Post Syndicated from João Tomé original https://blog.cloudflare.com/radar-2024-year-in-review-internet-services
Since the late 1990s, millions have relied on the Internet for searching, communicating, shopping, and working, though 2.6 billion people (about 31% of the global population) still lack Internet access. Over the years, use of the Internet has evolved from email and static sites to social media, streaming, e-commerce, cloud tools, and more recently AI chatbots, reflecting its constant adaptation to users’ needs. This post explores how people interacted online in 2024, based on Cloudflare’s observations and a review of the year’s DNS trends.
Building on similar reports we’ve done over the past several years, we have compiled a ranking of the top Internet properties of 2024, with the same categories included in 2023, including Generative AI. In addition to our overall ranking, we chose 9 categories to focus on:
As we have done since 2022, our analysis uses anonymized DNS query data from our 1.1.1.1 public DNS resolver, used by millions globally. We aggregate domains for each service (e.g., twitter.com, t.co, and x.com for X) and identify the sites that provide services to humans, thus excluding technical domains like root-servers.net. Rankings reflect relative popularity within categories, not absolute traffic. Therefore, a drop in rank doesn’t always indicate less traffic to a specific Internet service — it may simply reflect increased competition from other services, leading to a change in rank.
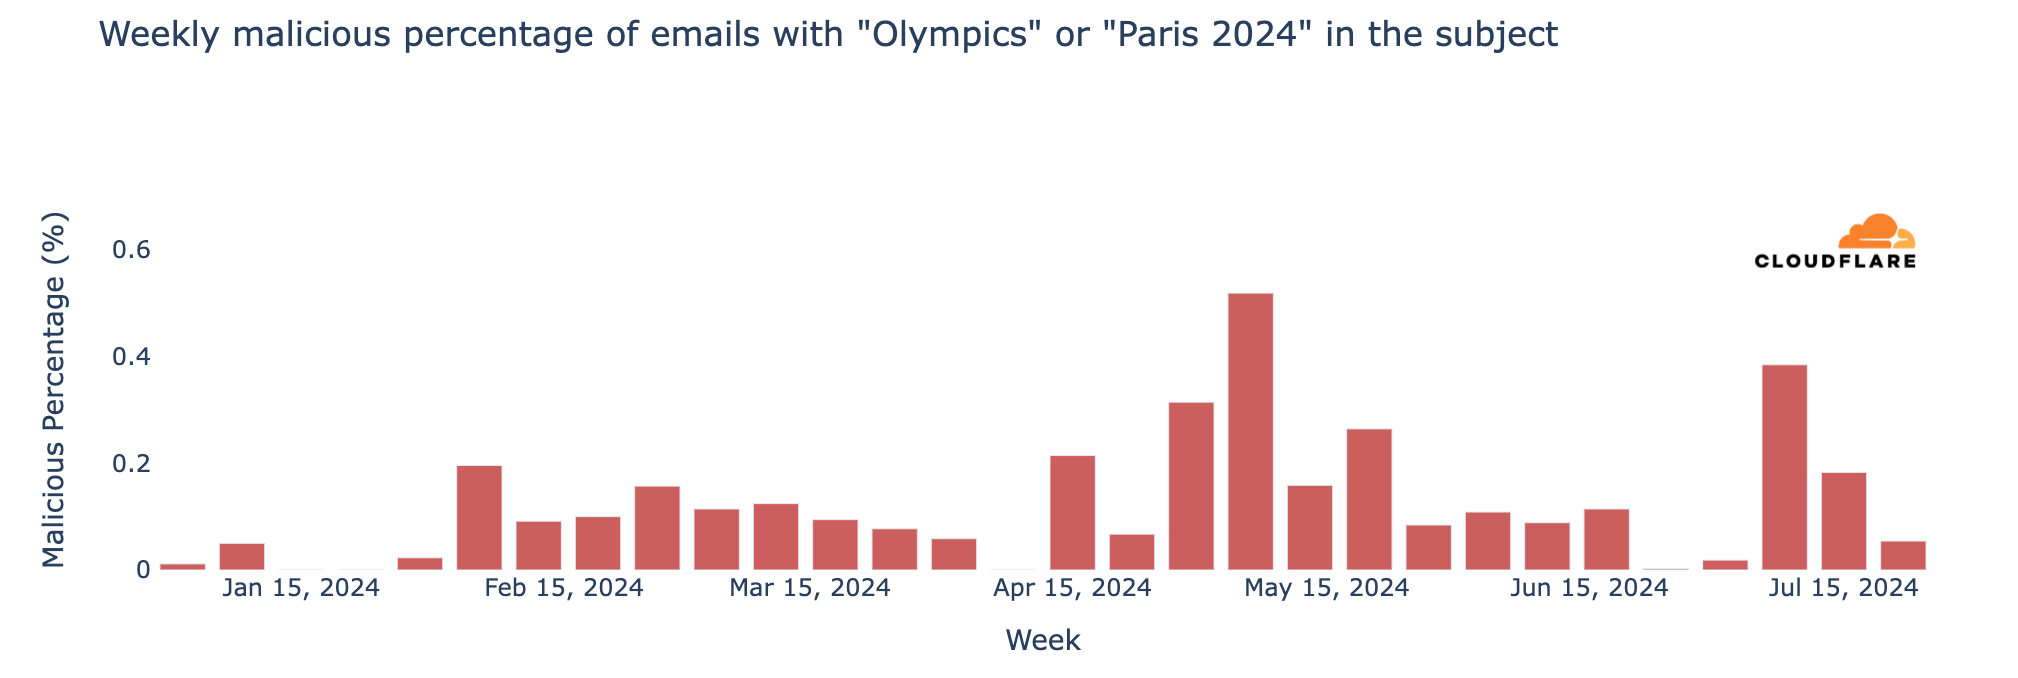
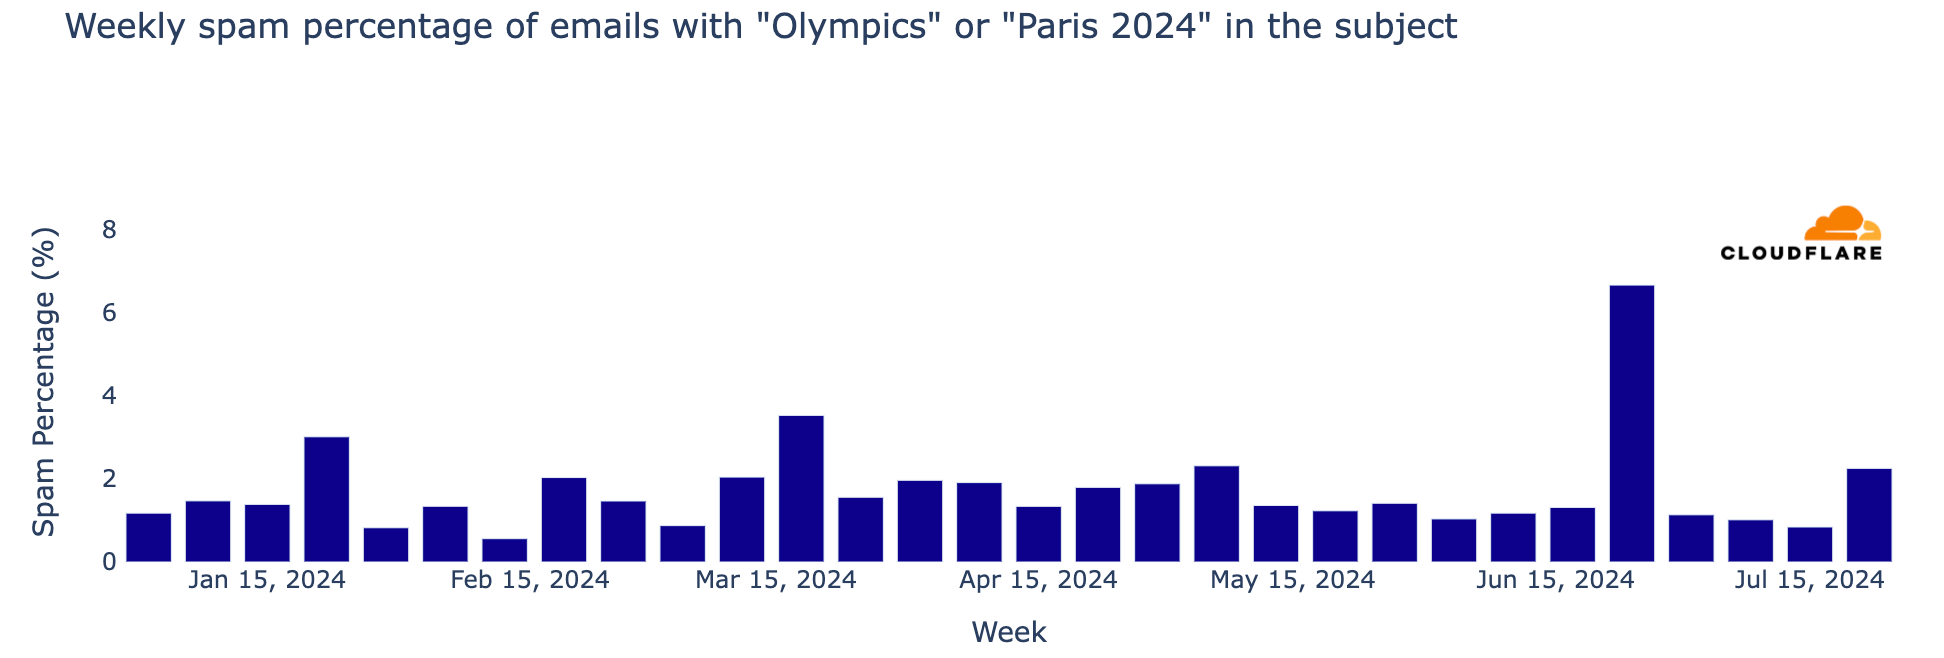
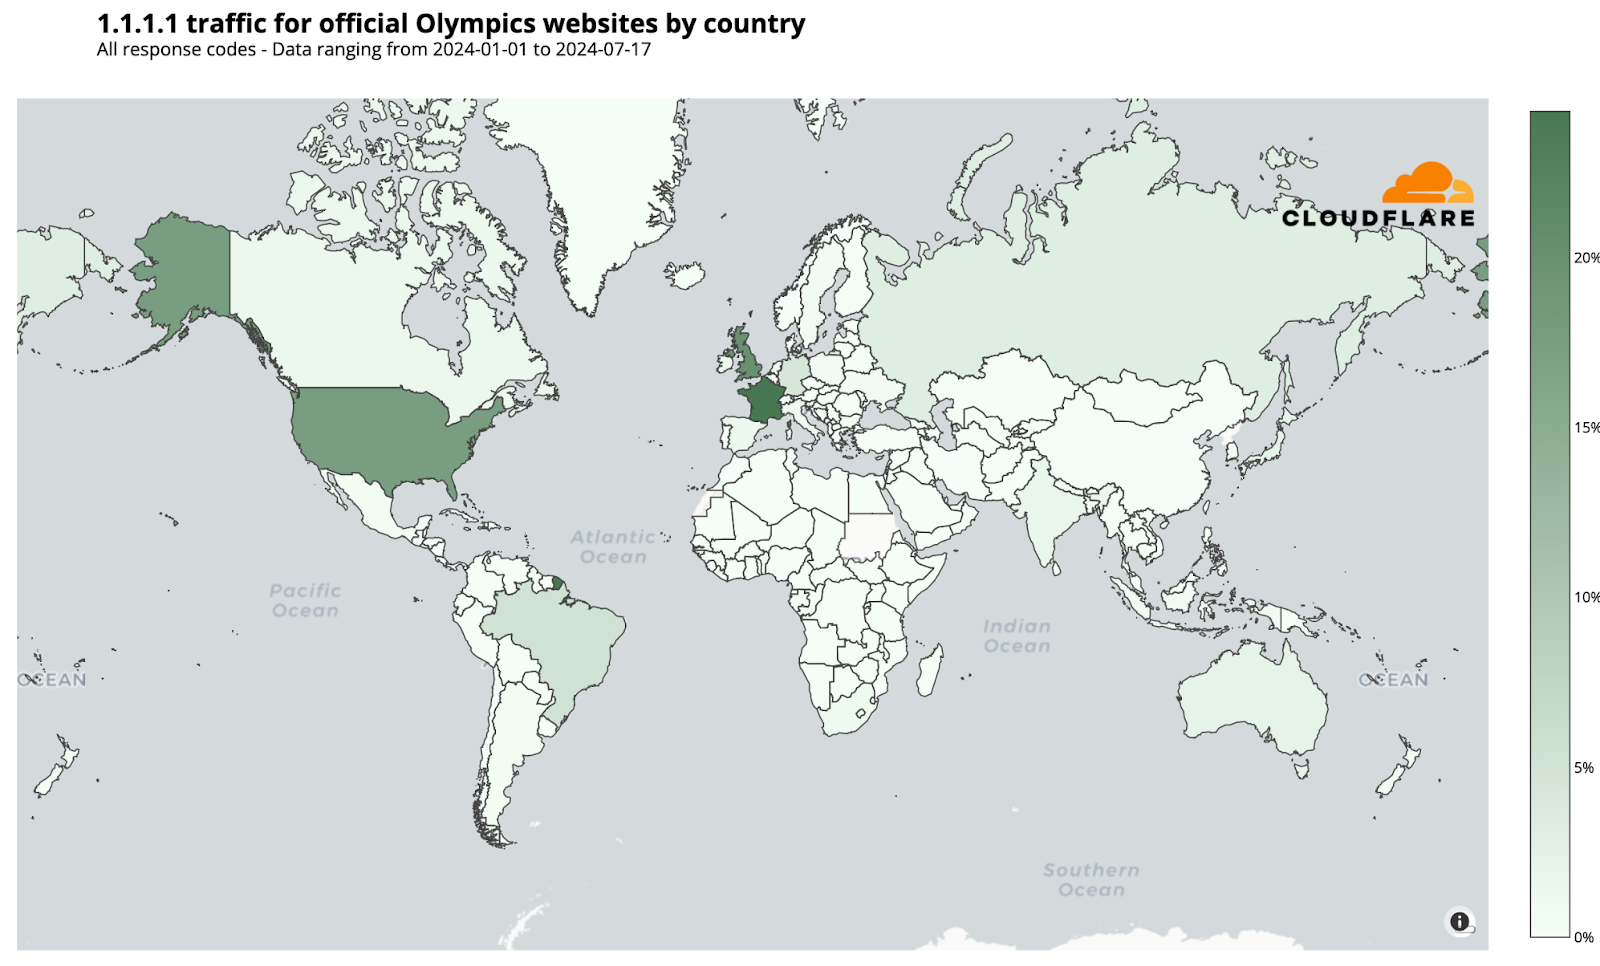
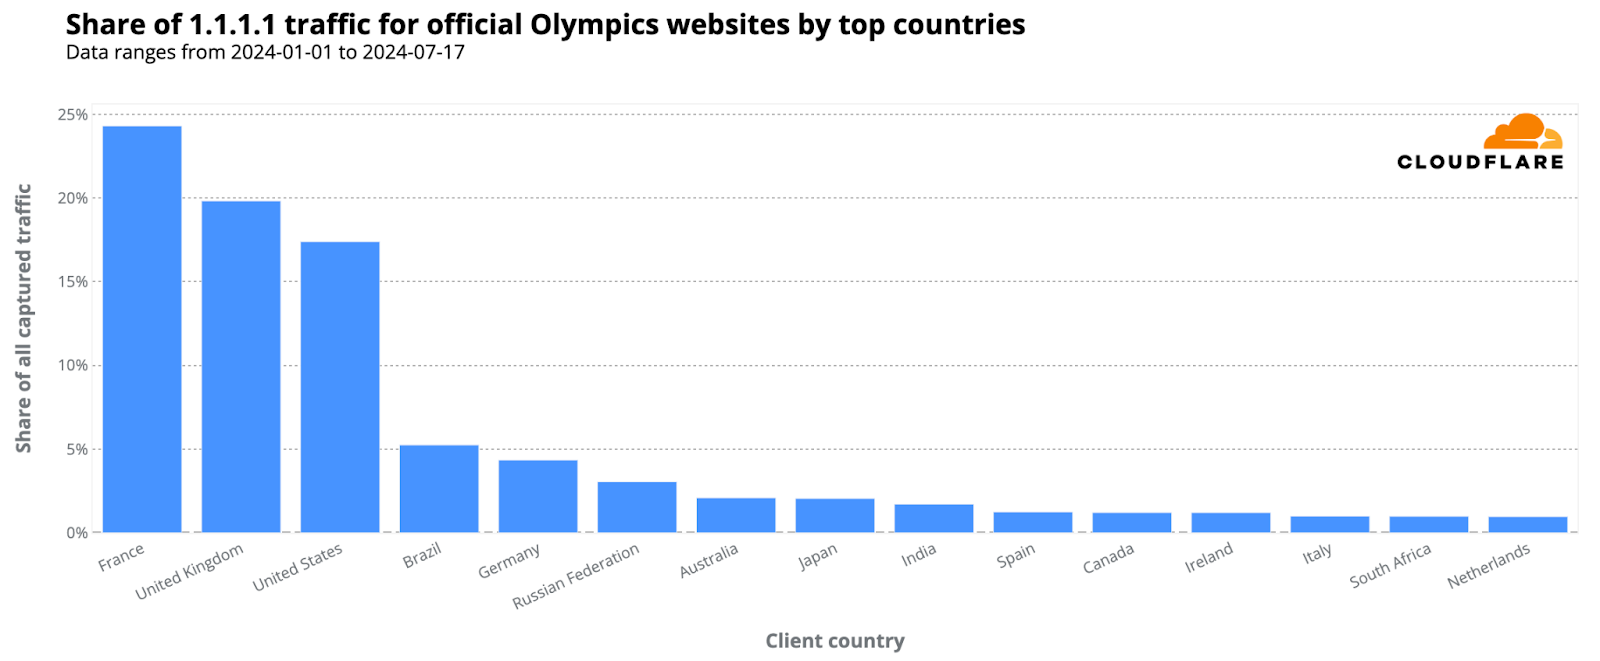
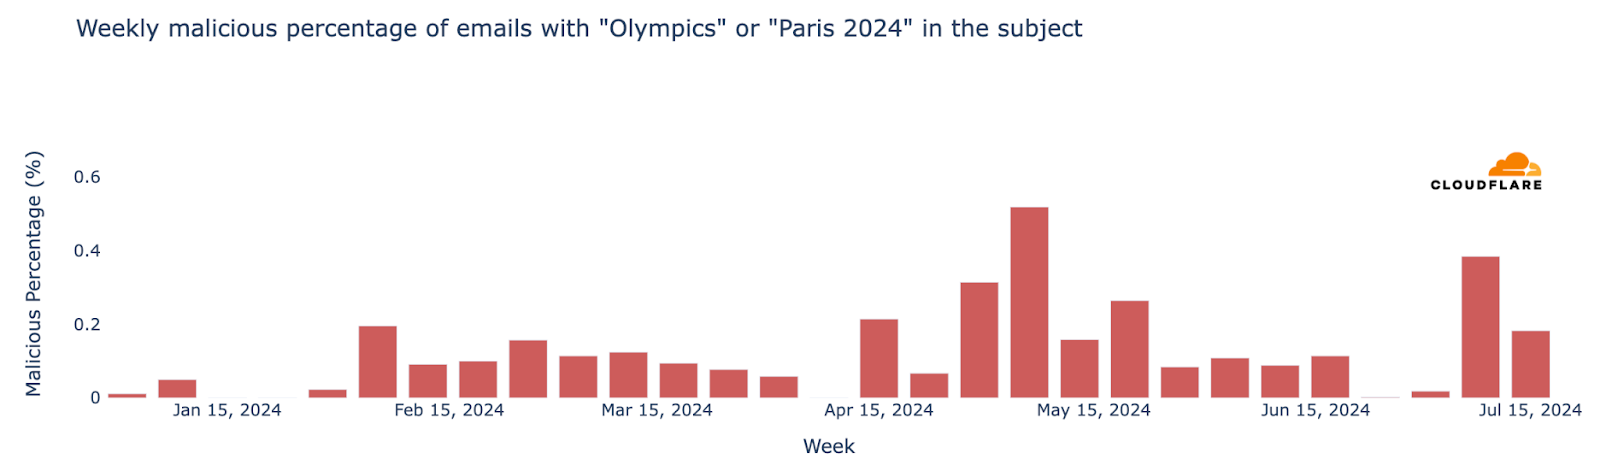
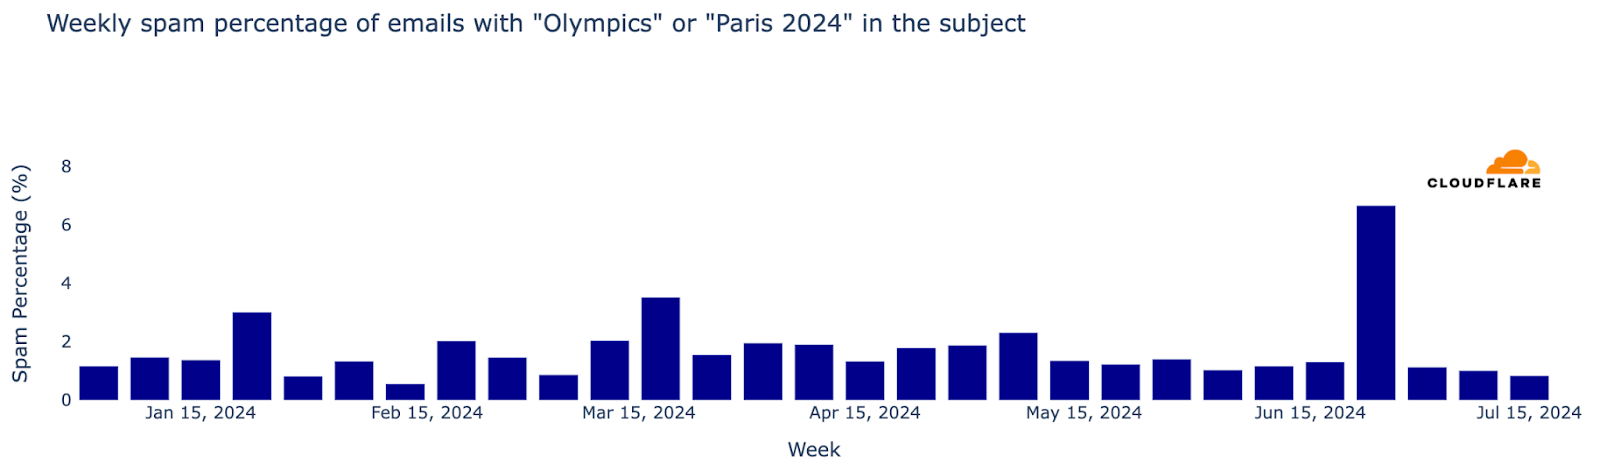
This part of the 2024 Cloudflare Radar Year in Review highlights shifts in Internet services, with rising platforms like Temu, GitHub Copilot, and WeChat reflecting changing user preferences. ChatGPT (OpenAI) also played a more prominent role in the generative AI space and in our Overall ranking, nearly reaching the Top 50. Major events like the Paris Olympics and US elections influenced rankings as well, boosting Olympics-related sites and news platforms like CNN and Fox News.
Keep reading for a detailed look at the evolution of trends throughout the year. For more, visit our 2024 Cloudflare Radar Year in Review microsite. Along with the lists of most popular Internet services, the Year in Review microsite and its associated blog post explore a number of additional metrics.
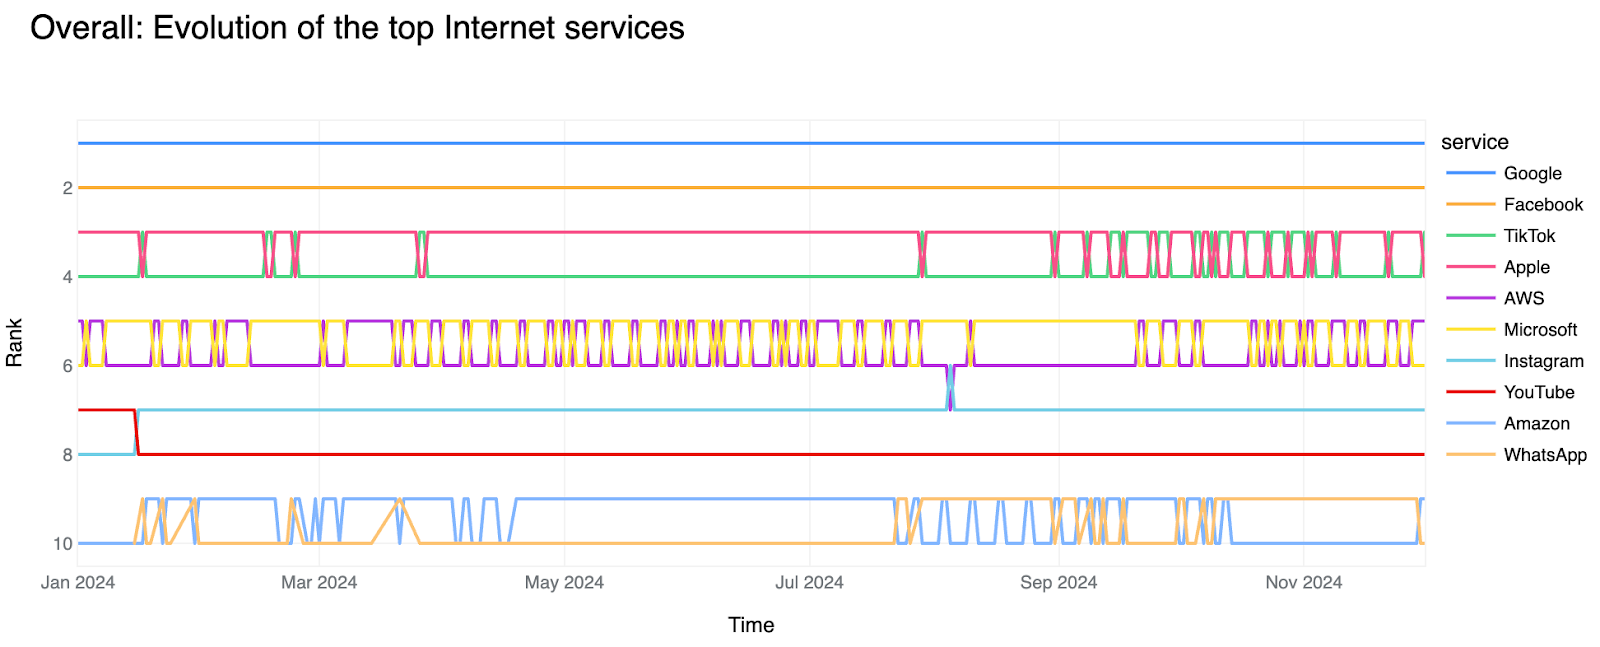
Since 2021, we’ve started our review of rankings with an Overall Top 10 list, showcasing the most popular Internet services globally based on DNS traffic from our 1.1.1.1 resolver. Unsurprisingly, Google (including services like Google Maps and Google Calendar) remained the #1 Internet service in 2024. Since introducing our ranking method two years ago, no other service has come close to challenging Google’s top spot. It’s important to note that Apple and Microsoft are similar to Google in that their main domains (apple.com or microsoft.com) are used for many different services. We include other services separately, such as Outlook or iCloud, which use their own specific domains.
-
Google
-
Facebook
-
Apple
-
TikTok
-
Amazon Web Services
-
Microsoft
-
Instagram
-
YouTube
-
Amazon
-
WhatsApp
Beyond Google, Facebook consistently held the #2 spot throughout 2024. Last year, it competed with Apple for that position. Apple, which uses domains like apple.com for services related to its software and devices, was generally #3. However, TikTok challenged that position on several days since late August. Amazon Web Services (AWS), differentiated from Amazon by domains like amazonaws.com, performed better this year compared to 2023. It held the #5 spot but often traded places with Microsoft during the year.
Instagram also rose in the rankings. It was around #8 in 2023 and steadily improved. Now, it holds the #7 spot, ahead of YouTube.
Amazon remained at #9 for most of the year, the same as in 2023. WhatsApp, owned by Meta, appeared in the Top 10 for the first time, taking the #10 spot.
Close to the Top 10 were Apple’s iCloud, Netflix (which performs better on weekends), and Microsoft’s Outlook.
In the chart below, you can follow the evolution of the top Internet services in our Overall ranking throughout the year.
In 2022, X (then known as Twitter) ranked as high as #10 in our overall ranking and was close to Instagram. It never reached the top 10 in 2023, and in 2024, X dropped further, to #14 or #15. More on X’s performance in the Social Media category below.
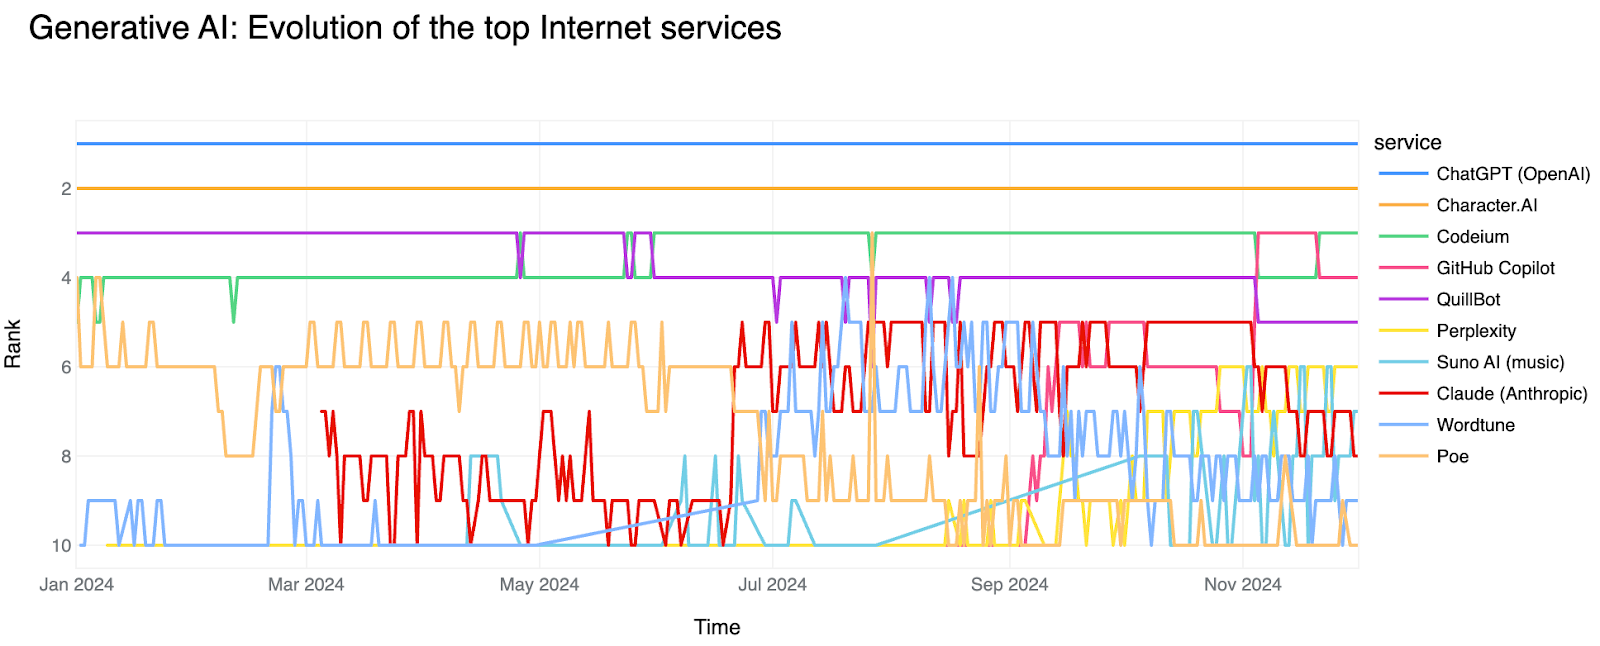
Generative AI gained global attention in late 2022 with the launch of ChatGPT, and became a global phenomenon during 2023. By 2024, ChatGPT (OpenAI) continues to be by far the most popular service in this category, which includes chatbots, coding bots, and more. Other generative AI services had more stable rankings compared to 2023.
-
ChatGPT (OpenAI)
-
Character.AI
-
Codeium
-
QuillBot
-
Claude (Anthropic)
-
Perplexity
-
GitHub Copilot
-
Wordtune
-
Poe
-
Tabnine
Significant changes occurred below ChatGPT’s first place ranking throughout the year. Character.AI, an AI-driven chatbot platform, maintained a strong #2 position, staying ahead of Codeium, a code-generation AI tool that has improved its position since June, and Quillbot, an AI writing and paraphrasing tool.
Claude, the AI chatbot from Anthropic, rose in the rankings, particularly after March 4, when the new model, Claude 3, was introduced, and again later in May when it became available in Europe. It reached #5 in June. Perplexity, an AI-driven search and Q&A platform, started the year outside the Top 10 but ended close to Claude. It surpassed Claude for the first time on November 6, 2024, the day after the U.S. elections, reaching #6.
This next chart shows movement among the Generative AI services that were more popular later in the year.
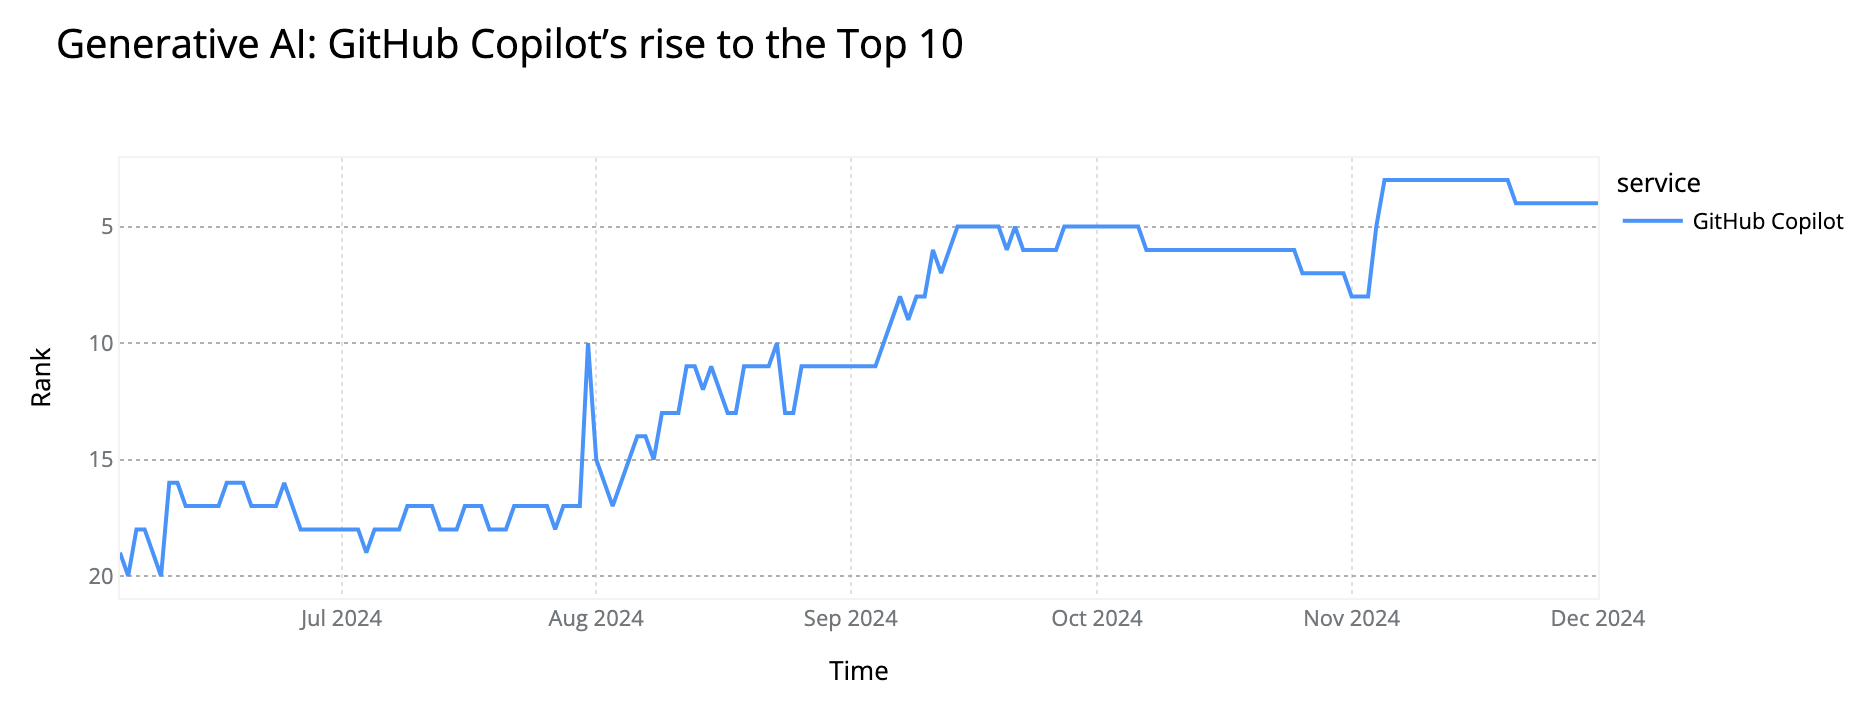
Several new players entered the Top 10 AI rankings in 2024, showing strong growth. GitHub Copilot, an AI-powered coding assistant, experienced the fastest rise, entering the Top 10 in September (after reaching the Top 20 in June) and staying mostly between #5 and #3 by November, as the next chart shows. Similarly, Suno AI, an AI-powered audio and music generation platform, entered the Top 10 in April, briefly dropped out, but stabilized between #6 and #10 after October — in November, it ranked #6 on weekends.
Some platforms lost ground in the rankings. Wordtune, an AI writing assistant, peaked at #4 during mid-year but declined afterward. Tabnine, another AI-powered coding assistant, held the #5 spot for months but slipped after July. In contrast, Sider AI, a coding assistant, entered the Top 20 in March and finished the year around #12. Poe, an AI chatbot platform, ranked #5 in 2023 and between #5 and #6 before June, but ended 2024 moving around #10, performing better during weekends.
Google Gemini, Google’s AI assistant and model, performed better on weekdays and started the year ranking between #7 and #10, but dropped out of the Top 10 after July as newer AI platforms gained momentum. Hugging Face, an open-source AI and machine learning platform, mostly fluctuated between #7 and #9 during the year, peaking at #4 on August 18 around the time several models were updated, and and as it reached its milestone of 5 million users. However, it fell out of the Top 10 by September.
Midjourney, an AI-powered platform for generating images, performed well until June, when it was close to the Top 10. Additionally, the OpenAI API ranked #18 in the Generative AI category on May 14-15, coinciding with OpenAI’s announcement of GPT-4o availability, including in the API.
Notable trends that we observed when looking at trends for Generative AI services within our larger Overall ranking include:
-
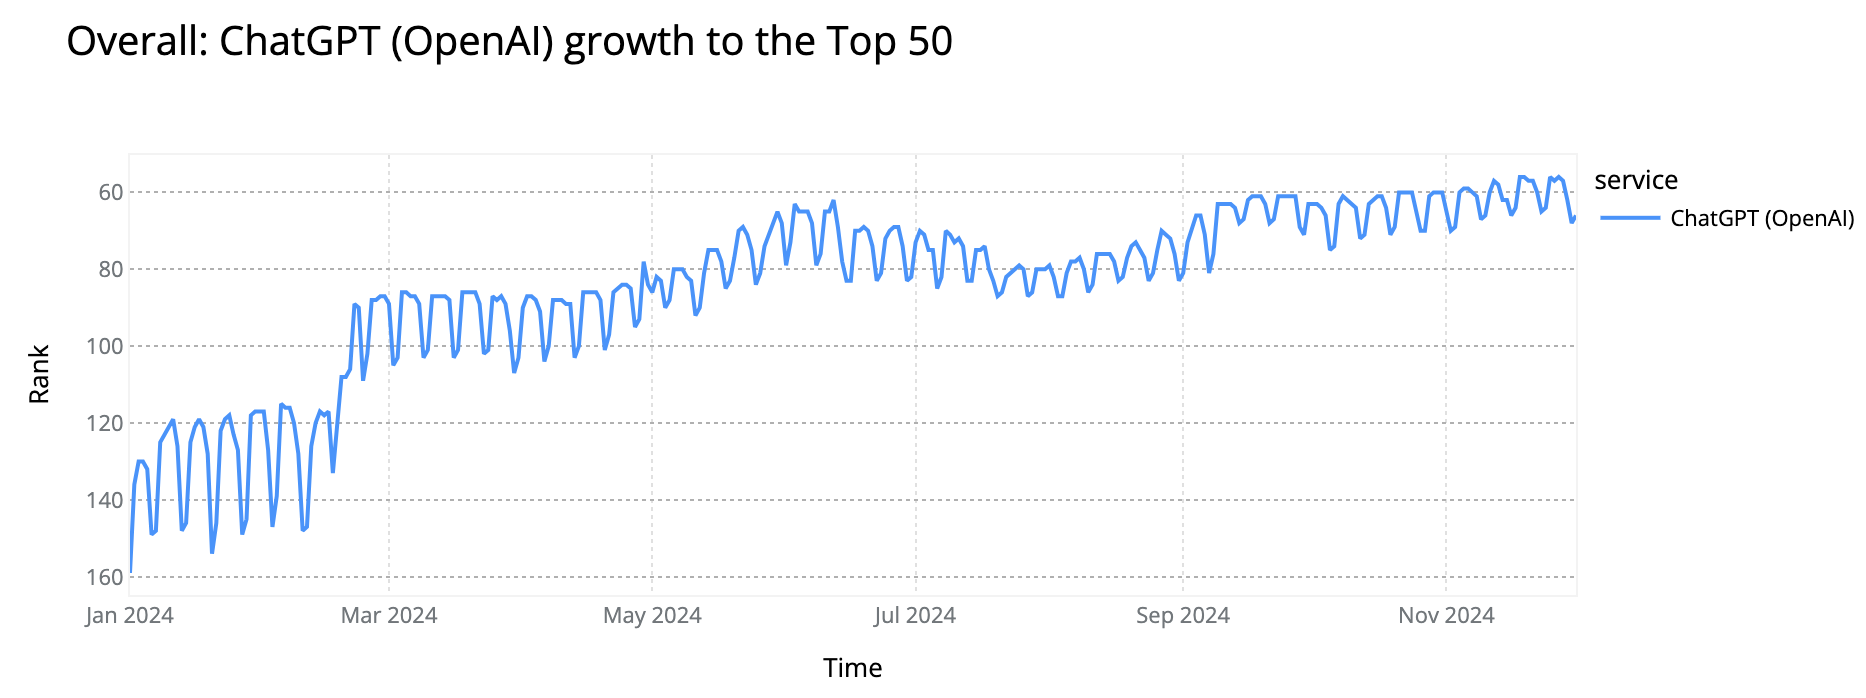
ChatGPT continued its growth in 2024, similar to 2023. In early 2023, it ranked around #200 and ended the year near the top 100. In 2024, it started close to the top 100, reached the top 60 in May with the release of the 4o model, and has been near the top 50 since September, aligning with the return of workers and students to their routines. It ranks higher on weekdays, averaging #56, and drops on weekends.
-
Comparing ChatGPT with other known and non-AI related websites, by late November, ChatGPT ranked ahead of Weather.com, Temu, eBay, Telegram, Google Calendar, and Prime Video, but trailed Disney Plus
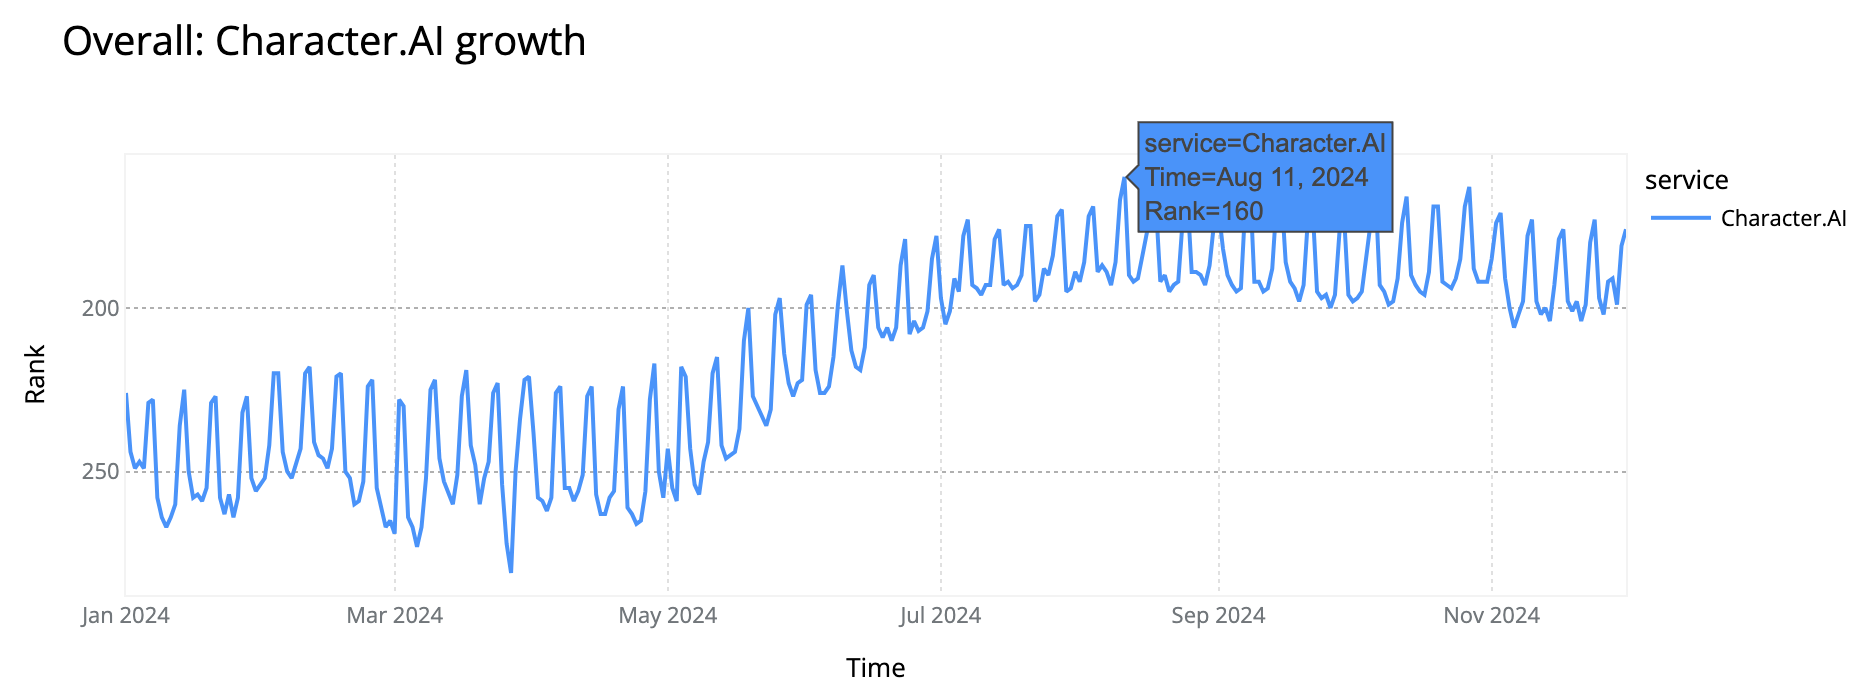
Character.ai also showed a clear growth trend in our Overall ranking, from outside the top 200 earlier in the year, to above #180 after July, performing better in August, reaching as high as #161. The AI-driven chatbot platform performed better on weekends than on weekdays, the opposite of ChatGPT.
-
Codeium entered the top 300 in July. It ranked higher on weekdays than weekends.
According to Kepios, there are an estimated 5.22 billion social media users worldwide in 2024 (up from 4.95 billion last year), representing 63.8% of the global population. Social media continues to play a major role in daily life, serving as a key platform for communication, information, and attention.
Once again, social media giants like Facebook, TikTok, and Instagram dominate, ranking among the top 10 most popular Internet services overall.
-
Facebook
-
TikTok
-
Instagram
-
X
-
Snapchat
-
LinkedIn
-
Discord
-
Kwai
-
Pinterest
-
Reddit
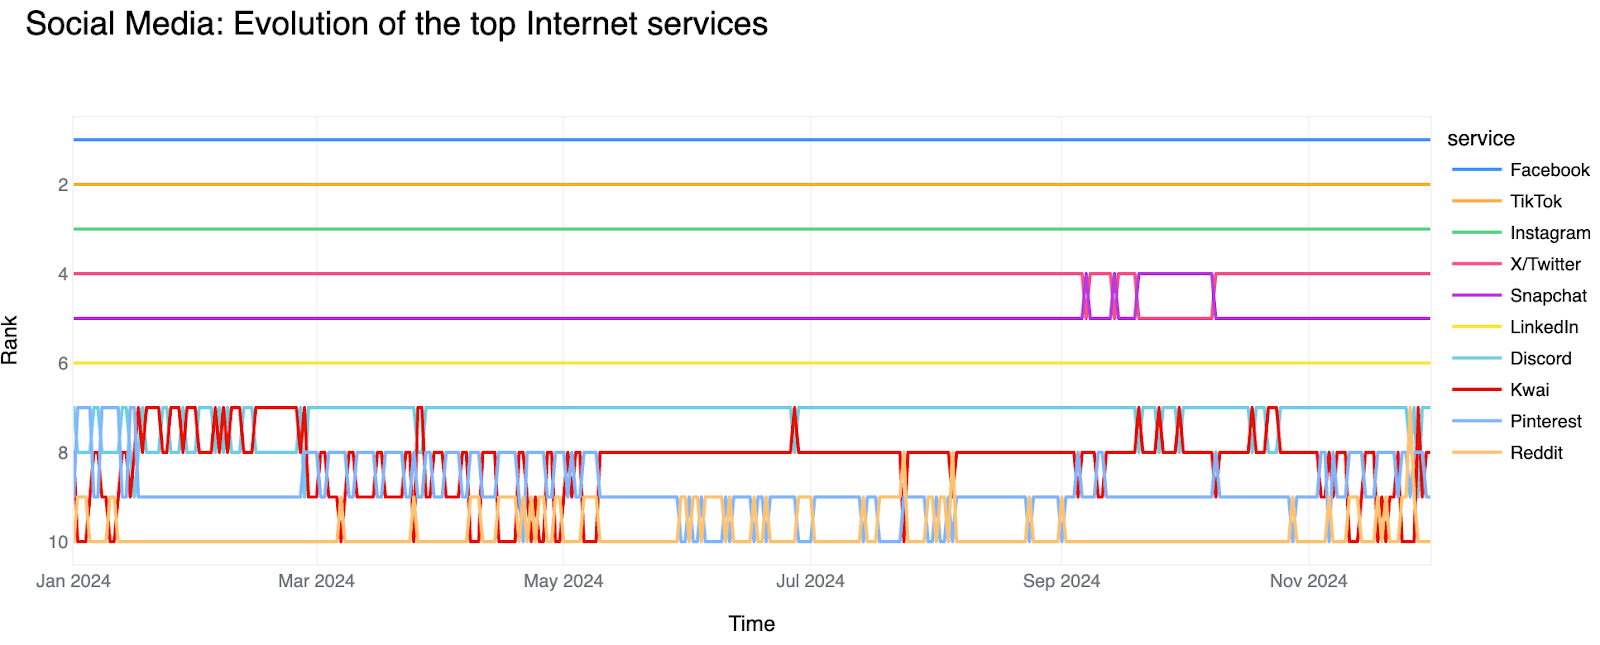
In the Social Media category rankings, the top seven remain unchanged from last year. However, there are notable developments in this category. In 2022, X briefly challenged Instagram for the #3 spot during a few days. Since 2023, X has held a solid #4 position, with Snapchat closing in and reaching #4 for the first time on several days in September and October.
LinkedIn stayed steady at #6, followed by Discord. Kwai, a Chinese video app popular in Brazil (with 60 million reported users) and other countries (a reported ), rose from #10 last year to #8. Further down the list, Pinterest kept its #9 rank, while Reddit, previously #8 in 2023, dropped to #10 this year, but peaked at #7 on November 26, just before Black Friday and Thanksgiving in the US. Here’s the Social Media Top 10 chart for 2024:
Our global ranking also highlights several non-Western platforms in the Top 20. These include Douyin (#11), the Chinese version of TikTok; VK (#12), often referred to as the Russian Facebook; and TikTok rivals popular in Southeast Asia SnackVideo (#13) by Chinese Kuaishou (that also owns Kwai). OnlyFans appeared consistently in the Top 20 starting in September, ranking around #18 and surpassing Tumblr by late November.
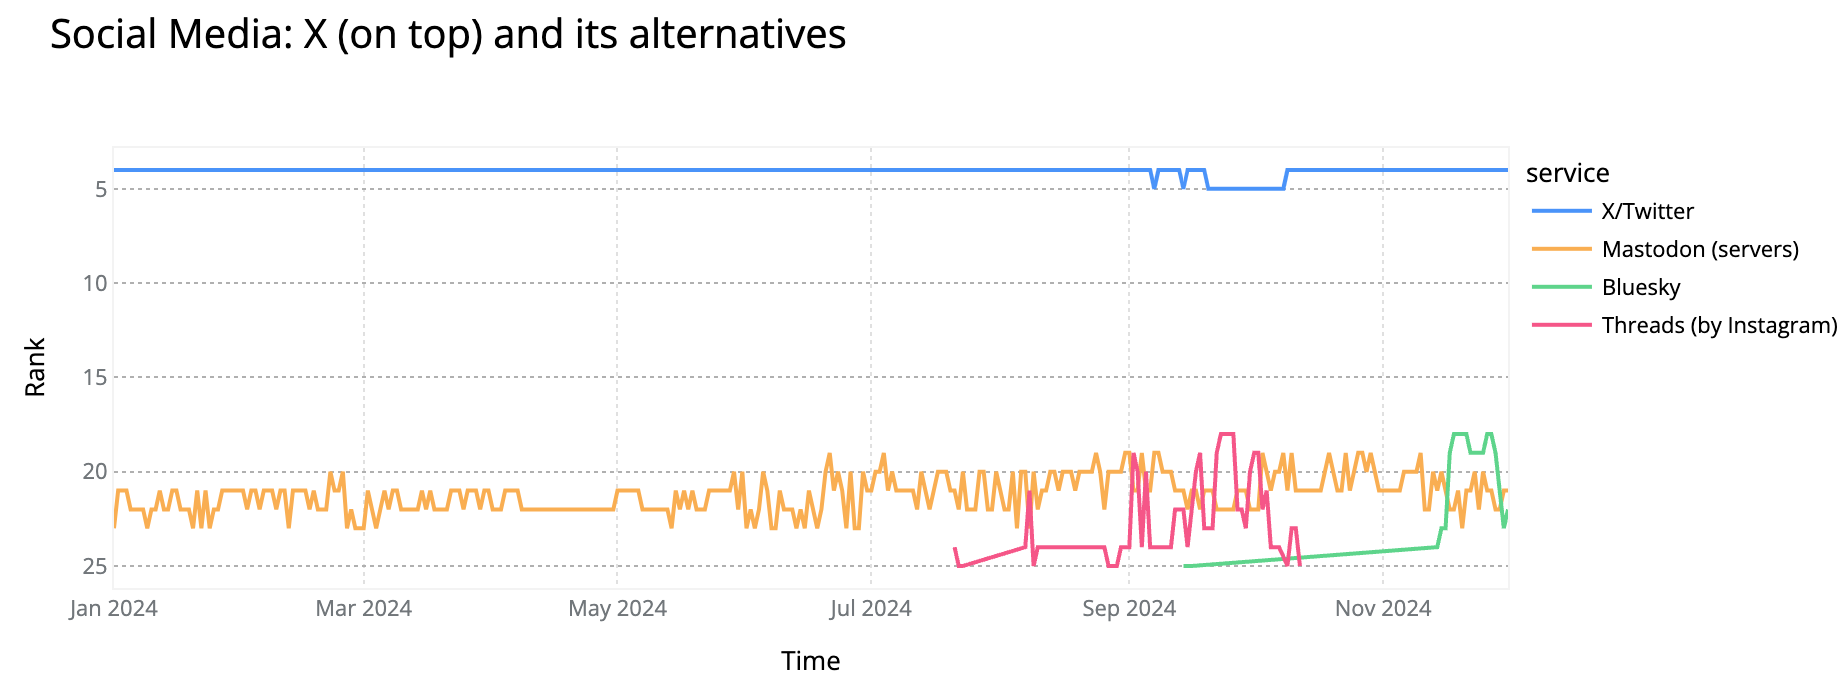
The #18 spot was briefly held by X alternative Threads (by Instagram) in late September and by Bluesky starting November 18. Mastodon-related servers reached as high as #19 for several days since late August. Here’s a look at X (on top) and its alternatives in this category:
Let’s move beyond the Social Media category to see how these platforms performed in our Overall ranking, where bigger shifts between services are evident.
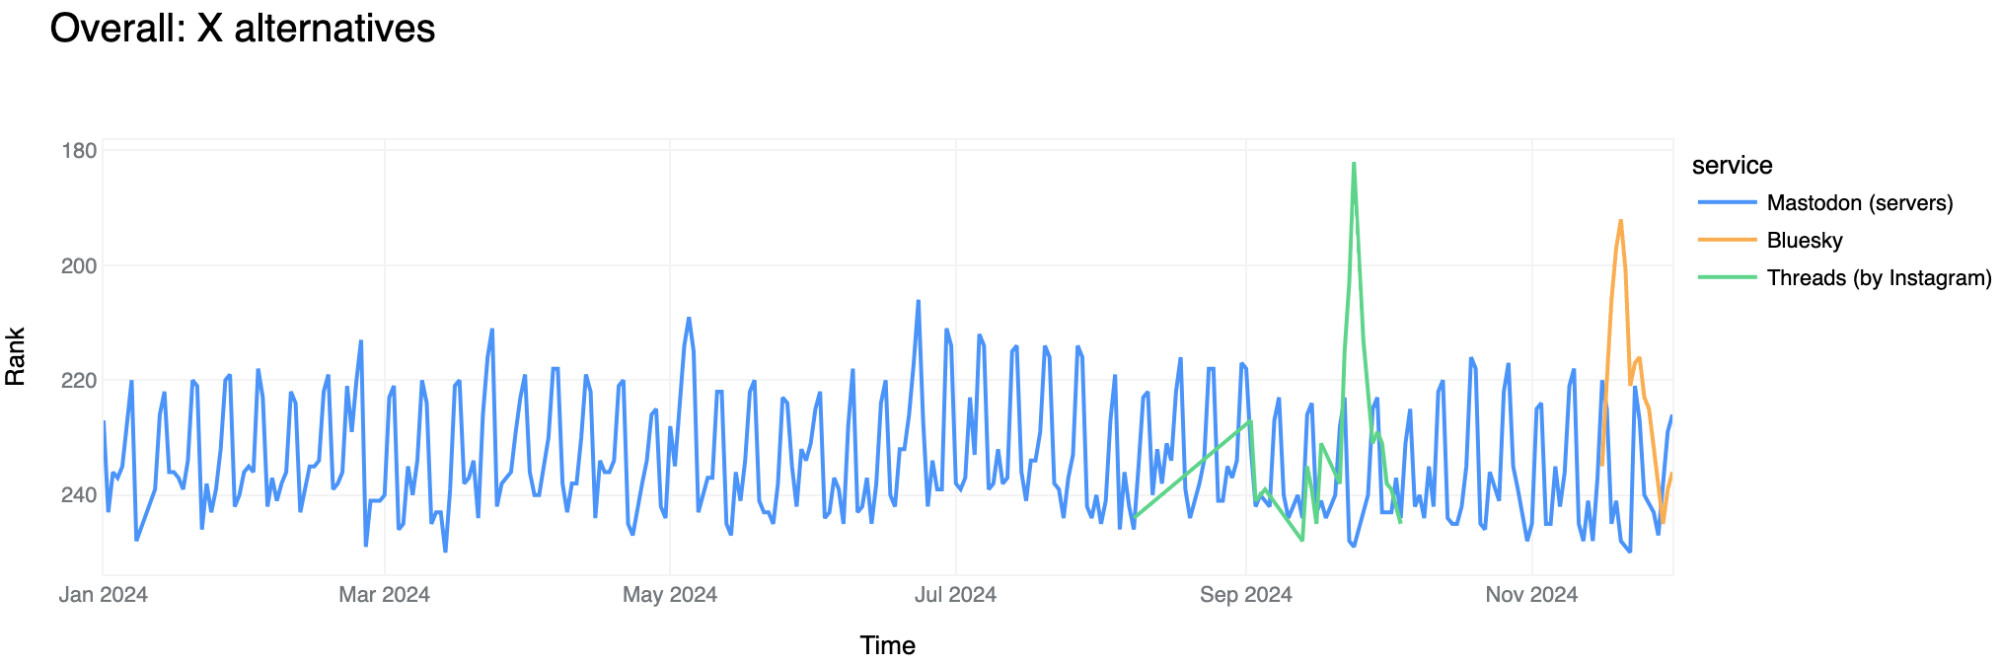
As we’ve seen, Threads, Bluesky, and Mastodon (via an aggregation of popular servers) didn’t break into the Top 10 of the Social Media category. However, in the Overall ranking, Mastodon servers, bundled together, consistently ranked between #208 and #248, performing better on weekends.
Bluesky entered the Top 250 in September 2024, and gained additional attention after the US elections. It rose sharply after November 14, peaking at #193 on November 20, and has since stabilized around #220.
Threads entered the Top 250 in August 2024, peaking at #183 on September 24 before dropping out in October. In 2023, Threads peaked at #227 in early July but fell out of the Top 250 by late August. It’s worth noting that Threads also uses Instagram’s cdninstagram.com for images and videos, which may influence Threads position in our DNS rankings (that said, Instagram wasn’t impacted by Threads appearance in our rankings).
Here are some other trends we observed among social media apps, and how they did in our Overall ranking:
-
Instagram’s best day (#6 in the Overall ranking) was August 5, 2024, coinciding with the week the app was banned in Turkey.
-
X’s best day of the year in our ranking was April 14, when it reached #12. This coincided with Arsenal losing the top position in the English football/soccer Premier League (the most-watched sports league in the world) to Manchester City, which went on to win its fourth title in a row. Last year, we noted how football/soccer in England impacted X’s ranking. X also reached #13 on August 9 and 10, during the final weekend of the Paris 2024 Olympics.
-
X performed better on weekdays, while LinkedIn ranked higher between Mondays and Wednesdays. Snapchat and Discord performed better on weekends.
-
Reddit consistently stayed in our Top 50 in 2024, showing growth from around #45 to #40 by November, with a peak at #38 on November 26. It performed better between Mondays and Wednesdays.
-
Quora displayed a downward trend in our ranking, dropping from around #140 to #160. It performed better between Mondays and Wednesdays.
-
Tinder, which performs better on Sundays, started the year around #150 but eventually dropped below #160.
-
Tumblr followed a similar pattern, dropping out of the Top 200, where it was in early 2024, to outside the ranking entirely since September. Tumblr performed better on weekends.
-
OnlyFans showed growth in our Overall ranking, sitting around the Top 220 with a peak at #213 on December 1. It performed better on weekends.
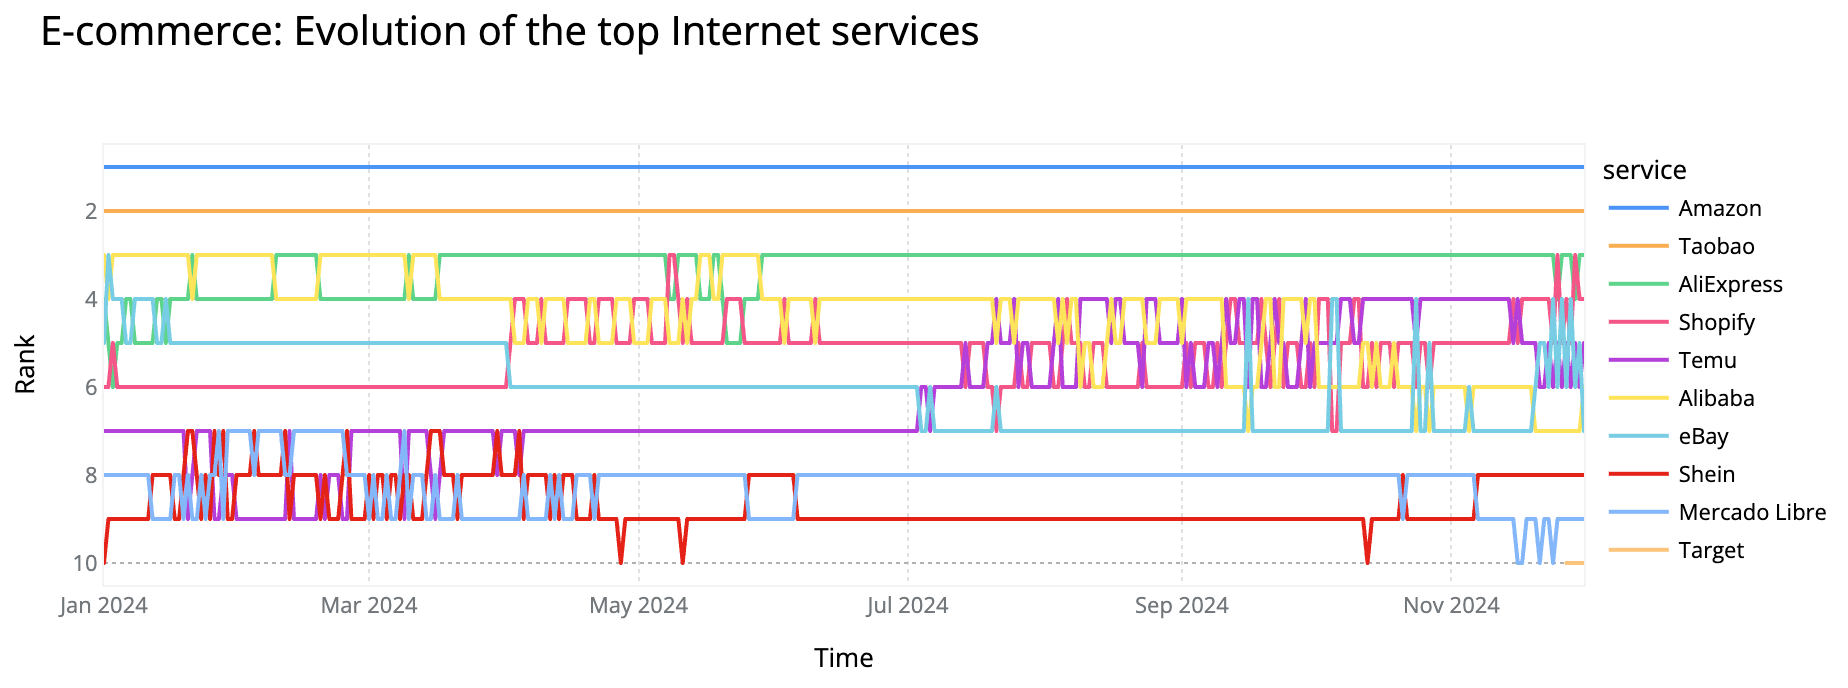
The importance of e-commerce continues to grow, as highlighted in our recent Cyber Week 2024 blog post. Amazon leads the category, followed by Taobao, the Chinese marketplace, holding a steady #2 spot as it also did in 2023. New to #3 is AliExpress, the global online retail giant from China.
-
Amazon
-
Taobao
-
AliExpress
-
Shopify
-
Temu
-
Alibaba
-
eBay
-
Shein
-
Mercado Libre
-
Wildberries (RU)
Compared to 2023, eBay lost its #3 spot globally and dropped down to #7, despite starting 2024 at #3 for several days. AliExpress claimed #3, followed by Shopify (#4), the Canadian platform hosting numerous online stores, and Temu (#5). Temu, the low-cost, fast-fashion marketplace launched in the US in September 2022, ended 2023 at #7 but rose to #5 in 2024, occasionally reaching #4 since August. Alibaba dropped to #6 in September.
Shein, the Chinese fast-fashion brand, continued its growth and overtook Mercado Libre (#8) in November. A surprise this year was Wildberries, often called Russia’s “Amazon,” that has been expanding to several neighboring countries (including some in Europe). It climbed to #10 in September, surpassing OLX (which held #10 for several months), Rakuten, and Lazada.
Looking at how e-commerce sites performed in our Overall ranking, we observed the following trends:
-
Amazon fluctuated between #9 and #10 after October, returning to #9 on November 30 and December 1, during the Black Friday weekend. It often performed better on weekends.
-
Shopify’s best day of the year was Black Friday, November 29, when it reached #55. The global e-commerce platform performed better during weekdays.
-
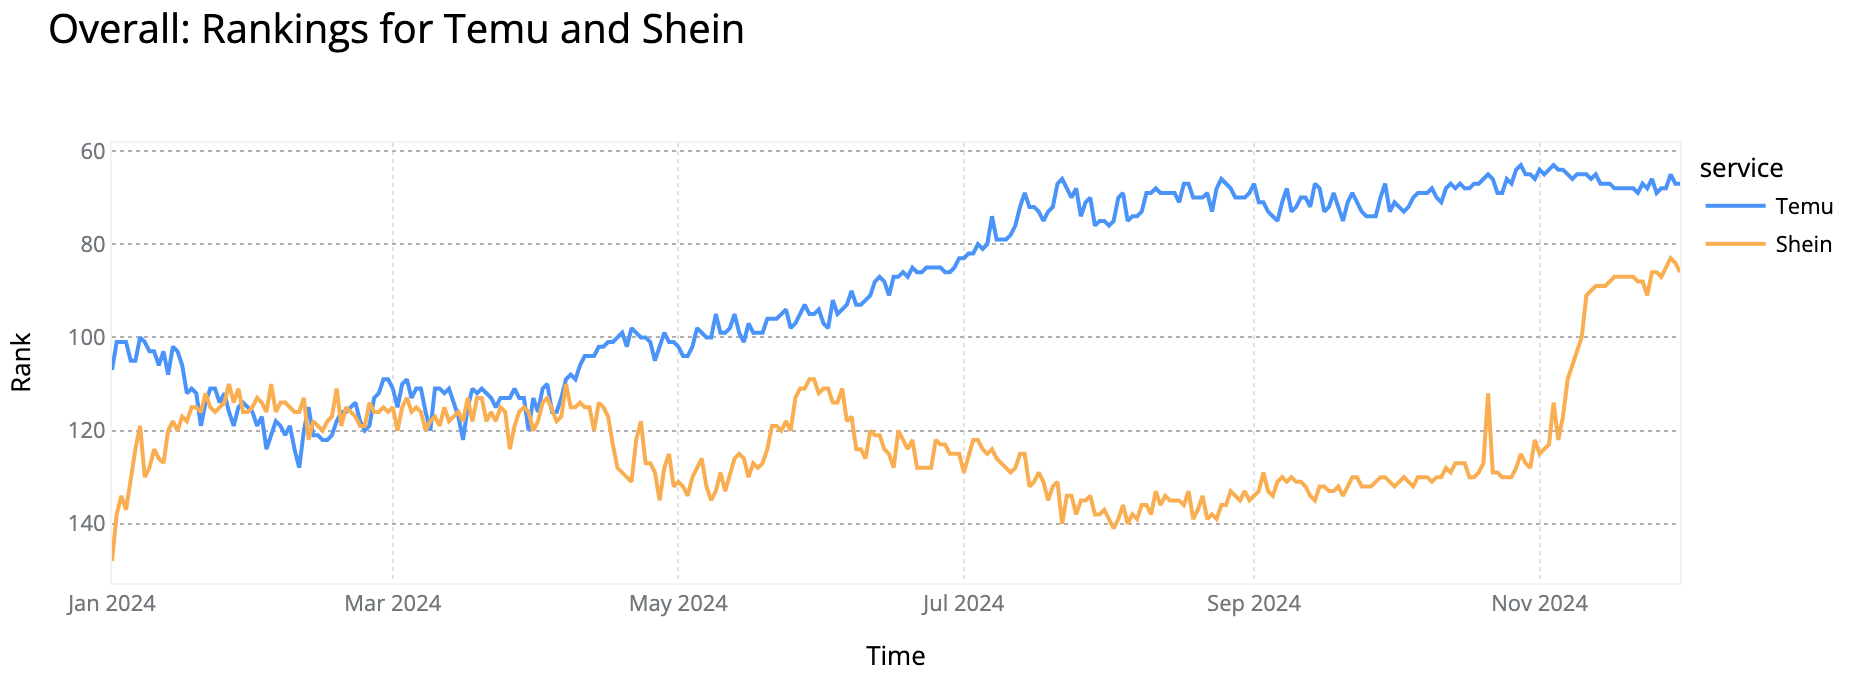
Temu, known for low-cost products, started 2024 outside the Top 100 but climbed into the Top 70 by year-end. It performed best in late October and early November, peaking at #63, with a Black Friday spike to #65.
-
Shein, the Chinese fast-fashion brand, showed growth, nearing the Top 100 in early 2024 before dropping to the Top 140 between June and October. It rebounded in November, peaking at #83 on Black Friday. A similar trend was observed in 2023, when it ended the year around the Top 120. Here’s the comparison between recent players Temu and Shein:
-
eBay consistently ranked between #72 and #80, peaking at #62 on October 5-6 and again in late November, just before Black Friday. It often performed better on weekends.
-
Mercado Libre, the Latin American marketplace, had its best day on Black Friday, November 29, reaching #100.
-
Adidas entered the Top 250, ranking #232 on Black Friday, November 29.
-
Target performed well in November, peaking at #133 on November 27, the day before Thanksgiving in the US, and at #127 on December 1. It often performed better on Sundays.
-
Walmart improved its performance from September onward, with its best days on November 25-26, reaching #150.
-
Ikea, the Swedish furniture retailer, peaked at #247 on June 29.
The relevance of video streaming platforms shows no signs of fading. In 2024, the Top 3 rankings stayed unchanged from 2023, with YouTube firmly holding the #1 spot, followed by Netflix. Among paid streaming services, Netflix leads, trailed by Disney Plus and Amazon Prime Video. Other paid streaming services are outside the Top 10, including, in ranked order: HBO/Max, Hulu, Peacock, and Paramount Plus.
-
YouTube
-
Netflix
-
Twitch
-
Roku
-
Disney Plus
-
Amazon Prime Video
-
Vimeo
-
Plex.TV
-
Pluto TV
-
Bigo Live
Twitch, a live-streaming platform for gaming, kept the #3 spot, as it did in 2023 and 2022. Roku, a digital media player that also offers streaming services, ranked #4, maintaining its position from last year. Similarly, Disney Plus (#5) and Amazon Prime Video (#6) held their spots, while Hulu dropped out of the Top 10.
The creative video platform Vimeo showed clear popularity growth since May, followed by recent players like Plex TV, a media platform with streaming that performed better starting in October, and Pluto TV, a free ad-supported streaming service that also showed growth throughout the year. Bigo Live, a live-streaming social platform, entered the Top 10 rankings in May.
Next, the Top 10 overtime perspective:
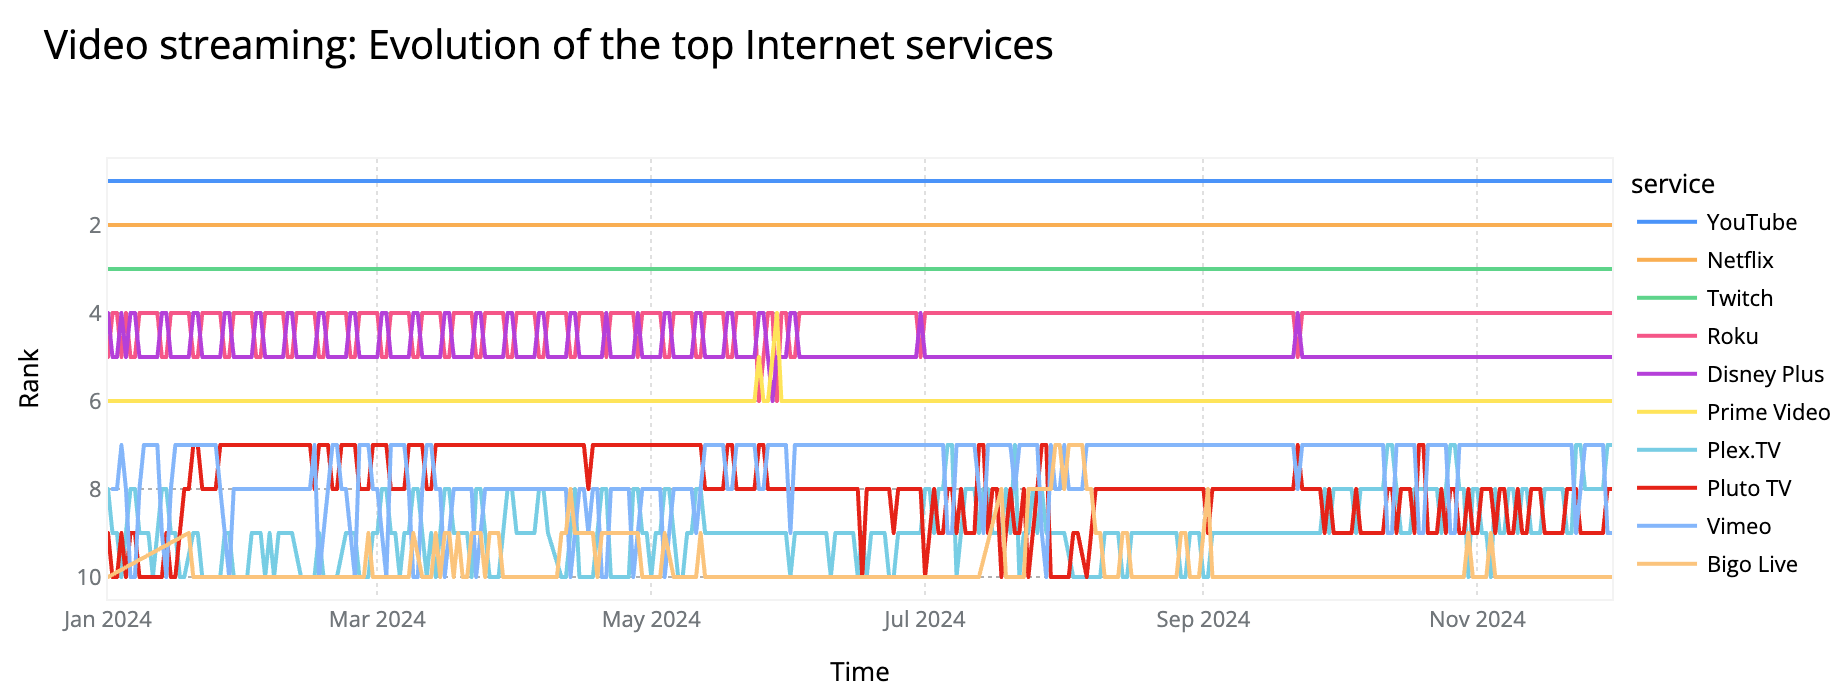
Throughout the year, Disney Plus occasionally challenged Roku, especially on weekends, a trend similar to what was observed in 2023.
Looking at how video streaming services performed in our Overall ranking, we found:
-
Netflix consistently ranked #12 on most weekends, particularly Sundays, through late May and resumed the same trend after August. Netflix, Disney Plus, Prime Video, and HBO/Max were more popular on weekends, especially Sundays.
-
Disney Plus ranged between #50 and #60, with a strong start to the year and a spike to #51 on September 22, coinciding with the premiere of the new Marvel show Agatha All Along.
-
Prime Video had its best day in the rankings on May 25, at #56, the day the movie Bombshell with Nicole Kidman premiered on the platform.
-
HBO/Max was consistently around the Top 100 until August. but dropped out after October.
-
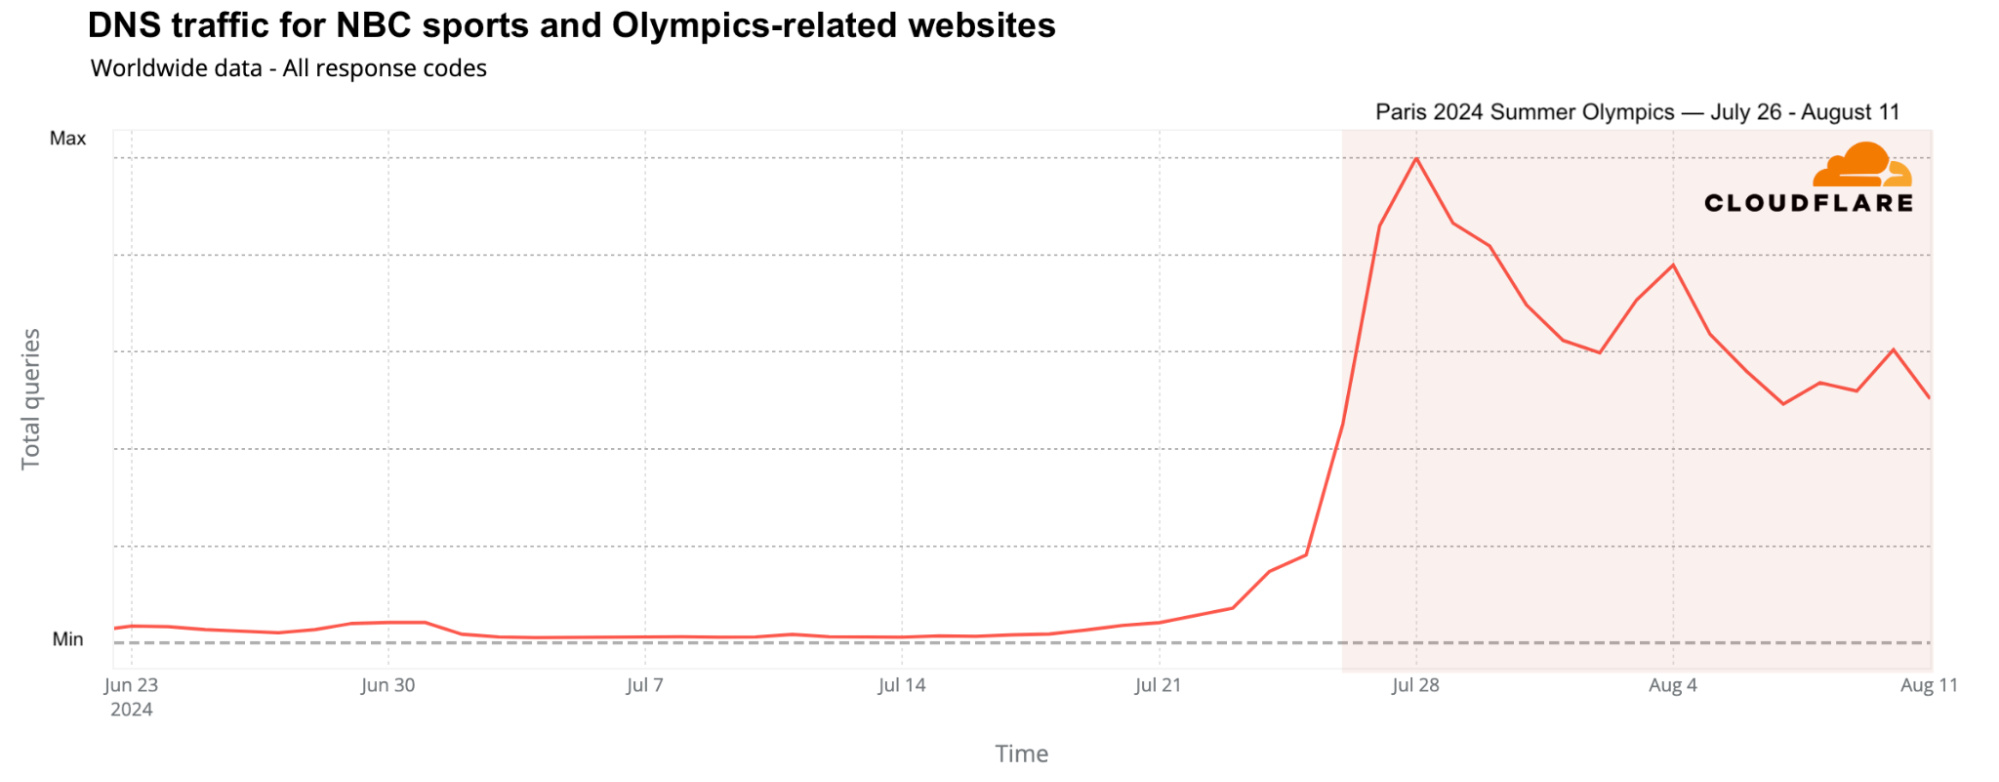
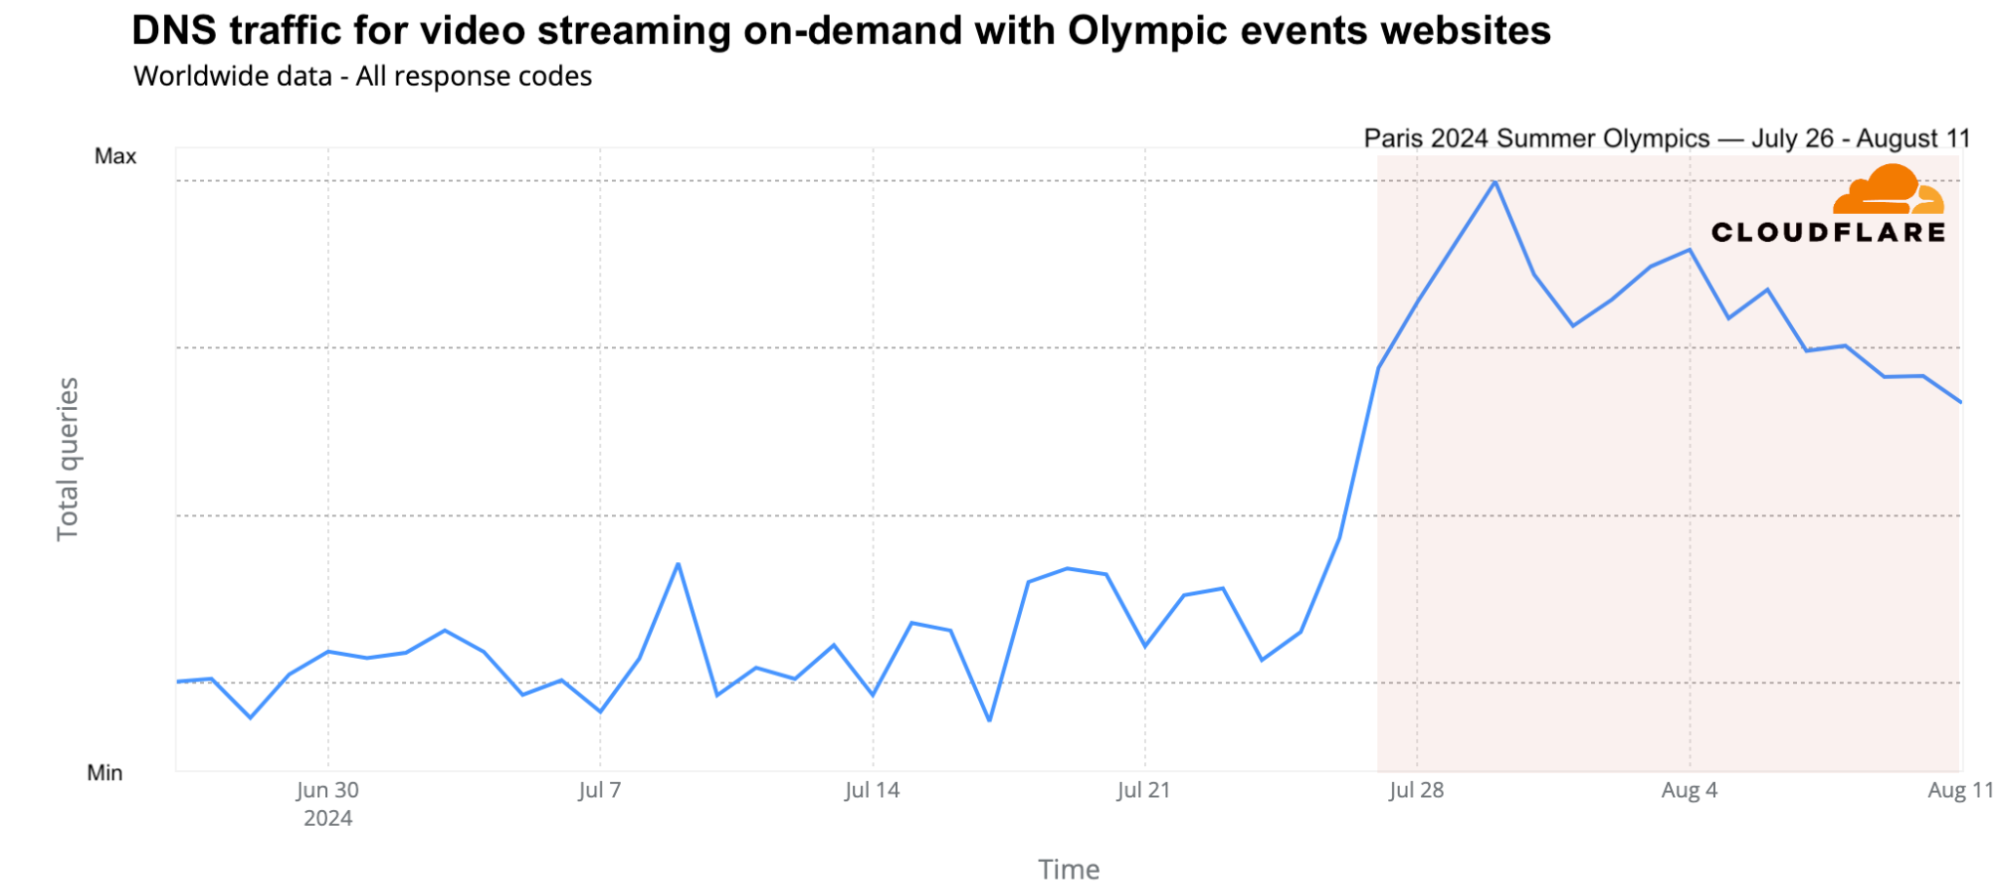
Peacock had an inconsistent presence in the Top 250 but reappeared in late July during the Paris 2024 Olympics, reaching #176 on July 28. That was one of the busiest days for Olympic events, as detailed in our blog post on the event.
-
Paramount Plus was mostly outside the Top 250 this year but peaked at #216 on February 11, the day of the Super Bowl, which the platform streamed.
News organizations are vital for keeping the public informed, especially during crises. With that in mind, this ranking of news services, some of which are well-established news outlets while others are news aggregators, also highlights a few newsworthy trends.
-
Globo
-
BBC
-
NY Times
-
CNN
-
Fox News
-
Google News
-
Yahoo Finance
-
Daily Mail
-
RT
-
NewsBreak
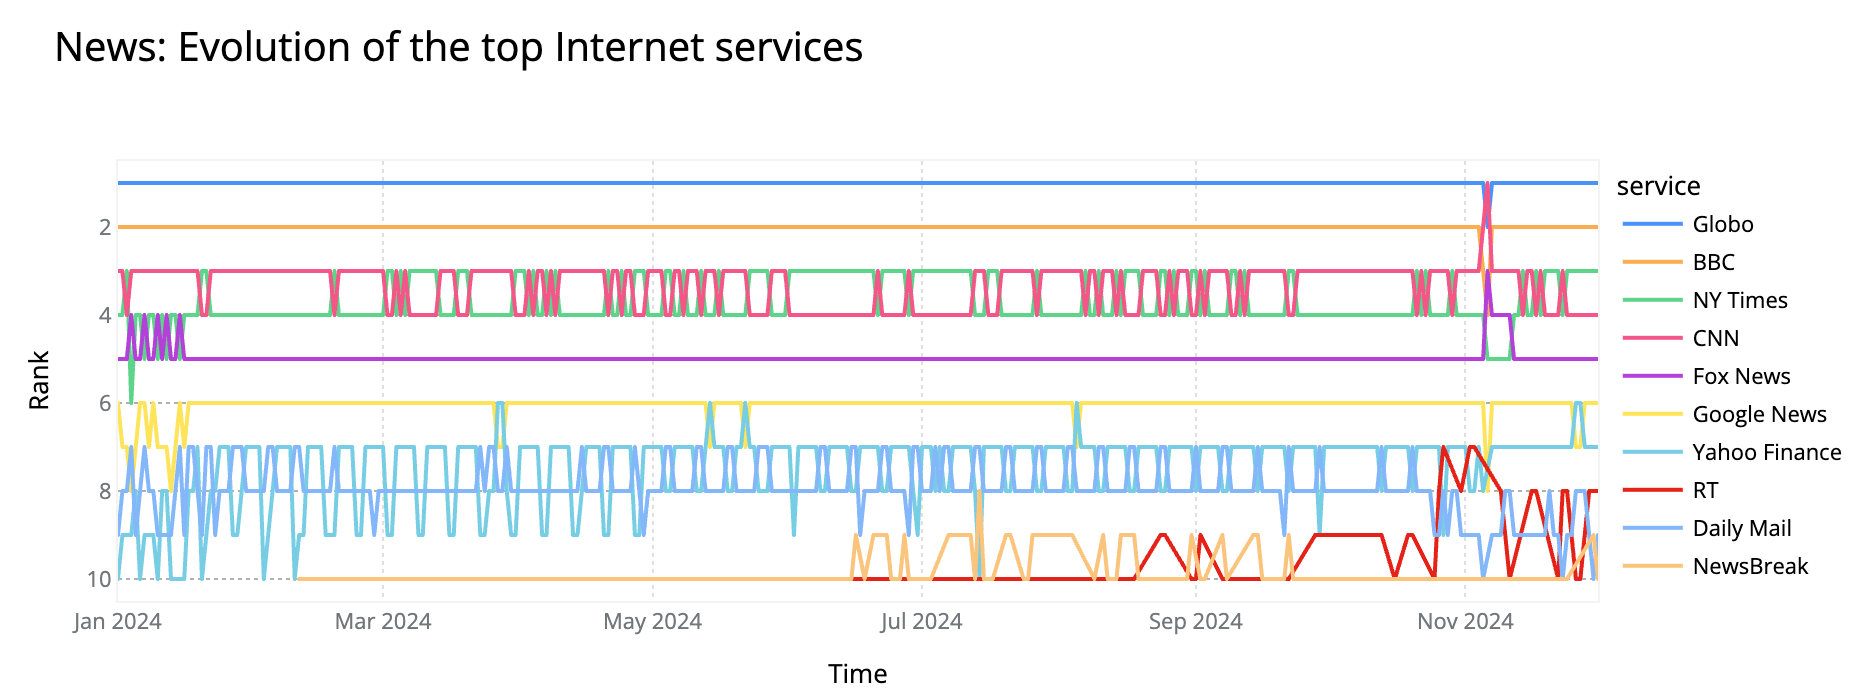
This year’s rankings in the news category mirrored 2023 at the top. Globo, the Brazilian media giant — one of the largest in Latin America and globally — encompassing radio, TV, newspapers, and magazines, stayed #1, followed by the British BBC at #2, that operates globally and in 42 languages.
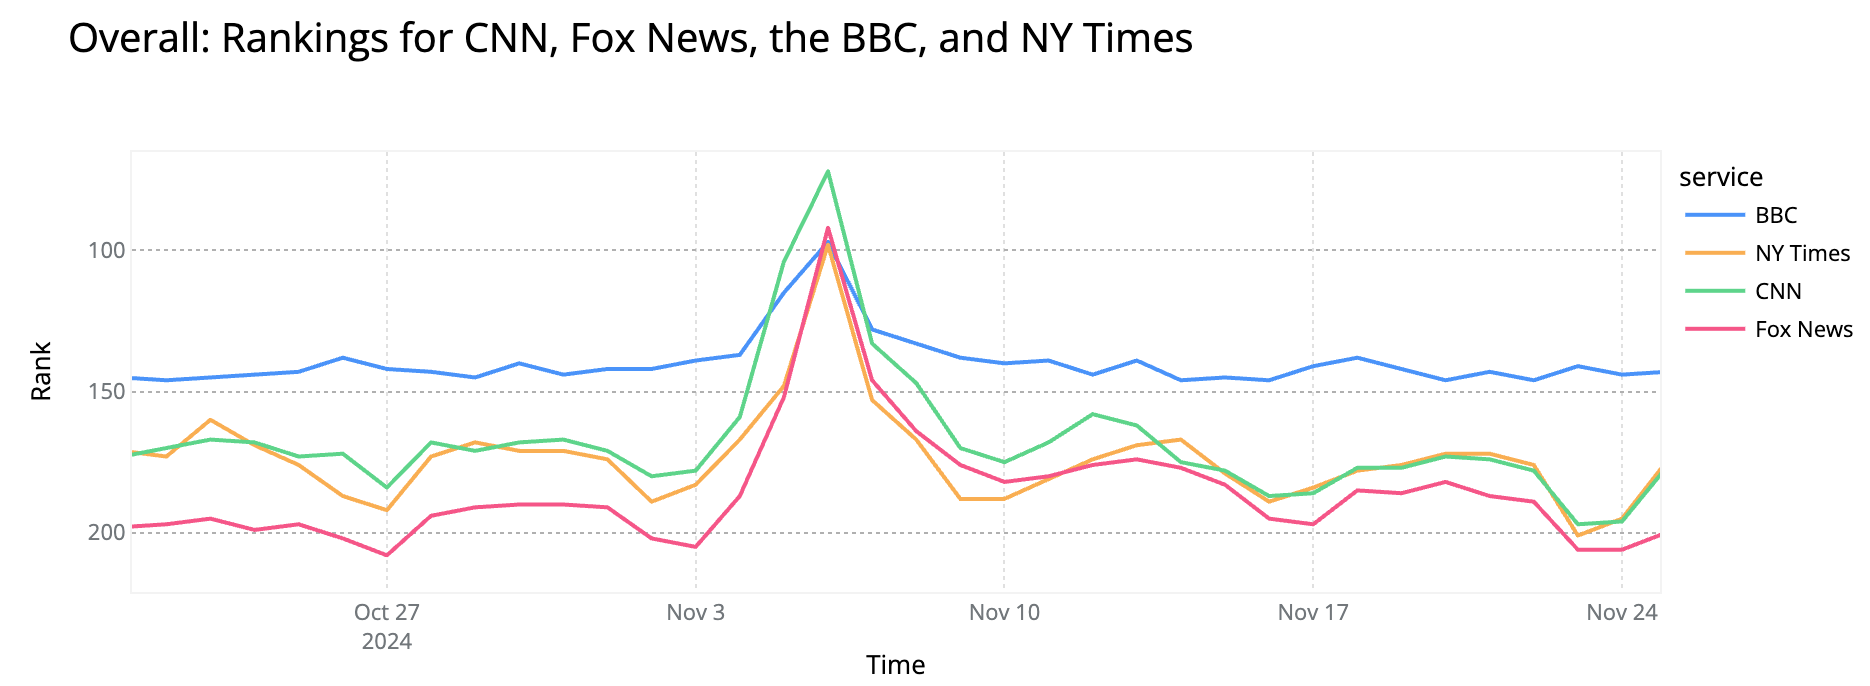
The New York Times rose to #3 this year (it was #5 in 2023), overtaking CNN (#4) and Fox News (#5), which dropped from its position at #3 in 2023 and this year came behind CNN.
Several prominent outlets, such as the Washington Post, The Guardian, NPR, and the Wall Street Journal, fell out of the Top 10 this year. These outlets had higher rankings in late 2023 following the start of the Hamas-Israel conflict on October 7. News aggregators gained prominence, with Google News (#6) and also Yahoo Finance (#7), focused on financial news (and that came in front of Yahoo News), and NewsBreak (#10), a US-based local news app, entering the Top 10.
The British Daily Mail, which has also expanded its focus to the US and Australia, ranked #8, followed by RT, the Russian news TV network with a global presence. RT launched its Brazil/Portuguese version in late 2023 and was recently highlighted in a report and an alert from the US Department of State regarding its global operations.
The US elections impacted rankings. CNN climbed to #2 on November 5, election day, and reached #1 on November 6, while Fox News peaked at #3. NBC News also improved, reaching #11 on November 5 and #7 the following day. Associated Press ranked #8 on November 5 as well. Here’s the News ranking:
Notable news trends we identified in our larger Overall ranking include:
-
As we’ve seen in the News category, the US elections on November 5, 2024, caused CNN, Fox News, and others to jump in our rankings. This trend was also evident in the Overall ranking for the following media outlets, listed by performance. November 6 was the best day of 2024 for each:
-
CNN: #105 on November 5; #72 on November 6
-
Fox News: #153 on November 5; #92 on November 6
-
BBC: #115 on November 5, and #97 on November 6
-
NY Times: #149 on November 5; #98 on November 6
-
NBC News: #160 on November 6
-
Associated Press: #166 on November 6
-
Google News: #250 on November 5; #228 on November 6
-
Wall Street Journal: #241 on November 6
-
Washington Post: #245 on November 6
-
In the next chart we show rankings for CNN, Fox News, the BBC, and NY Times:
-
Brazil made headlines in late February when thousands of Bolsonaro supporters protested to defend the former president against investigations. During this period, Globo moved up the rankings, reaching #60 on February 24-25, 2024.
-
WP, the news aggregator from Poland, had its best day on July 26 (#188), coinciding with Polish lawmakers voting to allow security forces to use lethal weapons with “impunity”, particularly at the tense border with Belarus. WP peaked again on November 6 (#180), the day after the US elections, when the result of the election was mentioned in Poland’s parliament. Its third and final peak was on Black Friday, November 29, again at #180.
-
Rambler, the Russian news aggregator, peaked at #218 on February 23, 2024, the day after the Moscow concert hall attack and the same day Vladimir Putin addressed the nation.
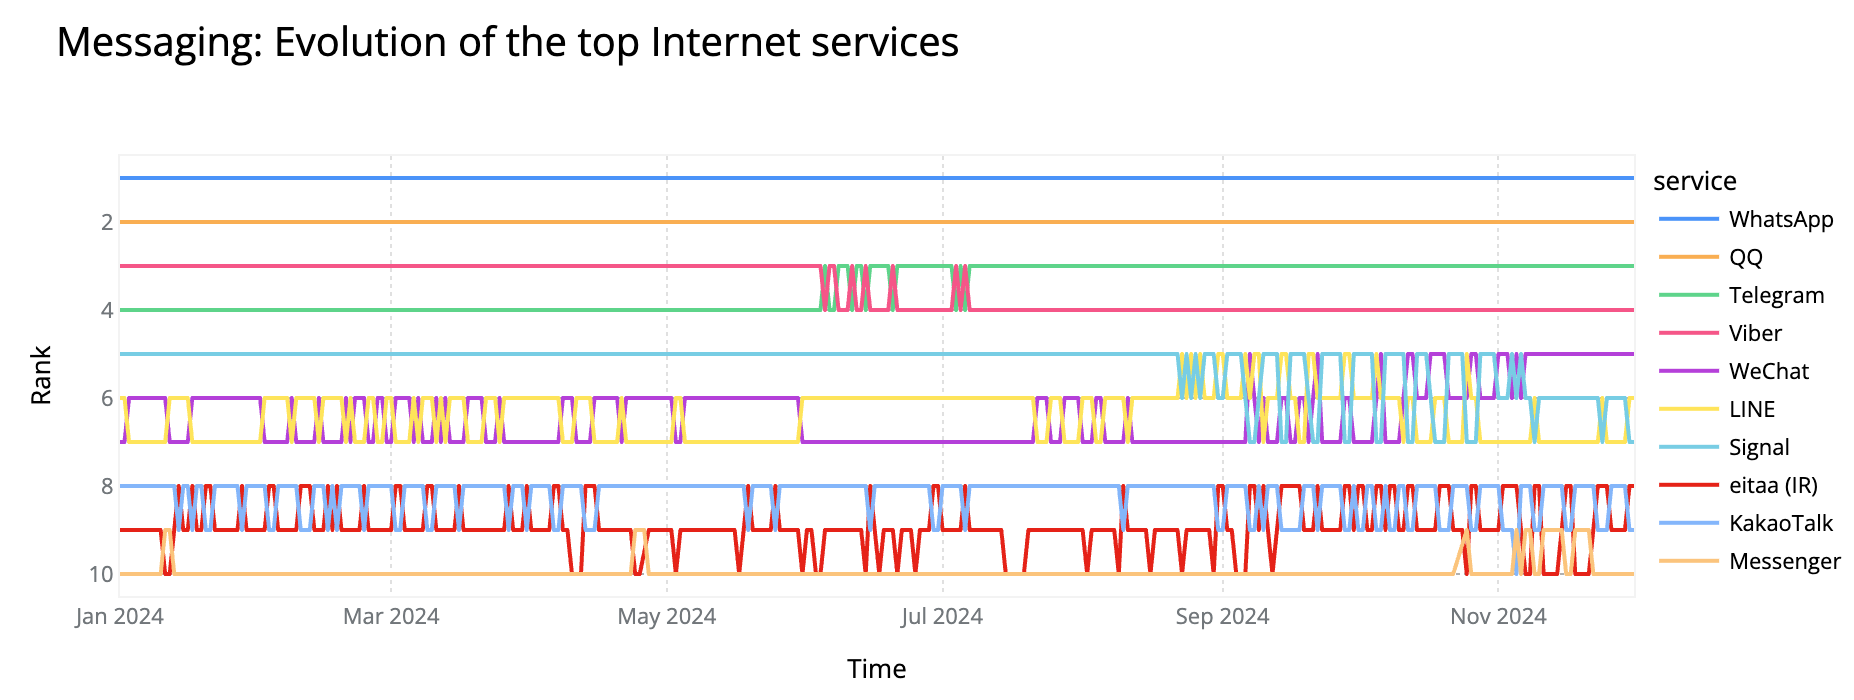
Messaging remains relevant, especially for specific communication purposes. Apple’s iMessage is excluded from this category because it lacks a unique domain name for traffic analysis. With that in mind, WhatsApp retained its position as the top messaging service in 2024, consistent with 2023 and 2022.
-
WhatsApp
-
QQ
-
Telegram
-
Viber
-
WeChat
-
Signal
-
LINE
-
KakaoTalk
-
eitaa.com
-
Facebook Messenger
Following WhatsApp at #2 is, for the second year in a row, the Chinese service QQ, also known as Tencent QQ, which includes games and mobile payments and is popular in Asia. Telegram, widely used in Eastern Europe and Asia, took the #3 spot from Viber in June. Viber remains popular in Eastern Europe, Asia, and the Middle East.
WeChat rose this year, securing #5 in October and surpassing Signal, which held that position for most of the year but dropped to #6 (the same position in which it ended 2023). LINE from Japan ranked #7, while new entries to the Top 10 included South Korea’s KakaoTalk (#8) and Iran’s eitaa.com (#9), a messaging application, designed for both mobile and desktop platforms, that is popular in Iran and among the Farsi (Persian) language diaspora.
Facebook Messenger rounded out the Top 10 at #10.
Here are other messaging trends from our Overall ranking:
-
WhatsApp, as noted, performed better this year, growing in popularity since late July, stabilizing at #9 by mid-October, and performing better during weekdays.
-
Telegram’s best days were between July 16-18, during developments in the Ukraine war, including the Russian Black Sea Fleet leaving Crimea. Telegram is widely used by thousands of Russian ‘war correspondents,’ as recently reported.
-
Eitaa, the Iranian cloud-based messaging app, peaked at #185 in our Overall ranking on April 14, 2024, the day of Iranian strikes against Israel, which we covered in a blog post on Internet trends.
-
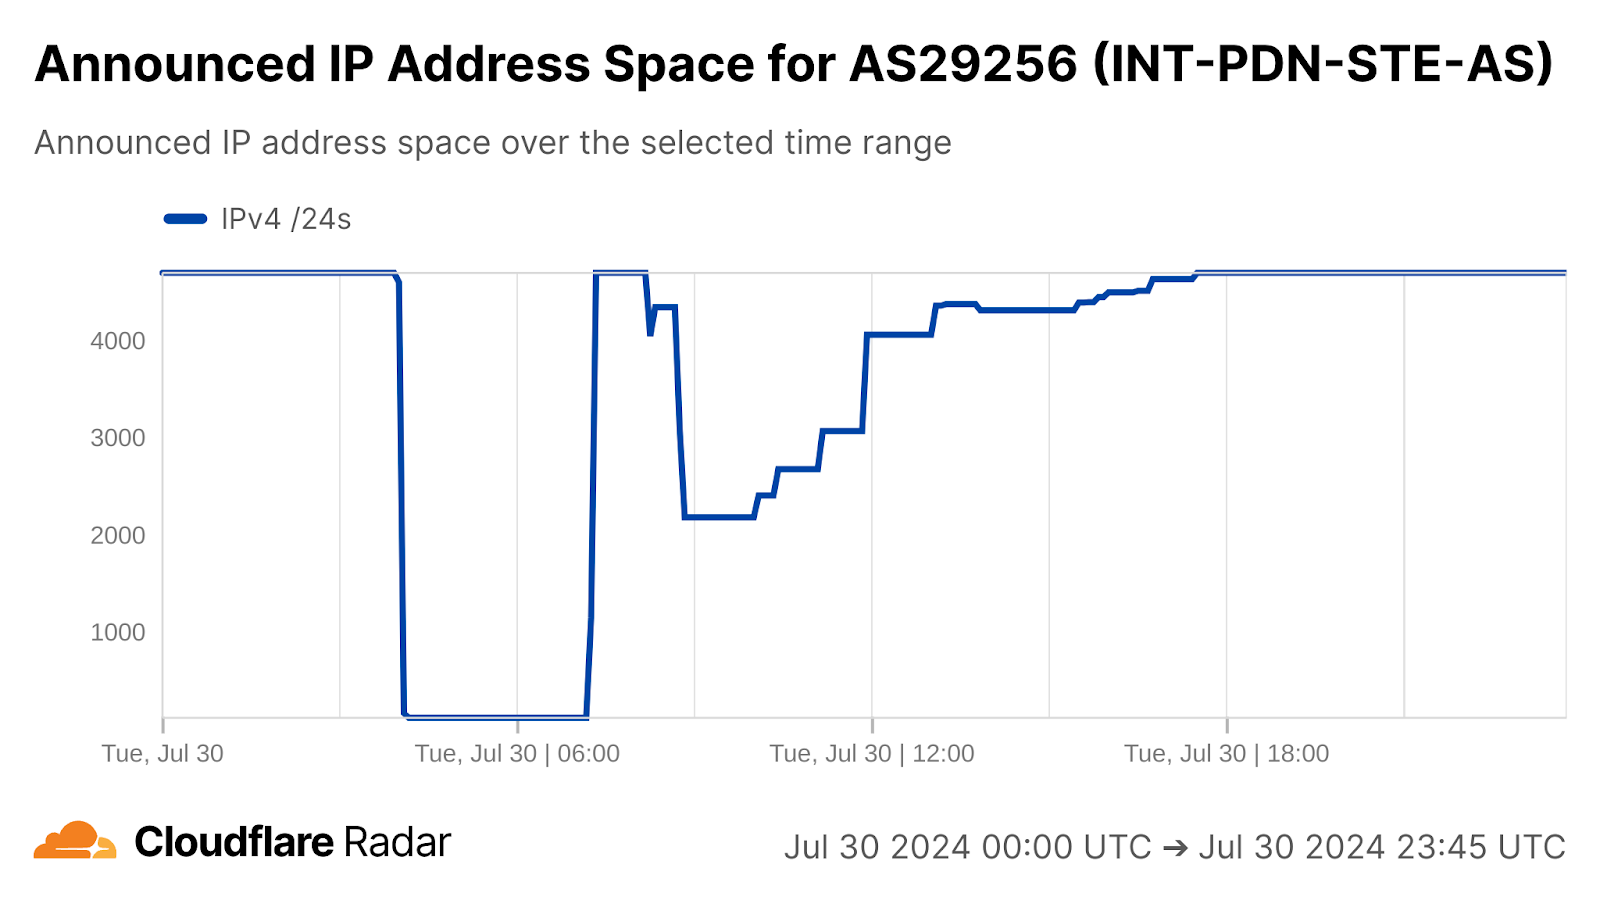
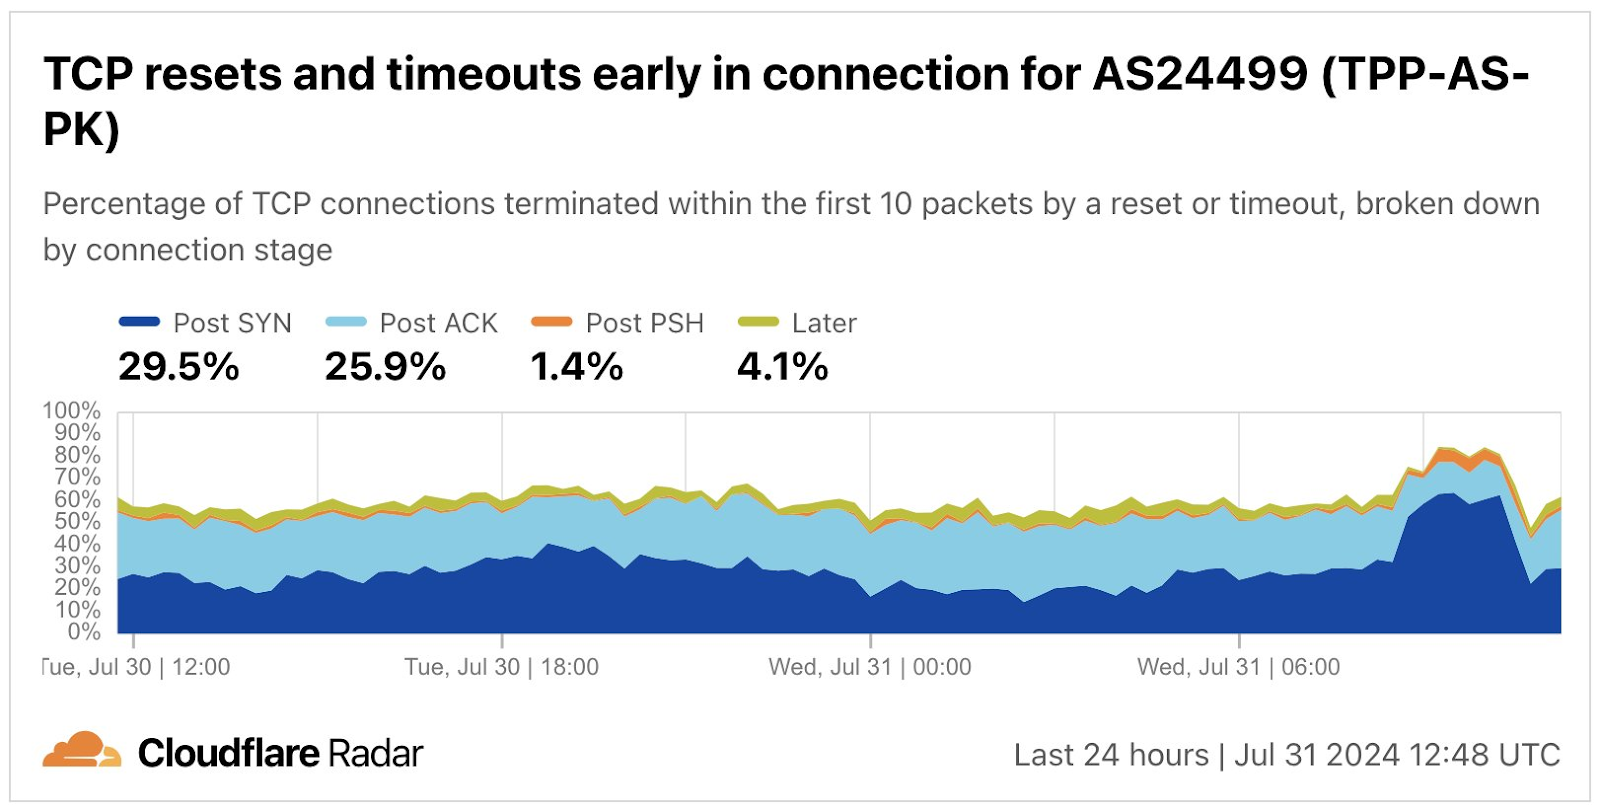
WeChat spiked in our Overall ranking (#116) on July 30, 2024, coinciding with Chinese leaders pledging to tilt stimulus efforts towards consumers.
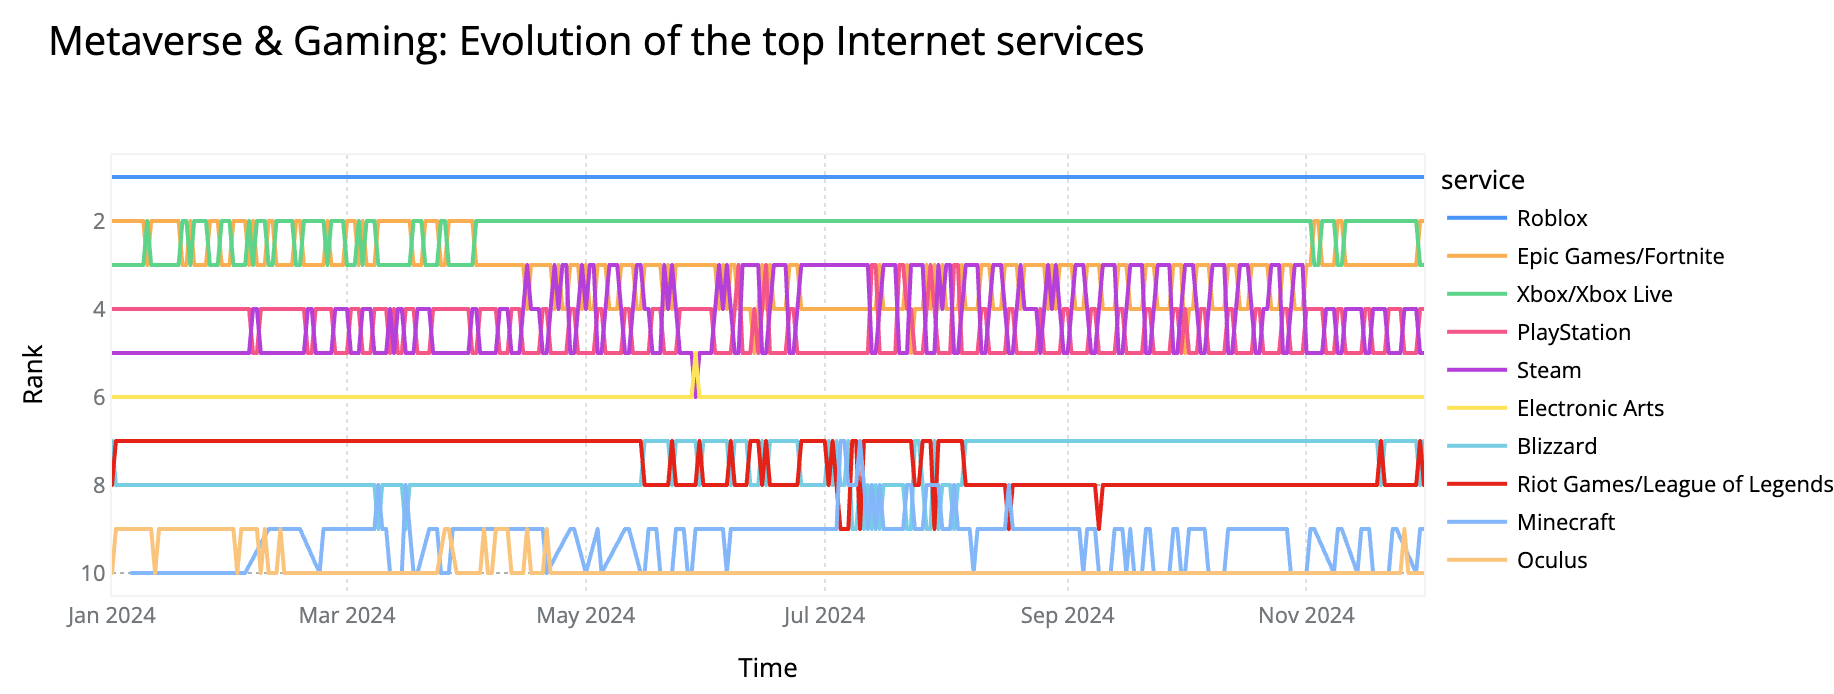
Gaming and metaverse both involve immersing players in other worlds. Leaving concepts aside, we’ve grouped gaming and the metaverse into the same category since 2022. Roblox dominated this category again in 2024, retaining its top spot, followed by Microsoft’s Xbox at #2. Epic Games, the creator of Fortnite, ranked third.
-
Roblox
-
Xbox/Xbox Live
-
Epic Games/Fortnite
-
Steam
-
PlayStation
-
Electronic Arts
-
Blizzard
-
Riot Games/League of Legends
-
Minecraft
-
Garena
Xbox/Xbox Live held #2 consistently, but Epic Games/Fortnite contested the position earlier in the year and again in November. Steam was a surprise this year, jumping to #4, ahead of PlayStation. It even rose to #2 in late March and early April, coinciding with the launch of a new demo. Other platforms on the rise included Electronic Arts, Blizzard, and Riot Games/League of Legends.
Minecraft made the Top 10 at #9, performing best on July 5, 6, and 10, when it reached #7. Garena, the Singaporean game developer and publisher, entered the Top 10 for the first time. Oculus, Meta’s VR headset and metaverse service, dropped out of the Top 10 to #11, after ending 2023 at #5. It performed better earlier in the year (until April) and in late November.
Here’s the top chart across 2024:
Here are other metaverse and gaming trends from our Overall ranking:
-
Roblox’s best day in 2024 was January 21, when it reached #20. The platform performed better on weekends, especially Sundays, similar to other popular gaming platforms like Xbox/Xbox Live, Epic Games/Fortnite, Steam, and PlayStation.
-
Epic Games/Fortnite’s best day was January 1, 2024.
-
Xbox/Xbox Live (#37) and PlayStation (#43) had their best day on November 2, 2024, the day before the launch of the new version of the classic game Aero the Acro-Bat: Rascal Rival Revenge.
-
Steam’s best day was August 24, 2024, during the week of Gamescom 2024 in Germany. Several new games were released that week, including Tactical Breach Wizards and Dustborn.
-
Minecraft, celebrating its 15th anniversary in May 2024, had its best days on June 15 (#90), following the release of the Tricky Trials game update by Mojang Studios, and August 17 (#90), coinciding with the release of Minecraft: Java Edition Snapshot 24w33a.
Financial services cover everything from traditional banking to cryptocurrencies and tax tools. Stripe, the Irish-American payment platform, kept its #1 spot for the second year, after overtaking PayPal in this category in 2023.
-
Stripe
-
TradingView
-
Alipay
-
PayPal
-
Nubank (BR)
-
Binance
-
Coinbase
-
Banco do Brasil
-
Bradesco Bank
-
Itau
PayPal spent only a few days at #2 and a few others at #3 this year, but ultimately dropped to #4. TradingView, a platform specializing in tools for traders and investors, climbed to #2, followed by AliPay, the Chinese mobile and online payment platform, which secured #3.
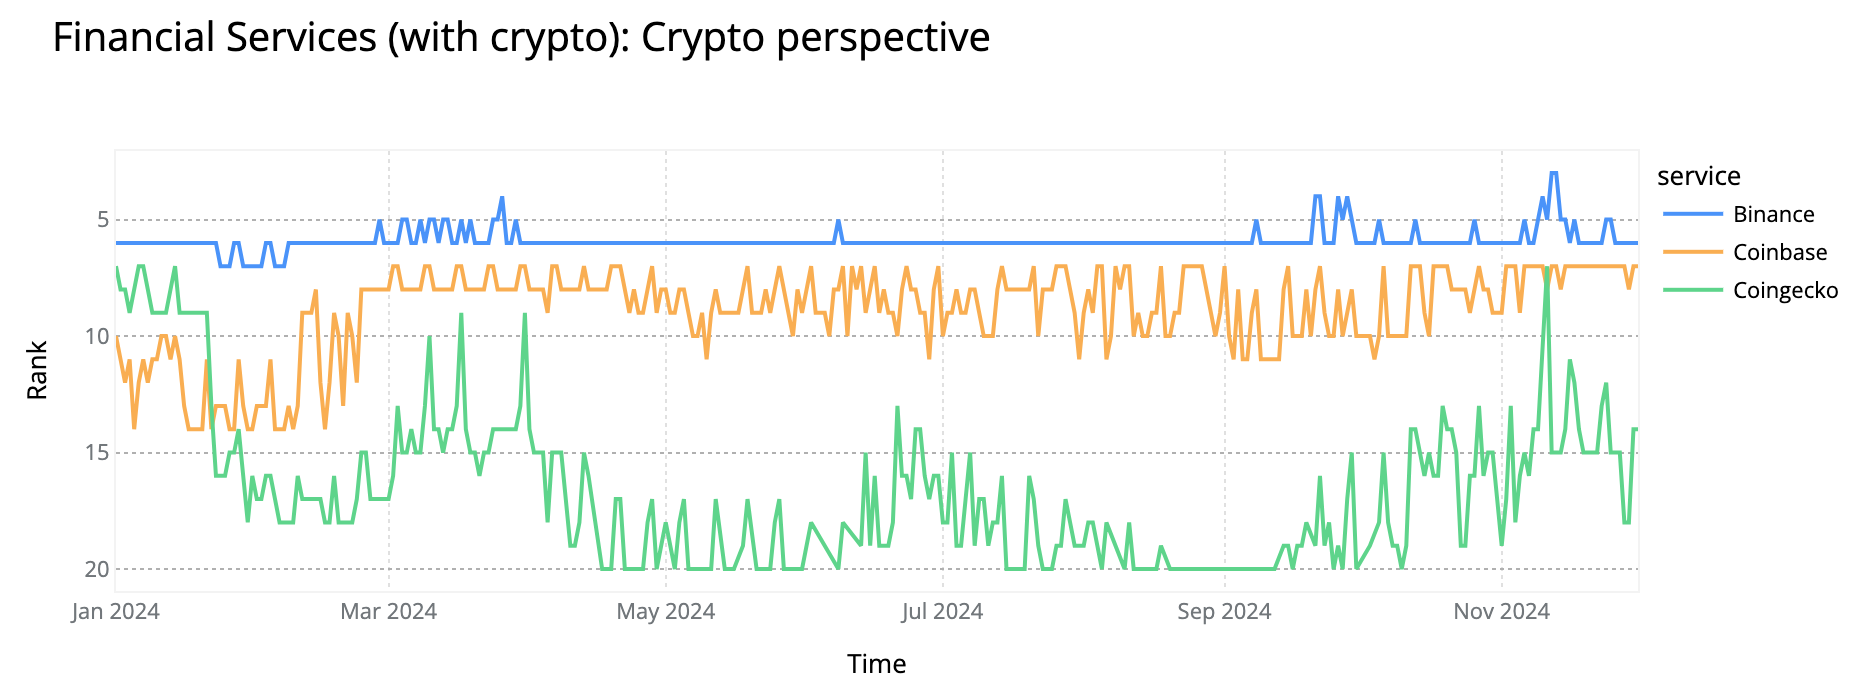
Nubank, the Brazilian neobank (only online) and considered to be the most valuable, one of the biggest Latin America financial groups and the world’s biggest digital bank, entered the Top 10 at #5, while Binance rose to #6 (up from #8 last year). Binance also peaked at #3 on November 12-13, following the US elections, as Bitcoin reached new highs. In the crypto space, Coinbase joined the Top 10 for the first time.
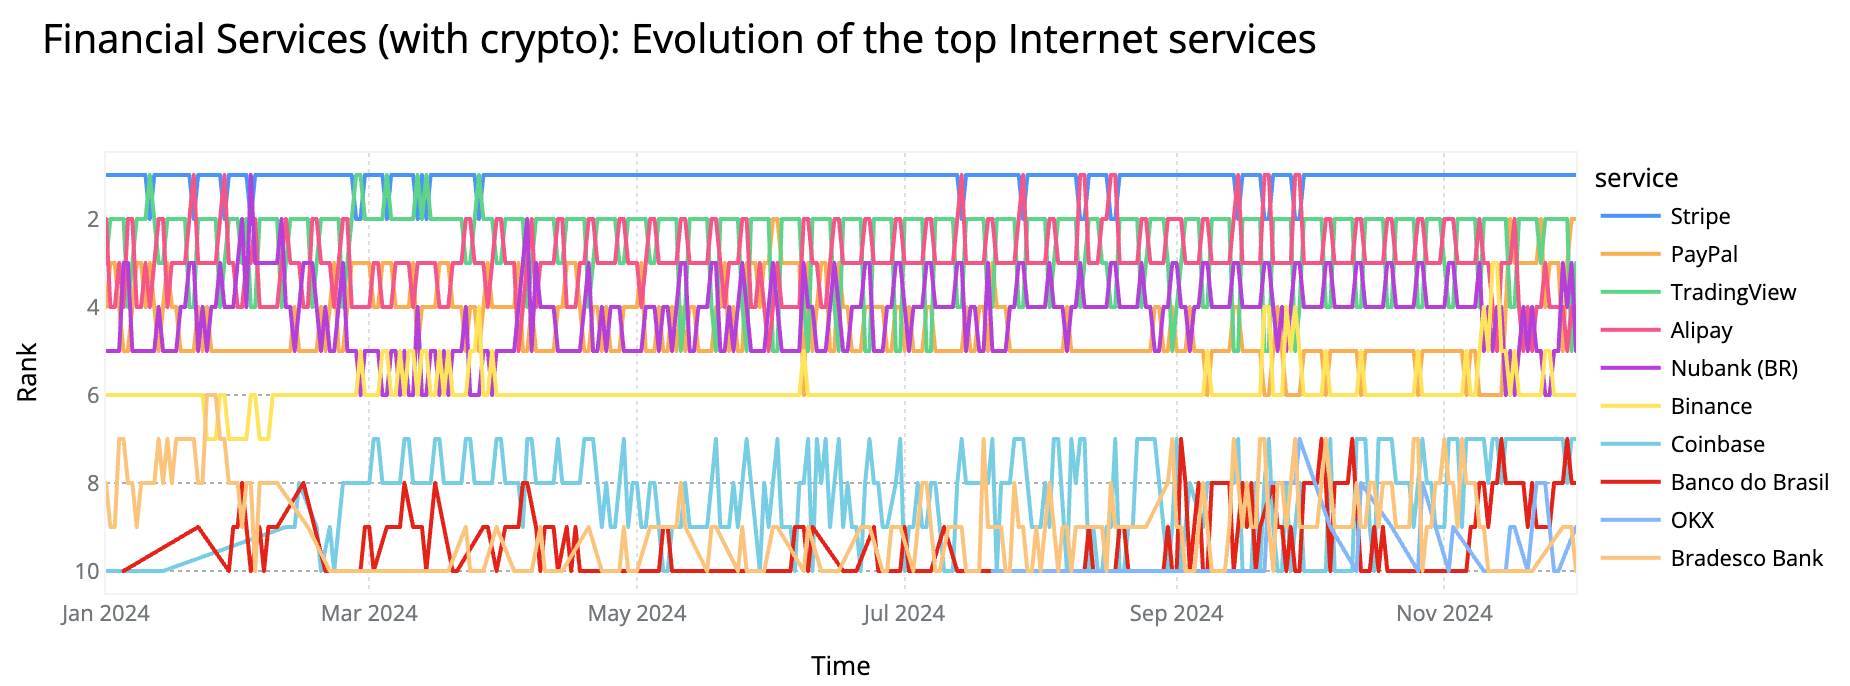
Brazil’s growth in online banking, digital banks, and payments in Latin America has driven traditional banks to expand their digital presence. In 2024, Banco do Brasil, Bradesco, and Itaú performed well and rose into the Top 10, moving more than ever to the online space including in partnership with each other (as detailed in these two (1), (2) articles in Portuguese).
And here’s the crypto perspective in this Financial services category:
Next, we highlight other financial services trends from our Overall ranking:
-
Stripe’s best days were just before Black Friday, on November 18-19 and November 25, reaching #81 during those days. Stripe performed better on weekends and maintained consistent rankings throughout the year.
-
PayPal ranked higher around Black Friday week, peaking at #89 on November 21 and on Black Friday, November 29.
-
Brazilian bank Nubank performed best a few days before Carnival in Brazil (February 10-14), reaching #87 on February 1 and 3 and #92 on February 10. It also ranked well on Black Friday, November 29, peaking at #90.
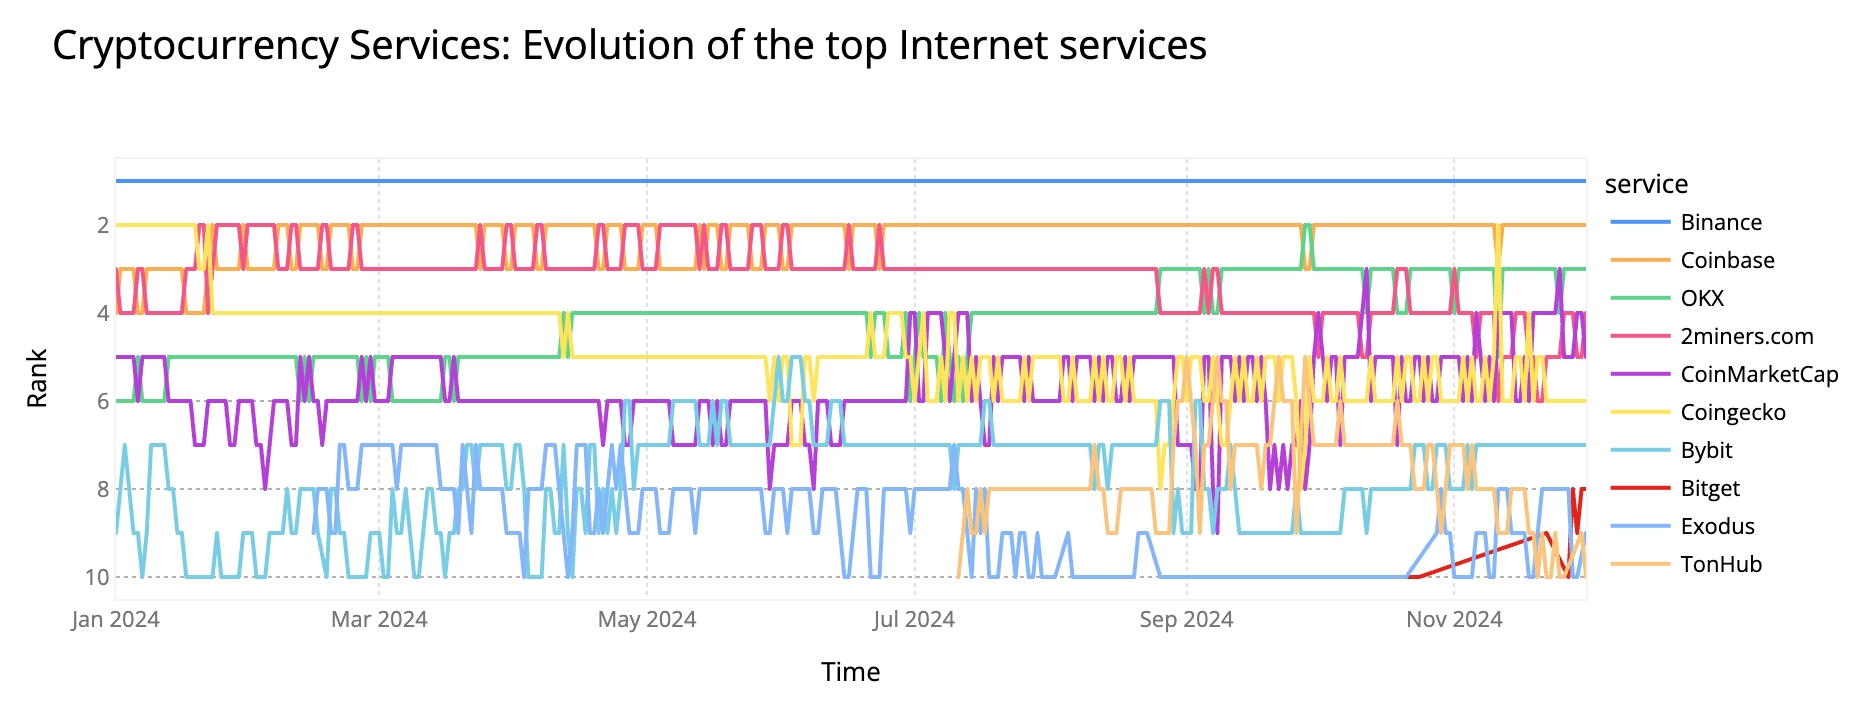
In addition to our Financial Services category, we evaluated cryptocurrency-related services specifically. Despite a few crashes over recent years, the crypto sector continued to evolve in 2024, experiencing a late-year boom, as we explore below. Binance and Coinbase retained the top two spots, while OKX climbed to #3 this year.
-
Binance
-
Coinbase
-
OKX
-
2miners.com
-
CoinMarketCap
-
Coingecko
-
Bybit
-
Exodus
-
Tonkeeper
-
NiceHash
CoinGecko, a cryptocurrency data platform, dropped to #6, making way for OKX in late August, while new entrant 2miners.com rose to #4. CoinMarketCap ranked #5, followed by several dynamic new entrants in the Top 10:
-
Bybit (#7): A cryptocurrency exchange offering spot and derivatives trading.
-
Exodus (#8): A user-friendly, multi-asset cryptocurrency wallet.
-
Tonkeeper (#9): A secure wallet for managing Toncoin and related assets.
NiceHash, a platform connecting cryptocurrency miners and buyers, performed better in 2023, but dropped from #5 to #10 this year.
The US elections also had an apparent effect on the Overall ranking:
-
Binance entered the Top 100 for the first time on September 26, when Bitcoin surged past $65,000, driven by positive US employment data and China’s announcement of economic stimulus measures. It peaked at #97 on November 13, following the US elections and Donald Trump’s victory, as Bitcoin’s price surpassed $90,000 for the first time.
-
Coinbase’s best day was November 21, reaching #131, as Bitcoin approached $100,000 (which it surpassed on December 4, although our ranking only covers up to December 1).
-
OKX peaked at #149 on November 22, and CoinMarketCap reached #176 on November 23.
-
CoinGecko’s best day was November 11, the week following the US elections, when it climbed to #137.
Outside the categories we reviewed as part of the Year in Review, several notable trends emerged in our Overall ranking:
-
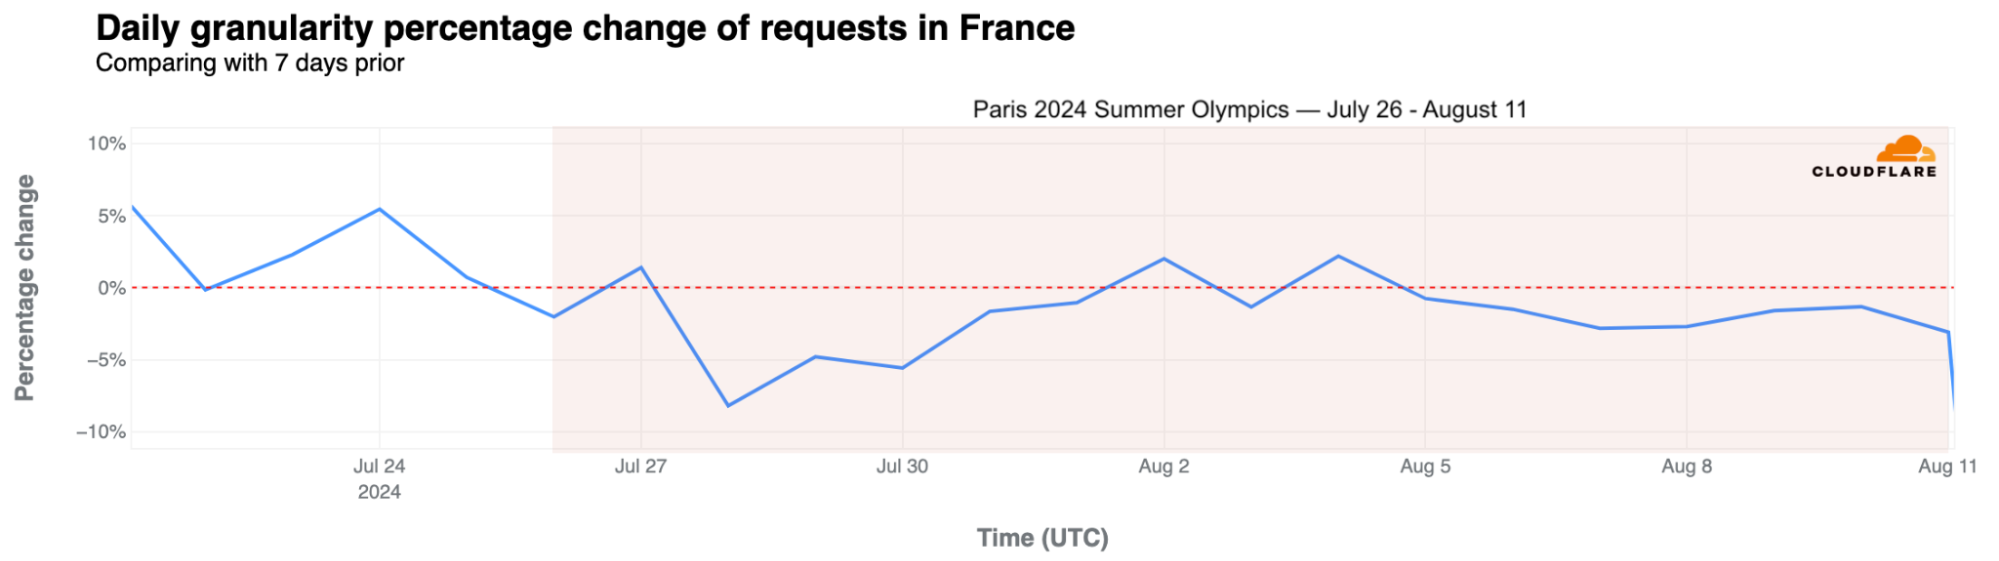
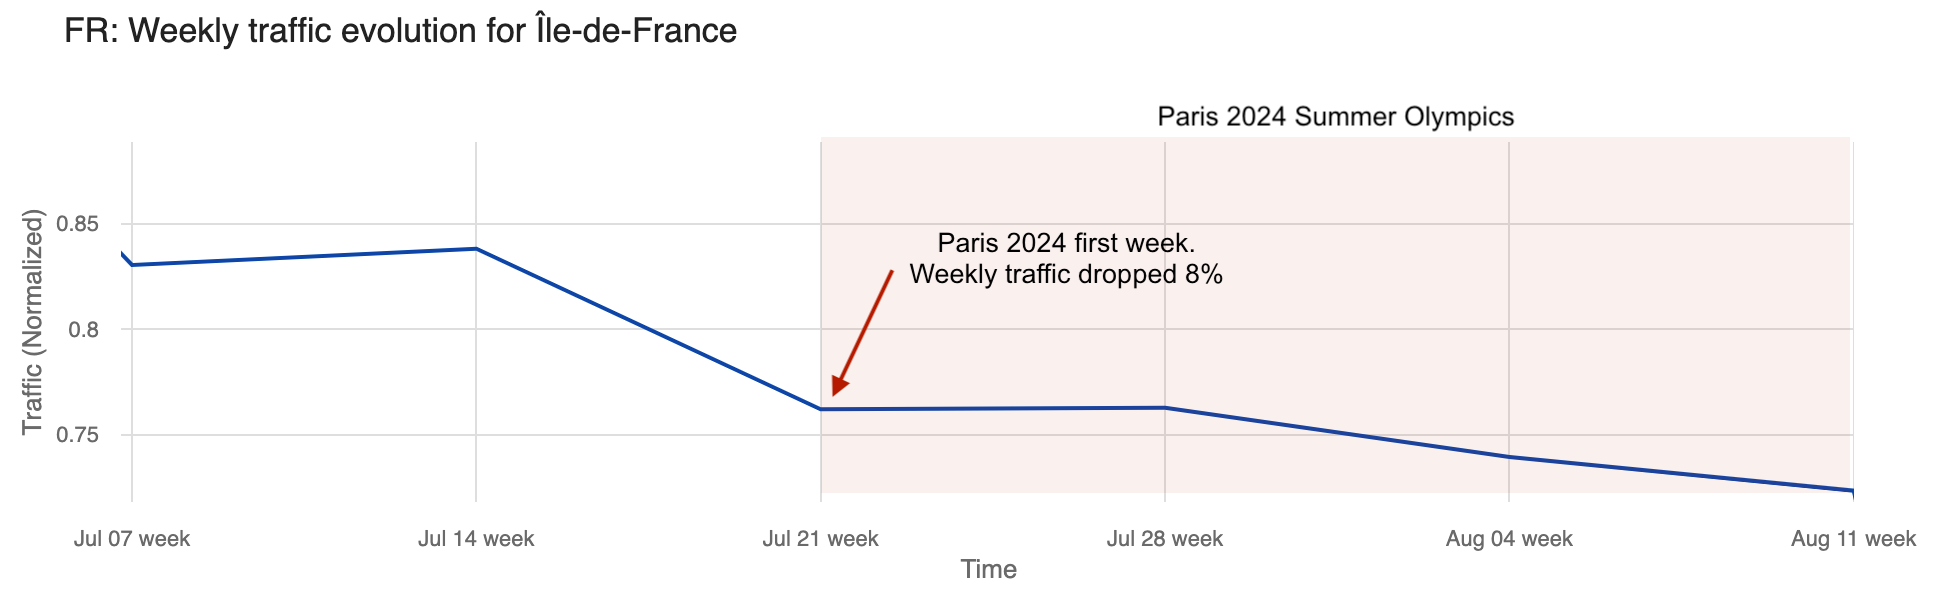
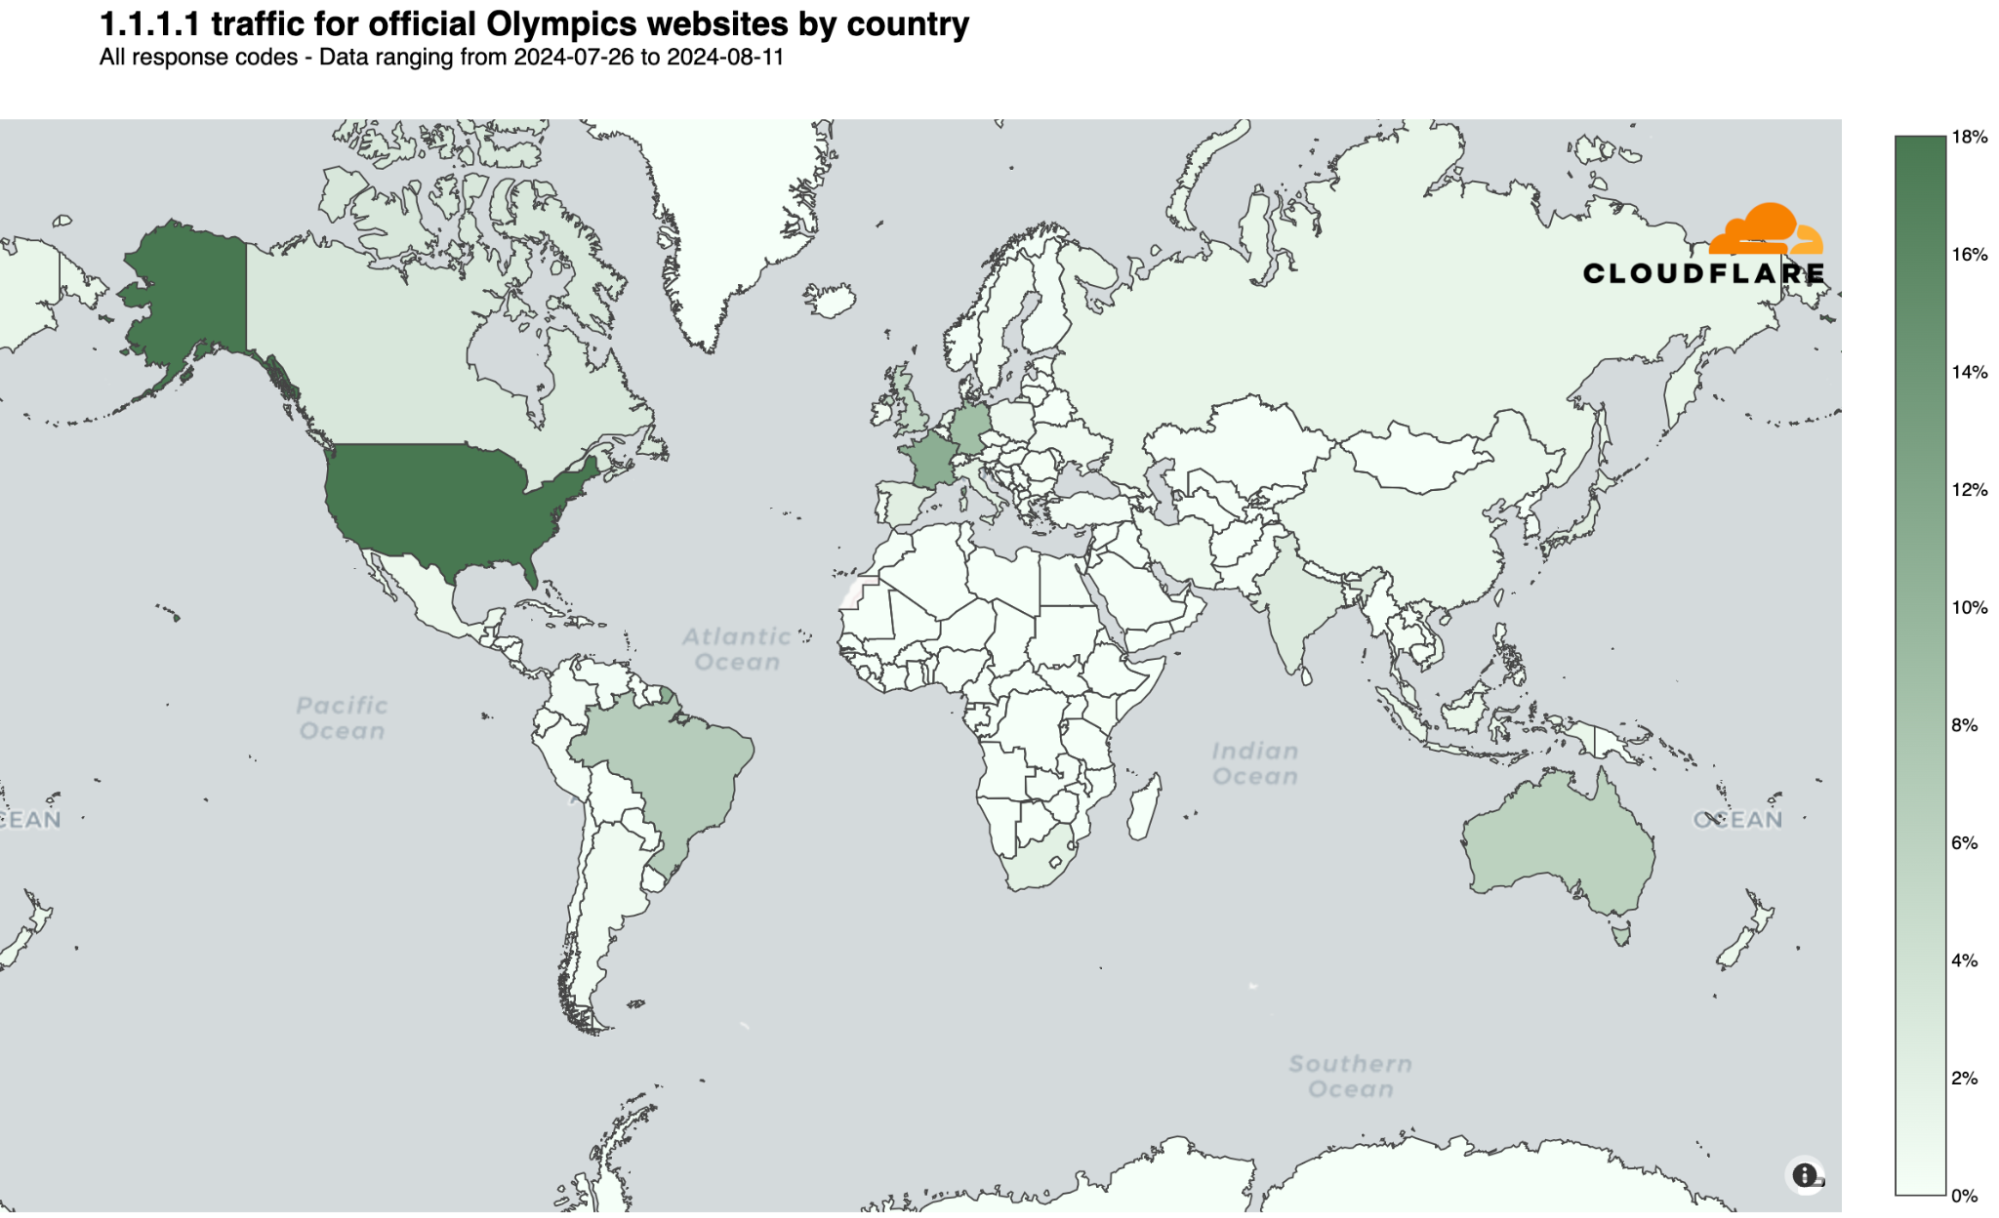
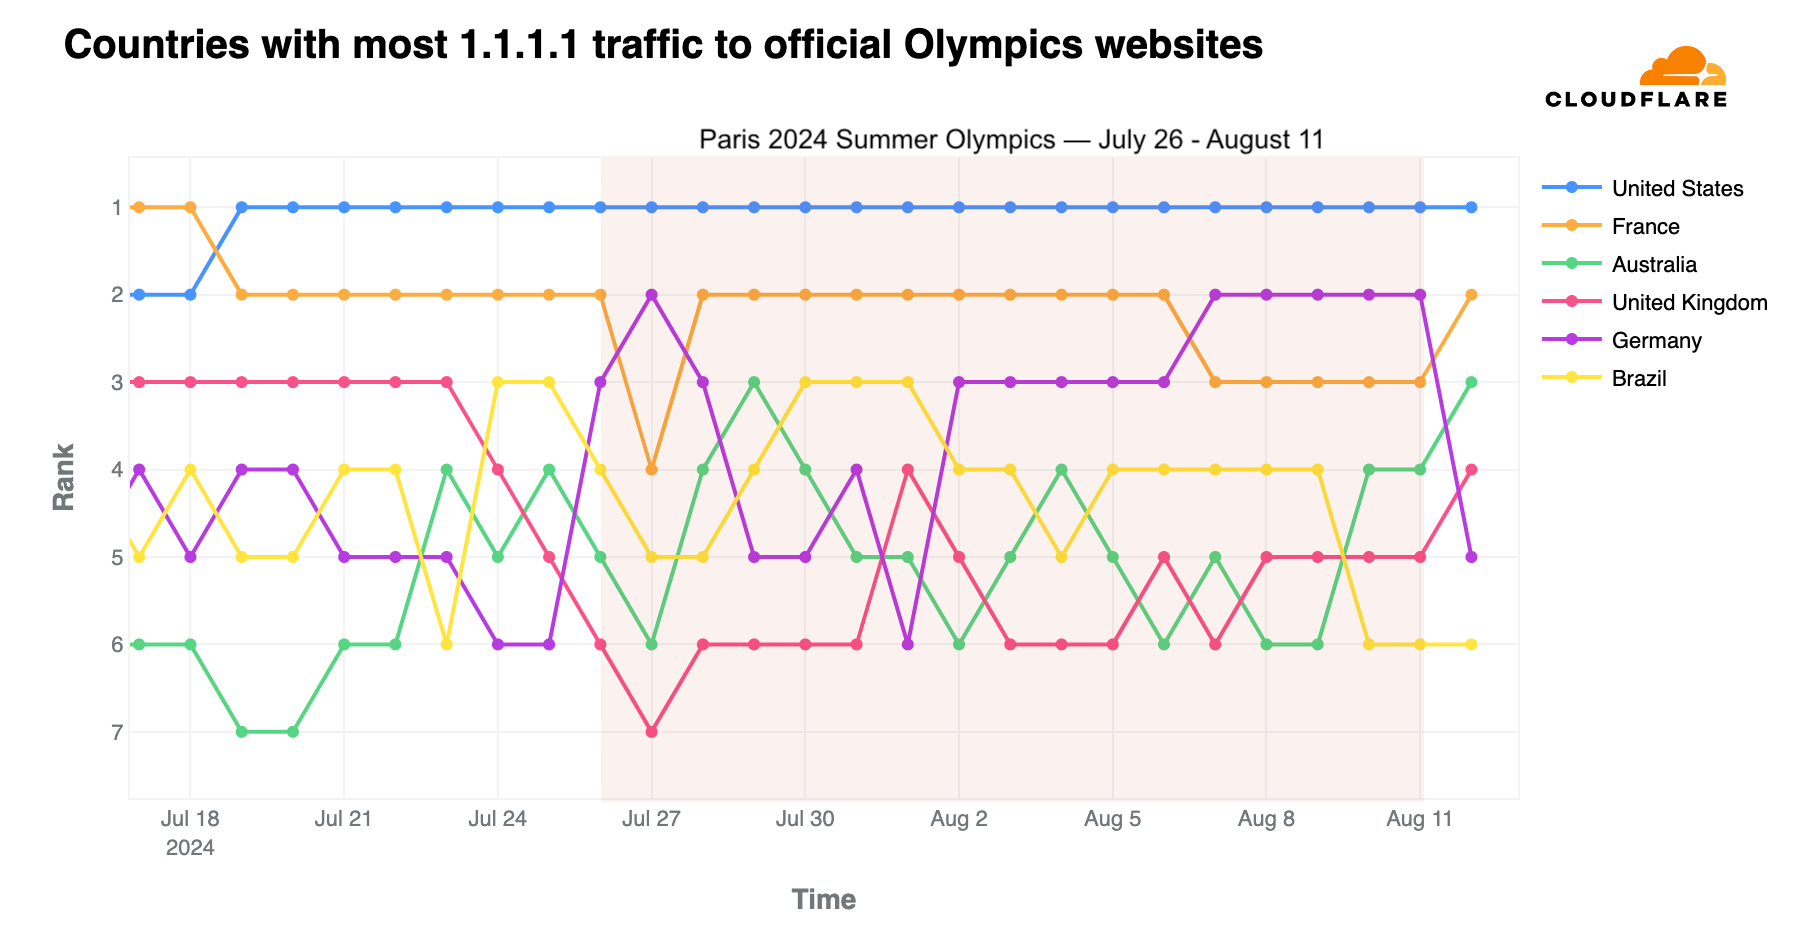
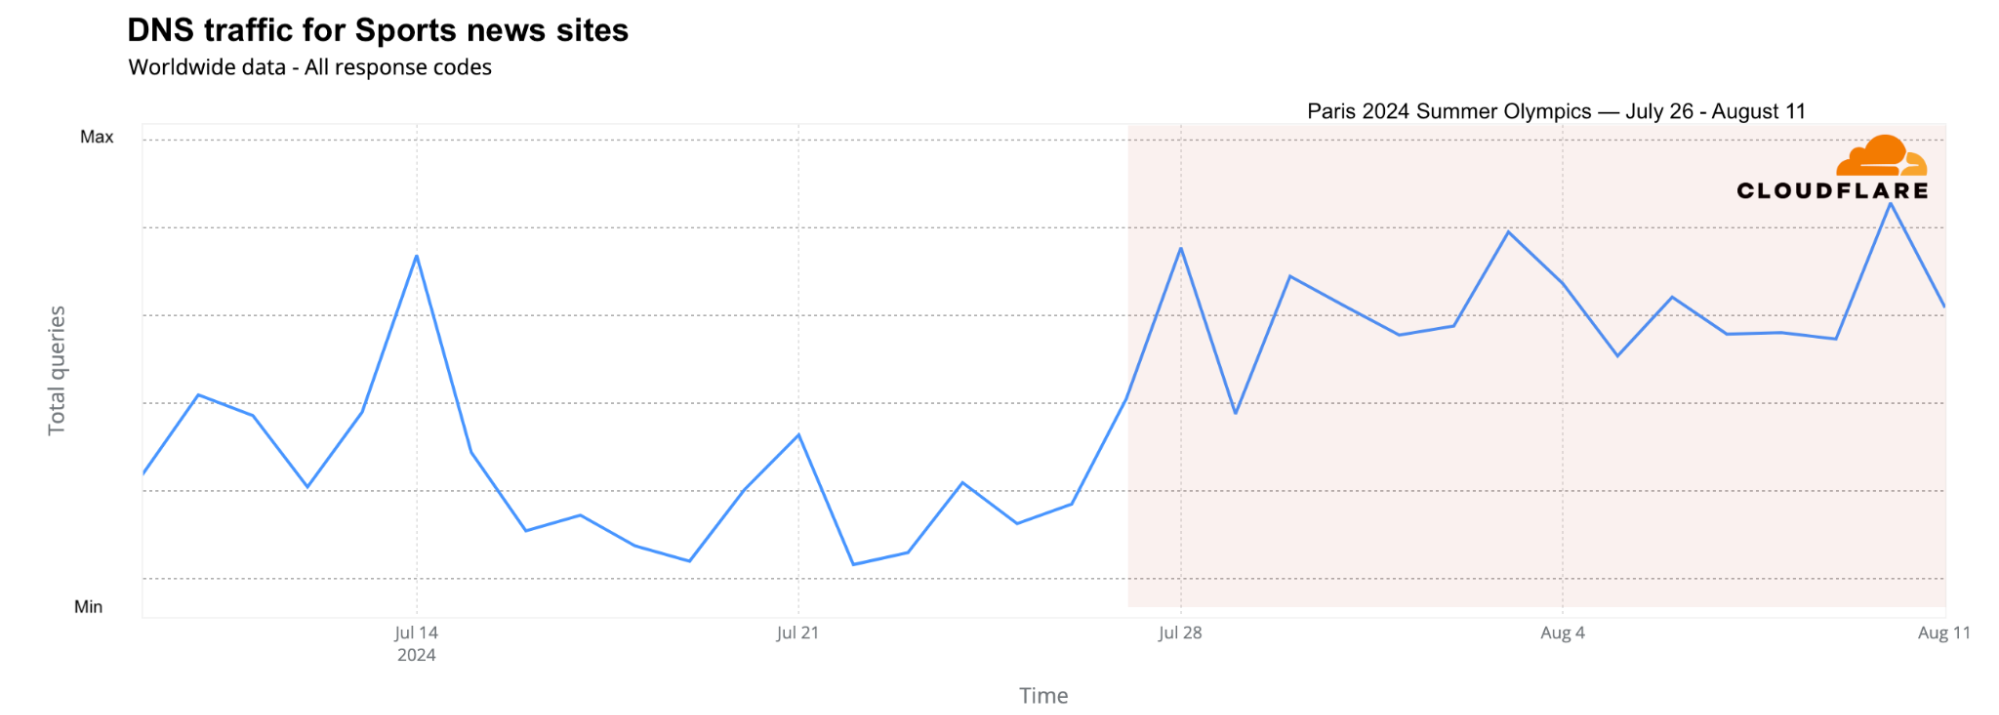
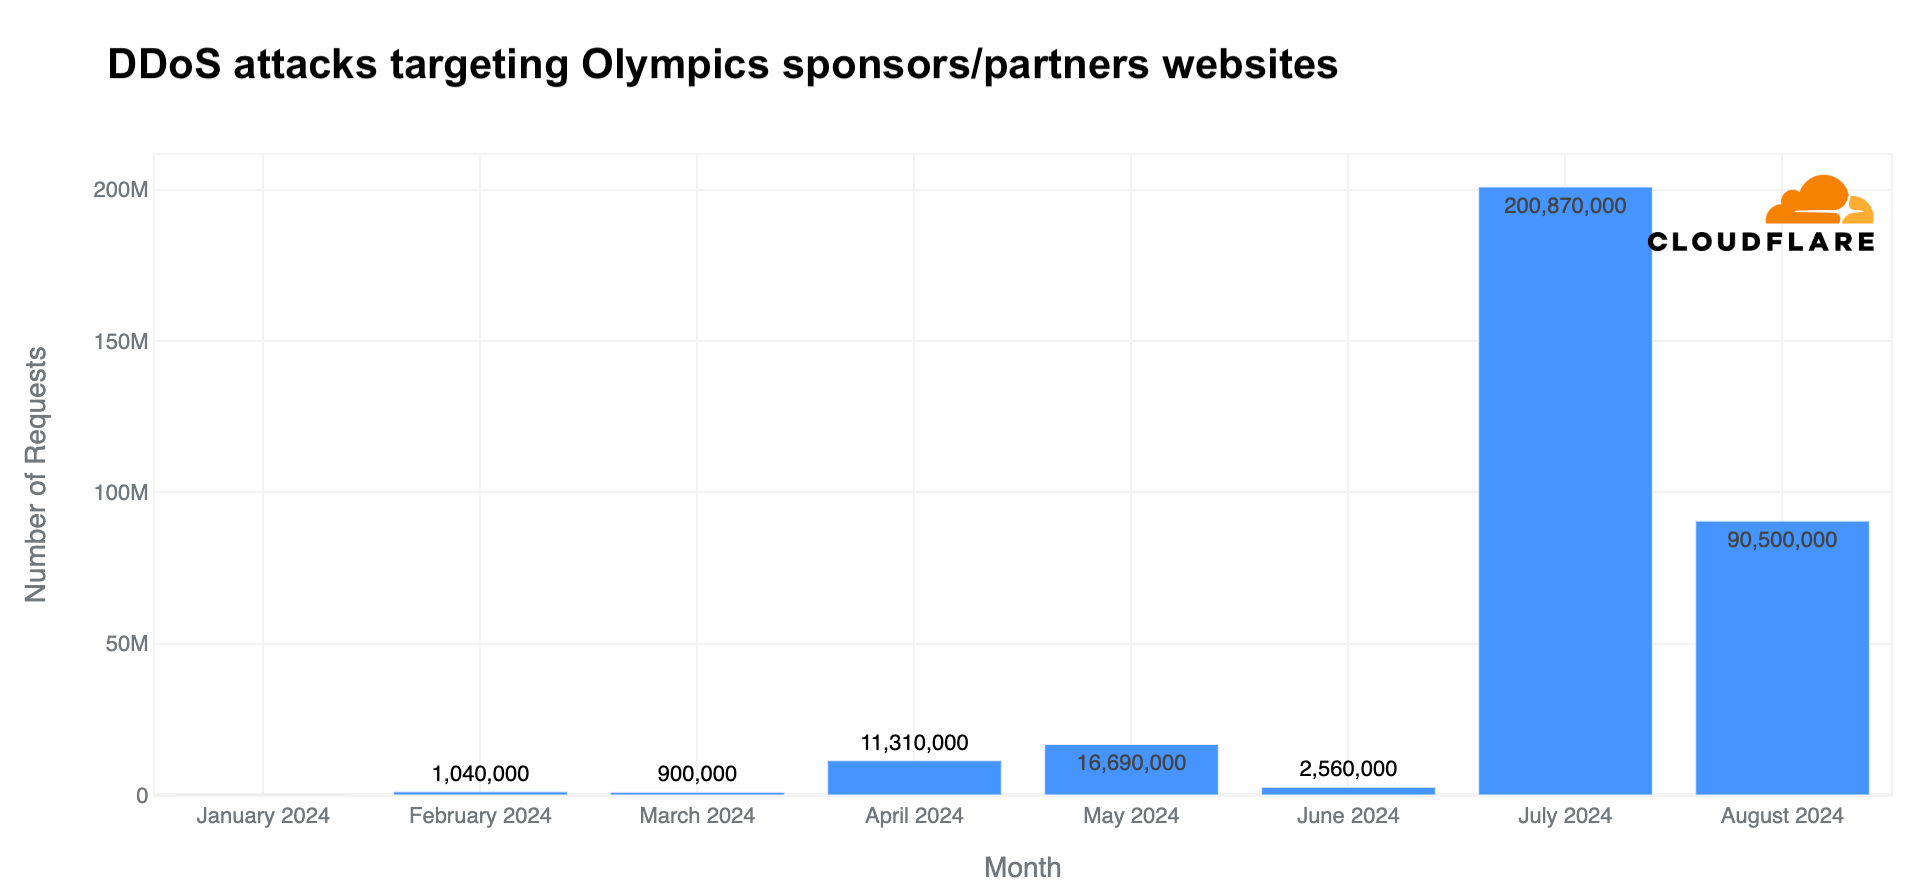
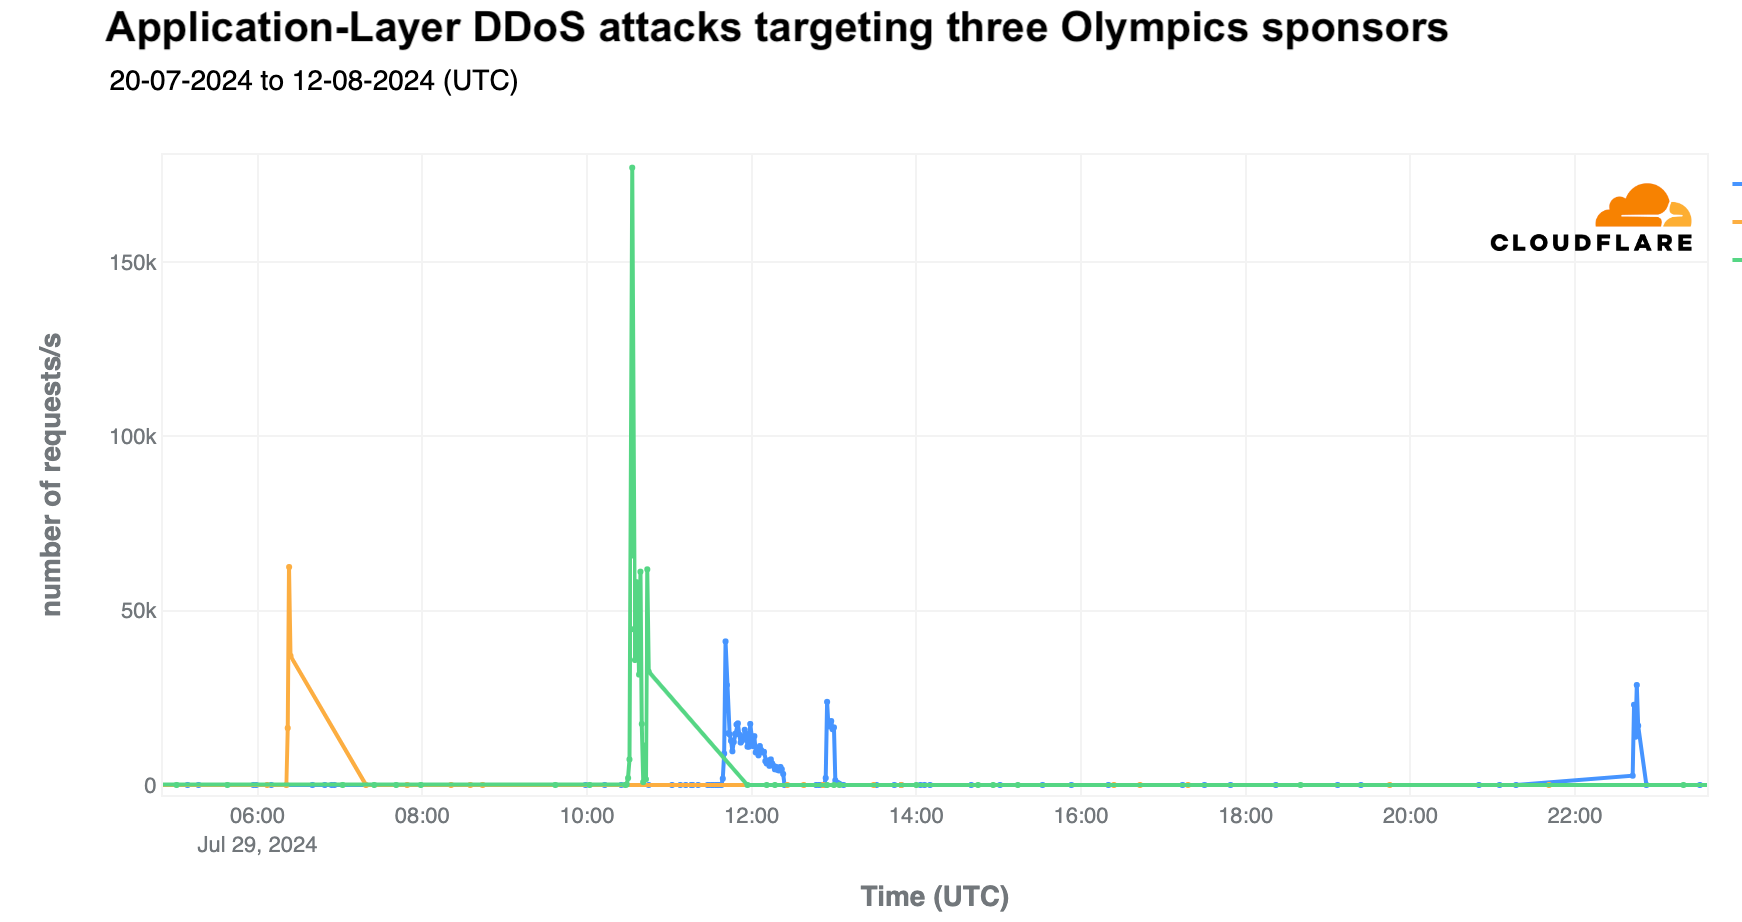
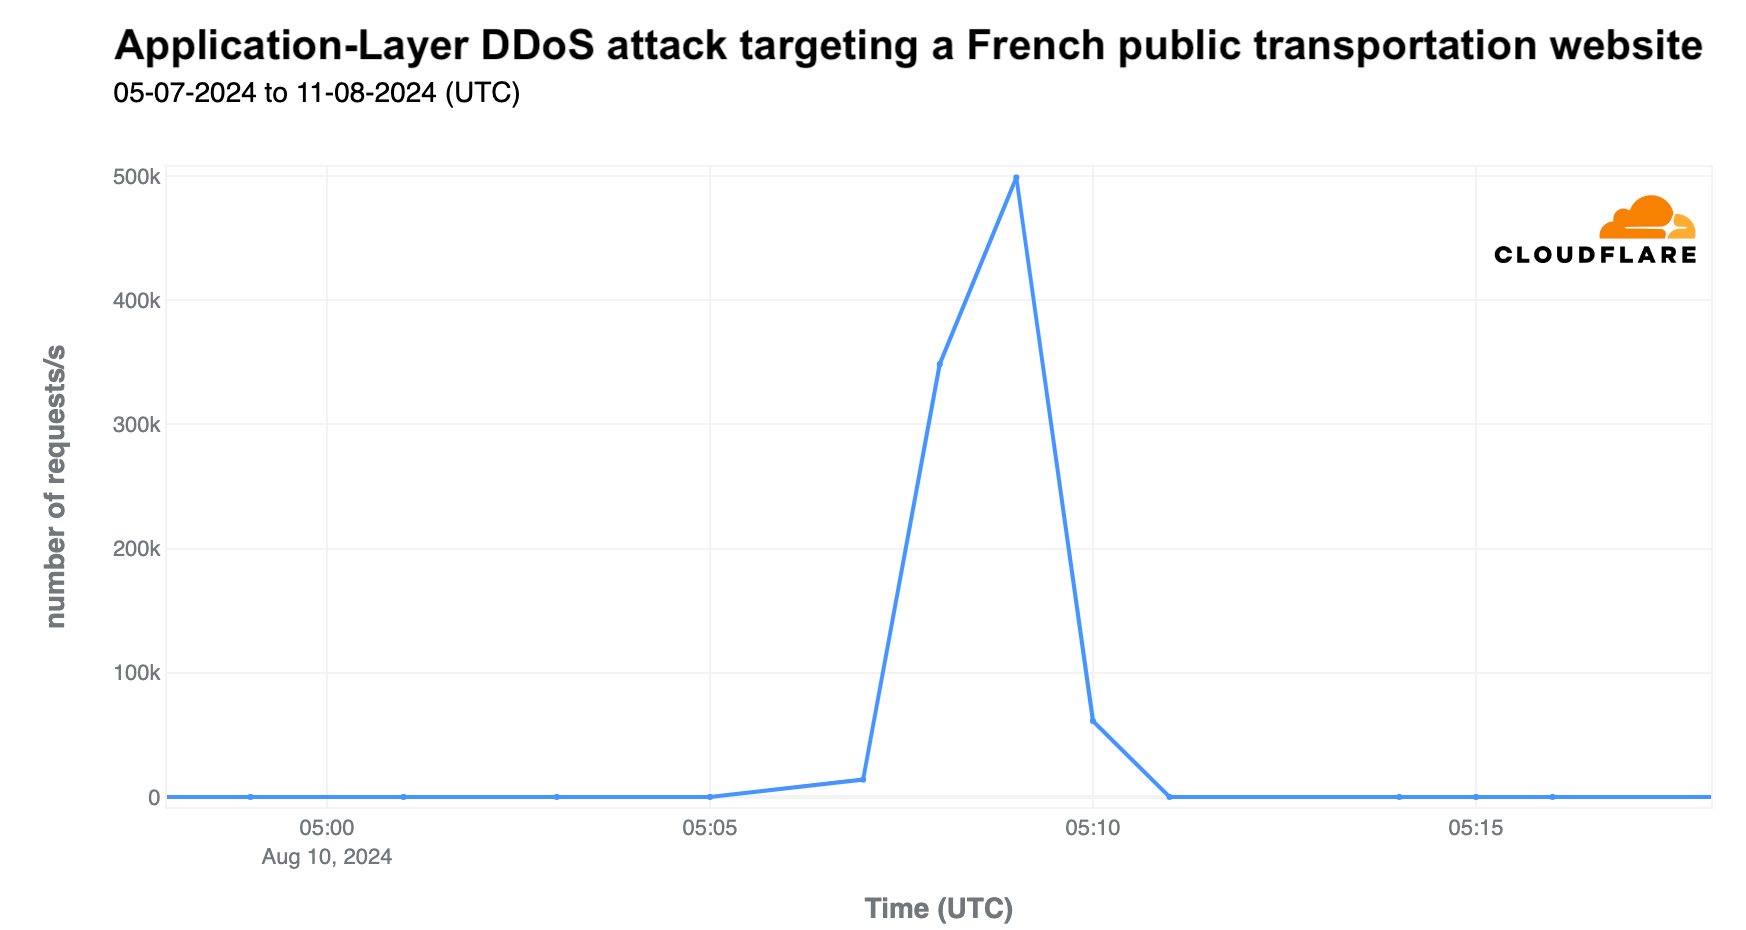
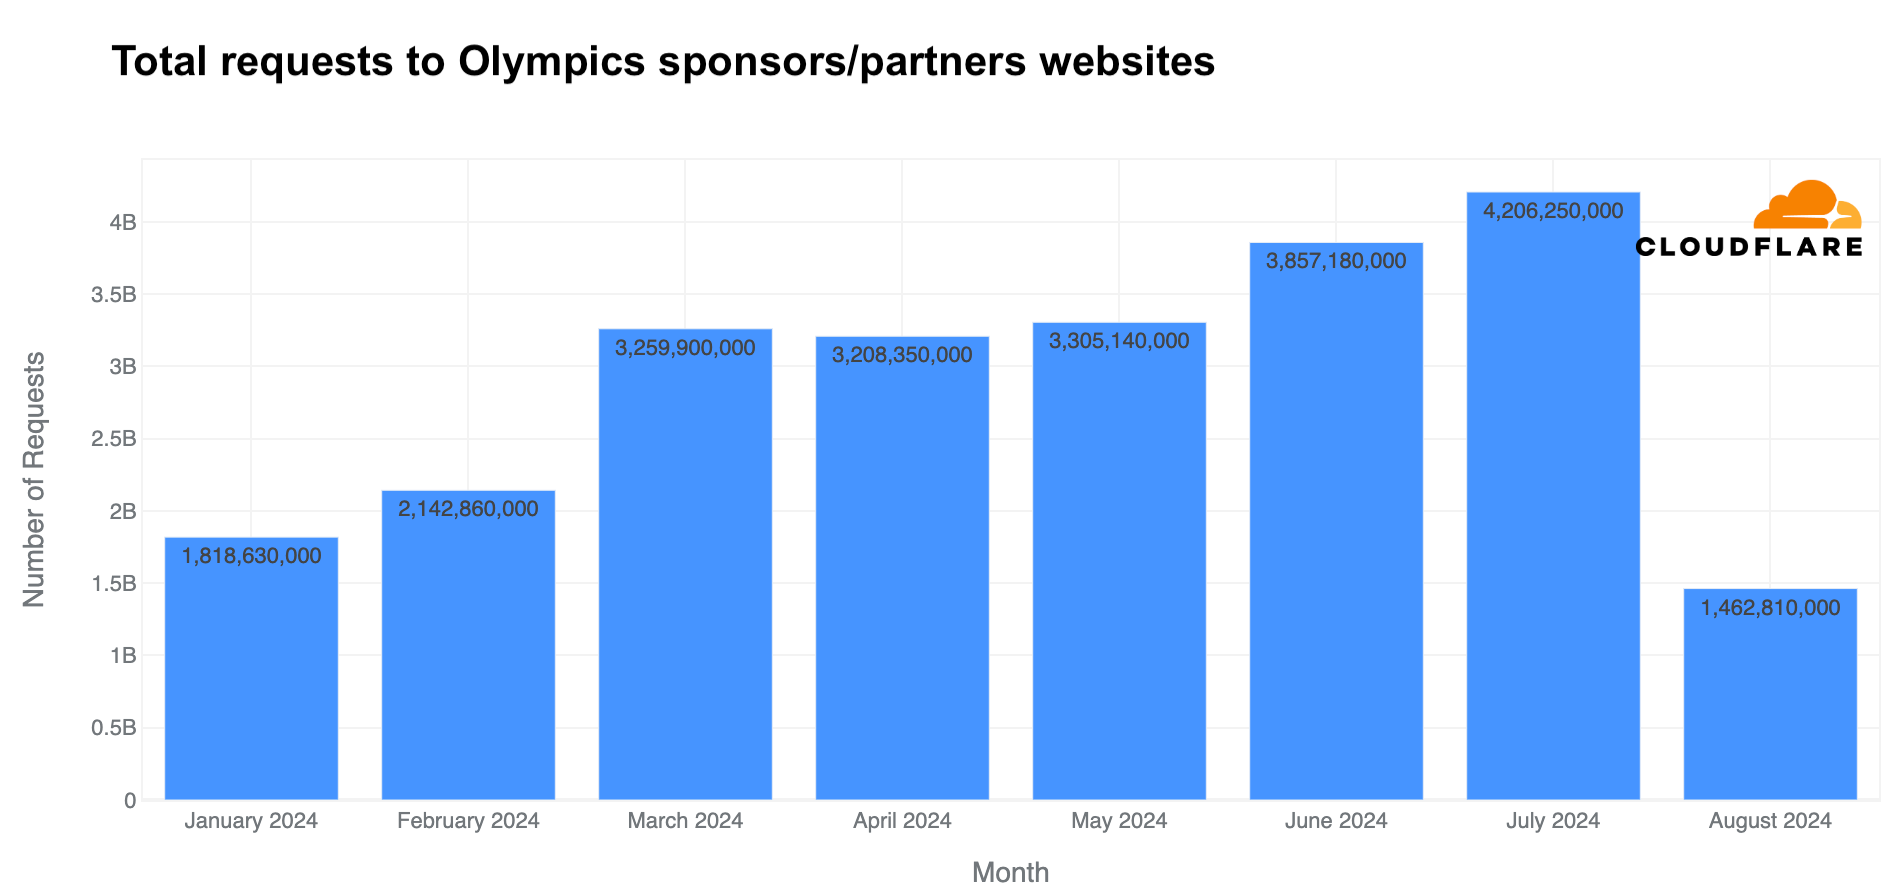
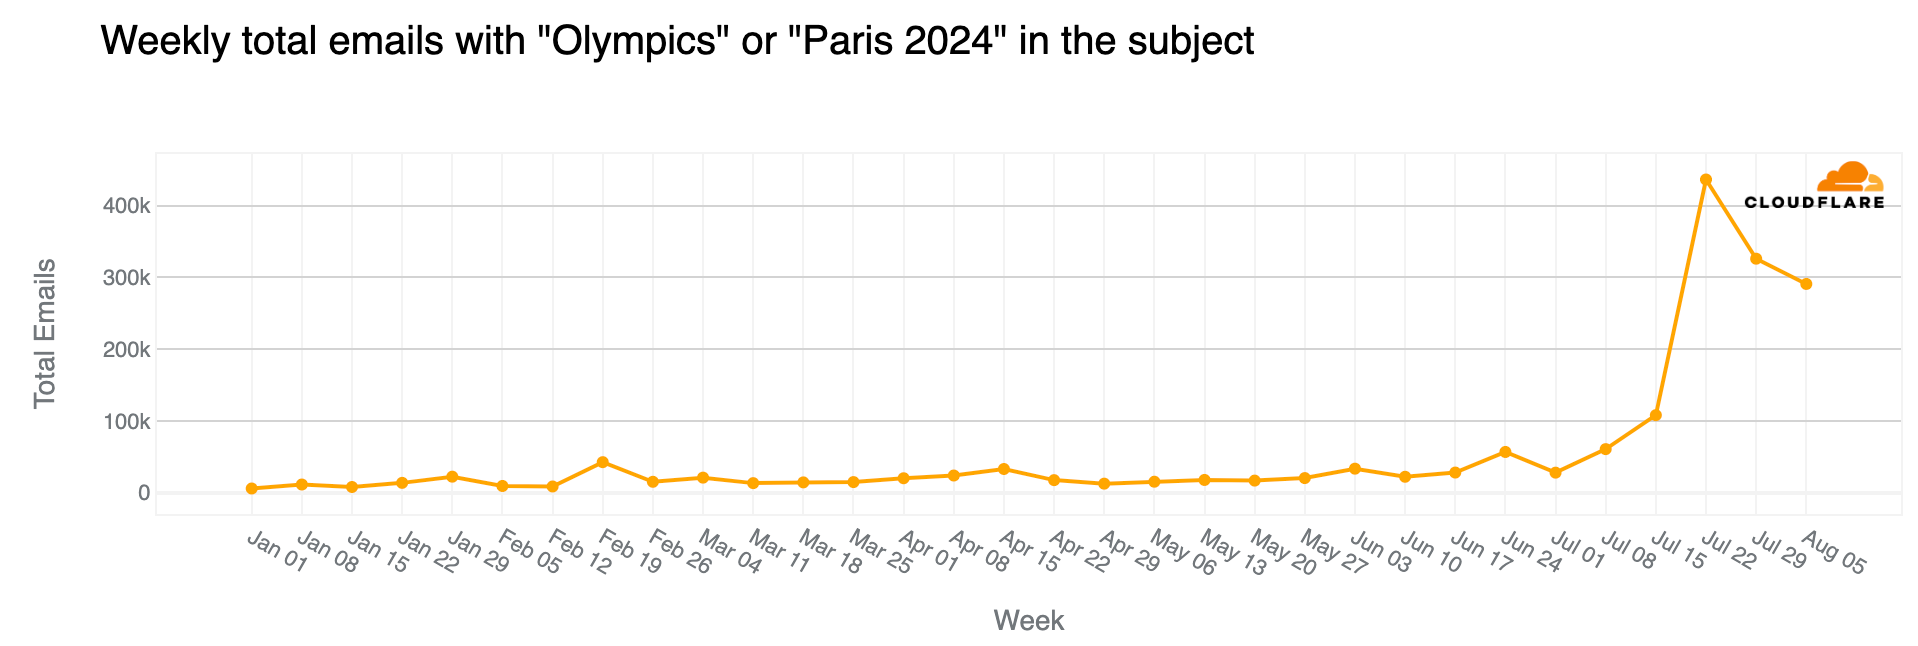
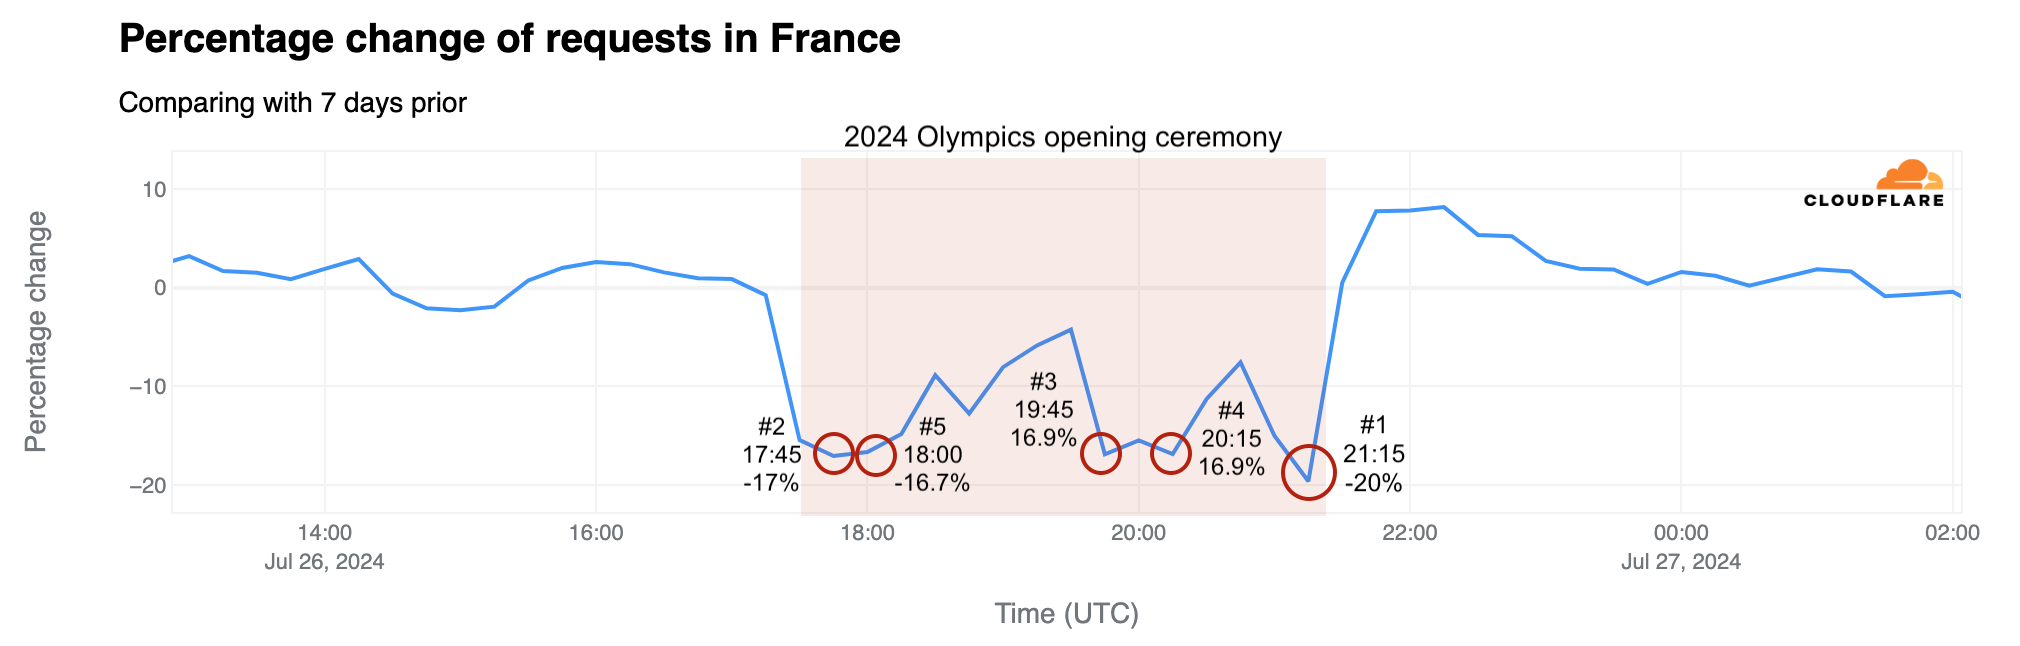
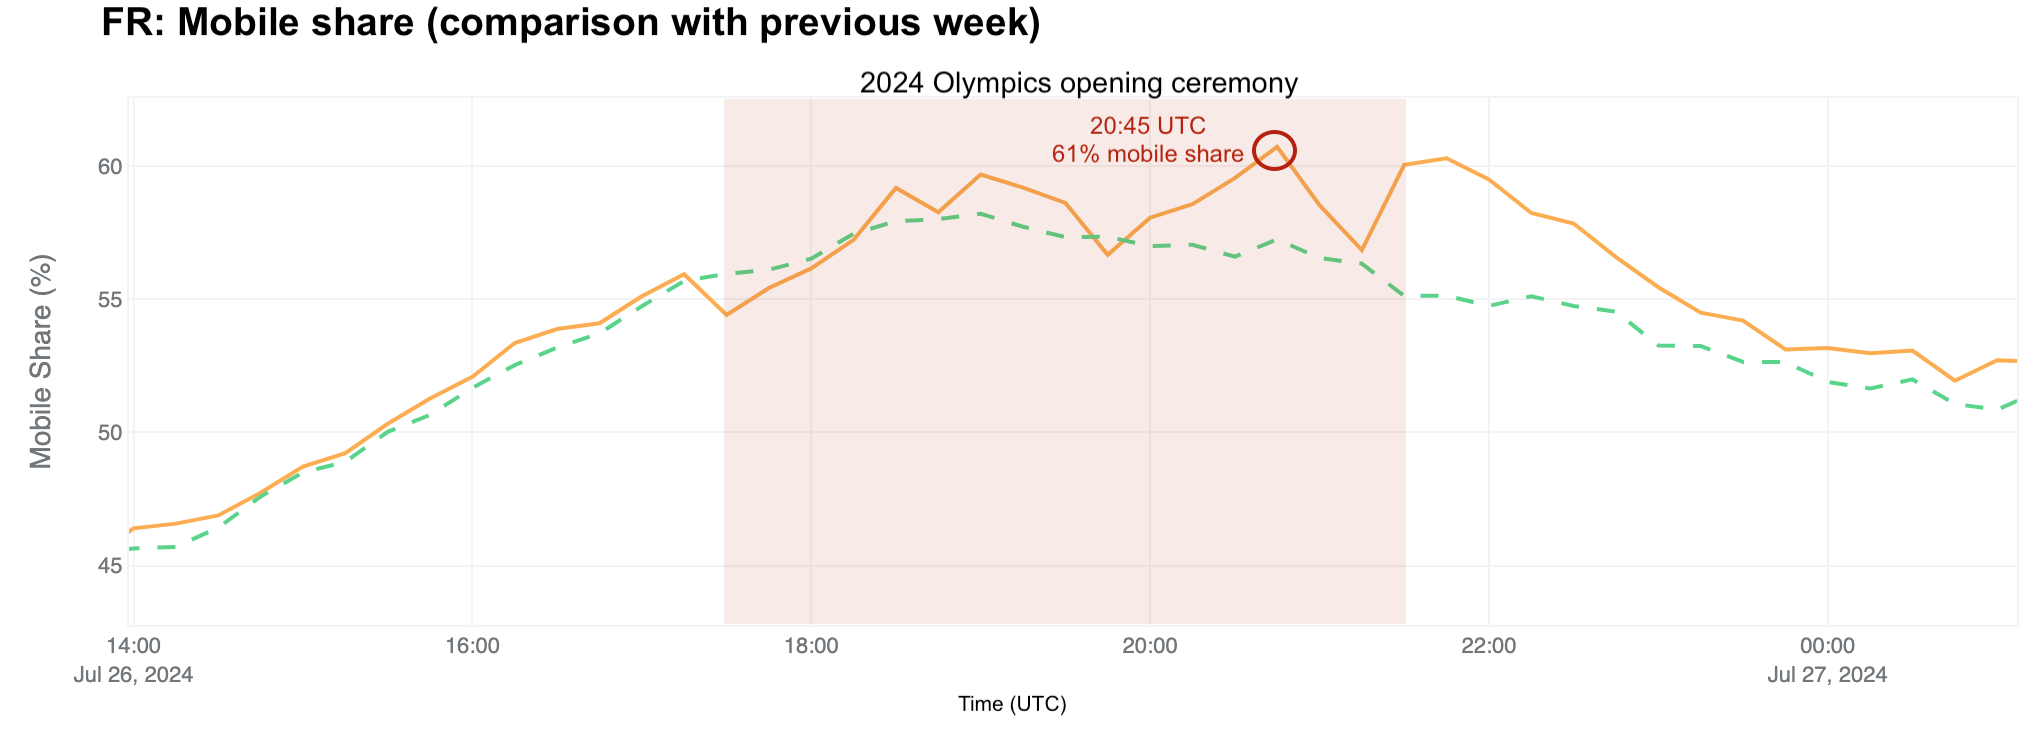
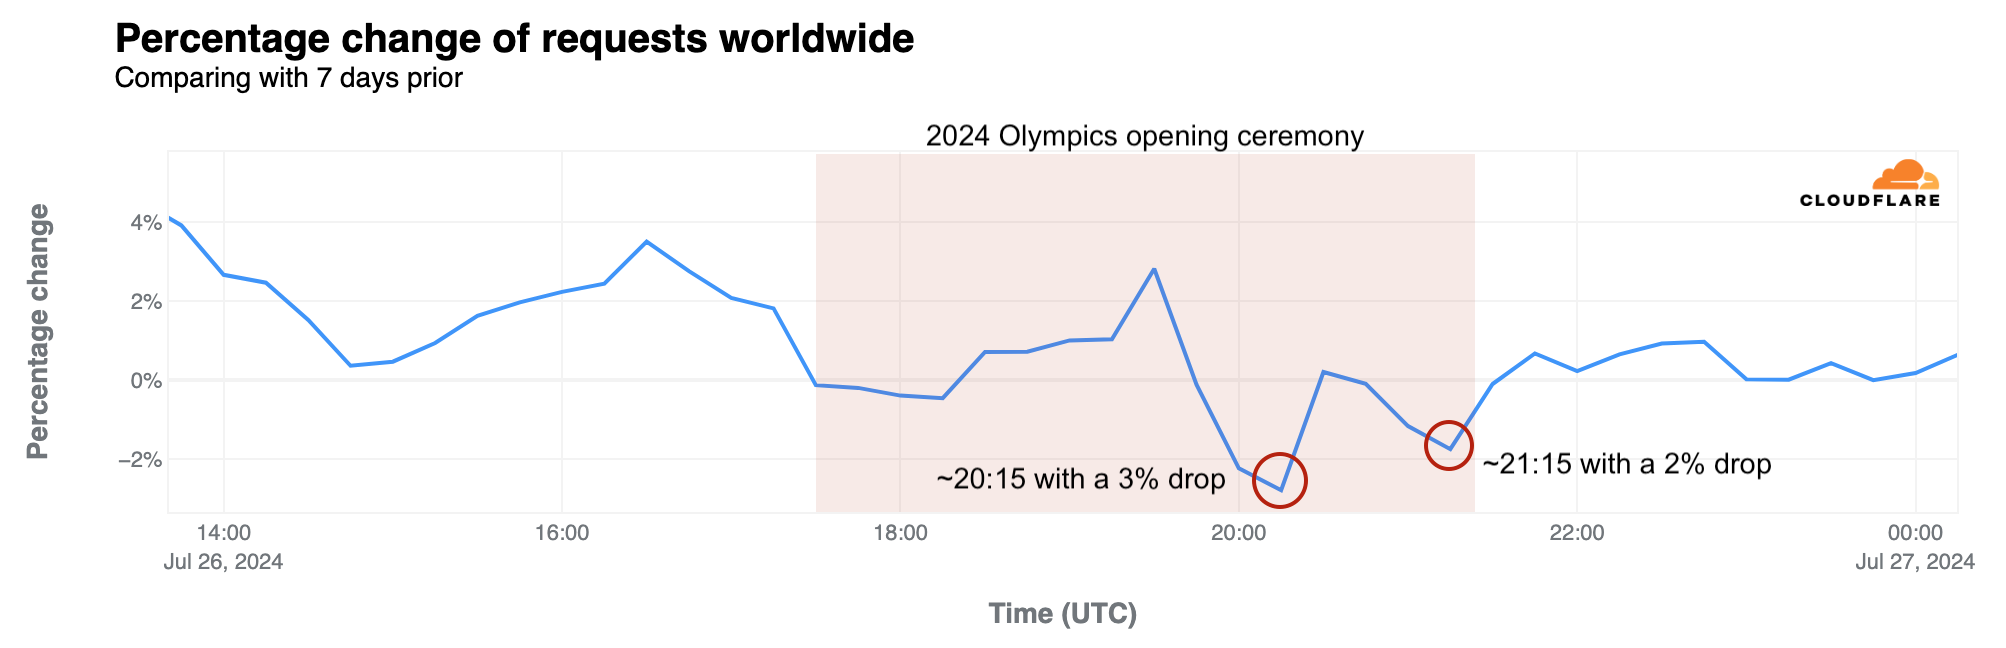
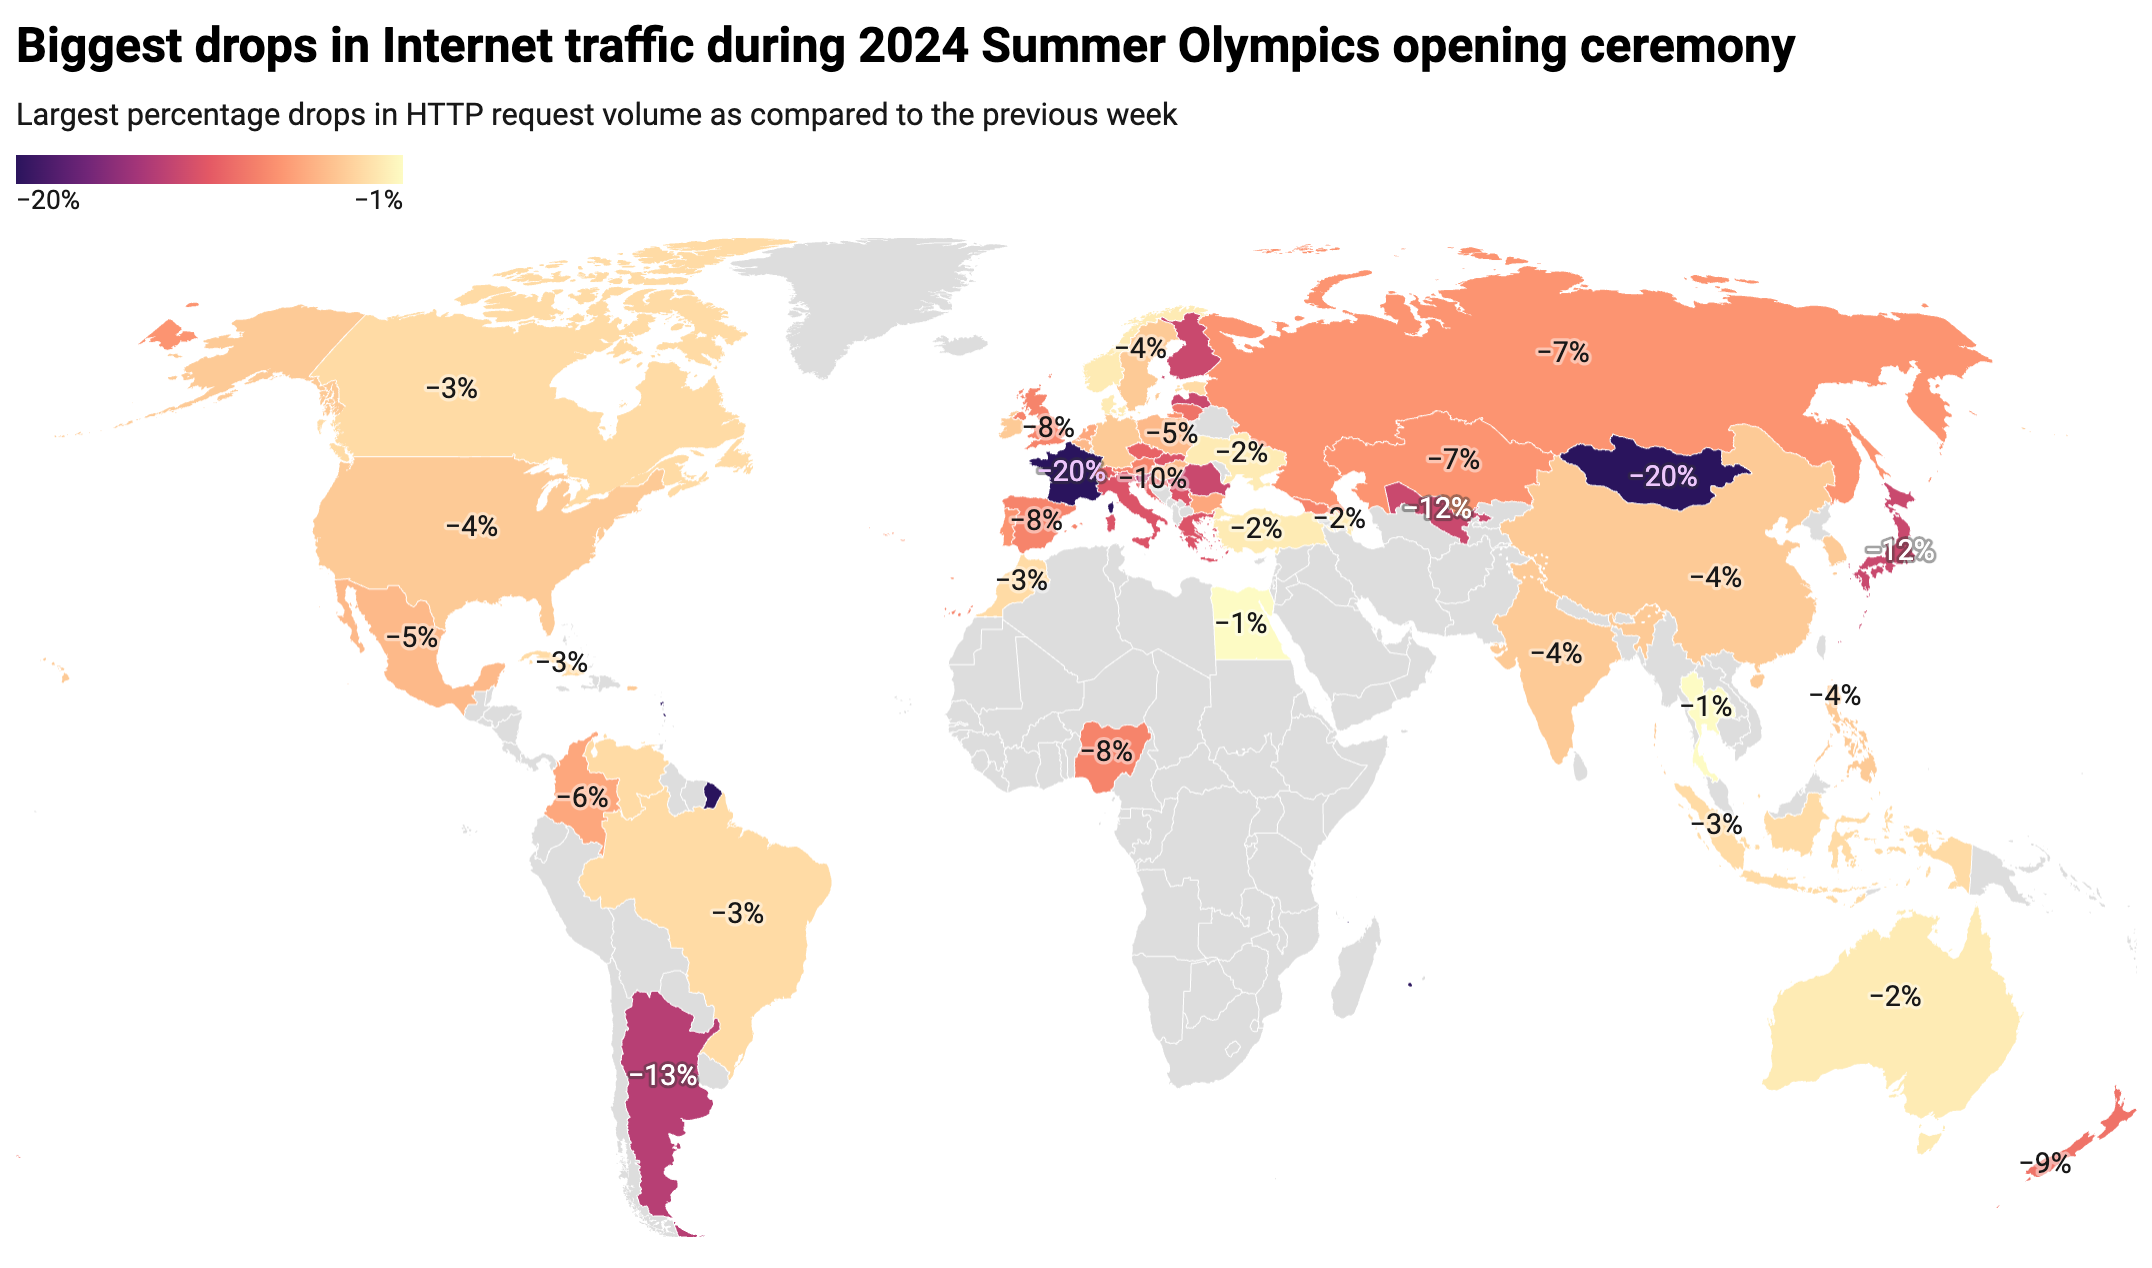
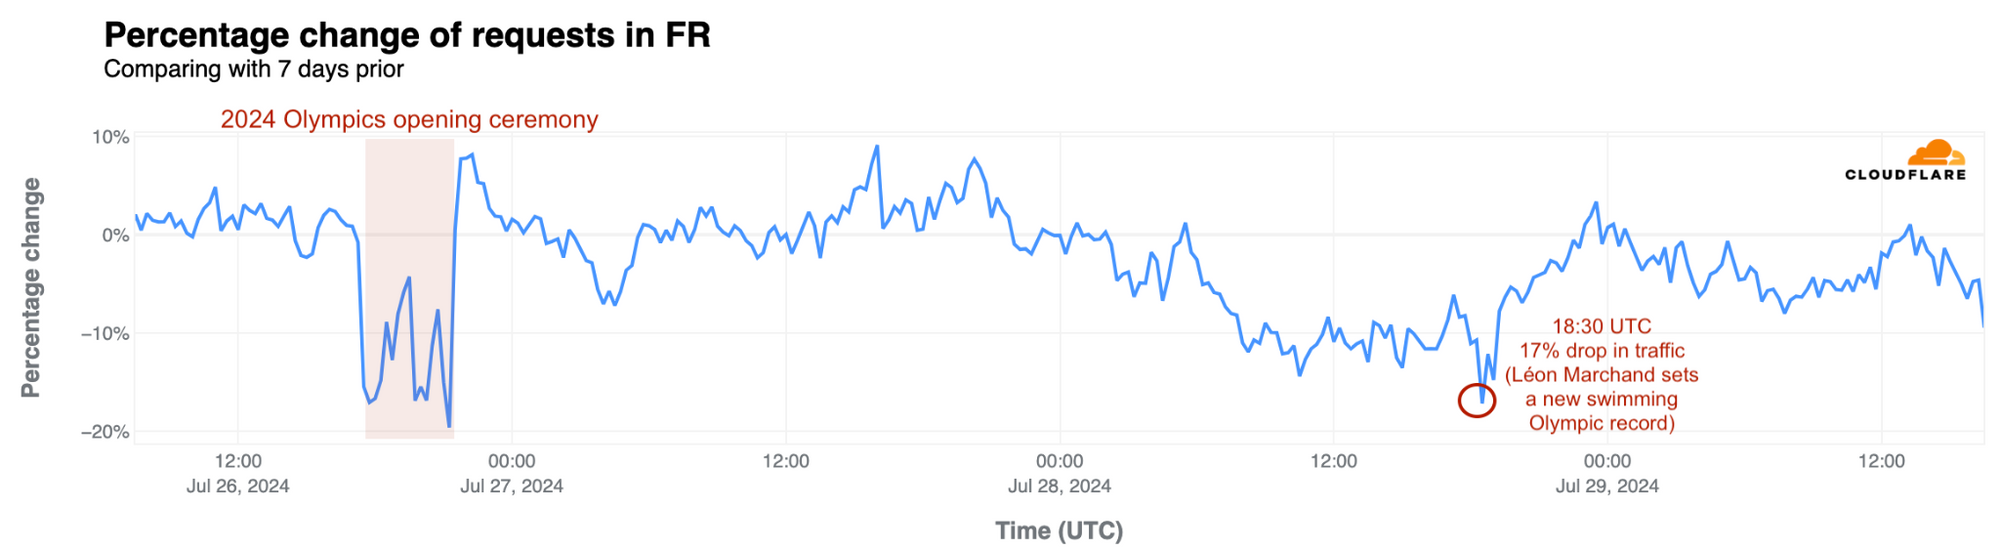
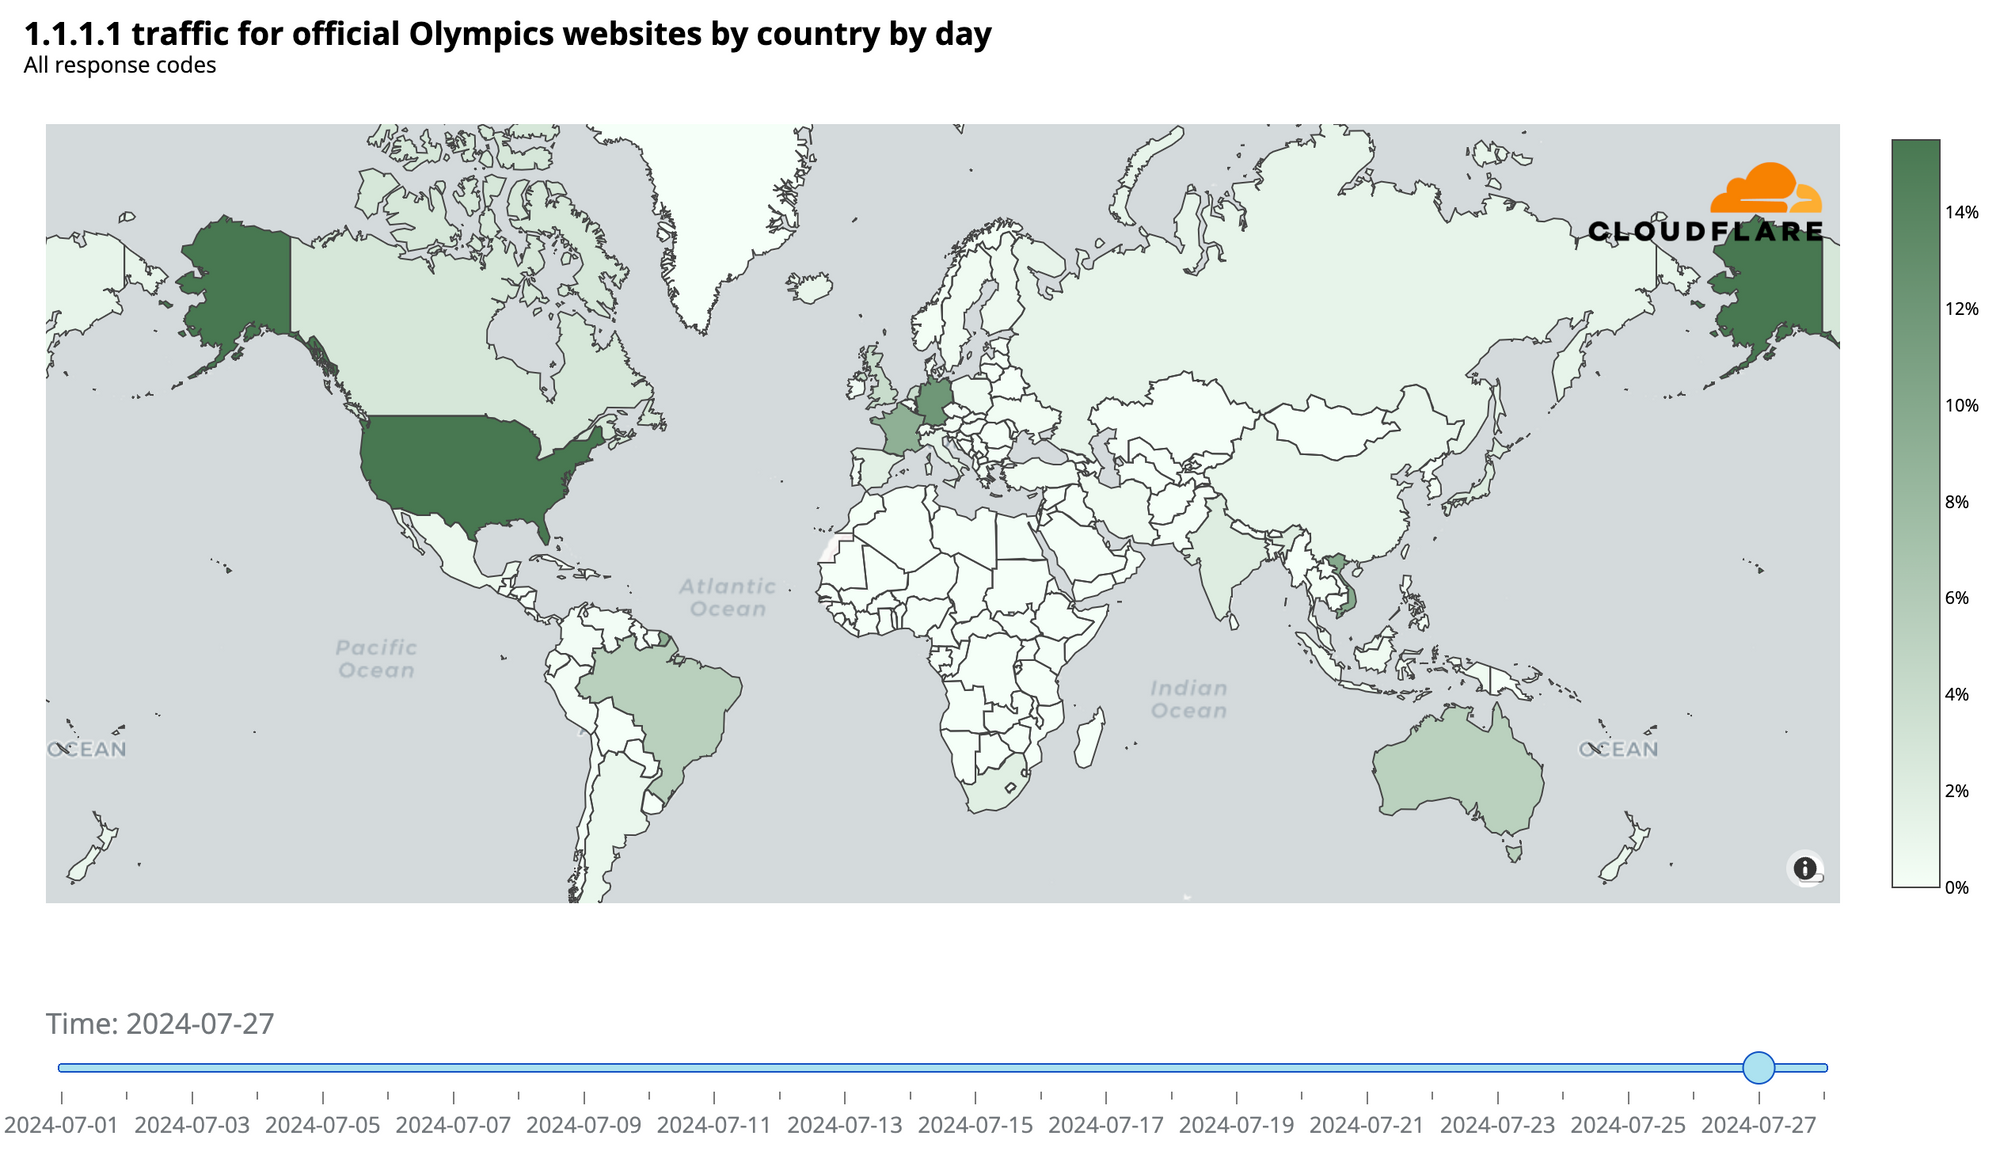
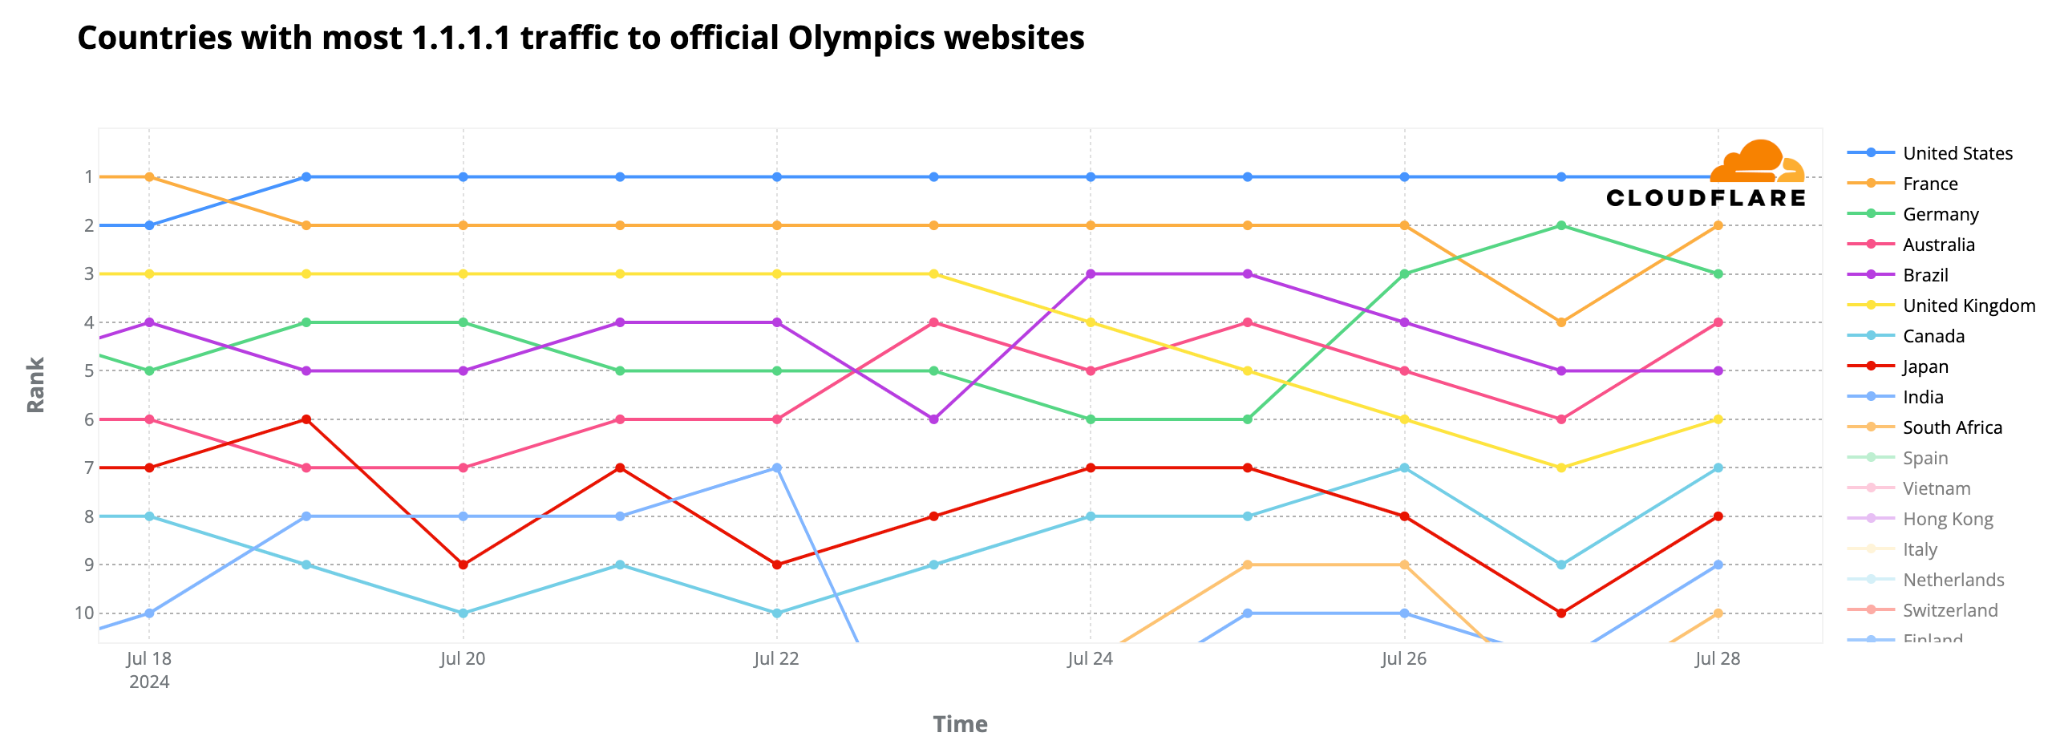
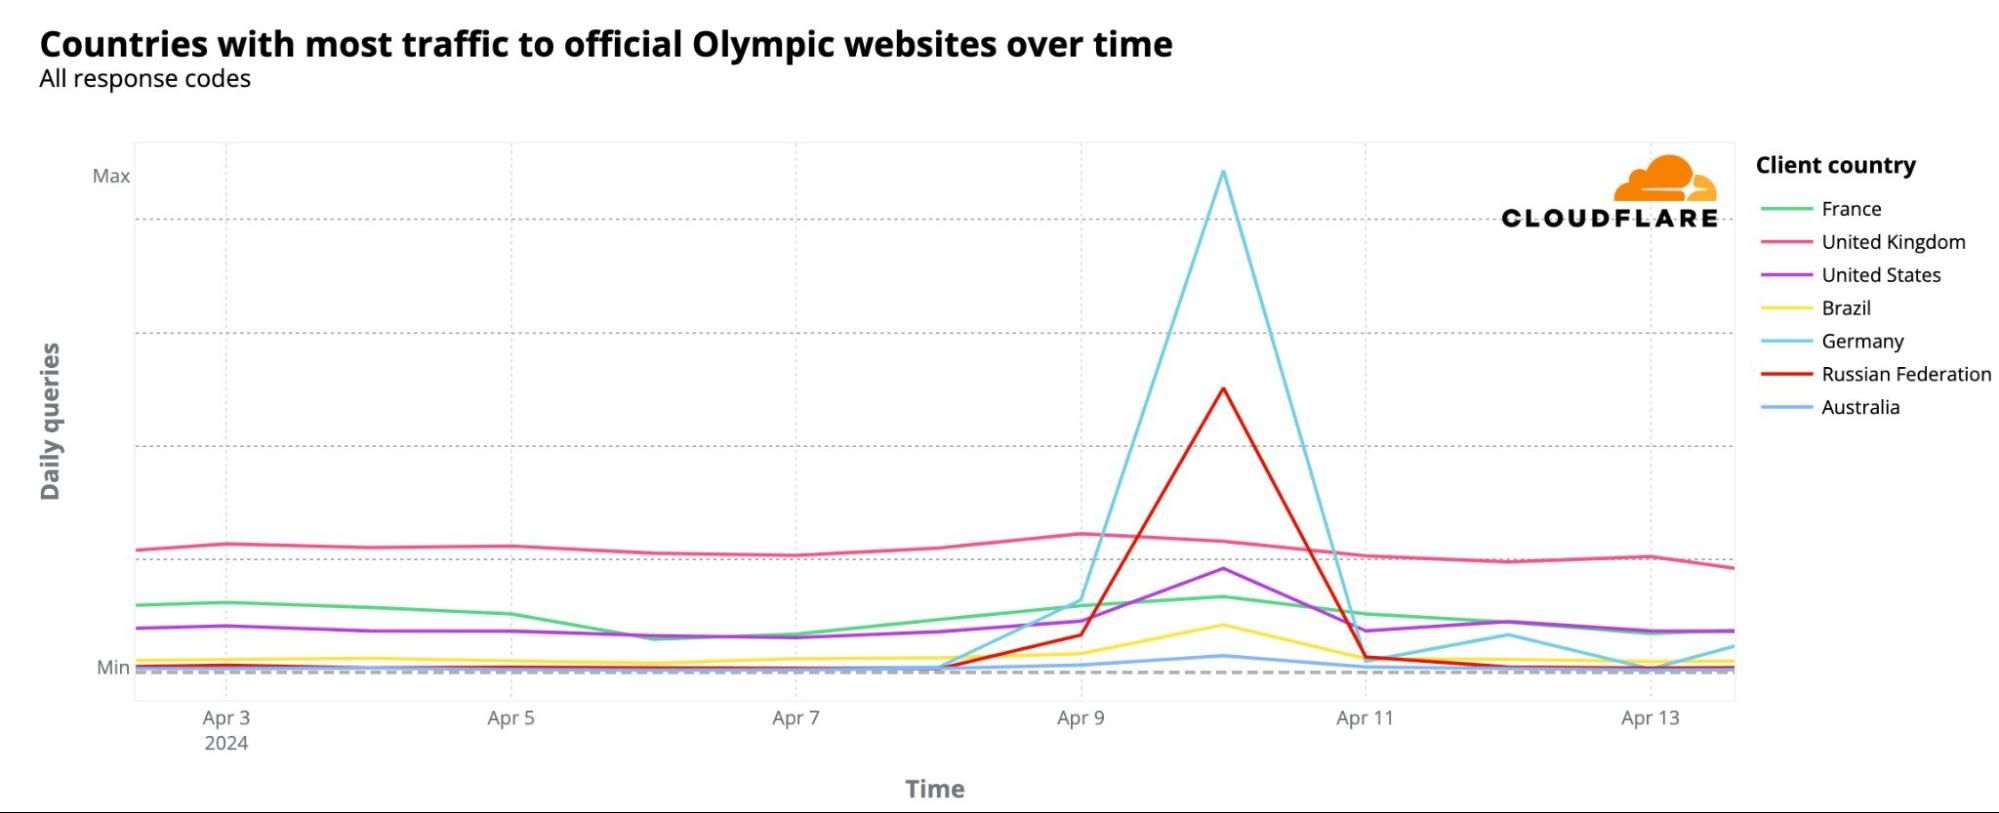
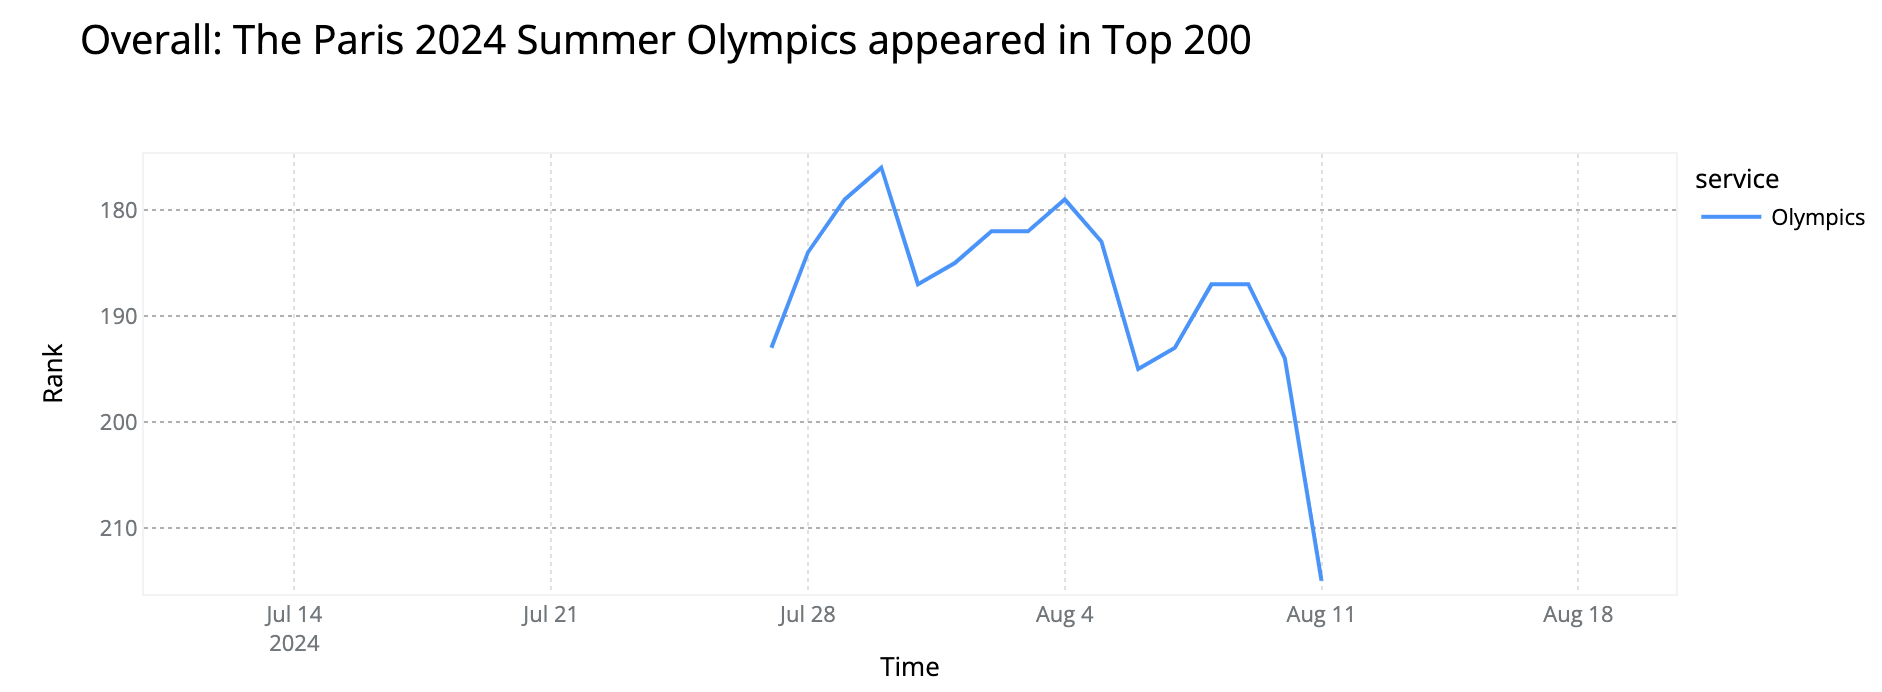
The Paris 2024 Summer Olympics (July 26–August 11, 2024) appeared in our Top 250 Overall ranking, with Olympics-related sites debuting on July 27 (#195), the first full day of events. The peak was on July 30 (#177), driven by Léon Marchand’s swimming performances and the US women’s artistic gymnastics medal, as detailed in our Olympics blog post. The final day in the Top 250 was August 11 (#217).

-
Spotify ranked between #17 and #18 this year, performing best in October, spending most of the month at #17. However, as our list ends on December 1, we are not tracking the impact of the recently launched Spotify Wrapped.
-
Tesla entered the Top 250 after October. Its best day was October 12 (#245), following the Cybercab robotaxi reveal. It also ranked higher on November 17 (#246), after a post-US elections stock rally.
-
GitHub’s best day was November 8 (#31), coinciding with its announcement of enhanced security protocols, including mandatory two-factor authentication (2FA) for organizations.
-
NBA appeared in the Top 250 until early March, with its best day on February 4, during these games.
-
Nike ranked only once, on March 26 (#236), during the annual Air Max Day celebration.
-
Brazil’s official Judiciary site peaked at #105 on October 6, during the first round of municipal elections.
-
Ticketmaster peaked at #169 on October 8, during a major service disruption, followed by October 9 (#170), the day Australian F1 tickets went on sale.
-
Intuit’s best day was April 15 (#121), US Tax Day, consistent with previous years.
-
Weather.com peaked at #61 between August 4–6, during Hurricane Debby’s landfall in Florida.
-
The best day for IMDb (the Internet Movie Database) was January 1 (#220).
-
Example.com, a domain used for documentation purposes, ranked between #24 and #56.
The Internet continues to shape how we socialize, work, and stay informed. Our 2024 rankings highlight the enduring dominance of platforms like Google, Facebook, and TikTok, alongside the rapid rise of generative AI services like OpenAI’s ChatGPT, with new players like GitHub Copilot and Claude making strides.
In social media, X shows declining influence, while Threads, Bluesky, and Mastodon are carving out niches but remain far from overtaking established platforms. Temu continues to rise in e-commerce, while Shein and AliExpress strengthened their global positions. In cryptocurrency, Binance regained momentum as Bitcoin surged, and newer players entered the scene. Gaming saw Roblox maintain its lead, with Steam experiencing notable growth.
Events like the Paris 2024 Summer Olympics, US elections, and war-related attacks also shaped Internet trends, emphasizing how global events influence online activity. These trends mirror real-world developments and set the stage for an interconnected, tech-driven future.
On a final note, creating rankings is a team effort that comes with its own challenges and requires careful attention and frequent updates. We welcome your feedback and suggestions for new categories to explore in the Year in Review.
(Our data scientist, Sabina Zejnilovic, played a crucial role in gathering the Internet services data.)