Tag Archives: system-migration

Migrating Critical Traffic At Scale with No Downtime — Part 2

Post Syndicated from Netflix Technology Blog original https://netflixtechblog.com/migrating-critical-traffic-at-scale-with-no-downtime-part-2-4b1c8c7155c1

Migrating Critical Traffic At Scale with No Downtime — Part 2

Shyam Gala, Javier Fernandez-Ivern, Anup Rokkam Pratap, Devang Shah

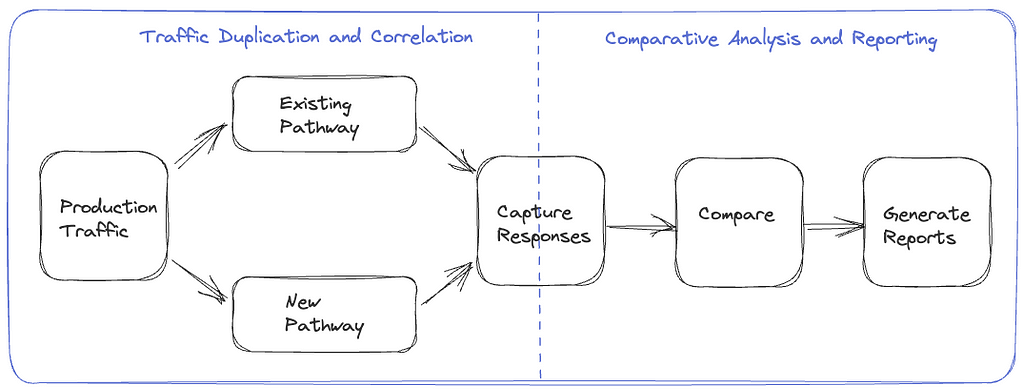
Picture yourself enthralled by the latest episode of your beloved Netflix series, delighting in an uninterrupted, high-definition streaming experience. Behind these perfect moments of entertainment is a complex mechanism, with numerous gears and cogs working in harmony. But what happens when this machinery needs a transformation? This is where large-scale system migrations come into play. Our previous blog post presented replay traffic testing — a crucial instrument in our toolkit that allows us to implement these transformations with precision and reliability.

Replay traffic testing gives us the initial foundation of validation, but as our migration process unfolds, we are met with the need for a carefully controlled migration process. A process that doesn’t just minimize risk, but also facilitates a continuous evaluation of the rollout’s impact. This blog post will delve into the techniques leveraged at Netflix to introduce these changes to production.

Sticky Canaries

Canary deployments are an effective mechanism for validating changes to a production backend service in a controlled and limited manner, thus mitigating the risk of unforeseen consequences that may arise due to the change. This process involves creating two new clusters for the updated service; a baseline cluster containing the current version running in production and a canary cluster containing the new version of the service. A small percentage of production traffic is redirected to the two new clusters, allowing us to monitor the new version’s performance and compare it against the current version. By collecting and analyzing key performance metrics of the service over time, we can assess the impact of the new changes and determine if they meet the availability, latency, and performance requirements.

Some product features require a lifecycle of requests between the customer device and a set of backend services to drive the feature. For instance, video playback functionality on Netflix involves requesting URLs for the streams from a service, calling the CDN to download the bits from the streams, requesting a license to decrypt the streams from a separate service, and sending telemetry indicating the successful start of playback to yet another service. By tracking metrics only at the level of service being updated, we might miss capturing deviations in broader end-to-end system functionality.

Sticky Canary is an improvement to the traditional canary process that addresses this limitation. In this variation, the canary framework creates a pool of unique customer devices and then routes traffic for this pool consistently to the canary and baseline clusters for the duration of the experiment. Apart from measuring service-level metrics, the canary framework is able to keep track of broader system operational and customer metrics across the canary pool and thereby detect regressions on the entire request lifecycle flow.

Sticky Canary

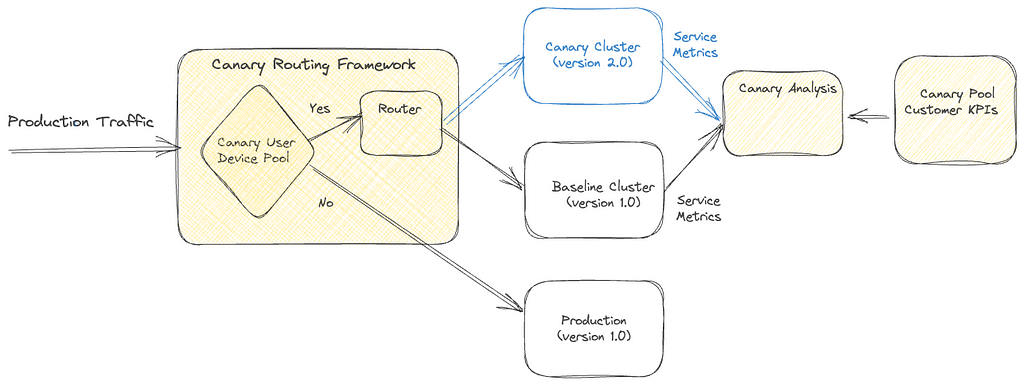
It is important to note that with sticky canaries, devices in the canary pool continue to be routed to the canary throughout the experiment, potentially resulting in undesirable behavior persisting through retries on customer devices. Therefore, the canary framework is designed to monitor operational and customer KPI metrics to detect persistent deviations and terminate the canary experiment if necessary.

Canaries and sticky canaries are valuable tools in the system migration process. Compared to replay testing, canaries allow us to extend the validation scope beyond the service level. They enable verification of the broader end-to-end system functionality across the request lifecycle for that functionality, giving us confidence that the migration will not cause any disruptions to the customer experience. Canaries also provide an opportunity to measure system performance under different load conditions, allowing us to identify and resolve any performance bottlenecks. They enable us to further fine-tune and configure the system, ensuring the new changes are integrated smoothly and seamlessly.

A/B Testing

A/B testing is a widely recognized method for verifying hypotheses through a controlled experiment. It involves dividing a portion of the population into two or more groups, each receiving a different treatment. The results are then evaluated using specific metrics to determine whether the hypothesis is valid. The industry frequently employs the technique to assess hypotheses related to product evolution and user interaction. It is also widely utilized at Netflix to test changes to product behavior and customer experience.

A/B testing is also a valuable tool for assessing significant changes to backend systems. We can determine A/B test membership in either device application or backend code and selectively invoke new code paths and services. Within the context of migrations, A/B testing enables us to limit exposure to the migrated system by enabling the new path for a smaller percentage of the member base. Thereby controlling the risk of unexpected behavior resulting from the new changes. A/B testing is also a key technique in migrations where the updates to the architecture involve changing device contracts as well.

Canary experiments are typically conducted over periods ranging from hours to days. However, in certain instances, migration-related experiments may be required to span weeks or months to obtain a more accurate understanding of the impact on specific Quality of Experience (QoE) metrics. Additionally, in-depth analyses of particular business Key Performance Indicators (KPIs) may require longer experiments. For instance, envision a migration scenario where we enhance the playback quality, anticipating that this improvement will lead to more customers engaging with the play button. Assessing relevant metrics across a considerable sample size is crucial for obtaining a reliable and confident evaluation of the hypothesis. A/B frameworks work as effective tools to accommodate this next step in the confidence-building process.

In addition to supporting extended durations, A/B testing frameworks offer other supplementary capabilities. This approach enables test allocation restrictions based on factors such as geography, device platforms, and device versions, while also allowing for analysis of migration metrics across similar dimensions. This ensures that the changes do not disproportionately impact specific customer segments. A/B testing also provides adaptability, permitting adjustments to allocation size throughout the experiment.

We might not use A/B testing for every backend migration. Instead, we use it for migrations in which changes are expected to impact device QoE or business KPIs significantly. For example, as discussed earlier, if the planned changes are expected to improve client QoE metrics, we would test the hypothesis via A/B testing.

Dialing Traffic

After completing the various stages of validation, such as replay testing, sticky canaries, and A/B tests, we can confidently assert that the planned changes will not significantly impact SLAs (service-level-agreement), device level QoE, or business KPIs. However, it is imperative that the final rollout is regulated to ensure that any unnoticed and unexpected problems do not disrupt the customer experience. To this end, we have implemented traffic dialing as the last step in mitigating the risk associated with enabling the changes in production.

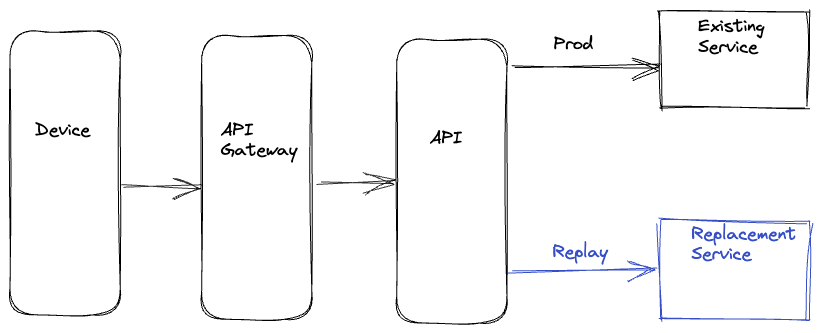
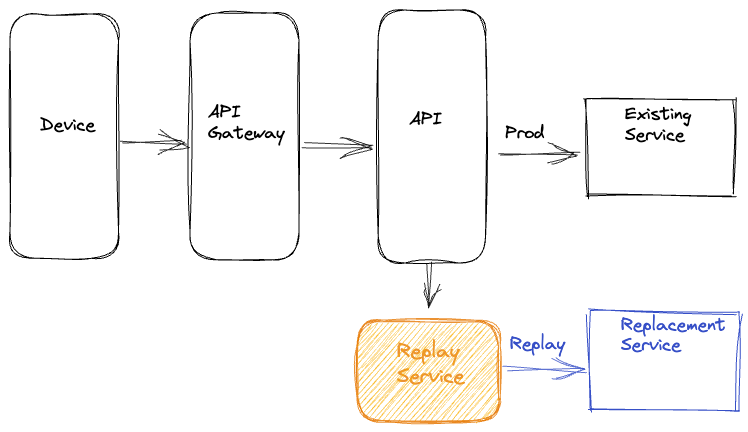
A dial is a software construct that enables the controlled flow of traffic within a system. This construct samples inbound requests using a distribution function and determines whether they should be routed to the new path or kept on the existing path. The decision-making process involves assessing whether the distribution function’s output aligns within the range of the predefined target percentage. The sampling is done consistently using a fixed parameter associated with the request. The target percentage is controlled via a globally scoped dynamic property that can be updated in real-time. By increasing or decreasing the target percentage, traffic flow to the new path can be regulated instantaneously.

Dial

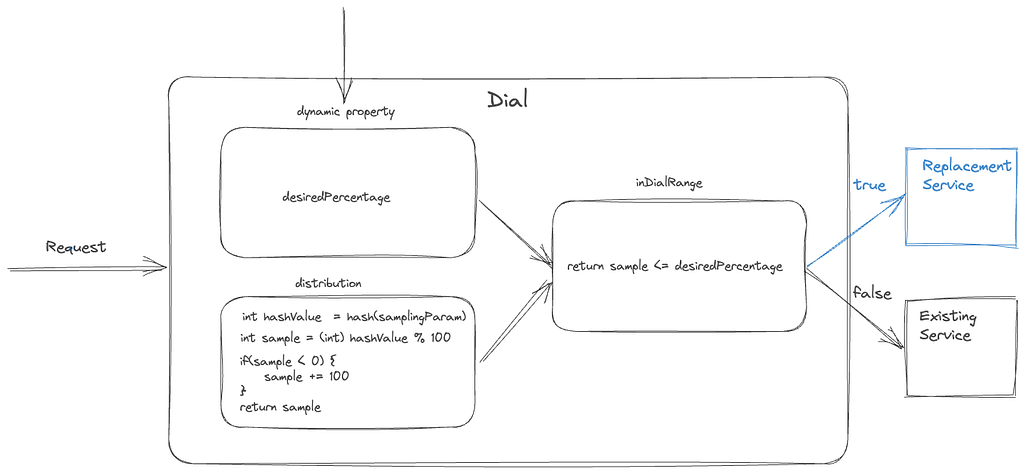
The selection of the actual sampling parameter depends on the specific migration requirements. A dial can be used to randomly sample all requests, which is achieved by selecting a variable parameter like a timestamp or a random number. Alternatively, in scenarios where the system path must remain constant with respect to customer devices, a constant device attribute such as deviceId is selected as the sampling parameter. Dials can be applied in several places, such as device application code, the relevant server component, or even at the API gateway for edge API systems, making them a versatile tool for managing migrations in complex systems.

Traffic is dialed over to the new system in measured discrete steps. At every step, relevant stakeholders are informed, and key metrics are monitored, including service, device, operational, and business metrics. If we discover an unexpected issue or notice metrics trending in an undesired direction during the migration, the dial gives us the capability to quickly roll back the traffic to the old path and address the issue.

The dialing steps can also be scoped at the data center level if traffic is served from multiple data centers. We can start by dialing traffic in a single data center to allow for an easier side-by-side comparison of key metrics across data centers, thereby making it easier to observe any deviations in the metrics. The duration of how long we run the actual discrete dialing steps can also be adjusted. Running the dialing steps for longer periods increases the probability of surfacing issues that may only affect a small group of members or devices and might have been too low to capture and perform shadow traffic analysis. We can complete the final step of migrating all the production traffic to the new system using the combination of gradual step-wise dialing and monitoring.

Migrating Persistent Stores

Stateful APIs pose unique challenges that require different strategies. While the replay testing technique discussed in the previous part of this blog series can be employed, additional measures outlined earlier are necessary.

This alternate migration strategy has proven effective for our systems that meet certain criteria. Specifically, our data model is simple, self-contained, and immutable, with no relational aspects. Our system doesn’t require strict consistency guarantees and does not use database transactions. We adopt an ETL-based dual-write strategy that roughly follows this sequence of steps:

  • Initial Load through an ETL process: Data is extracted from the source data store, transformed into the new model, and written to the newer data store through an offline job. We use custom queries to verify the completeness of the migrated records.
  • Continuous migration via Dual-writes: We utilize an active-active/dual-writes strategy to migrate the bulk of the data. As a safety mechanism, we use dials (discussed previously) to control the proportion of writes that go to the new data store. To maintain state parity across both stores, we write all state-altering requests of an entity to both stores. This is achieved by selecting a sampling parameter that makes the dial sticky to the entity’s lifecycle. We incrementally turn the dial up as we gain confidence in the system while carefully monitoring its overall health. The dial also acts as a switch to turn off all writes to the new data store if necessary.
  • Continuous verification of records: When a record is read, the service reads from both data stores and verifies the functional correctness of the new record if found in both stores. One can perform this comparison live on the request path or offline based on the latency requirements of the particular use case. In the case of a live comparison, we can return records from the new datastore when the records match. This process gives us an idea of the functional correctness of the migration.
  • Evaluation of migration completeness: To verify the completeness of the records, cold storage services are used to take periodic data dumps from the two data stores and compared for completeness. Gaps in the data are filled back with an ETL process.
  • Cut-over and clean-up: Once the data is verified for correctness and completeness, dual writes and reads are disabled, any client code is cleaned up, and read/writes only occur to the new data store.
Migrating Stateful Systems

Clean-up

Clean-up of any migration-related code and configuration after the migration is crucial to ensure the system runs smoothly and efficiently and we don’t build up tech debt and complexity. Once the migration is complete and validated, all migration-related code, such as traffic dials, A/B tests, and replay traffic integrations, can be safely removed from the system. This includes cleaning up configuration changes, reverting to the original settings, and disabling any temporary components added during the migration. In addition, it is important to document the entire migration process and keep records of any issues encountered and their resolution. By performing a thorough clean-up and documentation process, future migrations can be executed more efficiently and effectively, building on the lessons learned from the previous migrations.

Parting Thoughts

We have utilized a range of techniques outlined in our blog posts to conduct numerous large, medium, and small-scale migrations on the Netflix platform. Our efforts have been largely successful, with minimal to no downtime or significant issues encountered. Throughout the process, we have gained valuable insights and refined our techniques. It should be noted that not all of the techniques presented are universally applicable, as each migration presents its own unique set of circumstances. Determining the appropriate level of validation, testing, and risk mitigation requires careful consideration of several factors, including the nature of the changes, potential impacts on customer experience, engineering effort, and product priorities. Ultimately, we aim to achieve seamless migrations without disruptions or downtime.

In a series of forthcoming blog posts, we will explore a selection of specific use cases where the techniques highlighted in this blog series were utilized effectively. They will focus on a comprehensive analysis of the Ads Tier Launch and an extensive GraphQL migration for various product APIs. These posts will offer readers invaluable insights into the practical application of these methodologies in real-world situations.


Migrating Critical Traffic At Scale with No Downtime — Part 2 was originally published in Netflix TechBlog on Medium, where people are continuing the conversation by highlighting and responding to this story.

Migrating Critical Traffic At Scale with No Downtime — Part 1

Post Syndicated from Netflix Technology Blog original https://netflixtechblog.com/migrating-critical-traffic-at-scale-with-no-downtime-part-1-ba1c7a1c7835

Migrating Critical Traffic At Scale with No Downtime — Part 1

Shyam Gala, Javier Fernandez-Ivern, Anup Rokkam Pratap, Devang Shah

Hundreds of millions of customers tune into Netflix every day, expecting an uninterrupted and immersive streaming experience. Behind the scenes, a myriad of systems and services are involved in orchestrating the product experience. These backend systems are consistently being evolved and optimized to meet and exceed customer and product expectations.

When undertaking system migrations, one of the main challenges is establishing confidence and seamlessly transitioning the traffic to the upgraded architecture without adversely impacting the customer experience. This blog series will examine the tools, techniques, and strategies we have utilized to achieve this goal.

The backend for the streaming product utilizes a highly distributed microservices architecture; hence these migrations also happen at different points of the service call graph. It can happen on an edge API system servicing customer devices, between the edge and mid-tier services, or from mid-tiers to data stores. Another relevant factor is that the migration could be happening on APIs that are stateless and idempotent, or it could be happening on stateful APIs.

We have categorized the tools and techniques we have used to facilitate these migrations in two high-level phases. The first phase involves validating functional correctness, scalability, and performance concerns and ensuring the new systems’ resilience before the migration. The second phase involves migrating the traffic over to the new systems in a manner that mitigates the risk of incidents while continually monitoring and confirming that we are meeting crucial metrics tracked at multiple levels. These include Quality-of-Experience(QoE) measurements at the customer device level, Service-Level-Agreements (SLAs), and business-level Key-Performance-Indicators(KPIs).

This blog post will provide a detailed analysis of replay traffic testing, a versatile technique we have applied in the preliminary validation phase for multiple migration initiatives. In a follow-up blog post, we will focus on the second phase and look deeper at some of the tactical steps that we use to migrate the traffic over in a controlled manner.

Replay Traffic Testing

Replay traffic refers to production traffic that is cloned and forked over to a different path in the service call graph, allowing us to exercise new/updated systems in a manner that simulates actual production conditions. In this testing strategy, we execute a copy (replay) of production traffic against a system’s existing and new versions to perform relevant validations. This approach has a handful of benefits.

  • Replay traffic testing enables sandboxed testing at scale without significantly impacting production traffic or user experience.
  • Utilizing cloned real traffic, we can exercise the diversity of inputs from a wide range of devices and device application software versions in production. This is particularly important for complex APIs that have many high cardinality inputs. Replay traffic provides the reach and coverage required to test the ability of the system to handle infrequently used input combinations and edge cases.
  • This technique facilitates validation on multiple fronts. It allows us to assert functional correctness and provides a mechanism to load test the system and tune the system and scaling parameters for optimal functioning.
  • By simulating a real production environment, we can characterize system performance over an extended period while considering the expected and unexpected traffic pattern shifts. It provides a good read on the availability and latency ranges under different production conditions.
  • Provides a platform to ensure that essential operational insights, metrics, logging, and alerting are in place before migration.

Replay Solution

The replay traffic testing solution comprises two essential components.

  1. Traffic Duplication and Correlation: The initial step requires the implementation of a mechanism to clone and fork production traffic to the newly established pathway, along with a process to record and correlate responses from the original and alternative routes.
  2. Comparative Analysis and Reporting: Following traffic duplication and correlation, we need a framework to compare and analyze the responses recorded from the two paths and get a comprehensive report for the analysis.
Replay Testing Framework

We have tried different approaches for the traffic duplication and recording step through various migrations, making improvements along the way. These include options where replay traffic generation is orchestrated on the device, on the server, and via a dedicated service. We will examine these alternatives in the upcoming sections.

Device Driven

In this option, the device makes a request on the production path and the replay path, then discards the response on the replay path. These requests are executed in parallel to minimize any potential delay on the production path. The selection of the replay path on the backend can be driven by the URL the device uses when making the request or by utilizing specific request parameters in routing logic at the appropriate layer of the service call graph. The device also includes a unique identifier with identical values on both paths, which is used to correlate the production and replay responses. The responses can be recorded at the most optimal location in the service call graph or by the device itself, depending on the particular migration.

Device Driven Replay

The device-driven approach’s obvious downside is that we are wasting device resources. There is also a risk of impact on device QoE, especially on low-resource devices. Adding forking logic and complexity to the device code can create dependencies on device application release cycles that generally run at a slower cadence than service release cycles, leading to bottlenecks in the migration. Moreover, allowing the device to execute untested server-side code paths can inadvertently expose an attack surface area for potential misuse.

Server Driven

To address the concerns of the device-driven approach, the other option we have used is to handle the replay concerns entirely on the backend. The replay traffic is cloned and forked in the appropriate service upstream of the migrated service. The upstream service calls the existing and new replacement services concurrently to minimize any latency increase on the production path. The upstream service records the responses on the two paths along with an identifier with a common value that is used to correlate the responses. This recording operation is also done asynchronously to minimize any impact on the latency on the production path.

Server Driven Replay

The server-driven approach’s benefit is that the entire complexity of replay logic is encapsulated on the backend, and there is no wastage of device resources. Also, since this logic resides on the server side, we can iterate on any required changes faster. However, we are still inserting the replay-related logic alongside the production code that is handling business logic, which can result in unnecessary coupling and complexity. There is also an increased risk that bugs in the replay logic have the potential to impact production code and metrics.

Dedicated Service

The latest approach that we have used is to completely isolate all components of replay traffic into a separate dedicated service. In this approach, we record the requests and responses for the service that needs to be updated or replaced to an offline event stream asynchronously. Quite often, this logging of requests and responses is already happening for operational insights. Subsequently, we use Mantis, a distributed stream processor, to capture these requests and responses and replay the requests against the new service or cluster while making any required adjustments to the requests. After replaying the requests, this dedicated service also records the responses from the production and replay paths for offline analysis.

Dedicated Replay Service

This approach centralizes the replay logic in an isolated, dedicated code base. Apart from not consuming device resources and not impacting device QoE, this approach also reduces any coupling between production business logic and replay traffic logic on the backend. It also decouples any updates on the replay framework away from the device and service release cycles.

Analyzing Replay Traffic

Once we have run replay traffic and recorded a statistically significant volume of responses, we are ready for the comparative analysis and reporting component of replay traffic testing. Given the scale of the data being generated using replay traffic, we record the responses from the two sides to a cost-effective cold storage facility using technology like Apache Iceberg. We can then create offline distributed batch processing jobs to correlate & compare the responses across the production and replay paths and generate detailed reports on the analysis.

Normalization

Depending on the nature of the system being migrated, the responses might need some preprocessing before being compared. For example, if some fields in the responses are timestamps, those will differ. Similarly, if there are unsorted lists in the responses, it might be best to sort them before comparing. In certain migration scenarios, there may be intentional alterations to the response generated by the updated service or component. For instance, a field that was a list in the original path is represented as key-value pairs in the new path. In such cases, we can apply specific transformations to the response on the replay path to simulate the expected changes. Based on the system and the associated responses, there might be other specific normalizations that we might apply to the response before we compare the responses.

Comparison

After normalizing, we diff the responses on the two sides and check whether we have matching or mismatching responses. The batch job creates a high-level summary that captures some key comparison metrics. These include the total number of responses on both sides, the count of responses joined by the correlation identifier, matches and mismatches. The summary also records the number of passing/ failing responses on each path. This summary provides an excellent high-level view of the analysis and the overall match rate across the production and replay paths. Additionally, for mismatches, we record the normalized and unnormalized responses from both sides to another big data table along with other relevant parameters, such as the diff. We use this additional logging to debug and identify the root cause of issues driving the mismatches. Once we discover and address those issues, we can use the replay testing process iteratively to bring down the mismatch percentage to an acceptable number.

Lineage

When comparing responses, a common source of noise arises from the utilization of non-deterministic or non-idempotent dependency data for generating responses on the production and replay pathways. For instance, envision a response payload that delivers media streams for a playback session. The service responsible for generating this payload consults a metadata service that provides all available streams for the given title. Various factors can lead to the addition or removal of streams, such as identifying issues with a specific stream, incorporating support for a new language, or introducing a new encode. Consequently, there is a potential for discrepancies in the sets of streams used to determine payloads on the production and replay paths, resulting in divergent responses.

A comprehensive summary of data versions or checksums for all dependencies involved in generating a response, referred to as a lineage, is compiled to address this challenge. Discrepancies can be identified and discarded by comparing the lineage of both production and replay responses in the automated jobs analyzing the responses. This approach mitigates the impact of noise and ensures accurate and reliable comparisons between production and replay responses.

Comparing Live Traffic

An alternative method to recording responses and performing the comparison offline is to perform a live comparison. In this approach, we do the forking of the replay traffic on the upstream service as described in the `Server Driven` section. The service that forks and clones the replay traffic directly compares the responses on the production and replay path and records relevant metrics. This option is feasible if the response payload isn’t very complex, such that the comparison doesn’t significantly increase latencies or if the services being migrated are not on the critical path. Logging is selective to cases where the old and new responses do not match.

Replay Traffic Analysis

Load Testing

Besides functional testing, replay traffic allows us to stress test the updated system components. We can regulate the load on the replay path by controlling the amount of traffic being replayed and the new service’s horizontal and vertical scale factors. This approach allows us to evaluate the performance of the new services under different traffic conditions. We can see how the availability, latency, and other system performance metrics, such as CPU consumption, memory consumption, garbage collection rate, etc, change as the load factor changes. Load testing the system using this technique allows us to identify performance hotspots using actual production traffic profiles. It helps expose memory leaks, deadlocks, caching issues, and other system issues. It enables the tuning of thread pools, connection pools, connection timeouts, and other configuration parameters. Further, it helps in the determination of reasonable scaling policies and estimates for the associated cost and the broader cost/risk tradeoff.

Stateful Systems

We have extensively utilized replay testing to build confidence in migrations involving stateless and idempotent systems. Replay testing can also validate migrations involving stateful systems, although additional measures must be taken. The production and replay paths must have distinct and isolated data stores that are in identical states before enabling the replay of traffic. Additionally, all different request types that drive the state machine must be replayed. In the recording step, apart from the responses, we also want to capture the state associated with that specific response. Correspondingly in the analysis phase, we want to compare both the response and the related state in the state machine. Given the overall complexity of using replay testing with stateful systems, we have employed other techniques in such scenarios. We will look at one of them in the follow-up blog post in this series.

Summary

We have adopted replay traffic testing at Netflix for numerous migration projects. A recent example involved leveraging replay testing to validate an extensive re-architecture of the edge APIs that drive the playback component of our product. Another instance included migrating a mid-tier service from REST to gRPC. In both cases, replay testing facilitated comprehensive functional testing, load testing, and system tuning at scale using real production traffic. This approach enabled us to identify elusive issues and rapidly build confidence in these substantial redesigns.

Upon concluding replay testing, we are ready to start introducing these changes in production. In an upcoming blog post, we will look at some of the techniques we use to roll out significant changes to the system to production in a gradual risk-controlled way while building confidence via metrics at different levels.


Migrating Critical Traffic At Scale with No Downtime — Part 1 was originally published in Netflix TechBlog on Medium, where people are continuing the conversation by highlighting and responding to this story.