Tag Archives: Netflix

AV1 — Now Powering 30% of Netflix Streaming

Post Syndicated from Netflix Technology Blog original https://netflixtechblog.com/av1-now-powering-30-of-netflix-streaming-02f592242d80

AV1 — Now Powering 30% of Netflix Streaming

Liwei Guo, Zhi Li, Sheldon Radford, Jeff Watts

Streaming video has become an integral part of our daily lives. At Netflix, our top priority is delivering the best possible entertainment experience to our members, regardless of their devices or network conditions. One of the key technologies enabling this is AV1, a modern, open video codec that is rapidly transforming both how we stream content and how users experience it. Today, AV1 powers approximately 30% of all Netflix viewing, marking a major milestone in our efforts to bring more efficient and higher-quality streaming to our members.

In this post, we’ll revisit Netflix’s AV1 journey to date, highlight emerging use cases, and share adoption trends across the device ecosystem. Having witnessed AV1’s significant impact,and with AV2 on the horizon, we’re more excited than ever about how open codecs will continue to revolutionize streaming for everyone.

AV1: A Modern, Open Codec

Since entering the streaming business in 2007, Netflix has primarily relied on H.264/AVC as its streaming format. However, we quickly recognized that a modern, open codec would benefit not only Netflix, but the entire multimedia industry. In 2015, together with a group of like-minded industry leaders, Netflix co-founded the Alliance for Open Media (AOMedia) to develop and promote next generation, open source media technologies. The AV1 codec became the first major project of this collaboration, with ambitious goals: to deliver significant improvements in compression efficiency over state-of-the-art codecs, and to introduce rich features that enable new use cases. After three years of collaborative development, AV1 was officially released in 2018.

Netflix’s AV1 Journey: From Android to TVs and Beyond

Piloting on Android Mobile

When we first set out to bring AV1 streaming to Netflix members, Android was the ideal starting point. Android’s flexibility allowed us to quickly integrate a software AV1 decoder using the efficient dav1d library, which was already optimized for ARM chipsets in mobile devices.

AV1’s superior compression efficiency was especially valuable for mobile users, many of whom are mindful of their data usage and network conditions. By adopting AV1, we were able to deliver noticeably better video quality at lower bitrates. For members relying on cellular data, this meant crisper images with fewer compression artifacts, even when bandwidth was limited. Launching AV1 support on Android in 2020 marked a significant step forward for Netflix on mobile, making high-quality streaming more accessible and enjoyable for members everywhere.

Front-and-Center for Netflix VOD Streaming

The success of our AV1 launch on Android proved its value for Netflix streaming, motivating us to expand support to smart TVs and other large-screen devices, where most of our members watch their favorite shows.

Smart TVs depend on hardware decoders for efficient high-quality playback. We worked closely with device manufacturers and SoC vendors to certify these devices, ensuring they are both conformant and performant. This collaborative effort enabled our AV1 streaming to TV devices in late 2021. Shortly thereafter, we expanded AV1 streaming to web browsers (in 2022) and continued to broaden device support. In 2023, this included Apple devices with the introduction of AV1 hardware support in the new M3 and A17 Pro chips.

As more devices began shipping with AV1 hardware support, a rapidly growing share of our members could enjoy the benefits of this advanced codec. Combined with our investment in adding AV1 streams across the entire catalog, AV1 viewing share has been consistently increasing in recent years. Today, AV1 accounts for approximately 30% of all Netflix streaming, making it our second most-used codec — and it’s on track to become number one very soon. The payoff has been substantial.

  • Elevating Streaming Experience Across the Board: Large-screen TVs and other devices demand higher bitrates to deliver stunning 4K, high frame rate (HFR) experiences. AV1’s superior compression efficiency has allowed us to provide these experiences using less data, making high-quality streaming more accessible and reliable. On average, AV1 streaming sessions achieve VMAF scores¹ that are 4.3 points higher than AVC and 0.9 points higher than HEVC sessions. At the same time, AV1 sessions use one-third less bandwidth than both AVC and HEVC, resulting in 45% fewer buffering interruptions. Moreover, Netflix’s diverse content catalog benefits universally from AV1, with improvements across all content types.
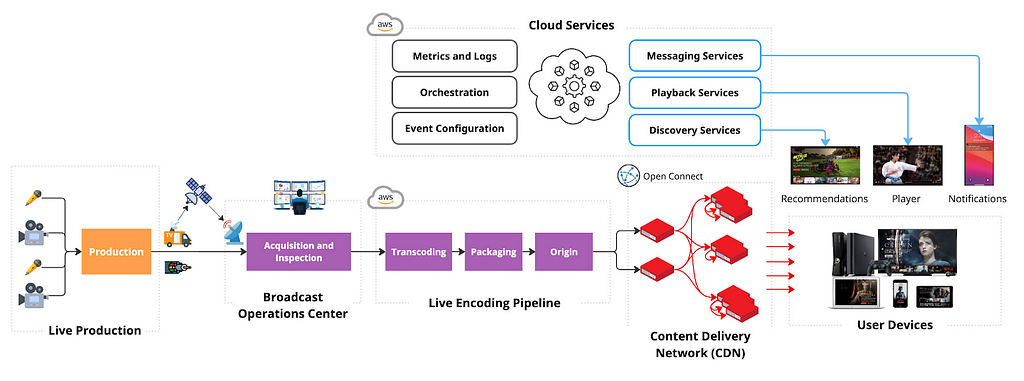
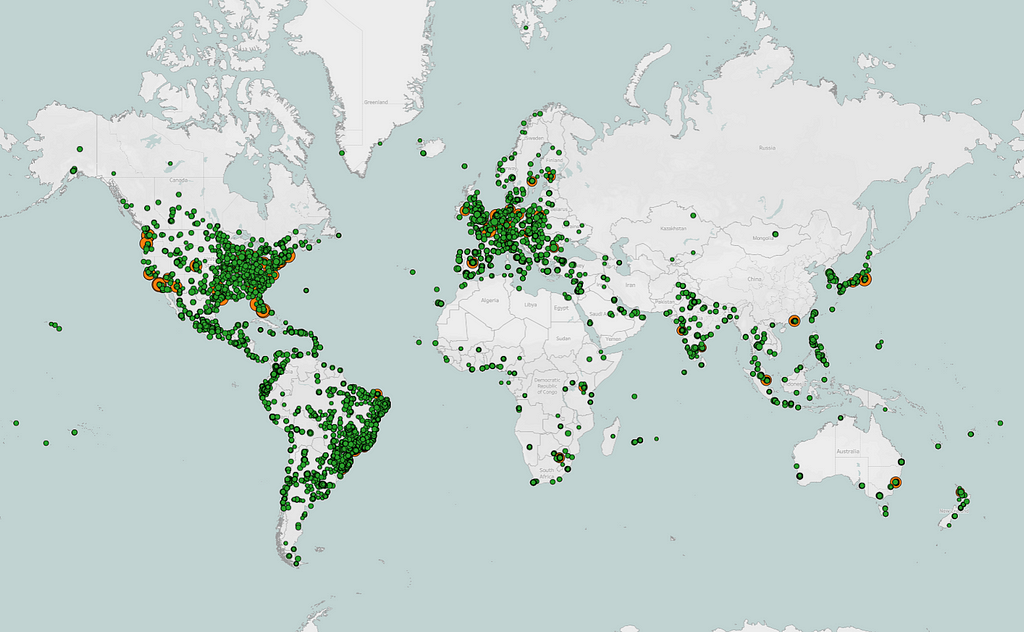
  • Driving Network Efficiency Worldwide: Netflix streams are delivered through our own content delivery network (Open Connect), in partnership with local ISPs around the globe. With more than 300 million members, Netflix streaming constitutes a non-trivial portion of global internet traffic. Because AV1 is a more efficient codec, its streams are smaller in size (while providing even better visual quality). By shifting a substantial share of our streaming to AV1, we reduce overall internet bandwidth consumption, and lessen system and network load for both Netflix and our partners.

Unlocking Advanced Experiences

In addition to its superior compression efficiency, AV1 was designed to support a rich set of features. Once we established a robust framework for the continuous expansion of AV1 streaming, we quickly shifted our focus towards exploring AV1’s unique features to unlock even more advanced and immersive experiences for our members.

High-Dynamic-Range(HDR)
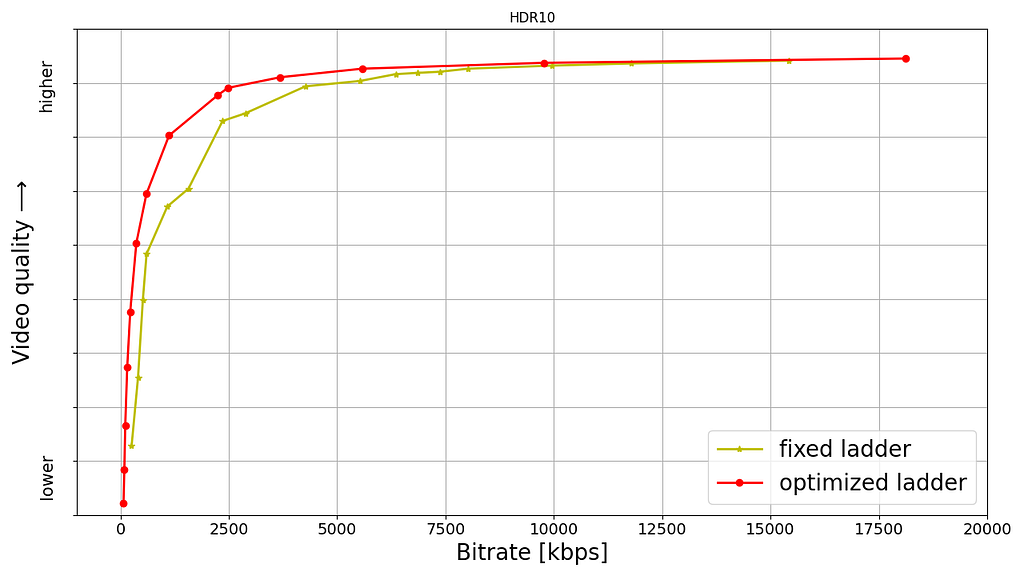
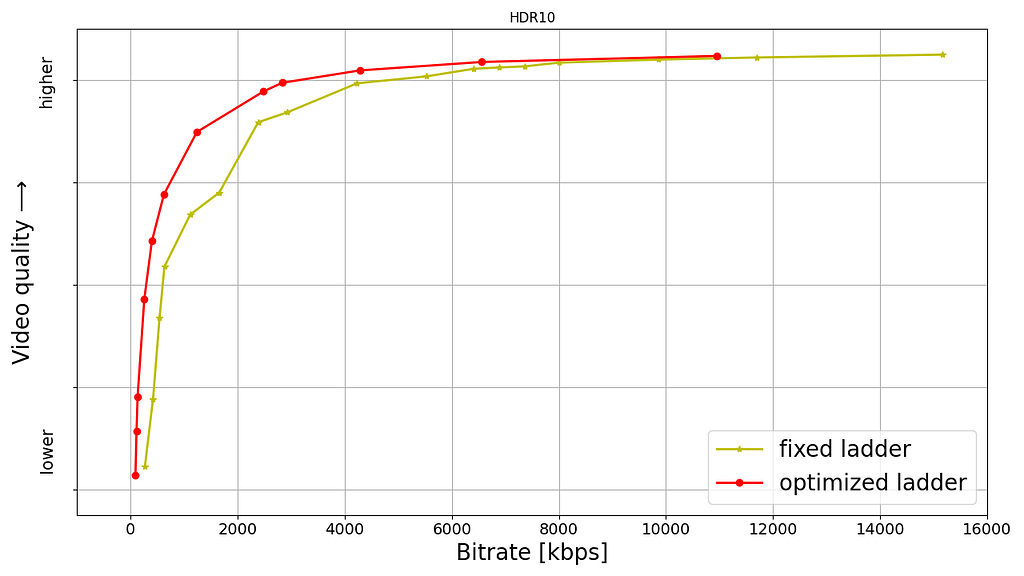
HDR brings enhanced detail, vivid colors, and greater clarity to images. As a premium streaming service, Netflix has been a pioneer in adopting HDR, offering HDR streaming since 2016. In March 2025, we launched AV1 HDR streaming. We chose HDR10+ as the HDR format for its use of dynamic metadata, which enabled us to adapt the tone mapping per device in a scene-dependent manner.

As anticipated, the combination of AV1 and HDR10+ allows us to deliver images with greater detail, more vibrant colors, and an overall heightened sense of immersion for our members. At the moment, 85% of our HDR catalog (from the perspective of view-hours) has AV1-HDR10+ coverage, and this number is expected to reach 100% in the next couple of months.

Photographs of devices displaying the same (cropped) frame with HDR10 metadata (left) and HDR10+ metadata (right). Notice the preservation of the flashlight detail in the HDR10+ capture, and the over-exposure of the region under the flashlight in the HDR10 one.

Cinematic Film Grain
Film grain is a hallmark of the cinematic experience, widely used in the movie industry to enhance a film’s depth, texture, and realism. However, because film grain is inherently random, faithfully representing it in digital video requires a significant amount of data. This presents a unique challenge for streaming: restricting the bitrate can result in grain that appears unnatural or distorted, while increasing the bitrate to accurately preserve cinematic grain almost inevitably leads to elevated rebuffering. The AV1 specification incorporates a unique solution called Film Grain Synthesis (FGS). Instead of encoding grain as part of every frame, the grain is stripped out before encoding and then resynthesized at the decoder using parameters sent in the bitstream, delivering a realistic cinematic film grain experience without the usual data costs.

This approach represents a significant shift from traditional compression and streaming techniques. Our team invested substantial effort in fine-tuning the media processing pipeline, ensuring FGS delivers robust performance at scale. In July 2025, we successfully productized AV1 FGS, and the results were astonishing: AV1 with FGS could deliver videos with cinematic film grain at a bitrate well within the capabilities of typical household internet connections. For non-FGS AV1 encodings, even at much higher bitrate, they may not be able to achieve comparable quality.

The same (cropped) frame from source (left), regular AV1 stream encoded at 8274kbps (middle) and AV1 FGS stream encoded at 2804 kbps (right). The AV1 FGS stream reduces the bitrate by 66% while delivering clearly better quality.

Beyond VOD Streaming

So far, our AV1 journey has been mainly on VOD, but we see significant opportunities for AV1 beyond traditional VOD streaming. On a mission to entertain the world, Netflix has constantly explored and established other ways to bring joy to our members, and we believe AV1 could contribute to the success of these new products.
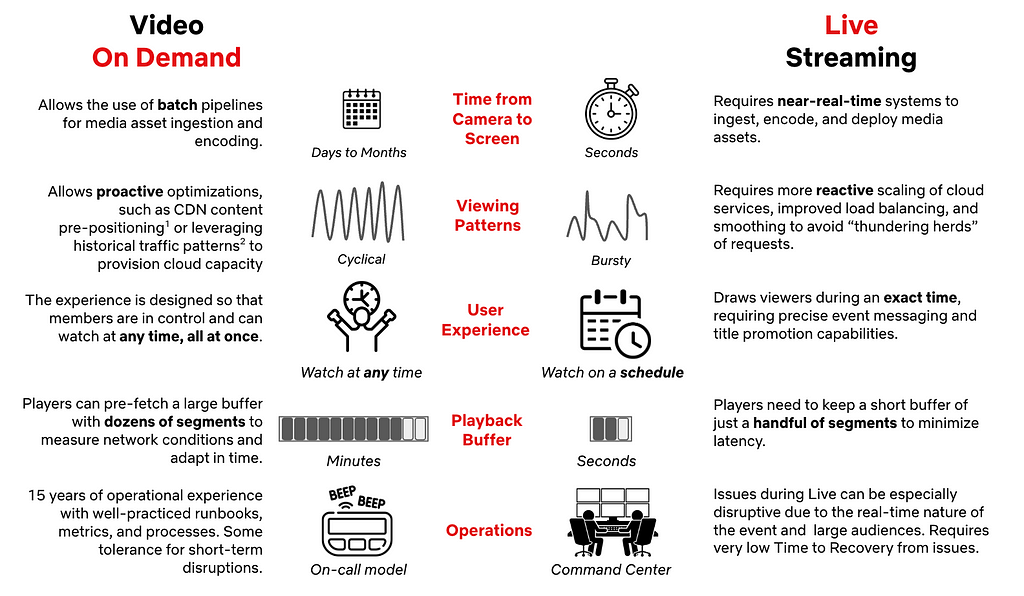
Live Streaming
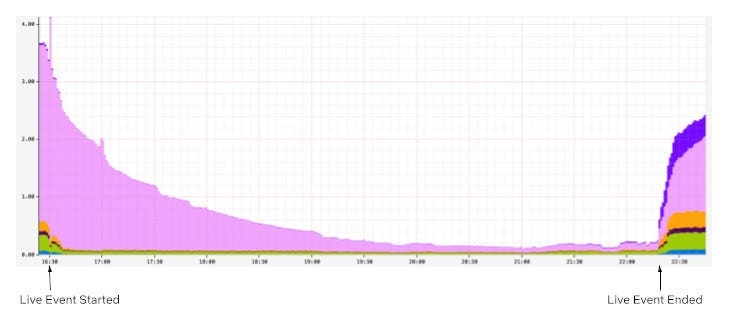
Debuting in 2023, live streaming has experienced rapid growth at Netflix, becoming a key part of our streaming offerings in just two short years. We are actively evaluating the use of AV1 in live streaming, as we believe it could help further scale Netflix’s live programming:

  • Hyper-scale concurrent viewership: Live streaming at Netflix means delivering content to tens of millions of viewers simultaneously. AV1’s superior compression efficiency could significantly reduce the required bandwidth, enabling us to deliver high-quality live experiences to large audiences without compromising video quality.
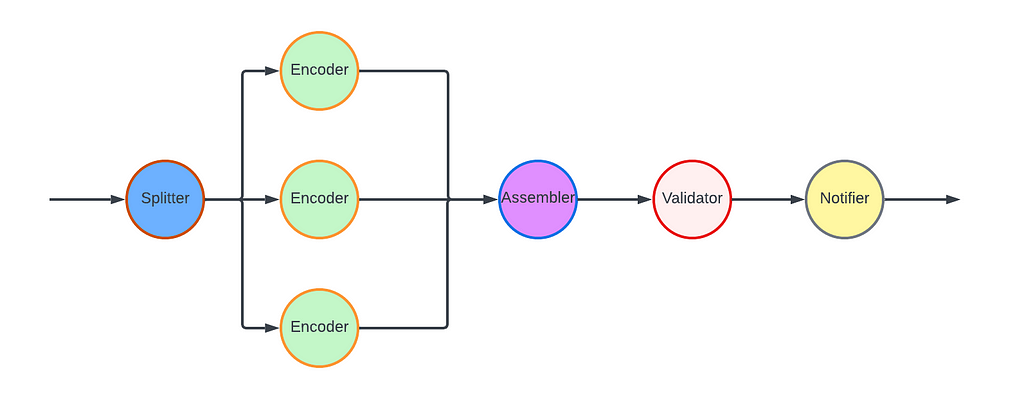
  • Customizable graphics overlay: for live sport events such as football, tennis and boxing, graphics overlays have become an integral part of the member experience — from embedding game statistics to delivering sponsorships. AV1 offers an opportunity to make the graphics highly customizable: layered coding is supported in AV1’s main profile, allowing encoding the main content in the base layer, and graphics in the enhancement layer, and easily swapping out one version of the enhancement layer with another. We envision that the use of AV1’s layered coding can greatly simplify the live streaming workflow and reduce delivery costs.

Cloud Gaming
Cloud gaming is a new Netflix offering that is currently in the beta phase and is available to members in select countries. The game engines run on cloud servers, while the rendered graphics are streamed directly to members’ devices. By removing barriers and transforming every Netflix-enabled device into a game console, Cloud gaming aims to deliver a seamless, “play anywhere” experience for our members. For a glimpse of this in action, watch as Co-CEO Greg Peters and CTO Elizabeth Stone play a round of Boggle Party — powered entirely by Netflix’s cloud gaming platform!

Unlike traditional video streaming, cloud gaming requires that every player action is reflected instantly on the screen to ensure a responsive and immersive experience. This makes delivering high-quality video frames with extremely low latency, despite fluctuating network conditions, one of the biggest challenges in cloud gaming.

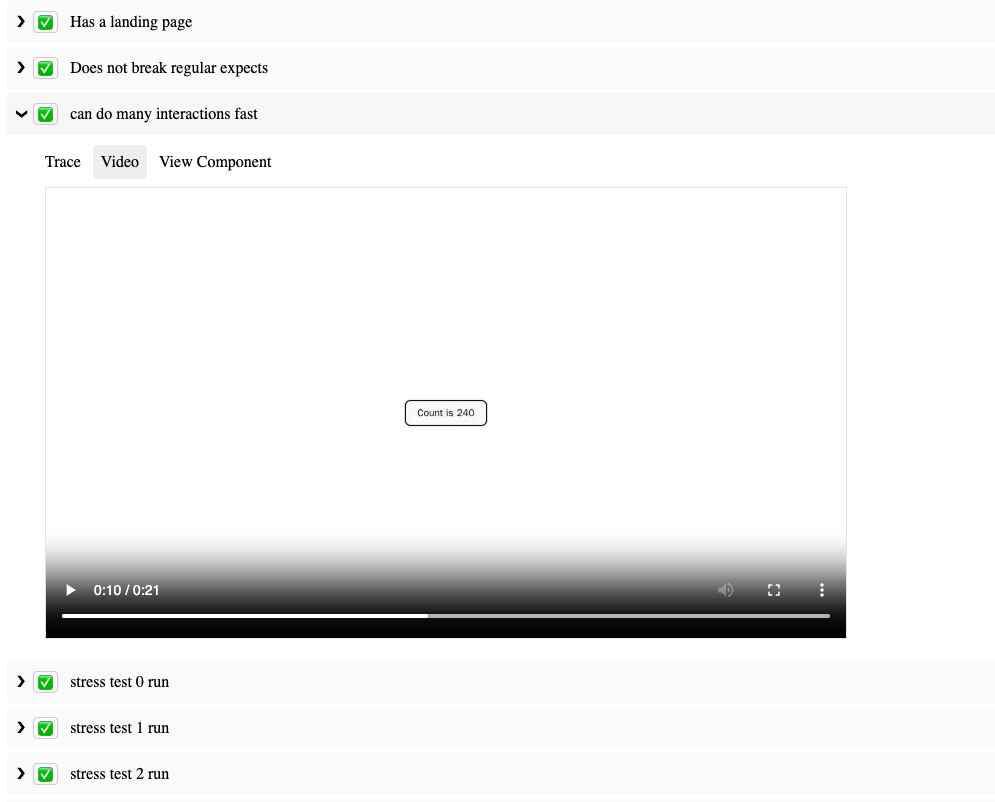
Our team is actively working on productizing AV1 for cloud gaming. Given AV1’s high compression efficiency, we can reduce frame sizes, helping video frames get through even when network conditions become challenging. This positions AV1 as a promising technology for enabling a high-quality, low-latency gaming experience across a wide range of devices.

A Device Ecosystem United for AV1

Netflix is a streaming company, and we have worked diligently to create highly efficient and standards-conformant AV1 streams for our catalog. However, an equally, if not more, important factor in AV1’s success is the widespread support from device manufacturers. Throughout our AV1 journey, we have been impressed by the unprecedented pace at which the device ecosystem has embraced AV1.

Just six months after the AV1 specification was finalized, the open-source AV1 decoder library sponsored by AOM, dav1d, was released. Small, performant, and highly resource-efficient, dav1d bridged the gap for early adopters like Netflix while hardware solutions were still in development. Continuous improvements to its performance and compatibility have made dav1d the preferred choice for a wide range of platforms and practical applications. Today, it serves as Android’s default software decoder. Additionally, it plays a key role in web browsers — for Netflix, it powers approximately 40% of our browser playback. This broad adoption has significantly expanded access to high-quality AV1 streaming, even in the absence of dedicated hardware decoders.

Netflix maintains a close working relationship with device manufacturers and SoC vendors, and we have witnessed first-hand their enthusiasm for adopting AV1. To ensure optimal streaming performance, Netflix has a rigorous certification process to verify proper support for our streaming formats on devices. AV1 was added to this certification process in 2019, and since then, we have seen a steady increase in the number of devices with full AV1 decoding capabilities. Over the past five years (2021–2025), 88% of large-screen devices, including TVs, set-top boxes, and streaming sticks, submitted for Netflix certification have supported AV1, with the vast majority offering full 4K@60fps capability. Notably, since 2023, almost all devices we have received for certification are AV1-capable.

We have also been impressed by the robustness of AV1 implementations across these devices. As mentioned earlier, FGS is an innovative tool that departs from traditional codec architectures and was not included in our initial full-scale AV1 streaming rollout. When we launched FGS this July, we worked closely with our partners to ensure broad device compatibility. We are pleased with the successful progress made, and AV1 with FGS is now supported across a significant and growing number of in-field devices.

Looking Ahead: AV1 Today, AV2 Tomorrow

As we reflect on our AV1 journey, it’s clear that the codec has already transformed the streaming experience for hundreds of millions of Netflix members worldwide. Thanks to industry-wide collaboration and rapid device adoption, AV1 is delivering higher quality, greater efficiency, and new cinematic features to more screens than ever before.

Looking ahead, we are excited about the forthcoming release of AV2, announced by the Alliance for Open Media for the end of 2025. AV2 is poised to set a new benchmark for compression efficiency and streaming capabilities, building on the solid foundation laid by AV1. At Netflix, we remain committed to adopting the best open technologies to delight our members around the globe. While AV2 represents the future of streaming, AV1 is very much the present — serving as the backbone of our platform and powering exceptional entertainment experiences across a vast and ever-expanding ecosystem of devices.

Acknowledgement

The success of AV1 at Netflix is the result of the dedication, expertise, and collaboration of many teams across the company — including Encoding, Clients, Device Certification, Partner Engineering, Data Science & Engineering, Infra, Platform, etc.

We would also like to thank Artem Danylenko, Aditya Mavlankar, Anne Aaron, Cyril Concolato, Allan Zhou and Anush Moorthy for their valuable comments and feedback on earlier drafts of this post.

Footnotes

  1. These numbers represent a snapshot of data from November 13, 2025. Actual values may vary slightly from day to day and across different regions, depending on the mix of content, devices, and internet connectivity.


AV1 — Now Powering 30% of Netflix Streaming was originally published in Netflix TechBlog on Medium, where people are continuing the conversation by highlighting and responding to this story.

Behind the Streams: Real-Time Recommendations for Live Events Part 3

Post Syndicated from Netflix Technology Blog original https://netflixtechblog.com/behind-the-streams-real-time-recommendations-for-live-events-e027cb313f8f

By: Kris Range, Ankush Gulati, Jim Isaacs, Jennifer Shin, Jeremy Kelly, Jason Tu

This is part 3 in a series called “Behind the Streams”. Check out part 1 and part 2 to learn more.

Picture this: It’s seconds before the biggest fight night in Netflix history. Sixty-five million fans are waiting, devices in hand, hearts pounding. The countdown hits zero. What does it take to get everyone to the action on time, every time? At Netflix, we’re used to on-demand viewing where everyone chooses their own moment. But with live events, millions are eager to join in at once. Our job: make sure our members never miss a beat.

When Live events break streaming records ¹ ² ³, our infrastructure faces the ultimate stress test. Here’s how we engineered a discovery experience for a global audience excited to see a knockout.

Why are Live Events Different?

Unlike Video on Demand (VOD), members want to catch live events as they happen. There’s something uniquely exciting about being part of the moment. That means we only have a brief window to recommend a Live event at just the right time. Too early, excitement fades; too late, the moment is missed. Every second counts.

To capture that excitement, we enhanced our recommendation delivery systems to serve real-time suggestions, providing members richer and more compelling signals to hit play in the moment when it matters most. The challenge? Sending dynamic, timely updates concurrently to over a hundred million devices worldwide without creating a thundering herd effect that would overwhelm our cloud services. Simply scaling up linearly isn’t efficient and reliable. For popular events, it could also divert resources from other critical services. We needed a smarter and more scalable solution than just adding more resources.

Orchestrating the moment: Real-time Recommendations

With millions of devices online and live event schedules that can shift in real time, the challenge was to keep everyone perfectly in sync. We set out to solve this by building a system that doesn’t just react, but adapts by dynamically updating recommendations as the event unfolds. We identified the need to balance three constraints:

  • Time: the duration required to coordinate an update.
  • Request throughput: the capacity of our cloud services to handle requests.
  • Compute cardinality: the variety of requests necessary to serve a unique update.
Visualizing constraints for real-time updates

We solved this constraint optimization problem by splitting the real-time recommendations into two phases: prefetching and real-time broadcasting. First, we prefetch the necessary data ahead of time, distributing the load over a longer period to avoid traffic spikes. When the Live event starts or ends, we broadcast a low cardinality message to all connected devices, prompting them to use the prefetched data locally. The timing of the broadcast also adapts when event times shift to preserve accuracy with the production of the Live event. By combining these two phases, we’re able to keep our members’ devices in sync and solve the thundering herd problem. To maximize device reach, especially for those with unstable networks, we use “at least once” broadcasts to ensure every device gets the latest updates and can catch up on any previously missed broadcasts as soon as they’re back online.

The first phase optimizes request throughput and compute cardinality by prefetching materialized recommendations, displayed title metadata, and artwork for a Live event. As members naturally browse their devices before the event, this data is prepopulated and stored locally in device cache, awaiting the notification trigger to serve the recommendations instantaneously. By distributing these requests naturally over time ahead of the event, we can eliminate any related traffic spikes and avoid the need for large-scale, real-time system scaling.

A phased approach, smoothing traffic requests over time with a real-time low-cardinality broadcast

The second phase optimizes request throughput and time to update devices by broadcasting a low-cardinality, real-time message to all connected devices at critical moments in a Live event’s lifecycle. Each broadcast payload includes a state key and a timestamp. The state key indicates the current stage of the Live event, allowing devices to use their pre-fetched data to update cached responses locally without additional server requests. The timestamp ensures that if a device misses a broadcast due to network issues, it can catch up by replaying missed updates upon reconnecting. This mechanism guarantees devices receive updates at least once, significantly increasing delivery reliability even on unstable networks.

A phased approach optimizes each constraint to ensure we can deliver for the big moment!

Moment in Numbers: During peak load, we have successfully delivered updates at multiple stages of our events to over 100 million devices in under a minute.

Under the Hood: How It Works

With the big picture in mind, let’s examine how these pieces interact in practice.

In the diagram below, the Message Producer microservice centralizes all of the business logic. It continuously monitors live events for setup and timing changes. When it detects an update, it schedules broadcasts to be sent at precisely the right moment. The Message Producer also standardizes communication by providing a concise GraphQL schema for both device queries and broadcast payloads.

Rather than sending broadcasts directly to devices via WebSocket, the Message Producer hands them off to the Message Router. The Message Router is part of a robust two-tier pub/sub architecture built on proven technologies like Pushy (our WebSocket proxy), Apache Kafka, and Netflix’s KV key-value store. The Message Router tracks subscriptions at the Pushy node granularity, while Pushy nodes map the subscriptions to individual connections, creating a low-latency fanout that minimizes compute and bandwidth requirements.

Devices interface with our GraphQL Domain Graph Service (DGS). These schemas offer multiple query interfaces for prefetching, allowing devices to tailor their requests to the specific experience being presented. Each response adheres to a consistent API that resolves to a map of stage keys, enabling fast lookups and keeping business logic off the device. Our broadcast schema specifies WebSocket connection parameters, the current event stage, and the timestamp of the last broadcast message. When a device receives a broadcast, it injects the payload directly into its cache, triggering an immediate update and re-render of the interface.

Balancing the Moment: Throughput Management

In addition to building the new technology to support real-time recommendations, we also evaluated our existing systems for potential traffic hotspots. Using high-watermark traffic projections for live events, we generated synthetic traffic to simulate game-day scenarios and observed how our online services handled these bursts. Through this process, several common patterns emerged:

Breaking the Cache Synchrony

Our game-day simulations revealed that while our approach mitigated the immediate thundering herd risks driven by member traffic during the events, live events introduced unexpected mini thundering herds in our systems hours before and after the actual events. The surge of members joining just in time for these events led to concentrated cache expirations and recomputations, which created traffic spikes well outside the event window that we did not anticipate. This was not a problem for VOD content because the member traffic patterns are a lot smoother. We found that fixed TTLs caused cache expirations and refresh-traffic spikes to happen all at once. To address this, we added jitter to server and client cache expirations to spread out refreshes and smooth out traffic spikes.

Adaptive Traffic Prioritization

While our services already leverage traffic prioritization and partitioning based on factors such as request type and device type, live events introduced a distinct challenge. These events generated brief traffic bursts that were intensely spiky and placed significant strain on our systems. Through simulations, we recognized the need for an additional event-driven layer of traffic management.

To tackle this, we improved our traffic sharding strategies by using event-based signals. This enabled us to route live event traffic to dedicated clusters with more aggressive scaling policies. We also added a dynamic traffic prioritization ruleset that activates whenever we see high requests per second (RPS) to ensure our systems can handle the surge smoothly. During these peaks, we aggressively deprioritize non-critical server-driven updates so that our systems can devote resources to the most time-sensitive computations. This approach ensures smooth performance and reliability when demand is at its highest.

Snapshot of non-critical traffic volume decline (in %) for a member-facing service during a live event — achieved via aggressive de-prioritization

Looking Ahead

When we set out to build a seamlessly scalable scheduled viewing experience, our goal was to create a dynamic and richer member experience for live content. Popular live events like the Crawford v. Canelo fight and the NFL Christmas games truly put our systems to the test. Along the way, we also uncovered valuable learnings that continue to shape our work. Our attempts to deprioritize traffic to other non-critical services caused unexpected call patterns and spikes in traffic elsewhere. Similarly, in hindsight, we also learned that the high traffic volume from popular events caused excessive non-essential logging and was putting unnecessary pressure on our ingestion pipelines.

None of this work would have been possible without our stunning colleagues at Netflix who collaborated across multiple functions to architect, build, and test these approaches, ensuring members can easily access events at the right moment: UI Engineering, Cloud Gateway, Data Science & Engineering, Search and Discovery, Evidence Engineering, Member Experience Foundations, Content Promotion and Distribution, Operations and Reliability, Device Playback, Experience and Design and Product Management.

As Netflix’s content offering expands to include new formats like live titles, free-to-air linear content, and games, we’re excited to build on what we’ve accomplished and look ahead to even more possibilities. Our roadmap includes extending the capabilities we developed for scheduled live viewing to these emerging formats. We’re also focused on enhancing our engineering tooling for greater visibility into operations, message delivery, and error handling to help us continue to deliver the best possible experience for our members.

Join Us for What’s Next

We’re just scratching the surface of what’s possible as we bring new live experiences to members around the world. If you are looking to solve interesting technical challenges in a unique culture, then apply for a role that captures your curiosity.

Look out for future blog posts in our “Behind the Streams” series, where we’ll explore the systems that ensure viewers can watch live streams once they manage to find and play them.


Behind the Streams: Real-Time Recommendations for Live Events Part 3 was originally published in Netflix TechBlog on Medium, where people are continuing the conversation by highlighting and responding to this story.

Behind the Streams: Live at Netflix. Part 1

Post Syndicated from Netflix Technology Blog original https://netflixtechblog.com/behind-the-streams-live-at-netflix-part-1-d23f917c2f40

Behind the Streams: Three Years Of Live at Netflix. Part 1.

By Sergey Fedorov, Chris Pham, Flavio Ribeiro, Chris Newton, and Wei Wei

Many great ideas at Netflix begin with a question, and three years ago, we asked one of our boldest yet: if we were to entertain the world through Live — a format almost as old as television itself — how would we do it?

What began with an engineering plan to pave the path towards our first Live comedy special, Chris Rock: Selective Outrage, has since led to hundreds of Live events ranging from the biggest comedy shows and NFL Christmas Games to record-breaking boxing fights and becoming the home of WWE.

In our series Behind the Streams — where we take you through the technical journey of our biggest bets — we will do a multiple part deep-dive into the architecture of Live and what we learned while building it. Part one begins with the foundation we set for Live, and the critical decisions we made that influenced our approach.

| But First: What Makes Live Streaming Different?

While Live as a television format is not new, the streaming experience we intended to build required capabilities we did not have at the time. Despite 15 years of on-demand streaming under our belt, Live introduced new considerations influencing architecture and technology choices:

References: 1. Content Pre-Positioning on Open Connect, 2.Load-Balancing Netflix Traffic at Global Scale

This means that we had a lot to build in order to make Live work well on Netflix. That starts with making the right choices regarding the fundamentals of our Live Architecture.

| Key Pillars of Netflix Live Architecture

Our Live Technology needed to extend the same promise to members that we’ve made with on-demand streaming: great quality on as many devices as possible without interruptions. Live is one of many entertainment formats on Netflix, so we also needed to seamlessly blend Live events into the user experience, all while scaling to over 300 million global subscribers.

When we started, we had nine months until the first launch. While we needed to execute quickly, we also wanted to architect for future growth in both magnitude and multitude of events. As a key principle, we leveraged our unique position of building support for a single product — Netflix — and having control over the full Live lifecycle, from Production to Screen.

Dedicated Broadcast Facilities to Ingest Live Content from Production

Live events can happen anywhere in the world, but not every location has Live facilities or great connectivity. To ensure secure and reliable live signal transport, we leverage distributed and highly connected broadcast operations centers, with specialized equipment for signal ingest and inspection, closed-captioning, graphics and advertisement management. We prioritized repeatability, conditioning engineering to launch live events consistently, reliably, and cost-effectively, leaning into automation wherever possible. As a result, we have been able to reduce the event-specific setup to the transmission between production and the Broadcast Operations Center, reusing the rest across events.

Cloud-based Redundant Transcoding and Packaging Pipelines

The feed received at the Broadcast Center contains a fully produced program, but still needs to be encoded and packaged for streaming on devices. We chose a Cloud-based approach to allow for dynamic scaling, flexibility in configuration, and ease of integration with our Digital Rights Management (DRM), content management, and content delivery services already deployed in the cloud. We leverage AWS MediaConnect and AWS MediaLive to acquire feeds in the cloud and transcode them into various video quality levels with bitrates tailored per show. We built a custom packager to better integrate with our delivery and playback systems. We also built a custom Live Origin to ensure strict read and write SLAs for Live segments.

Scaling Live Content Delivery to millions of viewers with Open Connect CDN

In order for the produced media assets to be streamed, they need to be transferred from a few AWS locations, where Live Origin is deployed, to hundreds of millions of devices worldwide. We leverage Netflix’s CDN, Open Connect, to scale Live asset delivery. Open Connect servers are placed close to the viewers at over 6K locations and connected to AWS locations via a dedicated Open Connect Backbone network.

18K+ servers in 6K+ locations, in Internet Exchanges, or embedded into ISP networks
Open Connect Backbone connects servers in Internet Exchange locations to 5 AWS regions

By enabling Live delivery on Open Connect, we build on top of $1B+ in Netflix investments over the last 12 years focused on scaling the network and optimizing the performance of delivery servers. By sharing capacity across on-demand and Live viewership we improve utilization, and by caching past Live content on the same servers used for on-demand streaming, we can easily enable catch-up viewing.

Optimizing Live Playback for Device Compatibility, Scale, Quality, and Stability

To make Live accessible to the majority of our customers without upgrading their streaming devices, we settled on using HTTPS-based Live Streaming. While UDP-based protocols can provide additional features like ultra-low latency, HTTPS has ubiquitous support among devices and compatibility with delivery and encoding systems. Furthermore, we use AVC and HEVC video codecs, transcode with multiple quality levels up from SD to 4K, and use a 2-second segment duration to balance compression efficiency, infrastructure load, and latency. While prioritizing streaming quality and playback stability, we have also achieved industry standard latency from camera to device, and continue to improve it.

To configure playback, the device player receives a playback manifest at the play start. The manifest contains items like the encoding bitrates and CDN servers players should use. We deliver the manifest from the cloud instead of the CDN, as it allows us to personalize the configuration for each device. To reference segments of the stream, the manifest includes a segment template that is used by devices to map a wall-clock time to URLs on the CDN. Using a segment template vs periodic polling for manifest updates minimizes network dependencies, CDN server load, and overhead on resource-constrained devices, like smart TVs, thus improving both scalability and stability of our system. While streaming, the player monitors network performance and dynamically chooses the bitrate and CDN server, maximizing streaming quality while minimizing rebuffering.

Run Discovery and Playback Control Services in the Cloud

So far, we have covered the streaming path from Camera to Device. To make the stream fully work, we also need to orchestrate across all systems, and ensure viewers can find and start the Live event. This functionality is performed by dozens of Cloud services, with functions like playback configuration, personalization, or metrics collection. These services tend to receive disproportionately higher loads around Live event start time, and Cloud deployment provides flexibility in dynamically scaling compute resources. Moreover, as Live demand tends to be localized, we are able to balance load across multiple AWS regions, better utilizing our global footprint. Deployment in the cloud also allows us to build a user experience where we embed Live content into a broader selection of entertainment options in the UI, like on-demand titles or Games.

Centralize Real-time Metrics in the Cloud with Specialized Tools and Facilities

With control over ingest, encoding pipelines, the Open Connect CDN, and device players, we have nearly end-to-end observability into the Live workflow. During Live, we collect system and user metrics in real-time (e.g., where members see the title on Netflix and their quality of experience), alerting us to poor user experiences or degraded system performance. Our real-time monitoring is built using a mix of internally developed tools, such as Atlas, Mantis, and Lumen, and open-source technologies, such as Kafka and Druid, processing up to 38 million events per second during some of our largest live events while providing critical metrics and operational insights in a matter of seconds. Furthermore, we set up dedicated “Control Center” facilities, which bring key metrics together to the operational team that monitors the event in real-time.

| Our key learnings so far

Building new functionality always brings fresh challenges and opportunities to learn, especially with a system as complex as Live. Even after three years, we’re still learning every day how to deliver Live events more effectively. Here are a few key highlights:

Extensive testing: Prior to Live we heavily relied on the predictable flow of on-demand traffic for pre-release canaries or A/B tests to validate deployments. But Live traffic was not always available, especially not at the scale representative of a big launch. As a result, we spent considerable effort to:

  1. Generate internal “test streams,” which engineers use to run integration, regression, or smoke tests as part of the development lifecycle.
  2. Build synthetic load testing capabilities to stress test cloud and CDN systems. We use 2 approaches, allowing us to generate up to 100K starts-per-second:
     — Capture, modify, and replay past Live production traffic, representing a diversity of user devices and request patterns.
     — Virtualize Netflix devices and generate traffic against CDN or Cloud endpoints to test the impact of the latest changes across all systems.
  3. Run automated failure injection, forcing missing or corrupted segments from the encoding pipeline, loss of a cloud region, network drop, or server timeouts.

Regular practice: Despite rigorous pre-release testing, nothing beats a production environment, especially when operating at scale. We learned that having a regular schedule with diverse Live content is essential to making improvements while balancing the risks of member impact. We run A/B tests, perform chaos testing, operational exercises, and train operational teams for upcoming launches.

Viewership predictions: We use prediction-based techniques to pre-provision Cloud and CDN capacity, and share forecasts with our ISP and Cloud partners ahead of time so they can plan network and compute resources. Then we complement them with reactive scaling of cloud systems powering sign-up, log-in, title discovery, and playback services to account for viewership exceeding our predictions. We have found success with forward-looking real-time viewership predictions during a live event, allowing us to take steps to mitigate risks earlier, before more members are impacted.

Graceful degradation: Despite our best efforts, we can (and did!) find ourselves in a situation where viewership exceeded our predictions and provisioned capacity. In this case, we developed a number of levers to continue streaming, even if it means gradually removing some nice-to-have features. For example, we use service-level prioritized load shedding to prioritize live traffic over non-critical traffic (like pre-fetch). Beyond that, we can lighten the experience, like dialing down personalization, disabling bookmarks, or lowering the maximum streaming quality. Our load tests include scenarios where we under-scale systems to validate desired behavior.

Retry storms: When systems reach capacity, our key focus is to avoid cascading issues or further overloading systems with retries. Beyond system retries, users may retry manually — we’ve seen a 10x increase in traffic load due to stream restarts after viewing interruptions of as little as 30 seconds. We spent considerable time understanding device retry behavior in the presence of issues like network timeouts or missing segments. As a result, we implemented strategies like server-guided backoff for device retries, absorbing spikes via prioritized traffic shedding at Cloud Edge Gateway, and re-balancing traffic between cloud regions.

Contingency planning: Everyone has a plan until they get punched in the mouth” is very relevant for Live. When something breaks, there is practically no time for troubleshooting. For large events, we set up in-person launch rooms with engineering owners of critical systems. For quick detection and response, we developed a small set of metrics as early indicators of issues, and have extensive runbooks for common operational issues. We don’t learn on launch day; instead, launch teams practice failure response via Game Day exercises ahead of time. Finally, our runbooks extend beyond engineering, covering escalation to executive leadership and coordination across functions like Customer Service, Production, Communications, or Social.

Our commitment to enhancing the member experience doesn’t end at the “Thanks for Watching!” screen. Shortly after each live stream, we dive into metrics to identify areas for improvement. Our Data & Insights team conducts comprehensive analyses, A/B tests, and consumer research to ensure the next event is even more delightful for our members. We leverage insights on member behavior, preferences, and expectations to refine the Netflix product experience and optimize our Live technology — like reducing latency by ~10 seconds through A/B tests, without affecting quality or stability.

| What’s next on our Live journey?

Despite three years of effort, we are far from done! In fact, we are just getting started, actively building on the learnings shared above to deliver more joy to our members with Live events. To support the growing number of Live titles and new formats, like FIFA WWC in 2027, we keep building our broadcast and delivery infrastructure and are actively working to further improve the Live experience.

In this post, we’ve provided a broad overview and have barely scratched the surface. In the upcoming posts, we will dive deeper into key pillars of our Live systems, covering our encoding, delivery, playback, and user experience investments in more detail.

Getting this far would not have been possible without the hard work of dozens of teams across Netflix, who collaborate closely to design, build, and operate Live systems: Operations and Reliability, Encoding Technologies, Content Delivery, Device Playback, Streaming Algorithms, UI Engineering, Search and Discovery, Messaging, Content Promotion and Distribution, Data Platform, Cloud Infrastructure, Tooling and Productivity, Program Management, Data Science & Engineering, Product Management, Globalization, Consumer Insights, Ads, Security, Payments, Live Production, Experience and Design, Product Marketing and Customer Service, amongst many others.


Behind the Streams: Live at Netflix. Part 1 was originally published in Netflix TechBlog on Medium, where people are continuing the conversation by highlighting and responding to this story.

HDR10+ Now Streaming on Netflix

Post Syndicated from Netflix Technology Blog original https://netflixtechblog.com/hdr10-now-streaming-on-netflix-c9ab1f4bd72b

Roger Quero, Liwei Guo, Jeff Watts, Joseph McCormick, Agata Opalach, Anush Moorthy

We are excited to announce that we are now streaming HDR10+ content on our service for AV1-enabled devices, enhancing the viewing experience for certified HDR10+ devices, which previously only received HDR10 content. The dynamic metadata included in our HDR10+ content improves the quality and accuracy of the picture when viewed on these devices.

Delighting Members with Even Better Picture Quality

Nearly a decade ago, we made a bold move to be a pioneering adopter of High Dynamic Range (HDR) technology. HDR enables images to have more details, vivid colors, and improved realism. We began producing our shows and movies in HDR, encoding them in HDR, and streaming them in HDR for our members. We were confident that it would greatly enhance our members’ viewing experience, and unlock new creative visions — and we were right! In the last five years, HDR streaming has increased by more than 300%, while the number of HDR-configured devices watching Netflix has more than doubled. Since launching HDR with season one of Marco Polo, Netflix now has over 11,000 hours of HDR titles for members to immerse themselves in.

We continue to enhance member joy while maintaining creative vision by adding support for HDR10+. This will further augment Netflix’s growing HDR ecosystem, preserve creative intent on even more devices, and provide a more immersive viewing experience.

We enabled HDR10+ on Netflix using the AV1 video codec that was standardized by the Alliance for Open Media (AOM) in 2018. AV1 is one of the most efficient codecs available today. We previously enabled AV1 encoding for SDR content, and saw tremendous value for our members, including higher and more consistent visual quality, lower play delay and increased streaming at the highest resolution. AV1-SDR is already the second most streamed codec at Netflix, behind H.264/AVC, which has been around for over 20 years! With the addition of HDR10+ streams to AV1, we expect the day is not far when AV1 will be the most streamed codec at Netflix.

To enhance our offering, we have been adding HDR10+ streams to both new releases and existing popular HDR titles. AV1-HDR10+ now accounts for 50% of all eligible viewing hours. We will continue expanding our HDR10+ offerings with the goal of providing an HDR10+ experience for all HDR titles by the end of this year¹.

Industry Adopted Formats

Today, the industry recognizes three prevalent HDR formats: Dolby Vision, HDR10, and HDR10+. For all three HDR Formats, metadata is embedded in the content, serving as instructions to guide the playback device — whether it’s a TV, mobile device, or computer — on how to display the image.

HDR10 is the most widely adopted HDR format, supported by all HDR devices. HDR10 uses static metadata that is defined once for the entire content detailing aspects such as the maximum content light level (MaxCLL), maximum frame average light level (MaxFALL), as well as characteristics of the mastering display used for color grading. This metadata only allows for a one-size-fits-all tone mapping of the content for display devices. It cannot account for dynamic contrast across scenes, which most content contains.

HDR10+ and Dolby Vision improve on this with dynamic metadata that provides content image statistics on a per-frame basis, enabling optimized tone mapping adjustments for each scene. This achieves greater perceptual fidelity to the original, preserving creative intent.

HDR10 vs. HDR10+

The figure below shows screen grabs of two AV1-encoded frames of the same content displayed using HDR10 (top) and HDR10+ (bottom).

Photographs of devices displaying the same frame with HDR10 metadata (top) and HDR10+ metadata (bottom). Notice the preservation of the flashlight detail in the HDR10+ capture, and the over-exposure of the region under the flashlight in the HDR10 one².

As seen in the flashlight on the table, the highlight details are clipped in the HDR10 content, but are recovered in HDR10+. Further, the region under the flashlight is overexposed in the HDR10 content, while HDR10+ renders that region with greater fidelity to the source. The reason HDR10+, with its dynamic metadata, shines in this example is that the scenes preceding and following the scene with this frame have markedly different luminance statistics. The static HDR10 metadata is unable to account for the change in the content. While this is a simple example, the dynamic metadata in HDR10+ demonstrates such value across any set of scenes. This consistency allows our members to stay immersed in the content, and better preserves creative intent.

Receiving HDR10+

At the time of launch, these requirements must be satisfied to receive HDR10+:

1.Member must have a Netflix Premium plan subscription

2. Title must be available in HDR10+ format

3. Member device must support AV1 & HDR10+. Here are some examples of compatible devices:

  • SmartTVs, mobile phones, and tablets that meet Netflix certification for HDR10+
  • Source device (such as set-top boxes, streaming devices, MVPDs, etc.) that meets Netflix certification for HDR10+, connected to an HDR10+ compliant display via HDMI

4. For TV or streaming devices, ensure that the HDR toggle is enabled in our Netflix application settings: https://help.netflix.com/en/node/100220

Additional guidance: https://help.netflix.com/en/node/13444

Summary

More HDR content is watched every day on Netflix. Expanding the Netflix HDR ecosystem to include HDR10+ increases the accessibility of HDR content with dynamic metadata to more members, improves the viewing experience, and preserves the creative intent of our content creators. The commitment to innovation and quality underscores our dedication to delivering an immersive and authentic viewing experience for all our members.

Acknowledgements

Launching HDR10+ was a collaborative effort involving multiple teams at Netflix, and we are grateful to everyone who contributed to making this idea a reality. We would like to extend our thanks to the following teams for their crucial roles in this launch:

  • The various Client and Partner Engineering teams at Netflix that manage the Netflix experience across different device platforms.
    Special acknowledgments: Akshay Garg, Dasha Polyakova, Vivian Li, Ben Toofer, Allan Zhou, Artem Danylenko
  • The Encoding Technologies team that is responsible for producing optimized encodings to enable high-quality experiences for our members. Special acknowledgments: Adithya Prakash, Vinicius Carvalho
  • The Content Operations & Innovation teams responsible for producing and delivering HDR content to Netflix, maintaining the intent of creative vision from production to streaming. Special acknowledgements: Michael Keegan

Footnotes

  1. While we have enabled HDR10+ for distribution i.e., for what our members consume on their devices, we continue to accept only Dolby Vision masters on the ingest side, i.e., for all content delivery to Netflix as per our delivery specification. In addition to HDR10+, we continue to serve HDR10 and DolbyVision. Our encoding pipeline is designed with flexibility and extensibility where all these HDR formats could be derived from a single DolbyVision deliverable efficiently at scale.
  2. We recognize that it is hard to convey visual improvements in HDR video using still photographs converted to SDR. We encourage the reader to stream Netflix content in HDR10+ and check for yourself!


HDR10+ Now Streaming on Netflix was originally published in Netflix TechBlog on Medium, where people are continuing the conversation by highlighting and responding to this story.

Title Launch Observability at Netflix Scale

Post Syndicated from Netflix Technology Blog original https://netflixtechblog.com/title-launch-observability-at-netflix-scale-8efe69ebd653

Part 3: System Strategies and Architecture

By: Varun Khaitan

With special thanks to my stunning colleagues: Mallika Rao, Esmir Mesic, Hugo Marques

This blog post is a continuation of Part 2, where we cleared the ambiguity around title launch observability at Netflix. In this installment, we will explore the strategies, tools, and methodologies that were employed to achieve comprehensive title observability at scale.

Defining the observability endpoint

To create a comprehensive solution, we decided to introduce observability endpoints first. Each microservice involved in our Personalization stack that integrated with our observability solution had to introduce a new “Title Health” endpoint. Our goal was for each new endpoint to adhere to a few principles:

  1. Accurate reflection of production behavior
  2. Standardization across all endpoints
  3. Answering the Insight Triad: “Healthy” or not, why not and how to fix it.

Accurately Reflecting Production Behavior

A key part of our solution is insights into production behavior, which necessitates our requests to the endpoint result in traffic to the real service functions that mimics the same pathways the traffic would take if it came from the usual callers.

In order to allow for this mimicking, many systems implement an “event” handling, where they convert our request into a call to the real service with properties enabled to log when titles are filtered out of their response and why. Building services that adhere to software best practices, such as Object-Oriented Programming (OOP), the SOLID principles, and modularization, is crucial to have success at this stage. Without these practices, service endpoints may become tightly coupled to business logic, making it challenging and costly to add a new endpoint that seamlessly integrates with the observability solution while following the same production logic.

A service with modular business logic facilitates the seamless addition of an observability endpoint.

Standardization

To standardize communication between our observability service and the personalization stack’s observability endpoints, we’ve developed a stable proto request/response format. This centralized format, defined and maintained by our team, ensures all endpoints adhere to a consistent protocol. As a result, requests are uniformly handled, and responses are processed cohesively. This standardization enhances adoption within the personalization stack, simplifies the system, and improves understanding and debuggability for engineers.

The request schema for the observability endpoint.

The Insight Triad API

To efficiently understand the health of a title and triage issues quickly, all implementations of the observability endpoint must answer: is the title eligible for this phase of promotion, if not — why is it not eligible, and what can be done to fix any problems.

The end-users of this observability system are Launch Managers, whose job it is to ensure smooth title launches. As such, they must be able to quickly see whether there is a problem, what the problem is, and how to solve it. Teams implementing the endpoint must provide as much information as possible so that a non-engineer (Launch Manager) can understand the root cause of the issue and fix any title setup issues as they arise. They must also provide enough information for partner engineers to identify the problem with the underlying service in cases of system-level issues.

These requirements are captured in the following protobuf object that defines the endpoint response.

The response schema for the observability endpoint.

High level architecture

We’ve distilled our comprehensive solution into the following key steps, capturing the essence of our approach:

  1. Establish observability endpoints across all services within our Personalization and Discovery Stack.
  2. Implement proactive monitoring for each of these endpoints.
  3. Track real-time title impressions from the Netflix UI.
  4. Store the data in an optimized, highly distributed datastore.
  5. Offer easy-to-integrate APIs for our dashboard, enabling stakeholders to track specific titles effectively.
  6. “Time Travel” to validate ahead of time.
Observability stack high level architecture diagram

In the following sections, we will explore each of these concepts and components as illustrated in the diagram above.

Key Features

Proactive monitoring through scheduled collectors jobs

Our Title Health microservice runs a scheduled collector job every 30 minutes for most of our personalization stack.

For each Netflix row we support (such as Trending Now, Coming Soon, etc.), there is a dedicated collector. These collectors retrieve the relevant list of titles from our catalog that qualify for a specific row by interfacing with our catalog services. These services are informed about the expected subset of titles for each row, for which we are assessing title health.

Once a collector retrieves its list of candidate titles, it orchestrates batched calls to assigned row services using the above standardized schema to retrieve all the relevant health information of the titles. Additionally, some collectors will instead poll our kafka queue for impressions data.

Real-time Title Impressions and Kafka Queue

In addition to evaluating title health via our personalization stack services, we also keep an eye on how our recommendation algorithms treat titles by reviewing impressions data. It’s essential that our algorithms treat all titles equitably, for each one has limitless potential.

This data is processed from a real-time impressions stream into a Kafka queue, which our title health system regularly polls. Specialized collectors access the Kafka queue every two minutes to retrieve impressions data. This data is then aggregated in minute(s) intervals, calculating the number of impressions titles receive in near-real-time, and presented as an additional health status indicator for stakeholders.

Data storage and distribution through Hollow Feeds

Netflix Hollow is an Open Source java library and toolset for disseminating in-memory datasets from a single producer to many consumers for high performance read-only access. Given the shape of our data, hollow feeds are an excellent strategy to distribute the data across our service boxes.

Once collectors gather health data from partner services in the personalization stack or from our impressions stream, this data is stored in a dedicated Hollow feed for each collector. Hollow offers numerous features that help us monitor the overall health of a Netflix row, including ensuring there are no large-scale issues across a feed publish. It also allows us to track the history of each title by maintaining a per-title data history, calculate differences between previous and current data versions, and roll back to earlier versions if a problematic data change is detected.

Observability Dashboard using Health Check Engine

We maintain several dashboards that utilize our title health service to present the status of titles to stakeholders. These user interfaces access an endpoint in our service, enabling them to request the current status of a title across all supported rows. This endpoint efficiently reads from all available Hollow Feeds to obtain the current status, thanks to Hollow’s in-memory capabilities. The results are returned in a standardized format, ensuring easy support for future UIs.

Additionally, we have other endpoints that can summarize the health of a title across subsets of sections to highlight specific member experiences.

Message depicting a dashboard request.

Time Traveling: Catching before launch

Titles launching at Netflix go through several phases of pre-promotion before ultimately launching on our platform. For each of these phases, the first several hours of promotion are critical for the reach and effective personalization of a title, especially once the title has launched. Thus, to prevent issues as titles go through the launch lifecycle, our observability system needs to be capable of simulating traffic ahead of time so that relevant teams can catch and fix issues before they impact members. We call this capability “Time Travel”.

Many of the metadata and assets involved in title setup have specific timelines for when they become available to members. To determine if a title will be viewable at the start of an experience, we must simulate a request to a partner service as if it were from a future time when those specific metadata or assets are available. This is achieved by including a future timestamp in our request to the observability endpoint, corresponding to when the title is expected to appear for a given experience. The endpoint then communicates with any further downstream services using the context of that future timestamp.

An example request with a future timestamp.

Conclusion

Throughout this series, we’ve explored the journey of enhancing title launch observability at Netflix. In Part 1, we identified the challenges of managing vast content launches and the need for scalable solutions to ensure each title’s success. Part 2 highlighted the strategic approach to navigating ambiguity, introducing “Title Health” as a framework to align teams and prioritize core issues. In this final part, we detailed the sophisticated system strategies and architecture, including observability endpoints, proactive monitoring, and “Time Travel” capabilities; all designed to ensure a thrilling viewing experience.

By investing in these innovative solutions, we enhance the discoverability and success of each title, fostering trust with content creators and partners. This journey not only bolsters our operational capabilities but also lays the groundwork for future innovations, ensuring that every story reaches its intended audience and that every member enjoys their favorite titles on Netflix.

Thank you for joining us on this exploration, and stay tuned for more insights and innovations as we continue to entertain the world.


Title Launch Observability at Netflix Scale was originally published in Netflix TechBlog on Medium, where people are continuing the conversation by highlighting and responding to this story.

Title Launch Observability at Netflix Scale

Post Syndicated from Netflix Technology Blog original https://netflixtechblog.com/title-launch-observability-at-netflix-scale-19ea916be1ed

Part 2: Navigating Ambiguity

By: Varun Khaitan

With special thanks to my stunning colleagues: Mallika Rao, Esmir Mesic, Hugo Marques

Building on the foundation laid in Part 1, where we explored the “what” behind the challenges of title launch observability at Netflix, this post shifts focus to the “how.” How do we ensure every title launches seamlessly and remains discoverable by the right audience?

In the dynamic world of technology, it’s tempting to leap into problem-solving mode. But the key to lasting success lies in taking a step back — understanding the broader context before diving into solutions. This thoughtful approach doesn’t just address immediate hurdles; it builds the resilience and scalability needed for the future. Let’s explore how this mindset drives results.

Understanding the Bigger Picture

Let’s take a comprehensive look at all the elements involved and how they interconnect. We should aim to address questions such as: What is vital to the business? Which aspects of the problem are essential to resolve? And how did we arrive at this point?

This process involves:

  1. Identifying Stakeholders: Determine who is impacted by the issue and whose input is crucial for a successful resolution. In this case, the main stakeholders are:

    Title Launch Operators
    Role:
    Responsible for setting up the title and its metadata into our systems.
    Challenge: Don’t understand the cascading effects of their setup on these perceived black box personalization systems

    Personalization System Engineers
    Role: Develop and operate the personalization systems.
    Challenge: End up spending unplanned cycles on title launch and personalization investigations.

    Product Managers
    Role: Ensure we put forward the best experience for our members.
    Challenge: Members may not connect with the most relevant title.

    Creative Representatives
    Role: Mediator between the content creators and Netflix.
    Challenge: Build trust in the Netflix brand with content creators.

  2. Mapping the Current Landscape: By charting the existing landscape, we can pinpoint areas ripe for improvement and steer clear of redundant efforts. Beyond the scattered solutions and makeshift scripts, it became evident that there was no established solution for title launch observability. This suggests that this area has been neglected for quite some time and likely requires significant investment. This situation presents both challenges and opportunities; while it may be more difficult to make initial progress, there are plenty of easy wins to capitalize on.
  3. Clarifying the Core Problem: By clearly defining the problem, we can ensure that our solutions address the root cause rather than just the symptoms. While there were many issues and problems we could address, the core problem here was to make sure every title was treated fairly by our personalization stack. If we can ensure fair treatment with confidence and bring that visibility to all our stakeholders, we can address all their challenges.
  4. Assessing Business Priorities: Understanding what is most important to the organization helps prioritize actions and resources effectively. In this context, we’re focused on developing systems that ensure successful title launches, build trust between content creators and our brand, and reduce engineering operational overhead. While this is a critical business need and we definitely should solve it, it’s essential to evaluate how it stacks up against other priorities across different areas of the organization.

Defining Title Health

Navigating such an ambiguous space required a shared understanding to foster clarity and collaboration. To address this, we introduced the term “Title Health,” a concept designed to help us communicate effectively and capture the nuances of maintaining each title’s visibility and performance. This shared language became a foundation for discussing the complexities of this domain.

“Title Health” encompasses various metrics and indicators that reflect how well a title is performing, in terms of discoverability and member engagement. The three main questions we try to answer are:

  1. Is this title visible at all to any member?
  2. Is this title visible to an appropriate audience size?
  3. Is this title reaching all the appropriate audiences?

Defining Title Health provided a framework to monitor and optimize each title’s lifecycle. It allowed us to align with partners on principles and requirements before building solutions, ensuring every title reaches its intended audience seamlessly. This common language not only introduced the problem space effectively but also accelerated collaboration and decision-making across teams.

Categories of issues

To build a robust plan for title launch observability, we first needed to categorize the types of issues we encounter. This structured approach allows us to address all aspects of title health comprehensively.

Currently, these issues are grouped into three primary categories:

1. Title Setup

A title’s setup includes essential attributes like metadata (e.g., launch dates, audio and subtitle languages, editorial tags) and assets (e.g., artwork, trailers, supplemental messages). These elements are critical for a title’s eligibility in a row, accurate personalization, and an engaging presentation. Since these attributes feed directly into algorithms, any delays or inaccuracies can ripple through the system.

The observability system must ensure that title setup is complete and validated in a timely manner, identify potential bottlenecks and ensure a smooth launch process.

2. Personalization Systems

Titles are eligible to be recommended across multiple canvases on product — HomePage, Coming Soon, Messaging, Search and more. Personalization systems handle the recommendation and serving of titles on these canvases, leveraging a vast ecosystem of microservices, caches, databases, code, and configurations to build these product canvases.

We aim to validate that titles are eligible in all appropriate product canvases across the end to end personalization stack during all of the title’s launch phases.

3. Algorithms

Complex algorithms drive each personalized product experience, recommending titles tailored to individual members. Observability here means validating the accuracy of algorithmic recommendations for all titles.
Algorithmic performance can be affected by various factors, such as model shortcomings, incomplete or inaccurate input signals, feature anomalies, or interactions between titles. Identifying and addressing these issues ensures that recommendations remain precise and effective.

By categorizing issues into these areas, we can systematically address challenges and deliver a reliable, personalized experience for every title on our platform.

Issue Analysis

Let’s also learn more about how often we see each of these types of issues and how much effort it takes to fix them once they come up.

From the above chart, we see that setup issues are the most common but they are also easy to fix since it’s relatively straightforward to go back and rectify a title’s metadata. System issues, which mostly manifest as bugs in our personalization microservices are not uncommon, and they take moderate effort to address. Algorithm issues, while rare, are really difficult to address since these often involve interpreting and retraining complex machine learning models.

Evaluating Our Options

Now that we understand more deeply about the problems we want to address and how we should go about prioritizing our resources. Lets go back to the two options we discussed in Part 1, and make an informed decision.

Ultimately, we realized this space demands the full spectrum of features we’ve discussed. But the question remained: Where do we start?
After careful consideration, we chose to focus on proactive issue detection first. Catching problems before launch offered the greatest potential for business impact, ensuring smoother launches, better member experiences, and stronger system reliability.

This decision wasn’t just about solving today’s challenges — it was about laying the foundation for a scalable, robust system that can grow with the complexities of our ever-evolving platform.

Up next

In the next iteration we will talk about how to design an observability endpoint that works for all personalization systems. What are the main things to keep in mind while creating a microservice API endpoint? How do we ensure standardization? What is the architecture of the systems involved?

Keep an eye out for our next binge-worthy episode!


Title Launch Observability at Netflix Scale was originally published in Netflix TechBlog on Medium, where people are continuing the conversation by highlighting and responding to this story.

Title Launch Observability at Netflix Scale

Post Syndicated from Netflix Technology Blog original https://netflixtechblog.com/title-launch-observability-at-netflix-scale-c88c586629eb

Part 1: Understanding The Challenges

By: Varun Khaitan

With special thanks to my stunning colleagues: Mallika Rao, Esmir Mesic, Hugo Marques

Introduction

At Netflix, we manage over a thousand global content launches each month, backed by billions of dollars in annual investment. Ensuring the success and discoverability of each title across our platform is a top priority, as we aim to connect every story with the right audience to delight our members. To achieve this, we are committed to building robust systems that deliver comprehensive observability, enabling us to take full accountability for every title on our service.

The Challenge of Title Launch Observability

As engineers, we’re wired to track system metrics like error rates, latencies, and CPU utilization — but what about metrics that matter to a title’s success?

Consider the following example of two different Netflix Homepages:

Sample Homepage A
Sample Homepage B

To a basic recommendation system, the two sample pages might appear equivalent as long as the viewer watches the top title. Yet, these pages couldn’t be more different. Each title represents countless hours of effort and creativity, and our systems need to honor that uniqueness.

How do we bridge this gap? How can we design systems that recognize these nuances and empower every title to shine and bring joy to our members?

The Operational Needs of a Personalization System

In the early days of Netflix Originals, our launch team would huddle together at midnight, manually verifying that titles appeared in all the right places. While this hands-on approach worked for a handful of titles, it quickly became clear that it couldn’t scale. As Netflix expanded globally and the volume of title launches skyrocketed, the operational challenges of maintaining this manual process became undeniable.

Operating a personalization system for a global streaming service involves addressing numerous inquiries about why certain titles appear or fail to appear at specific times and places.
Some examples:

  • Why is title X not showing on the Coming Soon row for a particular member?
  • Why is title Y missing from the search page in Brazil?
  • Is title Z being displayed correctly in all product experiences as intended?

As Netflix scaled, we faced the mounting challenge of providing accurate, timely answers to increasingly complex queries about title performance and discoverability. This led to a suite of fragmented scripts, runbooks, and ad hoc solutions scattered across teams — an approach that was neither sustainable nor efficient.

The stakes are even higher when ensuring every title launches flawlessly. Metadata and assets must be correctly configured, data must flow seamlessly, microservices must process titles without error, and algorithms must function as intended. The complexity of these operational demands underscored the urgent need for a scalable solution.

Automating the Operations

It becomes evident over time that we need to automate our operations to scale with the business. As we thought more about this problem and possible solutions, two clear options emerged.

Option 1: Log Processing

Log processing offers a straightforward solution for monitoring and analyzing title launches. By logging all titles as they are displayed, we can process these logs to identify anomalies and gain insights into system performance. This approach provides a few advantages:

  1. Low burden on existing systems: Log processing imposes minimal changes to existing infrastructure. By leveraging logs, which are already generated during regular operations, we can scale observability without significant system modifications. This allows us to focus on data analysis and problem-solving rather than managing complex system changes.
  2. Using the source of truth: Logs serve as a reliable “source of truth” by providing a comprehensive record of system events. They allow us to verify whether titles are presented as intended and investigate any discrepancies. This capability is crucial for ensuring our recommendation systems and user interfaces function correctly, supporting successful title launches.

However, taking this approach also presents several challenges:

  1. Catching Issues Ahead of Time: Logging primarily addresses post-launch scenarios, as logs are generated only after titles are shown to members. To detect issues proactively, we need to simulate traffic and predict system behavior in advance. Once artificial traffic is generated, discarding the response object and relying solely on logs becomes inefficient.
  2. Appropriate Accuracy: Comprehensive logging requires services to log both included and excluded titles, along with reasons for exclusion. This could lead to an exponential increase in logged data. Utilizing probabilistic logging methods could compromise accuracy, making it difficult to ascertain whether a title’s absence in logs is due to exclusion or random chance.
  3. SLA and Cost Considerations: Our existing online logging systems do not natively support logging at the title granularity level. While reengineering these systems to accommodate this additional axis is possible, it would entail increased costs. Additionally, the time-sensitive nature of these investigations precludes the use of cold storage, which cannot meet the stringent SLAs required.

Option 2: Observability Endpoints in Our Personalization Systems

To prioritize title launch observability, we could adopt a centralized approach. By introducing observability endpoints across all systems, we can enable real-time data flow into a dedicated microservice for title launch observability. This approach embeds observability directly into the very fabric of services managing title launches and personalization, ensuring seamless monitoring and insights. Key benefits and strategies include:

  1. Real-Time Monitoring: Observability endpoints enable real-time monitoring of system performance and title placements, allowing us to detect and address issues as they arise.
  2. Proactive Issue Detection: By simulating future traffic(an aspect we call “time travel”) and capturing system responses ahead of time, we can preemptively identify potential issues before they impact our members or the business.
  3. Enhanced Accuracy: Observability endpoints provide precise data on title inclusions and exclusions, allowing us to make accurate assertions about system behavior and title visibility. It also provides us with advanced debugability information needed to fix identified issues.
  4. Scalability and Cost Efficiency: While initial implementation required some investment, this approach ultimately offers a scalable and cost-effective solution to managing title launches at Netflix scale.

Choosing this option also comes with some tradeoffs:

  1. Significant Initial Investment: Several systems would need to create new endpoints and refactor their codebases to adopt this new method of prioritizing launches.
  2. Synchronization Risk: There would be a potential risk that these new endpoints may not accurately represent production behavior, thus necessitating conscious efforts to ensure all endpoints remain synchronized.

Up Next

By adopting a comprehensive observability strategy that includes real-time monitoring, proactive issue detection, and source of truth reconciliation, we’ve significantly enhanced our ability to ensure the successful launch and discovery of titles across Netflix, enriching the global viewing experience for our members. In the next part of this series, we’ll dive into how we achieved this, sharing key technical insights and details.

Stay tuned for a closer look at the innovation behind the scenes!


Title Launch Observability at Netflix Scale was originally published in Netflix TechBlog on Medium, where people are continuing the conversation by highlighting and responding to this story.

Enhancing Netflix Reliability with Service-Level Prioritized Load Shedding

Post Syndicated from Netflix Technology Blog original https://netflixtechblog.com/enhancing-netflix-reliability-with-service-level-prioritized-load-shedding-e735e6ce8f7d

Applying Quality of Service techniques at the application level

Anirudh Mendiratta, Kevin Wang, Joey Lynch, Javier Fernandez-Ivern, Benjamin Fedorka

Introduction

In November 2020, we introduced the concept of prioritized load shedding at the API gateway level in our blog post, Keeping Netflix Reliable Using Prioritized Load Shedding. Today, we’re excited to dive deeper into how we’ve extended this strategy to the individual service level, focusing on the video streaming control plane and data plane, to further enhance user experience and system resilience.

The Evolution of Load Shedding at Netflix

At Netflix, ensuring a seamless viewing experience for millions of users simultaneously is paramount. Our initial approach for prioritized load shedding was implemented at the Zuul API gateway layer. This system effectively manages different types of network traffic, ensuring that critical playback requests receive priority over less critical telemetry traffic.

Building on this foundation, we recognized the need to apply a similar prioritization logic deeper within our architecture, specifically at the service layer where different types of requests within the same service could be prioritized differently. The advantages of applying these techniques at the service level in addition to our edge API gateway are:

  1. Service teams can own their prioritization logic and can apply finer grained prioritization.
  2. This can be used for backend to backend communication, i.e. for services not sitting behind our edge API gateway.
  3. Services can use cloud capacity more efficiently by combining different request types into one cluster and shedding low priority requests when necessary instead of maintaining separate clusters for failure isolation.

Introducing Service-Level Prioritized Load Shedding

PlayAPI is a critical backend service on the video streaming control plane, responsible for handling device initiated manifest and license requests necessary to start playback. We categorize these requests into two types based on their criticality:

  1. User-Initiated Requests (critical): These requests are made when a user hits play and directly impact the user’s ability to start watching a show or a movie.
  2. Pre-fetch Requests (non-critical): These requests are made optimistically when a user browses content without the user hitting play, to reduce latency should the user decide to watch a particular title. A failure in only pre-fetch requests does not result in a playback failure, but slightly increases the latency between pressing play and video appearing on screen.
Netflix on Chrome making pre-fetch requests to PlayAPI while the user is browsing content

The Problem

In order to handle large traffic spikes, high backend latency, or an under-scaled backend service, PlayAPI previously used a concurrency limiter to throttle requests that would reduce the availability of both user-initiated and prefetch requests equally. This was not ideal because:

  1. Spikes in pre-fetch traffic reduced availability for user-initiated requests
  2. Increased backend latency reduced availability for user-initiated requests and pre-fetch requests equally, when the system had enough capacity to serve all user-initiated requests.

Sharding the critical and non-critical requests into separate clusters was an option, which addressed problem 1 and added failure isolation between the two types of requests, however it came with a higher compute cost. Another disadvantage of sharding is that it adds some operational overhead — engineers need to make sure CI/CD, auto-scaling, metrics, and alerts are enabled for the new cluster.

Option 1 — No isolation
Option 2 — Isolation but higher compute cost

Our Solution

We implemented a concurrency limiter within PlayAPI that prioritizes user-initiated requests over prefetch requests without physically sharding the two request handlers. This mechanism uses the partitioning functionality of the open source Netflix/concurrency-limits Java library. We create two partitions in our limiter:

  • User-Initiated Partition: Guaranteed 100% throughput.
  • Pre-fetch Partition: Utilizes only excess capacity.
Option 3 — Single cluster with prioritized load-shedding offers application-level isolation with lower compute cost. Each instance serves both types of requests and has a partition whose size adjusts dynamically to ensure that pre-fetch requests only get excess capacity. This allows user-initiated requests to “steal” pre-fetch capacity when necessary.

The partitioned limiter is configured as a pre-processing Servlet Filter that uses HTTP headers sent by devices to determine a request’s criticality, thus avoiding the need to read and parse the request body for rejected requests. This ensures that the limiter is not itself a bottleneck and can effectively reject requests while using minimal CPU. As an example, the filter can be initialized as

Filter filter = new ConcurrencyLimitServletFilter(
new ServletLimiterBuilder()
.named("playapi")
.partitionByHeader("X-Netflix.Request-Name")
.partition("user-initiated", 1.0)
.partition("pre-fetch", 0.0)
.build());

Note that in steady state, there is no throttling and the prioritization has no effect on the handling of pre-fetch requests. The prioritization mechanism only kicks in when a server is at the concurrency limit and needs to reject requests.

Testing

In order to validate that our load-shedding worked as intended, we used Failure Injection Testing to inject 2 second latency in pre-fetch calls, where the typical p99 latency for these calls is < 200 ms. The failure was injected on one baseline instance with regular load shedding and one canary instance with prioritized load shedding. Some internal services that PlayAPI calls use separate clusters for user-initiated and pre-fetch requests and run pre-fetch clusters hotter. This test case simulates a scenario where a pre-fetch cluster for a downstream service is experiencing high latency.

Baseline — Without prioritized load-shedding. Both pre-fetch and user-initiated see an equal drop in availability
Canary — With prioritized load-shedding. Only pre-fetch availability drops while user-initiated availability stays at 100%

Without prioritized load-shedding, both user-initiated and prefetch availability drop when latency is injected. However, after adding prioritized load-shedding, user-initiated requests maintain a 100% availability and only prefetch requests are throttled.

We were ready to roll this out to production and see how it performed in the wild!

Real-World Application and Results

Netflix engineers work hard to keep our systems available, and it was a while before we had a production incident that tested the efficacy of our solution. A few months after deploying prioritized load shedding, we had an infrastructure outage at Netflix that impacted streaming for many of our users. Once the outage was fixed, we got a 12x spike in pre-fetch requests per second from Android devices, presumably because there was a backlog of queued requests built up.

Spike in Android pre-fetch RPS

This could have resulted in a second outage as our systems weren’t scaled to handle this traffic spike. Did prioritized load-shedding in PlayAPI help us here?

Yes! While the availability for prefetch requests dropped as low as 20%, the availability for user-initiated requests was > 99.4% due to prioritized load-shedding.

Availability of pre-fetch and user-initiated requests

At one point we were throttling more than 50% of all requests but the availability of user-initiated requests continued to be > 99.4%.

Generic service work prioritization

Based on the success of this approach, we have created an internal library to enable services to perform prioritized load shedding based on pluggable utilization measures, with multiple priority levels.

Unlike API gateway, which needs to handle a large volume of requests with varying priorities, most microservices typically receive requests with only a few distinct priorities. To maintain consistency across different services, we have introduced four predefined priority buckets inspired by the Linux tc-prio levels:

  • CRITICAL: Affect core functionality — These will never be shed if we are not in complete failure.
  • DEGRADED: Affect user experience — These will be progressively shed as the load increases.
  • BEST_EFFORT: Do not affect the user — These will be responded to in a best effort fashion and may be shed progressively in normal operation.
  • BULK: Background work, expect these to be routinely shed.

Services can either choose the upstream client’s priority or map incoming requests to one of these priority buckets by examining various request attributes, such as HTTP headers or the request body, for more precise control. Here is an example of how services can map requests to priority buckets:

ResourceLimiterRequestPriorityProvider requestPriorityProvider() {
return contextProvider -> {
if (contextProvider.getRequest().isCritical()) {
return PriorityBucket.CRITICAL;
} else if (contextProvider.getRequest().isHighPriority()) {
return PriorityBucket.DEGRADED;
} else if (contextProvider.getRequest().isMediumPriority()) {
return PriorityBucket.BEST_EFFORT;
} else {
return PriorityBucket.BULK;
}
};
}

Generic CPU based load-shedding

Most services at Netflix autoscale on CPU utilization, so it is a natural measure of system load to tie into the prioritized load shedding framework. Once a request is mapped to a priority bucket, services can determine when to shed traffic from a particular bucket based on CPU utilization. In order to maintain the signal to autoscaling that scaling is needed, prioritized shedding only starts shedding load after hitting the target CPU utilization, and as system load increases, more critical traffic is progressively shed in an attempt to maintain user experience.

For example, if a cluster targets a 60% CPU utilization for auto-scaling, it can be configured to start shedding requests when the CPU utilization exceeds this threshold. When a traffic spike causes the cluster’s CPU utilization to significantly surpass this threshold, it will gradually shed low-priority traffic to conserve resources for high-priority traffic. This approach also allows more time for auto-scaling to add additional instances to the cluster. Once more instances are added, CPU utilization will decrease, and low-priority traffic will resume being served normally.

Percentage of requests (Y-axis) being load-shed based on CPU utilization (X-axis) for different priority buckets

Experiments with CPU based load-shedding

We ran a series of experiments sending a large request volume at a service which normally targets 45% CPU for auto scaling but which was prevented from scaling up for the purpose of monitoring CPU load shedding under extreme load conditions. The instances were configured to shed noncritical traffic after 60% CPU and critical traffic after 80%.

As RPS was dialed up past 6x the autoscale volume, the service was able to shed first noncritical and then critical requests. Latency remained within reasonable limits throughout, and successful RPS throughput remained stable.

Experimental behavior of CPU based load-shedding using synthetic traffic.
P99 latency stayed within a reasonable range throughout the experiment, even as RPS surpassed 6x the autoscale target.

Anti-patterns with load-shedding

Anti-pattern 1 — No shedding

In the above graphs, the limiter does a good job keeping latency low for the successful requests. If there was no shedding here, we’d see latency increase for all requests, instead of a fast failure in some requests that can be retried. Further, this can result in a death spiral where one instance becomes unhealthy, resulting in more load on other instances, resulting in all instances becoming unhealthy before auto-scaling can kick in.

No load-shedding: In the absence of load-shedding, increased latency can degrade all requests instead of rejecting some requests (that can be retried), and can make instances unhealthy

Anti-pattern 2 — Congestive failure

Another anti-pattern to watch out for is congestive failure or shedding too aggressively. If the load-shedding is due to an increase in traffic, the successful RPS should not drop after load-shedding. Here is an example of what congestive failure looks like:

Congestive failure: After 16:57, the service starts rejecting most requests and is not able to sustain a successful 240 RPS that it was before load-shedding kicked in. This can be seen in fixed concurrency limiters or when load-shedding consumes too much CPU preventing any other work from being done

We can see in the Experiments with CPU based load-shedding section above that our load-shedding implementation avoids both these anti-patterns by keeping latency low and sustaining as much successful RPS during load-shedding as before.

Generic IO based load-shedding

Some services are not CPU-bound but instead are IO-bound by backing services or datastores that can apply back pressure via increased latency when they are overloaded either in compute or in storage capacity. For these services we re-use the prioritized load shedding techniques, but we introduce new utilization measures to feed into the shedding logic. Our initial implementation supports two forms of latency based shedding in addition to standard adaptive concurrency limiters (themselves a measure of average latency):

  1. The service can specify per-endpoint target and maximum latencies, which allow the service to shed when the service is abnormally slow regardless of backend.
  2. The Netflix storage services running on the Data Gateway return observed storage target and max latency SLO utilization, allowing services to shed when they overload their allocated storage capacity.

These utilization measures provide early warning signs that a service is generating too much load to a backend, and allow it to shed low priority work before it overwhelms that backend. The main advantage of these techniques over concurrency limits alone is they require less tuning as our services already must maintain tight latency service-level-objectives (SLOs), for example a p50 < 10ms and p100 < 500ms. So, rephrasing these existing SLOs as utilizations allows us to shed low priority work early to prevent further latency impact to high priority work. At the same time, the system will accept as much work as it can while maintaining SLO’s.

To create these utilization measures, we count how many requests are processed slower than our target and maximum latency objectives, and emit the percentage of requests failing to meet those latency goals. For example, our KeyValue storage service offers a 10ms target with 500ms max latency for each namespace, and all clients receive utilization measures per data namespace to feed into their prioritized load shedding. These measures look like:

utilization(namespace) = {
overall = 12
latency = {
slo_target = 12,
slo_max = 0
}
system = {
storage = 17,
compute = 10,
}
}

In this case, 12% of requests are slower than the 10ms target, 0% are slower than the 500ms max latency (timeout), and 17% of allocated storage is utilized. Different use cases consult different utilizations in their prioritized shedding, for example batches that write data daily may get shed when system storage utilization is approaching capacity as writing more data would create further instability.

An example where the latency utilization is useful is for one of our critical file origin services which accepts writes of new files in the AWS cloud and acts as an origin (serves reads) for those files to our Open Connect CDN infrastructure. Writes are the most critical and should never be shed by the service, but when the backing datastore is getting overloaded, it is reasonable to progressively shed reads to files which are less critical to the CDN as it can retry those reads and they do not affect the product experience.

To achieve this goal, the origin service configured a KeyValue latency based limiter that starts shedding reads to files which are less critical to the CDN when the datastore reports a target latency utilization exceeding 40%. We then stress tested the system by generating over 50Gbps of read traffic, some of it to high priority files and some of it to low priority files:

In this test, there are a nominal number of critical writes and a high number of reads to both low and high priority files. In the top-left graph we ramp to 2000 read/second of ~4MiB files until we can trigger overload of the backend store at over 50Gbps in the top-center graph. When that happens, the top-right graph shows that even under significant load, the origin only sheds low priority read work to preserve high-priority writes and reads. Before this change when we hit breaking points, critical writes and reads would fail along with low priority reads. During this test the CPU load of the file serving service was nominal (<10%), so in this case only IO based limiters are able to protect the system. It is also important to note that the origin will serve more traffic as long as the backing datastore continues accepting it with low latency, preventing the problems we had with concurrency limits in the past where they would either shed too early when nothing was actually wrong or too late when we had entered congestive failure.

Conclusion and Future Directions

The implementation of service-level prioritized load shedding has proven to be a significant step forward in maintaining high availability and excellent user experience for Netflix customers, even during unexpected system stress.

Stay tuned for more updates as we innovate to keep your favorite shows streaming smoothly, no matter what SLO busters lie in wait.

Acknowledgements

We would like to acknowledge the many members of the Netflix consumer product, platform, and open connect teams who have designed, implemented, and tested these prioritization techniques. In particular: Xiaomei Liu, Raj Ummadisetty, Shyam Gala, Justin Guerra, William Schor, Tony Ghita et al.


Enhancing Netflix Reliability with Service-Level Prioritized Load Shedding was originally published in Netflix TechBlog on Medium, where people are continuing the conversation by highlighting and responding to this story.

Round 2: A Survey of Causal Inference Applications at Netflix

Post Syndicated from Netflix Technology Blog original https://netflixtechblog.com/round-2-a-survey-of-causal-inference-applications-at-netflix-fd78328ee0bb

At Netflix, we want to ensure that every current and future member finds content that thrills them today and excites them to come back for more. Causal inference is an essential part of the value that Data Science and Engineering adds towards this mission. We rely heavily on both experimentation and quasi-experimentation to help our teams make the best decisions for growing member joy.

Building off of our last successful Causal Inference and Experimentation Summit, we held another week-long internal conference this year to learn from our stunning colleagues. We brought together speakers from across the business to learn about methodological developments and innovative applications.

We covered a wide range of topics and are excited to share five talks from that conference with you in this post. This will give you a behind the scenes look at some of the causal inference research happening at Netflix!

Metrics Projection for Growth A/B Tests

Mihir Tendulkar, Simon Ejdemyr, Dhevi Rajendran, David Hubbard, Arushi Tomar, Steve Beckett, Judit Lantos, Cody Chapman, Ayal Chen-Zion, Apoorva Lal, Ekrem Kocaguneli, Kyoko Shimada

Experimentation is in Netflix’s DNA. When we launch a new product feature, we use — where possible — A/B test results to estimate the annualized incremental impact on the business.

Historically, that estimate has come from our Finance, Strategy, & Analytics (FS&A) partners. For each test cell in an experiment, they manually forecast signups, retention probabilities, and cumulative revenue on a one year horizon, using monthly cohorts. The process can be repetitive and time consuming.

We decided to build out a faster, automated approach that boils down to estimating two pieces of missing data. When we run an A/B test, we might allocate users for one month, and monitor results for only two billing periods. In this simplified example, we have one member cohort, and we have two billing period treatment effects (𝜏.cohort1,period1 and 𝜏.cohort1,period2, which we will shorten to 𝜏.1,1 and 𝜏.1,2, respectively).

To measure annualized impact, we need to estimate:

  1. Unobserved billing periods. For the first cohort, we don’t have treatment effects (TEs) for their third through twelfth billing periods (𝜏.1,j , where j = 3…12).
  2. Unobserved sign up cohorts. We only observed one monthly signup cohort, and there are eleven more cohorts in a year. We need to know both the size of these cohorts, and their TEs (𝜏.i,j, where i = 2…12 and j = 1…12).

For the first piece of missing data, we used a surrogate index approach. We make a standard assumption that the causal path from the treatment to the outcome (in this case, Revenue) goes through the surrogate of retention. We leverage our proprietary Retention Model and short-term observations — in the above example, 𝜏.1,2 — to estimate 𝜏.1,j , where j = 3…12.

For the second piece of missing data, we assume transportability: that each subsequent cohort’s billing-period TE is the same as the first cohort’s TE. Note that if you have long-running A/B tests, this is a testable assumption!

Fig. 1: Monthly cohort-based activity as measured in an A/B test. In green, we show the allocation window throughout January, while blue represents the January cohort’s observation window. From this, we can directly observe 𝜏.1 and 𝜏.2, and we can project later 𝜏.j forward using the surrogate-based approach. We can transport values from observed cohorts to unobserved cohorts.

Now, we can put the pieces together. For the first cohort, we project TEs forward. For unobserved cohorts, we transport the TEs from the first cohort and collapse our notation to remove the cohort index: 𝜏.1,1 is now written as just 𝜏.1. We estimate the annualized impact by summing the values from each cohort.

We empirically validated our results from this method by comparing to long-running AB tests and prior results from our FS&A partners. Now we can provide quicker and more accurate estimates of the longer term value our product features are delivering to members.

A Systematic Framework for Evaluating Game Events

Claire Willeck, Yimeng Tang

In Netflix Games DSE, we are asked many causal inference questions after an intervention has been implemented. For example, how did a product change impact a game’s performance? Or how did a player acquisition campaign impact a key metric?

While we would ideally conduct AB tests to measure the impact of an intervention, it is not always practical to do so. In the first scenario above, A/B tests were not planned before the intervention’s launch, so we needed to use observational causal inference to assess its effectiveness. In the second scenario, the campaign is at the country level, meaning everyone in the country is in the treatment group, which makes traditional A/B tests inviable.

To evaluate the impacts of various game events and updates and to help our team scale, we designed a framework and package around variations of synthetic control.

For most questions in Games, we have game-level or country-level interventions and relatively little data. This means most pre-existing packages that rely on time-series forecasting, unit-level data, or instrumental variables are not useful.

Our framework utilizes a variety of synthetic control (SC) models, including Augmented SC, Robust SC, Penalized SC, and synthetic difference-in-differences, since different approaches can work best in different cases. We utilize a scale-free metric to evaluate the performance of each model and select the one that minimizes pre-treatment bias. Additionally, we conduct robustness tests like backdating and apply inference measures based on the number of control units.

Fig. 2: Example of Augmented Synthetic Control model used to reduce pre-treatment bias by fitting the model in the training period and evaluating performance in the validation period. In this example, the Augmented Synthetic Control model reduced the pre-treatment bias in the validation period more than the other synthetic control variations.

This framework and package allows our team, and other teams, to tackle a broad set of causal inference questions using a consistent approach.

Double Machine Learning for Weighing Metrics Tradeoffs

Apoorva Lal, Winston Chou, Jordan Schafer

As Netflix expands into new business verticals, we’re increasingly seeing examples of metric tradeoffs in A/B tests — for example, an increase in games metrics may occur alongside a decrease in streaming metrics. To help decision-makers navigate scenarios where metrics disagree, we developed a method to compare the relative importance of different metrics (viewed as “treatments”) in terms of their causal effect on the north-star metric (Retention) using Double Machine Learning (DML).

In our first pass at this problem, we found that ranking treatments according to their Average Treatment Effects using DML with a Partially Linear Model (PLM) could yield an incorrect ranking when treatments have different marginal distributions. The PLM ranking would be correct if treatment effects were constant and additive. However, when treatment effects are heterogeneous, PLM upweights the effects for members whose treatment values are most unpredictable. This is problematic for comparing treatments with different baselines.

Instead, we discretized each treatment into bins and fit a multiclass propensity score model. This lets us estimate multiple Average Treatment Effects (ATEs) using Augmented Inverse-Propensity-Weighting (AIPW) to reflect different treatment contrasts, for example the effect of low versus high exposure.

We then weight these treatment effects by the baseline distribution. This yields an “apples-to-apples” ranking of treatments based on their ATE on the same overall population.

Fig. 3: Comparison of PLMs vs. AIPW in estimating treatment effects. Because PLMs do not estimate average treatment effects when effects are heterogeneous, they do not rank metrics by their Average Treatment Effects, whereas AIPW does.

In the example above, we see that PLM ranks Treatment 1 above Treatment 2, while AIPW correctly ranks the treatments in order of their ATEs. This is because PLM upweights the Conditional Average Treatment Effect for units that have more unpredictable treatment assignment (in this example, the group defined by x = 1), whereas AIPW targets the ATE.

Survey AB Tests with Heterogeneous Non-Response Bias

Andreas Aristidou, Carolyn Chu

To improve the quality and reach of Netflix’s survey research, we leverage a research-on-research program that utilizes tools such as survey AB tests. Such experiments allow us to directly test and validate new ideas like providing incentives for survey completion, varying the invitation’s subject-line, message design, time-of-day to send, and many other things.

In our experimentation program we investigate treatment effects on not only primary success metrics, but also on guardrail metrics. A challenge we face is that, in many of our tests, the intervention (e.g. providing higher incentives) and success metrics (e.g. percent of invited members who begin the survey) are upstream of guardrail metrics such as answers to specific questions designed to measure data quality (e.g. survey straightlining).

In such a case, the intervention may (and, in fact, we expect it to) distort upstream metrics (especially sample mix), the balance of which is a necessary component for the identification of our downstream guardrail metrics. This is a consequence of non-response bias, a common external validity concern with surveys that impacts how generalizable the results can be.

For example, if one group of members — group X — responds to our survey invitations at a significantly lower rate than another group — group Y — , then average treatment effects will be skewed towards the behavior of group Y. Further, in a survey AB test, the type of non-response bias can differ between control and treatment groups (e.g. different groups of members may be over/under represented in different cells of the test), thus threatening the internal validity of our test by introducing a covariate imbalance. We call this combination heterogeneous non-response bias.

To overcome this identification problem and investigate treatment effects on downstream metrics, we leverage a combination of several techniques. First, we look at conditional average treatment effects (CATE) for particular sub-populations of interest where confounding covariates are balanced in each strata.

In order to examine the average treatment effects, we leverage a combination of propensity scores to correct for internal validity issues and iterative proportional fitting to correct for external validity issues. With these techniques, we can ensure that our surveys are of the highest quality and that they accurately represent our members’ opinions, thus helping us build products that they want to see.

Design: The Intersection of Humans and Technology

Rina Chang

A design talk at a causal inference conference? Why, yes! Because design is about how a product works, it is fundamentally interwoven into the experimentation platform at Netflix. Our product serves the huge variety of internal users at Netflix who run — and consume the results of — A/B tests. Thus, choosing how to enable our users to take action and how we present data in the product is critical to decision-making via experimentation.

If you were to display some numbers and text, you might opt to show it in a tabular format.

While there is nothing inherently wrong with this presentation, it is not as easily digested as something more visual.

If your goal is to illustrate that those three numbers add up to 100%, and thus are parts of a whole, then you might choose a pie chart.

If you wanted to show how these three numbers combine to illustrate progress toward a goal, then you might choose a stacked bar chart.

Alternatively, if your goal was to compare these three numbers against each other, then you might choose a bar chart instead.

All of these show the same information, but the choice of presentation changes how easily a consumer of an infographic understands the “so what?” of the point you’re trying to convey. Note that there is no “right” solution here; rather, it depends on the desired takeaway.

Thoughtful design applies not only to static representations of data, but also to interactive experiences. In this example, a single item within a long form could be represented by having a pre-filled value.

Alternatively, the same functionality could be achieved by displaying a default value in text, with the ability to edit it.

While functionally equivalent, this UI change shifts the user’s narrative from “Is this value correct?” to “Do I need to do something that is not ‘normal’?” — which is a much easier question to answer. Zooming out even more, thoughtful design addresses product-level choices like if a person knows where to go to accomplish a task. In general, thoughtful design influences product strategy.

Design permeates all aspects of our experimentation product at Netflix, from small choices like color to strategic choices like our roadmap. By thoughtfully approaching design, we can ensure that tools help the team learn the most from our experiments.

External Speaker: Kosuke Imai

In addition to the amazing talks by Netflix employees, we also had the privilege of hearing from Kosuke Imai, Professor of Government and Statistics at Harvard, who delivered our keynote talk. He introduced the “cram method,” a powerful and efficient approach to learning and evaluating treatment policies using generic machine learning algorithms.

Measuring causality is a large part of the data science culture at Netflix, and we are proud to have many stunning colleagues who leverage both experimentation and quasi-experimentation to drive member impact. The conference was a great way to celebrate each other’s work and highlight the ways in which causal methodology can create value for the business.

To stay up to date on our work, follow the Netflix Tech Blog, and if you are interested in joining us, we are currently looking for new stunning colleagues to help us entertain the world!


Round 2: A Survey of Causal Inference Applications at Netflix was originally published in Netflix TechBlog on Medium, where people are continuing the conversation by highlighting and responding to this story.

The Making of VES: the Cosmos Microservice for Netflix Video Encoding

Post Syndicated from Netflix Technology Blog original https://netflixtechblog.com/the-making-of-ves-the-cosmos-microservice-for-netflix-video-encoding-946b9b3cd300

Liwei Guo, Vinicius Carvalho, Anush Moorthy, Aditya Mavlankar, Lishan Zhu

This is the second post in a multi-part series from Netflix. See here for Part 1 which provides an overview of our efforts in rebuilding the Netflix video processing pipeline with microservices. This blog dives into the details of building our Video Encoding Service (VES), and shares our learnings.

Cosmos is the next generation media computing platform at Netflix. Combining microservice architecture with asynchronous workflows and serverless functions, Cosmos aims to modernize Netflix’s media processing pipelines with improved flexibility, efficiency, and developer productivity. In the past few years, the video team within Encoding Technologies (ET) has been working on rebuilding the entire video pipeline on Cosmos.

This new pipeline is composed of a number of microservices, each dedicated to a single functionality. One such microservice is Video Encoding Service (VES). Encoding is an essential component of the video pipeline. At a high level, it takes an ingested mezzanine and encodes it into a video stream that is suitable for Netflix streaming or serves some studio/production use case. In the case of Netflix, there are a number of requirements for this service:

  • Given the wide range of devices from mobile phones to browsers to Smart TVs, multiple codec formats, resolutions, and quality levels need to be supported.
  • Chunked encoding is a must to meet the latency requirements of our business needs, and use cases with different levels of latency sensitivity need to be accommodated.
  • The capability of continuous release is crucial for enabling fast product innovation in both streaming and studio spaces.
  • There is a huge volume of encoding jobs every day. The service needs to be cost-efficient and make the most use of available resources.

In this tech blog, we will walk through how we built VES to achieve the above goals and will share a number of lessons we learned from building microservices. Please note that for simplicity, we have chosen to omit certain Netflix-specific details that are not integral to the primary message of this blog post.

Building Video Encoding Service on Cosmos

A Cosmos microservice consists of three layers: an API layer (Optimus) that takes in requests, a workflow layer (Plato) that orchestrates the media processing flows, and a serverless computing layer (Stratum) that processes the media. These three layers communicate asynchronously through a home-grown, priority-based messaging system called Timestone. We chose Protobuf as the payload format for its high efficiency and mature cross-platform support.

To help service developers get a head start, the Cosmos platform provides a powerful service generator. This generator features an intuitive UI. With a few clicks, it creates a basic yet complete Cosmos service: code repositories for all 3 layers are created; all platform capabilities, including discovery, logging, tracing, etc., are enabled; release pipelines are set up and dashboards are readily accessible. We can immediately start adding video encoding logic and deploy the service to the cloud for experimentation.

Optimus

As the API layer, Optimus serves as the gateway into VES, meaning service users can only interact with VES through Optimus. The defined API interface is a strong contract between VES and the external world. As long as the API is stable, users are shielded from internal changes in VES. This decoupling is instrumental in enabling faster iterations of VES internals.

As a single-purpose service, the API of VES is quite clean. We defined an endpoint encodeVideo that takes an EncodeRequest and returns an EncodeResponse (in an async way through Timestone messages). The EncodeRequest object contains information about the source video as well as the encoding recipe. All the requirements of the encoded video (codec, resolution, etc.) as well as the controls for latency (chunking directives) are exposed through the data model of the encoding recipe.

//protobuf definition 

message EncodeRequest {
VideoSource video_source = 1;//source to be encoded
Recipe recipe = 2; //including encoding format, resolution, etc.
}

message EncodeResponse {
OutputVideo output_video = 1; //encoded video
Error error = 2; //error message (optional)
}

message Recipe {
Codec codec = 1; //including codec format, profile, level, etc.
Resolution resolution = 2;
ChunkingDirectives chunking_directives = 3;
...
}

Like any other Cosmos service, the platform automatically generates an RPC client based on the VES API data model, which users can use to build the request and invoke VES. Once an incoming request is received, Optimus performs validations, and (when applicable) converts the incoming data into an internal data model before passing it to the next layer, Plato.

Like any other Cosmos service, the platform automatically generates an RPC client based on the VES API data model, which users can use to build the request and invoke VES. Once an incoming request is received, Optimus performs validations, and (when applicable) converts the incoming data into an internal data model before passing it to the next layer, Plato.

Plato

The workflow layer, Plato, governs the media processing steps. The Cosmos platform supports two programming paradigms for Plato: forward chaining rule engine and Directed Acyclic Graph (DAG). VES has a linear workflow, so we chose DAG for its simplicity.

In a DAG, the workflow is represented by nodes and edges. Nodes represent stages in the workflow, while edges signify dependencies — a stage is only ready to execute when all its dependencies have been completed. VES requires parallel encoding of video chunks to meet its latency and resilience goals. This workflow-level parallelism is facilitated by the DAG through a MapReduce mode. Nodes can be annotated to indicate this relationship, and a Reduce node will only be triggered when all its associated Map nodes are ready.

For the VES workflow, we defined five Nodes and their associated edges, which are visualized in the following graph:

  • Splitter Node: This node divides the video into chunks based on the chunking directives in the recipe.
  • Encoder Node: This node encodes a video chunk. It is a Map node.
  • Assembler Node: This node stitches the encoded chunks together. It is a Reduce node.
  • Validator Node: This node performs the validation of the encoded video.
  • Notifier Node: This node notifies the API layer once the entire workflow is completed.

In this workflow, nodes such as the Notifier perform very lightweight operations and can be directly executed in the Plato runtime. However, resource-intensive operations need to be delegated to the computing layer (Stratum), or another service. Plato invokes Stratum functions for tasks such as encoding and assembling, where the nodes (Encoder and Assembler) post messages to the corresponding message queues. The Validator node calls another Cosmos service, the Video Validation Service, to validate the assembled encoded video.

Stratum

The computing layer, Stratum, is where media samples can be accessed. Developers of Cosmos services create Stratum Functions to process the media. They can bring their own media processing tools, which are packaged into Docker images of the Functions. These Docker images are then published to our internal Docker registry, part of Titus. In production, Titus automatically scales instances based on the depths of job queues.

VES needs to support encoding source videos into a variety of codec formats, including AVC, AV1, and VP9, to name a few. We use different encoder binaries (referred to simply as “encoders”) for different codec formats. For AVC, a format that is now 20 years old, the encoder is quite stable. On the other hand, the newest addition to Netflix streaming, AV1, is continuously going through active improvements and experimentations, necessitating more frequent encoder upgrades. ​​To effectively manage this variability, we decided to create multiple Stratum Functions, each dedicated to a specific codec format and can be released independently. This approach ensures that upgrading one encoder will not impact the VES service for other codec formats, maintaining stability and performance across the board.

Within the Stratum Function, the Cosmos platform provides abstractions for common media access patterns. Regardless of file formats, sources are uniformly presented as locally mounted frames. Similarly, for output that needs to be persisted in the cloud, the platform presents the process as writing to a local file. All details, such as streaming of bytes and retrying on errors, are abstracted away. With the platform taking care of the complexity of the infrastructure, the essential code for video encoding in the Stratum Function could be as simple as follows.

ffmpeg -i input/source%08d.j2k -vf ... -c:v libx264 ... output/encoding.264

Encoding is a resource-intensive process, and the resources required are closely related to the codec format and the encoding recipe. We conducted benchmarking to understand the resource usage pattern, particularly CPU and RAM, for different encoding recipes. Based on the results, we leveraged the “container shaping” feature from the Cosmos platform.

We defined a number of different “container shapes”, specifying the allocations of resources like CPU and RAM.

# an example definition of container shape
group: containerShapeExample1
resources:
numCpus: 2
memoryInMB: 4000
networkInMbp: 750
diskSizeInMB: 12000

Routing rules are created to assign encoding jobs to different shapes based on the combination of codec format and encoding resolution. This helps the platform perform “bin packing”, thereby maximizing resource utilization.

An example of “bin-packing”. The circles represent CPU cores and the area represents the RAM. This 16-core EC2 instance is packed with 5 encoding containers (rectangles) of 3 different shapes (indicated by different colors).

Continuous Release

After we completed the development and testing of all three layers, VES was launched in production. However, this did not mark the end of our work. Quite the contrary, we believed and still do that a significant part of a service’s value is realized through iterations: supporting new business needs, enhancing performance, and improving resilience. An important piece of our vision was for Cosmos services to have the ability to continuously release code changes to production in a safe manner.

Focusing on a single functionality, code changes pertaining to a single feature addition in VES are generally small and cohesive, making them easy to review. Since callers can only interact with VES through its API, internal code is truly “implementation details” that are safe to change. The explicit API contract limits the test surface of VES. Additionally, the Cosmos platform provides a pyramid-based testing framework to guide developers in creating tests at different levels.

After testing and code review, changes are merged and are ready for release. The release pipeline is fully automated: after the merge, the pipeline checks out code, compiles, builds, runs unit/integration/end-to-end tests as prescribed, and proceeds to full deployment if no issues are encountered. Typically, it takes around 30 minutes from code merge to feature landing (a process that took 2–4 weeks in our previous generation platform!). The short release cycle provides faster feedback to developers and helps them make necessary updates while the context is still fresh.

Screenshot of a release pipeline run in our production environment

When running in production, the service constantly emits metrics and logs. They are collected by the platform to visualize dashboards and to drive monitoring/alerting systems. Metrics deviating too much from the baseline will trigger alerts and can lead to automatic service rollback (when the “canary” feature is enabled).

The Learnings:

VES was the very first microservice that our team built. We started with basic knowledge of microservices and learned a multitude of lessons along the way. These learnings deepened our understanding of microservices and have helped us improve our design choices and decisions.

Define a Proper Service Scope

A principle of microservice architecture is that a service should be built for a single functionality. This sounds straightforward, but what exactly qualifies a “single functionality”? “Encoding video” sounds good but wouldn’t “encode video into the AVC format” be an even more specific single-functionality?

When we started building the VES, we took the approach of creating a separate encoding service for each codec format. While this has advantages such as decoupled workflows, quickly we were overwhelmed by the development overhead. Imagine that a user requested us to add the watermarking capability to the encoding. We needed to make changes to multiple microservices. What is worse, changes in all these services are very similar and essentially we are adding the same code (and tests) again and again. Such kind of repetitive work can easily wear out developers.

The service presented in this blog is our second iteration of VES (yes, we already went through one iteration). In this version, we consolidated encodings for different codec formats into a single service. They share the same API and workflow, while each codec format has its own Stratum Functions. So far this seems to strike a good balance: the common API and workflow reduces code repetition, while separate Stratum Functions guarantee independent evolution of each codec format.

The changes we made are not irreversible. If someday in the future, the encoding of one particular codec format evolves into a totally different workflow, we have the option to spin it off into its own microservice.

Be Pragmatic about Data Modeling

In the beginning, we were very strict about data model separation — we had a strong belief that sharing equates to coupling, and coupling could lead to potential disasters in the future. To avoid this, for each service as well as the three layers within a service, we defined its own data model and built converters to translate between different data models.

We ended up creating multiple data models for aspects such as bit-depth and resolution across our system. To be fair, this does have some merits. For example, our encoding pipeline supports different bit-depths for AVC encoding (8-bit) and AV1 encoding (10-bit). By defining both AVC.BitDepth and AV1.BitDepth, constraints on the bit-depth can be built into the data models. However, it is debatable whether the benefits of this differentiation power outweigh the downsides, namely multiple data model translations.

Eventually, we created a library to host data models for common concepts in the video domain. Examples of such concepts include frame rate, scan type, color space, etc. As you can see, they are extremely common and stable. This “common” data model library is shared across all services owned by the video team, avoiding unnecessary duplications and data conversions. Within each service, additional data models are defined for service-specific objects.

Embrace Service API Changes

This may sound contradictory. We have been saying that an API is a strong contract between the service and its users, and keeping an API stable shields users from internal changes. This is absolutely true. However, none of us had a crystal ball when we were designing the very first version of the service API. It is inevitable that at a certain point, this API becomes inadequate. If we hold the belief that “the API cannot change” too dearly, developers would be forced to find workarounds, which are almost certainly sub-optimal.

There are many great tech articles about gracefully evolving API. We believe we also have a unique advantage: VES is a service internal to Netflix Encoding Technologies (ET). Our two users, the Streaming Workflow Orchestrator and the Studio Workflow Orchestrator, are owned by the workflow team within ET. Our teams share the same contexts and work towards common goals. If we believe updating API is in the best interest of Netflix, we meet with them to seek alignment. Once a consensus to update the API is reached, teams collaborate to ensure a smooth transition.

Stay Tuned…

This is the second part of our tech blog series Rebuilding Netflix Video Pipeline with Microservices. In this post, we described the building process of the Video Encoding Service (VES) in detail as well as our learnings. Our pipeline includes a few other services that we plan to share about as well. Stay tuned for our future blogs on this topic of microservices!


The Making of VES: the Cosmos Microservice for Netflix Video Encoding was originally published in Netflix TechBlog on Medium, where people are continuing the conversation by highlighting and responding to this story.

Introducing SafeTest: A Novel Approach to Front End Testing

Post Syndicated from Netflix Technology Blog original https://netflixtechblog.com/introducing-safetest-a-novel-approach-to-front-end-testing-37f9f88c152d

by Moshe Kolodny

In this post, we’re excited to introduce SafeTest, a revolutionary library that offers a fresh perspective on End-To-End (E2E) tests for web-based User Interface (UI) applications.

The Challenges of Traditional UI Testing

Traditionally, UI tests have been conducted through either unit testing or integration testing (also referred to as End-To-End (E2E) testing). However, each of these methods presents a unique trade-off: you have to choose between controlling the test fixture and setup, or controlling the test driver.

For instance, when using react-testing-library, a unit testing solution, you maintain complete control over what to render and how the underlying services and imports should behave. However, you lose the ability to interact with an actual page, which can lead to a myriad of pain points:

  • Difficulty in interacting with complex UI elements like <Dropdown /> components.
  • Inability to test CORS setup or GraphQL calls.
  • Lack of visibility into z-index issues affecting click-ability of buttons.
  • Complex and unintuitive authoring and debugging of tests.

Conversely, using integration testing tools like Cypress or Playwright provides control over the page, but sacrifices the ability to instrument the bootstrapping code for the app. These tools operate by remotely controlling a browser to visit a URL and interact with the page. This approach has its own set of challenges:

  • Difficulty in making calls to an alternative API endpoint without implementing custom network layer API rewrite rules.
  • Inability to make assertions on spies/mocks or execute code within the app.
  • Testing something like dark mode entails clicking the theme switcher or knowing the localStorage mechanism to override.
  • Inability to test segments of the app, for example if a component is only visible after clicking a button and waiting for a 60 second timer to countdown, the test will need to run those actions and will be at least a minute long.

Recognizing these challenges, solutions like E2E Component Testing have emerged, with offerings from Cypress and Playwright. While these tools attempt to rectify the shortcomings of traditional integration testing methods, they have other limitations due to their architecture. They start a dev server with bootstrapping code to load the component and/or setup code you want, which limits their ability to handle complex enterprise applications that might have OAuth or a complex build pipeline. Moreover, updating TypeScript usage could break your tests until the Cypress/Playwright team updates their runner.

Welcome to SafeTest

SafeTest aims to address these issues with a novel approach to UI testing. The main idea is to have a snippet of code in our application bootstrapping stage that injects hooks to run our tests (see the How Safetest Works sections for more info on what this is doing). Note that how this works has no measurable impact on the regular usage of your app since SafeTest leverages lazy loading to dynamically load the tests only when running the tests (in the README example, the tests aren’t in the production bundle at all). Once that’s in place, we can use Playwright to run regular tests, thereby achieving the ideal browser control we want for our tests.

This approach also unlocks some exciting features:

  • Deep linking to a specific test without needing to run a node test server.
  • Two-way communication between the browser and test (node) context.
  • Access to all the DX features that come with Playwright (excluding the ones that come with @playwright/test).
  • Video recording of tests, trace viewing, and pause page functionality for trying out different page selectors/actions.
  • Ability to make assertions on spies in the browser in node, matching snapshot of the call within the browser.

Test Examples with SafeTest

SafeTest is designed to feel familiar to anyone who has conducted UI tests before, as it leverages the best parts of existing solutions. Here’s an example of how to test an entire application:

import { describe, it, expect } from 'safetest/jest';
import { render } from 'safetest/react';

describe('my app', () => {
it('loads the main page', async () => {
const { page } = await render();

await expect(page.getByText('Welcome to the app')).toBeVisible();
expect(await page.screenshot()).toMatchImageSnapshot();
});
});

We can just as easily test a specific component

import { describe, it, expect, browserMock } from 'safetest/jest';
import { render } from 'safetest/react';

describe('Header component', () => {
it('has a normal mode', async () => {
const { page } = await render(<Header />);

await expect(page.getByText('Admin')).not.toBeVisible();
});

it('has an admin mode', async () => {
const { page } = await render(<Header admin={true} />);

await expect(page.getByText('Admin')).toBeVisible();
});

it('calls the logout handler when signing out', async () => {
const spy = browserMock.fn();
const { page } = await render(<Header handleLogout={fn} />);

await page.getByText('logout').click();
expect(await spy).toHaveBeenCalledWith();
});
});

Leveraging Overrides

SafeTest utilizes React Context to allow for value overrides during tests. For an example of how this works, let’s assume we have a fetchPeople function used in a component:

import { useAsync } from 'react-use';
import { fetchPerson } from './api/person';

export const People: React.FC = () => {
const { data: people, loading, error } = useAsync(fetchPeople);

if (loading) return <Loader />;
if (error) return <ErrorPage error={error} />;
return <Table data={data} rows=[...] />;
}

We can modify the People component to use an Override:

 import { fetchPerson } from './api/person';
+import { createOverride } from 'safetest/react';

+const FetchPerson = createOverride(fetchPerson);

export const People: React.FC = () => {
+ const fetchPeople = FetchPerson.useValue();
const { data: people, loading, error } = useAsync(fetchPeople);

if (loading) return <Loader />;
if (error) return <ErrorPage error={error} />;
return <Table data={data} rows=[...] />;
}

Now, in our test, we can override the response for this call:

const pending = new Promise(r => { /* Do nothing */ });
const resolved = [{name: 'Foo', age: 23], {name: 'Bar', age: 32]}];
const error = new Error('Whoops');

describe('People', () => {
it('has a loading state', async () => {
const { page } = await render(
<FetchPerson.Override with={() => () => pending}>
<People />
</FetchPerson.Override>
);

await expect(page.getByText('Loading')).toBeVisible();
});

it('has a loaded state', async () => {
const { page } = await render(
<FetchPerson.Override with={() => async () => resolved}>
<People />
</FetchPerson.Override>
);

await expect(page.getByText('User: Foo, name: 23')).toBeVisible();
});

it('has an error state', async () => {
const { page } = await render(
<FetchPerson.Override with={() => async () => { throw error }}>
<People />
</FetchPerson.Override>
);

await expect(page.getByText('Error getting users: "Whoops"')).toBeVisible();
});
});

The render function also accepts a function that will be passed the initial app component, allowing for the injection of any desired elements anywhere in the app:

it('has a people loaded state', async () => {
const { page } = await render(app =>
<FetchPerson.Override with={() => async () => resolved}>
{app}
</FetchPerson.Override>
);
await expect(page.getByText('User: Foo, name: 23')).toBeVisible();
});

With overrides, we can write complex test cases such as ensuring a service method which combines API requests from /foo, /bar, and /baz, has the correct retry mechanism for just the failed API requests and still maps the return value correctly. So if /bar takes 3 attempts to resolve the method will make a total of 5 API calls.

Overrides aren’t limited to just API calls (since we can use also use page.route), we can also override specific app level values like feature flags or changing some static value:

+const UseFlags = createOverride(useFlags);
export const Admin = () => {
+ const useFlags = UseFlags.useValue();
const { isAdmin } = useFlags();
if (!isAdmin) return <div>Permission error</div>;
// ...
}

+const Language = createOverride(navigator.language);
export const LanguageChanger = () => {
- const language = navigator.language;
+ const language = Language.useValue();
return <div>Current language is { language } </div>;
}

describe('Admin', () => {
it('works with admin flag', async () => {
const { page } = await render(
<UseIsAdmin.Override with={oldHook => {
const oldFlags = oldHook();
return { ...oldFlags, isAdmin: true };
}}>
<MyComponent />
</UseIsAdmin.Override>
);

await expect(page.getByText('Permission error')).not.toBeVisible();
});
});

describe('Language', () => {
it('displays', async () => {
const { page } = await render(
<Language.Override with={old => 'abc'}>
<MyComponent />
</Language.Override>
);

await expect(page.getByText('Current language is abc')).toBeVisible();
});
});

Overrides are a powerful feature of SafeTest and the examples here only scratch the surface. For more information and examples, refer to the Overrides section on the README.

Reporting

SafeTest comes out of the box with powerful reporting capabilities, such as automatic linking of video replays, Playwright trace viewer, and even deep link directly to the mounted tested component. The SafeTest repo README links to all the example apps as well as the reports

Image of SafeTest report showing a video of a test run

SafeTest in Corporate Environments

Many large corporations need a form of authentication to use the app. Typically, navigating to localhost:3000 just results in a perpetually loading page. You need to go to a different port, like localhost:8000, which has a proxy server to check and/or inject auth credentials into underlying service calls. This limitation is one of the main reasons that Cypress/Playwright Component Tests aren’t suitable for use at Netflix.

However, there’s usually a service that can generate test users whose credentials we can use to log in and interact with the application. This facilitates creating a light wrapper around SafeTest to automatically generate and assume that test user. For instance, here’s basically how we do it at Netflix:

import { setup } from 'safetest/setup';
import { createTestUser, addCookies } from 'netflix-test-helper';

type Setup = Parameters<typeof setup>[0] & {
extraUserOptions?: UserOptions;
};


export const setupNetflix = (options: Setup) => {
setup({
...options,
hooks: { beforeNavigate: [async page => addCookies(page)] },
});

beforeAll(async () => {
createTestUser(options.extraUserOptions)
});
};

After setting this up, we simply import the above package in place of where we would have used safetest/setup.

Beyond React

While this post focused on how SafeTest works with React, it’s not limited to just React. SafeTest also works with Vue, Svelte, Angular, and even can run on NextJS or Gatsby. It also runs using either Jest or Vitest based on which test runner your scaffolding started you off with. The examples folder demonstrates how to use SafeTest with different tooling combinations, and we encourage contributions to add more cases.

At its core, SafeTest is an intelligent glue for a test runner, a UI library, and a browser runner. Though the most common usage at Netflix employs Jest/React/Playwright, it’s easy to add more adapters for other options.

Conclusion

SafeTest is a powerful testing framework that’s being adopted within Netflix. It allows for easy authoring of tests and provides comprehensive reports when and how any failures occurred, complete with links to view a playback video or manually run the test steps to see what broke. We’re excited to see how it will revolutionize UI testing and look forward to your feedback and contributions.


Introducing SafeTest: A Novel Approach to Front End Testing was originally published in Netflix TechBlog on Medium, where people are continuing the conversation by highlighting and responding to this story.

Rebuilding Netflix Video Processing Pipeline with Microservices

Post Syndicated from Netflix Technology Blog original https://netflixtechblog.com/rebuilding-netflix-video-processing-pipeline-with-microservices-4e5e6310e359

Liwei Guo, Anush Moorthy, Li-Heng Chen, Vinicius Carvalho, Aditya Mavlankar, Agata Opalach, Adithya Prakash, Kyle Swanson, Jessica Tweneboah, Subbu Venkatrav, Lishan Zhu

This is the first blog in a multi-part series on how Netflix rebuilt its video processing pipeline with microservices, so we can maintain our rapid pace of innovation and continuously improve the system for member streaming and studio operations. This introductory blog focuses on an overview of our journey. Future blogs will provide deeper dives into each service, sharing insights and lessons learned from this process.

The Netflix video processing pipeline went live with the launch of our streaming service in 2007. Since then, the video pipeline has undergone substantial improvements and broad expansions:

  • Starting with Standard Dynamic Range (SDR) at Standard-Definitions, we expanded the encoding pipeline to 4K and High Dynamic Range (HDR) which enabled support for our premium offering.
  • We moved from centralized linear encoding to distributed chunk-based encoding. This architecture shift greatly reduced the processing latency and increased system resiliency.
  • Moving away from the use of dedicated instances that were constrained in quantity, we tapped into Netflix’s internal trough created due to autoscaling microservices, leading to significant improvements in computation elasticity as well as resource utilization efficiency.
  • We rolled out encoding innovations such as per-title and per-shot optimizations, which provided significant quality-of-experience (QoE) improvement to Netflix members.
  • By integrating with studio content systems, we enabled the pipeline to leverage rich metadata from the creative side and create more engaging member experiences like interactive storytelling.
  • We expanded pipeline support to serve our studio/content-development use cases, which had different latency and resiliency requirements as compared to the traditional streaming use case.

Our experience of the last decade-and-a-half has reinforced our conviction that an efficient, flexible video processing pipeline that allows us to innovate and support our streaming service, as well as our studio partners, is critical to the continued success of Netflix. To that end, the Video and Image Encoding team in Encoding Technologies (ET) has spent the last few years rebuilding the video processing pipeline on our next-generation microservice-based computing platform Cosmos.

From Reloaded to Cosmos

Reloaded

Starting in 2014, we developed and operated the video processing pipeline on our third-generation platform Reloaded. Reloaded was well-architected, providing good stability, scalability, and a reasonable level of flexibility. It served as the foundation for numerous encoding innovations developed by our team.

When Reloaded was designed, we focused on a single use case: converting high-quality media files (also known as mezzanines) received from studios into compressed assets for Netflix streaming. Reloaded was created as a single monolithic system, where developers from various media teams in ET and our platform partner team Content Infrastructure and Solutions (CIS)¹ worked on the same codebase, building a single system that handled all media assets. Over the years, the system expanded to support various new use cases. This led to a significant increase in system complexity, and the limitations of Reloaded began to show:

  • Coupled functionality: Reloaded was composed of a number of worker modules and an orchestration module. The setup of a new Reloaded module and its integration with the orchestration required a non-trivial amount of effort, which led to a bias towards augmentation rather than creation when developing new functionalities. For example, in Reloaded the video quality calculation was implemented inside the video encoder module. With this implementation, it was extremely difficult to recalculate video quality without re-encoding.
  • Monolithic structure: Since Reloaded modules were often co-located in the same repository, it was easy to overlook code-isolation rules and there was quite a bit of unintended reuse of code across what should have been strong boundaries. Such reuse created tight coupling and reduced development velocity. The tight coupling among modules further forced us to deploy all modules together.
  • Long release cycles: The joint deployment meant that there was increased fear of unintended production outages as debugging and rollback can be difficult for a deployment of this size. This drove the approach of the “release train”. Every two weeks, a “snapshot” of all modules was taken, and promoted to be a “release candidate”. This release candidate then went through exhaustive testing which attempted to cover as large a surface area as possible. This testing stage took about two weeks. Thus, depending on when the code change was merged, it could take anywhere between two and four weeks to reach production.

As time progressed and functionalities grew, the rate of new feature contributions in Reloaded dropped. Several promising ideas were abandoned owing to the outsized work needed to overcome architectural limitations. The platform that had once served us well was now becoming a drag on development.

Cosmos

As a response, in 2018 the CIS and ET teams started developing the next-generation platform, Cosmos. In addition to the scalability and the stability that the developers already enjoyed in Reloaded, Cosmos aimed to significantly increase system flexibility and feature development velocity. To achieve this, Cosmos was developed as a computing platform for workflow-driven, media-centric microservices.

The microservice architecture provides strong decoupling between services. Per-microservice workflow support eases the burden of implementing complex media workflow logic. Finally, relevant abstractions allow media algorithm developers to focus on the manipulation of video and audio signals rather than on infrastructural concerns. A comprehensive list of benefits offered by Cosmos can be found in the linked blog.

Building the Video Processing Pipeline in Cosmos

Service Boundaries

In the microservice architecture, a system is composed of a number of fine-grained services, with each service focusing on a single functionality. So the first (and arguably the most important) thing is to identify boundaries and define services.

In our pipeline, as media assets travel through creation to ingest to delivery, they go through a number of processing steps such as analyses and transformations. We analyzed these processing steps to identify “boundaries” and grouped them into different domains, which in turn became the building blocks of the microservices we engineered.

As an example, in Reloaded, the video encoding module bundles 5 steps:

1. divide the input video into small chunks

2. encode each chunk independently

3. calculate the quality score (VMAF) of each chunk

4. assemble all the encoded chunks into a single encoded video

5. aggregate quality scores from all chunks

From a system perspective, the assembled encoded video is of primary concern while the internal chunking and separate chunk encodings exist in order to fulfill certain latency and resiliency requirements. Further, as alluded to above, the video quality calculation provides a totally separate functionality as compared to the encoding service.

Thus, in Cosmos, we created two independent microservices: Video Encoding Service (VES) and Video Quality Service (VQS), each of which serves a clear, decoupled function. As implementation details, the chunked encoding and the assembling were abstracted away into the VES.

Video Services

The approach outlined above was applied to the rest of the video processing pipeline to identify functionalities and hence service boundaries, leading to the creation of the following video services².

  1. Video Inspection Service (VIS): This service takes a mezzanine as the input and performs various inspections. It extracts metadata from different layers of the mezzanine for downstream services. In addition, the inspection service flags issues if invalid or unexpected metadata is observed and provides actionable feedback to the upstream team.
  2. Complexity Analysis Service (CAS): The optimal encoding recipe is highly content-dependent. This service takes a mezzanine as the input and performs analysis to understand the content complexity. It calls Video Encoding Service for pre-encoding and Video Quality Service for quality evaluation. The results are saved to a database so they can be reused.
  3. Ladder Generation Service (LGS): This service creates an entire bitrate ladder for a given encoding family (H.264, AV1, etc.). It fetches the complexity data from CAS and runs the optimization algorithm to create encoding recipes. The CAS and LGS cover much of the innovations that we have previously presented in our tech blogs (per-title, mobile encodes, per-shot, optimized 4K encoding, etc.). By wrapping ladder generation into a separate microservice (LGS), we decouple the ladder optimization algorithms from the creation and management of complexity analysis data (which resides in CAS). We expect this to give us greater freedom for experimentation and a faster rate of innovation.
  4. Video Encoding Service (VES): This service takes a mezzanine and an encoding recipe and creates an encoded video. The recipe includes the desired encoding format and properties of the output, such as resolution, bitrate, etc. The service also provides options that allow fine-tuning latency, throughput, etc., depending on the use case.
  5. Video Validation Service (VVS): This service takes an encoded video and a list of expectations about the encode. These expectations include attributes specified in the encoding recipe as well as conformance requirements from the codec specification. VVS analyzes the encoded video and compares the results against the indicated expectations. Any discrepancy is flagged in the response to alert the caller.
  6. Video Quality Service (VQS): This service takes the mezzanine and the encoded video as input, and calculates the quality score (VMAF) of the encoded video.

Service Orchestration

Each video service provides a dedicated functionality and they work together to generate the needed video assets. Currently, the two main use cases of the Netflix video pipeline are producing assets for member streaming and for studio operations. For each use case, we created a dedicated workflow orchestrator so the service orchestration can be customized to best meet the corresponding business needs.

For the streaming use case, the generated videos are deployed to our content delivery network (CDN) for Netflix members to consume. These videos can easily be watched millions of times. The Streaming Workflow Orchestrator utilizes almost all video services to create streams for an impeccable member experience. It leverages VIS to detect and reject non-conformant or low-quality mezzanines, invokes LGS for encoding recipe optimization, encodes video using VES, and calls VQS for quality measurement where the quality data is further fed to Netflix’s data pipeline for analytics and monitoring purposes. In addition to video services, the Streaming Workflow Orchestrator uses audio and timed text services to generate audio and text assets, and packaging services to “containerize” assets for streaming.

For the studio use case, some example video assets are marketing clips and daily production editorial proxies. The requests from the studio side are generally latency-sensitive. For example, someone from the production team may be waiting for the video to review so they can decide the shooting plan for the next day. Because of this, the Studio Workflow Orchestrator optimizes for fast turnaround and focuses on core media processing services. At this time, the Studio Workflow Orchestrator calls VIS to extract metadata of the ingested assets and calls VES with predefined recipes. Compared to member streaming, studio operations have different and unique requirements for video processing. Therefore, the Studio Workflow Orchestrator is the exclusive user of some encoding features like forensic watermarking and timecode/text burn-in.

Where we are now

We have had the new video pipeline running alongside Reloaded in production for a few years now. During this time, we completed the migration of all necessary functionalities from Reloaded, began gradually shifting over traffic one use case at a time, and completed the switchover in September of 2023.

While it is still early days, we have already seen the benefits of the new platform, specifically the ease of feature delivery. Notably, Netflix launched the Advertising-supported plan in November 2022. Processing Ad creatives posed some new challenges: media formats of Ads are quite different from movie and TV mezzanines that the team was familiar with, and there was a new set of media processing requirements related to the business needs of Ads. With the modularity and developer productivity benefits of Cosmos, we were able to quickly iterate the pipeline to keep up with the changing requirements and support a successful product launch.

Summary

Rebuilding the video pipeline was a huge undertaking for the team. We are very proud of what we have achieved, and also eager to share our journey with the technical community. This blog has focused on providing an overview: a brief history of our pipeline and the platforms, why the rebuilding was necessary, what these new services look like, and how they are being used for Netflix businesses. In the next blog, we are going to delve into the details of the Video Encoding Service (VES), explaining step-by-step the service creation, and sharing lessons learned (we have A LOT!). We also plan to cover other video services in future tech blogs. Follow the Netflix Tech Blog to stay up to date.

Acknowledgments

A big shout out to the CIS team for their outstanding work in building the Cosmos platform and their receptiveness to feedback from service developers.

We want to express our appreciation to our users, the Streaming Encoding Pipeline team, and the Video Engineering team. Just like our feedback helps iron out the platform, the feedback from our users has been instrumental in building high-quality services.

We also want to thank Christos Bampis and Zhi Li for their significant contributions to video services, and our two former team members, Chao Chen and Megha Manohara for contributing to the early development of this project.

Footnotes

  1. Formerly known as Media Cloud Engineering/MCE team.
  2. The actual number of video services is more than listed here. Some of them are Netflix-specific and thus omitted from this blog.


Rebuilding Netflix Video Processing Pipeline with Microservices was originally published in Netflix TechBlog on Medium, where people are continuing the conversation by highlighting and responding to this story.

All of Netflix’s HDR video streaming is now dynamically optimized

Post Syndicated from Netflix Technology Blog original https://netflixtechblog.com/all-of-netflixs-hdr-video-streaming-is-now-dynamically-optimized-e9e0cb15f2ba

by Aditya Mavlankar, Zhi Li, Lukáš Krasula and Christos Bampis

High dynamic range (HDR) video brings a wider range of luminance and a wider gamut of colors, paving the way for a stunning viewing experience. Separately, our invention of Dynamically Optimized (DO) encoding helps achieve optimized bitrate-quality tradeoffs depending on the complexity of the content.

HDR was launched at Netflix in 2016 and the number of titles available in HDR has been growing ever since. We were, however, missing the systematic ability to measure perceptual quality (VMAF) of HDR streams since VMAF was limited to standard dynamic range (SDR) video signals.

As noted in an earlier blog post, we began developing an HDR variant of VMAF; let’s call it HDR-VMAF. A vital aspect of such development is subjective testing with HDR encodes in order to generate training data. The pandemic, however, posed unique challenges in conducting a conventional in-lab subjective test with HDR encodes. We improvised as part of a collaborative effort with Dolby Laboratories and conducted subjective tests with 4K-HDR content using high-end OLED panels in calibrated conditions created in participants’ homes [1],[2]. Details pertaining to HDR-VMAF exceed the scope of this article and will be covered in a future blog post; for now, suffice it to say that the first version of HDR-VMAF landed internally in 2021 and we have been improving the metric ever since.

The arrival of HDR-VMAF allowed us to create HDR streams with DO applied, i.e., HDR-DO encodes. Prior to that, we were using a fixed ladder with predetermined bitrates — regardless of content characteristics — for HDR video streaming. We A/B tested HDR-DO encodes in production in Q3-Q4 2021, followed by improving the ladder generation algorithm further in early 2022. We started backfilling HDR-DO encodes for existing titles from Q2 2022. By June 2023 the entire HDR catalog was optimized. The graphic below (Fig. 1) depicts the migration of traffic from fixed bitrates to DO encodes.

Fig. 1: Migration of traffic from fixed-ladder encodes to DO encodes.

Bitrate versus quality comparison

HDR-VMAF is designed to be format-agnostic — it measures the perceptual quality of HDR video signal regardless of its container format, for example, Dolby Vision or HDR10. HDR-VMAF focuses on the signal characteristics (as a result of lossy encoding) instead of display characteristics, and thus it does not include display mapping in its pipeline. Display mapping is the specific tone mapping applied by the display based on its own characteristics — peak luminance, black level, color gamut, etc. — and based on content characteristics and/or metadata signaled in the bitstream.

Two ways that HDR10 and Dolby Vision differ are: 1) the preprocessing applied to the signal before encoding 2) the metadata informing the display mapping on different displays. So, HDR-VMAF will capture the effect of 1) but ignore the effect of 2). Display capabilities vary a lot among the heterogeneous population of devices that stream HDR content — this aspect is similar to other factors that vary session to session such as ambient lighting, viewing distance, upscaling algorithm on the device, etc. “VMAF not incorporating display mapping” implies the scores are computed for an “ideal display” that’s capable of representing the entire luminance range and the entire color gamut spanned by the video signal — thus not requiring display mapping. This background is useful to have before looking at rate vs quality curves pertaining to these two formats.

Shown below are rate versus quality examples for a couple of titles from our HDR catalog. We present two sets. Within each set we show curves for both Dolby Vision and HDR10. The first set (Fig. 2) corresponds to an episode from a gourmet cooking show incorporating fast-paced scenes from around the world. The second set (Fig. 3) corresponds to an episode from a relatively slower drama series; slower in terms of camera action. The optimized encodes are chosen from the convex hull formed by various rate-quality points corresponding to different bitrates, spatial resolutions and encoding recipes.

For brevity we skipped annotating ladder points with their spatial resolutions but the overall observations from our previous article on SDR-4K encode optimization apply here as well. The fixed ladder is slow in ramping up spatial resolution, so the quality stays almost flat among two successive 1080p points or two successive 4K points. On the other hand, the optimized ladder presents a sharper increase in quality with increasing bitrate.

The fixed ladder has predetermined 4K bitrates — 8, 10, 12 and 16 Mbps — it deterministically maxes out at 16 Mbps. On the other hand, the optimized ladder targets very high levels of quality on the top rung of the bitrate ladder, even at the cost of higher bitrates if the content is complex, thereby satisfying the most discerning viewers. In spite of reaching higher qualities than the fixed ladder, the HDR-DO ladder, on average, occupies only 58% of the storage space compared to fixed-bitrate ladder. This is achieved by more efficiently spacing the ladder points, especially in the high-bitrate region. After all, there is little to no benefit in packing multiple high-bitrate points so close to each other — for example, 3 QHD (2560×1440) points placed in the 6 to 7.5 Mbps range followed by the four 4K points at 8, 10, 12 and 16 Mbps, as was done on the fixed ladder.

Fig. 2: Rate-quality curves comparing fixed and optimized ladders corresponding to an episode from a gourmet cooking show incorporating fast-paced scenes from around the world.
Fig. 3: Rate-quality curves comparing fixed and optimized ladders corresponding to an episode from a drama series, which is slower in terms of camera action.

It is important to note that the fixed-ladder encodes had constant duration group-of-pictures (GoPs) and suffered from some inefficiency due to shot boundaries not aligning with Instantaneous Decoder Refresh (IDR) frames. The DO encodes are shot-based and so the IDR frames align with shot boundaries. For a given rate-quality operating point, the DO process helps allocate bits among the various shots while maximizing an overall objective function. Also thanks to the DO framework, within a given rate-quality operating point, challenging shots can and do burst in bitrate up to the codec level limit associated with that point.

Member benefits

We A/B tested the fixed and optimized ladders; first and foremost to make sure that devices in the field can handle the new streams and serving new streams doesn’t cause unintended playback issues. A/B testing also allows us to get a read on the improvement in quality of experience (QoE). Overall, the improvements can be summarized as:

  • 40% fewer rebuffers
  • Higher video quality for both bandwidth-constrained as well as unconstrained sessions
  • Lower initial bitrate
  • Higher initial quality
  • Lower play delay
  • Less variation in delivered video quality
  • Lower Internet data usage, especially on mobiles and tablets

Will HDR-VMAF be open-source?

Yes, we are committed to supporting the open-source community. The current implementation, however, is largely tailored to our internal pipelines. We are working to ensure it is versatile, stable, and easy-to-use for the community. Additionally, the current version has some algorithmic limitations that we are in the process of improving before the official release. When we do release it, HDR-VMAF will have higher accuracy in perceptual quality prediction, and be easier to use “out of the box”.

Summary

Thanks to the arrival of HDR-VMAF, we were able to optimize our HDR encodes. Fixed-ladder HDR encodes have been fully replaced by optimized ones, reducing storage footprint and Internet data usage — and most importantly, improving the video quality for our members. Improvements have been seen across all device categories ranging from TVs to mobiles and tablets.

Acknowledgments

We thank all the volunteers who participated in the subjective experiments. We also want to acknowledge the contributions of our colleagues from Dolby, namely Anustup Kumar Choudhury, Scott Daly, Robin Atkins, Ludovic Malfait, and Suzanne Farrell, who helped with preparations and conducting of the subjective tests.

We thank Matthew Donato, Adithya Prakash, Rich Gerber, Joe Drago, Benbuck Nason and Joseph McCormick for all the interesting discussions on HDR video.

We thank various internal teams at Netflix for the crucial roles they play:

  • The various client device and UI engineering teams at Netflix that manage the Netflix experience on various device platforms
  • The data science and engineering teams at Netflix that help us run and analyze A/B tests; we thank Chris Pham in particular for generating various data insights for the encoding team
  • The Playback Systems team that steers the Netflix experience for every client device including the experience served in various encoding A/B tests
  • The Open Connect team that manages Netflix’s own content delivery network
  • The Content Infrastructure and Solutions team that manages the compute platform that enables us to execute video encoding at scale
  • The Streaming Encoding Pipeline team that helps us orchestrate the generation of various streaming assets

Find our work interesting? Join us and be a part of the amazing team that brought you this tech-blog; open positions:

References

[1] L. Krasula, A. Choudhury, S. Daly, Z. Li, R. Atkins, L. Malfait, A. Mavlankar, “Subjective video quality for 4K HDR-WCG content using a browser-based approach for “at-home” testing,” Electronic Imaging, vol. 35, pp. 263–1–8 (2023) [online]
[2] A. Choudhury, L. Krasula, S. Daly, Z. Li, R. Atkins, L. Malfait, “Testing 4K HDR-WCG professional video content for subjective quality using a remote testing approach,” SMPTE Media Technology Summit 2023


All of Netflix’s HDR video streaming is now dynamically optimized was originally published in Netflix TechBlog on Medium, where people are continuing the conversation by highlighting and responding to this story.

Migrating Critical Traffic At Scale with No Downtime — Part 2

Post Syndicated from Netflix Technology Blog original https://netflixtechblog.com/migrating-critical-traffic-at-scale-with-no-downtime-part-2-4b1c8c7155c1

Migrating Critical Traffic At Scale with No Downtime — Part 2

Shyam Gala, Javier Fernandez-Ivern, Anup Rokkam Pratap, Devang Shah

Picture yourself enthralled by the latest episode of your beloved Netflix series, delighting in an uninterrupted, high-definition streaming experience. Behind these perfect moments of entertainment is a complex mechanism, with numerous gears and cogs working in harmony. But what happens when this machinery needs a transformation? This is where large-scale system migrations come into play. Our previous blog post presented replay traffic testing — a crucial instrument in our toolkit that allows us to implement these transformations with precision and reliability.

Replay traffic testing gives us the initial foundation of validation, but as our migration process unfolds, we are met with the need for a carefully controlled migration process. A process that doesn’t just minimize risk, but also facilitates a continuous evaluation of the rollout’s impact. This blog post will delve into the techniques leveraged at Netflix to introduce these changes to production.

Sticky Canaries

Canary deployments are an effective mechanism for validating changes to a production backend service in a controlled and limited manner, thus mitigating the risk of unforeseen consequences that may arise due to the change. This process involves creating two new clusters for the updated service; a baseline cluster containing the current version running in production and a canary cluster containing the new version of the service. A small percentage of production traffic is redirected to the two new clusters, allowing us to monitor the new version’s performance and compare it against the current version. By collecting and analyzing key performance metrics of the service over time, we can assess the impact of the new changes and determine if they meet the availability, latency, and performance requirements.

Some product features require a lifecycle of requests between the customer device and a set of backend services to drive the feature. For instance, video playback functionality on Netflix involves requesting URLs for the streams from a service, calling the CDN to download the bits from the streams, requesting a license to decrypt the streams from a separate service, and sending telemetry indicating the successful start of playback to yet another service. By tracking metrics only at the level of service being updated, we might miss capturing deviations in broader end-to-end system functionality.

Sticky Canary is an improvement to the traditional canary process that addresses this limitation. In this variation, the canary framework creates a pool of unique customer devices and then routes traffic for this pool consistently to the canary and baseline clusters for the duration of the experiment. Apart from measuring service-level metrics, the canary framework is able to keep track of broader system operational and customer metrics across the canary pool and thereby detect regressions on the entire request lifecycle flow.

Sticky Canary

It is important to note that with sticky canaries, devices in the canary pool continue to be routed to the canary throughout the experiment, potentially resulting in undesirable behavior persisting through retries on customer devices. Therefore, the canary framework is designed to monitor operational and customer KPI metrics to detect persistent deviations and terminate the canary experiment if necessary.

Canaries and sticky canaries are valuable tools in the system migration process. Compared to replay testing, canaries allow us to extend the validation scope beyond the service level. They enable verification of the broader end-to-end system functionality across the request lifecycle for that functionality, giving us confidence that the migration will not cause any disruptions to the customer experience. Canaries also provide an opportunity to measure system performance under different load conditions, allowing us to identify and resolve any performance bottlenecks. They enable us to further fine-tune and configure the system, ensuring the new changes are integrated smoothly and seamlessly.

A/B Testing

A/B testing is a widely recognized method for verifying hypotheses through a controlled experiment. It involves dividing a portion of the population into two or more groups, each receiving a different treatment. The results are then evaluated using specific metrics to determine whether the hypothesis is valid. The industry frequently employs the technique to assess hypotheses related to product evolution and user interaction. It is also widely utilized at Netflix to test changes to product behavior and customer experience.

A/B testing is also a valuable tool for assessing significant changes to backend systems. We can determine A/B test membership in either device application or backend code and selectively invoke new code paths and services. Within the context of migrations, A/B testing enables us to limit exposure to the migrated system by enabling the new path for a smaller percentage of the member base. Thereby controlling the risk of unexpected behavior resulting from the new changes. A/B testing is also a key technique in migrations where the updates to the architecture involve changing device contracts as well.

Canary experiments are typically conducted over periods ranging from hours to days. However, in certain instances, migration-related experiments may be required to span weeks or months to obtain a more accurate understanding of the impact on specific Quality of Experience (QoE) metrics. Additionally, in-depth analyses of particular business Key Performance Indicators (KPIs) may require longer experiments. For instance, envision a migration scenario where we enhance the playback quality, anticipating that this improvement will lead to more customers engaging with the play button. Assessing relevant metrics across a considerable sample size is crucial for obtaining a reliable and confident evaluation of the hypothesis. A/B frameworks work as effective tools to accommodate this next step in the confidence-building process.

In addition to supporting extended durations, A/B testing frameworks offer other supplementary capabilities. This approach enables test allocation restrictions based on factors such as geography, device platforms, and device versions, while also allowing for analysis of migration metrics across similar dimensions. This ensures that the changes do not disproportionately impact specific customer segments. A/B testing also provides adaptability, permitting adjustments to allocation size throughout the experiment.

We might not use A/B testing for every backend migration. Instead, we use it for migrations in which changes are expected to impact device QoE or business KPIs significantly. For example, as discussed earlier, if the planned changes are expected to improve client QoE metrics, we would test the hypothesis via A/B testing.

Dialing Traffic

After completing the various stages of validation, such as replay testing, sticky canaries, and A/B tests, we can confidently assert that the planned changes will not significantly impact SLAs (service-level-agreement), device level QoE, or business KPIs. However, it is imperative that the final rollout is regulated to ensure that any unnoticed and unexpected problems do not disrupt the customer experience. To this end, we have implemented traffic dialing as the last step in mitigating the risk associated with enabling the changes in production.

A dial is a software construct that enables the controlled flow of traffic within a system. This construct samples inbound requests using a distribution function and determines whether they should be routed to the new path or kept on the existing path. The decision-making process involves assessing whether the distribution function’s output aligns within the range of the predefined target percentage. The sampling is done consistently using a fixed parameter associated with the request. The target percentage is controlled via a globally scoped dynamic property that can be updated in real-time. By increasing or decreasing the target percentage, traffic flow to the new path can be regulated instantaneously.

Dial

The selection of the actual sampling parameter depends on the specific migration requirements. A dial can be used to randomly sample all requests, which is achieved by selecting a variable parameter like a timestamp or a random number. Alternatively, in scenarios where the system path must remain constant with respect to customer devices, a constant device attribute such as deviceId is selected as the sampling parameter. Dials can be applied in several places, such as device application code, the relevant server component, or even at the API gateway for edge API systems, making them a versatile tool for managing migrations in complex systems.

Traffic is dialed over to the new system in measured discrete steps. At every step, relevant stakeholders are informed, and key metrics are monitored, including service, device, operational, and business metrics. If we discover an unexpected issue or notice metrics trending in an undesired direction during the migration, the dial gives us the capability to quickly roll back the traffic to the old path and address the issue.

The dialing steps can also be scoped at the data center level if traffic is served from multiple data centers. We can start by dialing traffic in a single data center to allow for an easier side-by-side comparison of key metrics across data centers, thereby making it easier to observe any deviations in the metrics. The duration of how long we run the actual discrete dialing steps can also be adjusted. Running the dialing steps for longer periods increases the probability of surfacing issues that may only affect a small group of members or devices and might have been too low to capture and perform shadow traffic analysis. We can complete the final step of migrating all the production traffic to the new system using the combination of gradual step-wise dialing and monitoring.

Migrating Persistent Stores

Stateful APIs pose unique challenges that require different strategies. While the replay testing technique discussed in the previous part of this blog series can be employed, additional measures outlined earlier are necessary.

This alternate migration strategy has proven effective for our systems that meet certain criteria. Specifically, our data model is simple, self-contained, and immutable, with no relational aspects. Our system doesn’t require strict consistency guarantees and does not use database transactions. We adopt an ETL-based dual-write strategy that roughly follows this sequence of steps:

  • Initial Load through an ETL process: Data is extracted from the source data store, transformed into the new model, and written to the newer data store through an offline job. We use custom queries to verify the completeness of the migrated records.
  • Continuous migration via Dual-writes: We utilize an active-active/dual-writes strategy to migrate the bulk of the data. As a safety mechanism, we use dials (discussed previously) to control the proportion of writes that go to the new data store. To maintain state parity across both stores, we write all state-altering requests of an entity to both stores. This is achieved by selecting a sampling parameter that makes the dial sticky to the entity’s lifecycle. We incrementally turn the dial up as we gain confidence in the system while carefully monitoring its overall health. The dial also acts as a switch to turn off all writes to the new data store if necessary.
  • Continuous verification of records: When a record is read, the service reads from both data stores and verifies the functional correctness of the new record if found in both stores. One can perform this comparison live on the request path or offline based on the latency requirements of the particular use case. In the case of a live comparison, we can return records from the new datastore when the records match. This process gives us an idea of the functional correctness of the migration.
  • Evaluation of migration completeness: To verify the completeness of the records, cold storage services are used to take periodic data dumps from the two data stores and compared for completeness. Gaps in the data are filled back with an ETL process.
  • Cut-over and clean-up: Once the data is verified for correctness and completeness, dual writes and reads are disabled, any client code is cleaned up, and read/writes only occur to the new data store.
Migrating Stateful Systems

Clean-up

Clean-up of any migration-related code and configuration after the migration is crucial to ensure the system runs smoothly and efficiently and we don’t build up tech debt and complexity. Once the migration is complete and validated, all migration-related code, such as traffic dials, A/B tests, and replay traffic integrations, can be safely removed from the system. This includes cleaning up configuration changes, reverting to the original settings, and disabling any temporary components added during the migration. In addition, it is important to document the entire migration process and keep records of any issues encountered and their resolution. By performing a thorough clean-up and documentation process, future migrations can be executed more efficiently and effectively, building on the lessons learned from the previous migrations.

Parting Thoughts

We have utilized a range of techniques outlined in our blog posts to conduct numerous large, medium, and small-scale migrations on the Netflix platform. Our efforts have been largely successful, with minimal to no downtime or significant issues encountered. Throughout the process, we have gained valuable insights and refined our techniques. It should be noted that not all of the techniques presented are universally applicable, as each migration presents its own unique set of circumstances. Determining the appropriate level of validation, testing, and risk mitigation requires careful consideration of several factors, including the nature of the changes, potential impacts on customer experience, engineering effort, and product priorities. Ultimately, we aim to achieve seamless migrations without disruptions or downtime.

In a series of forthcoming blog posts, we will explore a selection of specific use cases where the techniques highlighted in this blog series were utilized effectively. They will focus on a comprehensive analysis of the Ads Tier Launch and an extensive GraphQL migration for various product APIs. These posts will offer readers invaluable insights into the practical application of these methodologies in real-world situations.


Migrating Critical Traffic At Scale with No Downtime — Part 2 was originally published in Netflix TechBlog on Medium, where people are continuing the conversation by highlighting and responding to this story.

Native Frame Rate Playback

Post Syndicated from Netflix Technology Blog original https://netflixtechblog.com/native-frame-rate-playback-6c87836a948

by Akshay Garg, Roger Quero

Introduction

Maximizing immersion for our members is an important goal for the Netflix product and engineering teams to keep our members entertained and fully engaged in our content. Leveraging a good mix of mature and cutting-edge client device technologies to deliver a smooth playback experience with glitch-free in-app transitions is an important step towards achieving this goal. In this article we explain our journey towards productizing a better viewing experience for our members by utilizing features and capabilities in consumer streaming devices.

If you have a streaming device connected to your TV, such as a Roku Set Top Box (STB) or an Amazon FireTV Stick, you may have come across an option in the device display setting pertaining to content frame rate. Device manufacturers often call this feature “Match Content Frame Rate”, “Auto adjust display refresh rate” or something similar. If you’ve ever wondered what these features are and how they can improve your viewing experience, keep reading — the following sections cover the basics of this feature and explain the details of how the Netflix application uses it.

Problem

Netflix’s content catalog is composed of video captured and encoded in one of various frame rates ranging from 23.97 to 60 frames per second (fps). When a member chooses to watch a movie or a TV show on a source device (ex. Set-top box, Streaming stick, Game Console, etc…) the content is delivered and then decoded at its native frame rate, which is the frame rate it was captured and encoded in. After the decode step, the source device converts it to the HDMI output frame rate which was configured based on the capabilities of the HDMI input port of the connected sink device (TV, AVR, Monitor etc). In general, the output frame rate over HDMI is automatically set to 50fps for PAL regions and 60fps for NTSC regions.

Netflix offers limited high frame rate content (50fps or 60fps), but the majority of our catalog and viewing hours can be attributed to members watching 23.97 to 30fps content. This essentially means that most of the time, our content goes through a process called frame rate conversion (aka FRC) on the source device which converts the content from its native frame rate to match the HDMI output frame rate by replicating frames. Figure 1 illustrates a simple FRC algorithm that converts 24fps content to 60fps.

Figure 1 : 3:2 pulldown technique to convert 24FPS content to 60FPS

Converting the content and transmitting it over HDMI at the output frame rate sounds logical and straightforward. In fact, FRC works well when the output frame rate is an integer multiple of the native frame rate ( ex. 24→48, 25→50, 30→60, 24→120, etc…). On the other hand, FRC introduces a visual artifact called Judder when non-integer multiple conversion is required (ex. 24→60, 25→60, etc…), which manifests as choppy video playback as illustrated below:

With Judder
Without Judder

It is important to note that the severity of the judder depends on the replication pattern. For this reason, judder is more prominent in PAL regions because of the process of converting 24fps content to 50fps over HDMI (see Figure 2):

  • Total of 50 frames must be transmitted over HDMI per second
  • Source device must replicate the original 24 frames to fill in the missing 26 frames
  • 50 output frames from 24 original frames are derived as follows:
  • 22 frames are duplicated ( total of 44 frames )
  • 2 frames are repeated three times ( total of 6 frames )
Figure 2: Example of a 24 to 50fps frame rate conversion algorithm

As a review, judder is more pronounced when the frequency of the number of repeated frames is inconsistent and spread out e.g. in the scenario mentioned above, the frame replication factor varies between 2 and 3 resulting in a more prominent judder.

Judder Mitigation Solutions

Now that we have a better understanding of the issue, let’s review the solutions that Netflix has invested in. Due to the fragmented nature of device capabilities in the ecosystem, we explored multiple solutions to address this issue for as many devices as possible. Each unique solution leverages existing or new source device capabilities and comes with various tradeoffs.

Solution #1: Match HDMI frame rate to content Native Frame Rate

The first solution we explored and recently enabled leverages the capability of existing source & sink devices to change the outgoing frame rate on the HDMI link. Once this feature is enabled in the system settings, devices will match the HDMI output frame rate with the content frame rate, either exactly or an integer multiple, without user intervention.

While this sounds like the perfect solution, devices that support older HDMI technologies e.g. HDMI v<2.1, can’t change the frame rate without also changing the HDMI data rate. This results in what is often referred as an “HDMI bonk” which causes the TV to display a blank screen momentarily. Not only is this a disruptive experience for members, but the duration of the blank screen varies depending on how fast the source and sink devices can resynchronize. Figure 3 below is an example of how this transition looks:

Figure 3: Native frame rate experience with screen blanking

Solution #2 : Match HDMI frame rate to content Native Frame Rate w/o screen blanking

Improvements in the recent HDMI standards (HDMI 2.1+) now allow a source device to send the video content at its native frame rate without needing an HDMI resynchronization. This is possible through an innovative technology called Quick Media Switching (QMS) which is an extension of Variable Refresh Rate (VRR) targeted for content playback scenarios. QMS allows a source device to maintain a constant data rate on the HDMI link even during transmission of content with different frame rates. It does so by adjusting the amount of non-visible padding data while keeping the amount of visible video data constant. Due to the constant HDMI data rate, the HDMI transmitter and receiver don’t need to resynchronize, leading to a seamless/glitch-free transition as illustrated in Figure 4.

HDMI QMS is positioned to be the ideal solution to address the problem we are presenting. Unfortunately, at present, this technology is relatively new and adoption into source and sink devices will take time.

Figure 4: Native frame rate experience without screen blanking using HDMI QMS

Solution #3: Frame Rate Conversion within Netflix Application

Apart from the above HDMI specification dependent solutions, it is possible for an application like Netflix to manipulate the presentation time stamp value of each video frame to minimize the effect of judder i.e. the application can present video frames to the underlying source device platform at a cadence that can help the source device to minimize the judder associated with FRC on the HDMI output link.

Let us understand this idea with the help of an example. Let’s go back to the same 24 to 50 fps FRC scenario that was covered earlier. But, instead of thinking about the FRC rate per second (24 ⇒ 50 fps), let’s expand the FRC calculation time period to 3 seconds (24*3 = 72 ⇒50*3 = 150 fps). For content with a native frame rate of 24 fps, the source device needs to get 72 frames from the streaming application in a period of 3 seconds. Now instead of sending 24 frames per second at a regular per second cadence, for each 3 second period the Netflix application can decide to send 25 frames in the first 2 seconds (25 x 2 = 50) and 22 frames in the 3rd second thereby still sending a total of 72 (50+22) frames in 3 seconds. This approach creates an even FRC in the first 2 seconds (25 frames replicated twice evenly) and in the 3rd second the source device can do a 22 to 50 fps FRC which will create less visual judder compared to the 24->50 fps FRC given a more even frame replication pattern. This concept is illustrated in Figure 5 below.

Figure 5: FRC Algorithm from Solution#3 for 24 to 50 fps conversion

NOTE: This solution was developed by David Zheng in the Partner Experience Technology team at Netflix. Watch out for an upcoming article going into further details of this solution.

How the Netflix Application Uses these Solutions

Given the possible solutions available to use and the associated benefits and limitations, the Netflix application running on a source device adapts to use one of these approaches based on factors such as source and sink device capabilities, user preferences and the specific use case within the Netflix application. Let’s walk through each of these aspects briefly.

Device Capability

Every source device that integrates the Netflix application is required to let the application know if it and the connected sink device have the ability to send and receive video content at its native frame rate. In addition, a source device is required to inform whether it can support QMS and perform a seamless playback start of any content at its native frame rate on the connected HDMI link.

As discussed in the introduction section, the presence of a system setting like “Match Content Frame Rate” typically indicates that a source device is capable of this feature.

User Preference

Even if a source device and the connected sink can support Native content frame rate streaming (seamless or non-seamless), a user might have selected not to do this via the source device system settings e.g. “Match Content Frame Rate” set to “Never”. Or they might have indicated a preference of doing this only when the native content frame rate play start can happen in a seamless manner e.g. “Match Content Frame Rate” set to “Seamless”.

The Netflix application needs to know this user selection in order to honor their preference. Hence, source devices are expected to relay this user preference to the Netflix application to help with this run-time decision making.

Netflix Use Case

In spite of source device capability and the user preferences collectively indicating that the Native Content Frame Rate streaming should be enabled, the Netflix application can decide to disable this feature for specific member experiences. As an example, when the user is browsing Netflix content in the home UI, we cannot play Netflix trailers in their Native frame rate due to the following reasons:

  • If using Solution # 1, when the Netflix trailers are encoded in varying content frame rates, switching between trailers will result in screen blanking, thereby making the UI browsing unusable.
  • If using Solution # 2, sending Netflix trailers in their Native frame rate would mean that the associated UI components (movement of cursor, asset selection etc) would also be displayed at the reduced frame rate and this will result in a sluggish UI browsing experience. This is because on HDMI output from the source device, both graphics (Netflix application UI) and video components will go out at the same frame rate (native content frame rate of the trailer) after being blended together on the source device.

To handle these issues we follow an approach as shown in Figure 6 below where we enable the Native Frame Rate playback experience only when the user selects a title and watches it in full screen with minimal graphical UI elements.

Figure 6: Native Frame Rate usage within Netflix application

Conclusion

This article presented features that aim to improve the content playback experience on HDMI source devices. The breadth of available technical solutions, user selectable preferences, device capabilities and the application of each of these permutations in the context of various in-app member journeys represent a typical engineering and product decision framework at Netflix. Here at Netflix, our goal is to maximize immersion for our members through introduction of new features that will improve their viewing experience and keep them fully engaged in our content.

Acknowledgements

We would like to acknowledge the hard work of a number of teams that came together to deliver the features being discussed in this document. These include Core UI and JS Player development, Netflix Application Software development, AV Test and Tooling (earlier article from this team), Partner Engineering and Product teams in the Consumer Engineering organization and our data science friends in the Data Science and Engineering organization at Netflix. Diagrams in this article are courtesy of our Partner Enterprise Platform XD team.


Native Frame Rate Playback was originally published in Netflix TechBlog on Medium, where people are continuing the conversation by highlighting and responding to this story.

Ensuring the Successful Launch of Ads on Netflix

Post Syndicated from Netflix Technology Blog original https://netflixtechblog.com/ensuring-the-successful-launch-of-ads-on-netflix-f99490fdf1ba

By Jose Fernandez, Ed Barker, Hank Jacobs

Introduction

In November 2022, we introduced a brand new tier — Basic with ads. This tier extended existing infrastructure by adding new backend components and a new remote call to our ads partner on the playback path. As we were gearing up for launch, we wanted to ensure it would go as smoothly as possible. To do this, we devised a novel way to simulate the projected traffic weeks ahead of launch by building upon the traffic migration framework described here. We used this simulation to help us surface problems of scale and validate our Ads algorithms.

Basic with ads was launched worldwide on November 3rd. In this blog post, we’ll discuss the methods we used to ensure a successful launch, including:

  • How we tested the system
  • Netflix technologies involved
  • Best practices we developed

Realistic Test Traffic

Netflix traffic ebbs and flows throughout the day in a sinusoidal pattern. New content or national events may drive brief spikes, but, by and large, traffic is usually smoothly increasing or decreasing. An exception to this trend is when we redirect traffic between AWS data centers during regional evacuations, which leads to sudden spikes in traffic in multiple regions. Region evacuations can occur at any time, for a variety of reasons.

Typical SPS distribution across data centers
SPS distribution across data centers during regional traffic shifts
Fig. 1: Traffic Patterns

While evaluating options to test anticipated load and evaluate our ad selection algorithms at scale, we realized that mimicking member viewing behavior in combination with the seasonality of our organic traffic with abrupt regional shifts were important requirements. Replaying real traffic and making it appear as Basic with ads traffic was a better solution than artificially simulating Netflix traffic. Replay traffic enabled us to test our new systems and algorithms at scale before launch, while also making the traffic as realistic as possible.

The Setup

A key objective of this initiative was to ensure that our customers were not impacted. We used member viewing habits to drive the simulation, but customers did not see any ads as a result. Achieving this goal required extensive planning and implementation of measures to isolate the replay traffic environment from the production environment.

Netflix’s data science team provided projections of what the Basic with ads subscriber count would look like a month after launch. We used this information to simulate a subscriber population through our AB testing platform. When traffic matching our AB test criteria arrived at our playback services, we stored copies of those requests in a Mantis stream.

Next, we launched a Mantis job that processed all requests in the stream and replayed them in a duplicate production environment created for replay traffic. We set the services in this environment to “replay traffic” mode, which meant that they did not alter state and were programmed to treat the request as being on the ads plan, which activated the components of the ads system.

The replay traffic environment generated responses containing a standard playback manifest, a JSON document containing all the necessary information for a Netflix device to start playback. It also included metadata about ads, such as ad placement and impression-tracking events. We stored these responses in a Keystone stream with outputs for Kafka and Elasticsearch. A Kafka consumer retrieved the playback manifests with ad metadata and simulated a device playing the content and triggering the impression-tracking events. We used Elasticsearch dashboards to analyze results.

Ultimately, we accurately simulated the projected Basic with ads traffic weeks ahead of the launch date.

A diagram of the systems involved in traffic replay
Fig. 2: The Traffic Replay Setup

The Rollout

To fully replay the traffic, we first validated the idea with a small percentage of traffic. The Mantis query language allowed us to set the percentage of replay traffic to process. We informed our engineering and business partners, including customer support, about the experiment and ramped up traffic incrementally while monitoring the success and error metrics through Lumen dashboards. We continued ramping up and eventually reached 100% replay. At this point we felt confident to run the replay traffic 24/7.

To validate handling traffic spikes caused by regional evacuations, we utilized Netflix’s region evacuation exercises which are scheduled regularly. By coordinating with the team in charge of region evacuations and aligning with their calendar, we validated our system and third-party touchpoints at 100% replay traffic during these exercises.

We also constructed and checked our ad monitoring and alerting system during this period. Having representative data allowed us to be more confident in our alerting thresholds. The ads team also made necessary modifications to the algorithms to achieve the desired business outcomes for launch.

Finally, we conducted chaos experiments using the ChAP experimentation platform. This allowed us to validate our fallback logic and our new systems under failure scenarios. By intentionally introducing failure into the simulation, we were able to identify points of weakness and make the necessary improvements to ensure that our ads systems were resilient and able to handle unexpected events.

The availability of replay traffic 24/7 enabled us to refine our systems and boost our launch confidence, reducing stress levels for the team.

Takeaways

The above summarizes three months of hard work by a tiger team consisting of representatives from various backend teams and Netflix’s centralized SRE team. This work helped ensure a successful launch of the Basic with ads tier on November 3rd.

To briefly recap, here are a few of the things that we took away from this journey:

  • Accurately simulating real traffic helps build confidence in new systems and algorithms more quickly.
  • Large scale testing using representative traffic helps to uncover bugs and operational surprises.
  • Replay traffic has other applications outside of load testing that can be leveraged to build new products and features at Netflix.

What’s Next

Replay traffic at Netflix has numerous applications, one of which has proven to be a valuable tool for development and launch readiness. The Resilience team is streamlining this simulation strategy by integrating it into the CHAP experimentation platform, making it accessible for all development teams without the need for extensive infrastructure setup. Keep an eye out for updates on this.


Ensuring the Successful Launch of Ads on Netflix was originally published in Netflix TechBlog on Medium, where people are continuing the conversation by highlighting and responding to this story.

Migrating Critical Traffic At Scale with No Downtime — Part 1

Post Syndicated from Netflix Technology Blog original https://netflixtechblog.com/migrating-critical-traffic-at-scale-with-no-downtime-part-1-ba1c7a1c7835

Migrating Critical Traffic At Scale with No Downtime — Part 1

Shyam Gala, Javier Fernandez-Ivern, Anup Rokkam Pratap, Devang Shah

Hundreds of millions of customers tune into Netflix every day, expecting an uninterrupted and immersive streaming experience. Behind the scenes, a myriad of systems and services are involved in orchestrating the product experience. These backend systems are consistently being evolved and optimized to meet and exceed customer and product expectations.

When undertaking system migrations, one of the main challenges is establishing confidence and seamlessly transitioning the traffic to the upgraded architecture without adversely impacting the customer experience. This blog series will examine the tools, techniques, and strategies we have utilized to achieve this goal.

The backend for the streaming product utilizes a highly distributed microservices architecture; hence these migrations also happen at different points of the service call graph. It can happen on an edge API system servicing customer devices, between the edge and mid-tier services, or from mid-tiers to data stores. Another relevant factor is that the migration could be happening on APIs that are stateless and idempotent, or it could be happening on stateful APIs.

We have categorized the tools and techniques we have used to facilitate these migrations in two high-level phases. The first phase involves validating functional correctness, scalability, and performance concerns and ensuring the new systems’ resilience before the migration. The second phase involves migrating the traffic over to the new systems in a manner that mitigates the risk of incidents while continually monitoring and confirming that we are meeting crucial metrics tracked at multiple levels. These include Quality-of-Experience(QoE) measurements at the customer device level, Service-Level-Agreements (SLAs), and business-level Key-Performance-Indicators(KPIs).

This blog post will provide a detailed analysis of replay traffic testing, a versatile technique we have applied in the preliminary validation phase for multiple migration initiatives. In a follow-up blog post, we will focus on the second phase and look deeper at some of the tactical steps that we use to migrate the traffic over in a controlled manner.

Replay Traffic Testing

Replay traffic refers to production traffic that is cloned and forked over to a different path in the service call graph, allowing us to exercise new/updated systems in a manner that simulates actual production conditions. In this testing strategy, we execute a copy (replay) of production traffic against a system’s existing and new versions to perform relevant validations. This approach has a handful of benefits.

  • Replay traffic testing enables sandboxed testing at scale without significantly impacting production traffic or user experience.
  • Utilizing cloned real traffic, we can exercise the diversity of inputs from a wide range of devices and device application software versions in production. This is particularly important for complex APIs that have many high cardinality inputs. Replay traffic provides the reach and coverage required to test the ability of the system to handle infrequently used input combinations and edge cases.
  • This technique facilitates validation on multiple fronts. It allows us to assert functional correctness and provides a mechanism to load test the system and tune the system and scaling parameters for optimal functioning.
  • By simulating a real production environment, we can characterize system performance over an extended period while considering the expected and unexpected traffic pattern shifts. It provides a good read on the availability and latency ranges under different production conditions.
  • Provides a platform to ensure that essential operational insights, metrics, logging, and alerting are in place before migration.

Replay Solution

The replay traffic testing solution comprises two essential components.

  1. Traffic Duplication and Correlation: The initial step requires the implementation of a mechanism to clone and fork production traffic to the newly established pathway, along with a process to record and correlate responses from the original and alternative routes.
  2. Comparative Analysis and Reporting: Following traffic duplication and correlation, we need a framework to compare and analyze the responses recorded from the two paths and get a comprehensive report for the analysis.
Replay Testing Framework

We have tried different approaches for the traffic duplication and recording step through various migrations, making improvements along the way. These include options where replay traffic generation is orchestrated on the device, on the server, and via a dedicated service. We will examine these alternatives in the upcoming sections.

Device Driven

In this option, the device makes a request on the production path and the replay path, then discards the response on the replay path. These requests are executed in parallel to minimize any potential delay on the production path. The selection of the replay path on the backend can be driven by the URL the device uses when making the request or by utilizing specific request parameters in routing logic at the appropriate layer of the service call graph. The device also includes a unique identifier with identical values on both paths, which is used to correlate the production and replay responses. The responses can be recorded at the most optimal location in the service call graph or by the device itself, depending on the particular migration.

Device Driven Replay

The device-driven approach’s obvious downside is that we are wasting device resources. There is also a risk of impact on device QoE, especially on low-resource devices. Adding forking logic and complexity to the device code can create dependencies on device application release cycles that generally run at a slower cadence than service release cycles, leading to bottlenecks in the migration. Moreover, allowing the device to execute untested server-side code paths can inadvertently expose an attack surface area for potential misuse.

Server Driven

To address the concerns of the device-driven approach, the other option we have used is to handle the replay concerns entirely on the backend. The replay traffic is cloned and forked in the appropriate service upstream of the migrated service. The upstream service calls the existing and new replacement services concurrently to minimize any latency increase on the production path. The upstream service records the responses on the two paths along with an identifier with a common value that is used to correlate the responses. This recording operation is also done asynchronously to minimize any impact on the latency on the production path.

Server Driven Replay

The server-driven approach’s benefit is that the entire complexity of replay logic is encapsulated on the backend, and there is no wastage of device resources. Also, since this logic resides on the server side, we can iterate on any required changes faster. However, we are still inserting the replay-related logic alongside the production code that is handling business logic, which can result in unnecessary coupling and complexity. There is also an increased risk that bugs in the replay logic have the potential to impact production code and metrics.

Dedicated Service

The latest approach that we have used is to completely isolate all components of replay traffic into a separate dedicated service. In this approach, we record the requests and responses for the service that needs to be updated or replaced to an offline event stream asynchronously. Quite often, this logging of requests and responses is already happening for operational insights. Subsequently, we use Mantis, a distributed stream processor, to capture these requests and responses and replay the requests against the new service or cluster while making any required adjustments to the requests. After replaying the requests, this dedicated service also records the responses from the production and replay paths for offline analysis.

Dedicated Replay Service

This approach centralizes the replay logic in an isolated, dedicated code base. Apart from not consuming device resources and not impacting device QoE, this approach also reduces any coupling between production business logic and replay traffic logic on the backend. It also decouples any updates on the replay framework away from the device and service release cycles.

Analyzing Replay Traffic

Once we have run replay traffic and recorded a statistically significant volume of responses, we are ready for the comparative analysis and reporting component of replay traffic testing. Given the scale of the data being generated using replay traffic, we record the responses from the two sides to a cost-effective cold storage facility using technology like Apache Iceberg. We can then create offline distributed batch processing jobs to correlate & compare the responses across the production and replay paths and generate detailed reports on the analysis.

Normalization

Depending on the nature of the system being migrated, the responses might need some preprocessing before being compared. For example, if some fields in the responses are timestamps, those will differ. Similarly, if there are unsorted lists in the responses, it might be best to sort them before comparing. In certain migration scenarios, there may be intentional alterations to the response generated by the updated service or component. For instance, a field that was a list in the original path is represented as key-value pairs in the new path. In such cases, we can apply specific transformations to the response on the replay path to simulate the expected changes. Based on the system and the associated responses, there might be other specific normalizations that we might apply to the response before we compare the responses.

Comparison

After normalizing, we diff the responses on the two sides and check whether we have matching or mismatching responses. The batch job creates a high-level summary that captures some key comparison metrics. These include the total number of responses on both sides, the count of responses joined by the correlation identifier, matches and mismatches. The summary also records the number of passing/ failing responses on each path. This summary provides an excellent high-level view of the analysis and the overall match rate across the production and replay paths. Additionally, for mismatches, we record the normalized and unnormalized responses from both sides to another big data table along with other relevant parameters, such as the diff. We use this additional logging to debug and identify the root cause of issues driving the mismatches. Once we discover and address those issues, we can use the replay testing process iteratively to bring down the mismatch percentage to an acceptable number.

Lineage

When comparing responses, a common source of noise arises from the utilization of non-deterministic or non-idempotent dependency data for generating responses on the production and replay pathways. For instance, envision a response payload that delivers media streams for a playback session. The service responsible for generating this payload consults a metadata service that provides all available streams for the given title. Various factors can lead to the addition or removal of streams, such as identifying issues with a specific stream, incorporating support for a new language, or introducing a new encode. Consequently, there is a potential for discrepancies in the sets of streams used to determine payloads on the production and replay paths, resulting in divergent responses.

A comprehensive summary of data versions or checksums for all dependencies involved in generating a response, referred to as a lineage, is compiled to address this challenge. Discrepancies can be identified and discarded by comparing the lineage of both production and replay responses in the automated jobs analyzing the responses. This approach mitigates the impact of noise and ensures accurate and reliable comparisons between production and replay responses.

Comparing Live Traffic

An alternative method to recording responses and performing the comparison offline is to perform a live comparison. In this approach, we do the forking of the replay traffic on the upstream service as described in the `Server Driven` section. The service that forks and clones the replay traffic directly compares the responses on the production and replay path and records relevant metrics. This option is feasible if the response payload isn’t very complex, such that the comparison doesn’t significantly increase latencies or if the services being migrated are not on the critical path. Logging is selective to cases where the old and new responses do not match.

Replay Traffic Analysis

Load Testing

Besides functional testing, replay traffic allows us to stress test the updated system components. We can regulate the load on the replay path by controlling the amount of traffic being replayed and the new service’s horizontal and vertical scale factors. This approach allows us to evaluate the performance of the new services under different traffic conditions. We can see how the availability, latency, and other system performance metrics, such as CPU consumption, memory consumption, garbage collection rate, etc, change as the load factor changes. Load testing the system using this technique allows us to identify performance hotspots using actual production traffic profiles. It helps expose memory leaks, deadlocks, caching issues, and other system issues. It enables the tuning of thread pools, connection pools, connection timeouts, and other configuration parameters. Further, it helps in the determination of reasonable scaling policies and estimates for the associated cost and the broader cost/risk tradeoff.

Stateful Systems

We have extensively utilized replay testing to build confidence in migrations involving stateless and idempotent systems. Replay testing can also validate migrations involving stateful systems, although additional measures must be taken. The production and replay paths must have distinct and isolated data stores that are in identical states before enabling the replay of traffic. Additionally, all different request types that drive the state machine must be replayed. In the recording step, apart from the responses, we also want to capture the state associated with that specific response. Correspondingly in the analysis phase, we want to compare both the response and the related state in the state machine. Given the overall complexity of using replay testing with stateful systems, we have employed other techniques in such scenarios. We will look at one of them in the follow-up blog post in this series.

Summary

We have adopted replay traffic testing at Netflix for numerous migration projects. A recent example involved leveraging replay testing to validate an extensive re-architecture of the edge APIs that drive the playback component of our product. Another instance included migrating a mid-tier service from REST to gRPC. In both cases, replay testing facilitated comprehensive functional testing, load testing, and system tuning at scale using real production traffic. This approach enabled us to identify elusive issues and rapidly build confidence in these substantial redesigns.

Upon concluding replay testing, we are ready to start introducing these changes in production. In an upcoming blog post, we will look at some of the techniques we use to roll out significant changes to the system to production in a gradual risk-controlled way while building confidence via metrics at different levels.


Migrating Critical Traffic At Scale with No Downtime — Part 1 was originally published in Netflix TechBlog on Medium, where people are continuing the conversation by highlighting and responding to this story.

Improved Alerting with Atlas Streaming Eval

Post Syndicated from Netflix Technology Blog original https://netflixtechblog.com/improved-alerting-with-atlas-streaming-eval-e691c60dc61e

Ruchir Jha, Brian Harrington, Yingwu Zhao

TL;DR

  • Streaming alert evaluation scales much better than the traditional approach of polling time-series databases.
  • It allows us to overcome high dimensionality/cardinality limitations of the time-series database.
  • It opens doors to support more exciting use-cases.

Engineers want their alerting system to be realtime, reliable, and actionable. While actionability is subjective and may vary by use-case, reliability is non-negotiable. In other words, false positives are bad but false negatives are the absolute worst!

A few years ago, we were paged by our SRE team due to our Metrics Alerting System falling behind — critical application health alerts reached engineers 45 minutes late! As we investigated the alerting delay, we found that the number of configured alerts had recently increased dramatically, by 5 times! The alerting system queried Atlas, our time series database on a cron for each configured alert query, and was seeing an elevated throttle rate and excessive retries with backoffs. This, in turn, increased the time between two consecutive checks for an alert, causing a global slowdown for all alerts. On further investigation, we discovered that one user had programmatically created tens of thousands of new alerts. This user represented a platform team at Netflix, and their goal was to build alerting automation for their users.

While we were able to put out the immediate fire by disabling the newly created alerts, this incident raised some critical concerns around the scalability of our alerting system. We also heard from other platform teams at Netflix who wanted to build similar automation for their users who, given our state at the time, wouldn’t have been able to do so without impacting Mean Time To Detect (MTTD) for all others. Rather, we were looking at an order of magnitude increase in the number of alert queries just over the next 6 months!

Since querying Atlas was the bottleneck, our first instinct was to scale it up to meet the increased alert query demand; however, we soon realized that would increase Atlas cost prohibitively. Atlas is an in-memory time-series database that ingests multiple billions of time-series per day and retains the last two weeks of data. It is already one of the largest services at Netflix both in size and cost. While Atlas is architected around compute & storage separation, and we could theoretically just scale the query layer to meet the increased query demand, every query, regardless of its type, has a data component that needs to be pushed down to the storage layer. To serve the increasing number of push down queries, the in-memory storage layer would need to scale up as well, and it became clear that this would push the already expensive storage costs far higher. Moreover, common database optimizations like caching recently queried data don’t really work for alerting queries because, generally speaking, the last received datapoint is required for correctness. Take for example, this alert query that checks if errors as a % of total RPS exceeds a threshold of 50% for 4 out of the last 5 minutes:

name,errors,:eq,:sum,
name,rps,:eq,:sum,
:div,
100,:mul,
50,:gt,
5,:rolling-count,4,:gt,

Say if the datapoint received for the last time interval leads to a positive evaluation for this query, relying on stale/cached data would either increase MTTD or result in the perception of a false negative, at least until the missing data is fetched and evaluated. It became clear to us that we needed to solve the scalability problem with a fundamentally different approach. Hence, we started down the path of alert evaluation via real-time streaming metrics.

High Level Architecture

The idea, at a high level, was to avoid the need to query the Atlas database almost entirely and transition most alert queries to streaming evaluation.

Alert queries are submitted either via our Alerting UI or by API clients, which are then saved to a custom config database that supports streaming config updates (full snapshot + update notifications). The Alerting Service receives these config updates and hashes every new or updated alert query for evaluation to one of its nodes by leveraging Edda Slots. The node responsible for evaluating a query, starts by breaking it down into a set of “data expressions” and with them subscribes to an upstream “broker” service. Data expressions define what data needs to be sourced in order to evaluate a query. For the example query listed above, the data expressions are name,errors,:eq,:sum and name,rps,:eq,:sum. The broker service acts as a subscription manager that maps a data expression to a set of subscriptions. In addition, it also maintains a Query Index of all active data expressions which is consulted to discern if an incoming datapoint is of interest to an active subscriber. The internals here are outside the scope of this blog post.

Next, the Alerting service (via the atlas-eval library) maps the received data points for a data expression to the alert query that needs them. For alert queries that resolve to more than one data expression, we align the incoming data points for each one of those data expressions on the same time boundary before emitting the accumulated values to the final eval step. For the example above, the final eval step would be responsible for computing the ratio and maintaining the rolling-count, which is keeping track of the number of intervals in which the ratio crossed the threshold as shown below:

The atlas-eval library supports streaming evaluation for most if not all Query, Data, Math and Stateful operators supported by Atlas today. Certain operators such as offset, integral, des are not supported on the streaming path.

OK, Results?

First and foremost, we have successfully alleviated our initial scalability problem with the polling based architecture. Today, we run 20X the number of queries we used to run a few years ago, with ease and at a fraction of what it would have cost to scale up the Atlas storage layer to serve the same volume. Multiple platform teams at Netflix programmatically generate and maintain alerts on behalf of their users without having to worry about impacting other users of the system. We are able to maintain strong SLAs around Mean Time To Detect (MTTD) regardless of the number of alerts being evaluated by the system.

Additionally, streaming evaluation allowed us to relax restrictions around high cardinality that our users were previously running into — alert queries that were rejected by Atlas Backend before due to cardinality constraints are now getting checked correctly on the streaming path. In addition, we are able to use Atlas Streaming to monitor and alert on some very high cardinality use-cases, such as metrics derived from free-form log data.

Finally, we switched Telltale, our holistic application health monitoring system, from polling a metrics cache to using realtime Atlas Streaming. The fundamental idea behind Telltale is to detect anomalies on SLI metrics (for example, latency, error rates, etc). When such anomalies are detected, Telltale is able to compute correlations with similar metrics emitted from either upstream or downstream services. In addition, it also computes correlations between SLI metrics and custom metrics like the log derived metrics mentioned above. This has proven to be valuable towards reducing Mean Time to Recover (MTTR). For example, we are able to now correlate increased error rates with increased rate of specific exceptions occurring in logs and even point to an exemplar stacktrace, as shown below:

Our logs pipeline fingerprints every log message and attaches a (very high cardinality) fingerprint tag to a log events counter that is then emitted to Atlas Streaming. Telltale consumes this metric in a streaming fashion to identify fingerprints that correlate with anomalies seen in SLI metrics. Once an anomaly is found, we query the logs backend with the fingerprint hash to obtain the exemplar stacktrace. What’s more is we are now able to identify correlated anomalies (and exceptions) occurring in services that may be N hops away from the affected service. A system like Telltale becomes more effective as more services are onboarded (and for that matter the full service graph), because otherwise it becomes difficult to root cause the problem, especially in a microservices-based architecture. A few years ago, as noted in this blog, only about a hundred services were using Telltale; thanks to Atlas Streaming we have now managed to onboard thousands of other services at Netflix.

Finally, we realized that once you remove limits on the number of monitored queries, and start supporting much higher metric dimensionality/cardinality without impacting the cost/performance profile of the system, it opens doors to many exciting new possibilities. For example, to make alerts more actionable, we may now be able to compute correlations between SLI anomalies and custom metrics with high cardinality dimensions, for example an alert on elevated HTTP error rates may be able to point to impacted customer cohorts, by linking to precisely correlated exemplars. This would help developers with reproducibility.

Transitioning to the streaming path has been a long journey for us. One of the challenges was difficulty in debugging scenarios where the streaming path didn’t agree with what is returned by querying the Atlas database. This is especially true when either the data is not available in Atlas or the query is not supported because of (say) cardinality constraints. This is one of the reasons it has taken us years to get here. That said, early signs indicate that the streaming paradigm may help with tackling a cardinal problem in observability — effective correlation between the metrics & events verticals (logs, and potentially traces in the future), and we are excited to explore the opportunities that this presents for Observability in general.


Improved Alerting with Atlas Streaming Eval was originally published in Netflix TechBlog on Medium, where people are continuing the conversation by highlighting and responding to this story.

Elasticsearch Indexing Strategy in Asset Management Platform (AMP)

Post Syndicated from Netflix Technology Blog original https://netflixtechblog.com/elasticsearch-indexing-strategy-in-asset-management-platform-amp-99332231e541

By Burak Bacioglu, Meenakshi Jindal

Asset Management at Netflix

At Netflix, all of our digital media assets (images, videos, text, etc.) are stored in secure storage layers. We built an asset management platform (AMP), codenamed Amsterdam, in order to easily organize and manage the metadata, schema, relations and permissions of these assets. It is also responsible for asset discovery, validation, sharing, and for triggering workflows.

Amsterdam service utilizes various solutions such as Cassandra, Kafka, Zookeeper, EvCache etc. In this blog, we will be focusing on how we utilize Elasticsearch for indexing and search the assets.

Amsterdam is built on top of three storage layers.

The first layer, Cassandra, is the source of truth for us. It consists of close to a hundred tables (column families) , the majority of which are reverse indices to help query the assets in a more optimized way.

The second layer is Elasticsearch, which is used to discover assets based on user queries. This is the layer we’d like to focus on in this blog. And more specifically, how we index and query over 7TB of data in a read-heavy and continuously growing environment and keep our Elasticsearch cluster healthy.

And finally, we have an Apache Iceberg layer which stores assets in a denormalized fashion to help answer heavy queries for analytics use cases.

Elasticsearch Integration

Elasticsearch is one of the best and widely adopted distributed, open source search and analytics engines for all types of data, including textual, numerical, geospatial, structured or unstructured data. It provides simple APIs for creating indices, indexing or searching documents, which makes it easy to integrate. No matter whether you use in-house deployments or hosted solutions, you can quickly stand up an Elasticsearch cluster, and start integrating it from your application using one of the clients provided based on your programming language (Elasticsearch has a rich set of languages it supports; Java, Python, .Net, Ruby, Perl etc.).

One of the first decisions when integrating with Elasticsearch is designing the indices, their settings and mappings. Settings include index specific properties like number of shards, analyzers, etc. Mapping is used to define how documents and their fields are supposed to be stored and indexed. You define the data types for each field, or use dynamic mapping for unknown fields. You can find more information on settings and mappings on Elasticsearch website.

Most applications in content and studio engineering at Netflix deal with assets; such as videos, images, text, etc. These applications are built on a microservices architecture, and the Asset Management Platform provides asset management to those dozens of services for various asset types. Each asset type is defined in a centralized schema registry service responsible for storing asset type taxonomies and relationships. Therefore, it initially seemed natural to create a different index for each asset type. When creating index mappings in Elasticsearch, one has to define the data type for each field. Since different asset types could potentially have fields with the same name but with different data types; having a separate index for each type would prevent such type collisions. Therefore we created around a dozen indices per asset type with fields mapping based on the asset type schema. As we onboarded new applications to our platform, we kept creating new indices for the new asset types. We have a schema management microservice which is used to store the taxonomy of each asset type; and this programmatically created new indices whenever new asset types were created in this service. All the assets of a specific type use the specific index defined for that asset type to create or update the asset document.

Fig 1. Indices based on Asset Types

As Netflix is now producing significantly more originals than it used to when we started this project a few years ago, not only did the number of assets grow dramatically but also the number of asset types grew from dozens to several thousands. Hence the number of Elasticsearch indices (per asset type) as well as asset document indexing or searching RPS (requests per second) grew over time. Although this indexing strategy worked smoothly for a while, interesting challenges started coming up and we started to notice performance issues over time. We started to observe CPU spikes, long running queries, instances going yellow/red in status.

Usually the first thing to try is to scale up the Elasticsearch cluster horizontally by increasing the number of nodes or vertically by upgrading instance types. We tried both, and in many cases it helps, but sometimes it is a short term fix and the performance problems come back after a while; and it did for us. You know it is time to dig deeper to understand the root cause of it.

It was time to take a step back and reevaluate our ES data indexing and sharding strategy. Each index was assigned a fixed number of 6 shards and 2 replicas (defined in the template of the index). With the increase in the number of asset types, we ended up having approximately 900 indices (thus 16200 shards). Some of these indices had millions of documents, whereas many of them were very small with only thousands of documents. We found the root cause of the CPU spike was unbalanced shards size. Elasticsearch nodes storing those large shards became hot spots and queries hitting those instances were timing out or very slow due to busy threads.

We changed our indexing strategy and decided to create indices based on time buckets, rather than asset types. What this means is, assets created between t1 and t2 would go to the T1 bucket, assets created between t2 and t3 would go to the T2 bucket, and so on. So instead of persisting assets based on their asset types, we would use their ids (thus its creation time; because the asset id is a time based uuid generated at the asset creation) to determine which time bucket the document should be persisted to. Elasticsearch recommends each shard to be under 65GB (AWS recommends them to be under 50GB), so we could create time based indices where each index holds somewhere between 16–20GB of data, giving some buffer for data growth. Existing assets can be redistributed appropriately to these precreated shards, and new assets would always go to the current index. Once the size of the current index exceeds a certain threshold (16GB), we would create a new index for the next bucket (minute/hour/day) and start indexing assets to the new index created. We created an index template in Elasticsearch so that the new indices always use the same settings and mappings stored in the template.

We chose to index all versions of an asset in the the same bucket – the one that keeps the first version. Therefore, even though new assets can never be persisted to an old index (due to our time based id generation logic, they always go to the latest/current index); existing assets can be updated, causing additional documents for those new asset versions to be created in those older indices. Therefore we chose a lower threshold for the roll over so that older shards would still be well under 50GB even after those updates.

Fig 2. Indices based on Time Buckets

For searching purposes, we have a single read alias that points to all indices created. When performing a query, we always execute it on the alias. This ensures that no matter where documents are, all documents matching the query will be returned. For indexing/updating documents, though, we cannot use an alias, we use the exact index name to perform index operations.

To avoid the ES query for the list of indices for every indexing request, we keep the list of indices in a distributed cache. We refresh this cache whenever a new index is created for the next time bucket, so that new assets will be indexed appropriately. For every asset indexing request, we look at the cache to determine the corresponding time bucket index for the asset. The cache stores all time-based indices in a sorted order (for simplicity we named our indices based on their starting time in the format yyyyMMddHHmmss) so that we can easily determine exactly which index should be used for asset indexing based on the asset creation time. Without using the time bucket strategy, the same asset could have been indexed into multiple indices because Elasticsearch doc id is unique per index and not the cluster. Or we would have to perform two API calls, first to identify the specific index and then to perform the asset update/delete operation on that specific index.

It is still possible to exceed 50GB in those older indices if millions of updates occur within that time bucket index. To address this issue, we added an API that would split an old index into two programmatically. In order to split a given bucket T1 (which stores all assets between t1 and t2) into two, we choose a time t1.5 between t1 and t2, create a new bucket T1_5, and reindex all assets created between t1.5 and t2 from T1 into this new bucket. While the reindexing is happening, queries / reads are still answered by T1, so any new document created (via asset updates) would be dual-written into T1 and T1.5, provided that their timestamp falls between t1.5 and t2. Finally, once the reindexing is complete, we enable reads from T1_5, stop the dual write and delete reindexed documents from T1.

In fact, Elasticsearch provides an index rollover feature to handle the growing indicex problem https://www.elastic.co/guide/en/elasticsearch/reference/6.0/indices-rollover-index.html. With this feature, a new index is created when the current index size hits a threshold, and through a write alias, the index calls will point to the new index created. That means, all future index calls would go to the new index created. However, this would create a problem for our update flow use case, because we would have to query multiple indices to determine which index contains a particular document so that we can update it appropriately. Because the calls to Elasticsearch may not be sequential, meaning, an asset a1 created at T1 can be indexed after another asset a2 created at T2 where T2>T1, the older asset a1 can end up in the newer index while the newer asset a2 is persisted in the old index. In our current implementation, however, by simply looking at the asset id (and asset creation time), we can easily find out which index to go to and it is always deterministic.

One thing to mention is, Elasticsearch has a default limit of 1000 fields per index. If we index all types to a single index, wouldn’t we easily exceed this number? And what about the data type collisions we mentioned above? Having a single index for all data types could potentially cause collisions when two asset types define different data types for the same field. We also changed our mapping strategy to overcome these issues. Instead of creating a separate Elasticsearch field for each metadata field defined in an asset type, we created a single nested type with a mandatory field called `key`, which represents the name of the field on the asset type, and a handful of data-type specific fields, such as: `string_value`, `long_value`, `date_value`, etc. We would populate the corresponding data-type specific field based on the actual data type of the value. Below you can see a part of the index mapping defined in our template, and an example from a document (asset) which has four metadata fields:

Fig 3. Snippet of the index mapping
Fig 4. Snippet of nested metadata field on a stored document

As you see above, all asset properties go under the same nested field `metadata` with a mandatory `key` field, and the corresponding data-type specific field. This ensures that no matter how many asset types or properties are indexed, we would always have a fixed number of fields defined in the mapping. When searching for these fields, instead of querying for a single value (cameraId == 42323243), we perform a nested query where we query for both key and the value (key == cameraId AND long_value == 42323243). For more information on nested queries, please refer to this link.

Fig 5. Search/Indexing RPS

After these changes, the indices we created are now balanced in terms of data size. CPU utilization is down from an average of 70% to 10%. In addition, we are able to reduce the refresh interval time on these indices from our earlier setting 30 seconds to 1 sec in order to support use cases like read after write, which enables users to search and get a document after a second it was created

Fig 6. CPU Spike with Old indexing strategy
Fig 7. CPU Usage with New indexing strategy

We had to do a one time migration of the existing documents to the new indices. Thankfully we already have a framework in place that can query all assets from Cassandra and index them in Elasticsearch. Since doing full table scans in Cassandra is not generally recommended on large tables (due to potential timeouts), our cassandra schema contains several reverse indices that help us query all data efficiently. We also utilize Kafka to process these assets asynchronously without impacting our real time traffic. This infrastructure is used not only to index assets to Elasticsearch, but also to perform administrative operations on all or some assets, such as bulk updating assets, scanning / fixing problems on them, etc. Since we only focused on Elasticsearch indexing in this blog, we are planning to create another blog to talk about this infrastructure later.


Elasticsearch Indexing Strategy in Asset Management Platform (AMP) was originally published in Netflix TechBlog on Medium, where people are continuing the conversation by highlighting and responding to this story.

Scaling Media Machine Learning at Netflix

Post Syndicated from Netflix Technology Blog original https://netflixtechblog.com/scaling-media-machine-learning-at-netflix-f19b400243

By Gustavo Carmo, Elliot Chow, Nagendra Kamath, Akshay Modi, Jason Ge, Wenbing Bai, Jackson de Campos, Lingyi Liu, Pablo Delgado, Meenakshi Jindal, Boris Chen, Vi Iyengar, Kelli Griggs, Amir Ziai, Prasanna Padmanabhan, and Hossein Taghavi

Figure 1 – Media Machine Learning Infrastructure

Introduction

In 2007, Netflix started offering streaming alongside its DVD shipping services. As the catalog grew and users adopted streaming, so did the opportunities for creating and improving our recommendations. With a catalog spanning thousands of shows and a diverse member base spanning millions of accounts, recommending the right show to our members is crucial.

Why should members care about any particular show that we recommend? Trailers and artworks provide a glimpse of what to expect in that show. We have been leveraging machine learning (ML) models to personalize artwork and to help our creatives create promotional content efficiently.

Our goal in building a media-focused ML infrastructure is to reduce the time from ideation to productization for our media ML practitioners. We accomplish this by paving the path to:

  • Accessing and processing media data (e.g. video, image, audio, and text)
  • Training large-scale models efficiently
  • Productizing models in a self-serve fashion in order to execute on existing and newly arriving assets
  • Storing and serving model outputs for consumption in promotional content creation

In this post, we will describe some of the challenges of applying machine learning to media assets, and the infrastructure components that we have built to address them. We will then present a case study of using these components in order to optimize, scale, and solidify an existing pipeline. Finally, we’ll conclude with a brief discussion of the opportunities on the horizon.

Infrastructure challenges and components

In this section, we highlight some of the unique challenges faced by media ML practitioners, along with the infrastructure components that we have devised to address them.

Media Access: Jasper

In the early days of media ML efforts, it was very hard for researchers to access media data. Even after gaining access, one needed to deal with the challenges of homogeneity across different assets in terms of decoding performance, size, metadata, and general formatting.

To streamline this process, we standardized media assets with pre-processing steps that create and store dedicated quality-controlled derivatives with associated snapshotted metadata. In addition, we provide a unified library that enables ML practitioners to seamlessly access video, audio, image, and various text-based assets.

Media Feature Storage: Amber Storage

Media feature computation tends to be expensive and time-consuming. Many ML practitioners independently computed identical features against the same asset in their ML pipelines.

To reduce costs and promote reuse, we have built a feature store in order to memoize features/embeddings tied to media entities. This feature store is equipped with a data replication system that enables copying data to different storage solutions depending on the required access patterns.

Compute Triggering and Orchestration: Amber Orchestration

Productized models must run over newly arriving assets for scoring. In order to satisfy this requirement, ML practitioners had to develop bespoke triggering and orchestration components per pipeline. Over time, these bespoke components became the source of many downstream errors and were difficult to maintain.

Amber is a suite of multiple infrastructure components that offers triggering capabilities to initiate the computation of algorithms with recursive dependency resolution.

Training Performance

Media model training poses multiple system challenges in storage, network, and GPUs. We have developed a large-scale GPU training cluster based on Ray, which supports multi-GPU / multi-node distributed training. We precompute the datasets, offload the preprocessing to CPU instances, optimize model operators within the framework, and utilize a high-performance file system to resolve the data loading bottleneck, increasing the entire training system throughput 3–5 times.

Serving and Searching

Media feature values can be optionally synchronized to other systems depending on necessary query patterns. One of these systems is Marken, a scalable service used to persist feature values as annotations, which are versioned and strongly typed constructs associated with Netflix media entities such as videos and artwork.

This service provides a user-friendly query DSL for applications to perform search operations over these annotations with specific filtering and grouping. Marken provides unique search capabilities on temporal and spatial data by time frames or region coordinates, as well as vector searches that are able to scale up to the entire catalog.

ML practitioners interact with this infrastructure mostly using Python, but there is a plethora of tools and platforms being used in the systems behind the scenes. These include, but are not limited to, Conductor, Dagobah, Metaflow, Titus, Iceberg, Trino, Cassandra, Elastic Search, Spark, Ray, MezzFS, S3, Baggins, FSx, and Java/Scala-based applications with Spring Boot.

Case study: scaling match cutting using the media ML infra

The Media Machine Learning Infrastructure is empowering various scenarios across Netflix, and some of them are described here. In this section, we showcase the use of this infrastructure through the case study of Match Cutting.

Background

Match Cutting is a video editing technique. It’s a transition between two shots that uses similar visual framing, composition, or action to fluidly bring the viewer from one scene to the next. It is a powerful visual storytelling tool used to create a connection between two scenes.

Figure 2 – a series of frame match cuts from Wednesday.

In an earlier post, we described how we’ve used machine learning to find candidate pairs. In this post, we will focus on the engineering and infrastructure challenges of delivering this feature.

Where we started

Initially, we built Match Cutting to find matches across a single title (i.e. either a movie or an episode within a show). An average title has 2k shots, which means that we need to enumerate and process ~2M pairs.

Figure 3- The original Match Cutting pipeline before leveraging media ML infrastructure components.

This entire process was encapsulated in a single Metaflow flow. Each step was mapped to a Metaflow step, which allowed us to control the amount of resources used per step.

Step 1

We download a video file and produce shot boundary metadata. An example of this data is provided below:

SB = {0: [0, 20], 1: [20, 30], 2: [30, 85], …}

Each key in the SB dictionary is a shot index and each value represents the frame range corresponding to that shot index. For example, for the shot with index 1 (the second shot), the value captures the shot frame range [20, 30], where 20 is the start frame and 29 is the end frame (i.e. the end of the range is exclusive while the start is inclusive).

Using this data, we then materialized individual clip files (e.g. clip0.mp4, clip1.mp4, etc) corresponding to each shot so that they can be processed in Step 2.

Step 2

This step works with the individual files produced in Step 1 and the list of shot boundaries. We first extract a representation (aka embedding) of each file using a video encoder (i.e. an algorithm that converts a video to a fixed-size vector) and use that embedding to identify and remove duplicate shots.

In the following example SB_deduped is the result of deduplicating SB:

# the second shot (index 1) was removed and so was clip1.mp4
SB_deduped = {0: [0, 20], 2: [30, 85], …}

SB_deduped along with the surviving files are passed along to step 3.

Step 3

We compute another representation per shot, depending on the flavor of match cutting.

Step 4

We enumerate all pairs and compute a score for each pair of representations. These scores are stored along with the shot metadata:

[
# shots with indices 12 and 729 have a high matching score
{shot1: 12, shot2: 729, score: 0.96},
# shots with indices 58 and 419 have a low matching score
{shot1: 58, shot2: 410, score: 0.02},

]

Step 5

Finally, we sort the results by score in descending order and surface the top-K pairs, where K is a parameter.

The problems we faced

This pattern works well for a single flavor of match cutting and finding matches within the same title. As we started venturing beyond single-title and added more flavors, we quickly faced a few problems.

Lack of standardization

The representations we extract in Steps 2 and Step 3 are sensitive to the characteristics of the input video files. In some cases such as instance segmentation, the output representation in Step 3 is a function of the dimensions of the input file.

Not having a standardized input file format (e.g. same encoding recipes and dimensions) created matching quality issues when representations across titles with different input files needed to be processed together (e.g. multi-title match cutting).

Wasteful repeated computations

Segmentation at the shot level is a common task used across many media ML pipelines. Also, deduplicating similar shots is a common step that a subset of those pipelines shares.

We realized that memoizing these computations not only reduces waste but also allows for congruence between algo pipelines that share the same preprocessing step. In other words, having a single source of truth for shot boundaries helps us guarantee additional properties for the data generated downstream. As a concrete example, knowing that algo A and algo B both used the same shot boundary detection step, we know that shot index i has identical frame ranges in both. Without this knowledge, we’ll have to check if this is actually true.

Gaps in media-focused pipeline triggering and orchestration

Our stakeholders (i.e. video editors using match cutting) need to start working on titles as quickly as the video files land. Therefore, we built a mechanism to trigger the computation upon the landing of new video files. This triggering logic turned out to present two issues:

  1. Lack of standardization meant that the computation was sometimes re-triggered for the same video file due to changes in metadata, without any content change.
  2. Many pipelines independently developed similar bespoke components for triggering computation, which created inconsistencies.

Additionally, decomposing the pipeline into modular pieces and orchestrating computation with dependency semantics did not map to existing workflow orchestrators such as Conductor and Meson out of the box. The media machine learning domain needed to be mapped with some level of coupling between media assets metadata, media access, feature storage, feature compute and feature compute triggering, in a way that new algorithms could be easily plugged with predefined standards.

This is where Amber comes in, offering a Media Machine Learning Feature Development and Productization Suite, gluing all aspects of shipping algorithms while permitting the interdependency and composability of multiple smaller parts required to devise a complex system.

Each part is in itself an algorithm, which we call an Amber Feature, with its own scope of computation, storage, and triggering. Using dependency semantics, an Amber Feature can be plugged into other Amber Features, allowing for the composition of a complex mesh of interrelated algorithms.

Match Cutting across titles

Step 4 entails a computation that is quadratic in the number of shots. For instance, matching across a series with 10 episodes with an average of 2K shots per episode translates into 200M comparisons. Matching across 1,000 files (across multiple shows) would take approximately 200 trillion computations.

Setting aside the sheer number of computations required momentarily, editors may be interested in considering any subset of shows for matching. The naive approach is to pre-compute all possible subsets of shows. Even assuming that we only have 1,000 video files, this means that we have to pre-compute 2¹⁰⁰⁰ subsets, which is more than the number of atoms in the observable universe!

Ideally, we want to use an approach that avoids both issues.

Where we landed

The Media Machine Learning Infrastructure provided many of the building blocks required for overcoming these hurdles.

Standardized video encodes

The entire Netflix catalog is pre-processed and stored for reuse in machine learning scenarios. Match Cutting benefits from this standardization as it relies on homogeneity across videos for proper matching.

Shot segmentation and deduplication reuse

Videos are matched at the shot level. Since breaking videos into shots is a very common task across many algorithms, the infrastructure team provides this canonical feature that can be used as a dependency for other algorithms. With this, we were able to reuse memoized feature values, saving on compute costs and guaranteeing coherence of shot segments across algos.

Orchestrating embedding computations

We have used Amber’s feature dependency semantics to tie the computation of embeddings to shot deduplication. Leveraging Amber’s triggering, we automatically initiate scoring for new videos as soon as the standardized video encodes are ready. Amber handles the computation in the dependency chain recursively.

Feature value storage

We store embeddings in Amber, which guarantees immutability, versioning, auditing, and various metrics on top of the feature values. This also allows other algorithms to be built on top of the Match Cutting output as well as all the intermediate embeddings.

Compute pairs and sink to Marken

We have also used Amber’s synchronization mechanisms to replicate data from the main feature value copies to Marken, which is used for serving.

Media Search Platform

Used to serve high-scoring pairs to video editors in internal applications via Marken.

The following figure depicts the new pipeline using the above-mentioned components:

Figure 4 – Match cutting pipeline built using media ML infrastructure components. Interactions between algorithms are expressed as a feature mesh, and each Amber Feature encapsulates triggering and compute.

Conclusion and Future Work

The intersection of media and ML holds numerous prospects for innovation and impact. We examined some of the unique challenges that media ML practitioners face and presented some of our early efforts in building a platform that accommodates the scaling of ML solutions.

In addition to the promotional media use cases we discussed, we are extending the infrastructure to facilitate a growing set of use cases. Here are just a few examples:

  • ML-based VFX tooling
  • Improving recommendations using a suite of content understanding models
  • Enriching content understanding ML and creative tooling by leveraging personalization signals and insights

In future posts, we’ll dive deeper into more details about the solutions built for each of the components we have briefly described in this post.

If you’re interested in media ML, we’re always looking for engineers and ML researchers and practitioners to join us!

Acknowledgments

Special thanks to Ben Klein, Fernando Amat Gil, Varun Sekhri, Guru Tahasildar, and Burak Bacioglu for contributing to ideas, designs, and discussions.


Scaling Media Machine Learning at Netflix was originally published in Netflix TechBlog on Medium, where people are continuing the conversation by highlighting and responding to this story.