Post Syndicated from Karthi Thyagarajan original https://aws.amazon.com/blogs/big-data/enhanced-monitoring-and-automatic-scaling-for-apache-flink/
Thousands of developers use Apache Flink to build streaming applications to transform and analyze data in real time. Apache Flink is an open-source framework and engine for processing data streams. It’s highly available and scalable, delivering high throughput and low latency for the most demanding stream-processing applications. Monitoring and scaling your applications is critical to keep your applications running successfully in a production environment.
Amazon Kinesis Data Analytics reduces the complexity of building and managing Apache Flink applications. Amazon Kinesis Data Analytics manages the underlying Apache Flink components that provide durable application state, metrics and logs, and more. Kinesis Data Analytics recently announced new Amazon CloudWatch metrics and the ability to create custom metrics to provide greater visibility into your application.
In this post, we show you how to easily monitor and automatically scale your Apache Flink applications with Amazon Kinesis Data Analytics. We walk through three examples. First, we create a custom metric in the Kinesis Data Analytics for Apache Flink application code. Second, we use application metrics to automatically scale the application. Finally, we share a CloudWatch dashboard for monitoring your application and recommend metrics that you can alarm on.
Custom metrics
Kinesis Data Analytics uses Apache Flink’s metrics system to send custom metrics to CloudWatch from your applications. For more information, see Using Custom Metrics with Amazon Kinesis Data Analytics for Apache Flink.
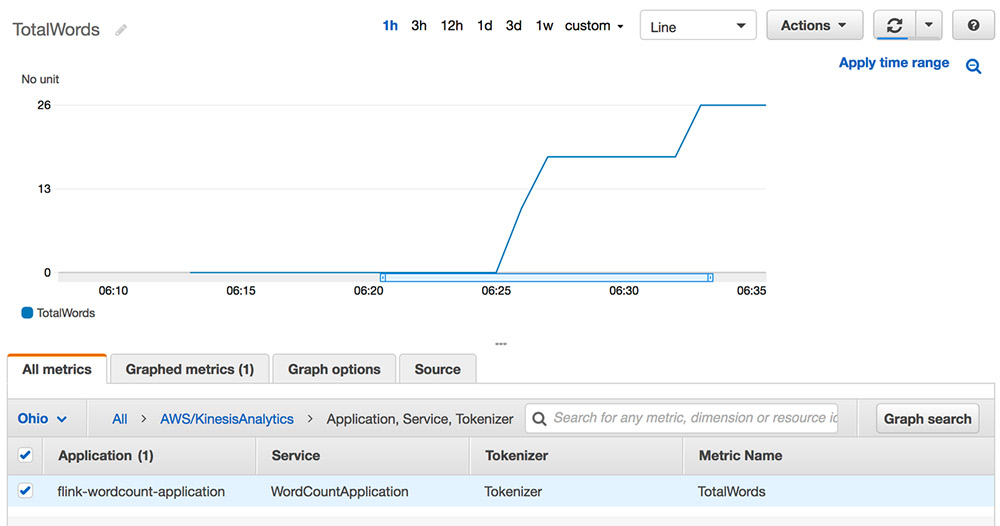
We use a basic word count program to illustrate the use of custom metrics. The following code shows how to extend RichFlatMapFunction to track the number of words it sees. This word count is then surfaced via the Flink metrics API.
Custom metrics emitted through the Flink metrics API are forwarded to CloudWatch metrics by Kinesis Data Analytics for Apache Flink. The following screenshot shows the word count metric in CloudWatch.
Custom automatic scaling
This section describes how to implement an automatic scaling solution for Kinesis Data Analytics for Apache Flink based on CloudWatch metrics. You can configure Kinesis Data Analytics for Apache Flink to perform CPU-based automatic scaling. However, you can automatically scale your application based on something other than CPU utilization. To perform custom automatic scaling, use Application Auto Scaling with the appropriate metric.
For applications that read from a Kinesis stream source, you can use the metric millisBehindLatest. This captures how far behind your application is from the head of the stream.
A target tracking policy is one of two scaling policy types offered by Application Auto Scaling. You can specify a threshold value around which to vary the degree of parallelism of your Kinesis Data Analytics application. The following sample code on GitHub configures Application Auto Scaling when millisBehindLatest for the consuming application exceeds 1 minute. This increases the parallelism, which increases the number of KPUs.
The following diagram shows how Application Auto Scaling, used with Amazon API Gateway and AWS Lambda, scales a Kinesis Data Analytics application in response to a CloudWatch alarm.

The sample code includes examples for automatic scaling based on the target tracking policy and step scaling policy.
Automatic scaling solution components
The following is a list of key components used in the automatic scaling solution. You can find these components in the AWS CloudFormation template in the GitHub repo accompanying this post.
- Application Auto Scaling scalable target – A scalable target is a resource that Application Auto Scaling can scale in and out. It’s uniquely identified by the combination of resource ID, scalable dimension, and namespace. For more information, see RegisterScalableTarget.
- Scaling policy – The scaling policy defines how your scalable target should scale. As described in the PutScalingPolicy, Application Auto Scaling supports two policy types:
TargetTrackingScalingandStepScaling. In addition, you can configure a scheduled scaling action using Application Auto Scaling. If you specifyTargetTrackingScaling, Application Auto Scaling also creates corresponding CloudWatch alarms for you. - API Gateway – Because the scalable target is a custom resource, we have to specify an API endpoint. Application Auto Scaling invokes this to perform scaling and get information about the current state of our scalable resource. We use an API Gateway and Lambda function to implement this endpoint.
- Lambda – API Gateway invokes the Lambda function. This is called by Application Auto Scaling to perform the scaling actions. It also fetches information such as current scale value and returns information requested by Application Auto Scaling.
Additionally, you should be aware of the following:
- When scaling out or in, this sample only updates the overall parallelism. It doesn’t adjust parallelism or KPU.
- When scaling occurs, the Kinesis Data Analytics application experiences downtime.
- The throughput of a Flink application depends on many factors, such as complexity of processing and destination throughput. The step-scaling example assumes a relationship between incoming record throughput and scaling. The millisBehindLatest metric used for target tracking automatic scaling works the same way.
- We recommend using the default scaling policy provided by Kinesis Data Analytics for CPU-based scaling, the target tracking auto scaling policy for the
millisBehindLatestmetric, and a step scaling auto scaling policy for a metric such asnumRecordsInPerSecond. However, you can use any automatic scaling policy for the metric you choose.
CloudWatch operational dashboard
Customers often ask us about best practices and the operational aspects of Kinesis Data Analytics for Apache Flink. We created a CloudWatch dashboard that captures the key metrics to monitor. We categorize the most common metrics in this dashboard with the recommended statistics for each metric.
This GitHub repo contains a CloudFormation template to deploy the dashboard for any Kinesis Data Analytics for Apache Flink application. You can also deploy a demo application with the dashboard. The dashboard includes the following:
- Application health metrics:
- Use uptime to see how long the job has been running without interruption and downtime to determine if a job failed to run. Non-zero downtime can indicate issues with your application.
- Higher-than-normal job restarts can indicate an unhealthy application.
- Checkpoint information size, duration, and number of failed checkpoints can help you understand application health and progress. Increasing checkpoint duration values can signify application health problems like backpressure and the inability to keep up with input data. Increasing checkpoint size over time can point to an infinitely growing state that can lead to out-of-memory errors.
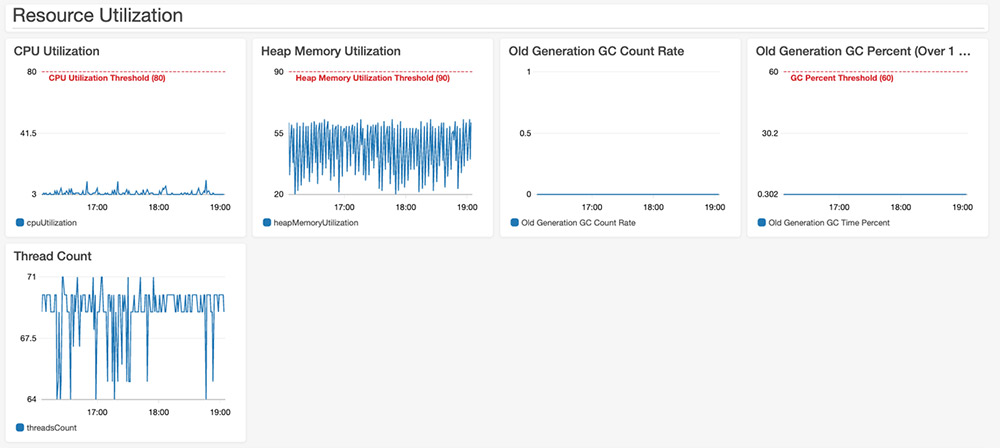
- Resource utilization metrics:
- You can check the CPU and heap memory utilization along with the thread count. You can also check the garbage collection time taken across all Flink task managers.
- Flink application progress metrics:
numRecordsInPerSecondandnumRecordsOutPerSecondshow the number of records accepted and emitted per second.numLateRecordsDroppedshows the number of records this operator or task has dropped due to arriving late.- Input and output watermarks are valid only when using event time semantics. You can use the difference between these two values to calculate event time latency.
- Source metrics:
- The Kinesis Data Streams-specific metric
millisBehindLatestshows that the consumer is behind the head of the stream, indicating how far behind current time the consumer is. We used this metric to demonstrate Application Auto Scaling earlier in this post. - The Kafka-specific metric
recordsLagMaxshows the maximum lag in terms of number of records for any partition in this window.
- The Kinesis Data Streams-specific metric
The dashboard contains useful metrics to gauge the operational health of a Flink application. You can modify the threshold, configure additional alarms, and add other system or custom metrics to customize the dashboard for your use. The following screenshot shows a section of the dashboard.
Summary
In this post, we covered how to use the enhanced monitoring features for Kinesis Data Analytics for Apache Flink applications. We created custom metrics for an Apache Flink application within application code and emitted it to CloudWatch. We also used Application Auto Scaling to scale an application. Finally, we shared a CloudWatch dashboard to monitor the operational health of Kinesis Data Analytics for Apache Flink applications. For more information about using Kinesis Data Analytics, see Getting Started with Amazon Kinesis Data Analytics.
About the Authors
 Karthi Thyagarajan is a Principal Solutions Architect on the Amazon Kinesis team.
 Deepthi Mohan is a Sr. TPM on the Amazon Kinesis Data Analytics team.