Post Syndicated from Selina Cho original https://blog.cloudflare.com/announcing-spectrum-ddos-analytics-and-ddos-insights-trends/


We’re excited to announce the expansion of the Network Analytics dashboard to Spectrum customers on the Enterprise plan. Additionally, this announcement introduces two major dashboard improvements for easier reporting and investigation.
Network Analytics
Cloudflare’s packet and bit oriented dashboard, Network Analytics, provides visibility into Internet traffic patterns and DDoS attacks in Layers 3 and 4 of the OSI model. This allows our users to better understand the traffic patterns and DDoS attacks as observed at the Cloudflare edge.
When the dashboard was first released in January, these capabilities were only available to Bring Your Own IP customers on the Spectrum and Magic Transit services, but now Spectrum customers using Cloudflare’s Anycast IPs are also supported.
Protecting L4 applications
Spectrum is Cloudflare’s L4 reverse-proxy service that offers unmetered DDoS protection and traffic acceleration for TCP and UDP applications. It provides enhanced traffic performance through faster TLS, optimized network routing, and high speed interconnection. It also provides encryption to legacy protocols and applications that don’t come with embedded encryption. Customers who typically use Spectrum operate services in which network performance and resilience to DDoS attacks are of utmost importance to their business, such as email, remote access, and gaming.
Spectrum customers can now view detailed traffic reports on DDoS attacks on their configured TCP/ UDP applications, including size of attacks, attack vectors, source location of attacks, and permitted traffic. What’s more, users can also configure and receive real-time alerts when their services are attacked.
Network Analytics: Rebooted
Since releasing the Network Analytics dashboard in January, we have been constantly improving its capabilities. Today, we’re announcing two major improvements that will make both reporting and investigation easier for our customers: DDoS Insights & Trend and Group-by Filtering for grouping-based traffic analysis.
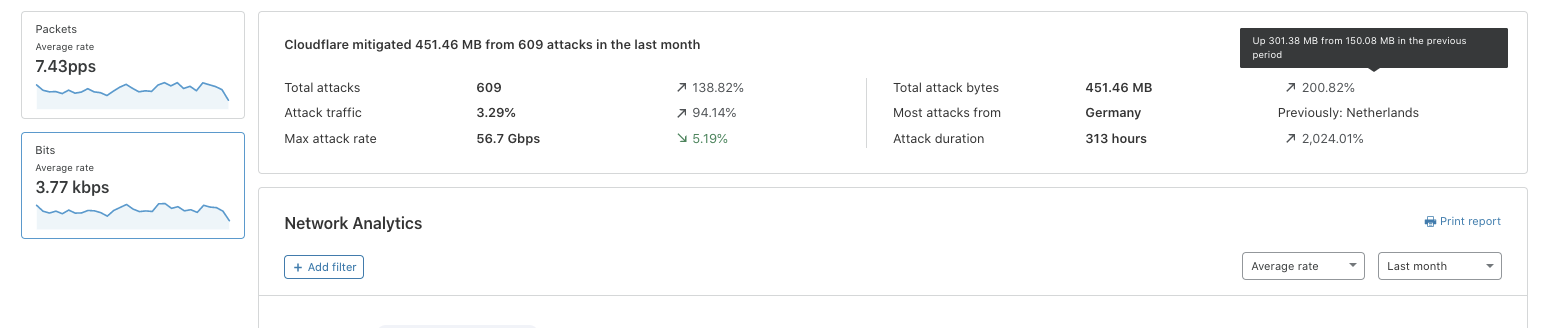
DDoS Trends Insights
First and foremost, we are adding a new DDoS Insights & Trends card, which provides dynamic insights into your attack trends over time. This feature provides a real-time view of the number of attacks, the percentage of attack traffic, the maximum attack rates, the total mitigated bytes, the main attack origin country, and the total duration of attacks, which can indicate the potential downtime that was prevented. These data points were surfaced as the most crucial ones by our customers in the feedback sessions. Along with the percentage of change period-over-period, our customers can easily understand how their security landscape evolves.
Troubleshooting made easy
In the main time series chart seen in the dashboard, we added an ability for users to change the Group-by field which enables users to customize the Y axis. This way, a user can quickly identify traffic anomalies and sudden changes in traffic based on criteria such as IP protocols, TCP flags, source country, and take action if needed with Magic Firewall, Spectrum or BYOIP.

Harnessing Cloudflare’s edge to empower our users
The DDoS Insights & Trends, the new investigation tools and the additional user interface enhancements can assist your organization to better understand your security landscape and take more meaningful actions as needed. We have more updates in Network Analytics dashboard, which are not covered in the scope of this post, including:
- Export logs as a CSV
- Zoom-in feature in the time series chart
- Drop-down view option for average rate and total volume
- Increased Top N views for source and destination values
- Addition of country and data center for source values
- New visualisation of the TCP flag distribution
Details on these updates can be found in our Help Center, which you can now access via the dashboard as well.
In the near future, we will also expand Network Analytics to Spectrum customers on the Business plan, and WAF customers on the Enterprise and Business plans. Stay tuned!
If you are a customer in Magic Transit, Spectrum or BYOIP, go try out the Network Analytics dashboard yourself today.
If you operate your own network, try Cloudflare Magic Transit for free with a limited time offer: https://www.cloudflare.com/lp/better/.