We’re excited to announce the expansion of the Network Analytics dashboard to Spectrum customers on the Enterprise plan. Additionally, this announcement introduces two major dashboard improvements for easier reporting and investigation.
Network Analytics
Cloudflare’s packet and bit oriented dashboard, Network Analytics, provides visibility into Internet traffic patterns and DDoS attacks in Layers 3 and 4 of the OSI model. This allows our users to better understand the traffic patterns and DDoS attacks as observed at the Cloudflare edge.
When the dashboard was first released in January, these capabilities were only available to Bring Your Own IP customers on the Spectrum and Magic Transit services, but now Spectrum customers using Cloudflare’s Anycast IPs are also supported.
Protecting L4 applications
Spectrum is Cloudflare’s L4 reverse-proxy service that offers unmetered DDoS protection and traffic acceleration for TCP and UDP applications. It provides enhanced traffic performance through faster TLS, optimized network routing, and high speed interconnection. It also provides encryption to legacy protocols and applications that don’t come with embedded encryption. Customers who typically use Spectrum operate services in which network performance and resilience to DDoS attacks are of utmost importance to their business, such as email, remote access, and gaming.
Spectrum customers can now view detailed traffic reports on DDoS attacks on their configured TCP/ UDP applications, including size of attacks, attack vectors, source location of attacks, and permitted traffic. What’s more, users can also configure and receive real-time alerts when their services are attacked.
Network Analytics: Rebooted
Since releasing the Network Analytics dashboard in January, we have been constantly improving its capabilities. Today, we’re announcing two major improvements that will make both reporting and investigation easier for our customers: DDoS Insights & Trend and Group-byFiltering for grouping-based traffic analysis.
DDoS Trends Insights
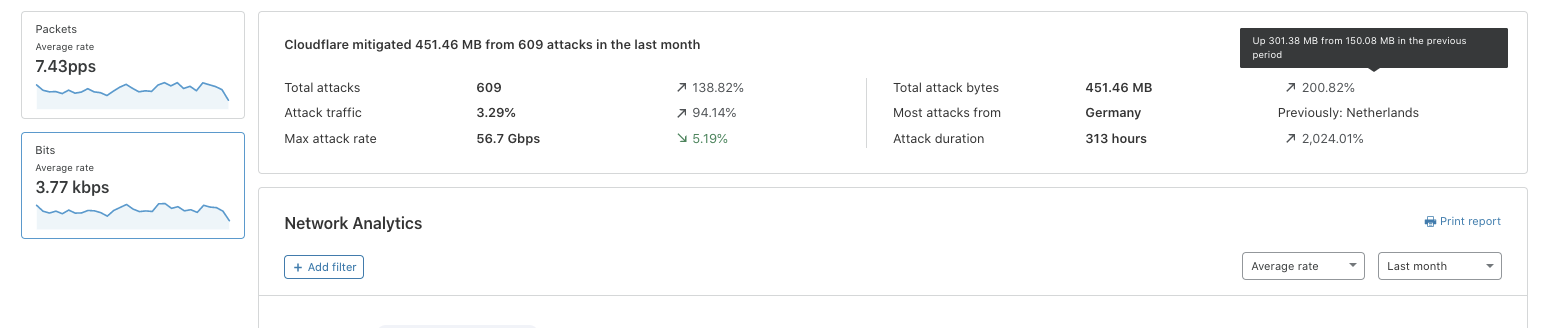
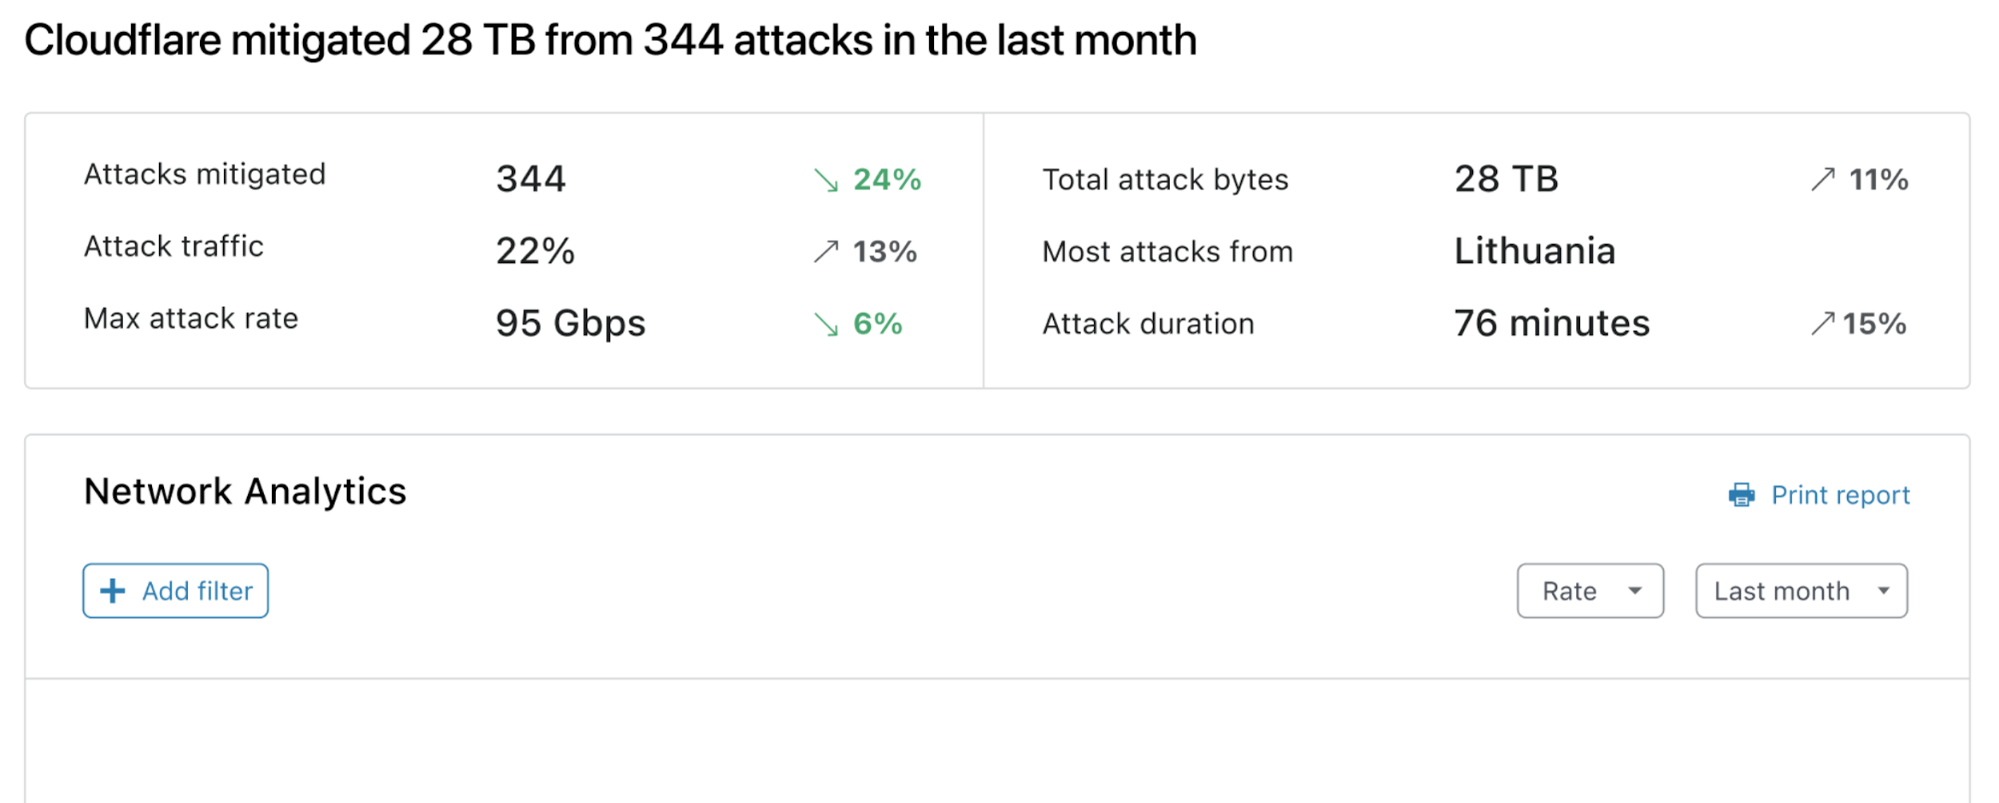
First and foremost, we are adding a new DDoS Insights & Trends card, which provides dynamic insights into your attack trends over time. This feature provides a real-time view of the number of attacks, the percentage of attack traffic, the maximum attack rates, the total mitigated bytes, the main attack origin country, and the total duration of attacks, which can indicate the potential downtime that was prevented. These data points were surfaced as the most crucial ones by our customers in the feedback sessions. Along with the percentage of change period-over-period, our customers can easily understand how their security landscape evolves.
Trends Insights
Troubleshooting made easy
In the main time series chart seen in the dashboard, we added an ability for users to change the Group-by field which enables users to customize the Y axis. This way, a user can quickly identify traffic anomalies and sudden changes in traffic based on criteria such as IP protocols, TCP flags, source country, and take action if needed with Magic Firewall, Spectrum or BYOIP.
Time Series Group-By Filtering
Harnessing Cloudflare’s edge to empower our users
The DDoS Insights & Trends, the new investigation tools and the additional user interface enhancements can assist your organization to better understand your security landscape and take more meaningful actions as needed. We have more updates in Network Analytics dashboard, which are not covered in the scope of this post, including:
Export logs as a CSV
Zoom-in feature in the time series chart
Drop-down view option for average rate and total volume
Increased Top N views for source and destination values
Addition of country and data center for source values
New visualisation of the TCP flag distribution
Details on these updates can be found in our Help Center, which you can now access via the dashboard as well.
In the near future, we will also expand Network Analytics to Spectrum customers on the Business plan, and WAF customers on the Enterprise and Business plans. Stay tuned!
If you are a customer in Magic Transit, Spectrum or BYOIP, go try out the Network Analytics dashboard yourself today.
In July 2020, I joined Cloudflare as a Product Management Intern on the DDoS (Distributed Denial of Service) team to enhance the benefits that Network Analytics brings to our customers. In the following, I am excited to share with you my experience with remote working as an intern, and how I acclimatized into Cloudflare. I also give details about what my work entailed and how we approached the process of Product Management.
Onboarding to Cloudflare during COVID19
As a long-time user of Cloudflare’s Free CDN plan myself, I was thrilled to join the company and learn what was happening behind the scenes while making its products. The entering internship class consisted of students and recent graduates from various backgrounds around the world – all with a mutual passion in helping build a better Internet.
The catch here was that 2020 would make the experience of being an intern very different. As it was the case with many other fellow interns, it was the first time I had taken up work remotely from scratch. The initial challenge was to integrate into the working environment without ever meeting colleagues in a physical office. Because everything took place online, it was much harder to pick up non-verbal cues that play a key role in communication, such as eye contact and body language.
To face this challenge, Cloudflare introduced creative and active ways in which we could better interact with one another. From the very first day, I was welcomed to an abundance of knowledge sharing talks and coffee chats with new and existing colleagues in different offices across the world. Whether it was data protection from the Legal team or going serverless with Workers, we were welcomed to afternoon seminars every week on a new area that was being pursued within Cloudflare.
Cloudflare not only retained the summer internship scheme, but in fact doubled the size of the class; this reinforced an optimistic mood within the entering class and a sense of personal responsibility. I was paired up with a mentor, a buddy, and a manager who helped me find my way quickly within Cloudflare, and without which my experience would not have been the same. Thanks to Omer, Pat, Val and countless others for all your incredible support!
Social interactions took various forms and were scheduled for all global time zones. I was invited to weekly virtual yoga sessions and intern meetups to network and discover what other interns across the world were working on. We got to virtually mingle at an “Intern Mixer” where we shared answers to philosophical prompts – what’s more, this was accompanied by an UberEats coupon for us to enjoy refreshments in our work-from-home setting. We also had Pub Quizzes with colleagues in the EMEA region to brush up on our trivia skills. At this uncertain time of the year, part of which I spent in complete self-isolation, these gatherings helped create a sense of belonging within the community, as well as an affinity towards the colleagues I interacted with.
Product Management at Cloudflare
My internship also offered a unique learning experience from the Product Management perspective. I took on the task of increasing the value of Network Analytics by giving customers and internal stakeholders improved transparency in the traffic patterns and attacks taking place. Network Analytics is Cloudflare’s packet- and bit-oriented dashboard that provides visibility into network- and transport-layer attacks which are mitigated across the world. Among various updates I led in visibility features is the new trends insights. During this time the dashboard was also extended to Enterprise customers on the Spectrum service, Cloudflare’s L4 reverse-proxy that provides DDoS protection against attacks and facilitates network performance.
I was at the intersection of multiple teams that contributed to Network Analytics from different angles, including user interface, UX research, product design, product content and backend engineering, among many others. The key to a successful delivery of Network Analytics as a product, given its interdisciplinary nature, meant that I actively facilitated communication and collaboration across experts in these teams as well as reflected the needs of the users.
I spent the first month of the internship approaching internal stakeholders, namely Customer Support engineers, Solutions Engineers, Customer Success Managers, and Product Managers, to better understand the common pain points. Given their past experience with customers, their insights revealed how Network Analytics could both leverage the existing visibility features to reduce overhead costs on the internal support side and empower users with actionable insights. This process also helped ensure that I didn’t reinvent wheels that had already been explored by existing Product Managers.
I then approached customers to enquire about desired areas for improvements. An example of such a desired improvement was that the display of data in the dashboard was not helping users infer any meaning regarding next steps. It did not answer questions like: What do these numbers represent in retrospect, and should I be concerned? Discussing these aspects helped validate the needs, and we subsequently came up with rough solutions to address them, such as dynamic trends view. Over the calls, we confirmed that – especially from those who rarely accessed the dashboard – having an overview of these numbers in the form of a trends card would incentivize users to log in more often and get more value from the product.
Trends Insights
The 1:1 dialogues were incredibly helpful in understanding how Network Analytics could be more effectively utilized, and guided ways for us to better surface the performance of our DDoS mitigation tools to our customers. In the first few weeks of the internship, I shadowed customer calls of other products; this helped me gain the confidence, knowledge, and language appropriate in Cloudflare’s user research. I did a run-through of the interview questions with a UX Researcher, and was informed on the procedure for getting in touch with appropriate customers. We even had bilingual calls where the Customer Success Manager helped translate the dialogues real-time.
In the following weeks, I synthesized these findings into a Product Requirements Document and lined up the features according to quarterly goals that could now be addressed in collaboration with other teams. After a formal review and discussion with Product Managers, engineers, and designers, we developed and rolled out each feature to the customers on a bi-weekly basis. We always welcomed feedback before and after the feature releases, as the goal wasn’t to have an ultimate final product, but to deliver incremental enhancements to meet the evolving needs of our customers.
Of course, all my interactions, including customer and internal stakeholder calls, were all held remotely. We all embraced video conferencing and instant chat messengers to make it feel as though we were physically close. I had weekly check-ins with various colleagues including my managers, Network Analytics team, DDoS engineering team, and DDoS reports team, to ensure that things were on track. For me, the key to working remotely was the instant chat function, which was not as intrusive as a fully fledged meeting, but a quick and considerate way to communicate in a tightly-knit team.
Looking Back
Product Management is a growth process – both for the corresponding individual and the product. As an individual, you grow fast through creative thinking, problem solving and incessant curiosity to better understand a product in the shoes of a customer. At the same time, the product continues to evolve and grow as a result of synergy between experts from diverse fields and customer feedback. Products are used and experienced by people, so it is a no-brainer that maintaining constant and direct feedback from our customers and internal stakeholders are what bolsters their quality.
It was an incredible opportunity to have been a part of an organization that represents one of the largest networks. Network Analytics is a window into the efforts led by Cloudflare engineers and technicians to help secure the Internet, and we are ambitious to scale the transparency across further mitigation systems in the future.
The internship was a successful immersive experience into the world of Network Analytics and Product Management, even in the face of a pandemic. Owing to Cloudflare’s flexibility and ready access to resources for remote work, I was able to adapt to the work environment from the first day onwards and gain an authentic learning experience into how products work. As I now return to university, I look back on an internship that significantly added to my personal and professional growth. I am happy to leave behind the latest evolution of Network Analytics dashboard with hopefully many more to come. Thanks to Cloudflare and all my colleagues for making this possible!
The collective thoughts of the interwebz
Manage Consent
To provide the best experiences, we use technologies like cookies to store and/or access device information. Consenting to these technologies will allow us to process data such as browsing behavior or unique IDs on this site. Not consenting or withdrawing consent, may adversely affect certain features and functions.
Functional
Always active
The technical storage or access is strictly necessary for the legitimate purpose of enabling the use of a specific service explicitly requested by the subscriber or user, or for the sole purpose of carrying out the transmission of a communication over an electronic communications network.
Preferences
The technical storage or access is necessary for the legitimate purpose of storing preferences that are not requested by the subscriber or user.
Statistics
The technical storage or access that is used exclusively for statistical purposes.The technical storage or access that is used exclusively for anonymous statistical purposes. Without a subpoena, voluntary compliance on the part of your Internet Service Provider, or additional records from a third party, information stored or retrieved for this purpose alone cannot usually be used to identify you.
Marketing
The technical storage or access is required to create user profiles to send advertising, or to track the user on a website or across several websites for similar marketing purposes.