Tag Archives: Network Analytics

How we built Network Analytics v2

Post Syndicated from Alex Forster original http://blog.cloudflare.com/building-network-analytics-v2/

How we built Network Analytics v2

How we built Network Analytics v2

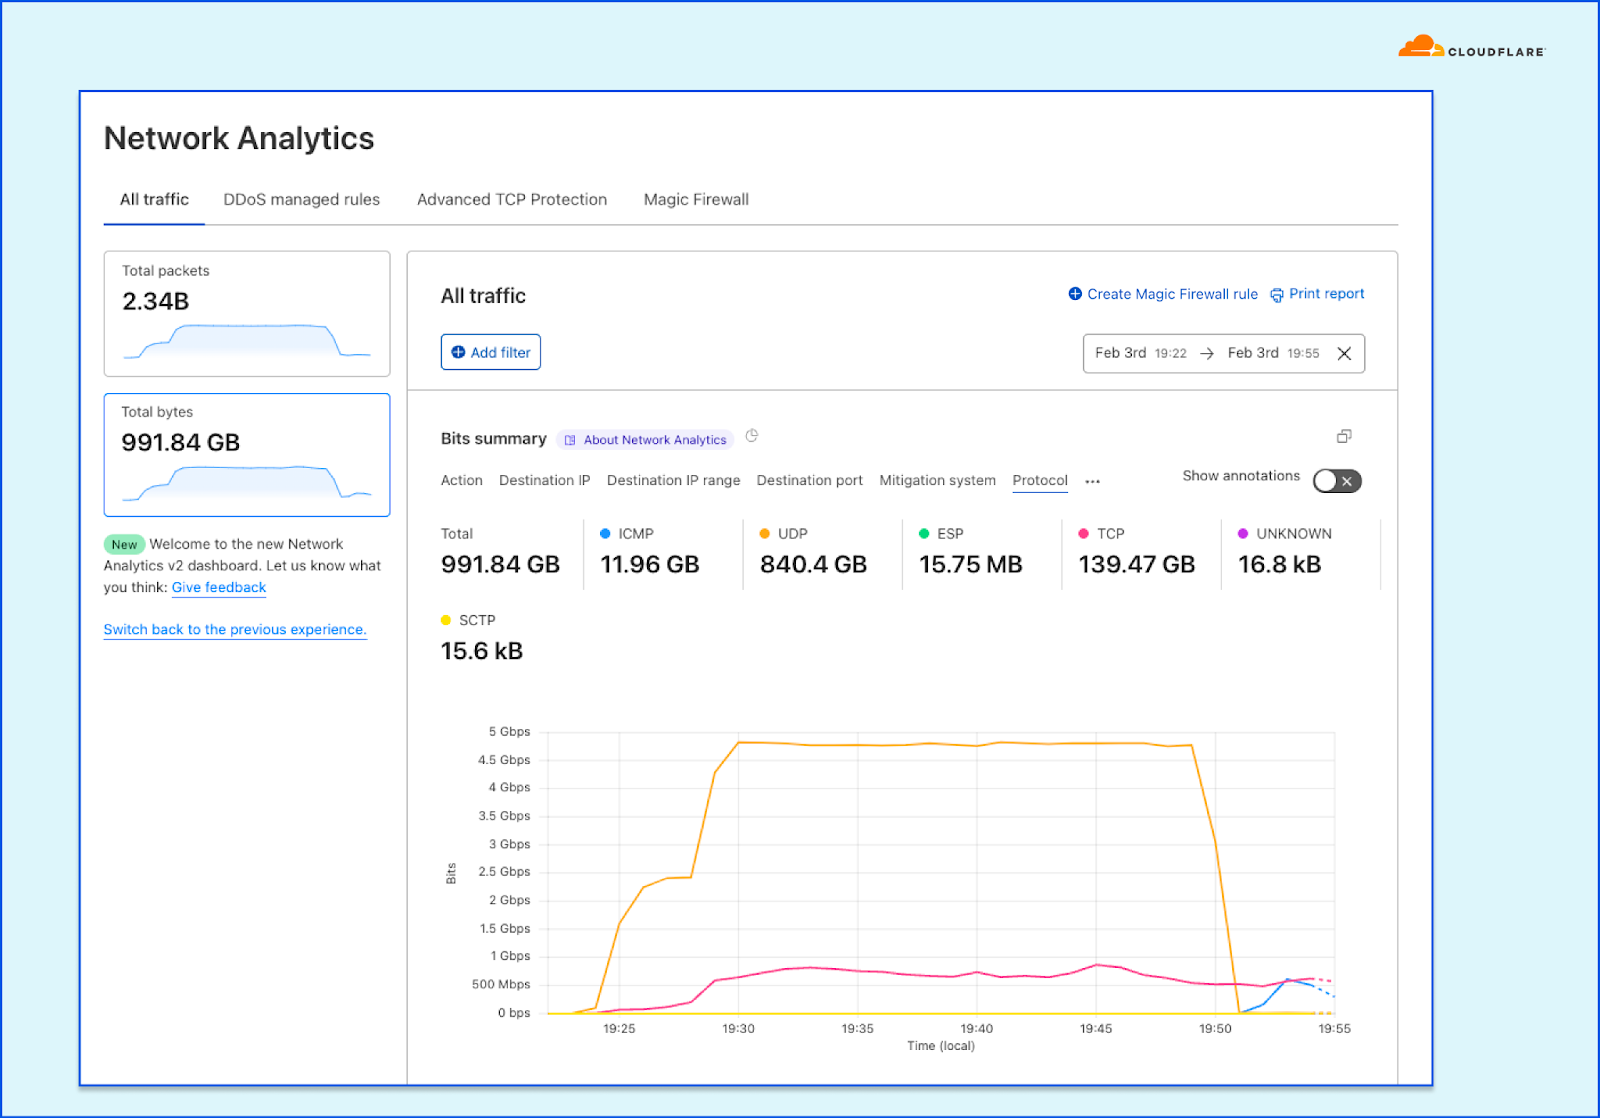
Network Analytics v2 is a fundamental redesign of the backend systems that provide real-time visibility into network layer traffic patterns for Magic Transit and Spectrum customers. In this blog post, we'll dive into the technical details behind this redesign and discuss some of the more interesting aspects of the new system.

To protect Cloudflare and our customers against Distributed Denial of Service (DDoS) attacks, we operate a sophisticated in-house DDoS detection and mitigation system called dosd. It takes samples of incoming packets, analyzes them for attacks, and then deploys mitigation rules to our global network which drop any packets matching specific attack fingerprints. For example, a simple network layer mitigation rule might say “drop UDP/53 packets containing responses to DNS ANY queries”.

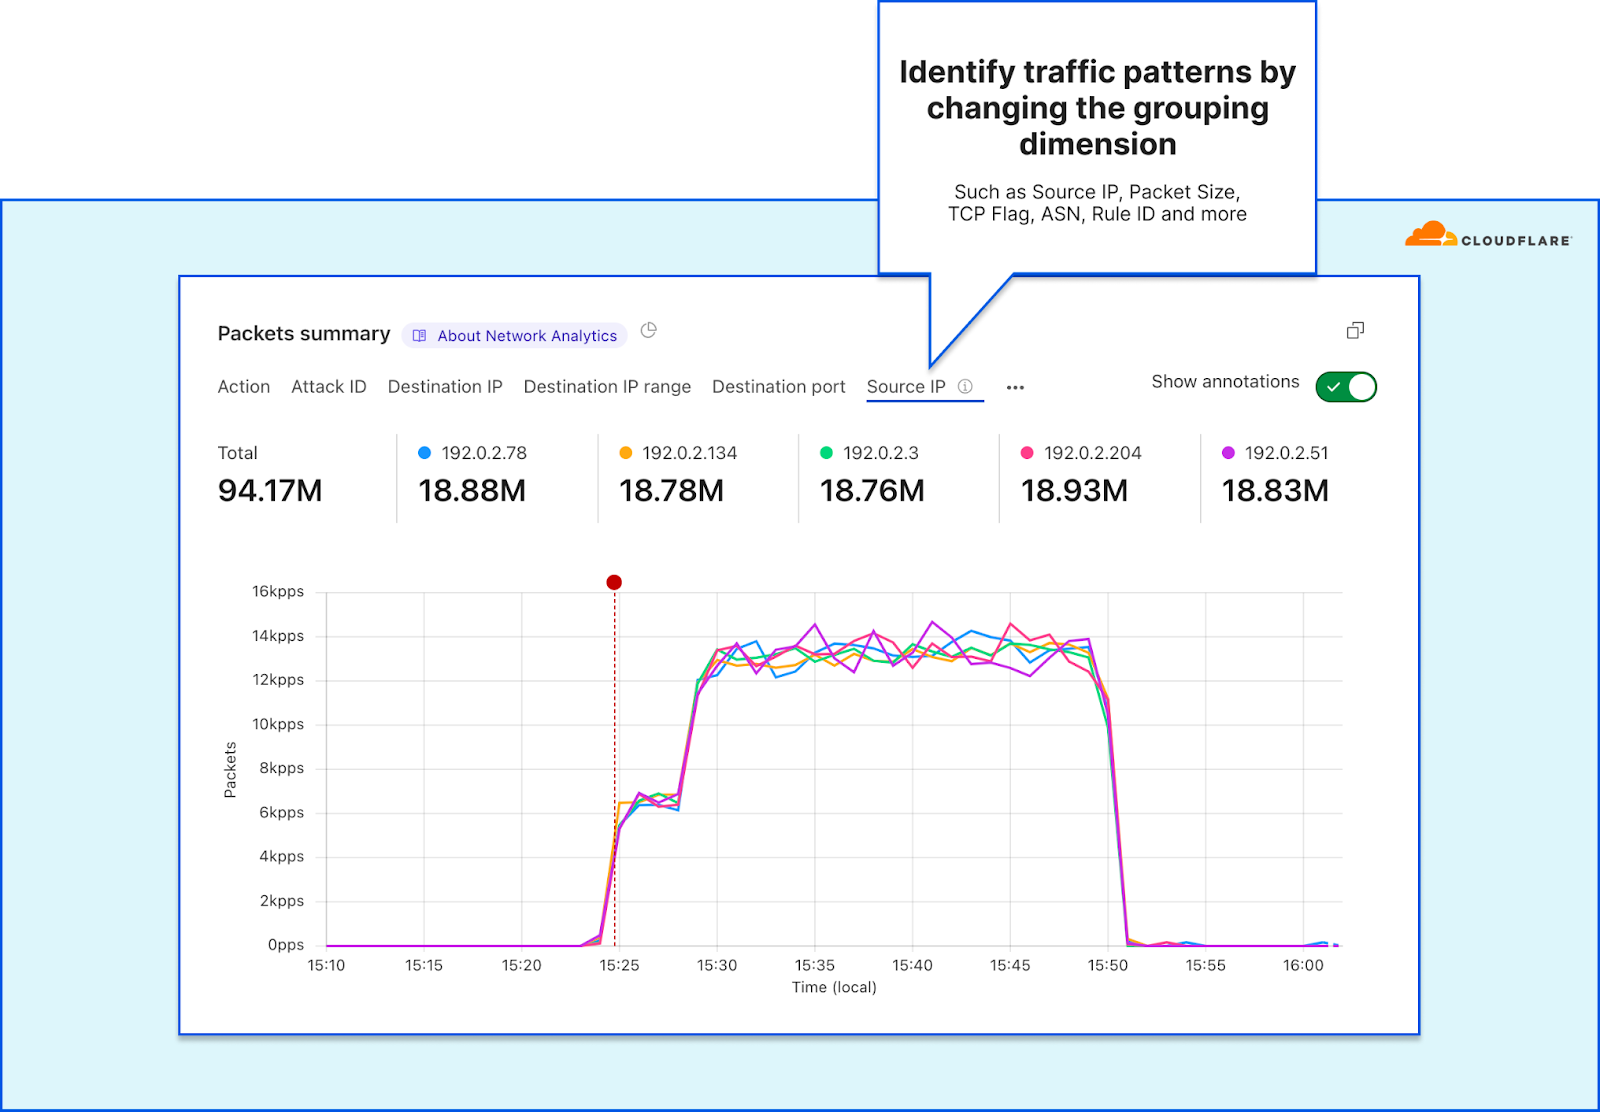
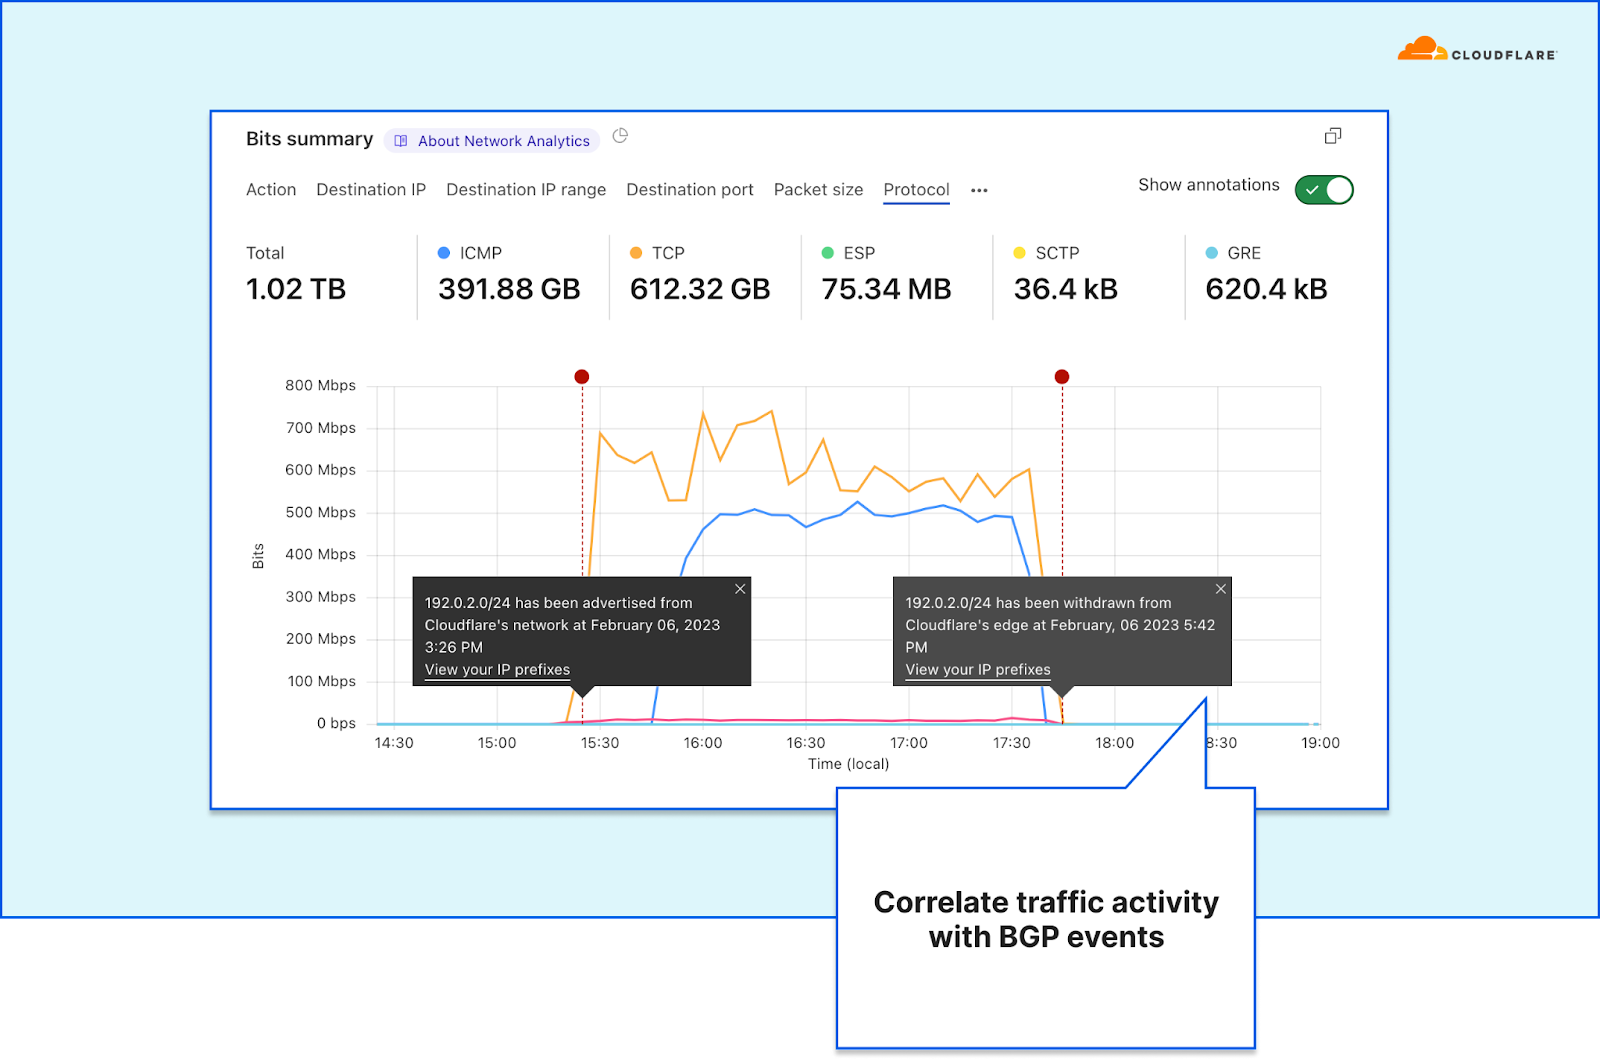
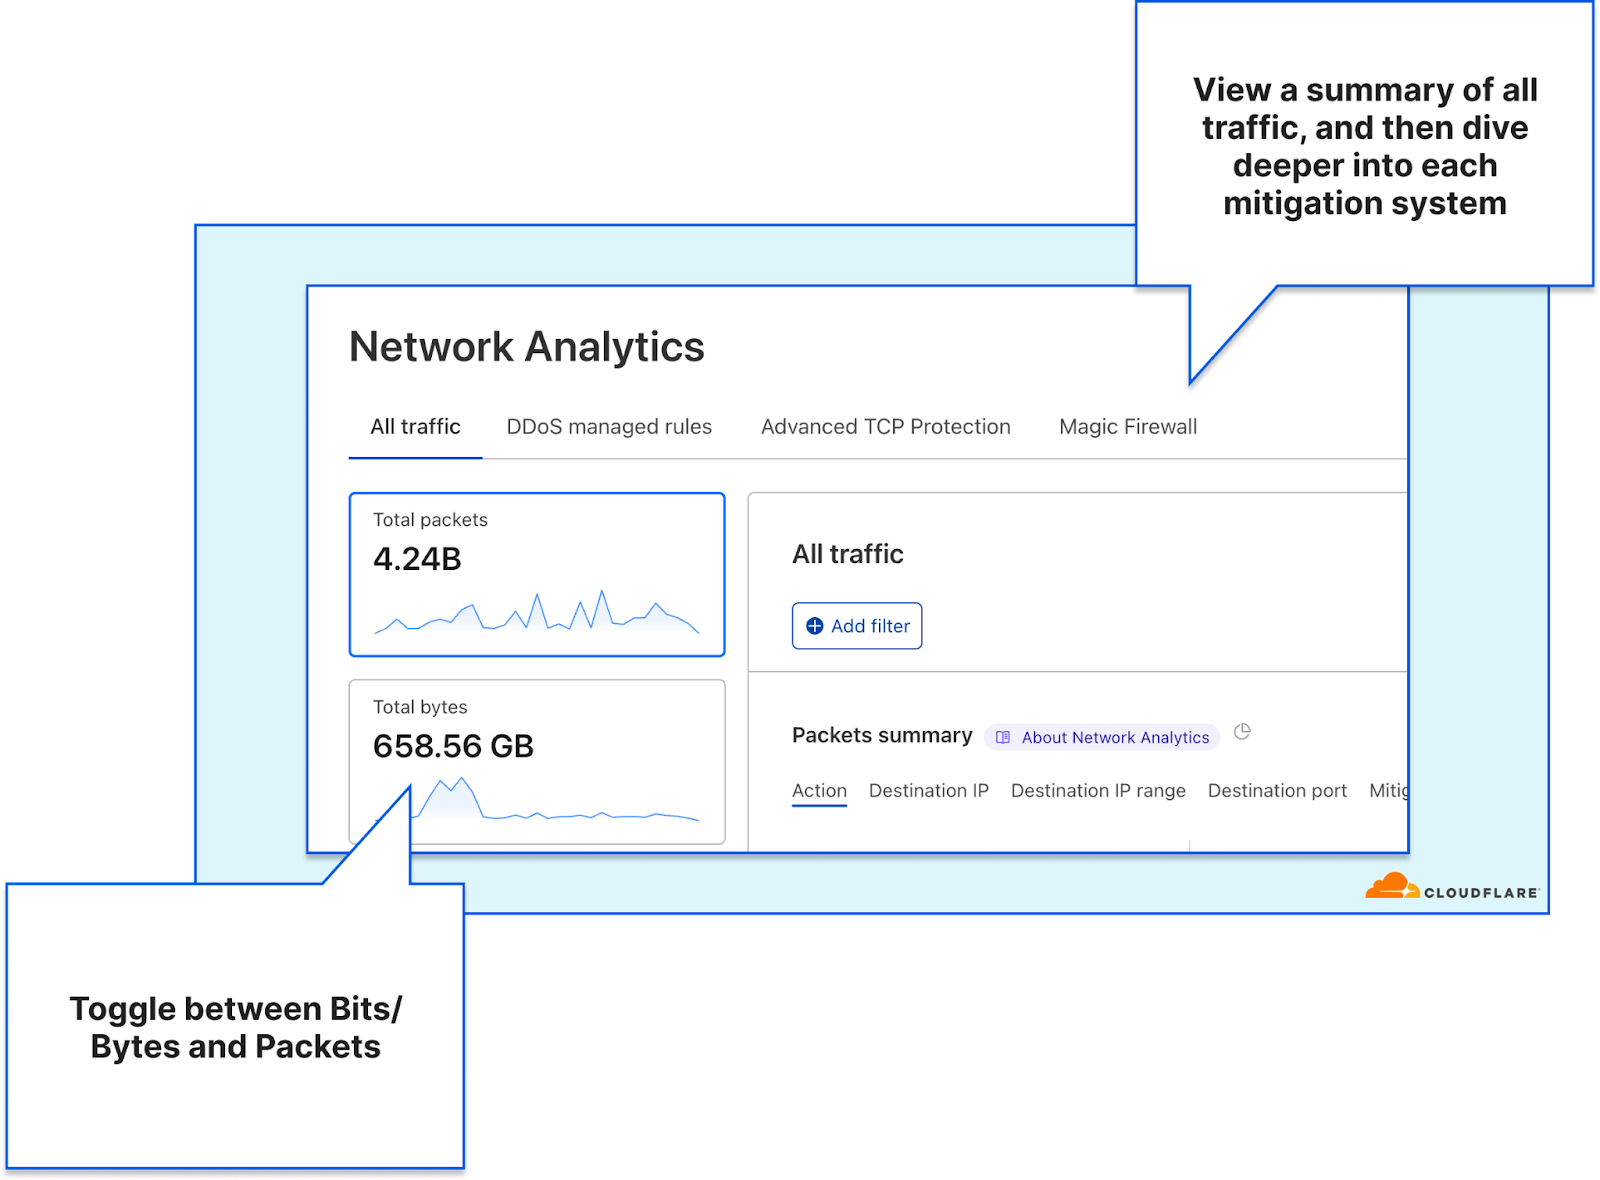
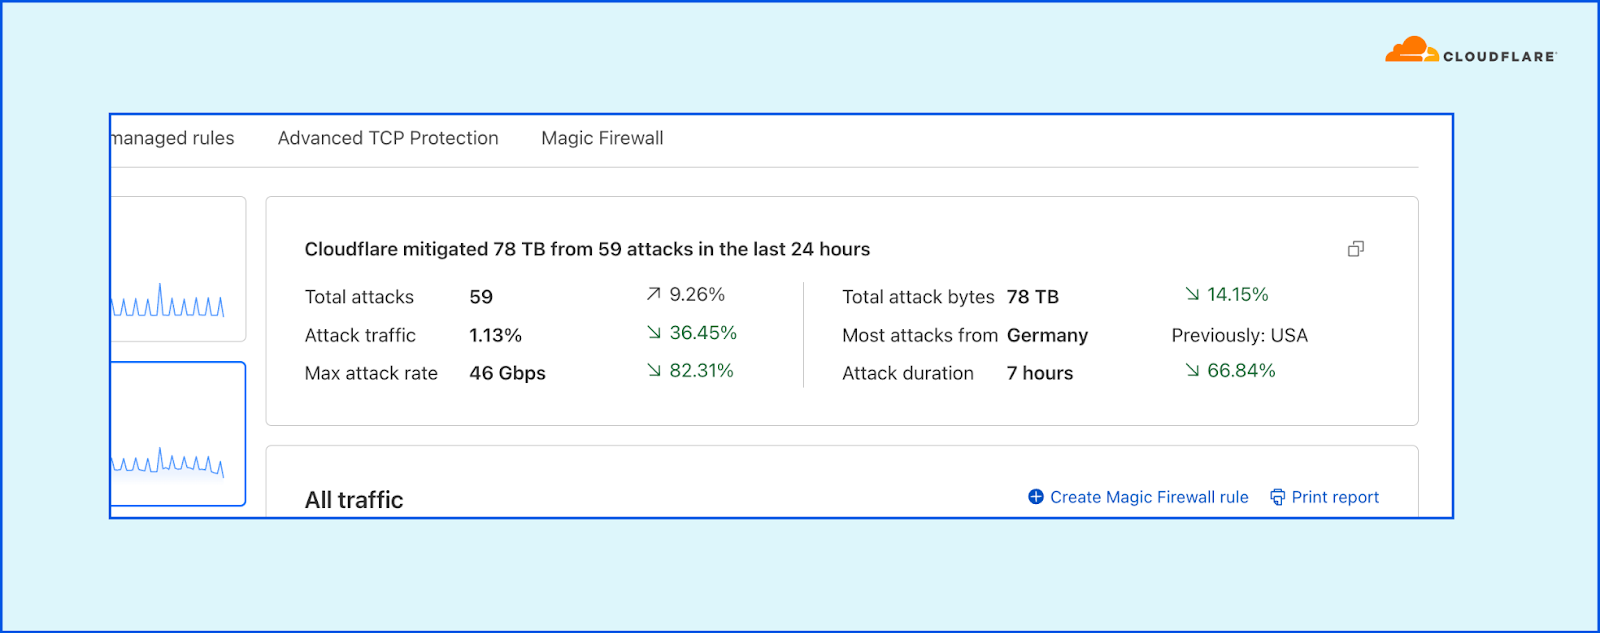
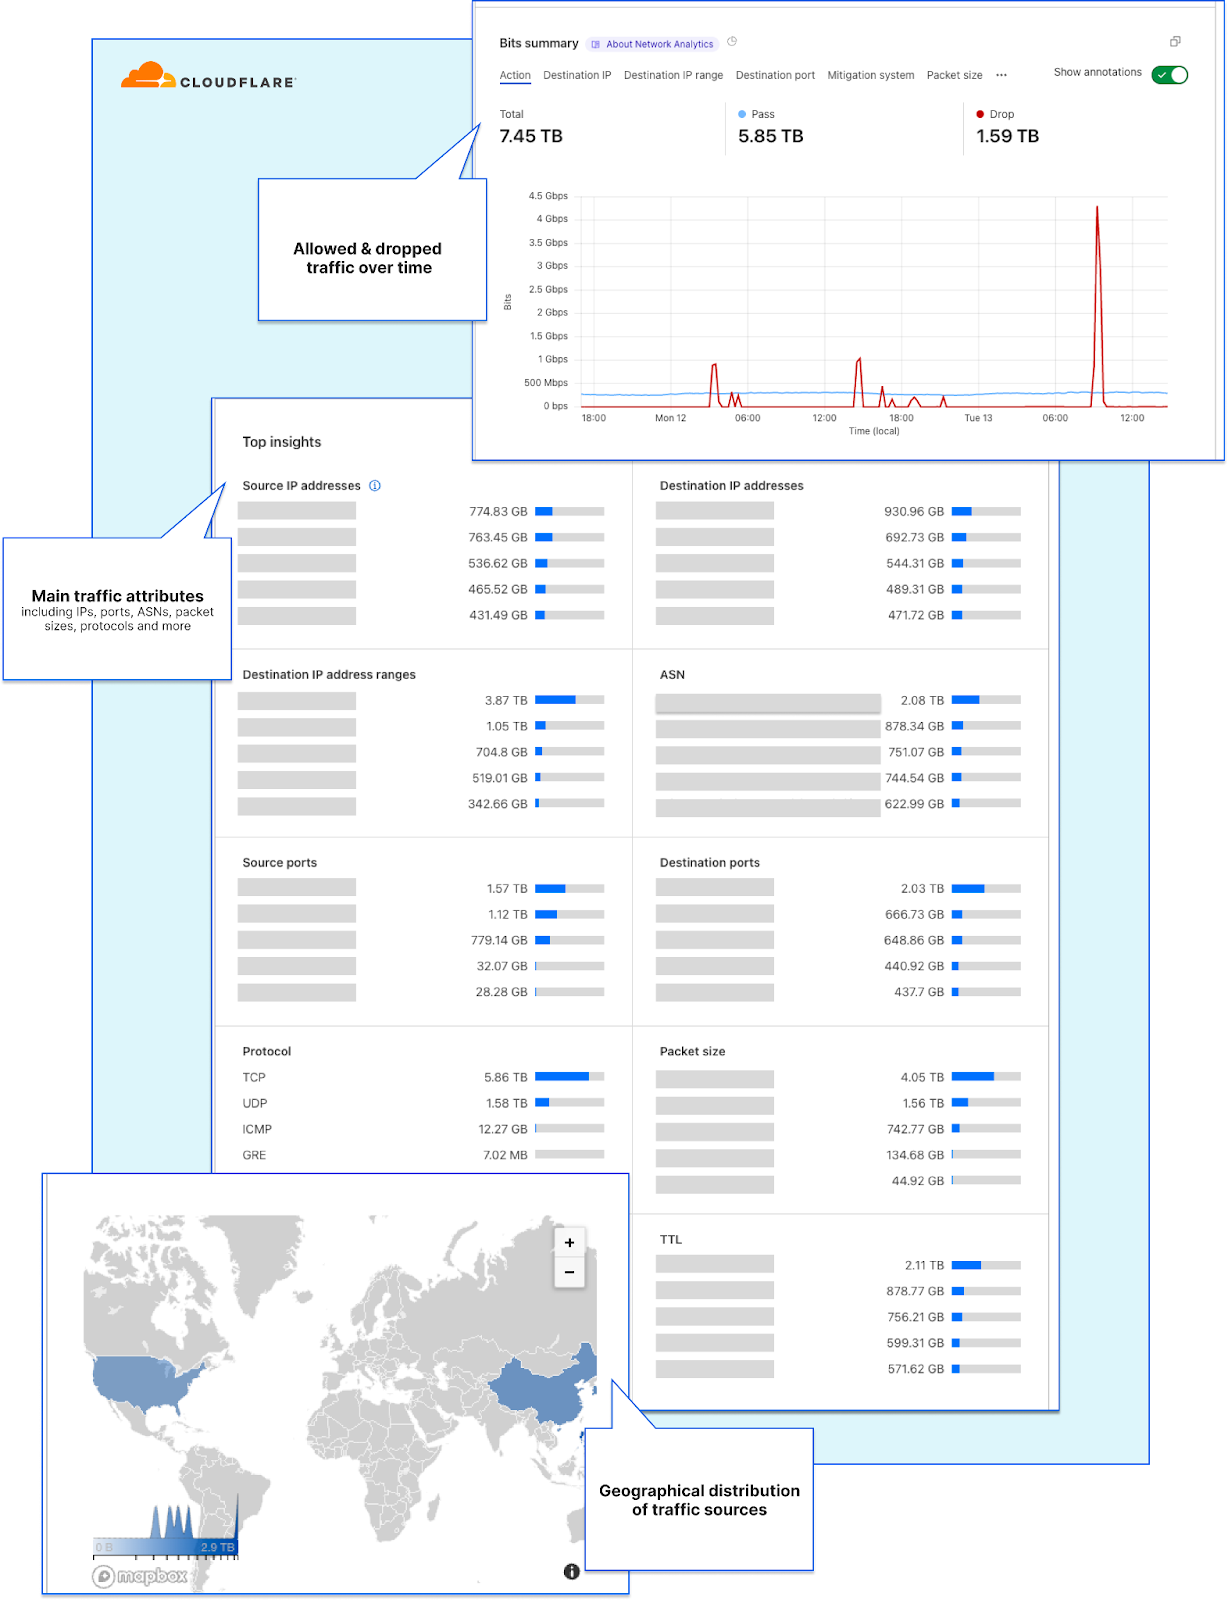
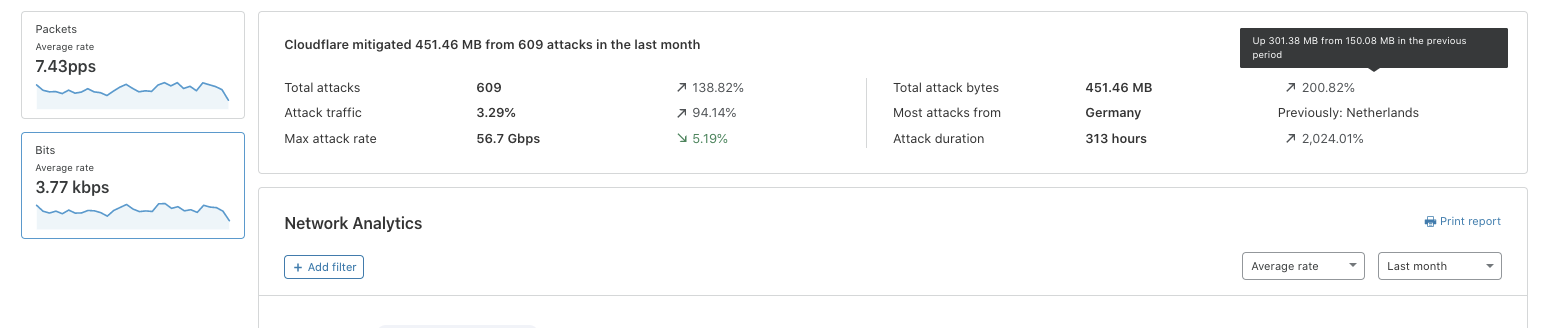
In order to give our Magic Transit and Spectrum customers insight into the mitigation rules that we apply to their traffic, we introduced a new reporting system called "Network Analytics" back in 2020. Network Analytics is a data pipeline that analyzes raw packet samples from the Cloudflare global network. At a high level, the analysis process involves trying to match each packet sample against the list of mitigation rules that dosd has deployed, so that it can infer whether any particular packet sample was dropped due to a mitigation rule. Aggregated time-series data about these packet samples is then rolled up into one-minute buckets and inserted into a ClickHouse database for long-term storage. The Cloudflare dashboard queries this data using our public GraphQL APIs, and displays the data to customers using interactive visualizations.

What was wrong with v1?

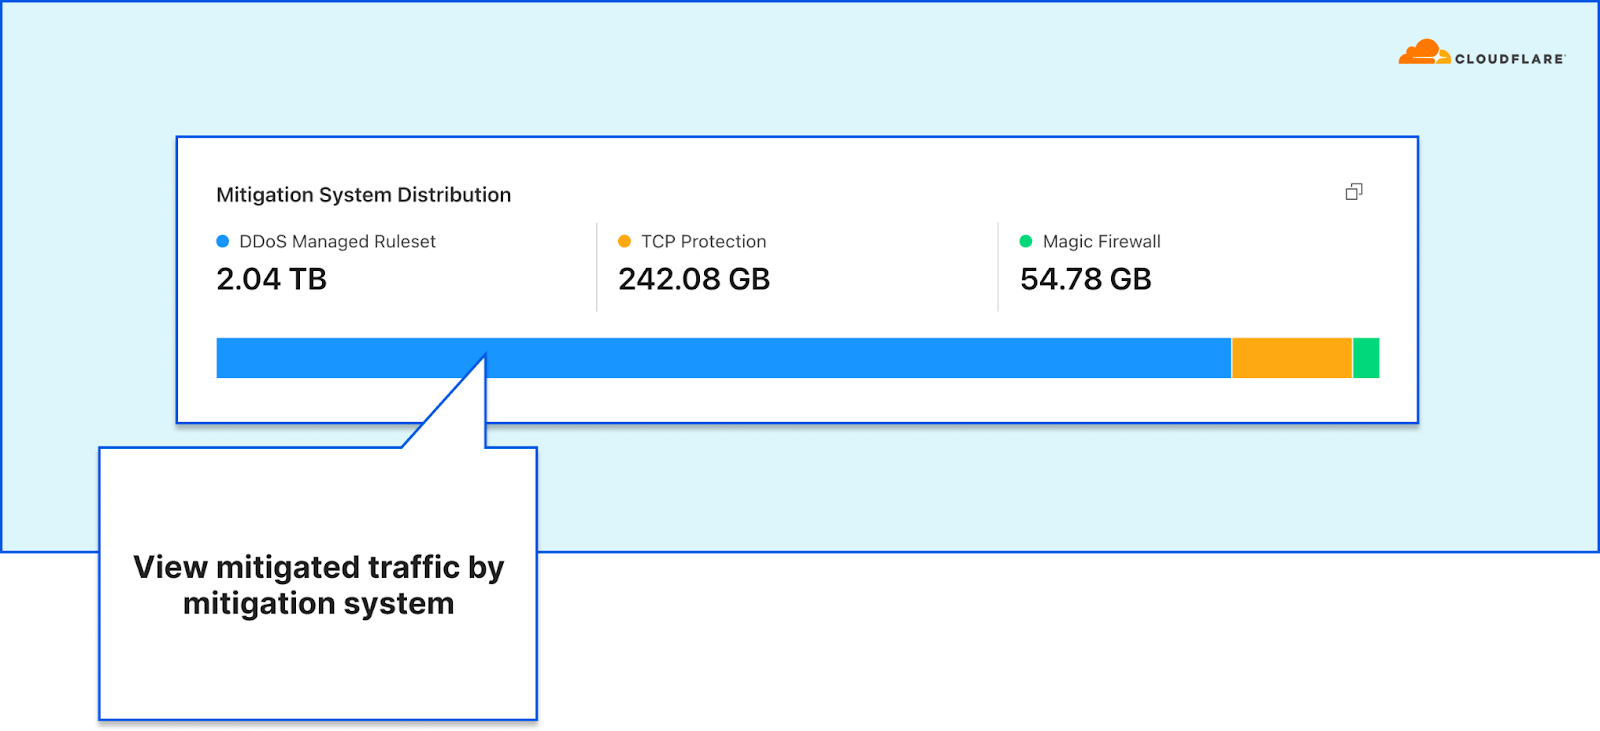
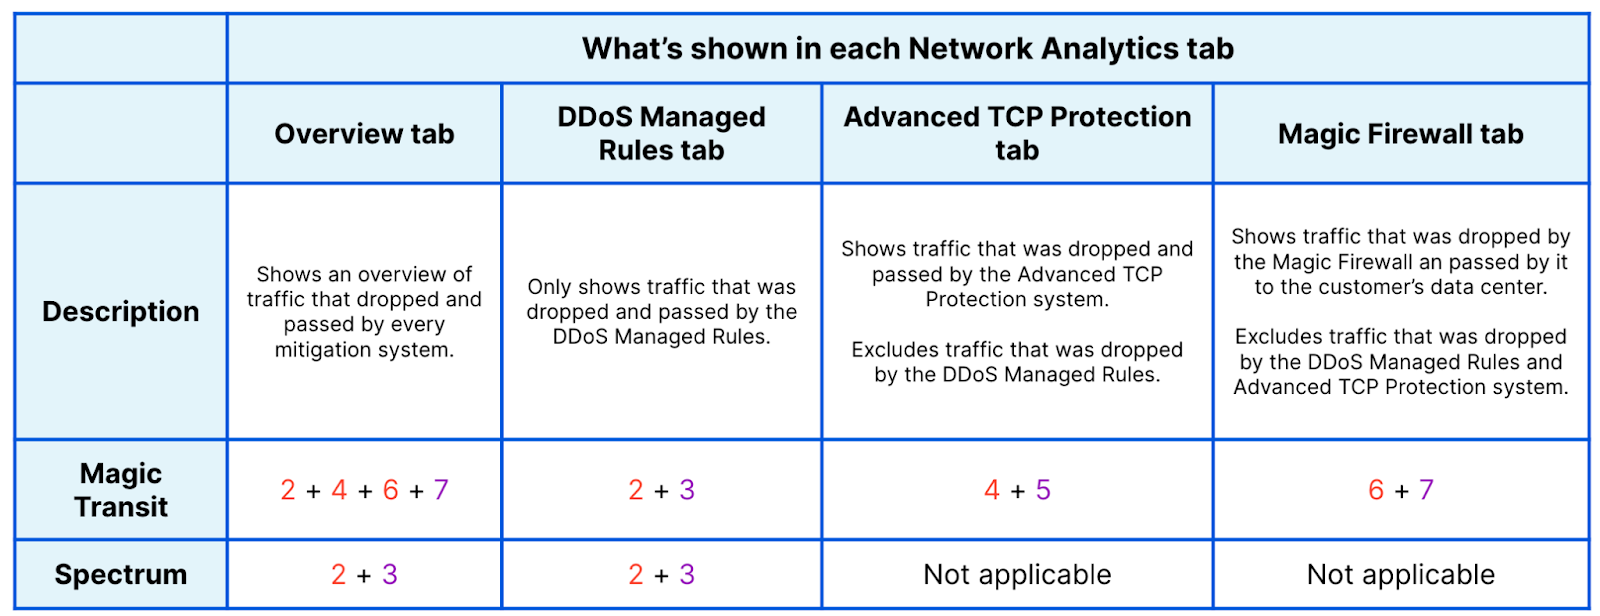
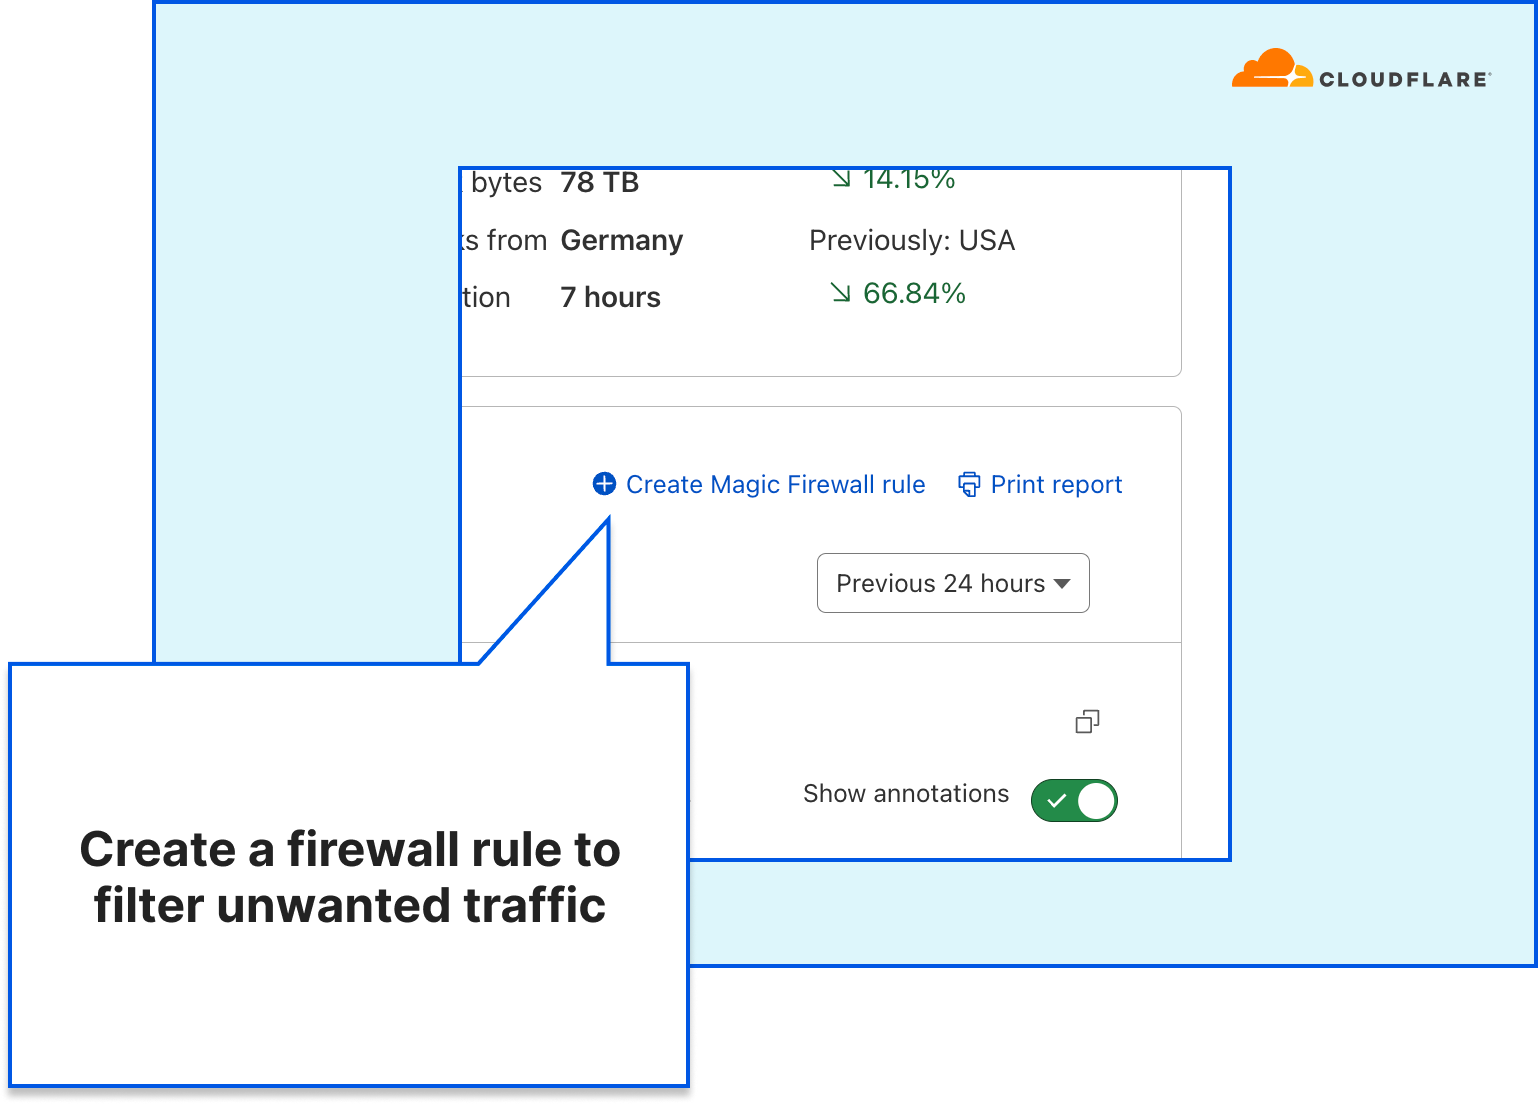
This original implementation of Network Analytics delivered a ton of value to customers and has served us well. However, in the years since it was launched, we have continued to significantly improve our mitigation capabilities by adding entirely new mitigation systems like Advanced TCP Protection (otherwise known as flowtrackd) and Magic Firewall. The original version of Network Analytics only reports on mitigations created by dosd, which meant we had a reporting system that was showing incomplete information.

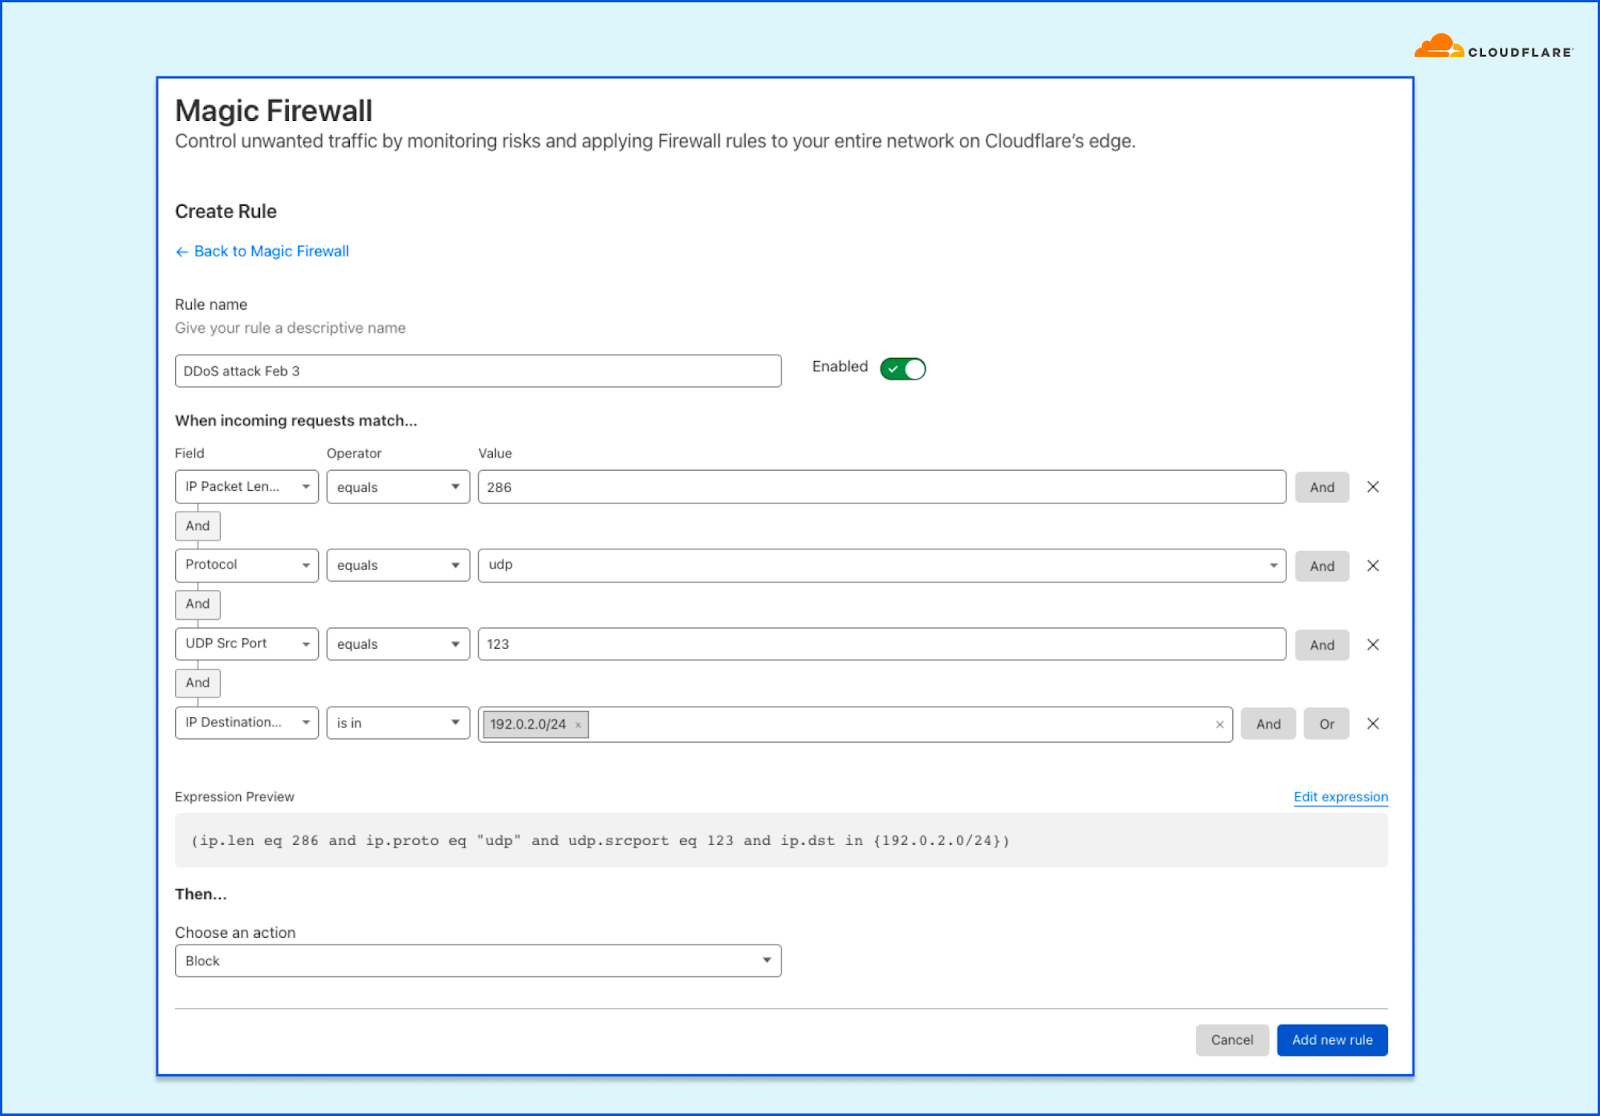
Adapting the original version of Network Analytics to work with Magic Firewall would have been relatively straightforward. Since firewall rules are “stateless”, we can tell whether a firewall rule matches a packet sample just by looking at the packet itself. That’s the same thing we were already doing to figure out whether packets match dosd mitigation rules.

However, despite our efforts, adapting Network Analytics to work with flowtrackd turned out to be an insurmountable problem. flowtrackd is “stateful”, meaning it determines whether a packet is part of a legitimate connection by tracking information about the other packets it has seen previously. The original Network Analytics design is incompatible with stateful systems like this, since that design made an assumption that the fate of a packet can be determined simply by looking at the bytes inside it.

Rethinking our approach

Rewriting a working system is not usually a good idea, but in this case it was necessary since the fundamental assumptions made by the old design were no longer true. When starting over with Network Analytics v2, it was clear to us that the new design not only needed to fix the deficiencies of the old design, it also had to be flexible enough to grow to support future products that we haven’t even thought of yet. To meet this high bar, we needed to really understand the core principles of network observability.

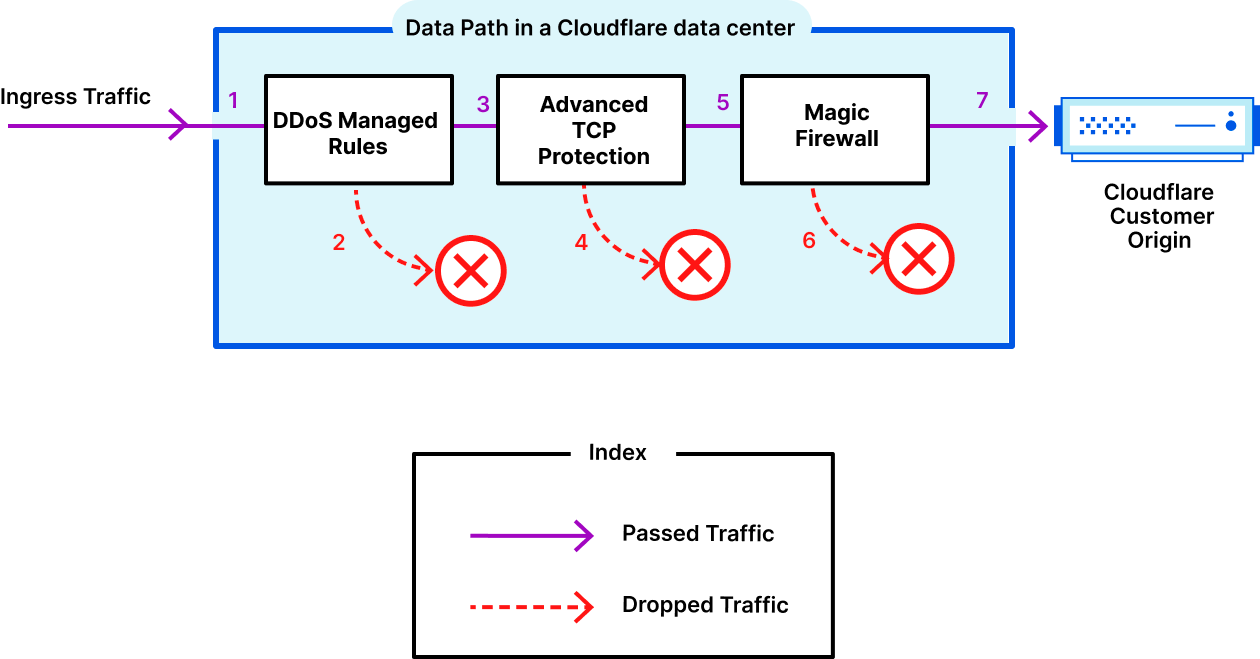
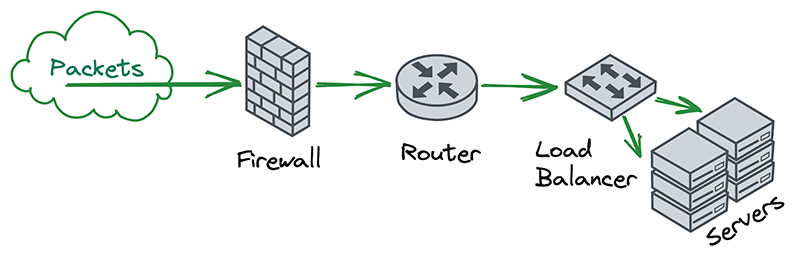
In the world of on-premise networks, packets typically chain through a series of appliances that each serve their own special purposes. For example, a packet may first pass through a firewall, then through a router, and then through a load balancer, before finally reaching the intended destination. The links in this chain can be thought of as independent “network functions”, each with some well-defined inputs and outputs.

How we built Network Analytics v2

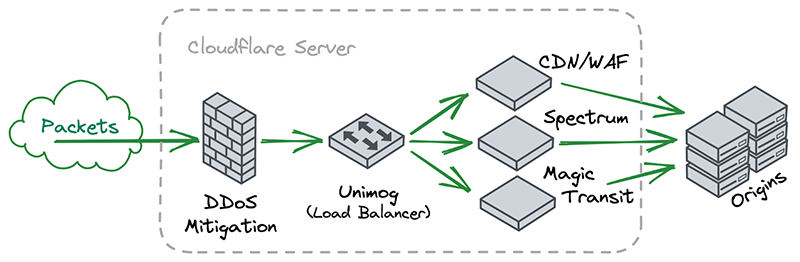
A key insight for us was that, if you squint a little, Cloudflare’s software architecture looks very similar to this. Each server receives packets and chains them through a series of independent and specialized software components that handle things like DDoS mitigation, firewalling, reverse proxying, etc.

How we built Network Analytics v2

After noticing this similarity, we decided to explore how people with traditional networks monitor them. Universally, the answer is either Netflow or sFlow.

How we built Network Analytics v2

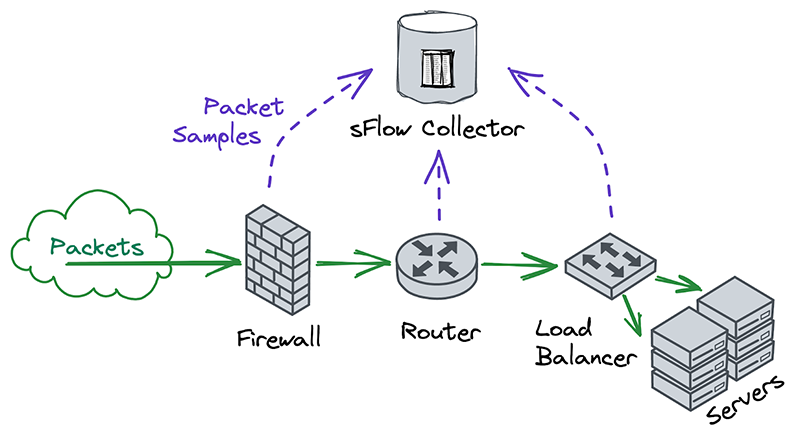
Nearly all on-premise hardware appliances can be configured to send a stream of Netflow or sFlow samples to a centralized flow collector. Traditional network operators tend to take these samples at many different points in the network, in order to monitor each device independently. This was different from our approach, which was to take packet samples only once, as soon as they entered the network and before performing any processing on them.

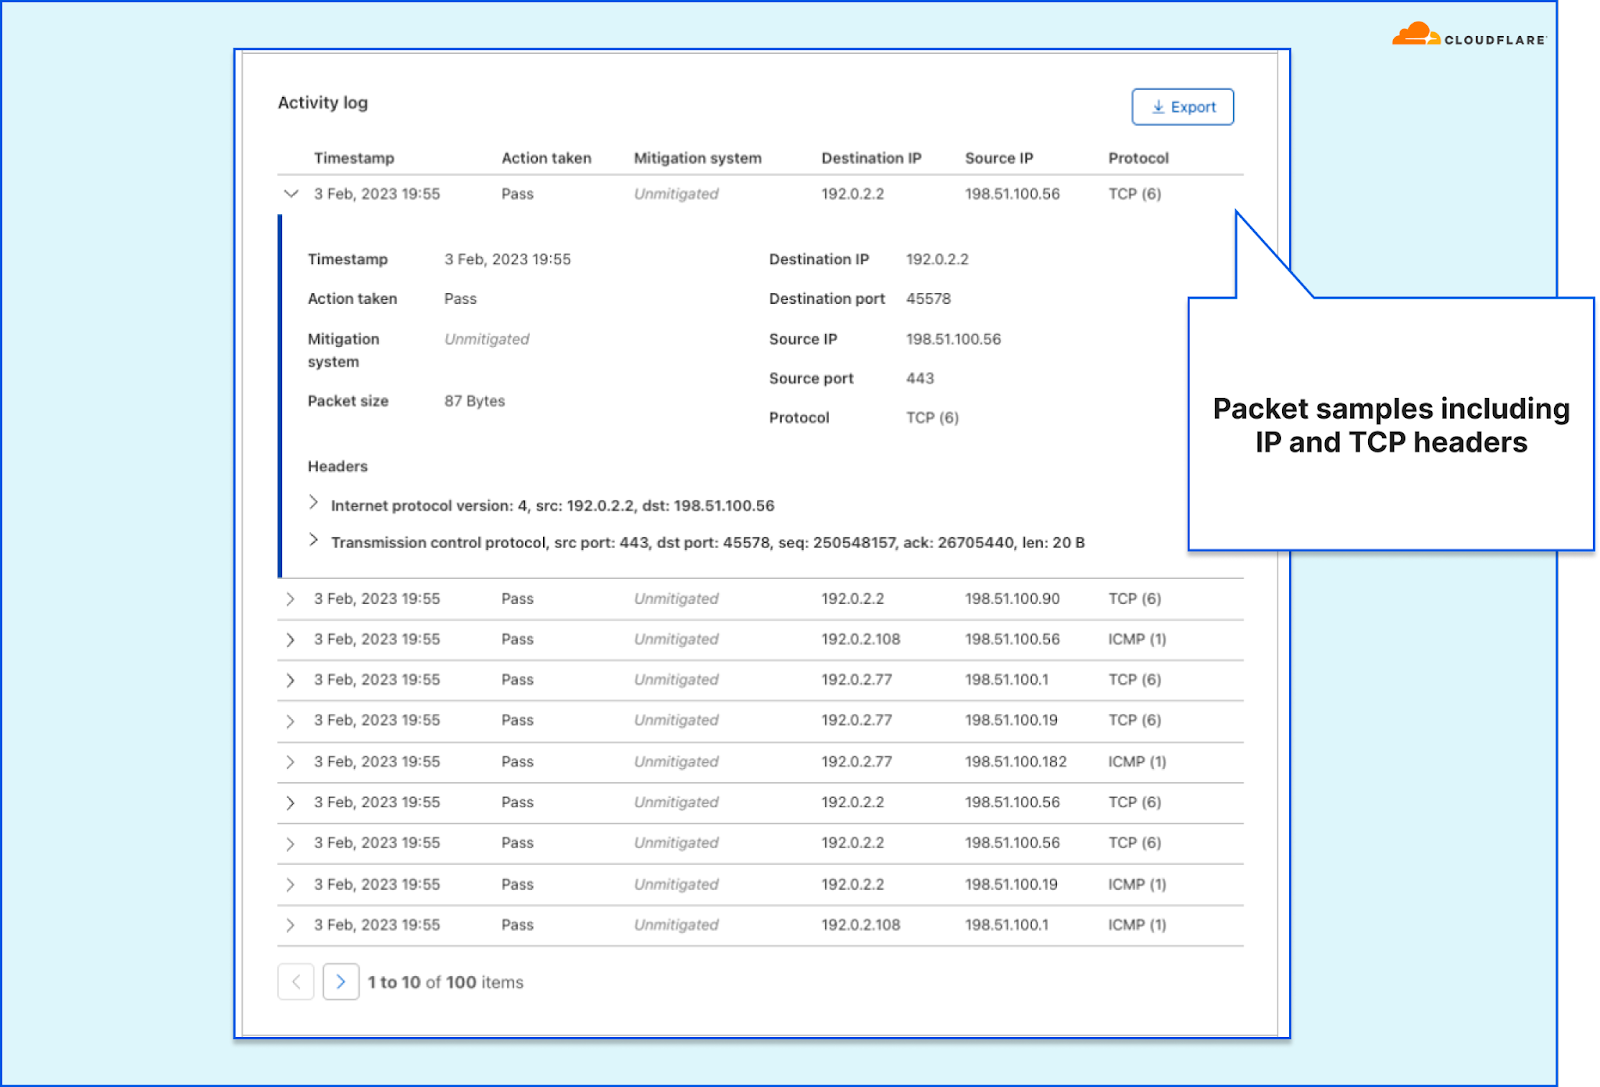
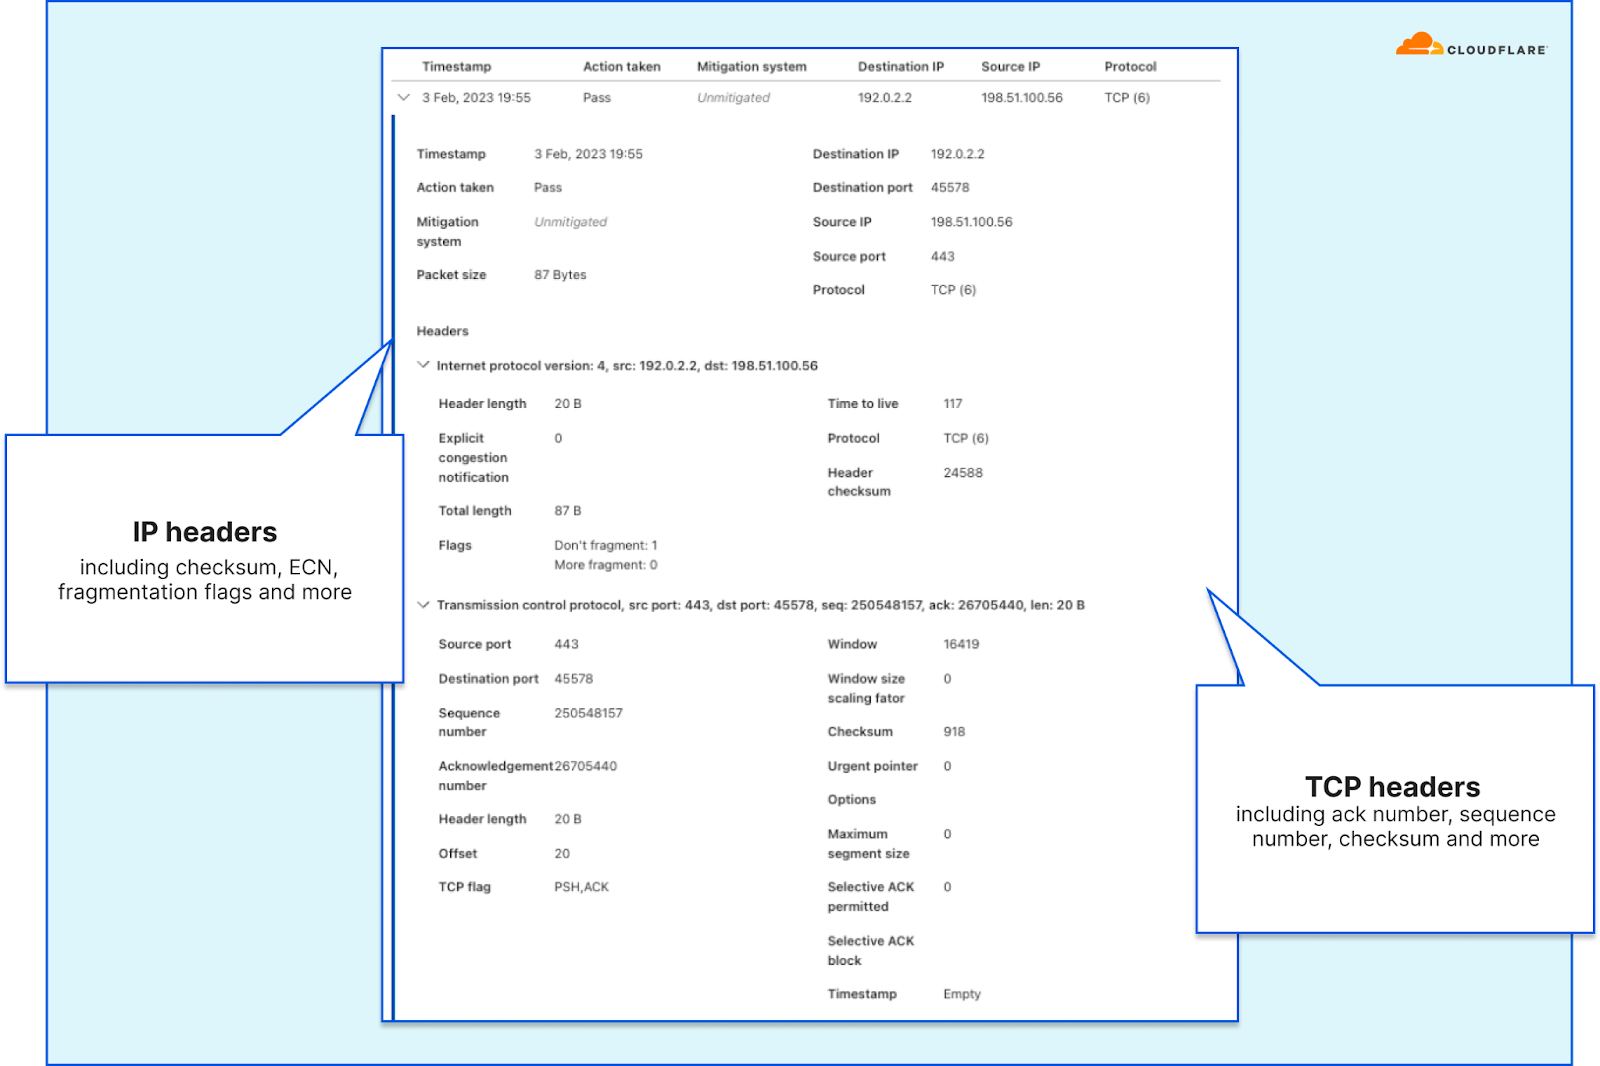
Another interesting thing we noticed was that Netflow and sFlow samples contain more than just information about packet contents. They also contain lots of metadata, such as the interface that packets entered and exited on, whether they were passed or dropped, which firewall or ACL rule they hit, and more. The metadata format is also extensible, so that devices can include information in their samples which might not make sense for other samples to contain. This flexibility allows flow collectors to offer rich reporting without necessarily having to understand the functions that each device performs on a network.

The more we thought about what kind of features and flexibility we wanted in an analytics system, the more we began to appreciate the elegance of traditional network monitoring. We realized that we could take advantage of the similarities between Cloudflare’s software architecture and “network functions” by having each software component emit its own packet samples with its own context-specific metadata attached.

How we built Network Analytics v2

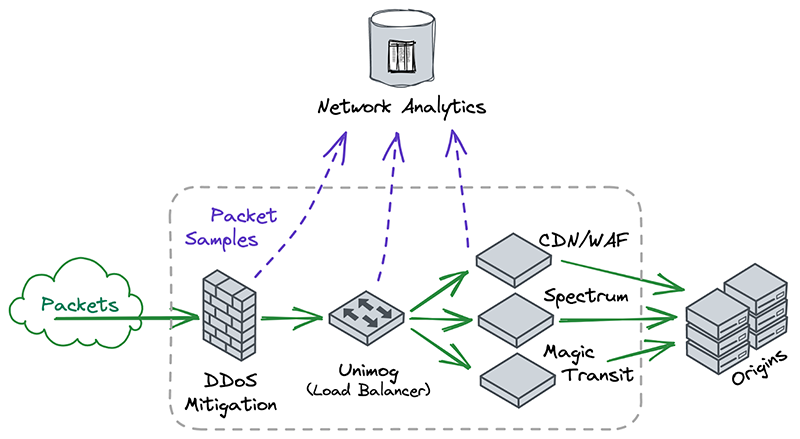
Even though it seemed counterintuitive for our software to emit multiple streams of packet samples this way, we realized through taking inspiration from traditional network monitoring that doing so was exactly how we could build the extensible and future-proof observability that we needed.

Design & implementation

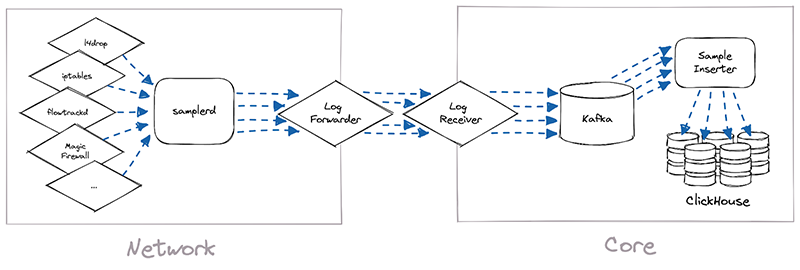
The implementation of Network Analytics v2 could be broken down into two separate pieces of work. First, we needed to build a new data pipeline that could receive packet samples from different sources, then normalize those samples and write them to long-term storage. We called this data pipeline samplerd – the “sampler daemon”.

The samplerd pipeline is relatively small and straightforward. It implements a few different interfaces that other software can use to send it metadata-rich packet samples. It then normalizes these samples and forwards them for postprocessing and insertion into a ClickHouse database.

How we built Network Analytics v2

The other, larger piece of work was to modify existing Cloudflare systems and make them send packet samples to samplerd. The rest of this post will cover a few interesting technical challenges that we had to overcome to adapt these systems to work with samplerd.

l4drop

The first system that incoming packets enter is our xdp daemon, called xdpd. In a few words, xdpd manages the installation of multiple XDP programs: a packet sampler, l4drop and L4LB. l4drop is where many types of attacks are mitigated. Mitigations done at this level are very cheap, because they happen so early in the network stack.

Before introducing samplerd, these XDP programs were organized like this:

How we built Network Analytics v2

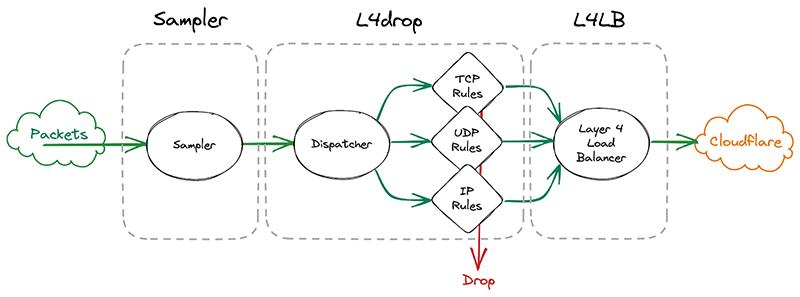
An incoming packet goes through a sampler that will emit a packet sample for some packets. It then enters l4drop, a set of programs that will decide the fate of a particular packet. Finally, L4LB is in charge of layer 4 load balancing.

It’s critical that the samples are emitted even for packets that get dropped further down in the pipeline, because that provides visibility into what’s dropped. That’s useful both from a customer perspective to have a more comprehensive view in dashboards but also to continuously adapt our mitigations as attacks change.

In l4drop’s original configuration, a packet sample is emitted prior to the mitigation decision. Thus, that sample can’t record the mitigation action that’s taken on that particular packet.

samplerd wants packet samples to include the mitigation outcome and other metadata that indicates why a particular mitigation decision was taken. For instance, a packet may be dropped because it matched an attack mitigation signature. Or it may pass because it matched a rate limiting rule and it was under the threshold for that rule. All of this is valuable information that needs to be shown to customers.

Given this requirement, the first idea we had was to simply move the sampler after l4drop and have l4drop just mark the packet as “to be dropped”, along with metadata for the reason why. The sampler component would then have all the necessary details to emit a sample with the final fate of the packet and its associated metadata. After emitting the sample, the sampler would drop or pass the packet.

However, this requires copying all the metadata associated with the dropping decision for every single packet, whether it will be sampled or not. The cost of this copying proved prohibitive considering that every packet entering Cloudflare goes through the xdpd programs.

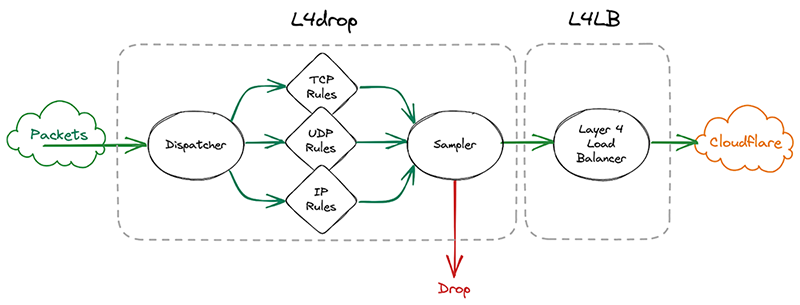
So we went back to the drawing board. What we actually need to know when making a sampling decision is whether we need to copy the metadata. We only need to copy the metadata if a particular packet will be sampled. That’s why it made sense to effectively split the sampler into two parts by sandwiching the programs that make the mitigation decision together. First, we make the mitigation decision, then we go through the mitigation decision programs. These programs can then decide to copy metadata only when a packet will be sampled. They will however always mark a packet with a DROP or PASS mark. Then the sampler will check the mark for sampling and the DROP/PASS mark. Based on those marks, they’ll build a sample if necessary and drop or pass the packet.

Given how tightly the sampler is now coupled with the rest of l4drop, it’s not a standalone part of xdpd anymore and the final result looks like this:

How we built Network Analytics v2

iptables

Another of our mitigation layers is iptables. We use it for some types of mitigations that we can’t perform in l4drop, like stateful connection tracking. iptables mitigations are organized as a list of rules that an incoming packet will be evaluated against. It’s also possible for a rule to jump to another rule when some conditions are met. Some of these rules will perform rate limiting, which will only drop packets beyond a certain threshold. For instance, we might drop all packets beyond a 10 packet-per-second threshold.

Prior to the introduction of samplerd, our typical rules would match on some characteristics of the packet – say, the IP and port – and make a decision whether to immediately drop or pass the packet.

To adapt our iptables rules to samplerd, we need to make them emit annotated samples, so that we can know why a decision was taken. To this end, one idea would be to just make the rules which drop packets also emit a nflog sample with a certain probability. One of the issues with that approach has to do with rate limiting rules. A packet may match such a rule, but the packet may be under the threshold and so that packet gets passed further down the line. That doesn’t work because we also want to sample those passed packets too, since it’s important for a customer to know what was passed and dropped by the rate limiter. But since a packet that passes the rate limiter may be dropped by further rules down the line, it’ll have multiple chances to be sampled, causing oversampling of some parts of the traffic. That would introduce statistical distortions in the sampled data.

To solve this, we can once again separate these steps like we did in l4drop, and make several sets of rules. First, the sampling decision is made by the first set of rules. Then, the pass-or-drop decision is made by the second set of rules. Finally, the sample can be emitted (if necessary), and then the packet can be passed or dropped by the third set of rules.

To communicate between rules we use Linux packet markings. For instance, a mark will be placed on a packet to signal that the packet will be sampled, and another mark will signify that the packet matched a particular rule and that it needs to be dropped.

For incoming packets, the rule in charge of the random sampling decision is evaluated first. Then the mitigation rules are evaluated next, in a specific order. When one of those rules decides to drop a packet, it jumps straight to the last set of rules, which will emit a sample if necessary before dropping. If no mitigation rule matches, eventually packets fall through to the last set of rules, where they will match a generic pass rule. That rule will emit a sample if necessary and pass the packet down the stack for further processing. By organizing rules in stages this way, we won’t ever double-sample packets.

ClickHouse & GraphQL

Once the samplerd daemon has the samples from the various mitigation systems, it does some light processing and ships those samples to be stored in ClickHouse. This inserter further enriches the metadata present in the sample, for instance by identifying the account associated with a particular destination IP. It also identifies ongoing attacks and adds a unique attack ID to each sample that is part of an attack.

We designed the inserters so that we’ll never need to change the data once it has been written, so that we can sustain high levels of insertion. Part of how we achieved this was by using ClickHouse’s MergeTree table engine. However, for improved performance, we have also used a less common ClickHouse table engine, called AggregatingMergeTree. Let’s dive into this using a simplified example.

Each packet sample is stored in a table that looks like the below:

Attack ID Dest IP Dest Port Sample Interval (SI)
abcd 1.1.1.1 53 1000
abcd 1.0.0.1 53 1000

The sample interval is the number of packets that went through between two samples, as we are using ABR.

These tables are then queried through the GraphQL API, either directly or by the dashboard. This required us to build a view of all the samples for a particular attack, to identify (for example) a fixed destination IP. These attacks may span days or even weeks and so these queries could potentially be costly and slow. For instance, a naive query to know whether the attack “abcd” has a fixed destination port or IP may look like this:

SELECT if(uniq(dest_ip) == 1, any(dest_ip), NULL), if(uniq(dest_port) == 1, any(dest_port), NULL)
FROM samples
WHERE attack_id = ‘abcd’

In the above query, we ask ClickHouse for a lot more data than we should need. We only really want to know whether there is one value or multiple values, yet we ask for an estimation of the number of unique values. One way to know if all values are the same (for values that can be ordered) is to check whether the maximum value is equal to the minimum. So we could rewrite the above query as:

SELECT if(min(dest_ip) == max(dest_ip), any(dest_ip), NULL), if(min(dest_port) == max(dest_port), any(dest_port), NULL)
FROM samples
WHERE attack_id = ‘abcd’

And the good news is that storing the minimum or the maximum takes very little space, typically the size of the column itself, as opposed to keeping the state that uniq() might require. It’s also very easy to store and update as we insert. So to speed up that query, we have added a precomputed table with running minimum and maximum using the AggregatingMergeTree engine. This is the special ClickHouse table engine that can compute and store the result of an aggregate function on a particular key. In our case, we will use the attackID as the key to group on, like this:

Attack ID min(Dest IP) max(Dest IP) min(Dest Port) max(Dest Port) sum(SI)
abcd 1.0.0.1 1.1.1.1 53 53 2000

Note: this can be generalized to many aggregating functions like sum(). The constraint on the function is that it gives the same result whether it’s given the whole set all at once or whether we apply the function to the value it returned on a subset and another value from the set.

Then the query that we run can be much quicker and simpler by querying our small aggregating table. In our experience, that table is roughly 0.002% of the original data size, although admittedly all columns of the original table are not present.

And we can use that to build a SQL view that would look like this for our example:

SELECT if(min_dest_ip == max_dest_ip, min_dest_ip, NULL), if(min_dest_port == max_dest_port, min_dest_port, NULL)
FROM aggregated_samples
WHERE attack_id = ‘abcd’

Attack ID Dest IP Dest Port Σ
abcd 53 2000

Implementation detail: in practice, it is possible that a row in the aggregated table gets split on multiple partitions. In that case, we will have two rows for a particular attack ID. So in production we have to take the min or max of all the rows in the aggregating table. That’s usually only three to four rows, so it’s still much faster than going over potentially thousands of samples spanning multiple days. In practice, the query we use in production is thus closer to:

SELECT if(min(min_dest_ip) == max(max_dest_ip), min(min_dest_ip), NULL), if(min(min_dest_port) == max(max_dest_port), min(min_dest_port), NULL)
FROM aggregated_samples
WHERE attack_id = ‘abcd’

Takeaways

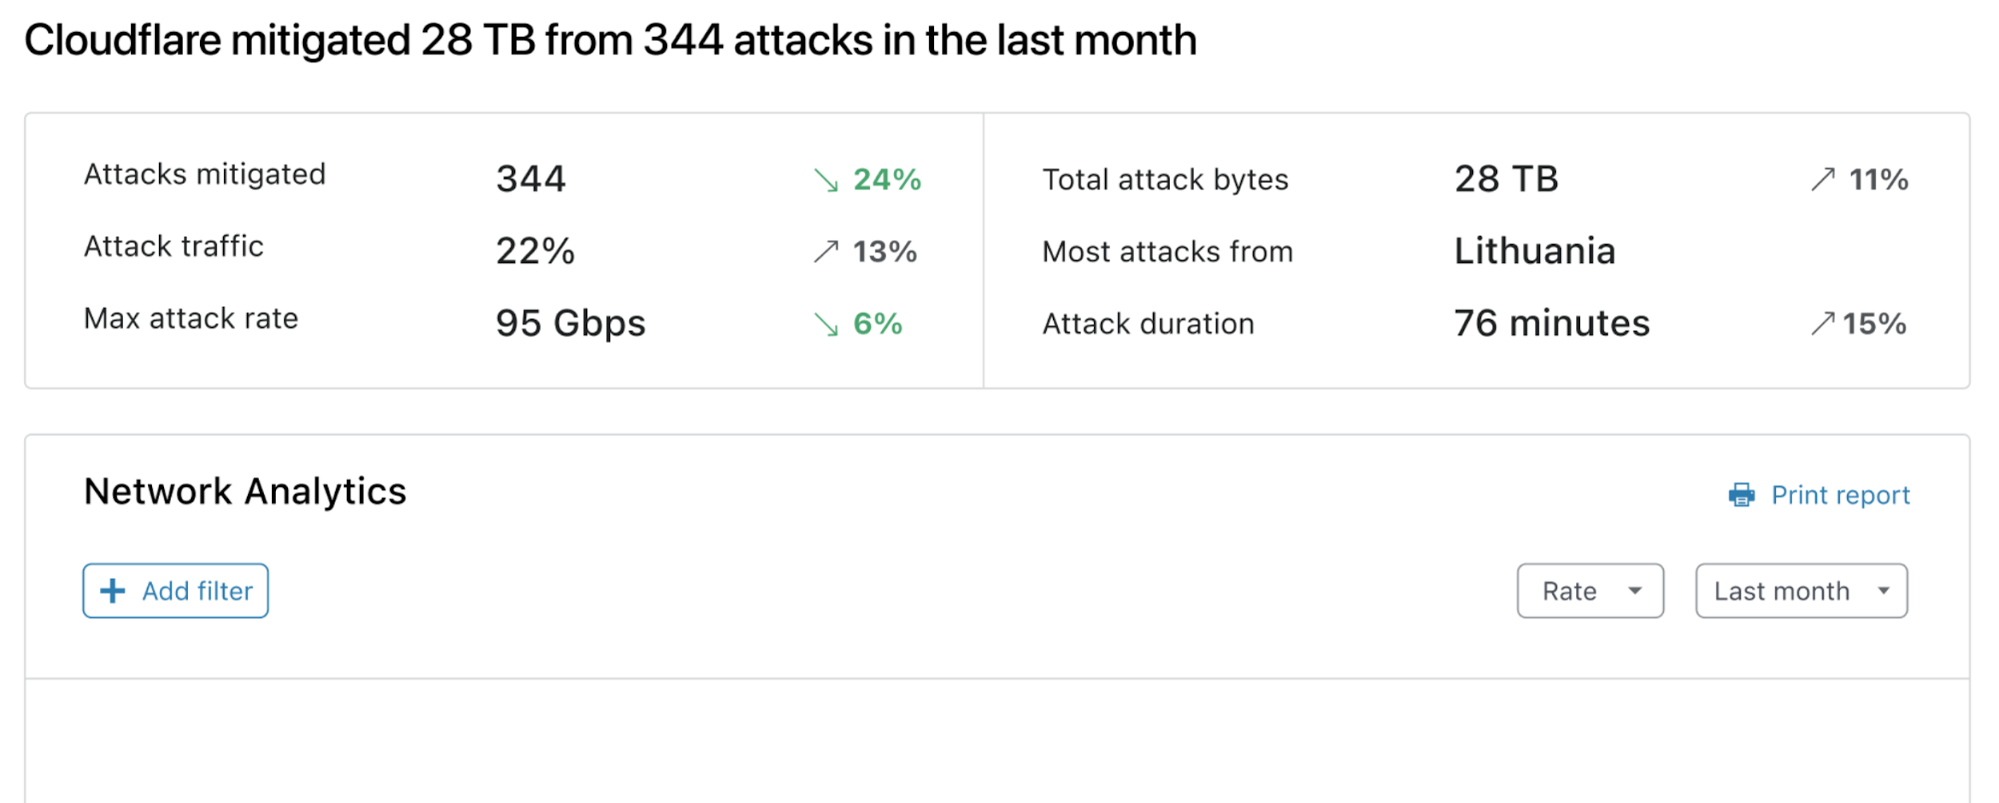
Rewriting Network Analytics was a bet that has paid off. Customers now have a more accurate and higher fidelity view of their network traffic. Internally, we can also now troubleshoot and fine tune our mitigation systems much more effectively. And as we develop and deploy new mitigation systems in the future, we are confident that we can adapt our reporting in order to support them.

Introducing Cloudflare’s new Network Analytics dashboard

Post Syndicated from Omer Yoachimik original https://blog.cloudflare.com/network-analytics-v2-announcement/

Introducing Cloudflare’s new Network Analytics dashboard

Introducing Cloudflare’s new Network Analytics dashboard

We’re pleased to introduce Cloudflare’s new and improved Network Analytics dashboard. It’s now available to Magic Transit and Spectrum customers on the Enterprise plan.

The dashboard provides network operators better visibility into traffic behavior, firewall events, and DDoS attacks as observed across Cloudflare’s global network. Some of the dashboard’s data points include:

  1. Top traffic and attack attributes
  2. Visibility into DDoS mitigations and Magic Firewall events
  3. Detailed packet samples including full packets headers and metadata
Introducing Cloudflare’s new Network Analytics dashboard
Network Analytics – Drill down by various dimensions
Introducing Cloudflare’s new Network Analytics dashboard
Network Analytics – View traffic by mitigation system

This dashboard was the outcome of a full refactoring of our network-layer data logging pipeline. The new data pipeline is decentralized and much more flexible than the previous one — making it more resilient, performant, and scalable for when we add new mitigation systems, introduce new sampling points, and roll out new services. A technical deep-dive blog is coming soon, so stay tuned.

In this blog post, we will demonstrate how the dashboard helps network operators:

  1. Understand their network better
  2. Respond to DDoS attacks faster
  3. Easily generate security reports for peers and managers

Understand your network better

One of the main responsibilities network operators bare is ensuring the operational stability and reliability of their network. Cloudflare’s Network Analytics dashboard shows network operators where their traffic is coming from, where it’s heading, and what type of traffic is being delivered or mitigated. These insights, along with user-friendly drill-down capabilities, help network operators identify changes in traffic, surface abnormal behavior, and can help alert on critical events that require their attention — to help them ensure their network’s stability and reliability.

Starting at the top, the Network Analytics dashboard shows network operators their traffic rates over time along with the total throughput. The entire dashboard is filterable, you can drill down using select-to-zoom, change the time-range, and toggle between a packet or bit/byte view. This can help gain a quick understanding of traffic behavior and identify sudden dips or surges in traffic.

Cloudflare customers advertising their own IP prefixes from the Cloudflare network can also see annotations for BGP advertisement and withdrawal events. This provides additional context atop of the traffic rates and behavior.

Introducing Cloudflare’s new Network Analytics dashboard
The Network Analytics dashboard time series and annotations

Geographical accuracy

One of the many benefits of Cloudflare’s Network Analytics dashboard is its geographical accuracy. Identification of the traffic source usually involves correlating the source IP addresses to a city and country. However, network-layer traffic is subject to IP spoofing. Malicious actors can spoof (alter) their source IP address to obfuscate their origin (or their botnet’s nodes) while attacking your network. Correlating the location (e.g., the source country) based on spoofed IPs would therefore result in spoofed countries. Using spoofed countries would skew the global picture network operators rely on.

To overcome this challenge and provide our users accurate geoinformation, we rely on the location of the Cloudflare data center wherein the traffic was ingested. We’re able to achieve geographical accuracy with high granularity, because we operate data centers in over 285 locations around the world. We use BGP Anycast which ensures traffic is routed to the nearest data center within BGP catchment.

Introducing Cloudflare’s new Network Analytics dashboard
Traffic by Cloudflare data center country from the Network Analytics dashboard

Detailed mitigation analytics

The dashboard lets network operators understand exactly what is happening to their traffic while it’s traversing the Cloudflare network. The All traffic tab provides a summary of attack traffic that was dropped by the three mitigation systems, and the clean traffic that was passed to the origin.

Introducing Cloudflare’s new Network Analytics dashboard
The All traffic tab in Network Analytics

Each additional tab focuses on one mitigation system, showing traffic dropped by the corresponding mitigation system and traffic that was passed through it. This provides network operators almost the same level of visibility as our internal support teams have. It allows them to understand exactly what Cloudflare systems are doing to their traffic and where in the Cloudflare stack an action is being taken.

Introducing Cloudflare’s new Network Analytics dashboard
Data path for Magic Transit customers

Using the detailed tabs, users can better understand the systems’ decisions and which rules are being applied to mitigate attacks. For example, in the Advanced TCP Protection tab, you can view how the system is classifying TCP connection states. In the screenshot below, you can see the distribution of packets according to connection state. For example, a sudden spike in Out of sequence packets may result in the system dropping them.

Introducing Cloudflare’s new Network Analytics dashboard
The Advanced TCP Protection tab in Network Analytics

Note that the presence of tabs differ slightly for Spectrum customers because they do not have access to the Advanced TCP Protection and Magic Firewall tabs. Spectrum customers only have access to the first two tabs.

Respond to DDoS attacks faster

Cloudflare detects and mitigates the majority of DDoS attacks automatically. However, when a network operator responds to a sudden increase in traffic or a CPU spike in their data centers, they need to understand the nature of the traffic. Is this a legitimate surge due to a new game release for example, or an unmitigated DDoS attack? In either case, they need to act quickly to ensure there are no disruptions to critical services.

The Network Analytics dashboard can help network operators quickly pattern traffic by switching the time-series’ grouping dimensions. They can then use that pattern to drop packets using the Magic Firewall. The default dimension is the outcome indicating whether traffic was dropped or passed. But by changing the time series dimension to another field such as the TCP flag, Packet size, or Destination port a pattern can emerge.

In the example below, we have zoomed in on a surge of traffic. By setting the Protocol field as the grouping dimension, we can see that there is a 5 Gbps surge of UDP packets (totalling at 840 GB throughput out of 991 GB in this time period). This is clearly not the traffic we want, so we can hover and click the UDP indicator to filter by it.

Introducing Cloudflare’s new Network Analytics dashboard
Distribution of a DDoS attack by IP protocols

We can then continue to pattern the traffic, and so we set the Source port to be the grouping dimension. We can immediately see that, in this case, the majority of traffic (838 GB) is coming from source port 123. That’s no bueno, so let’s filter by that too.

Introducing Cloudflare’s new Network Analytics dashboard
The UDP flood grouped by source port

We can continue iterating to identify the main pattern of the surge. An example of a field that is not necessarily helpful in this case is the Destination port. The time series is only showing us the top five ports but we can already see that it is quite distributed.

Introducing Cloudflare’s new Network Analytics dashboard
The attack targets multiple destination ports

We move on to see what other fields can contribute to our investigation. Using the Packet size dimension yields good results. Over 771 GB of the traffic are delivered over 286 byte packets.

Introducing Cloudflare’s new Network Analytics dashboard
Zooming in on an UDP flood originating from source port 123 

Assuming that our attack is now sufficiently patterned, we can create a Magic Firewall rule to block the attack by combining those fields. You can combine additional fields to ensure you do not impact your legitimate traffic. For example, if the attack is only targeting a single prefix (e.g., 192.0.2.0/24), you can limit the scope of the rule to that prefix.

Introducing Cloudflare’s new Network Analytics dashboard
Creating a Magic Firewall rule directly from within the analytics dashboard
Introducing Cloudflare’s new Network Analytics dashboard
Creating a Magic Firewall rule to block a UDP flood

If needed for attack mitigation or network troubleshooting, you can also view and export packet samples along with the packet headers. This can help you identify the pattern and sources of the traffic.

Introducing Cloudflare’s new Network Analytics dashboard
Example of packet samples with one sample expanded
Introducing Cloudflare’s new Network Analytics dashboard
Example of a packet sample with the header sections expanded

Generate reports

Another important role of the network security team is to provide decision makers an accurate view of their threat landscape and network security posture. Understanding those will enable teams and decision makers to prepare and ensure their organization is protected and critical services are kept available and performant. This is where, again, the Network Analytics dashboard comes in to help. Network operators can use the dashboard to understand their threat landscape — which endpoints are being targeted, by which types of attacks, where are they coming from, and how does that compare to the previous period.

Introducing Cloudflare’s new Network Analytics dashboard
Dynamic, adaptive executive summary

Using the Network Analytics dashboard, users can create a custom report — filtered and tuned to provide their decision makers a clear view of the attack landscape that’s relevant to them.

Introducing Cloudflare’s new Network Analytics dashboard

In addition, Magic Transit and Spectrum users also receive an automated weekly Network DDoS Report which includes key insights and trends.

Extending visibility from Cloudflare’s vantage point

As we’ve seen in many cases, being unprepared can cost organizations substantial revenue loss, it can negatively impact their reputation, reduce users’ trust as well as burn out teams that need to constantly put out fires reactively. Furthermore, impact to organizations that operate in the healthcare industry, water, and electric and other critical infrastructure industries can cause very serious real-world problems, e.g., hospitals not being able to provide care for patients.

The Network Analytics dashboard aims to reduce the effort and time it takes network teams to investigate and resolve issues as well as to simplify and automate security reporting. The data is also available via GraphQL API and Logpush to allow teams to integrate the data into their internal systems and cross references with additional data points.

To learn more about the Network Analytics dashboard, refer to the developer documentation.

Integrating Network Analytics Logs with your SIEM dashboard

Post Syndicated from Omer Yoachimik original https://blog.cloudflare.com/network-analytics-logs/

Integrating Network Analytics Logs with your SIEM dashboard

Integrating Network Analytics Logs with your SIEM dashboard

We’re excited to announce the availability of Network Analytics Logs. Magic Transit, Magic Firewall, Magic WAN, and Spectrum customers on the Enterprise plan can feed packet samples directly into storage services, network monitoring tools such as Kentik, or their Security Information Event Management (SIEM) systems such as Splunk to gain near real-time visibility into network traffic and DDoS attacks.

What’s included in the logs

By creating a Network Analytics Logs job, Cloudflare will continuously push logs of packet samples directly to the HTTP endpoint of your choice, including Websockets. The logs arrive in JSON format which makes them easy to parse, transform, and aggregate. The logs include packet samples of traffic dropped and passed by the following systems:

  1. Network-layer DDoS Protection Ruleset
  2. Advanced TCP Protection
  3. Magic Firewall

Note that not all mitigation systems are applicable to all Cloudflare services. Below is a table describing which mitigation service is applicable to which Cloudflare service:

Mitigation System Cloudflare Service
Magic Transit Magic WAN Spectrum
Network-layer DDoS Protection Ruleset
Advanced TCP Protection
Magic Firewall

Packets are processed by the mitigation systems in the order outlined above. Therefore, a packet that passed all three systems may produce three packet samples, one from each system. This can be very insightful when troubleshooting and wanting to understand where in the stack a packet was dropped. To avoid overcounting the total passed traffic, Magic Transit users should only take into consideration the passed packets from the last mitigation system, Magic Firewall.

An example of a packet sample log:

{"AttackCampaignID":"","AttackID":"","ColoName":"bkk06","Datetime":1652295571783000000,"DestinationASN":13335,"Direction":"ingress","IPDestinationAddress":"(redacted)","IPDestinationSubnet":"/24","IPProtocol":17,"IPSourceAddress":"(redacted)","IPSourceSubnet":"/24","MitigationReason":"","MitigationScope":"","MitigationSystem":"magic-firewall","Outcome":"pass","ProtocolState":"","RuleID":"(redacted)","RulesetID":"(redacted)","RulesetOverrideID":"","SampleInterval":100,"SourceASN":38794,"Verdict":"drop"}

All the available log fields are documented here: https://developers.cloudflare.com/logs/reference/log-fields/account/network_analytics_logs/

Setting up the logs

In this walkthrough, we will demonstrate how to feed the Network Analytics Logs into Splunk via Postman. At this time, it is only possible to set up Network Analytics Logs via API. Setting up the logs requires three main steps:

  1. Create a Cloudflare API token.
  2. Create a Splunk Cloud HTTP Event Collector (HEC) token.
  3. Create and enable a Cloudflare Logpush job.

Let’s get started!

1) Create a Cloudflare API token

  1. Log in to your Cloudflare account and navigate to My Profile.
  2. On the left-hand side, in the collapsing navigation menu, click API Tokens.
  3. Click Create Token and then, under Custom token, click Get started.
  4. Give your custom token a name, and select an Account scoped permission to edit Logs. You can also scope it to a specific/subset/all of your accounts.
  5. At the bottom, click Continue to summary, and then Create Token.
  6. Copy and save your token. You can also test your token with the provided snippet in Terminal.

When you’re using an API token, you don’t need to provide your email address as part of the API credentials.

Integrating Network Analytics Logs with your SIEM dashboard

Read more about creating an API token on the Cloudflare Developers website: https://developers.cloudflare.com/api/tokens/create/

2) Create a Splunk token for an HTTP Event Collector

In this walkthrough, we’re using a Splunk Cloud free trial, but you can use almost any service that can accept logs over HTTPS. In some cases, if you’re using an on-premise SIEM solution, you may need to allowlist Cloudflare IP address in your firewall to be able to receive the logs.

  1. Create a Splunk Cloud account. I created a trial account for the purpose of this blog.
  2. In the Splunk Cloud dashboard, go to Settings > Data Input.
  3. Next to HTTP Event Collector, click Add new.
  4. Follow the steps to create a token.
  5. Copy your token and your allocated Splunk hostname and save both for later.
Integrating Network Analytics Logs with your SIEM dashboard

Read more about using Splunk with Cloudflare Logpush on the Cloudflare Developers website: https://developers.cloudflare.com/logs/get-started/enable-destinations/splunk/

Read more about creating an HTTP Event Collector token on Splunk’s website: https://docs.splunk.com/Documentation/Splunk/8.2.6/Data/UsetheHTTPEventCollector

3) Create a Cloudflare Logpush job

Creating and enabling a job is very straightforward. It requires only one API call to Cloudflare to create and enable a job.

To send the API calls I used Postman, which is a user-friendly API client that was recommended to me by a colleague. It allows you to save and customize API calls. You can also use Terminal/CMD or any other API client/script of your choice.

One thing to notice is Network Analytics Logs are account-scoped. The API endpoint is therefore a tad different from what you would normally use for zone-scoped datasets such as HTTP request logs and DNS logs.

This is the endpoint for creating an account-scoped Logpush job:

https://api.cloudflare.com/client/v4/accounts/{account-id}/logpush/jobs

Your account identifier number is a unique identifier of your account. It is a string of 32 numbers and characters. If you’re not sure what your account identifier is, log in to Cloudflare, select the appropriate account, and copy the string at the end of the URL.

https://dash.cloudflare.com/{account-id}

Then, set up a new request in Postman (or any other API client/CLI tool).

To successfully create a Logpush job, you’ll need the HTTP method, URL, Authorization token, and request body (data). The request body must include a destination configuration (destination_conf), the specified dataset (network_analytics_logs, in our case), and the token (your Splunk token).

Integrating Network Analytics Logs with your SIEM dashboard

Method:

POST

URL:

https://api.cloudflare.com/client/v4/accounts/{account-id}/logpush/jobs

Authorization: Define a Bearer authorization in the Authorization tab, or add it to the header, and add your Cloudflare API token.

Body: Select a Raw > JSON

{
"destination_conf": "{your-unique-splunk-configuration}",
"dataset": "network_analytics_logs",
"token": "{your-splunk-hec-tag}",
"enabled": "true"
}

If you’re using Splunk Cloud, then your unique configuration has the following format:

{your-unique-splunk-configuration}=splunk://{your-splunk-hostname}.splunkcloud.com:8088/services/collector/raw?channel={channel-id}&header_Authorization=Splunk%20{your-splunk–hec-token}&insecure-skip-verify=false

Definition of the variables:

{your-splunk-hostname}= Your allocated Splunk Cloud hostname.

{channel-id} = A unique ID that you choose to assign for.`{your-splunk–hec-token}` = The token that you generated for your Splunk HEC.

An important note is that customers should have a valid SSL/TLS certificate on their Splunk instance to support an encrypted connection.

After you’ve done that, you can create a GET request to the same URL (no request body needed) to verify that the job was created and is enabled.

The response should be similar to the following:

{
    "errors": [],
    "messages": [],
    "result": {
        "id": {job-id},
        "dataset": "network_analytics_logs",
        "frequency": "high",
        "kind": "",
        "enabled": true,
        "name": null,
        "logpull_options": null,
        "destination_conf": "{your-unique-splunk-configuration}",
        "last_complete": null,
        "last_error": null,
        "error_message": null
    },
    "success": true
}

Shortly after, you should start receiving logs to your Splunk HEC.

Integrating Network Analytics Logs with your SIEM dashboard

Read more about enabling Logpush on the Cloudflare Developers website: https://developers.cloudflare.com/logs/reference/logpush-api-configuration/examples/example-logpush-curl/

Reduce costs with R2 storage

Depending on the amount of logs that you read and write, the cost of third party cloud storage can skyrocket — forcing you to decide between managing a tight budget and being able to properly investigate networking and security issues. However, we believe that you shouldn’t have to make those trade-offs. With R2’s low costs, we’re making this decision easier for our customers. Instead of feeding logs to a third party, you can reap the cost benefits of storing them in R2.

To learn more about the R2 features and pricing, check out the full blog post. To enable R2, contact your account team.

Cloudflare logs for maximum visibility

Cloudflare Enterprise customers have access to detailed logs of the metadata generated by our products. These logs are helpful for troubleshooting, identifying network and configuration adjustments, and generating reports, especially when combined with logs from other sources, such as your servers, firewalls, routers, and other appliances.

Network Analytics Logs joins Cloudflare’s family of products on Logpush: DNS logs, Firewall events, HTTP requests, NEL reports, Spectrum events, Audit logs, Gateway DNS, Gateway HTTP, and Gateway Network.

Not using Cloudflare yet? Start now with our Free and Pro plans to protect your websites against DDoS attacks, or contact us for comprehensive DDoS protection and firewall-as-a-service for your entire network.

How Netflix uses eBPF flow logs at scale for network insight

Post Syndicated from Netflix Technology Blog original https://netflixtechblog.com/how-netflix-uses-ebpf-flow-logs-at-scale-for-network-insight-e3ea997dca96

By Alok Tiagi, Hariharan Ananthakrishnan, Ivan Porto Carrero and Keerti Lakshminarayan

Netflix has developed a network observability sidecar called Flow Exporter that uses eBPF tracepoints to capture TCP flows at near real time. At much less than 1% of CPU and memory on the instance, this highly performant sidecar provides flow data at scale for network insight.

Challenges

The cloud network infrastructure that Netflix utilizes today consists of AWS services such as VPC, DirectConnect, VPC Peering, Transit Gateways, NAT Gateways, etc and Netflix owned devices. Netflix software infrastructure is a large distributed ecosystem that consists of specialized functional tiers that are operated on the AWS and Netflix owned services. While we strive to keep the ecosystem simple, the inherent nature of leveraging a variety of technologies will lead us to challenges such as:

  • App Dependencies and Data Flow Mappings: With the number of micro services growing by the day without understanding and having visibility into an application’s dependencies and data flows, it is difficult for both service owners and centralized teams to identify systemic issues.
  • Pathway Validation: Netflix velocity of change within the production streaming and studio environment can result in the inability of services to communicate with other resources.
  • Service Segmentation: The ease of the cloud deployments has led to the organic growth of multiple AWS accounts, deployment practices, interconnection practices, etc. Without having network visibility, it’s difficult to improve our reliability, security and capacity posture.
  • Network Availability: The expected continued growth of our ecosystem makes it difficult to understand our network bottlenecks and potential limits we may be reaching.

Cloud Network Insight is a suite of solutions that provides both operational and analytical insight into the cloud network infrastructure to address the identified problems. By collecting, accessing and analyzing network data from a variety of sources like VPC Flow Logs, ELB Access Logs, eBPF flow logs on the instances, etc, we can provide network insight to users and central teams through multiple data visualization techniques like Lumen, Atlas, etc.

Flow Exporter

The Flow Exporter is a sidecar that uses eBPF tracepoints to capture TCP flows at near real time on instances that power the Netflix microservices architecture.

What is BPF?

Berkeley Packet Filter (BPF) is an in-kernel execution engine that processes a virtual instruction set, and has been extended as eBPF for providing a safe way to extend kernel functionality. In some ways, eBPF does to the kernel what JavaScript does to websites: it allows all sorts of new applications to be created.

An eBPF flow log record represents one or more network flows that contain TCP/IP statistics that occur within a variable aggregation interval.

The sidecar has been implemented by leveraging the highly performant eBPF along with carefully chosen transport protocols to consume less than 1% of CPU and memory on any instance in our fleet. The choice of transport protocols like GRPC, HTTPS & UDP is runtime dependent on characteristics of the instance placement.

The runtime behavior of the Flow Exporter can be dynamically managed by configuration changes via Fast Properties. The Flow Exporter also publishes various operational metrics to Atlas. These metrics are visualized using Lumen, a self-service dashboarding infrastructure.

So how do we ingest and enrich these flows at scale ?

Flow Collector is a regional service that ingests and enriches flows. IP addresses within the cloud can move from one EC2 instance or Titus container to another over time. We use Sonar to attribute an IP address to a specific application at a particular time. Sonar is an IPv6 and IPv4 address identity tracking service.

Flow Collector consumes two data streams, the IP address change events from Sonar via Kafka and eBPF flow log data from the Flow Exporter sidecars. It performs real time attribution of flow data with application metadata from Sonar. The attributed flows are pushed to Keystone that routes them to the Hive and Druid datastores.

The attributed flow data drives various use cases within Netflix like network monitoring and network usage forecasting available via Lumen dashboards and machine learning based network segmentation. The data is also used by security and other partner teams for insight and incident analysis.

Summary

Providing network insight into the cloud network infrastructure using eBPF flow logs at scale is made possible with eBPF and a highly scalable and efficient flow collection pipeline. After several iterations of the architecture and some tuning, the solution has proven to be able to scale.

We are currently ingesting and enriching billions of eBPF flow logs per hour and providing visibility into our cloud ecosystem. The enriched data allows us to analyze networks across a variety of dimensions (e.g. availability, performance, and security), to ensure applications can effectively deliver their data payload across a globally dispersed cloud-based ecosystem.

Special Thanks To

Brendan Gregg


How Netflix uses eBPF flow logs at scale for network insight was originally published in Netflix TechBlog on Medium, where people are continuing the conversation by highlighting and responding to this story.

Announcing Spectrum DDoS Analytics and DDoS Insights & Trends

Post Syndicated from Selina Cho original https://blog.cloudflare.com/announcing-spectrum-ddos-analytics-and-ddos-insights-trends/

Announcing Spectrum DDoS Analytics and DDoS Insights & Trends

Announcing Spectrum DDoS Analytics and DDoS Insights & Trends

We’re excited to announce the expansion of the Network Analytics dashboard to Spectrum customers on the Enterprise plan. Additionally, this announcement introduces two major dashboard improvements for easier reporting and investigation.

Network Analytics

Cloudflare’s packet and bit oriented dashboard, Network Analytics, provides visibility into Internet traffic patterns and DDoS attacks in Layers 3 and 4 of the OSI model. This allows our users to better understand the traffic patterns and DDoS attacks as observed at the Cloudflare edge.

When the dashboard was first released in January, these capabilities were only available to Bring Your Own IP customers on the Spectrum and Magic Transit services, but now Spectrum customers using Cloudflare’s Anycast IPs are also supported.

Protecting L4 applications

Spectrum is Cloudflare’s L4 reverse-proxy service that offers unmetered DDoS protection and traffic acceleration for TCP and UDP applications. It provides enhanced traffic performance through faster TLS, optimized network routing, and high speed interconnection. It also provides encryption to legacy protocols and applications that don’t come with embedded encryption. Customers who typically use Spectrum operate services in which network performance and resilience to DDoS attacks are of utmost importance to their business, such as email, remote access, and gaming.

Spectrum customers can now view detailed traffic reports on DDoS attacks on their configured TCP/ UDP applications, including size of attacks, attack vectors, source location of attacks, and permitted traffic. What’s more, users can also configure and receive real-time alerts when their services are attacked.

Network Analytics: Rebooted

Announcing Spectrum DDoS Analytics and DDoS Insights & Trends

Since releasing the Network Analytics dashboard in January, we have been constantly improving its capabilities. Today, we’re announcing two major improvements that will make both reporting and investigation easier for our customers: DDoS Insights & Trend and Group-by Filtering for grouping-based traffic analysis.

First and foremost, we are adding a new DDoS Insights & Trends card, which provides dynamic insights into your attack trends over time. This feature provides a real-time view of the number of attacks, the percentage of attack traffic, the maximum attack rates, the total mitigated bytes, the main attack origin country, and the total duration of attacks, which can indicate the potential downtime that was prevented. These data points were surfaced as the most crucial ones by our customers in the feedback sessions. Along with the percentage of change period-over-period, our customers can easily understand how their security landscape evolves.

Announcing Spectrum DDoS Analytics and DDoS Insights & Trends
Trends Insights

Troubleshooting made easy

In the main time series chart seen in the dashboard, we added an ability for users to change the Group-by field which enables users to customize the Y axis. This way, a user can quickly identify traffic anomalies and sudden changes in traffic based on criteria such as IP protocols, TCP flags, source country, and take action if needed with Magic Firewall, Spectrum or BYOIP.

Announcing Spectrum DDoS Analytics and DDoS Insights & Trends
Time Series Group-By Filtering

Harnessing Cloudflare’s edge to empower our users

The DDoS Insights & Trends, the new investigation tools and the additional user interface enhancements can assist your organization to better understand your security landscape and take more meaningful actions as needed. We have more updates in Network Analytics dashboard, which are not covered in the scope of this post, including:

  • Export logs as a CSV
  • Zoom-in feature in the time series chart
  • Drop-down view option for average rate and total volume
  • Increased Top N views for source and destination values
  • Addition of country and data center for source values
  • New visualisation of the TCP flag distribution

Details on these updates can be found in our Help Center, which you can now access via the dashboard as well.

In the near future, we will also expand Network Analytics to Spectrum customers on the Business plan, and WAF customers on the Enterprise and Business plans. Stay tuned!

If you are a customer in Magic Transit, Spectrum or BYOIP, go try out the Network Analytics dashboard yourself today.

If you operate your own network, try Cloudflare Magic Transit for free with a limited time offer: https://www.cloudflare.com/lp/better/.

A Virtual Product Management Internship Experience

Post Syndicated from Selina Cho original https://blog.cloudflare.com/a-virtual-product-management-internship-experience/

A Virtual Product Management Internship Experience

A Virtual Product Management Internship Experience

In July 2020, I joined Cloudflare as a Product Management Intern on the DDoS (Distributed Denial of Service) team to enhance the benefits that Network Analytics brings to our customers. In the following, I am excited to share with you my experience with remote working as an intern, and how I acclimatized into Cloudflare. I also give details about what my work entailed and how we approached the process of Product Management.

Onboarding to Cloudflare during COVID19

As a long-time user of Cloudflare’s Free CDN plan myself, I was thrilled to join the company and learn what was happening behind the scenes while making its products. The entering internship class consisted of students and recent graduates from various backgrounds around the world – all with a mutual passion in helping build a better Internet.

The catch here was that 2020 would make the experience of being an intern very different. As it was the case with many other fellow interns, it was the first time I had taken up work remotely from scratch. The initial challenge was to integrate into the working environment without ever meeting colleagues in a physical office. Because everything took place online, it was much harder to pick up non-verbal cues that play a key role in communication, such as eye contact and body language.

To face this challenge, Cloudflare introduced creative and active ways in which we could better interact with one another. From the very first day, I was welcomed to an abundance of knowledge sharing talks and coffee chats with new and existing colleagues in different offices across the world. Whether it was data protection from the Legal team or going serverless with Workers, we were welcomed to afternoon seminars every week on a new area that was being pursued within Cloudflare.

Cloudflare not only retained the summer internship scheme, but in fact doubled the size of the class; this reinforced an optimistic mood within the entering class and a sense of personal responsibility. I was paired up with a mentor, a buddy, and a manager who helped me find my way quickly within Cloudflare, and without which my experience would not have been the same. Thanks to Omer, Pat, Val and countless others for all your incredible support!

Social interactions took various forms and were scheduled for all global time zones. I was invited to weekly virtual yoga sessions and intern meetups to network and discover what other interns across the world were working on. We got to virtually mingle at an “Intern Mixer” where we shared answers to philosophical prompts – what’s more, this was accompanied by an UberEats coupon for us to enjoy refreshments in our work-from-home setting. We also had Pub Quizzes with colleagues in the EMEA region to brush up on our trivia skills. At this uncertain time of the year, part of which I spent in complete self-isolation, these gatherings helped create a sense of belonging within the community, as well as an affinity towards the colleagues I interacted with.

Product Management at Cloudflare

My internship also offered a unique learning experience from the Product Management perspective. I took on the task of increasing the value of Network Analytics by giving customers and internal stakeholders improved  transparency in the traffic patterns and attacks taking place. Network Analytics is Cloudflare’s packet- and bit-oriented dashboard that provides visibility into network- and transport-layer attacks which are mitigated across the world. Among various updates I led in visibility features is the new trends insights. During this time the dashboard was also extended to Enterprise customers on the Spectrum service, Cloudflare’s L4 reverse-proxy that provides DDoS protection against attacks and facilitates network performance.

I was at the intersection of multiple teams that contributed to Network Analytics from different angles, including user interface, UX research, product design, product content and backend engineering, among many others. The key to a successful delivery of Network Analytics as a product, given its interdisciplinary nature, meant that I actively facilitated communication and collaboration across experts in these teams as well as reflected the needs of the users.

I spent the first month of the internship approaching internal stakeholders, namely Customer Support engineers, Solutions Engineers, Customer Success Managers, and Product Managers, to better understand the common pain points. Given their past experience with customers, their insights revealed how Network Analytics could both leverage the existing visibility features to reduce overhead costs on the internal support side and empower users with actionable insights. This process also helped ensure that I didn’t reinvent wheels that had already been explored by existing Product Managers.

I then approached customers to enquire about desired areas for improvements. An example of such a desired improvement was that the display of data in the dashboard was not helping users infer any meaning regarding next steps. It did not answer questions like: What do these numbers represent in retrospect, and should I be concerned? Discussing these aspects helped validate the needs, and we subsequently came up with rough solutions to address them, such as dynamic trends view. Over the calls, we confirmed that – especially from those who rarely accessed the dashboard – having an overview of these numbers in the form of a trends card would incentivize users to log in more often and get more value from the product.

A Virtual Product Management Internship Experience
Trends Insights

The 1:1 dialogues were incredibly helpful in understanding how Network Analytics could be more effectively utilized, and guided ways for us to better surface the performance of our DDoS mitigation tools to our customers. In the first few weeks of the internship, I shadowed customer calls of other products; this helped me gain the confidence, knowledge, and language appropriate in Cloudflare’s user research. I did a run-through of the interview questions with a UX Researcher, and was informed on the procedure for getting in touch with appropriate customers. We even had bilingual calls where the Customer Success Manager helped translate the dialogues real-time.

In the following weeks, I synthesized these findings into a Product Requirements Document and lined up the features according to quarterly goals that could now be addressed in collaboration with other teams. After a formal review and discussion with Product Managers, engineers, and designers, we developed and rolled out each feature to the customers on a bi-weekly basis. We always welcomed feedback before and after the feature releases, as the goal wasn’t to have an ultimate final product, but to deliver incremental enhancements to meet the evolving needs of our customers.

Of course, all my interactions, including customer and internal stakeholder calls, were all held remotely. We all embraced video conferencing and instant chat messengers to make it feel as though we were physically close. I had weekly check-ins with various colleagues including my managers, Network Analytics team, DDoS engineering team, and DDoS reports team, to ensure that things were on track. For me, the key to working remotely was the instant chat function, which was not as intrusive as a fully fledged meeting, but a quick and considerate way to communicate in a tightly-knit team.

Looking Back

Product Management is a growth process – both for the corresponding individual and the product. As an individual, you grow fast through creative thinking, problem solving and incessant curiosity to better understand a product in the shoes of a customer. At the same time, the product continues to evolve and grow as a result of synergy between experts from diverse fields and customer feedback. Products are used and experienced by people, so it is a no-brainer that maintaining constant and direct feedback from our customers and internal stakeholders are what bolsters their quality.

It was an incredible opportunity to have been a part of an organization that represents one of the largest networks. Network Analytics is a window into the efforts led by Cloudflare engineers and technicians to help secure the Internet, and we are ambitious to scale the transparency across further mitigation systems in the future.

The internship was a successful immersive experience into the world of Network Analytics and Product Management, even in the face of a pandemic. Owing to Cloudflare’s flexibility and ready access to resources for remote work, I was able to adapt to the work environment from the first day onwards and gain an authentic learning experience into how products work. As I now return to university, I look back on an internship that significantly added to my personal and professional growth. I am happy to leave behind the latest evolution of Network Analytics dashboard with hopefully many more to come. Thanks to Cloudflare and all my colleagues for making this possible!