Post Syndicated from Omer Yoachimik original https://blog.cloudflare.com/ddos-threat-report-2025-q3/
Welcome to the 23rd edition of Cloudflare’s Quarterly DDoS Threat Report. This report offers a comprehensive analysis of the evolving threat landscape of Distributed Denial of Service (DDoS) attacks based on data from the Cloudflare network. In this edition, we focus on the third quarter of 2025.
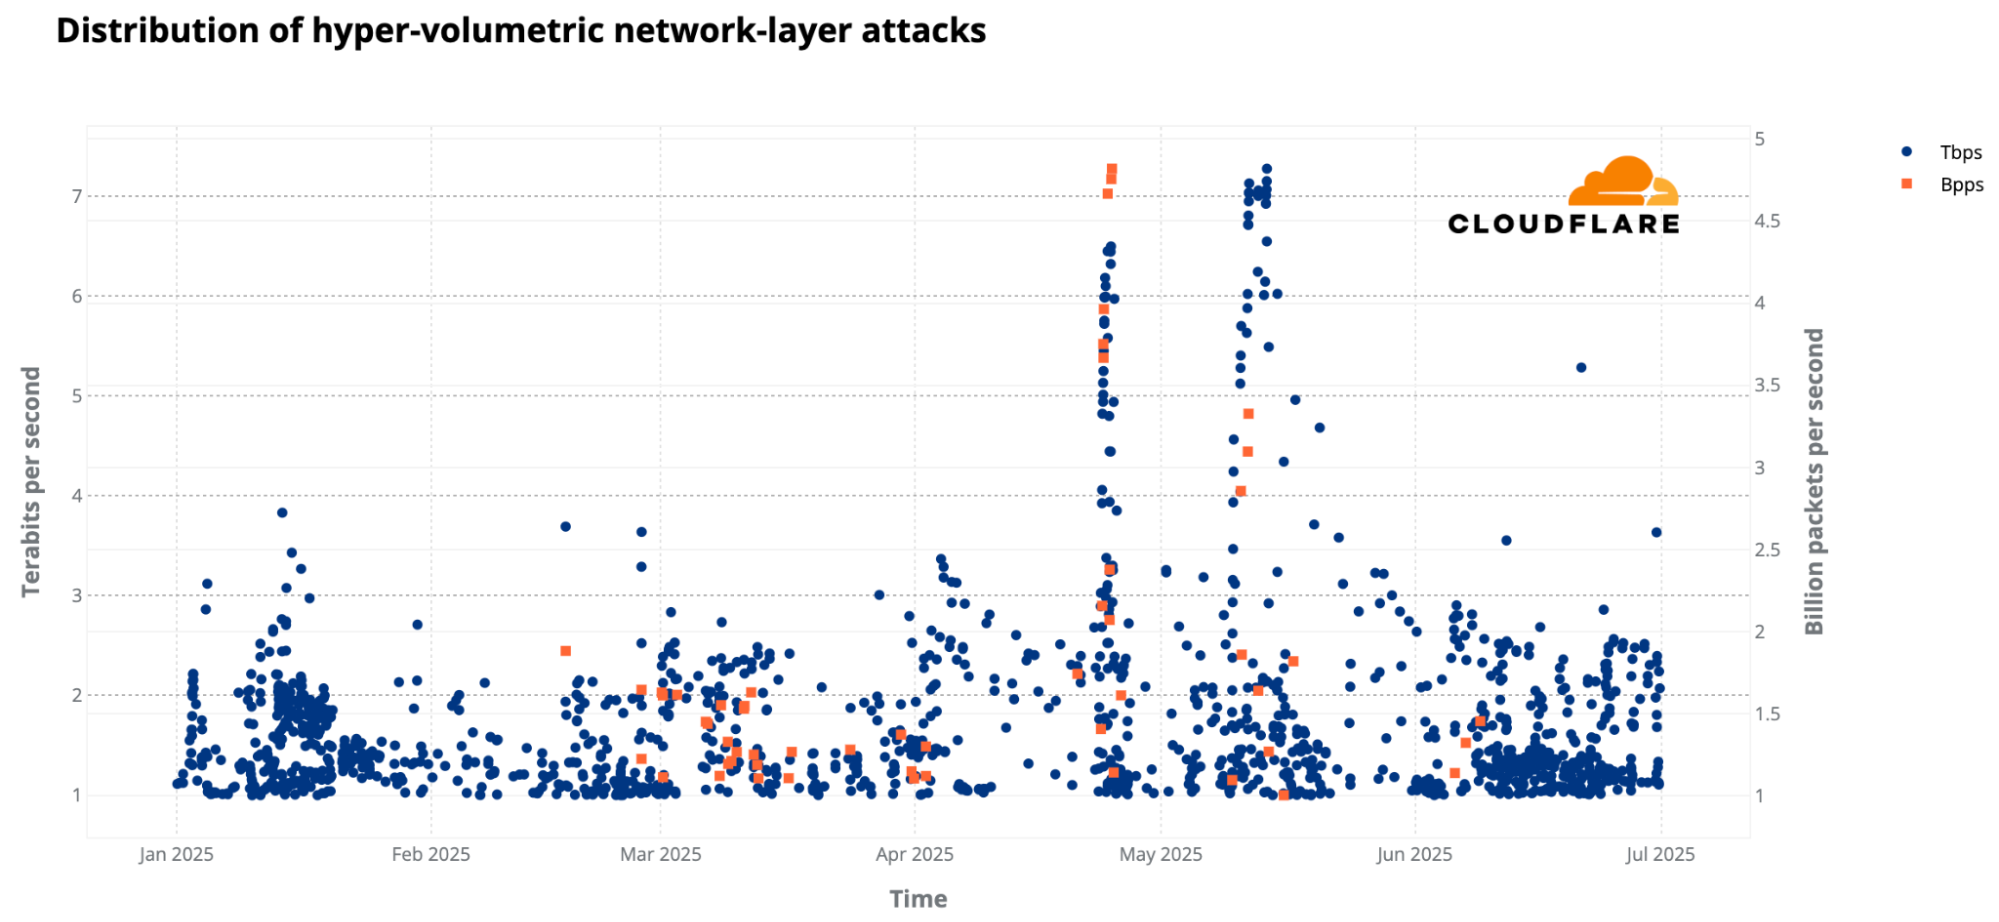
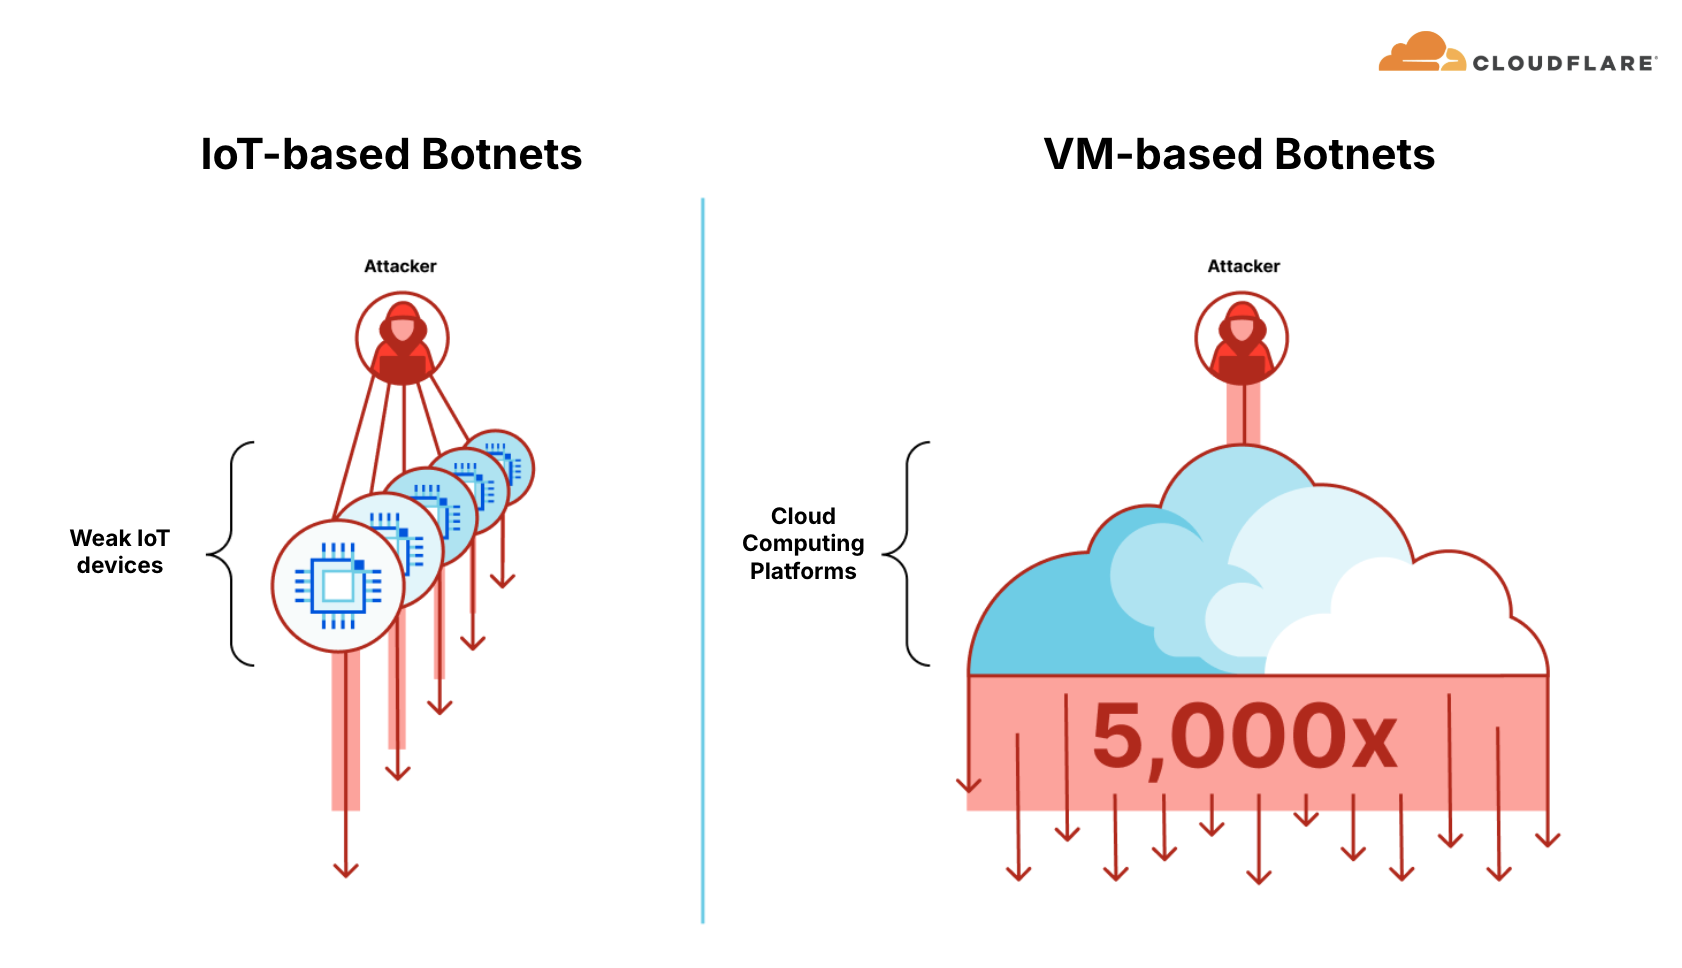
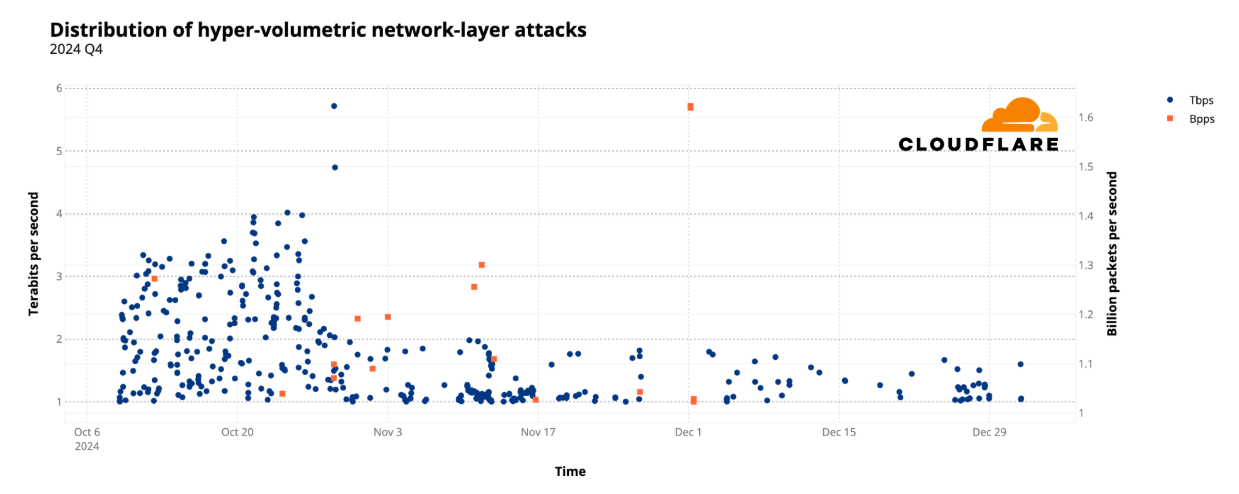
The third quarter of 2025 was overshadowed by the Aisuru botnet with a massive army of an estimated 1–4 million infected hosts globally. Aisuru unleashed hyper-volumetric DDoS attacks routinely exceeding 1 terabit per second (Tbps) and 1 billion packets per second (Bpps). The number of these attacks surged 54% quarter-over-quarter (QoQ), averaging 14 hyper-volumetric attacks daily. The scale was unprecedented, with attacks peaking at 29.7 Tbps and 14.1 Bpps.
Other than Aisuru, additional key insights in this report include:
-
DDoS attack traffic against AI companies surged by as much as 347% MoM in September 2025, as public concern and regulatory review of AI increases.
-
Escalating EU-China trade tensions over rare earth minerals and EV tariffs coincide with a significant increase in DDoS attacks against the Mining, Minerals & Metals industry as well as the Automotive industry in 2025 Q3.
-
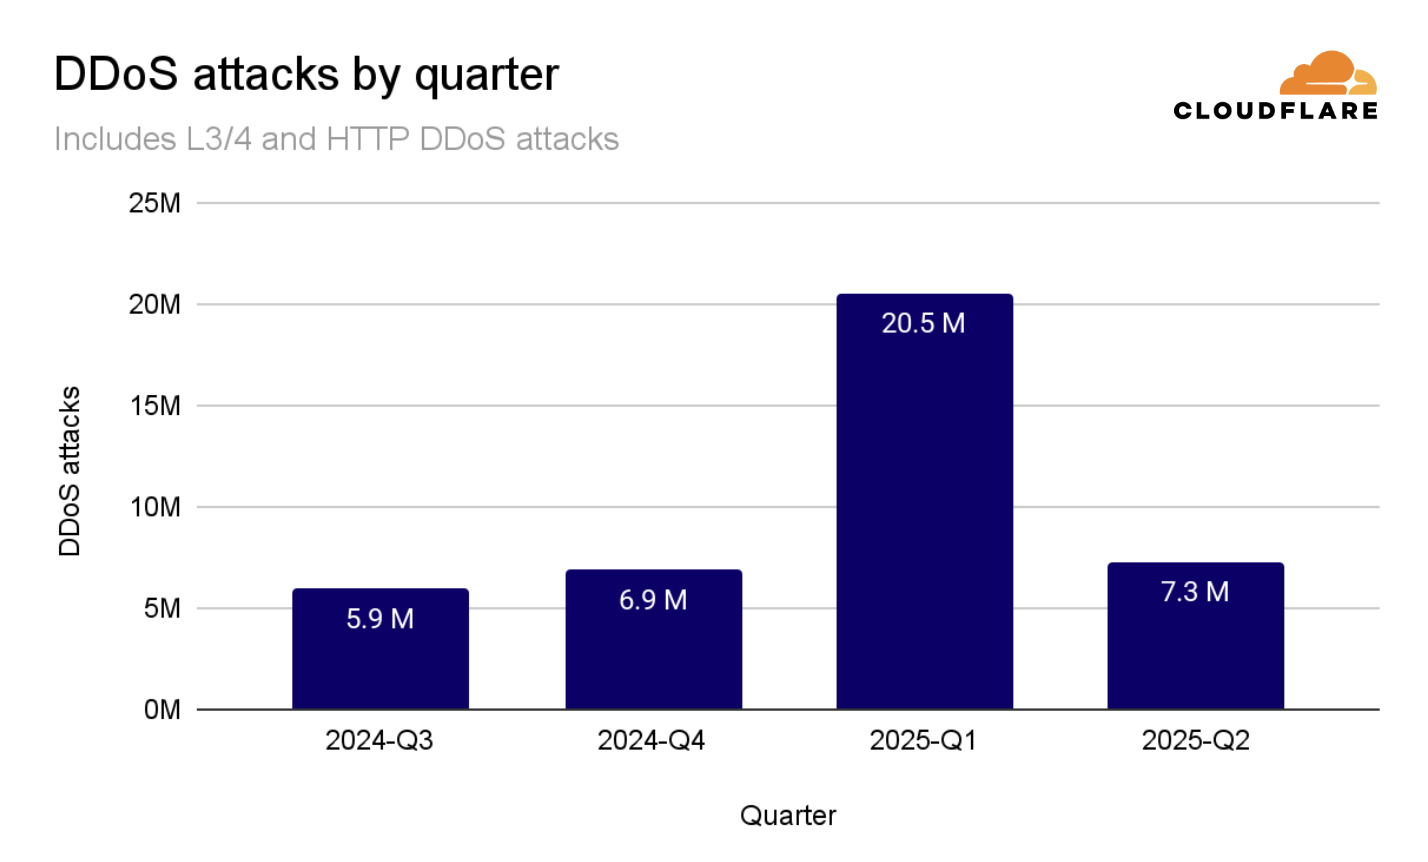
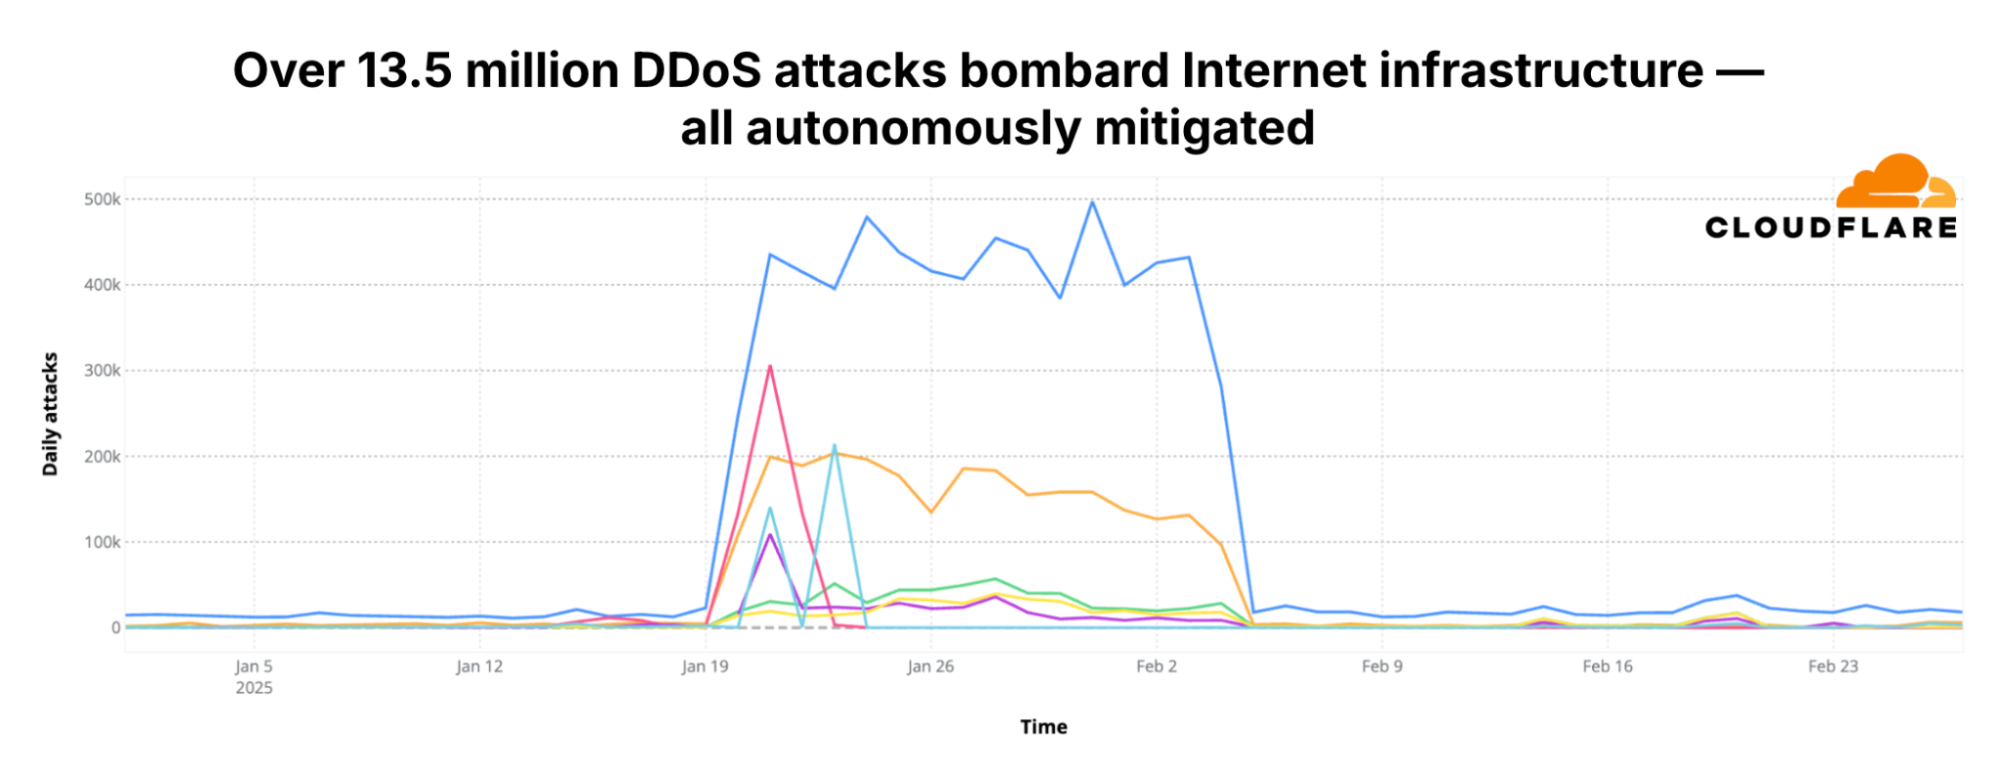
Overall, in the third quarter of 2025, Cloudflare’s autonomous defenses blocked a total of 8.3 million DDoS attacks. That’s an average of almost 3,780 DDoS attacks per hour. The number of DDoS attacks grew by 15% QoQ and 40% YoY.
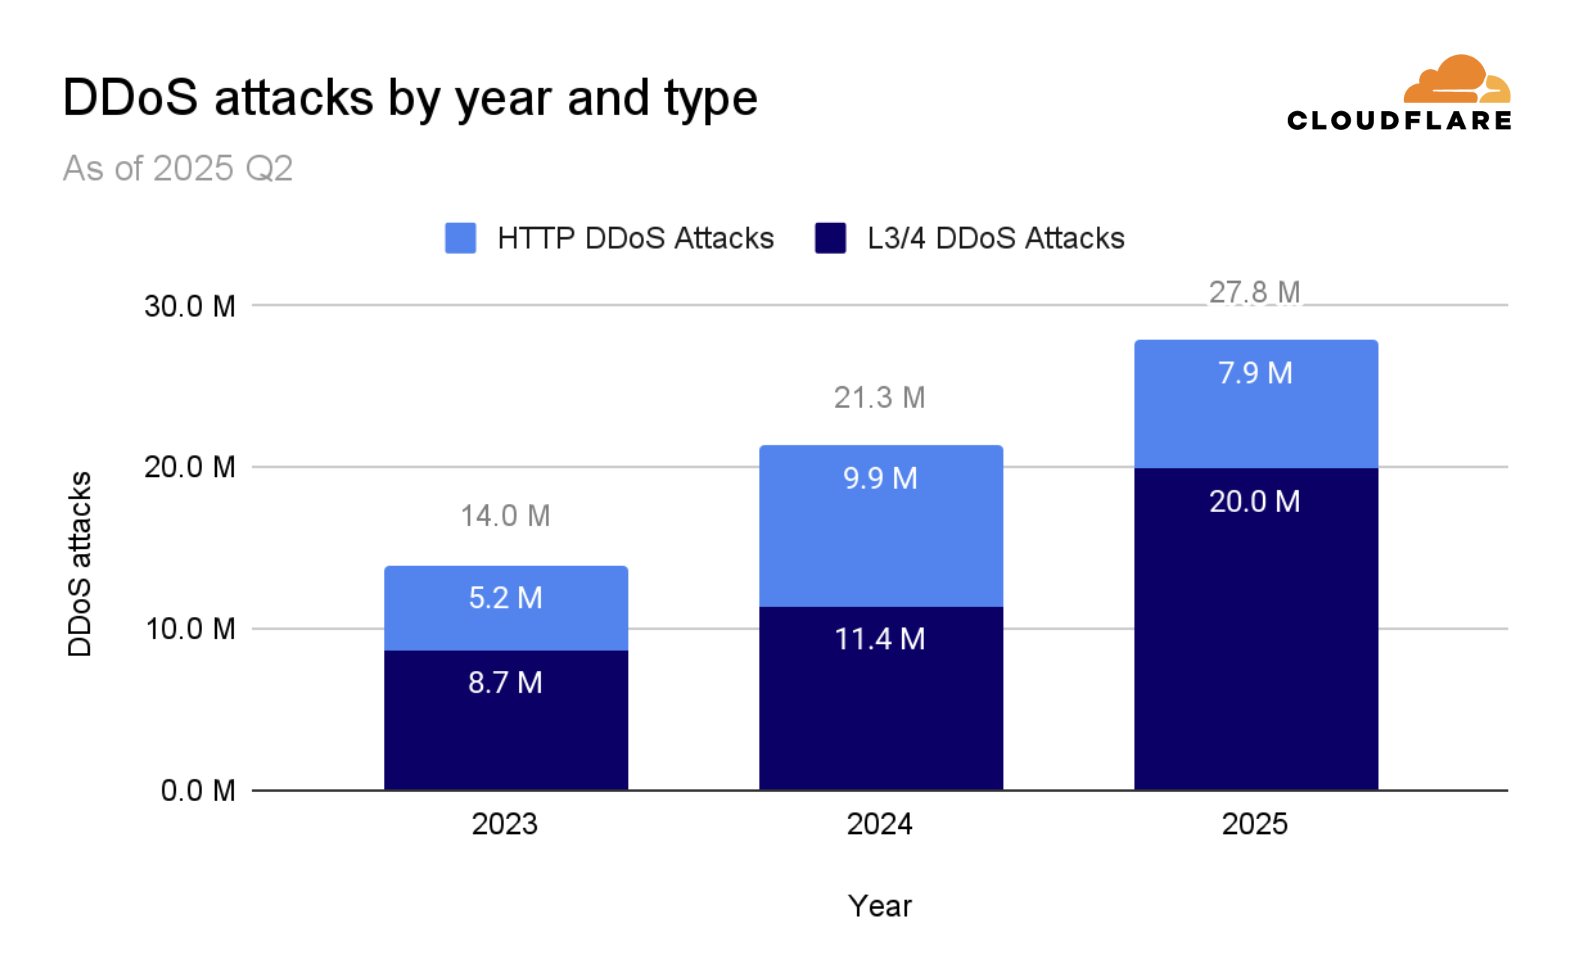
So far in 2025, and with an entire quarter to go until the end of the year, Cloudflare has already mitigated 36.2 million DDoS attacks. That corresponds to 170% of the DDoS attacks Cloudflare mitigated throughout 2024.

In the third quarter of 2025, Cloudflare automatically detected and mitigated 8.3 million DDoS attacks, representing a 15% increase QoQ and 40% increase YoY.

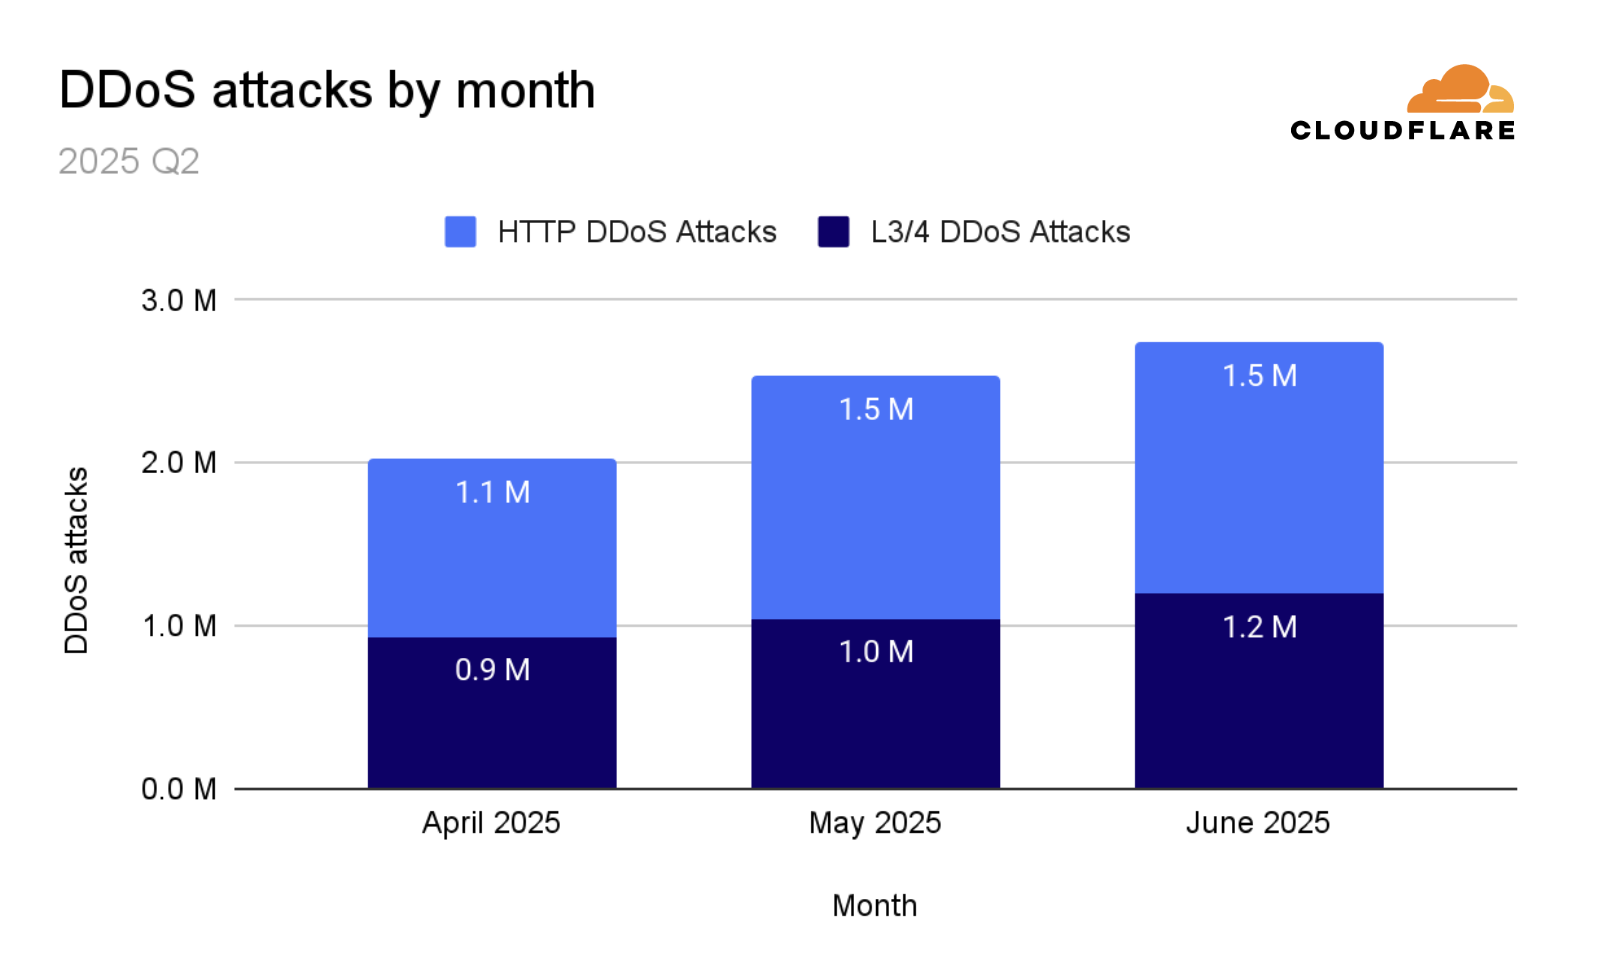
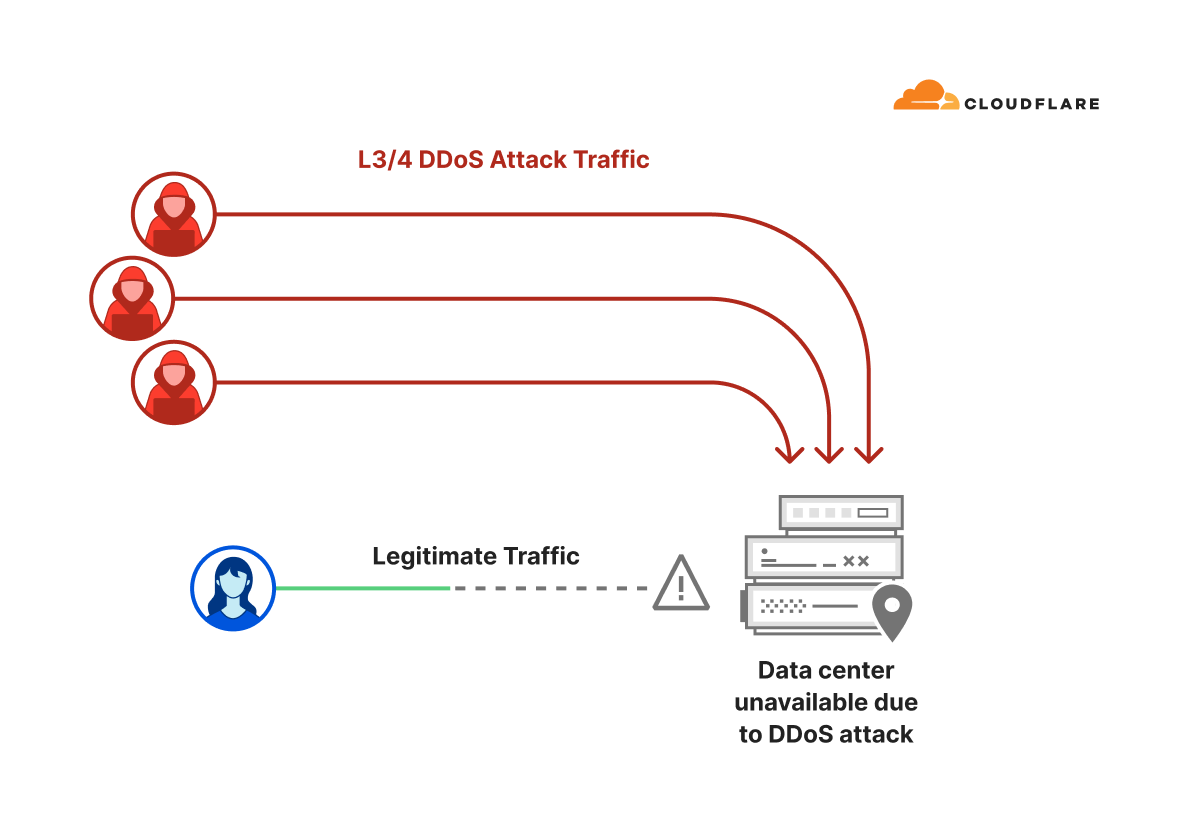
Network-layer DDoS attacks, accounting for 71% of the DDoS attacks in 2025 Q3, or 5.9 million DDoS attacks, increased by 87% QoQ and 95% YoY. However, HTTP DDoS attacks, accounting only for 29% of the DDoS attacks in 2025 Q3, or 2.4 million DDoS attacks, decreased by 41% QoQ and 17% YoY.

In the third quarter of 2025, Cloudflare mitigated an average of 3,780 DDoS attacks every hour.

Disruptive force
Aisuru targeted telecommunication providers, gaming companies, hosting providers, and financial services, to name a few. It has also caused “widespread collateral Internet disruption [in the US]”, as reported by Krebs on Security, simply due to the amount of botnet traffic routing through the Internet Service Providers (ISPs).
Let that sink in. If Aisuru’s attack traffic can disrupt parts of the U.S. Internet infrastructure when said ISPs were not even the target of the attack, imagine what it can do when it’s directly aimed at unprotected or insufficiently protected ISPs, critical infrastructure, healthcare services, emergency services, and military systems.
Botnet-for-hire and DDoS stats
“Chunks” of Aisuru are offered by distributors as botnets-for-hire, so anyone can potentially inflict chaos on entire nations by crippling backbone networks and saturating Internet links, disrupting millions of users and impairing access to essential services — all at a cost of a few hundred to a few thousand U.S. dollars.
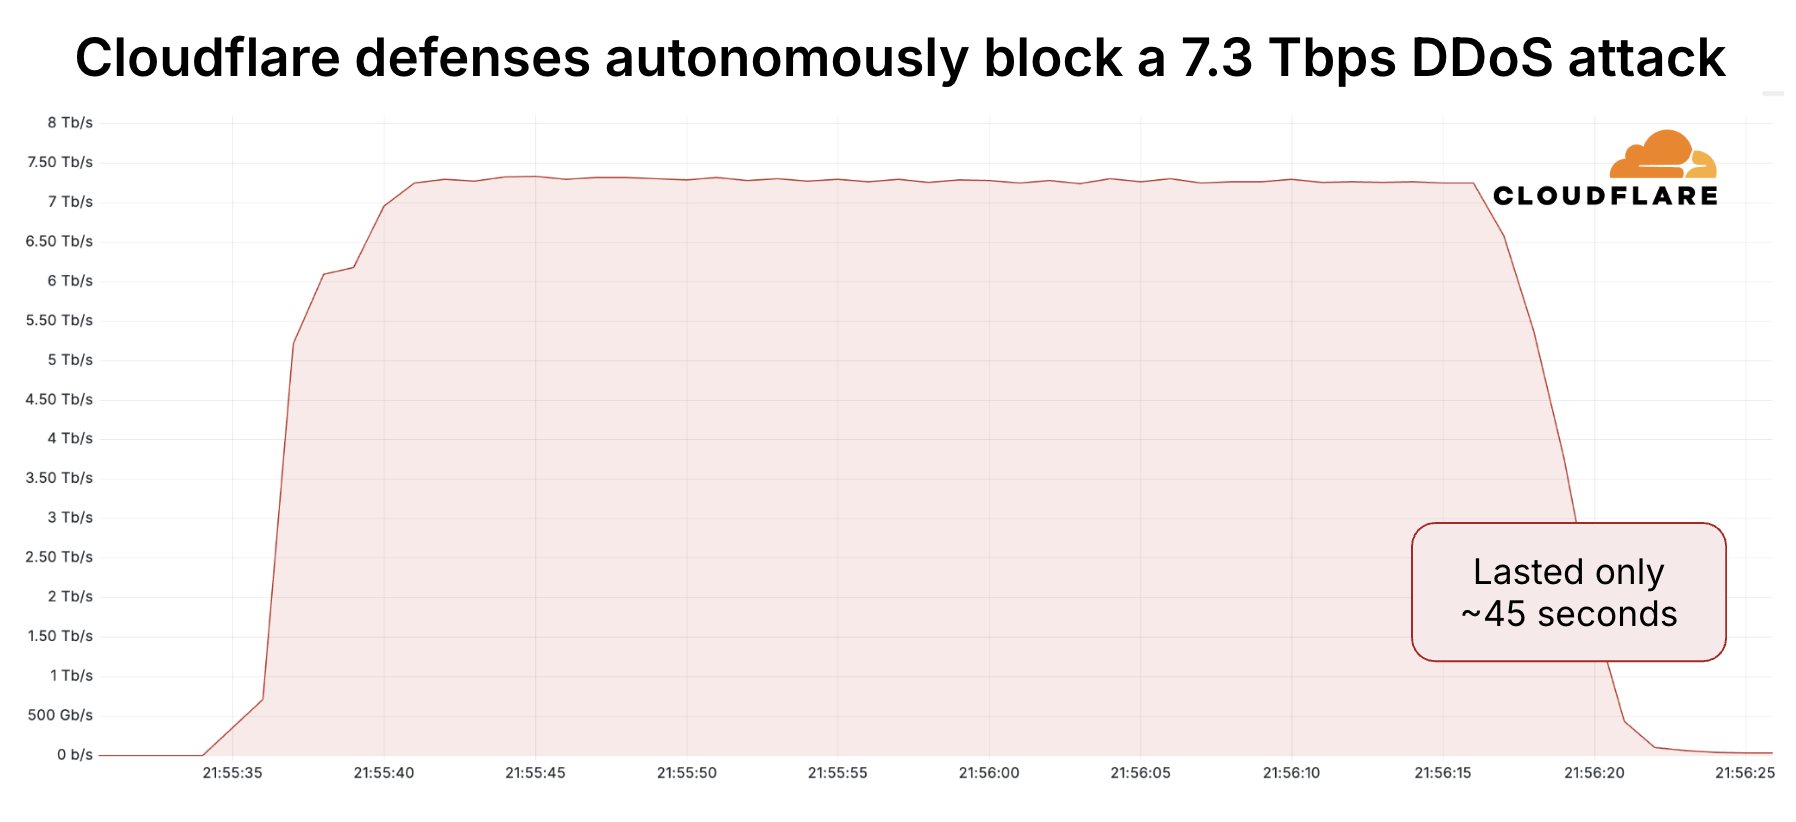
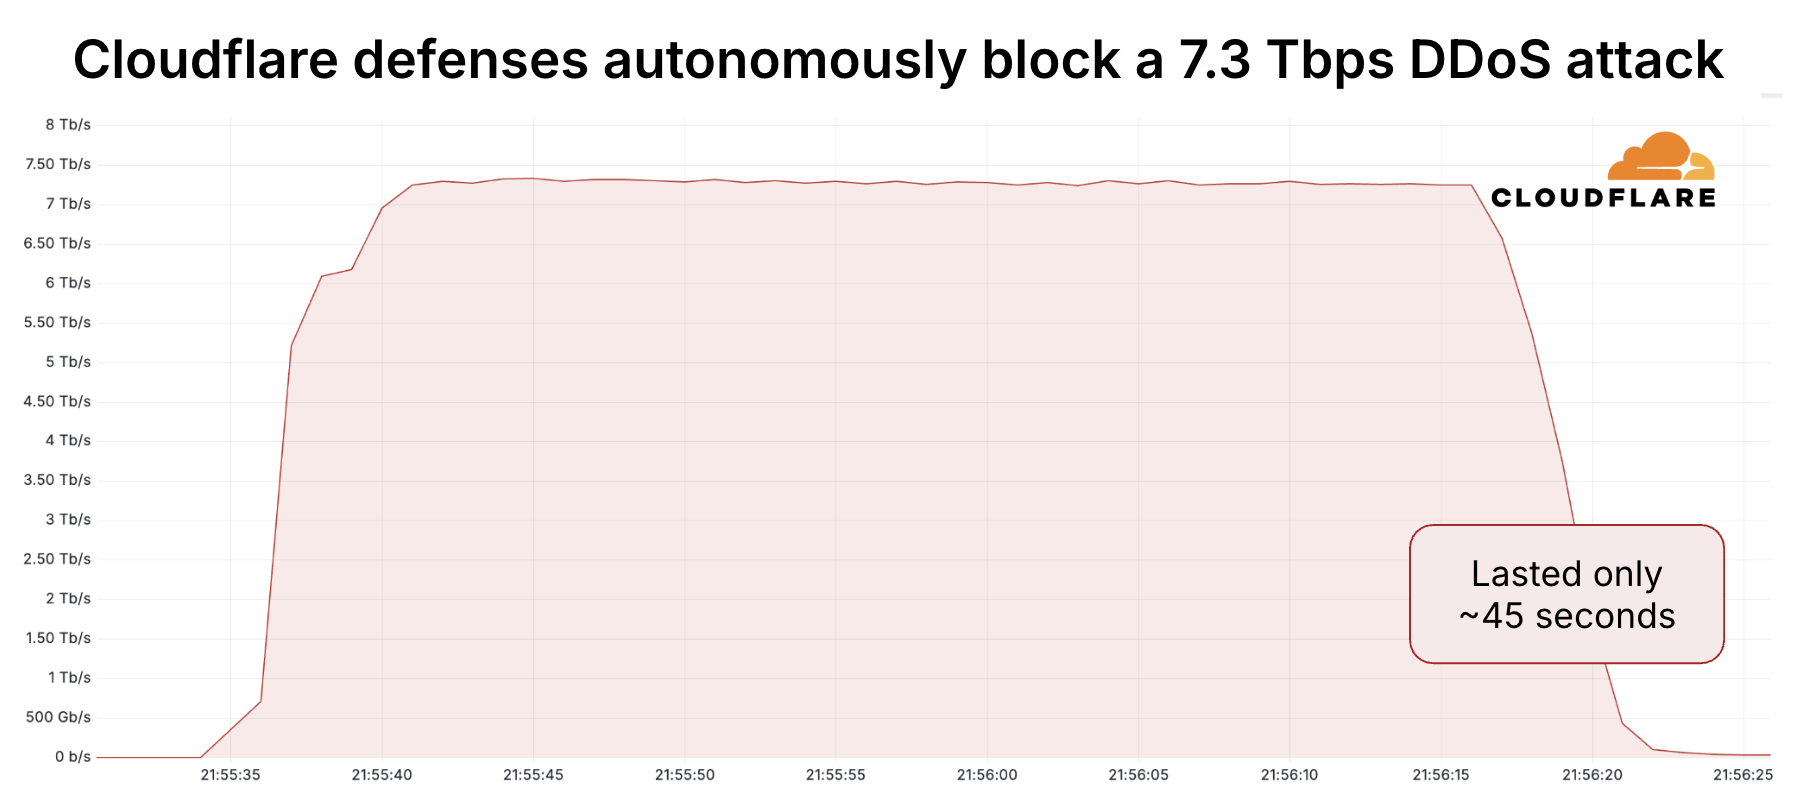
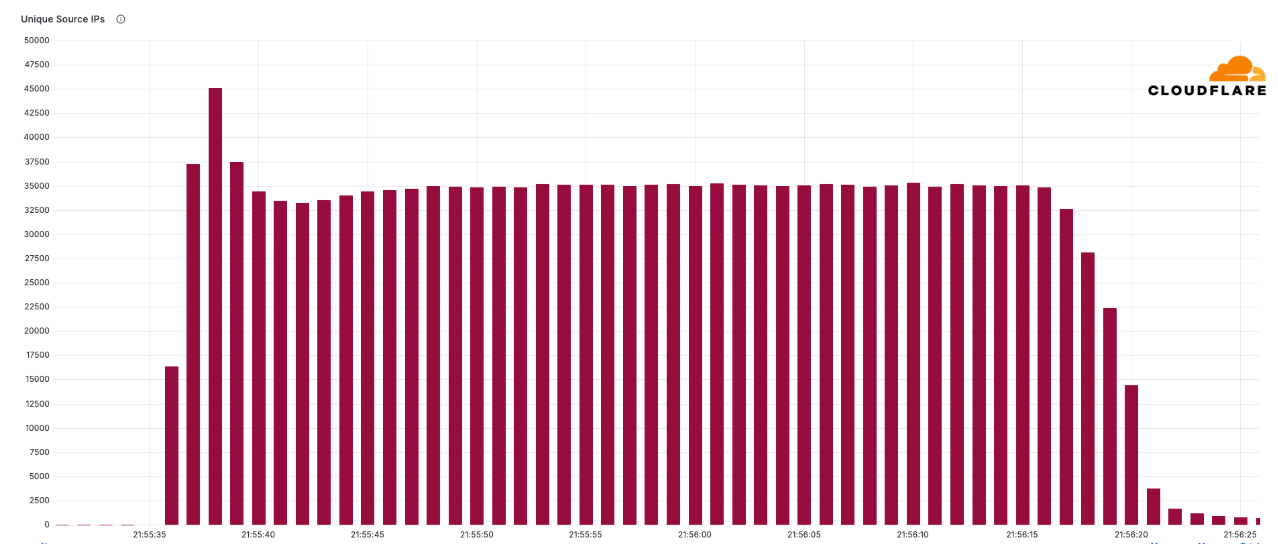
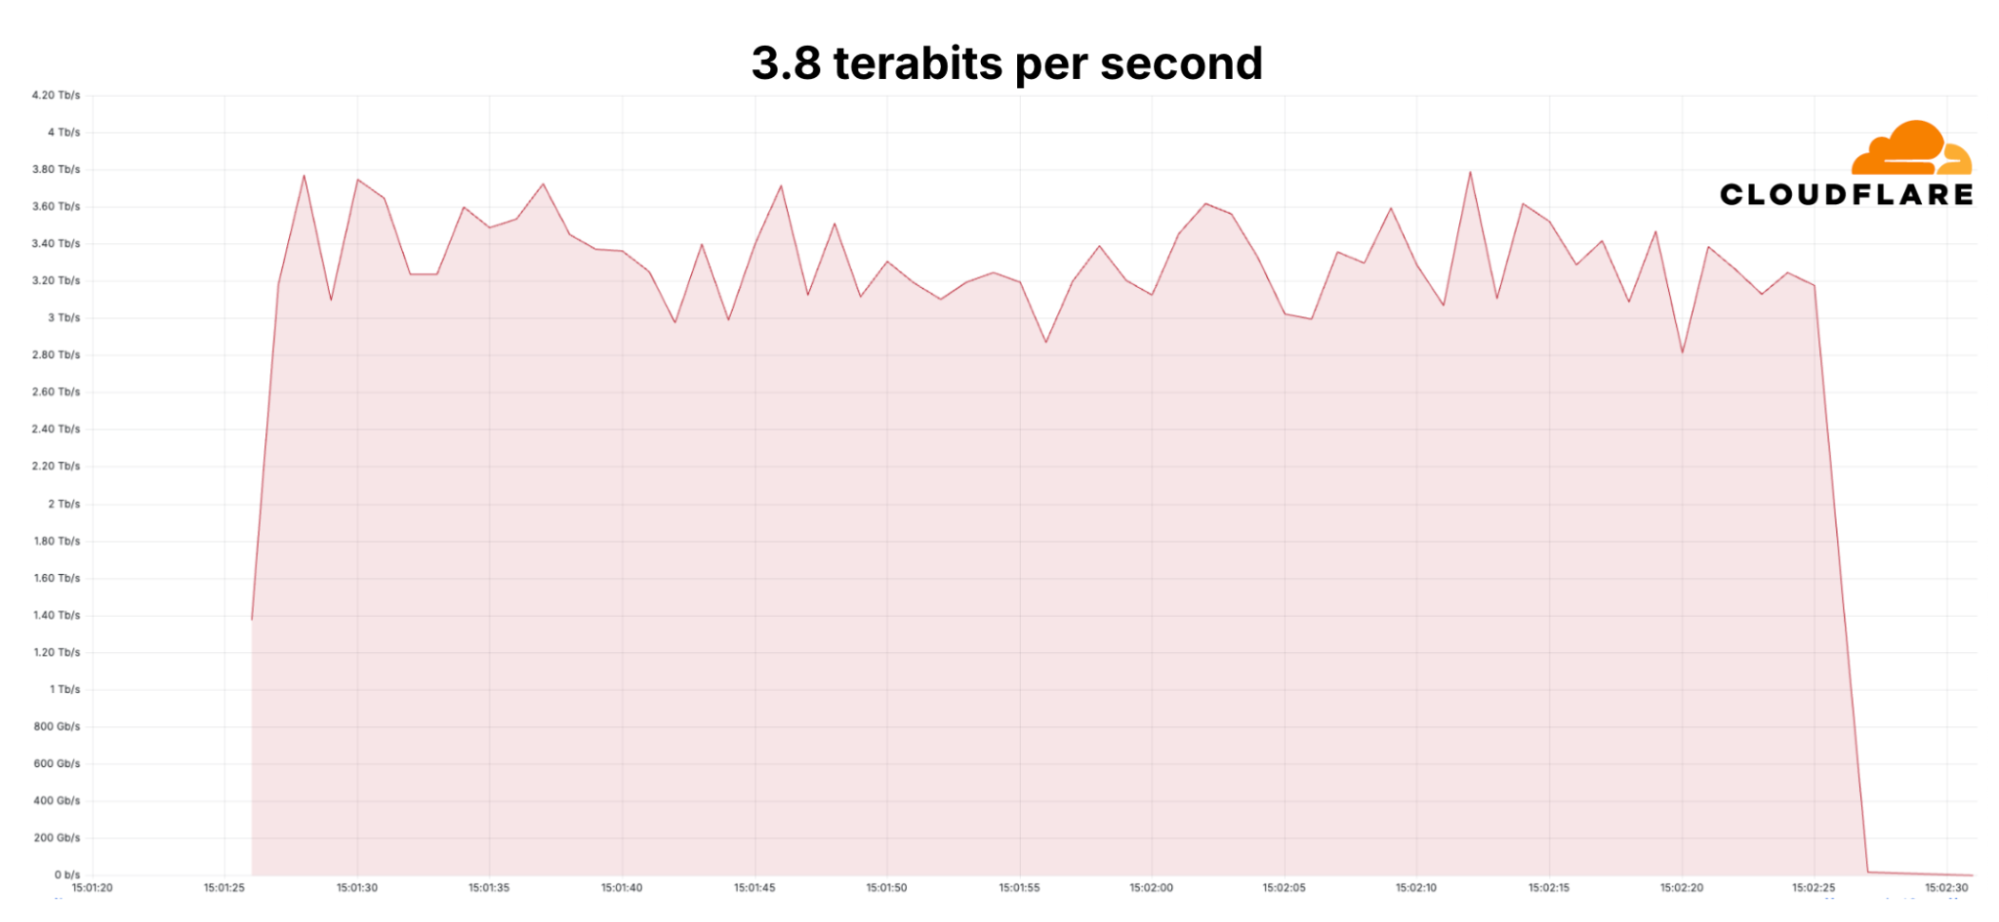
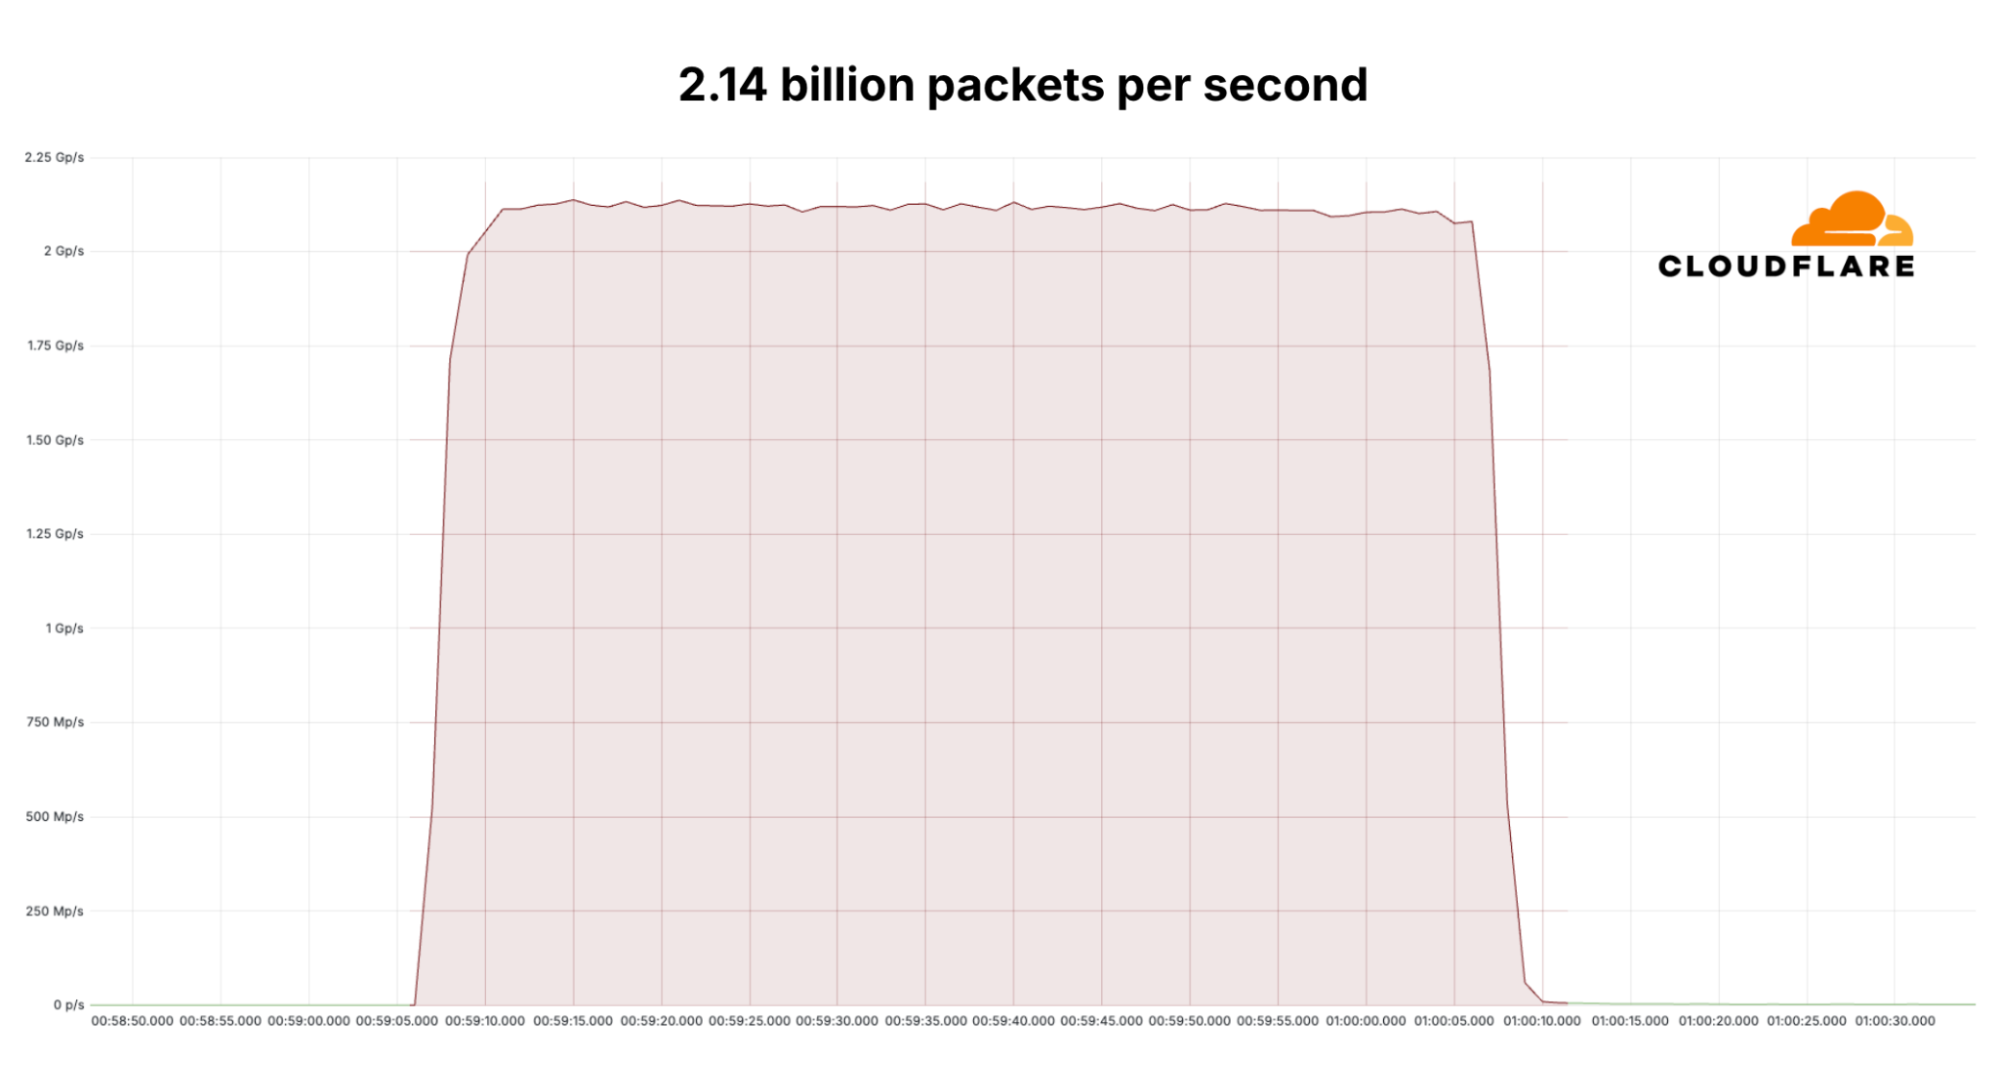
Since the start of 2025, Cloudflare has already mitigated 2,867 Aisuru attacks. In the third quarter alone, Cloudflare mitigated 1,304 hyper-volumetric attacks launched by Aisuru. That represents an increase of 54% QoQ. These include the world record-breaking 29.7 Tbps DDoS attack and the 14.1 Bpps DDoS attack.

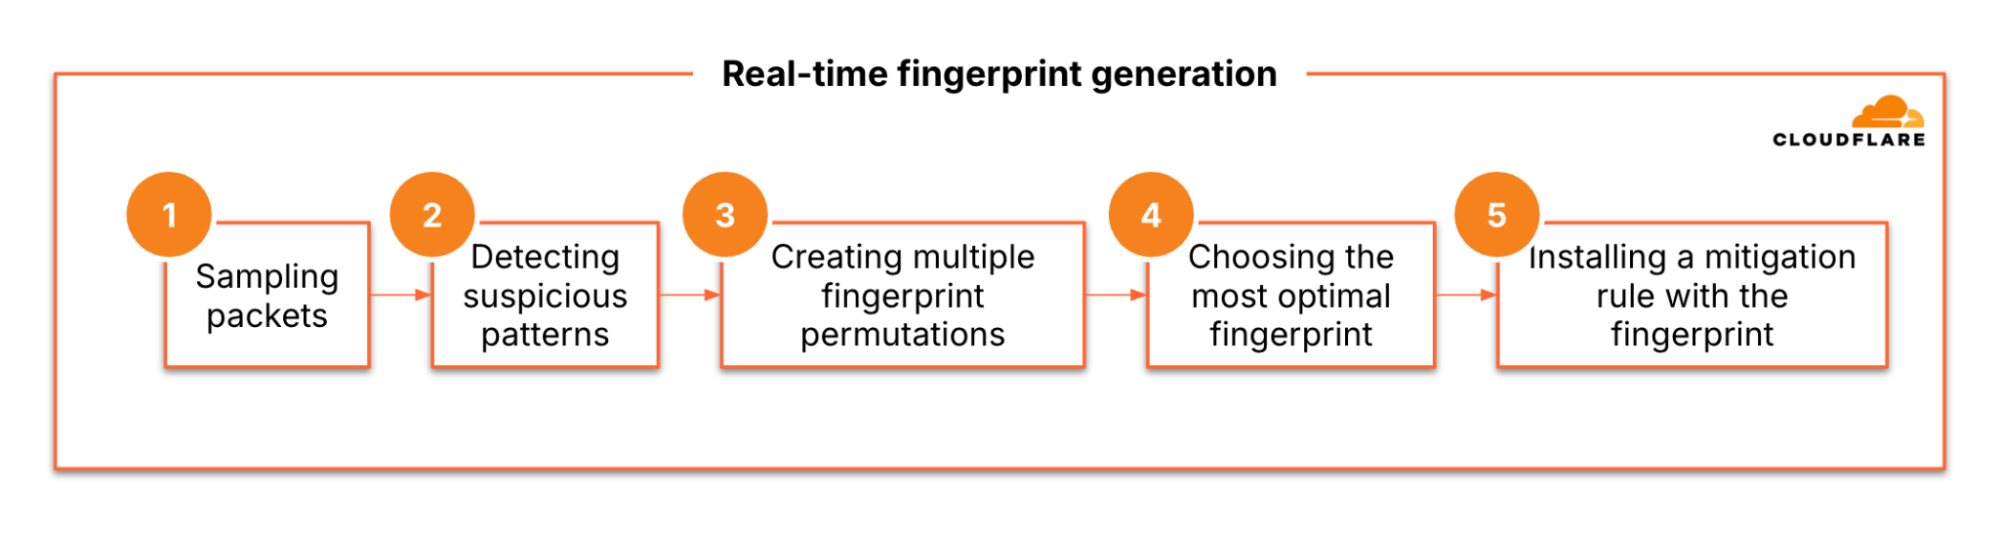
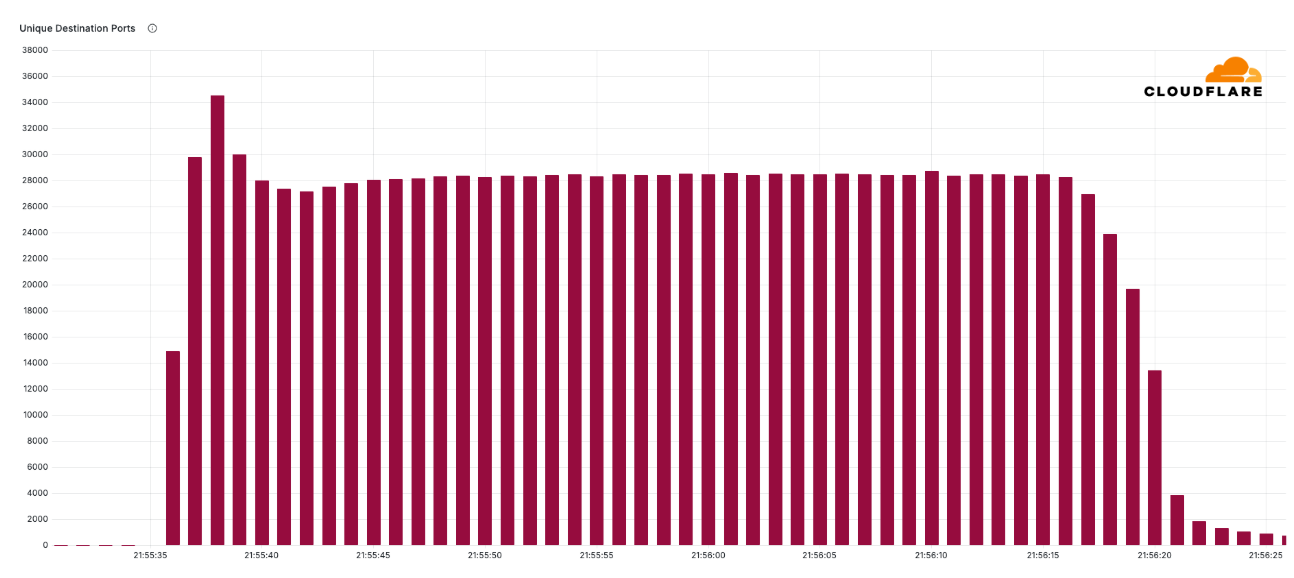
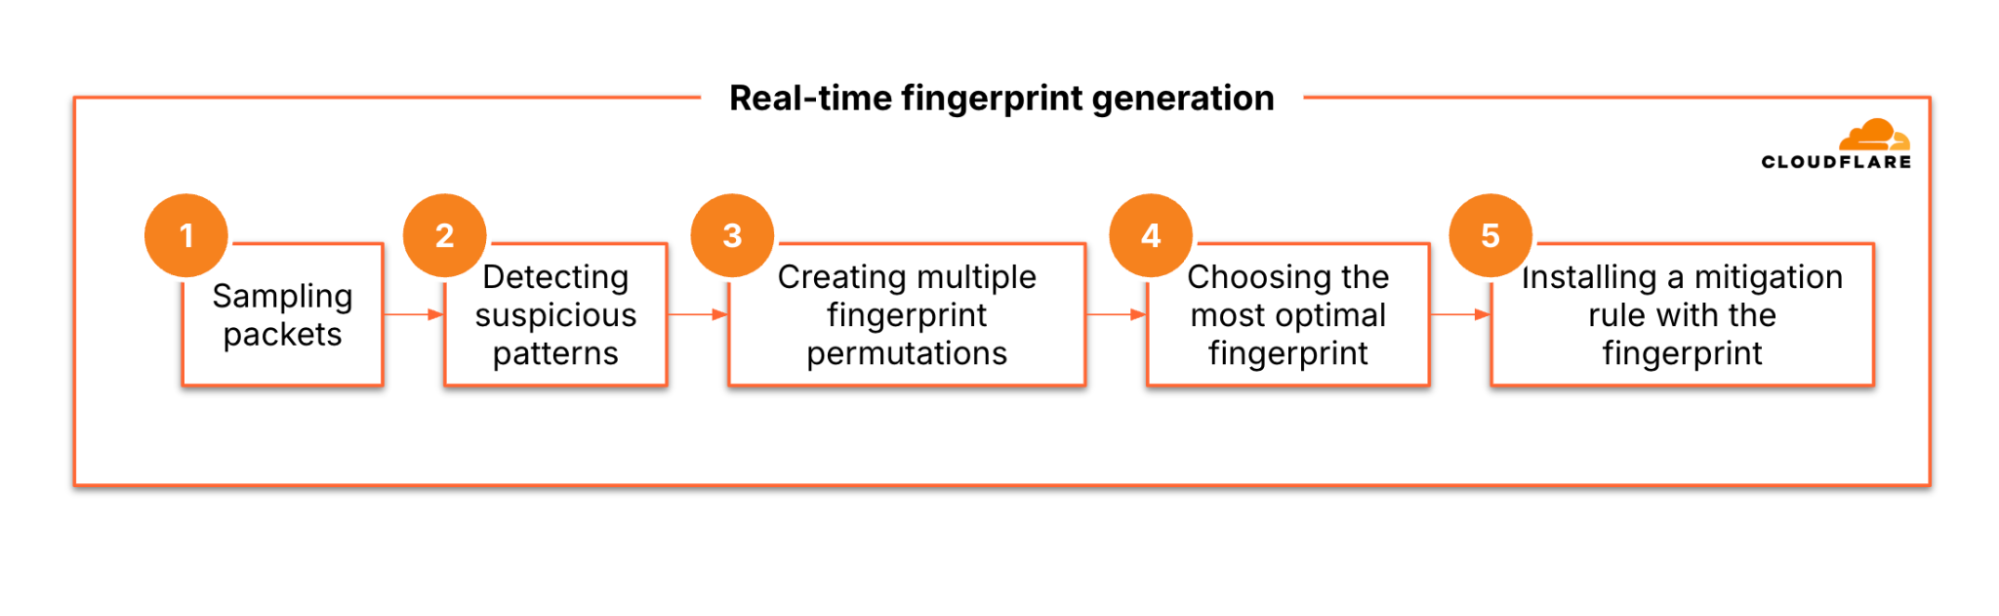
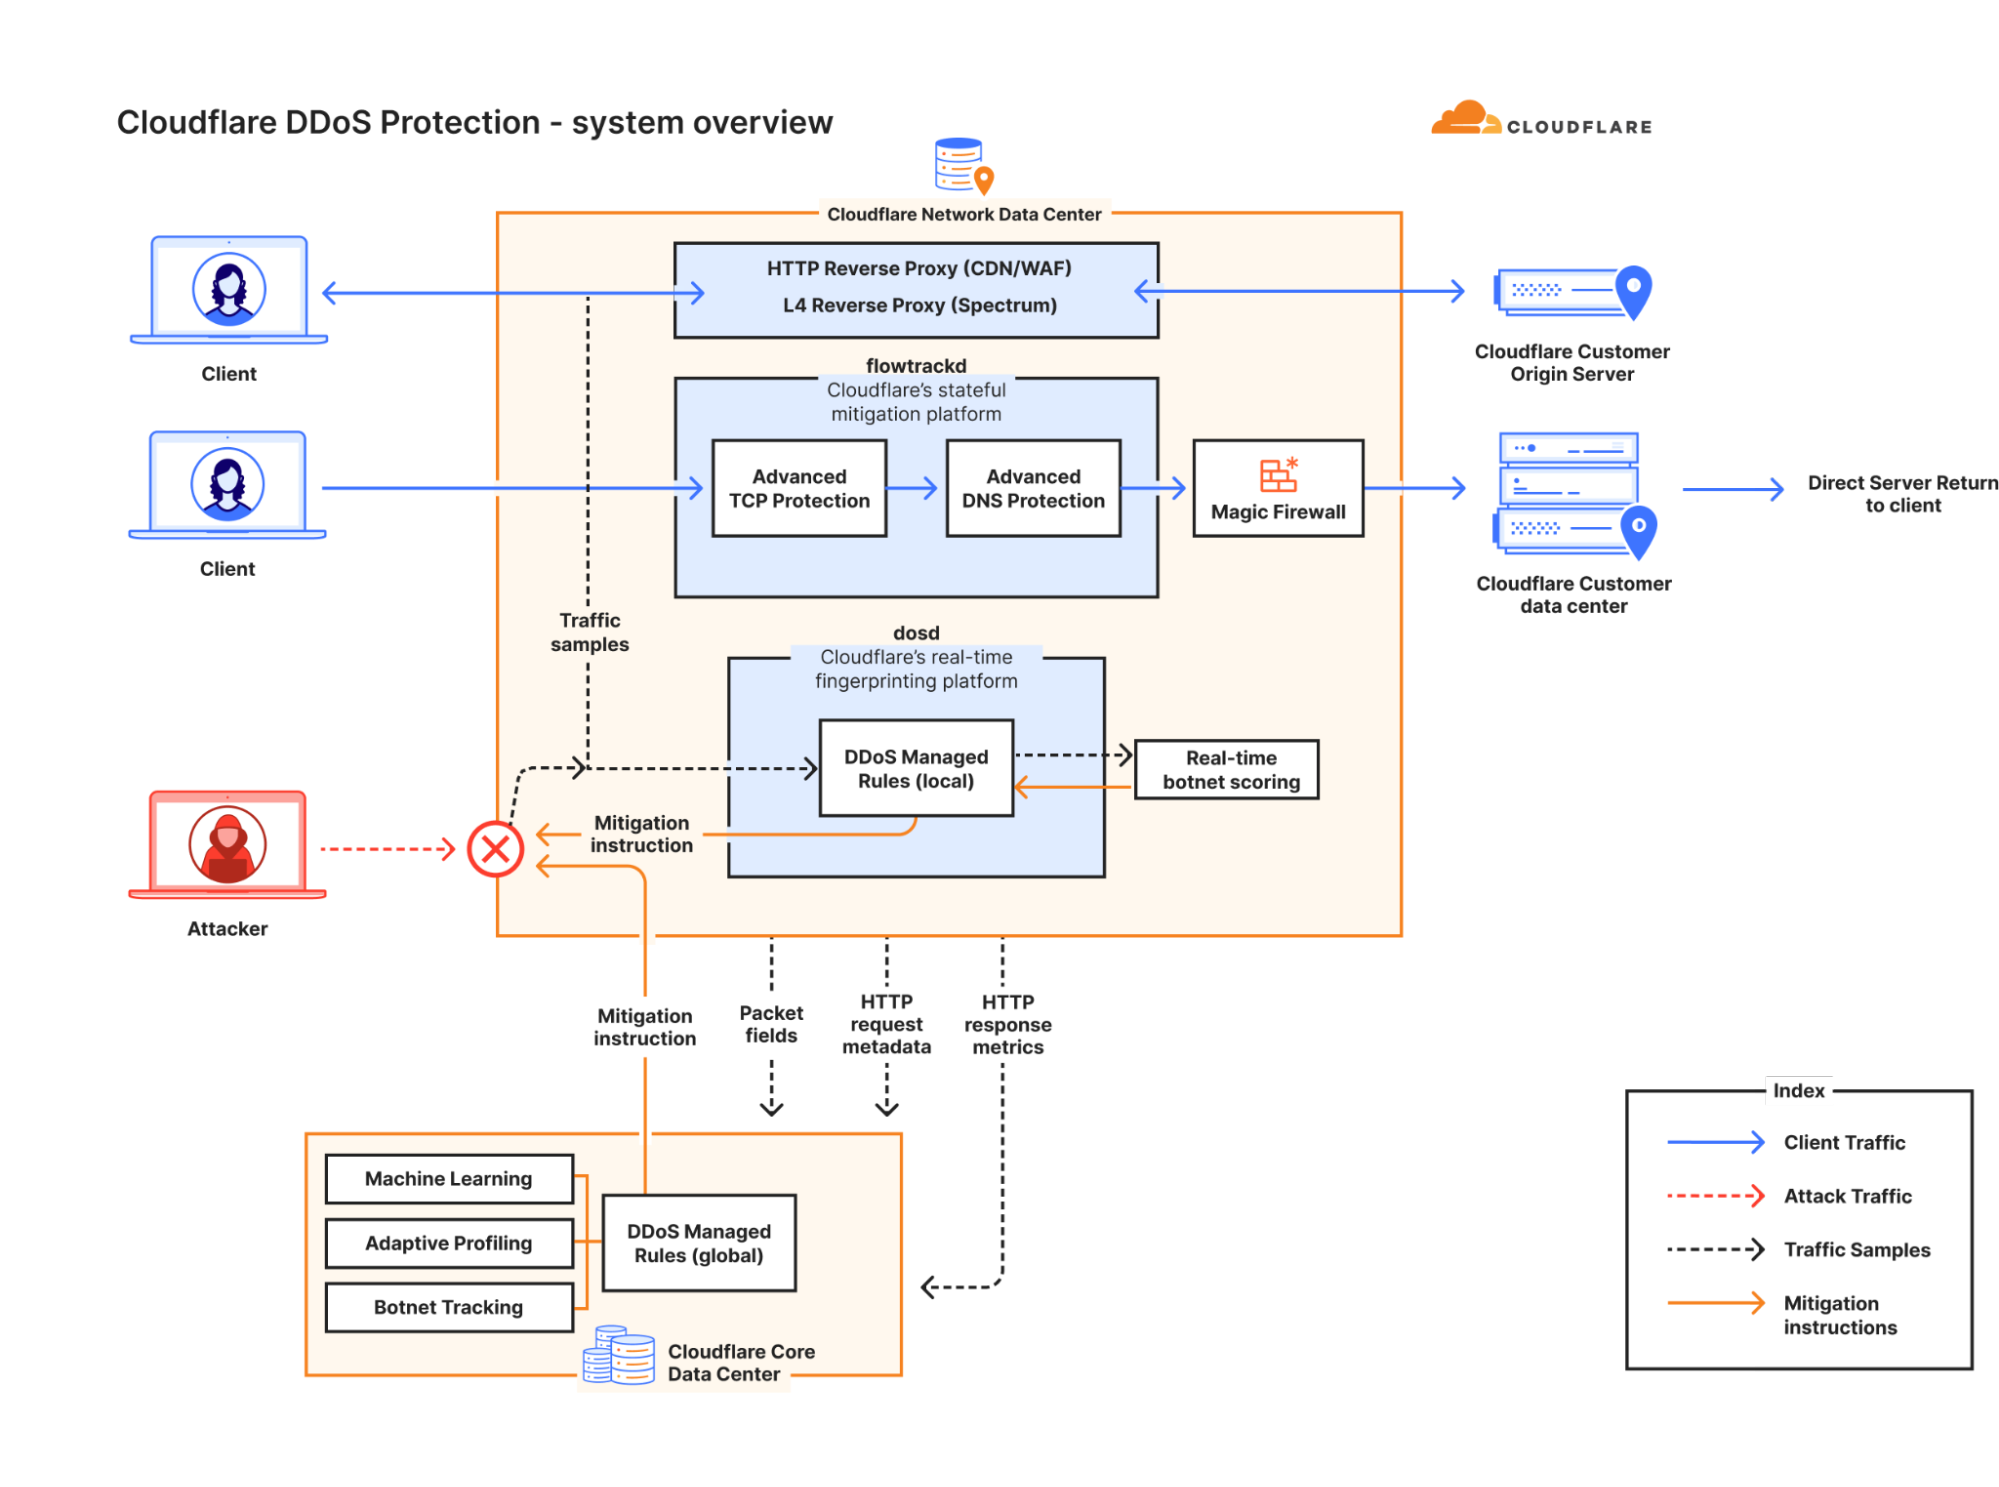
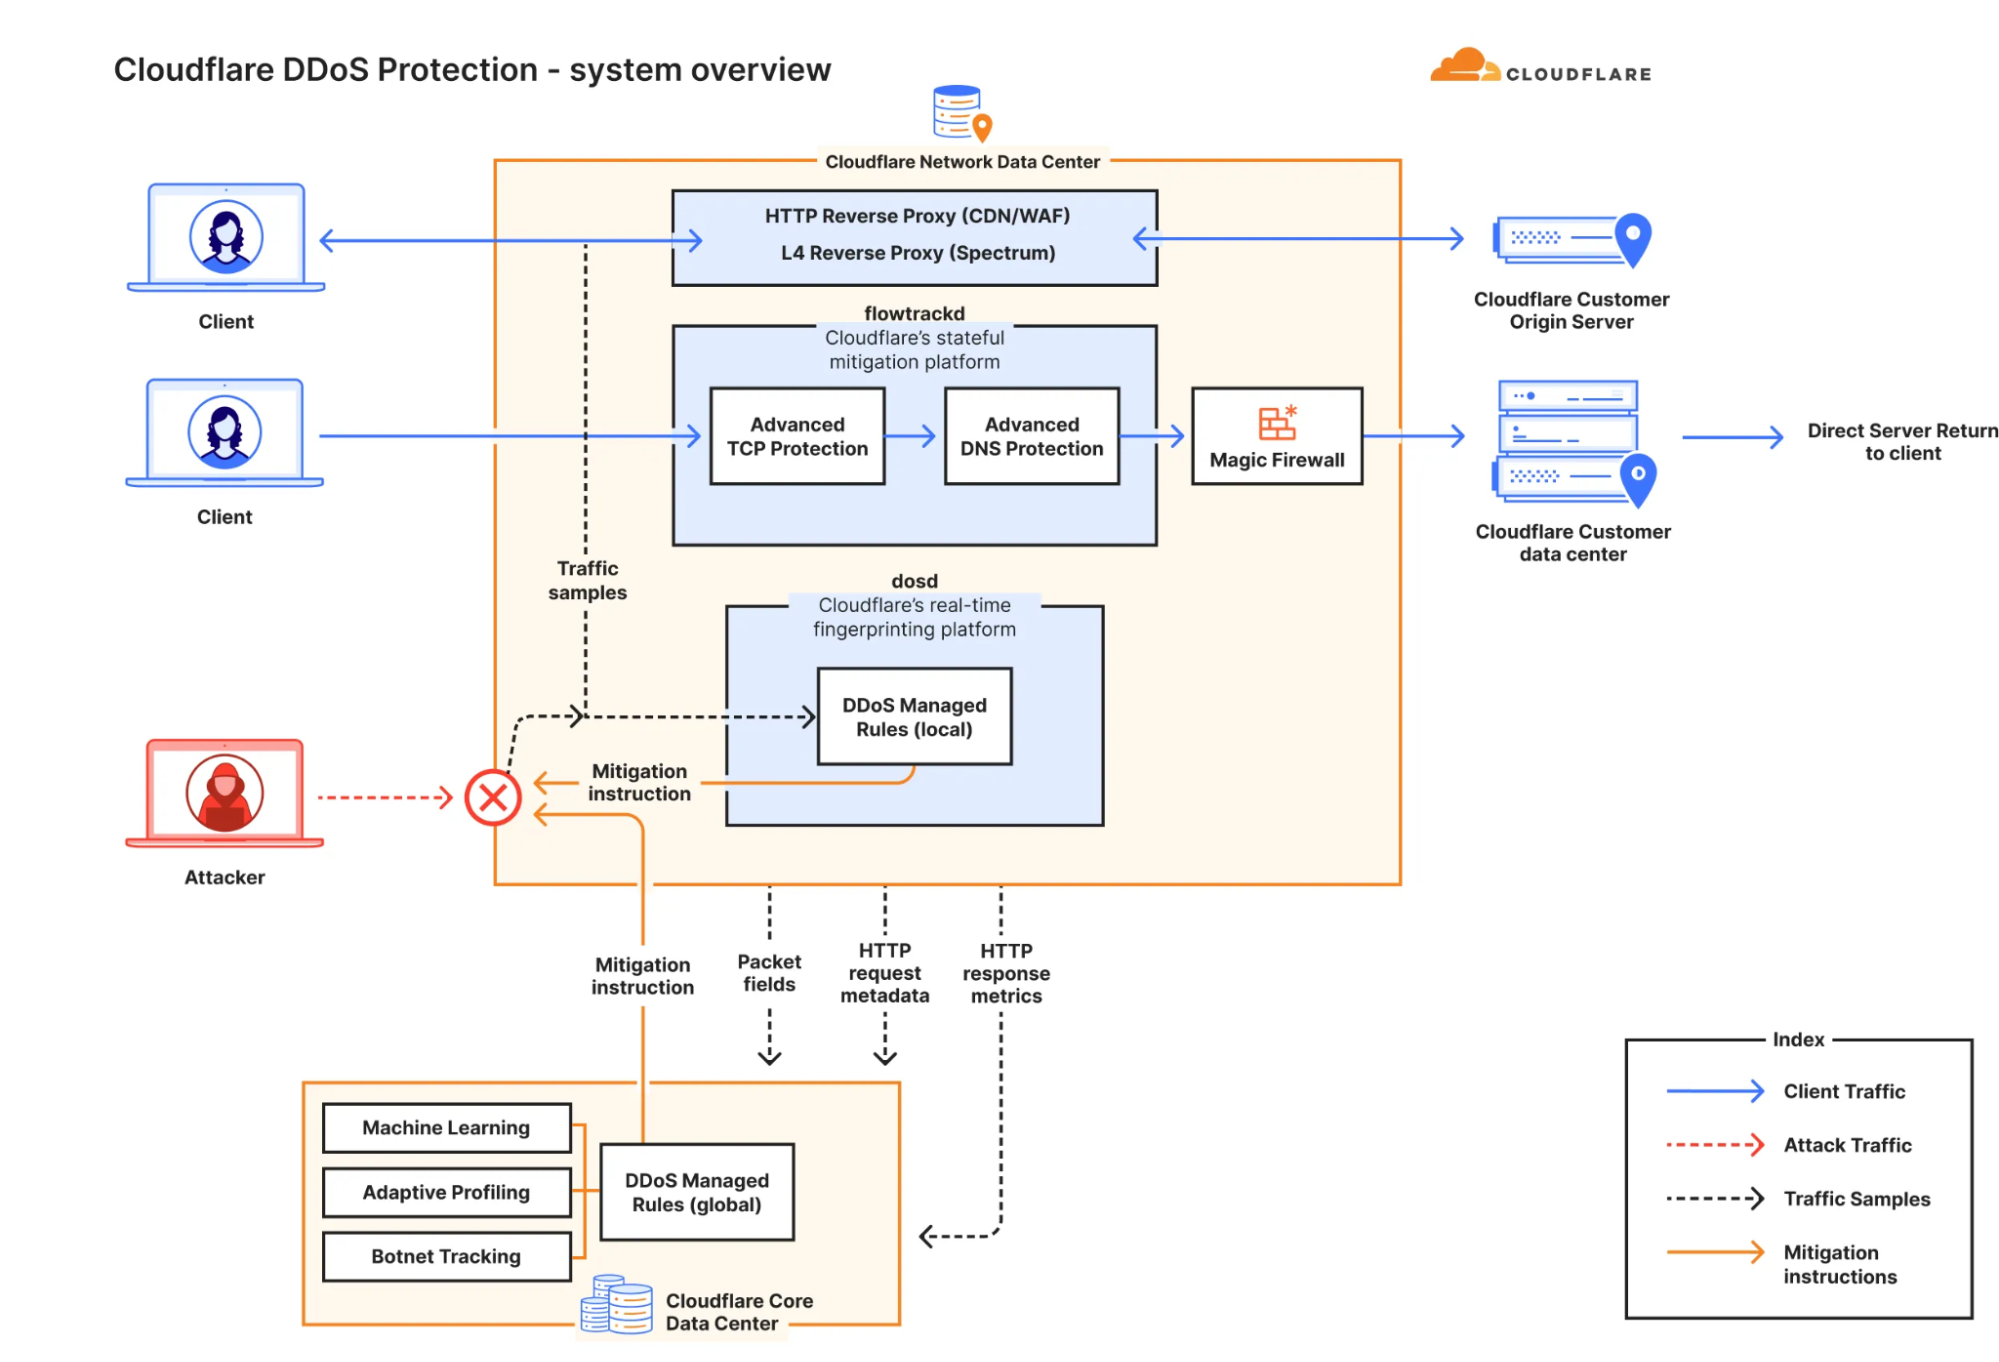
The 29.7 Tbps was a UDP carpet-bombing attack bombarding an average of 15K destination ports per second. The distributed attack randomized various packet attributes in an attempt to evade defenses, but Cloudflare’s mitigation systems detected and mitigated all the attacks, including this one, fully autonomously. Read more on How Cloudflare mitigates hyper-volumetric DDoS attacks.

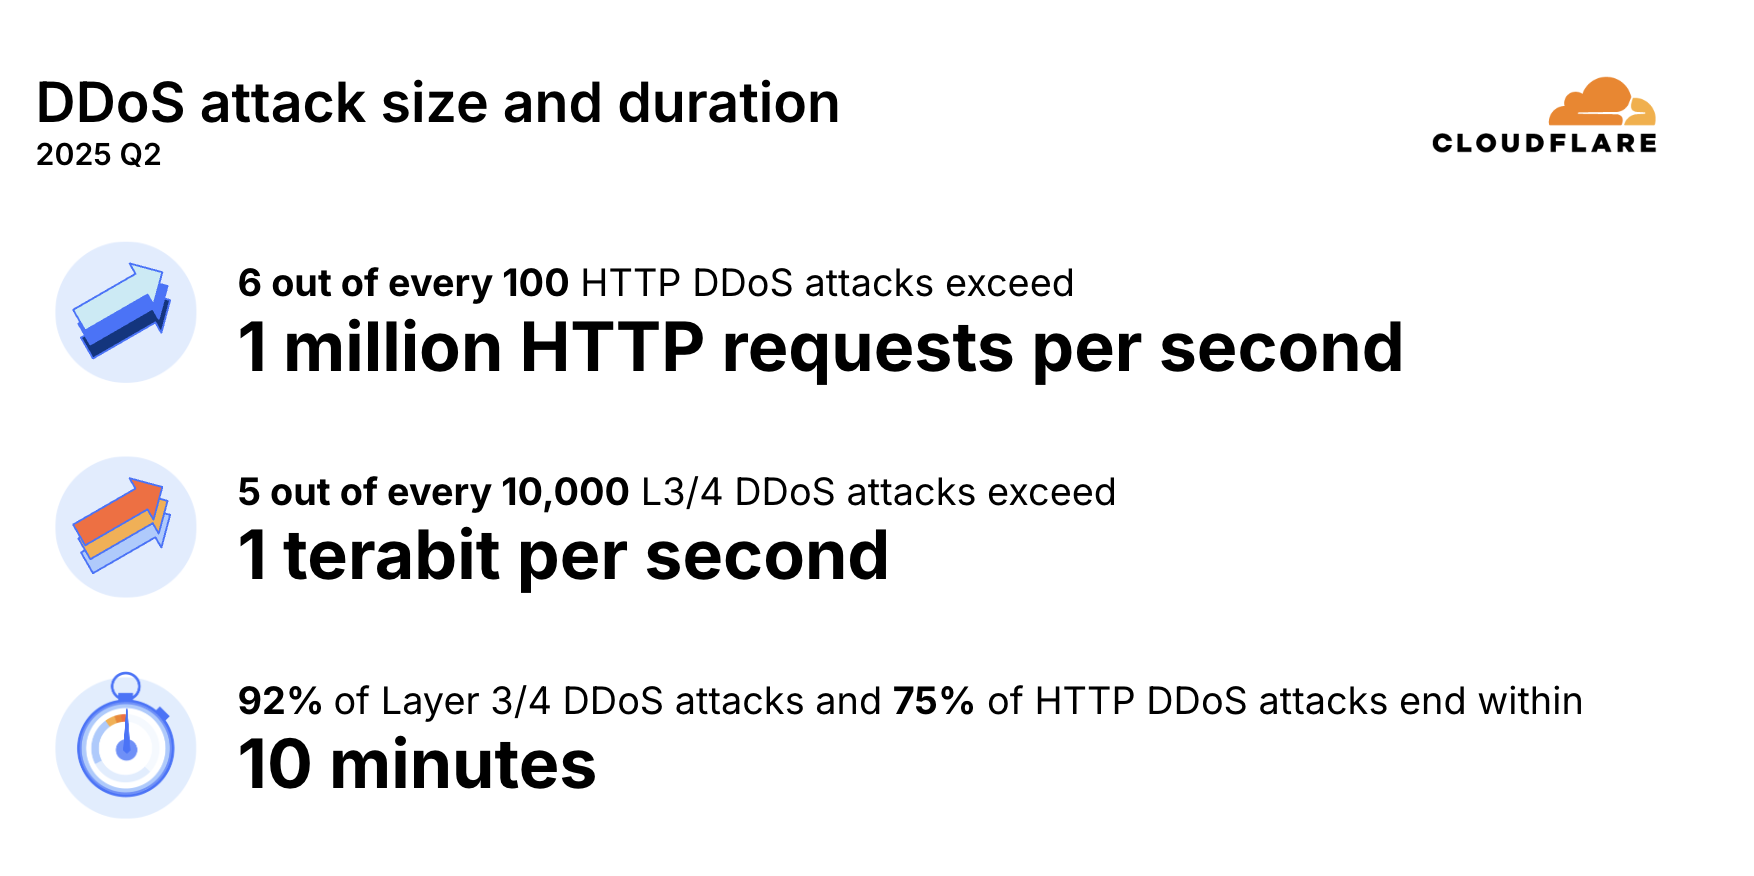
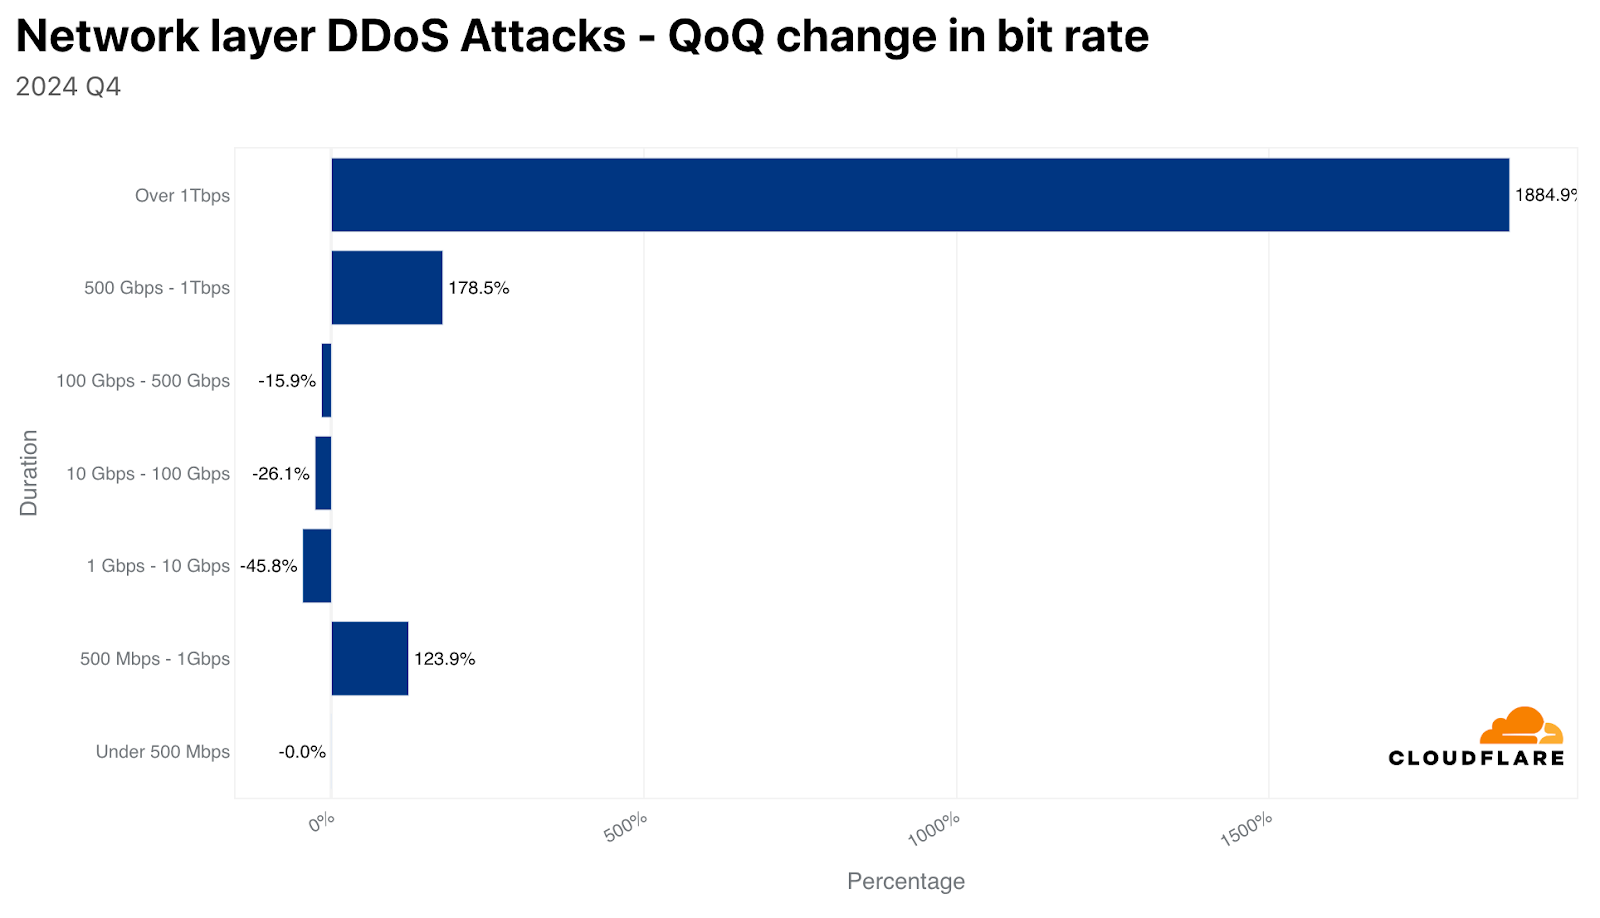
While the majority of DDoS attacks are relatively small, in Q3, the amount of DDoS attacks that exceeded 100 million packets per second (Mpps) increased by 189% QoQ. Similarly, attacks exceeding 1 Tbps increased by 227% QoQ. On the HTTP layer, 4 out of every 100 attacks exceeded 1 million requests per second.
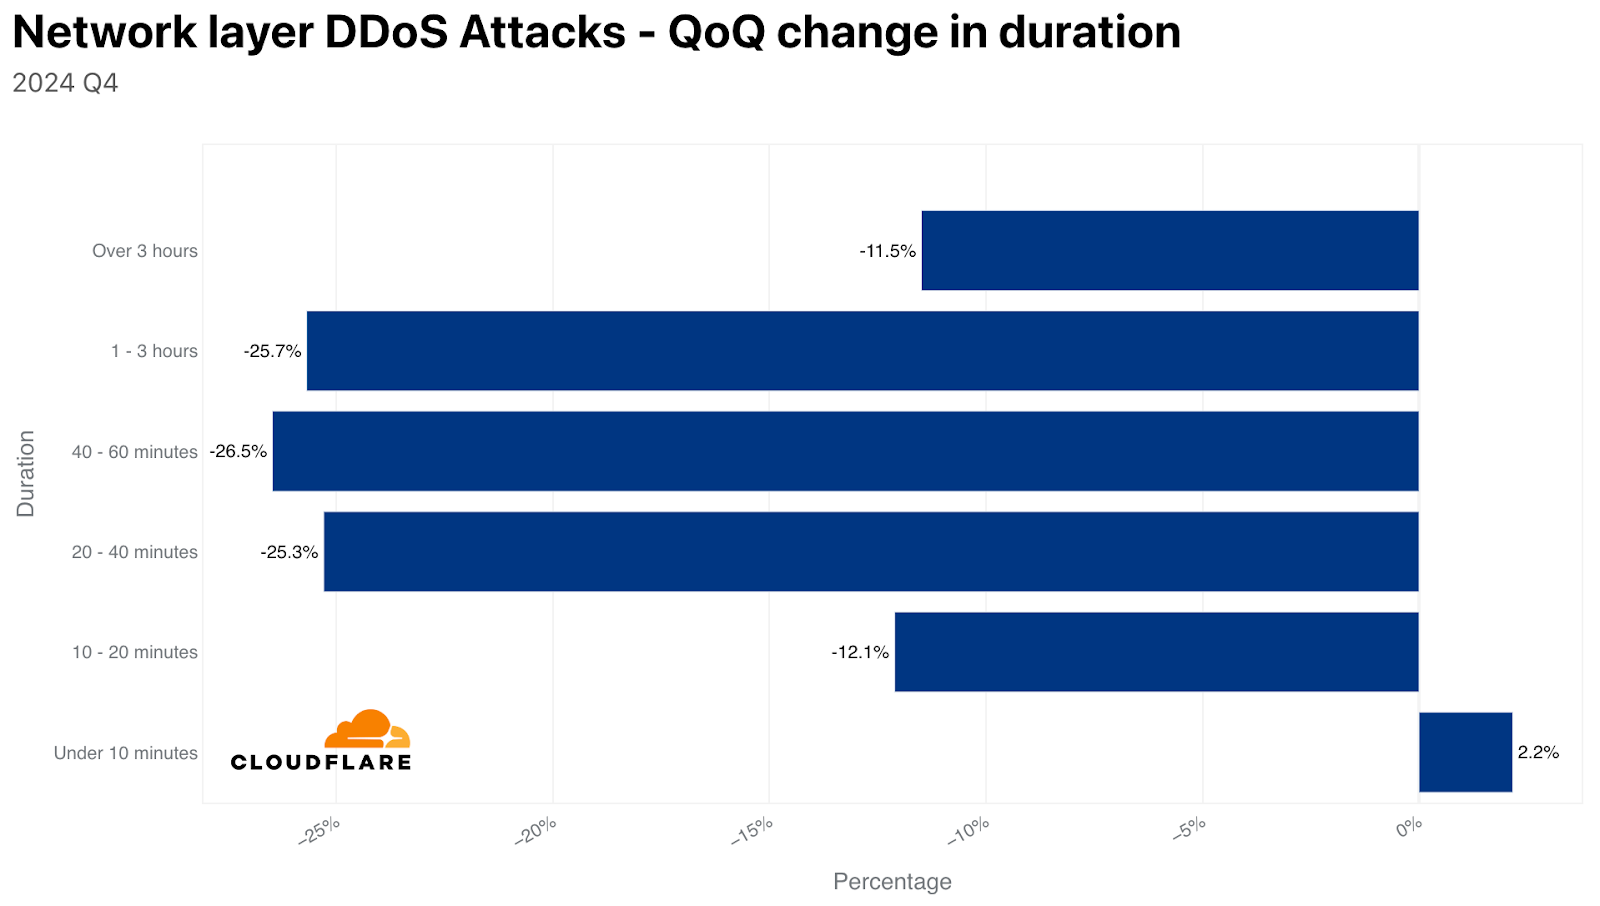
Furthermore, most attacks, 71% of HTTP DDoS and 89% of network-layer, end in under 10 minutes. That’s too fast for any human or on-demand service to react. A short attack may only last a few seconds, but the disruption it causes can be severe, and recovery takes far longer. Engineering and operational teams are then stuck with a complex, multi-step process to get critical systems back online, check data for consistency across distributed systems, and restore secure, reliable service to customers.
The impact of short-lived DDoS attacks, whether hyper-volumetric or not, can extend well beyond the duration of the attack.

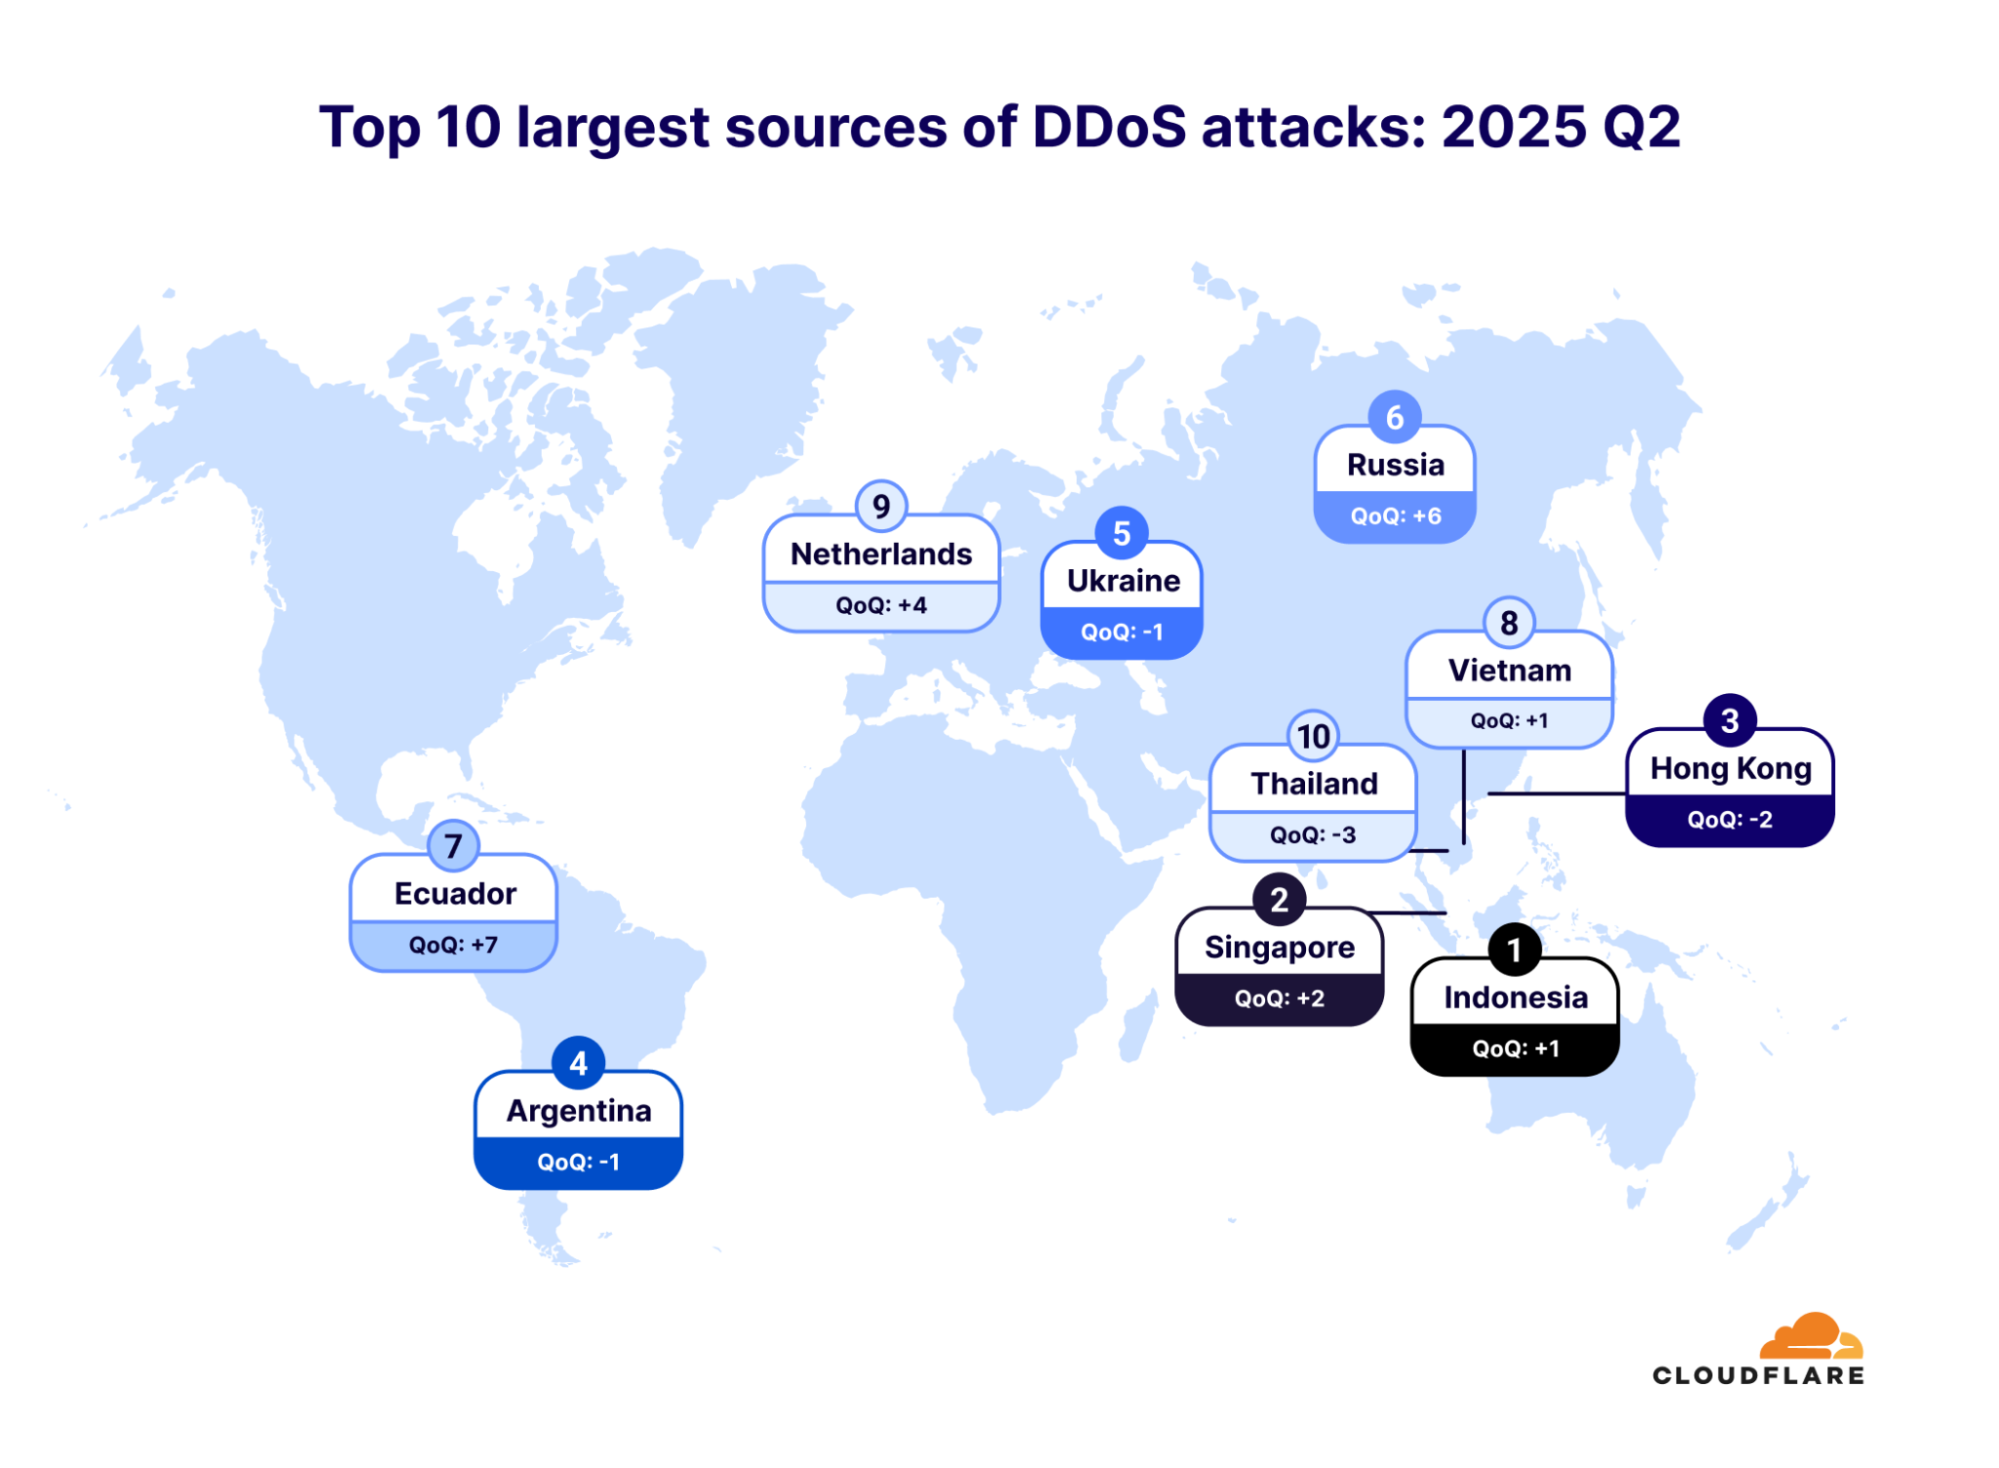
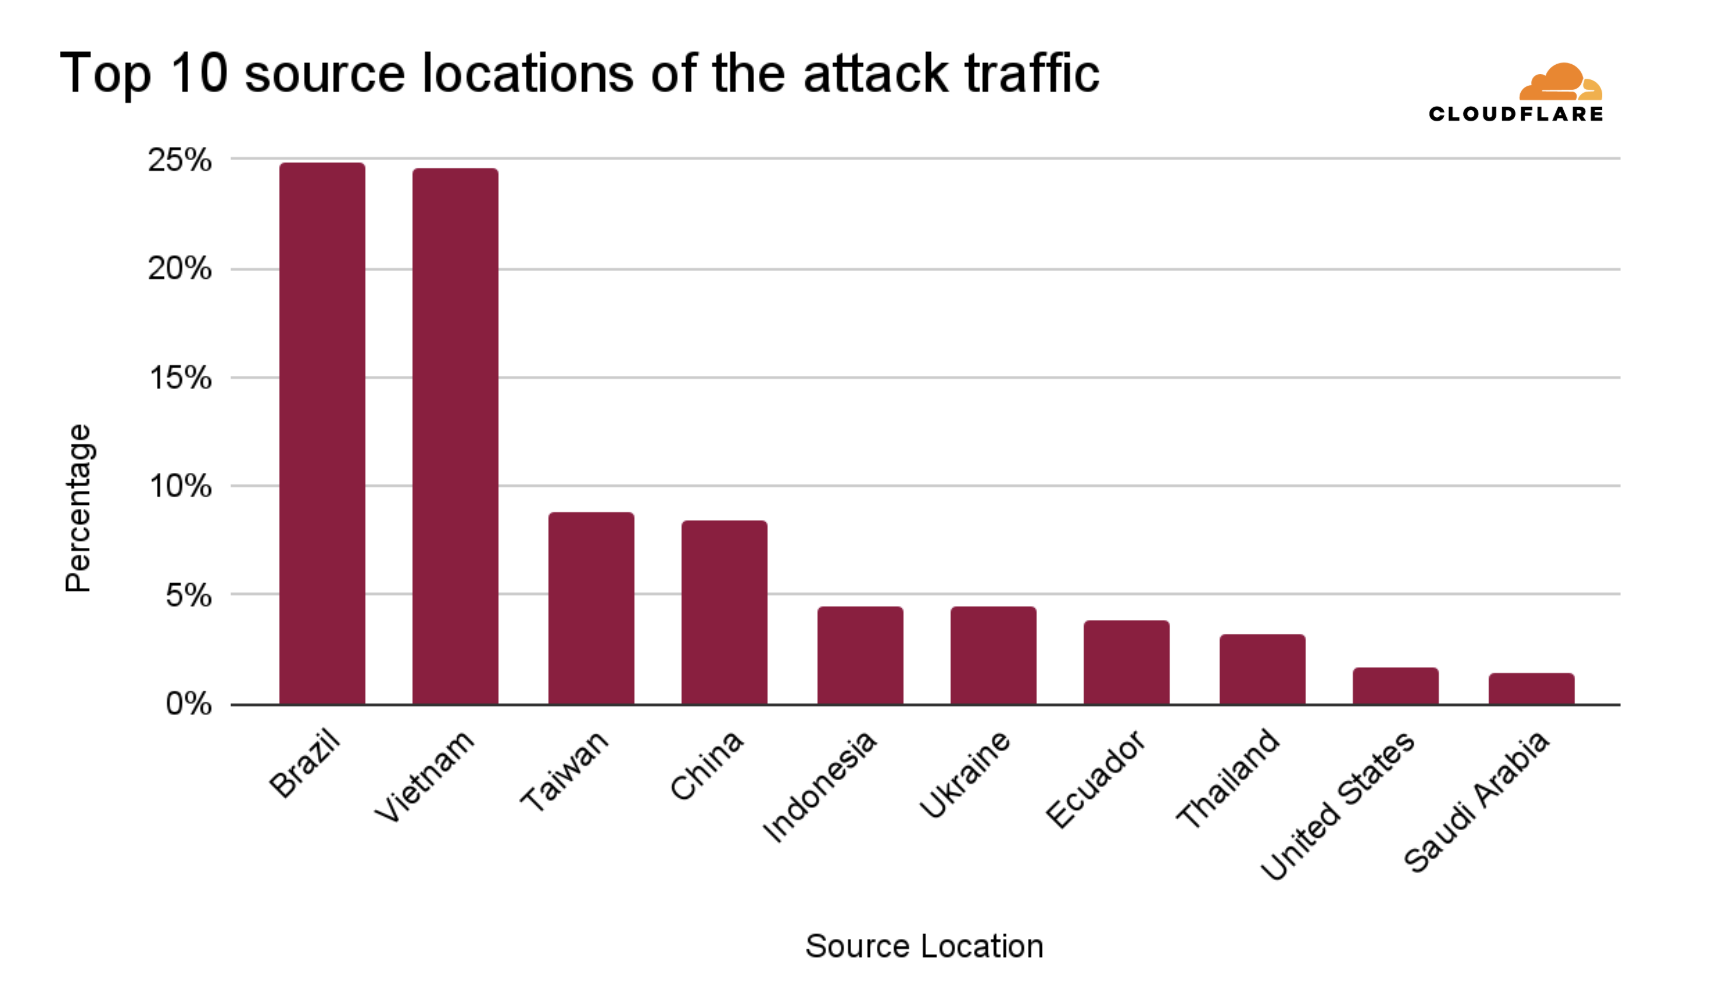
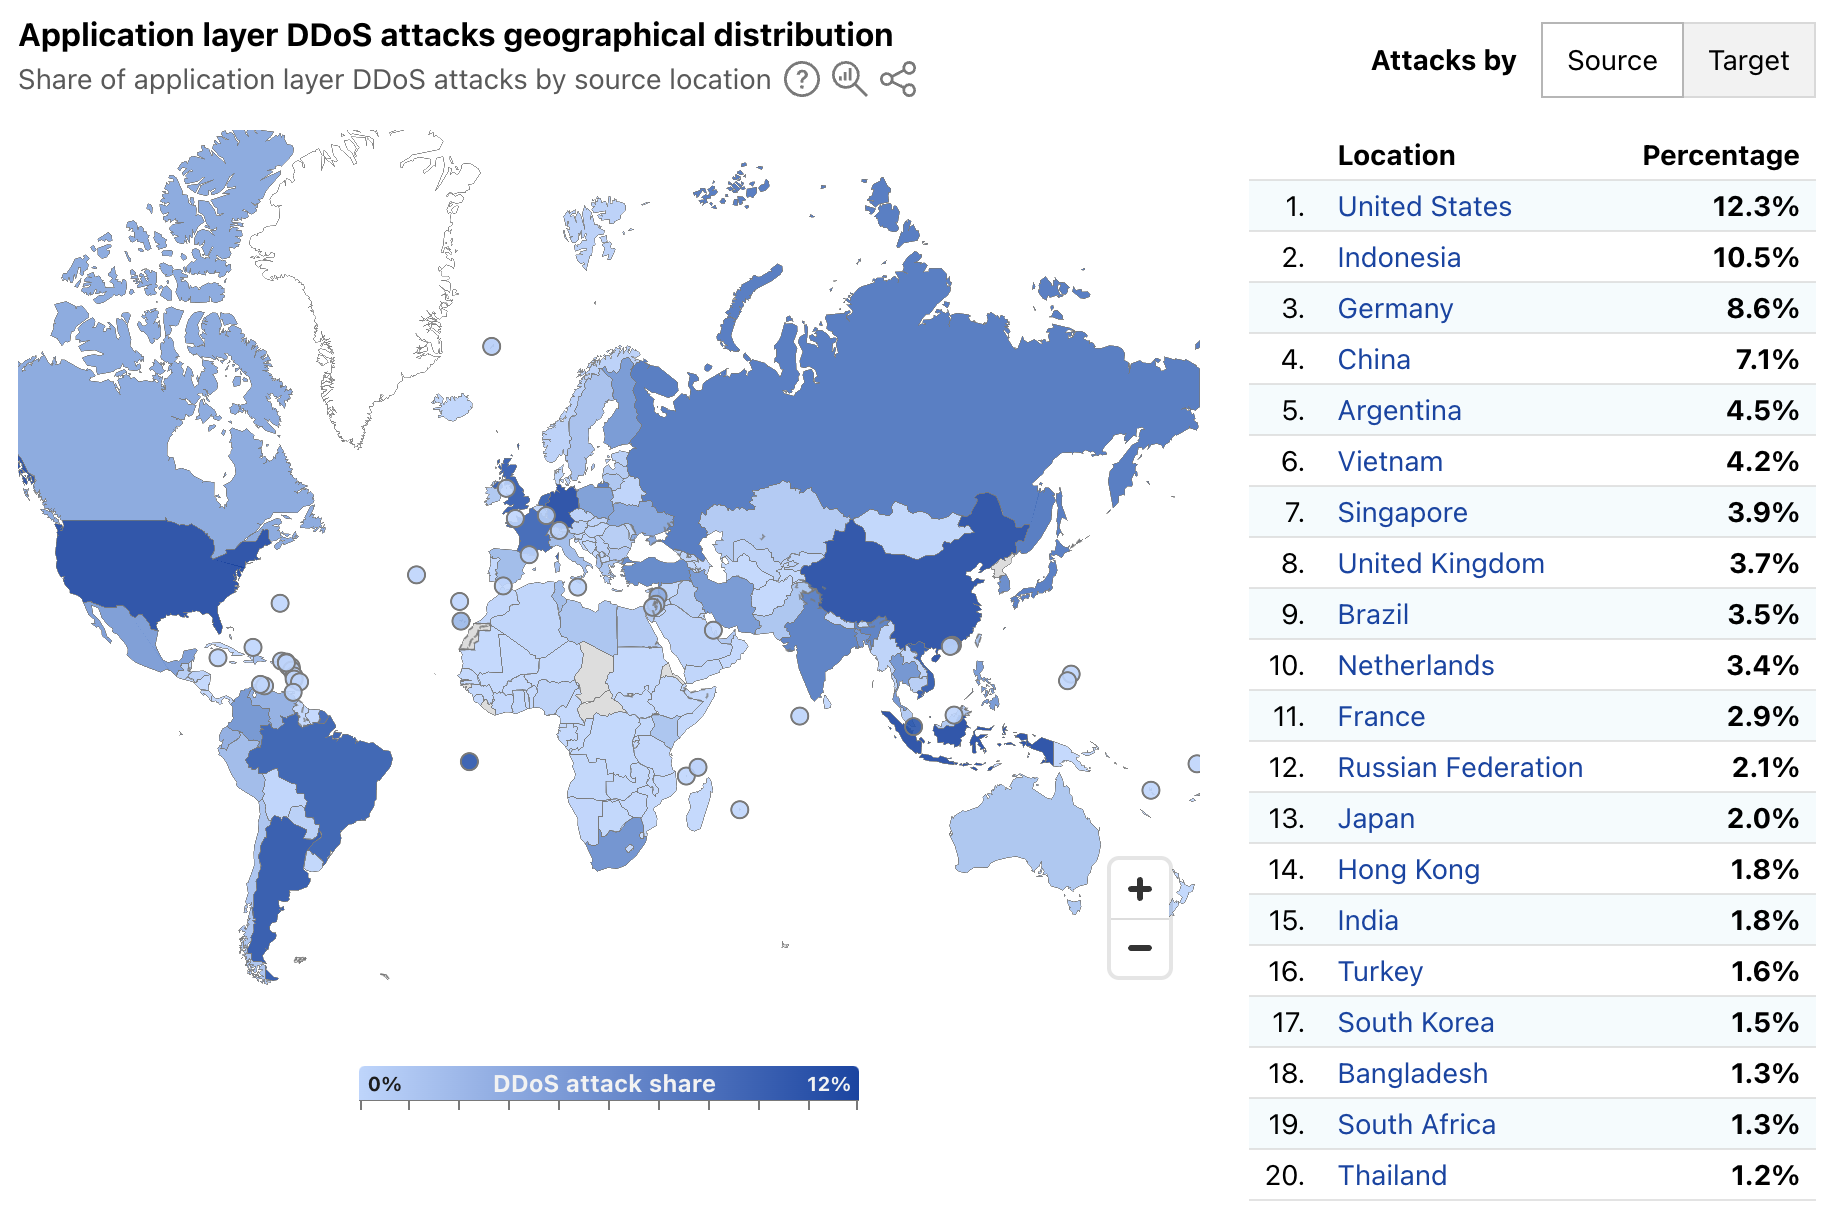
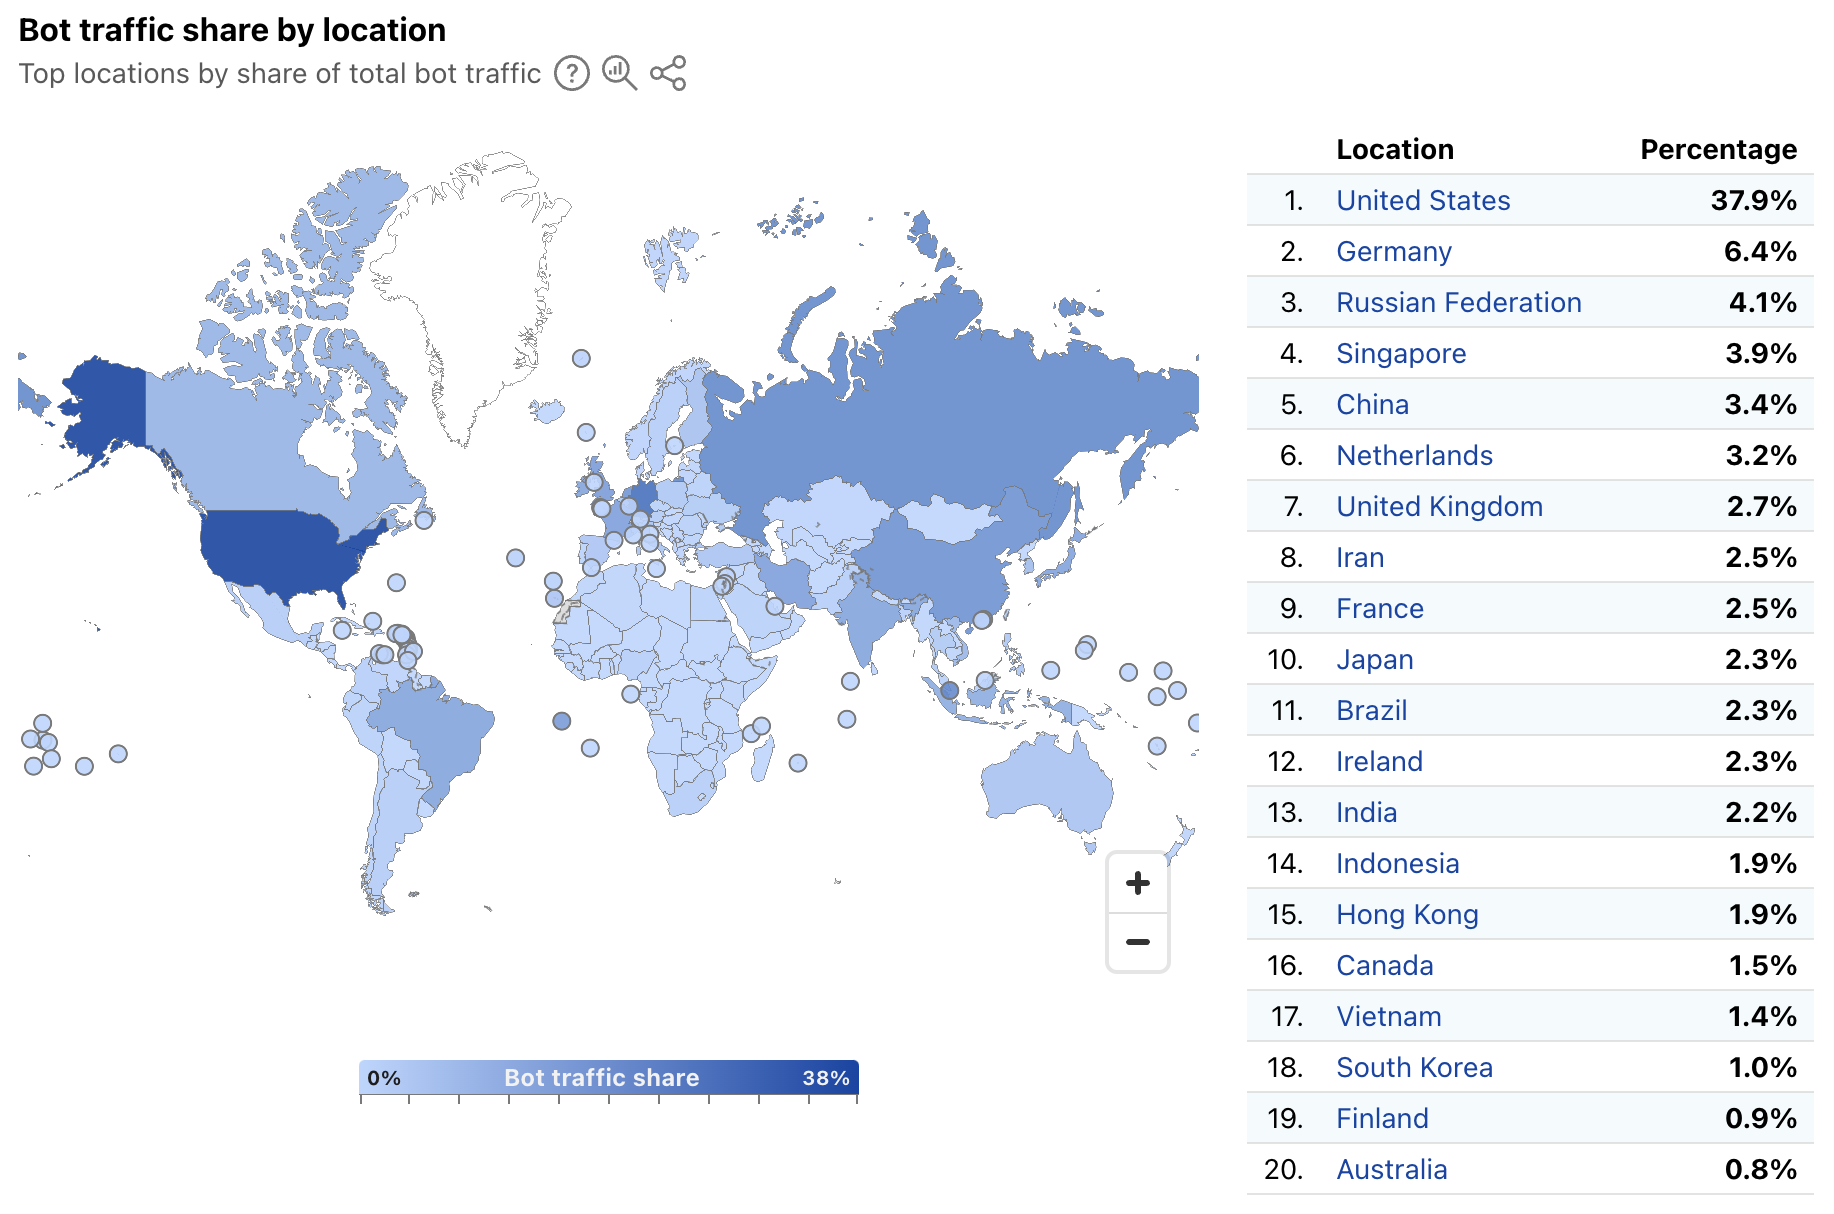
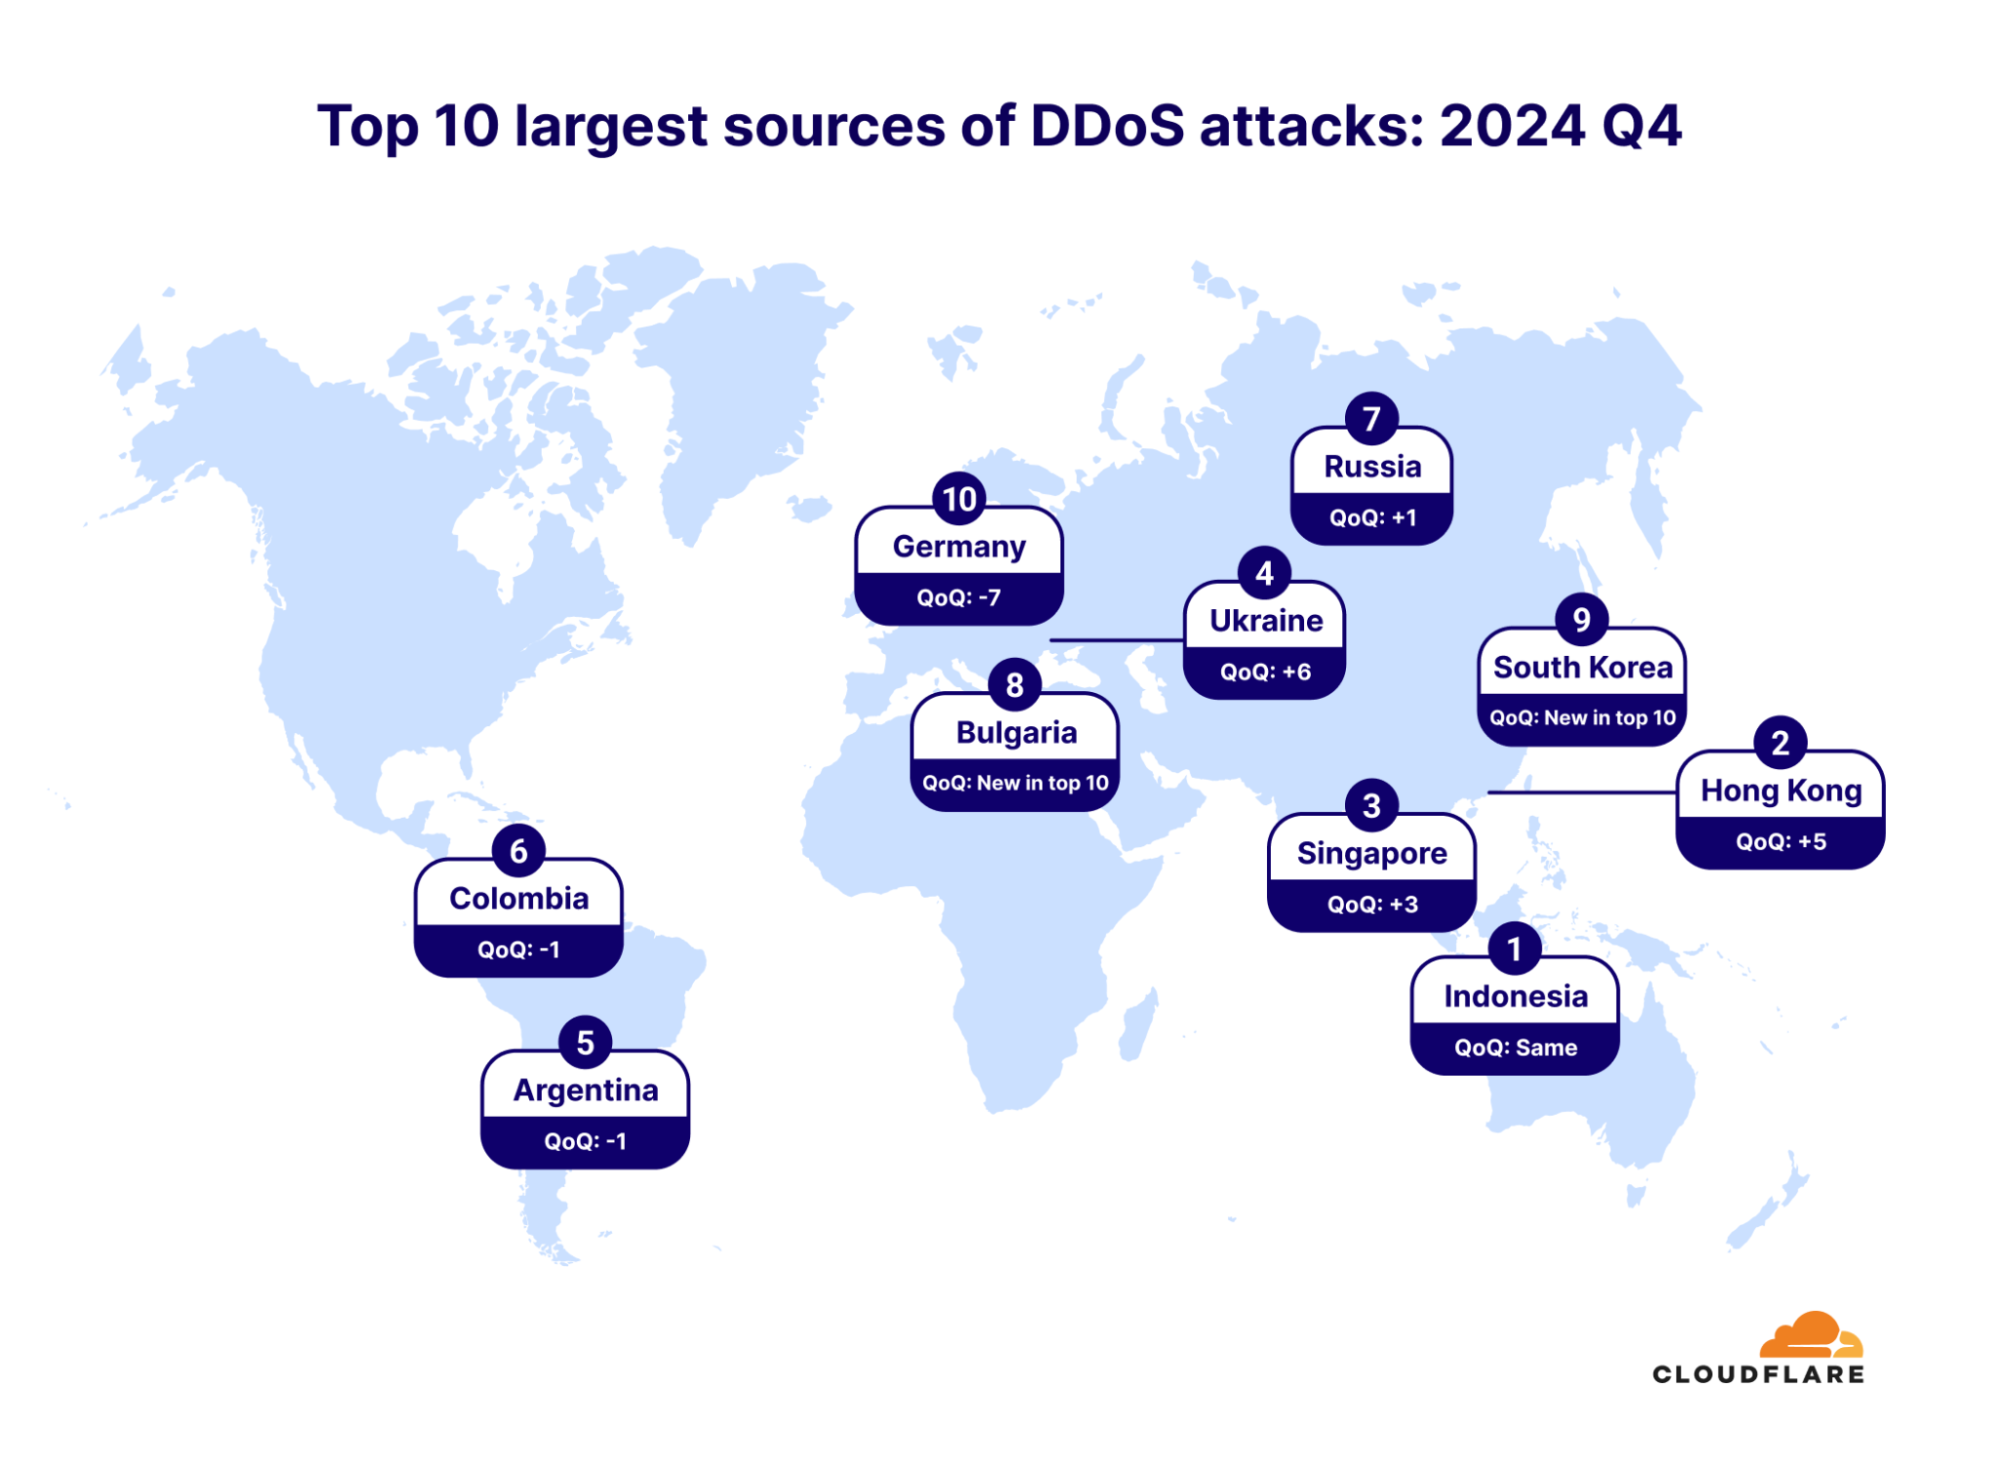
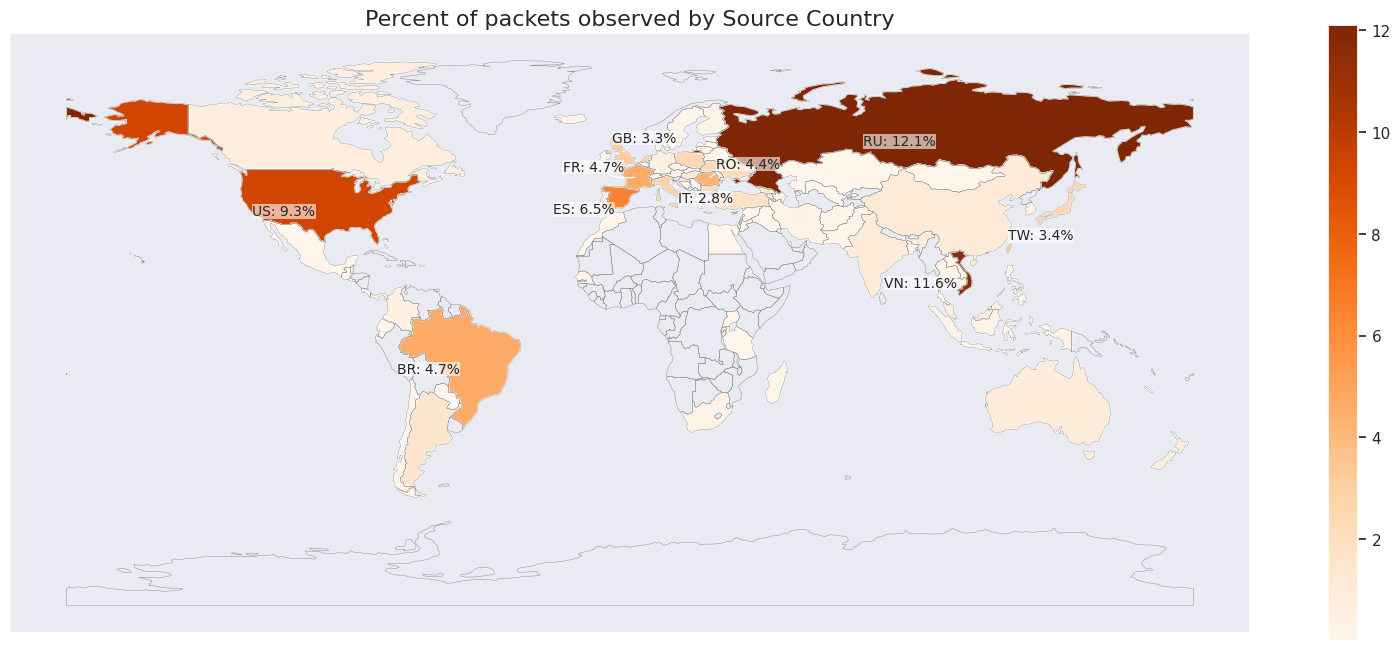
Seven out of the ten top sources are locations within Asia, with Indonesia in the lead. Indonesia is the largest source of DDoS attacks, and it has been ranked number one in the world for an entire year (since 2024 Q3). Even prior to this, Indonesia has always been placed in the top lists of attack sources. In 2024 Q2, Indonesia was the second-largest source, after climbing up from lower ranks in previous quarters and years.
To illustrate the rise of Indonesia as a DDoS hub, in just five years (since 2021 Q3), the percentage of HTTP DDoS attack requests originating from Indonesia has increased by a staggering 31,900%.

DDoS attackers go after rare Earth minerals
DDoS attacks against the Mining, Minerals & Metals industry significantly increased in the third quarter of 2025 as the 25th European Union–China trade summit saw rising tensions over Electric Vehicle (EV) tariffs, rare-earth exports, and cybersecurity issues, according to multiple news outlets. The BBC reported that “China also raised export controls on rare earths and critical minerals.” Overall, the Mining, Minerals & Metals industry surged 24 spots on the global ranking, making it the 49th most attacked industry in the world.
The Automotive industry saw the largest surge in DDoS attacks, leaping the industry by 62 spots in just one quarter, placing it as the sixth most attacked industry in the world. Cybersecurity companies also saw a significant increase in DDoS attacks. The Cybersecurity industry hopped by 17 spots, making it the 13th most attacked industry in the world.
DDoS attacks against AI surge by 347%
In September 2025, a Tony Blair Institute poll showed Britons view AI more as an economic risk than an opportunity, sparking major headlines about automation and trust. The UK Law Commission launched a review into AI use in government, making it a headline month for AI ethics, regulation, and generative-AI adoption. In September 2025, Cloudflare also saw MoM spikes as high as 347% in HTTP DDoS attack traffic against generative AI companies (based on a sample of leading generative AI services).
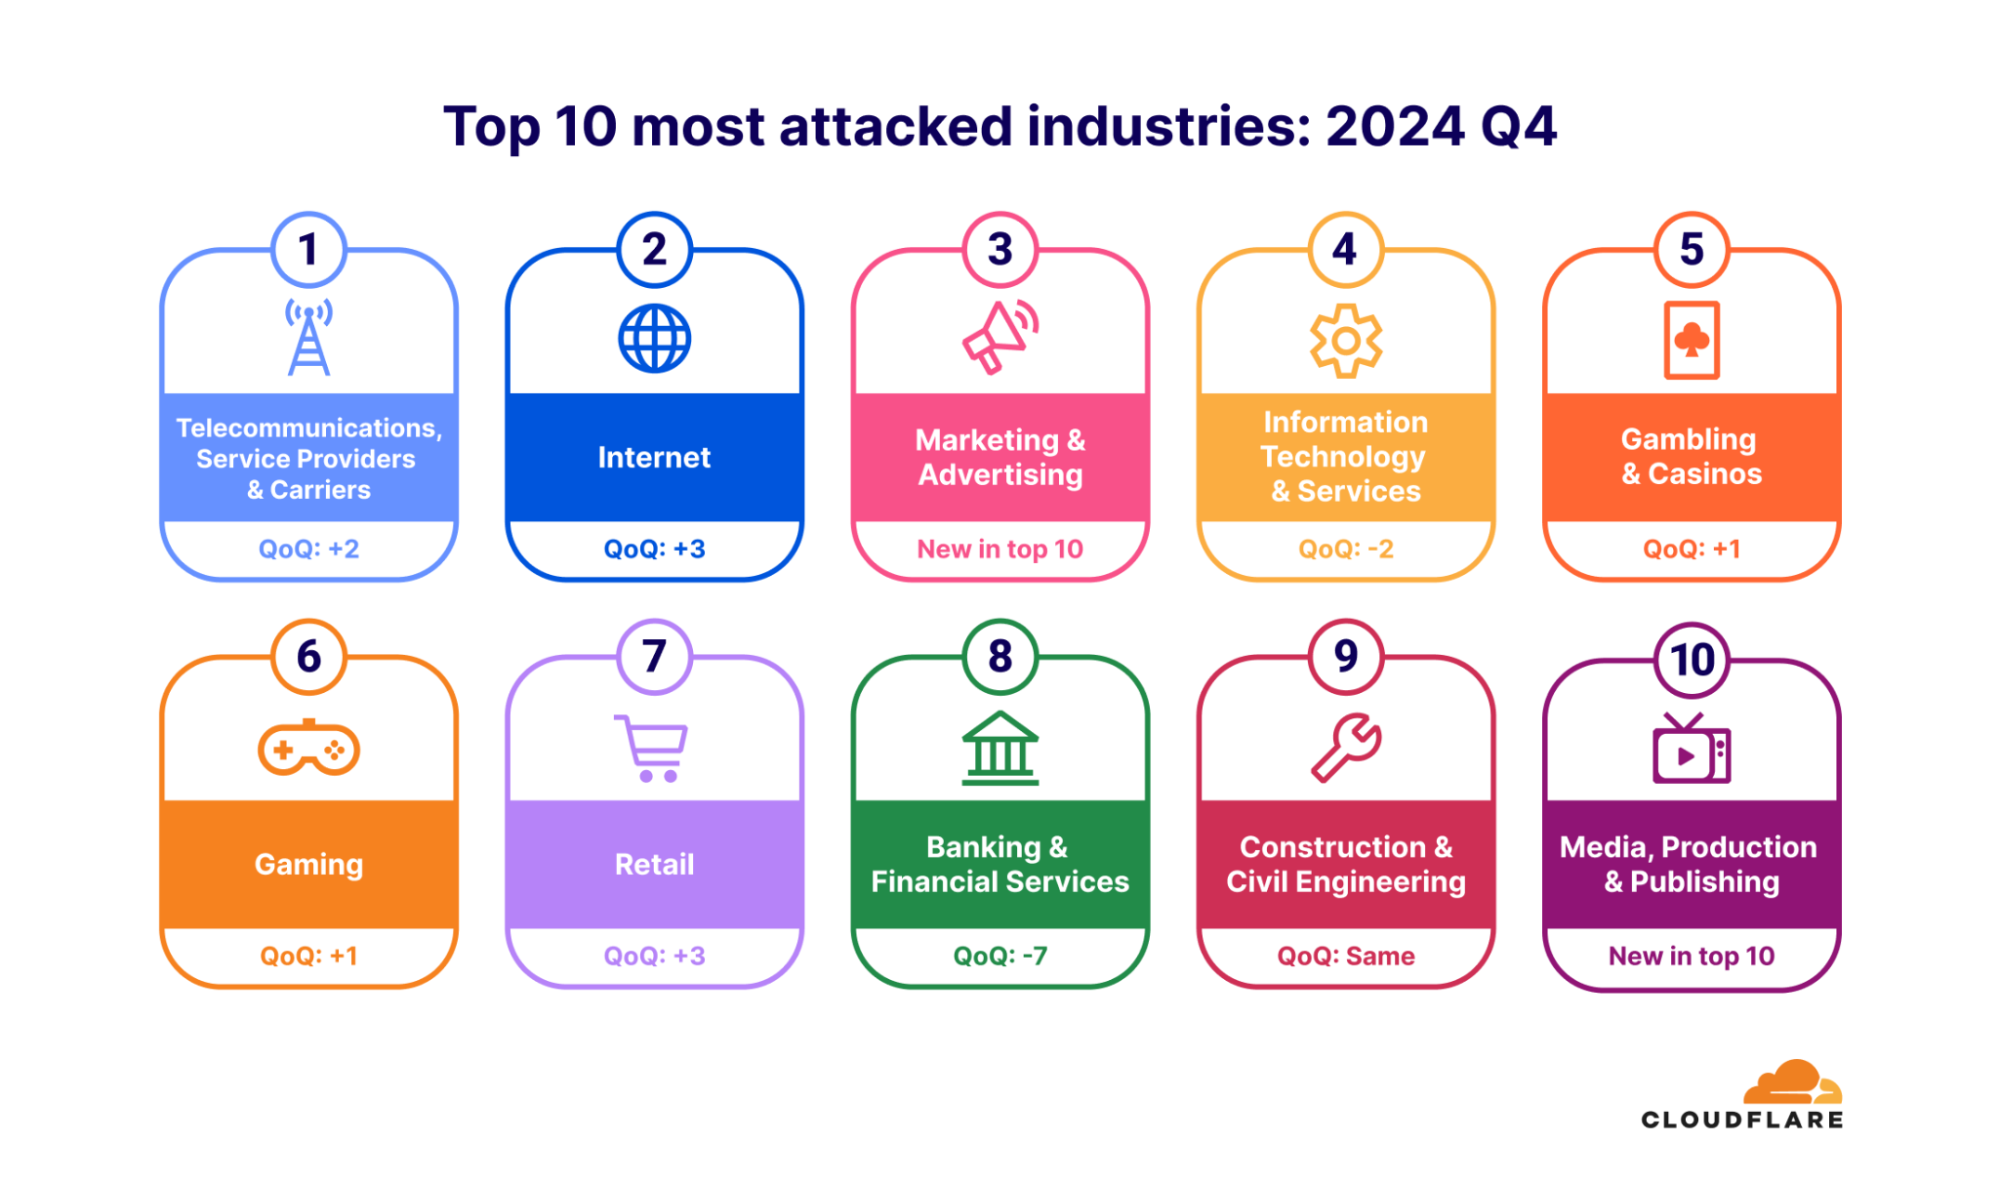
The top 10
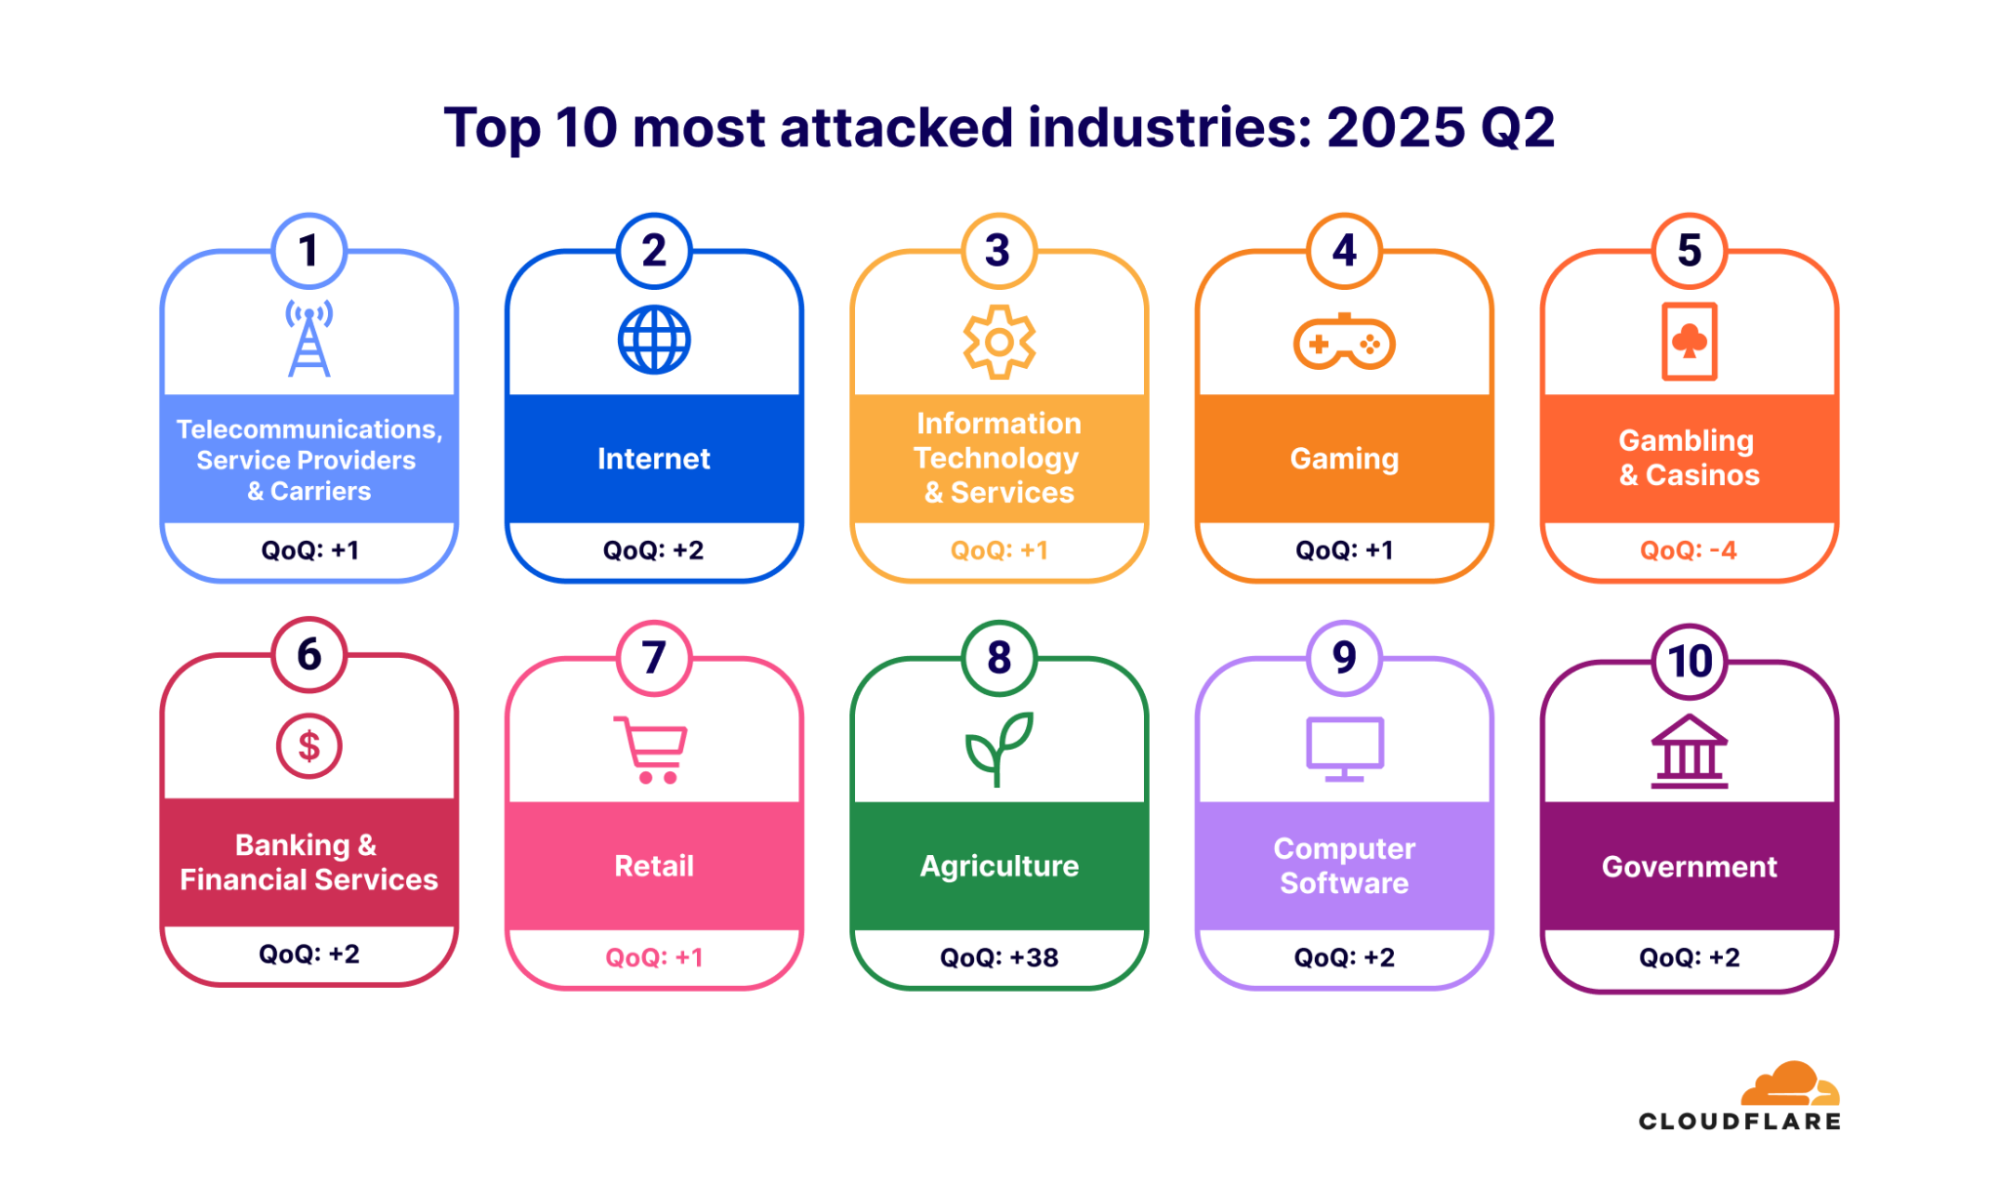
In the third quarter of 2025, Information Technology & Services topped the list as the most attacked industry, followed by Telecommunications, and Gambling & Casinos. Notably, Automotive surged dramatically by 62 spots QoQ. Media, Production & Publishing also saw a sharp rise, preceded by the Banking & Financial Services industry, the Retail industry, and the Consumer Electronics industry.

There is a direct correlation between geopolitical events and DDoS attack activity.
Stop the Loot!
“Lootuvaifi” (Stop the Loot!) in Maldivian, became the rallying chant in the 2025 Maldivian protests as protesters took to the streets objecting the “perceived government corruption and democratic backsliding,” peaking with the “end of free speech” media bill, which the UN Human Rights Chief said will “seriously undermine media freedom and the right to freedom of expression for the people of the Maldives if not withdrawn.” The 2025 Maldivian protests were accompanied by a barrage of DDoS attacks. Correspondingly, the Maldives was the country that saw the highest increase in DDoS attacks. In the third quarter of 2025, the Maldives leaped by 125 spots, making it the 38th most attacked country in the world.
‘Block Everything’
The nationwide protest movement, “Block Everything,” or “Bloquons Tout” in French, was launched by French trade unions in September 2025 to oppose President Macron’s government over new austerity measures, pension system changes, and rising living costs. While trade unions called for coordinated strikes and transport blockades to paralyze the country, cyber threat actors targeted French websites and Internet services with waves of DDoS attacks. France jumped 65 spots QoQ, making it the 18th most attacked country in the world.
‘Drawing the red line for Gaza in Brussels’
Increases in DDoS attacks were observed alongside protests in more countries. For example, Belgium jumped 63 places making it the 74th most attacked country in the world, as “tens of thousands of protesters drew the Red Line for Gaza in Brussels.”
The top 10
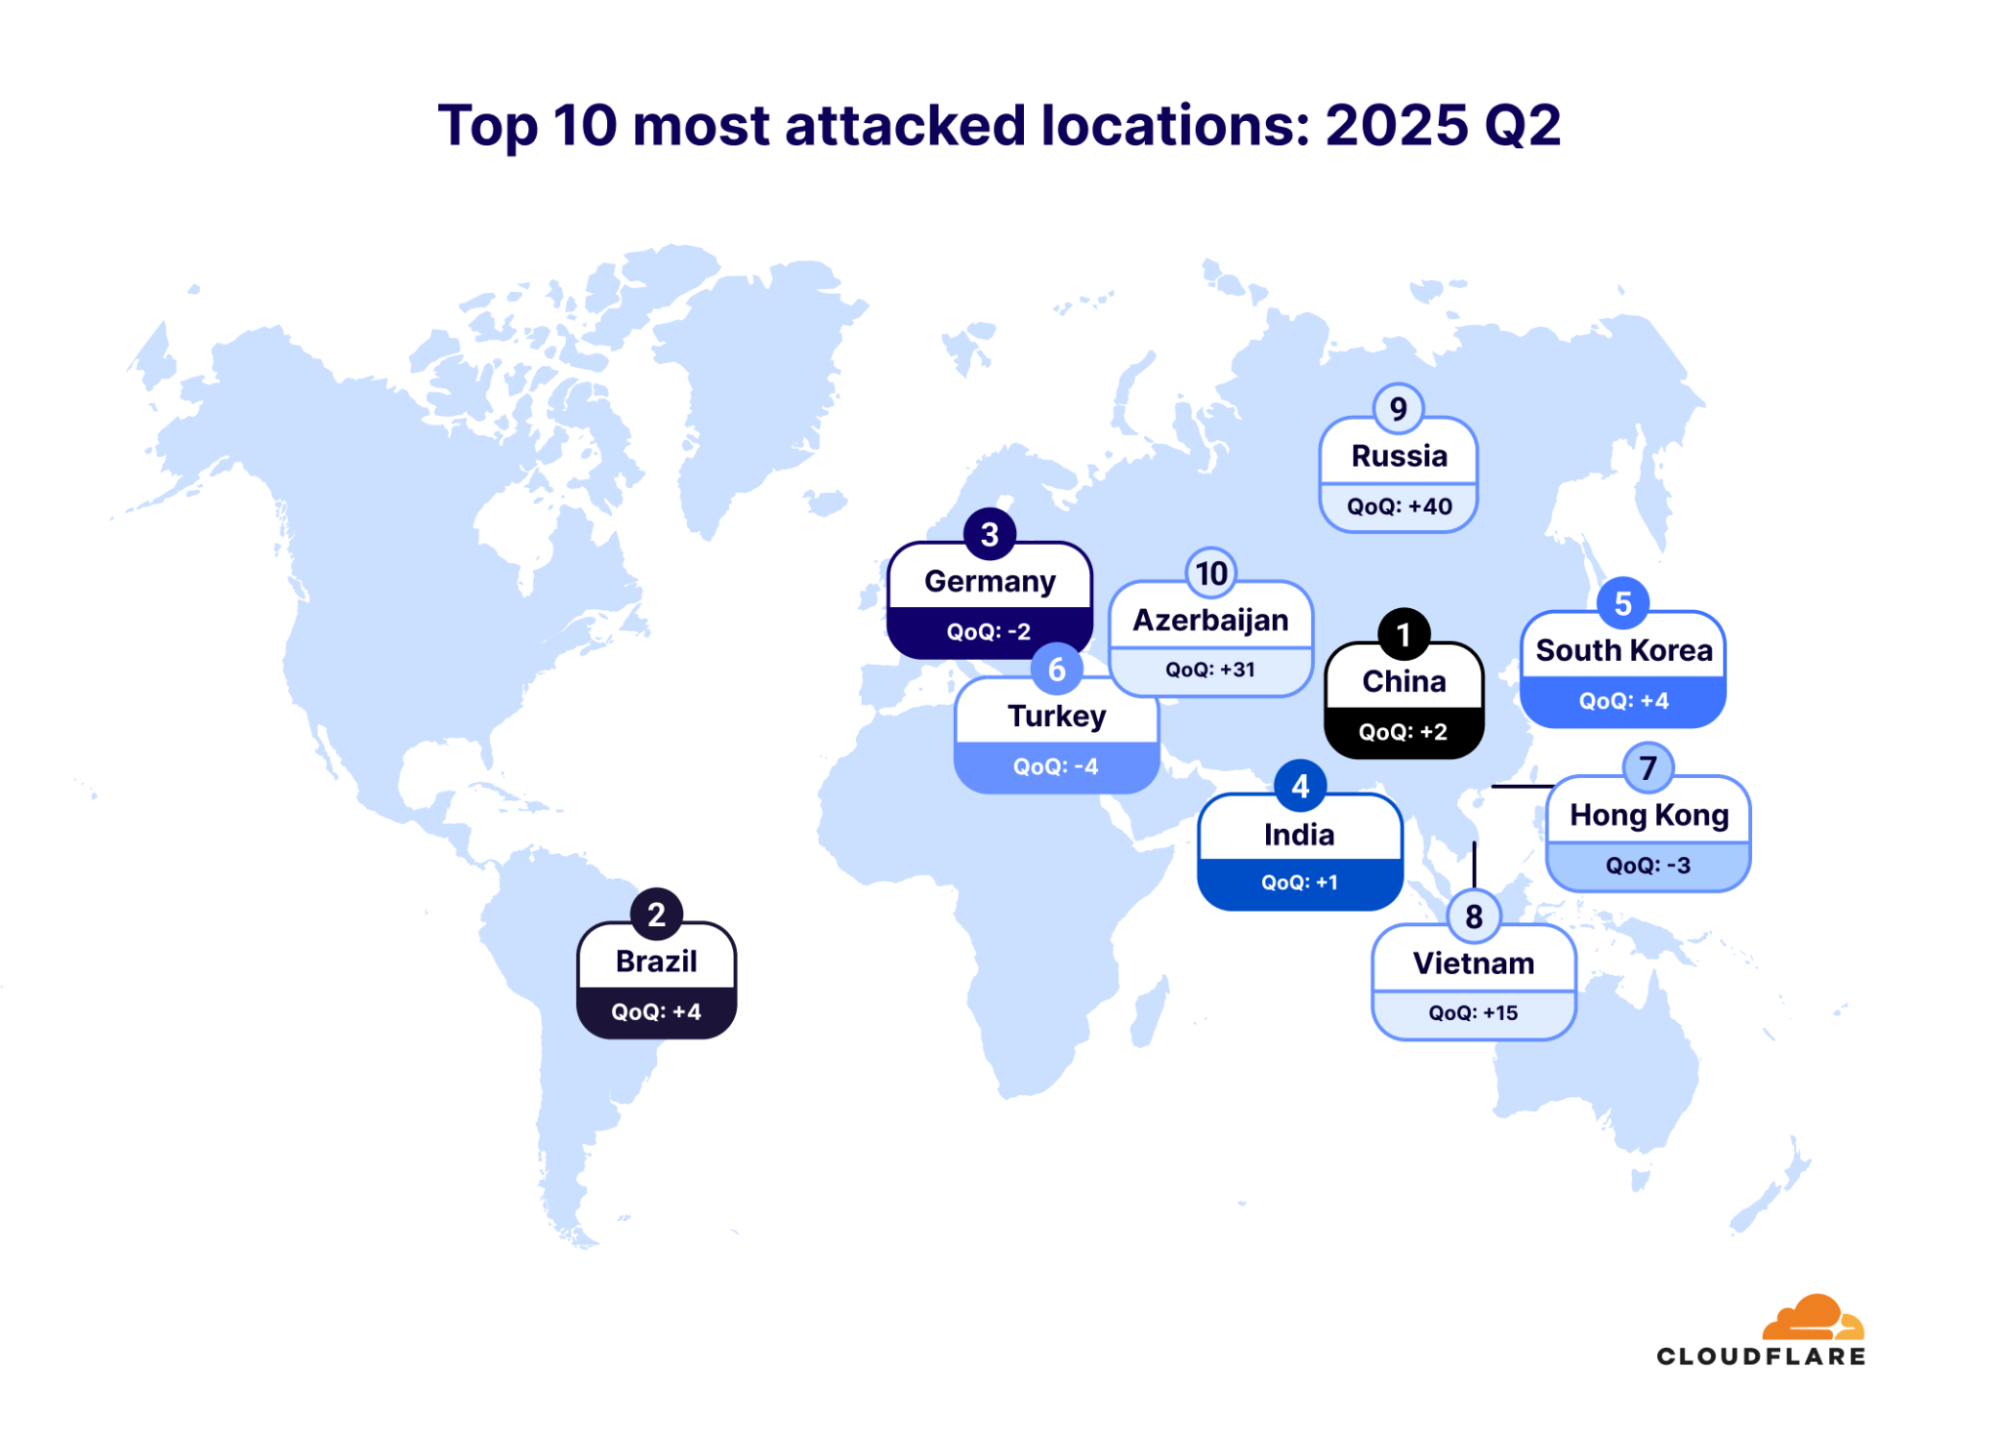
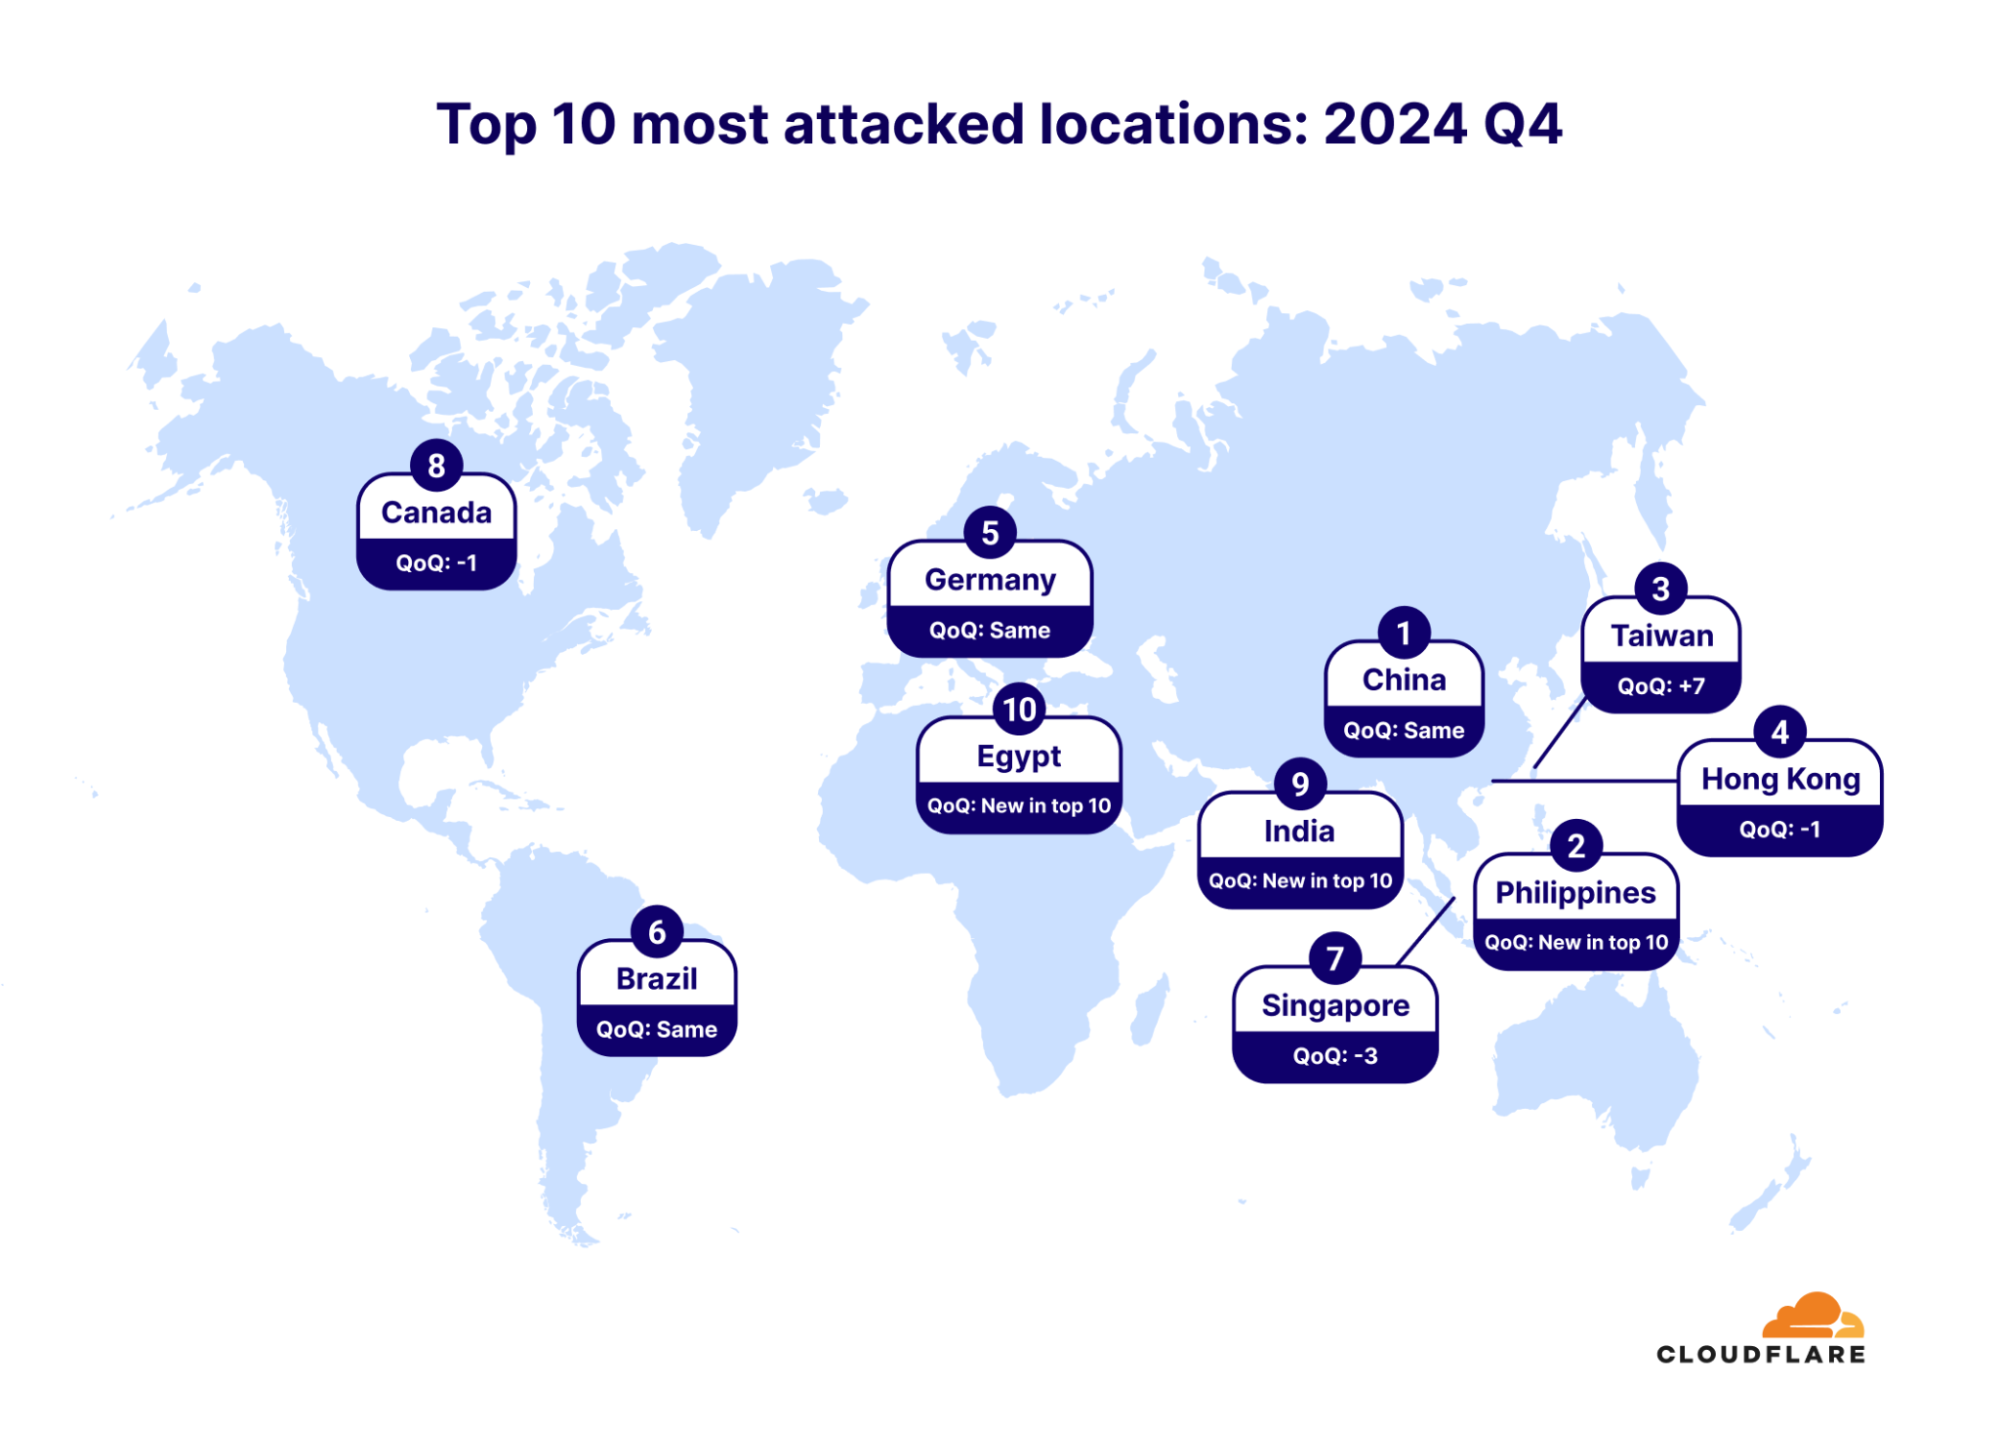
In the third quarter of 2025, China remained the most attacked, followed by Turkey in second, and Germany in third place. The most notable changes within this quarter was an increase in DDoS attacks against the United States, which leaped by 11 spots as the fifth most attacked country. The Philippines saw the largest increase within the top 10 – it jumped by 20 spots.

Network-layer DDoS attacks
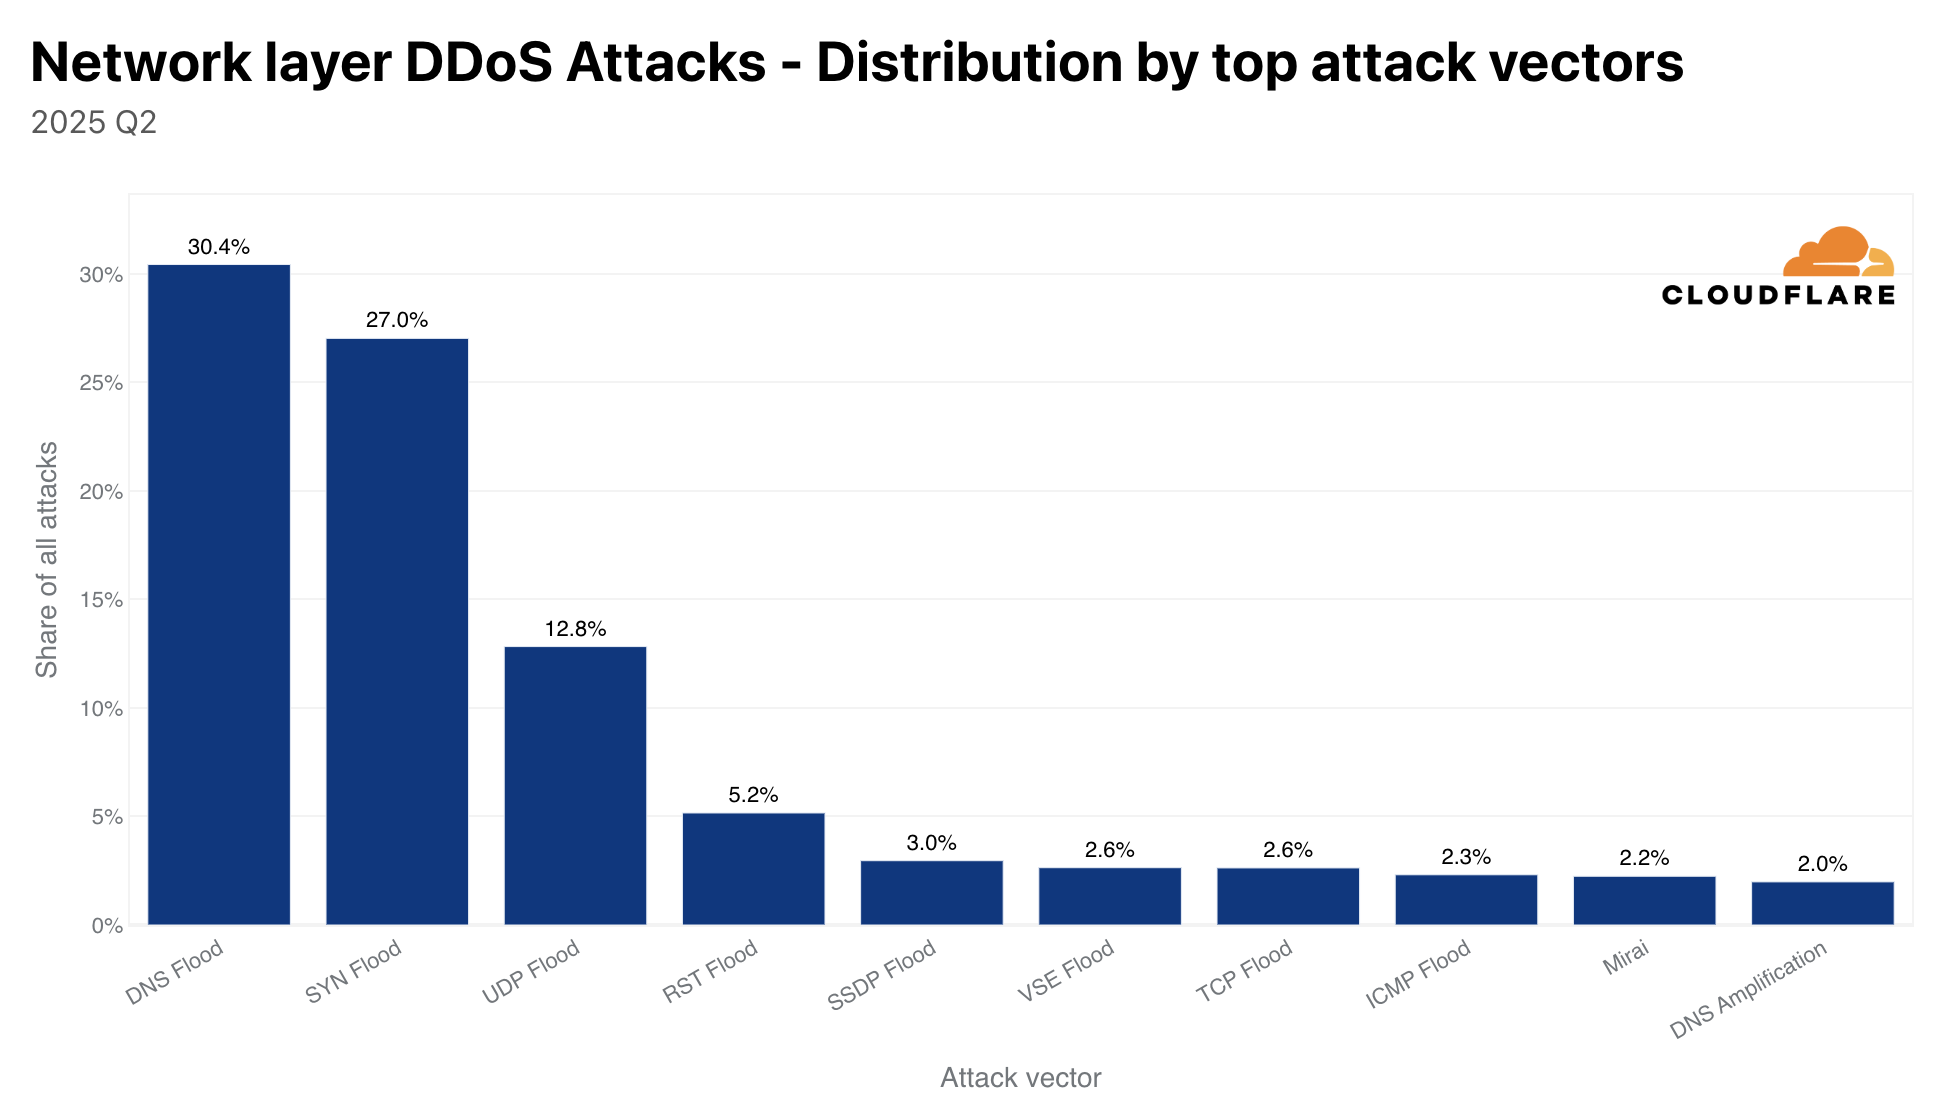
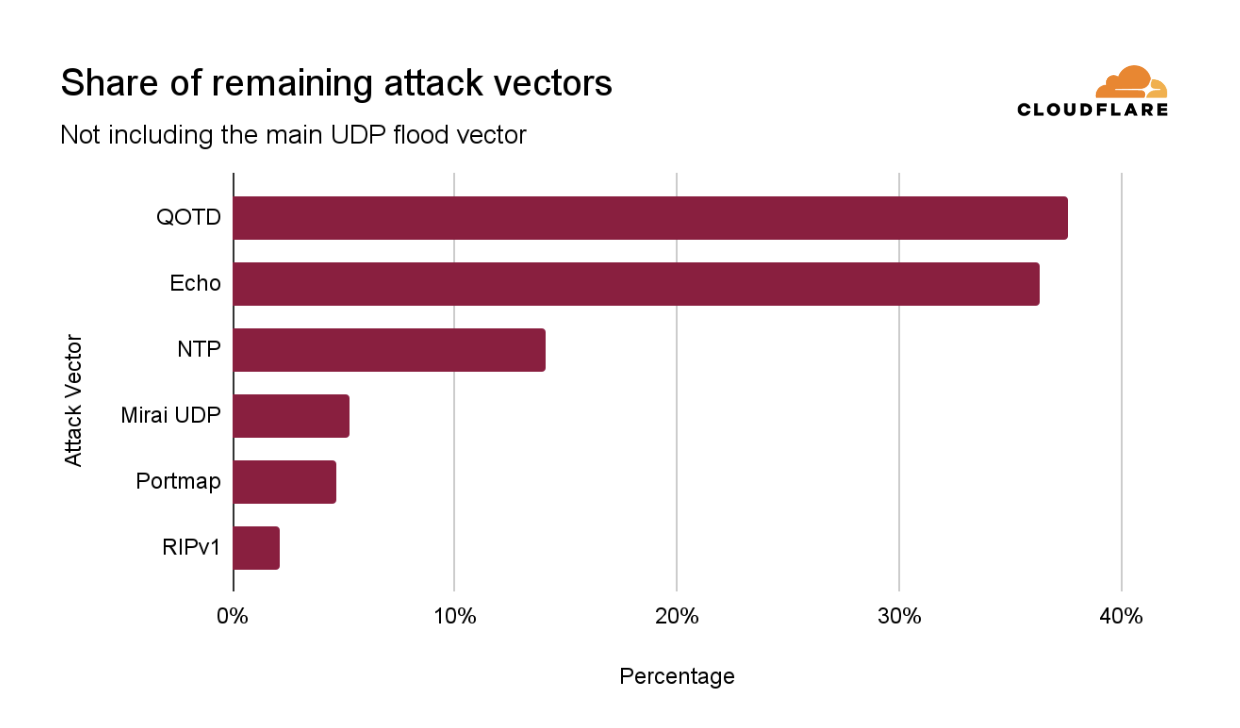
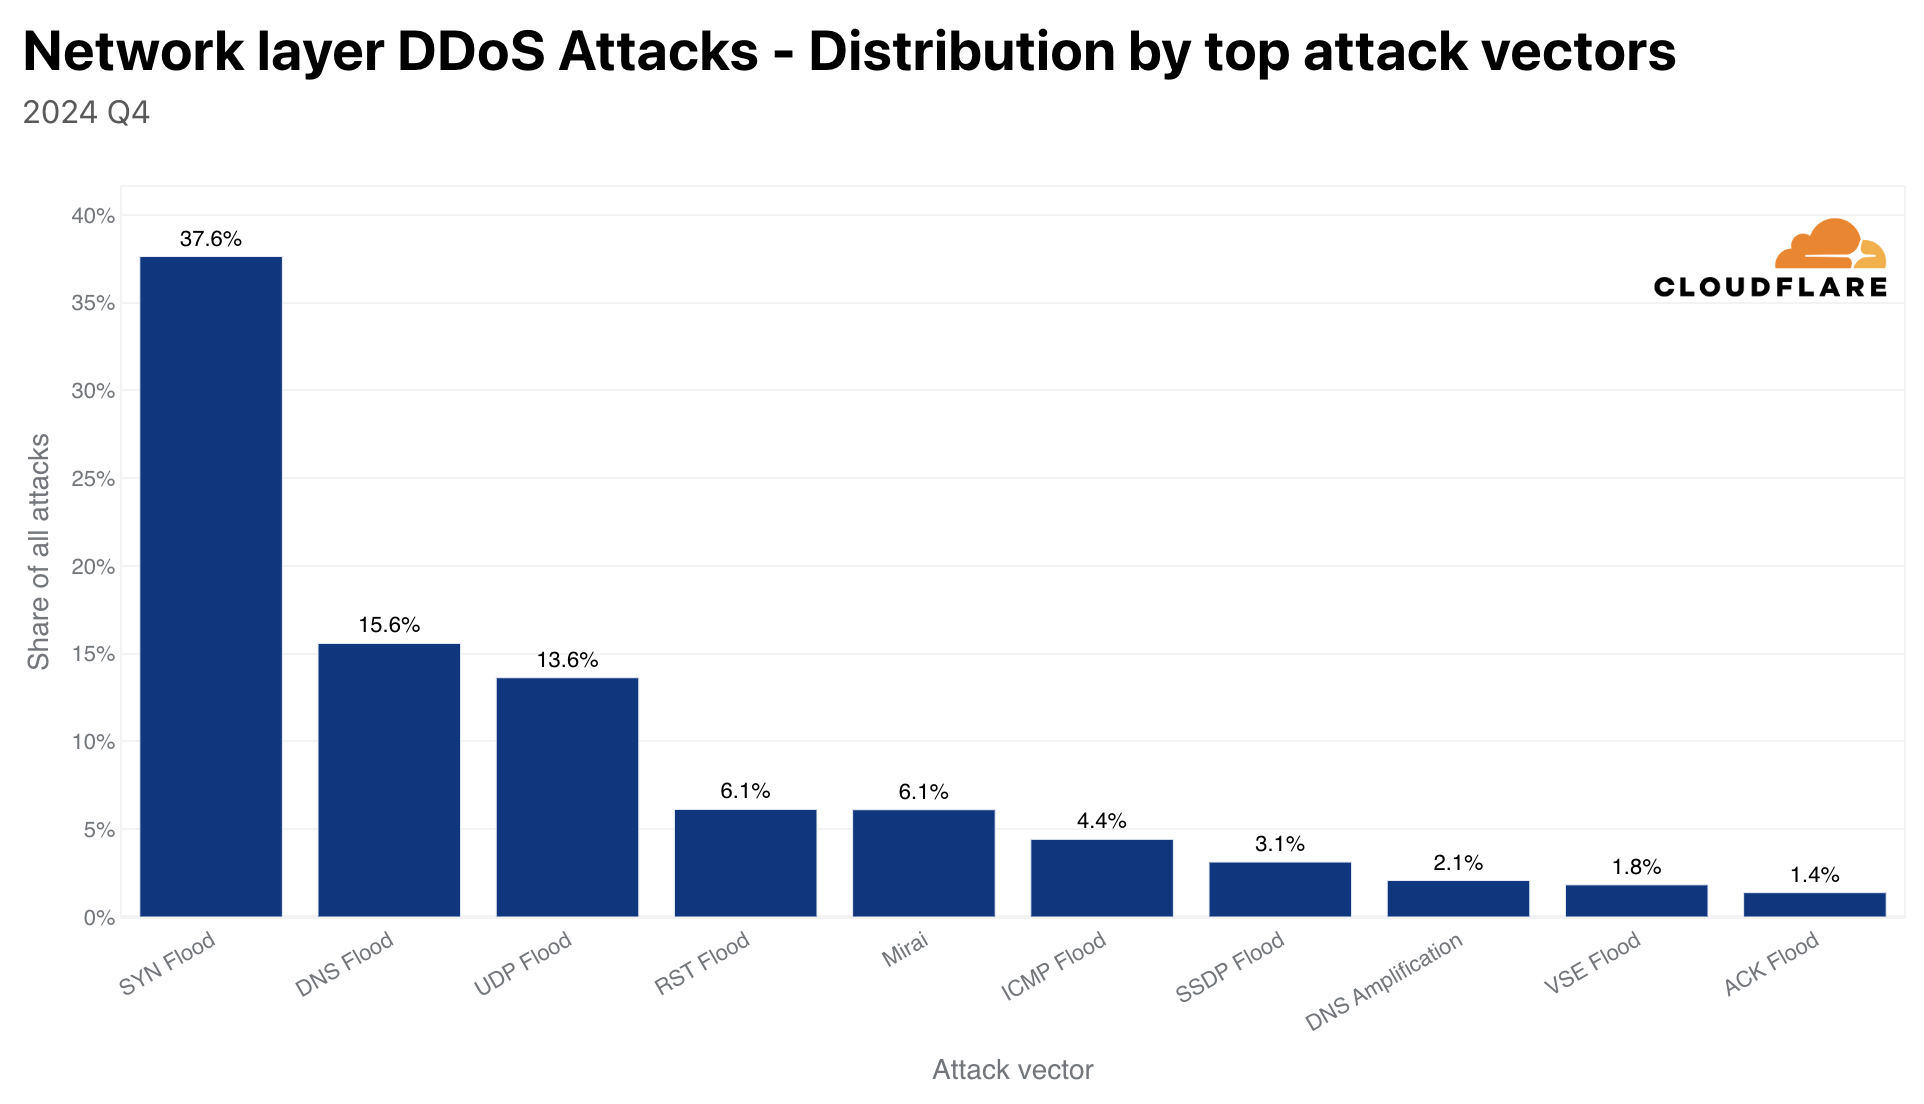
The amount of UDP DDoS attacks, partially fueled by Aisuru attacks, increased by 231% QoQ making it the top attack vector at the network-layer. DNS floods came in second place, SYN floods in third, and ICMP floods in fourth — accounting for just over half of all network-layer DDoS attacks.
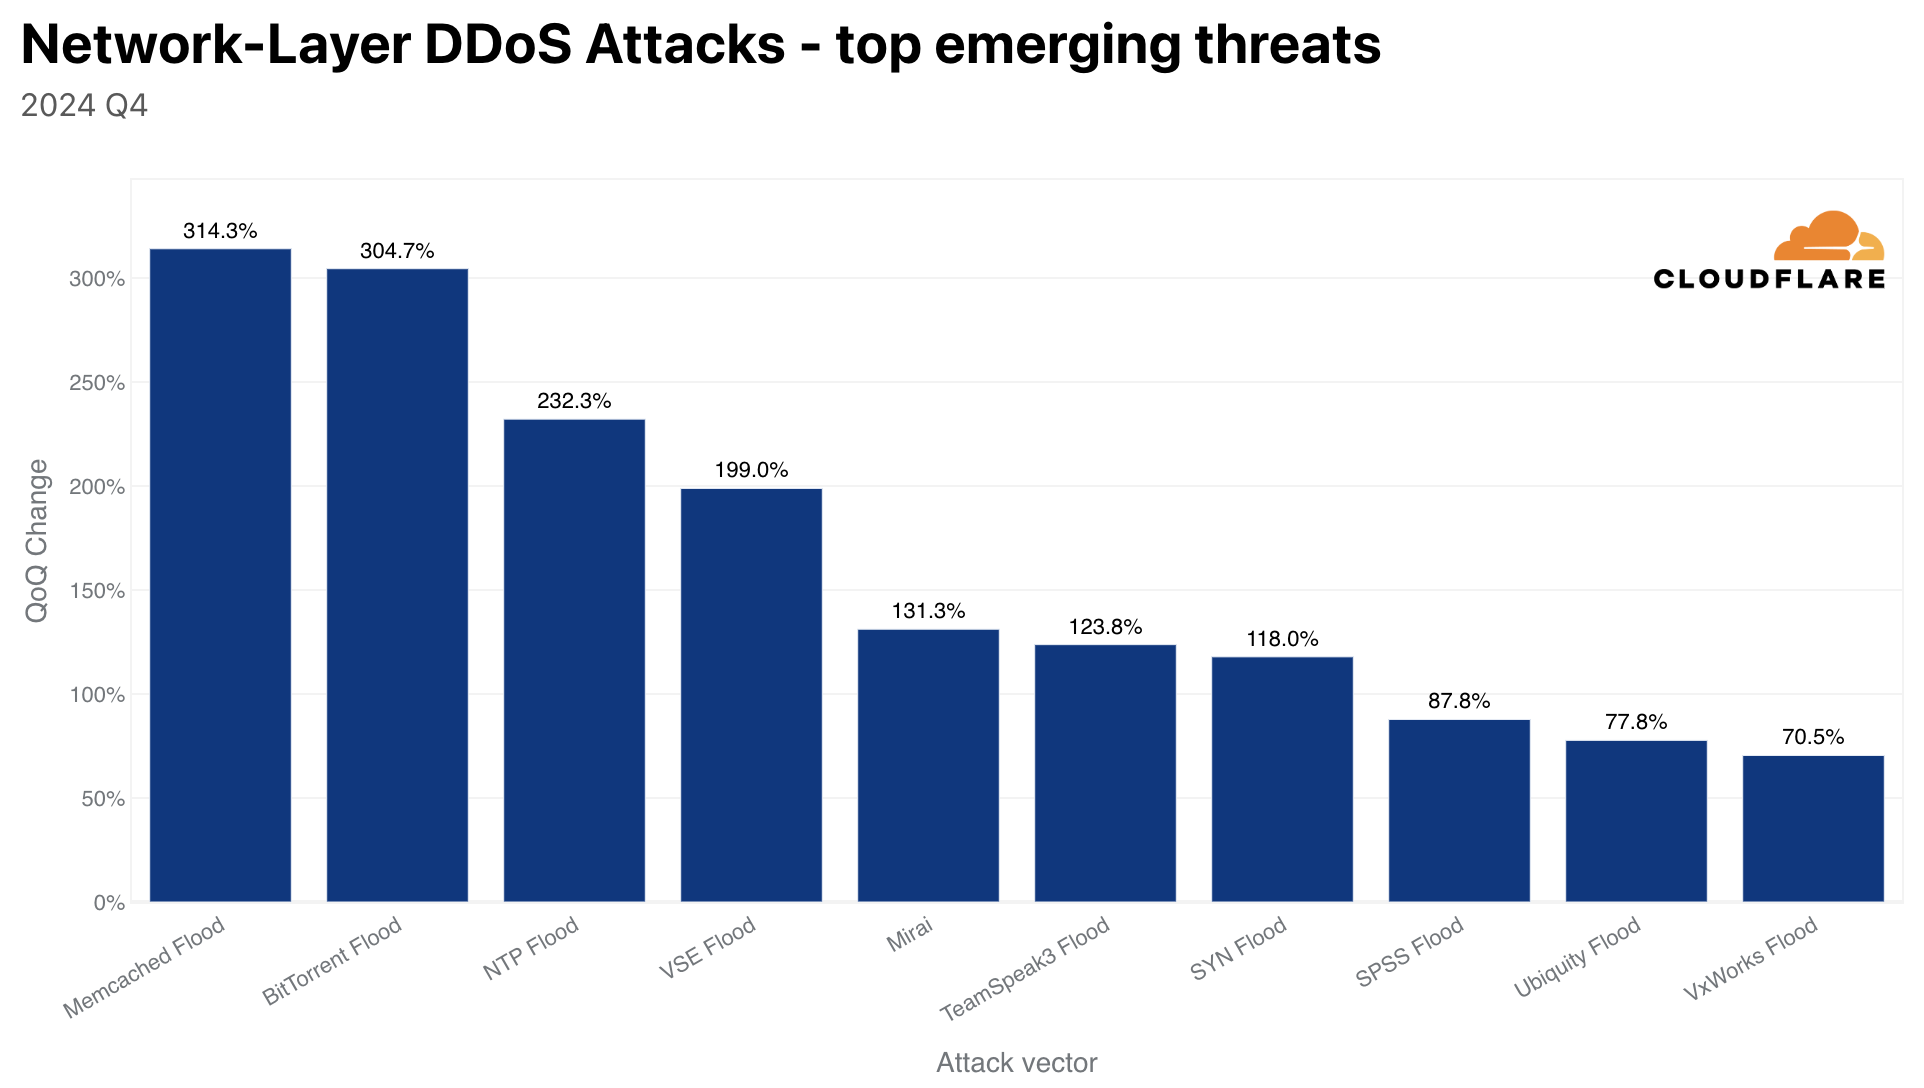
Although almost 10 years have passed since its first major debut, Mirai DDoS attacks are still quite common. Almost 2 out of every 100 network-layer DDoS attacks are launched by permutations of the Mirai botnet.

HTTP DDoS attacks
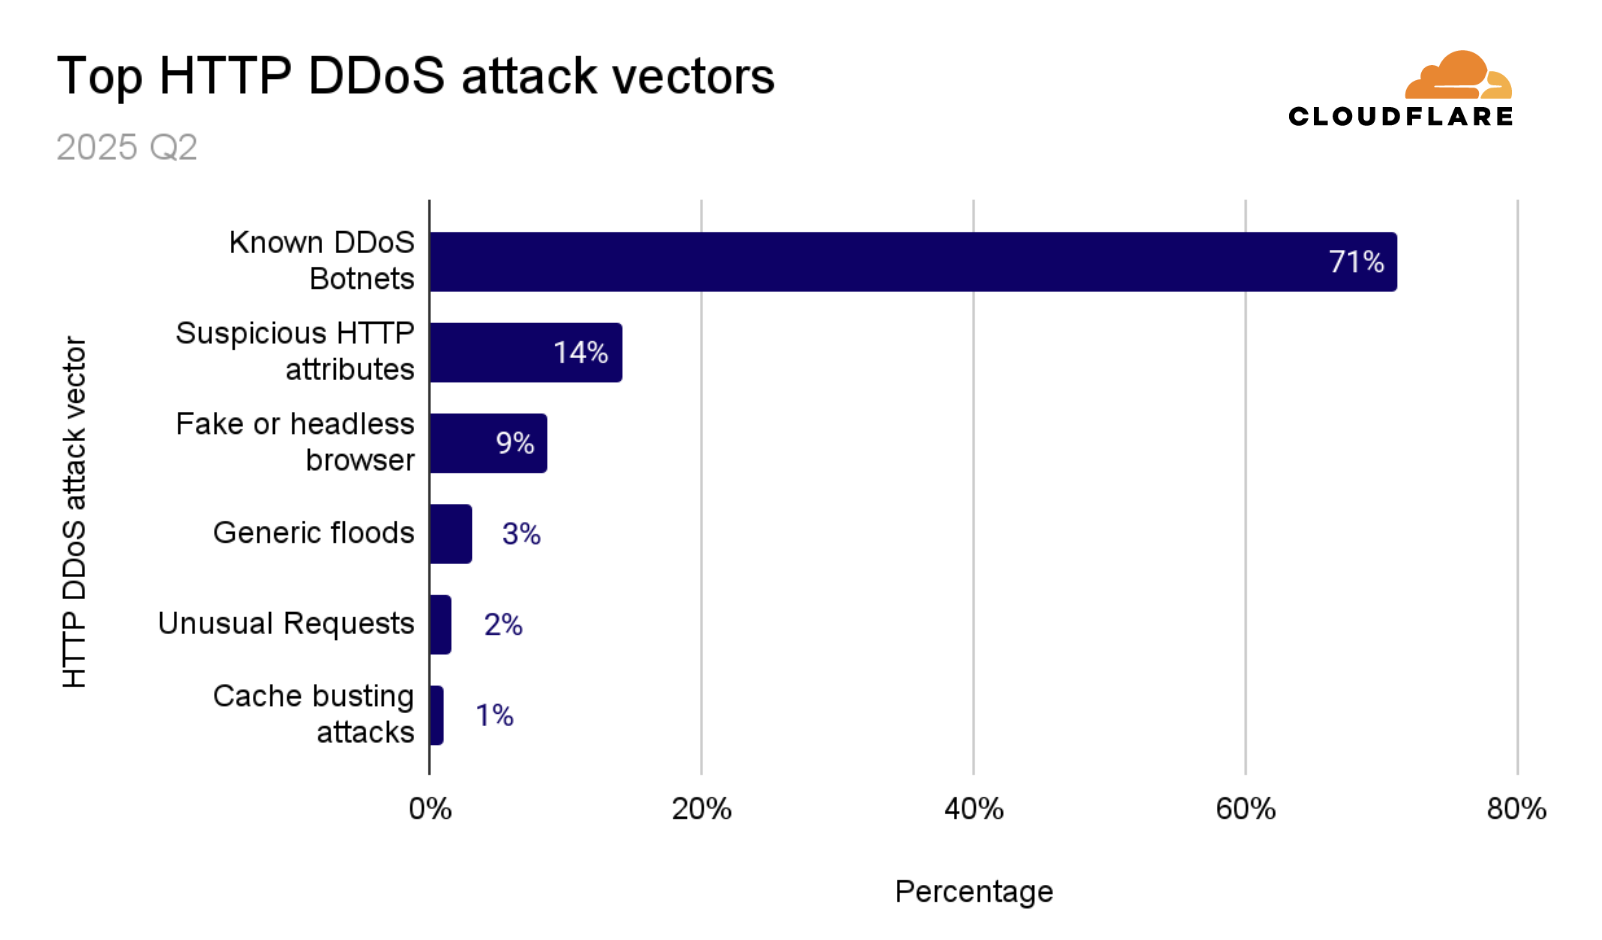
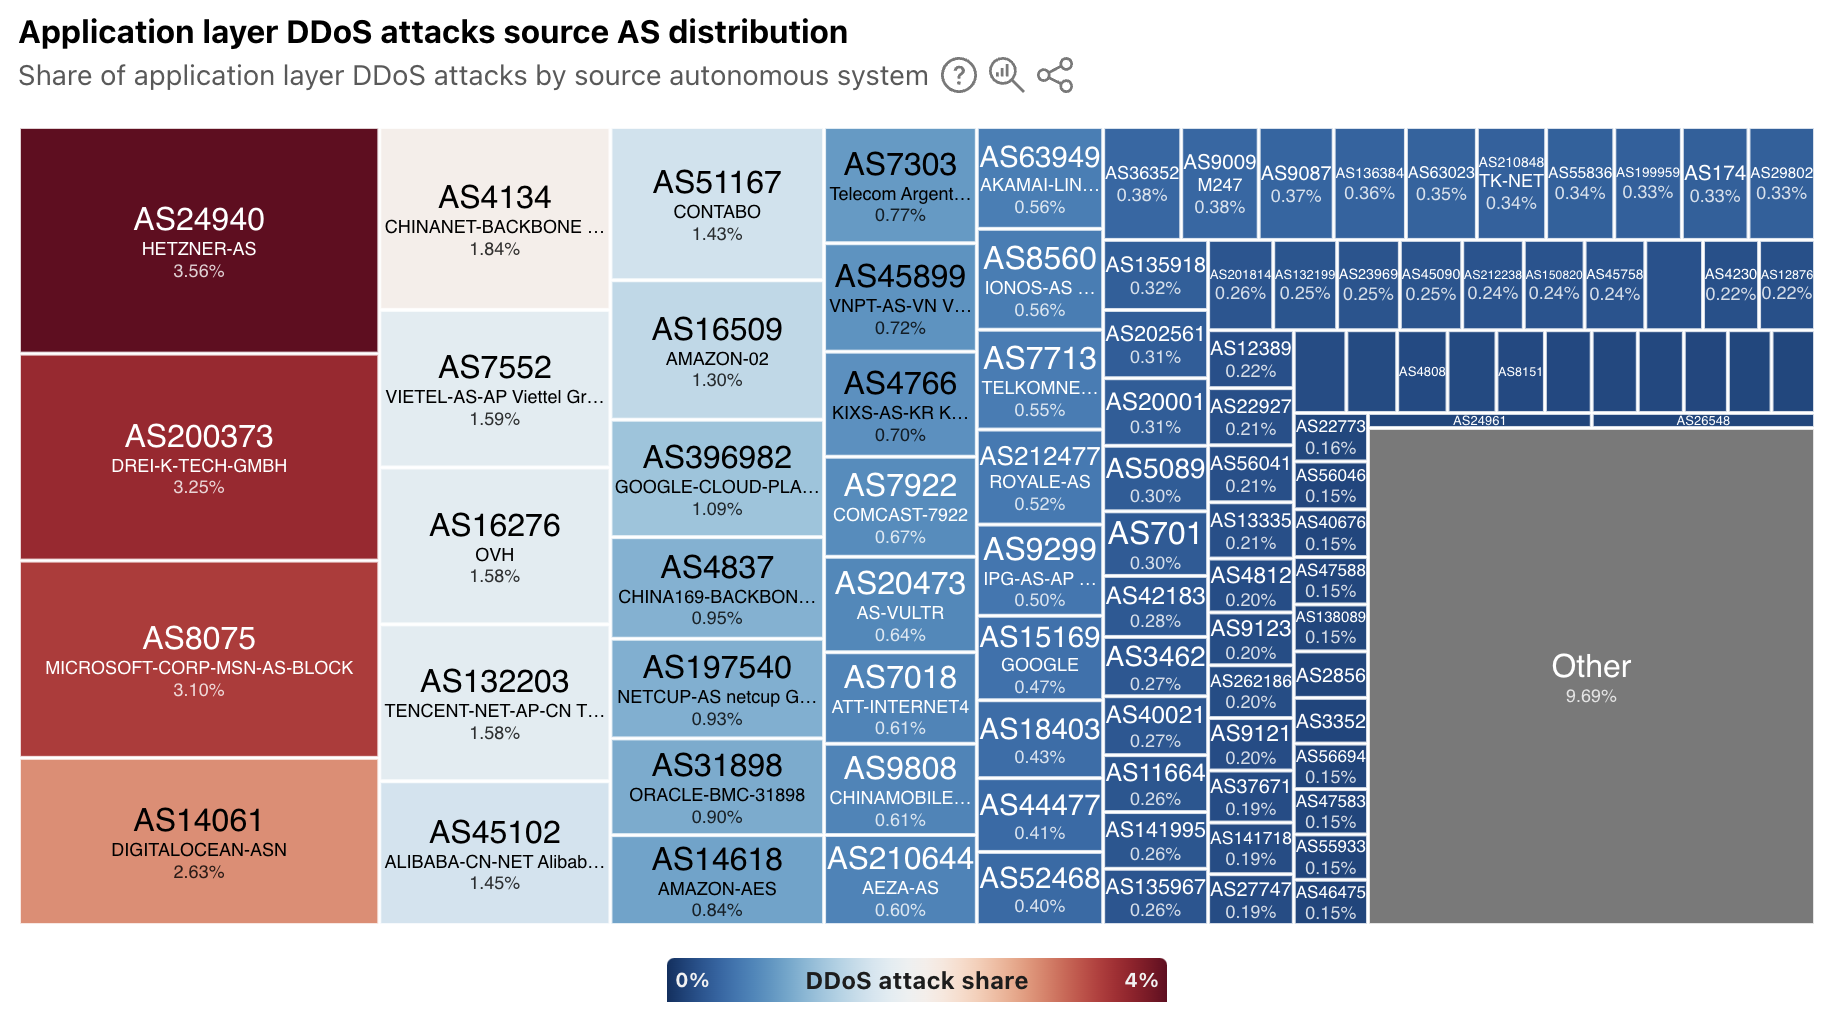
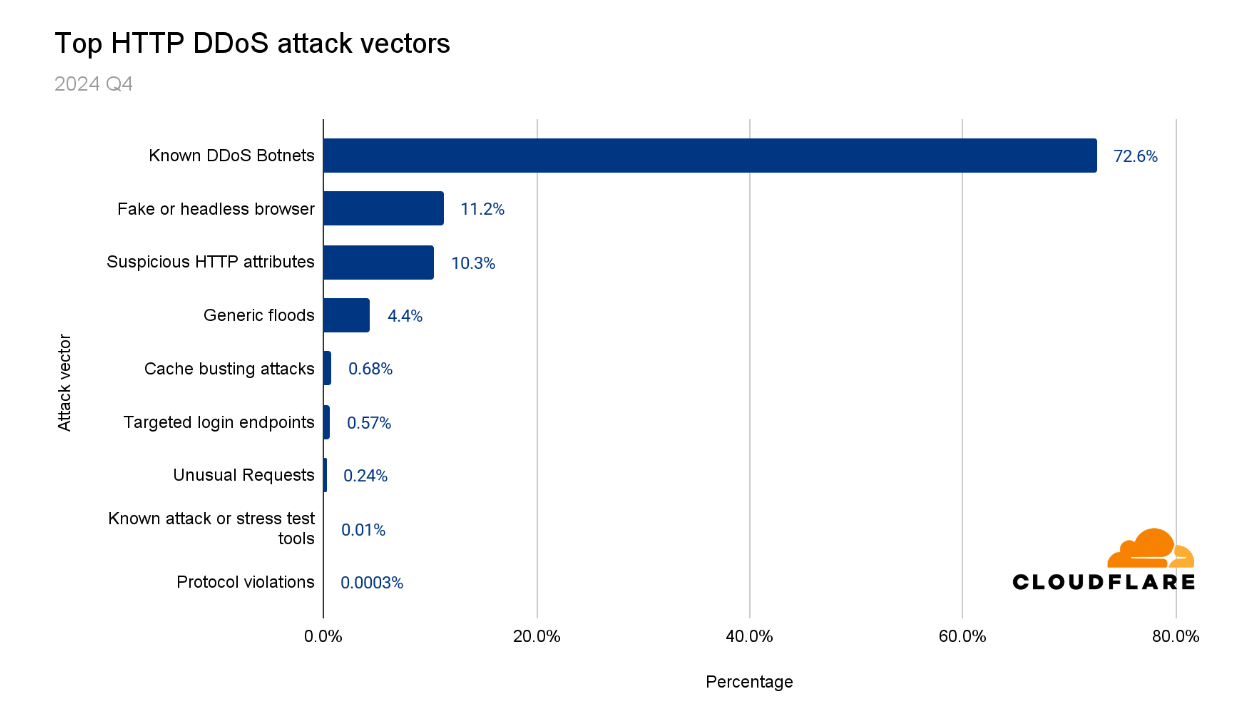
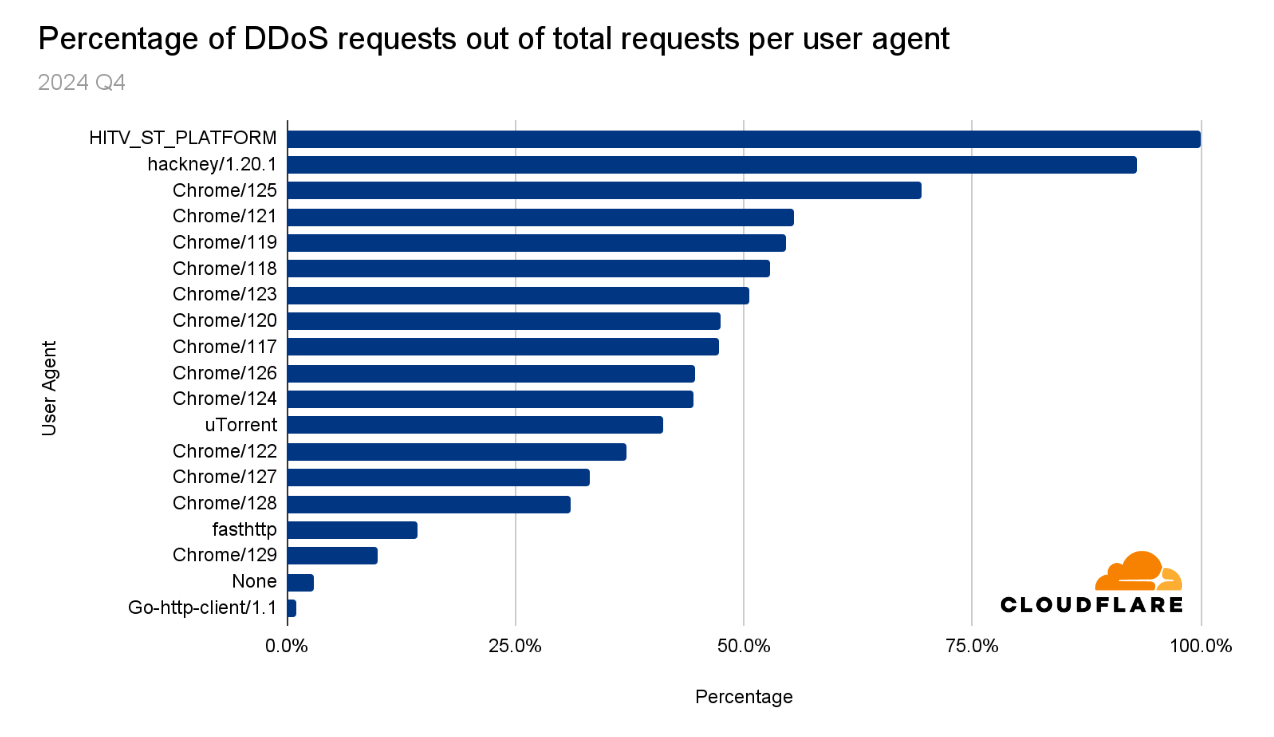
Nearly 70% of HTTP DDoS attacks originated from botnets already known to Cloudflare. This reflects one of the benefits that our customers gain from using Cloudflare. Once a botnet attacks one out of the millions of Cloudflare customers, everyone is automatically protected from that botnet.
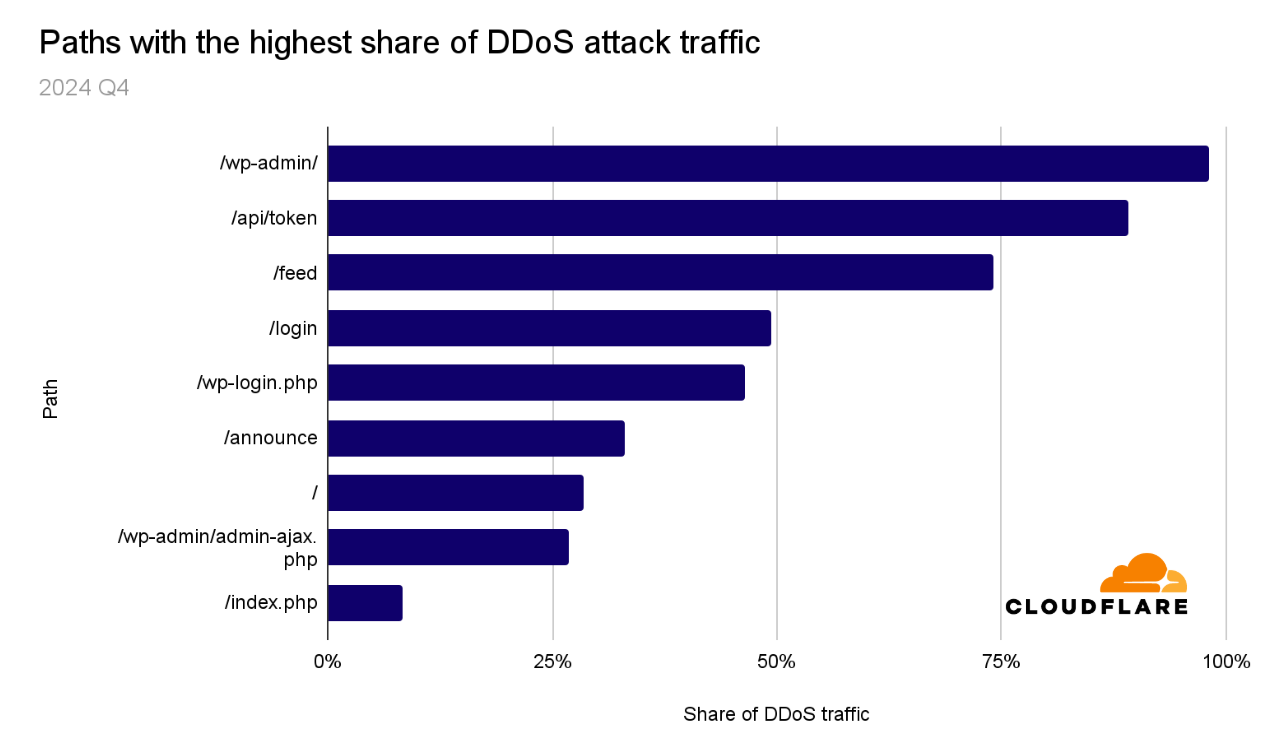
Another ~20% of HTTP DDoS attacks originated from fake or headless browsers, or included suspicious HTTP attributes. The remaining ~10% were a combination of generic floods, unusual requests, cache busting attacks, and attacks that targeted login endpoints.

We’ve entered an era where DDoS attacks have rapidly grown in sophistication and size — beyond anything we could’ve imagined a few years ago. Many organizations have faced challenges in keeping pace with this evolving threat landscape.
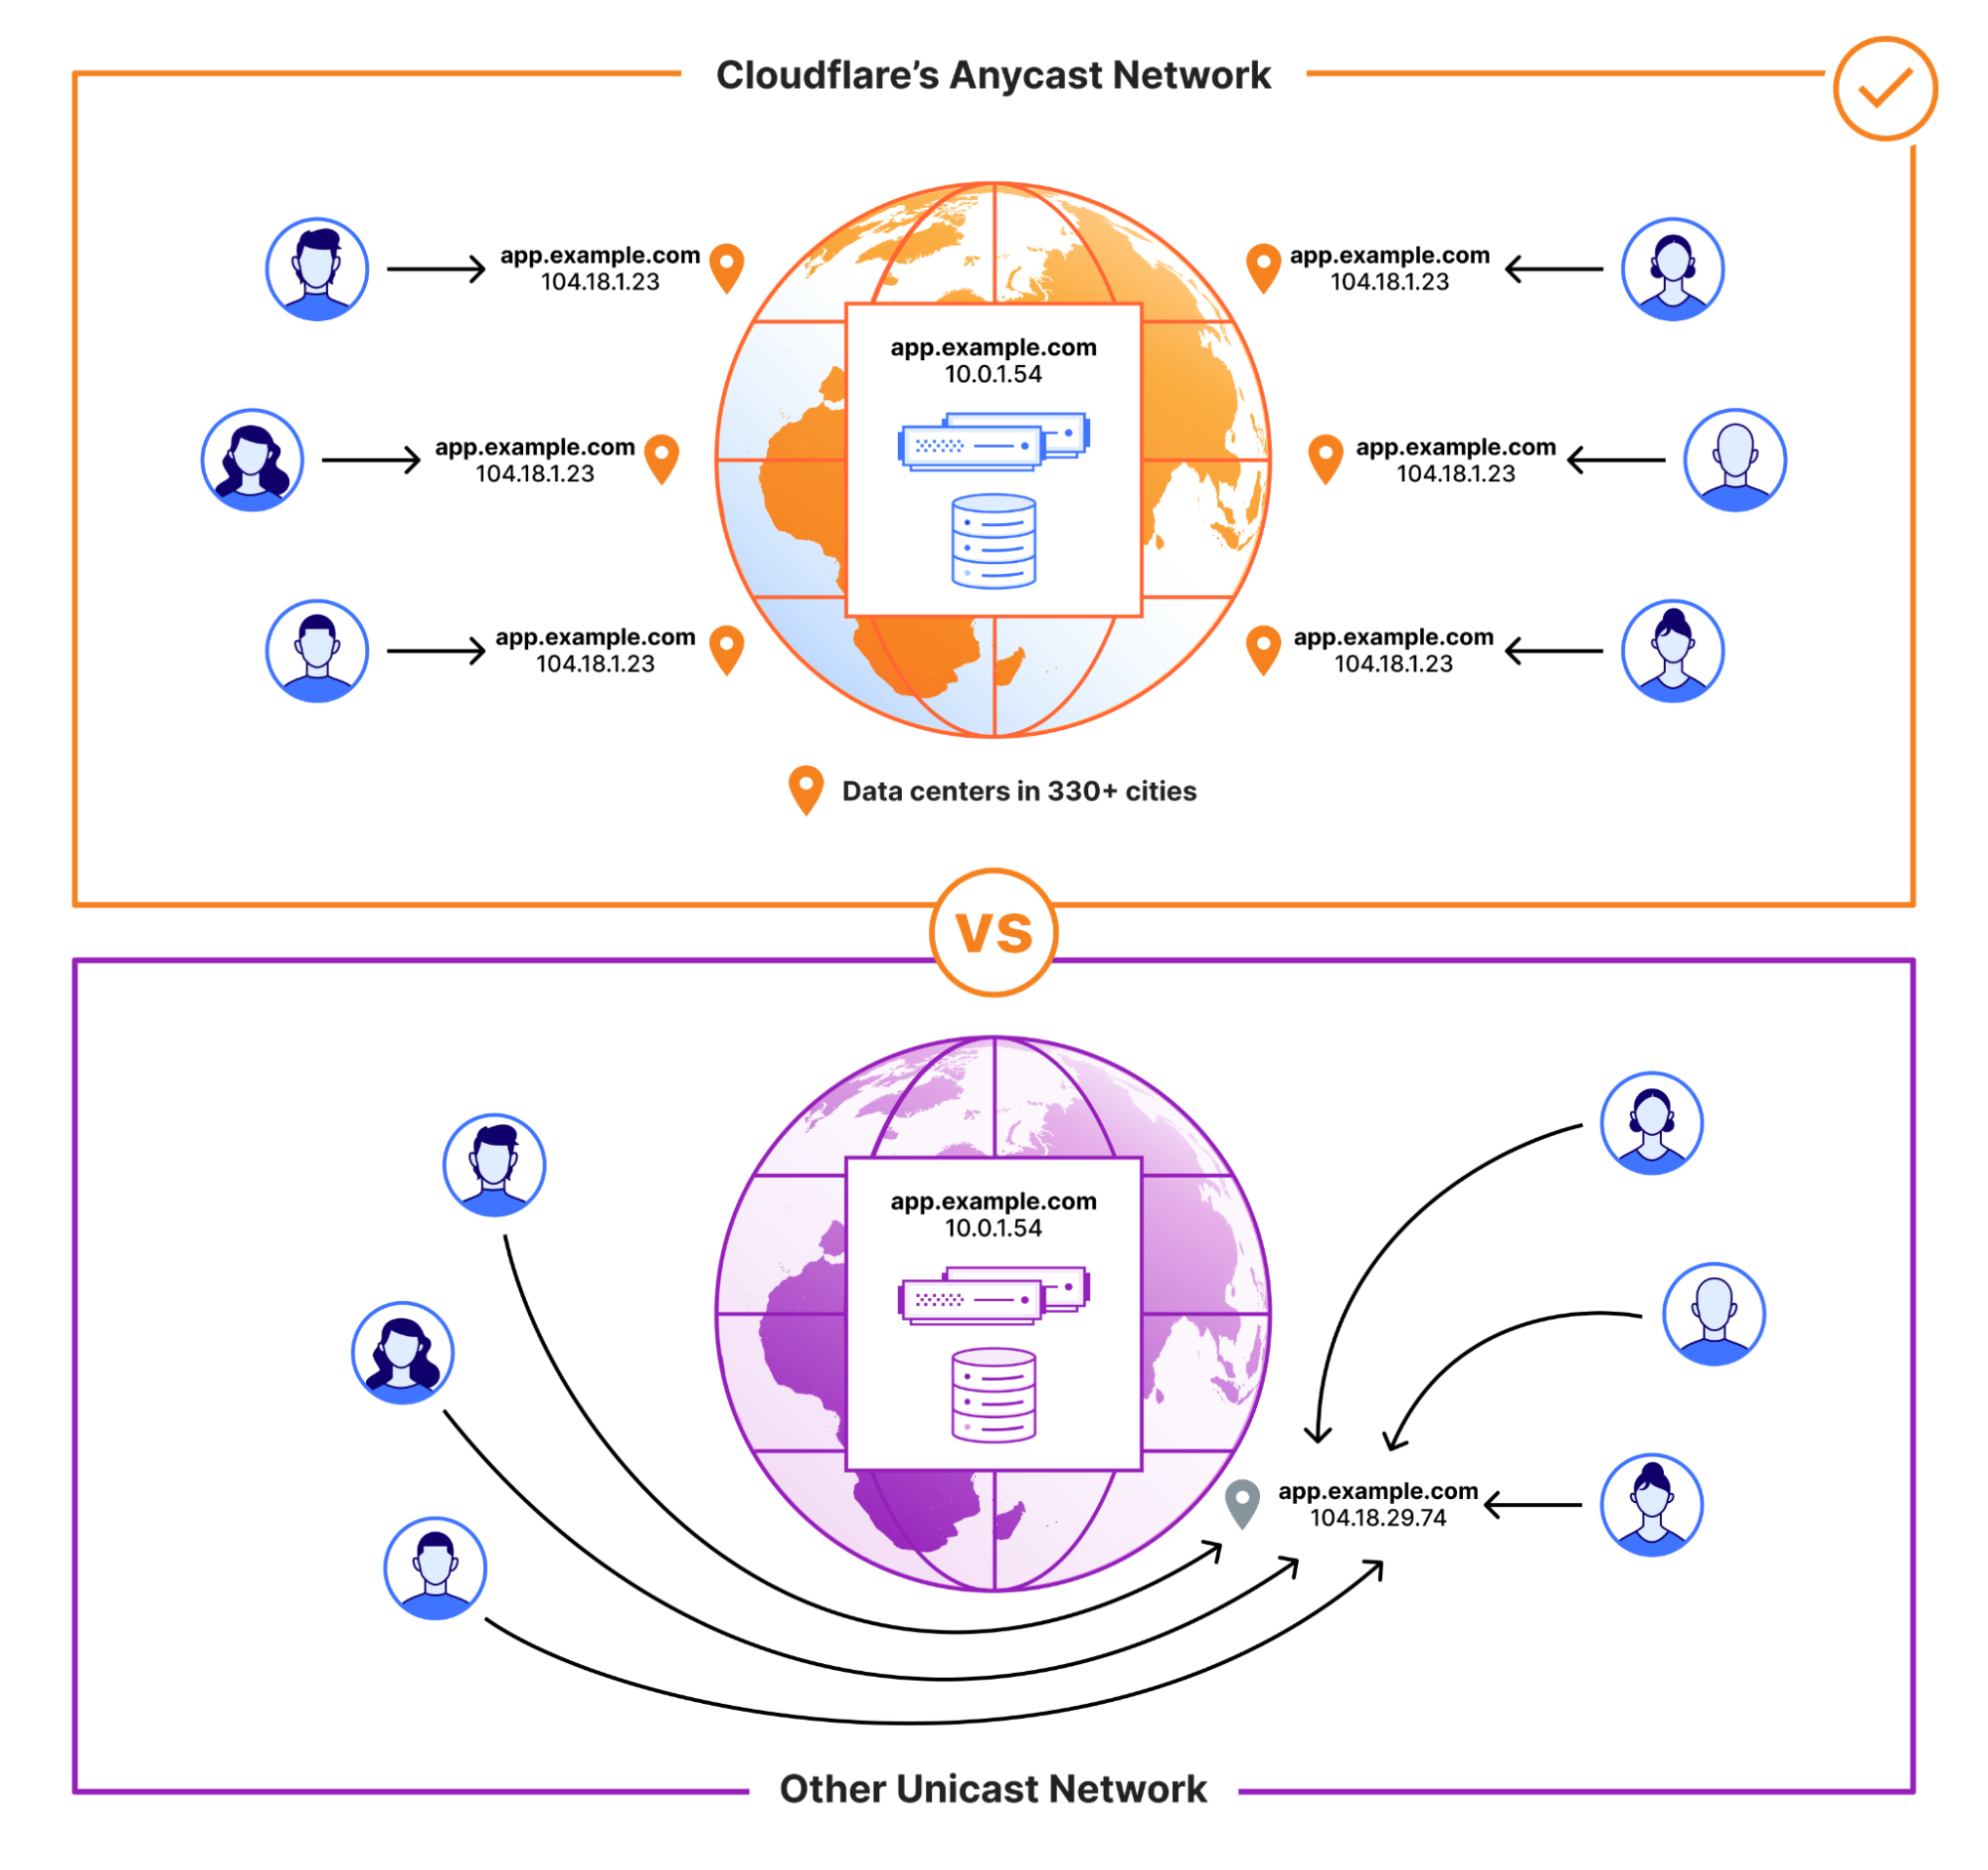
Organizations relying on on-premise mitigation appliances or on-demand scrubbing center solutions may benefit from reviewing their defense strategy given the current threat landscape.
Cloudflare, with its vast global network and autonomous DDoS mitigation systems, is committed to providing free unmetered DDoS protection to all customers, no matter the size, duration, or quantity of the DDoS attacks they face.


