Post Syndicated from Danilo Poccia original https://aws.amazon.com/blogs/aws/introducing-amazon-kinesis-data-analytics-studio-quickly-interact-with-streaming-data-using-sql-python-or-scala/
The best way to get timely insights and react quickly to new information you receive from your business and your applications is to analyze streaming data. This is data that must usually be processed sequentially and incrementally on a record-by-record basis or over sliding time windows, and can be used for a variety of analytics including correlations, aggregations, filtering, and sampling.
To make it easier to analyze streaming data, today we are pleased to introduce Amazon Kinesis Data Analytics Studio.
Now, from the Amazon Kinesis console you can select a Kinesis data stream and with a single click start a Kinesis Data Analytics Studio notebook powered by Apache Zeppelin and Apache Flink to interactively analyze data in the stream. Similarly, you can select a cluster in the Amazon Managed Streaming for Apache Kafka console to start a notebook to analyze data in Apache Kafka streams. You can also start a notebook from the Kinesis Data Analytics Studio console and connect to custom sources.

In the notebook, you can interact with streaming data and get results in seconds using SQL queries and Python or Scala programs. When you are satisfied with your results, with a few clicks you can promote your code to a production stream processing application that runs reliably at scale with no additional development effort.
For new projects, we recommend that you use the new Kinesis Data Analytics Studio over Kinesis Data Analytics for SQL Applications. Kinesis Data Analytics Studio combines ease of use with advanced analytical capabilities, which makes it possible to build sophisticated stream processing applications in minutes. Let’s see how that works in practice.
Using Kinesis Data Analytics Studio to Analyze Streaming Data
I want to get a better understanding of the data sent by some sensors to a Kinesis data stream.
To simulate the workload, I use this random_data_generator.py Python script. You don’t need to know Python to use Kinesis Data Analytics Studio. In fact, I am going to use SQL in the following steps. Also, you can avoid any coding and use the Amazon Kinesis Data Generator user interface (UI) to send test data to Kinesis Data Streams or Kinesis Data Firehose. I am using a Python script to have finer control over the data that is being sent.
import datetime
import json
import random
import boto3

STREAM_NAME = "my-input-stream"


def get_random_data():
    current_temperature = round(10 + random.random() * 170, 2)
    if current_temperature > 160:
        status = "ERROR"
    elif current_temperature > 140 or random.randrange(1, 100) > 80:
        status = random.choice(["WARNING","ERROR"])
    else:
        status = "OK"
    return {
        'sensor_id': random.randrange(1, 100),
        'current_temperature': current_temperature,
        'status': status,
        'event_time': datetime.datetime.now().isoformat()
    }


def send_data(stream_name, kinesis_client):
    while True:
        data = get_random_data()
        partition_key = str(data["sensor_id"])
        print(data)
        kinesis_client.put_record(
            StreamName=stream_name,
            Data=json.dumps(data),
            PartitionKey=partition_key)


if __name__ == '__main__':
    kinesis_client = boto3.client('kinesis')
    send_data(STREAM_NAME, kinesis_client)
This script sends random records to my Kinesis data stream using JSON syntax. For example:
From the Kinesis console, I select a Kinesis data stream (my-input-stream) and choose Process data in real time from the Process drop-down. In this way, the stream is configured as a source for the notebook.

Then, in the following dialog box, I create an Apache Flink – Studio notebook.
I enter a name (my-notebook) and a description for the notebook. The AWS Identity and Access Management (IAM) permissions to read from the Kinesis data stream I selected earlier (my-input-stream) are automatically attached to the IAM role assumed by the notebook.

I choose Create to open the AWS Glue console and create an empty database. Back in the Kinesis Data Analytics Studio console, I refresh the list and select the new database. It will define the metadata for my sources and destinations. From here, I can also review the default Studio notebook settings. Then, I choose Create Studio notebook.

Now that the notebook has been created, I choose Run.
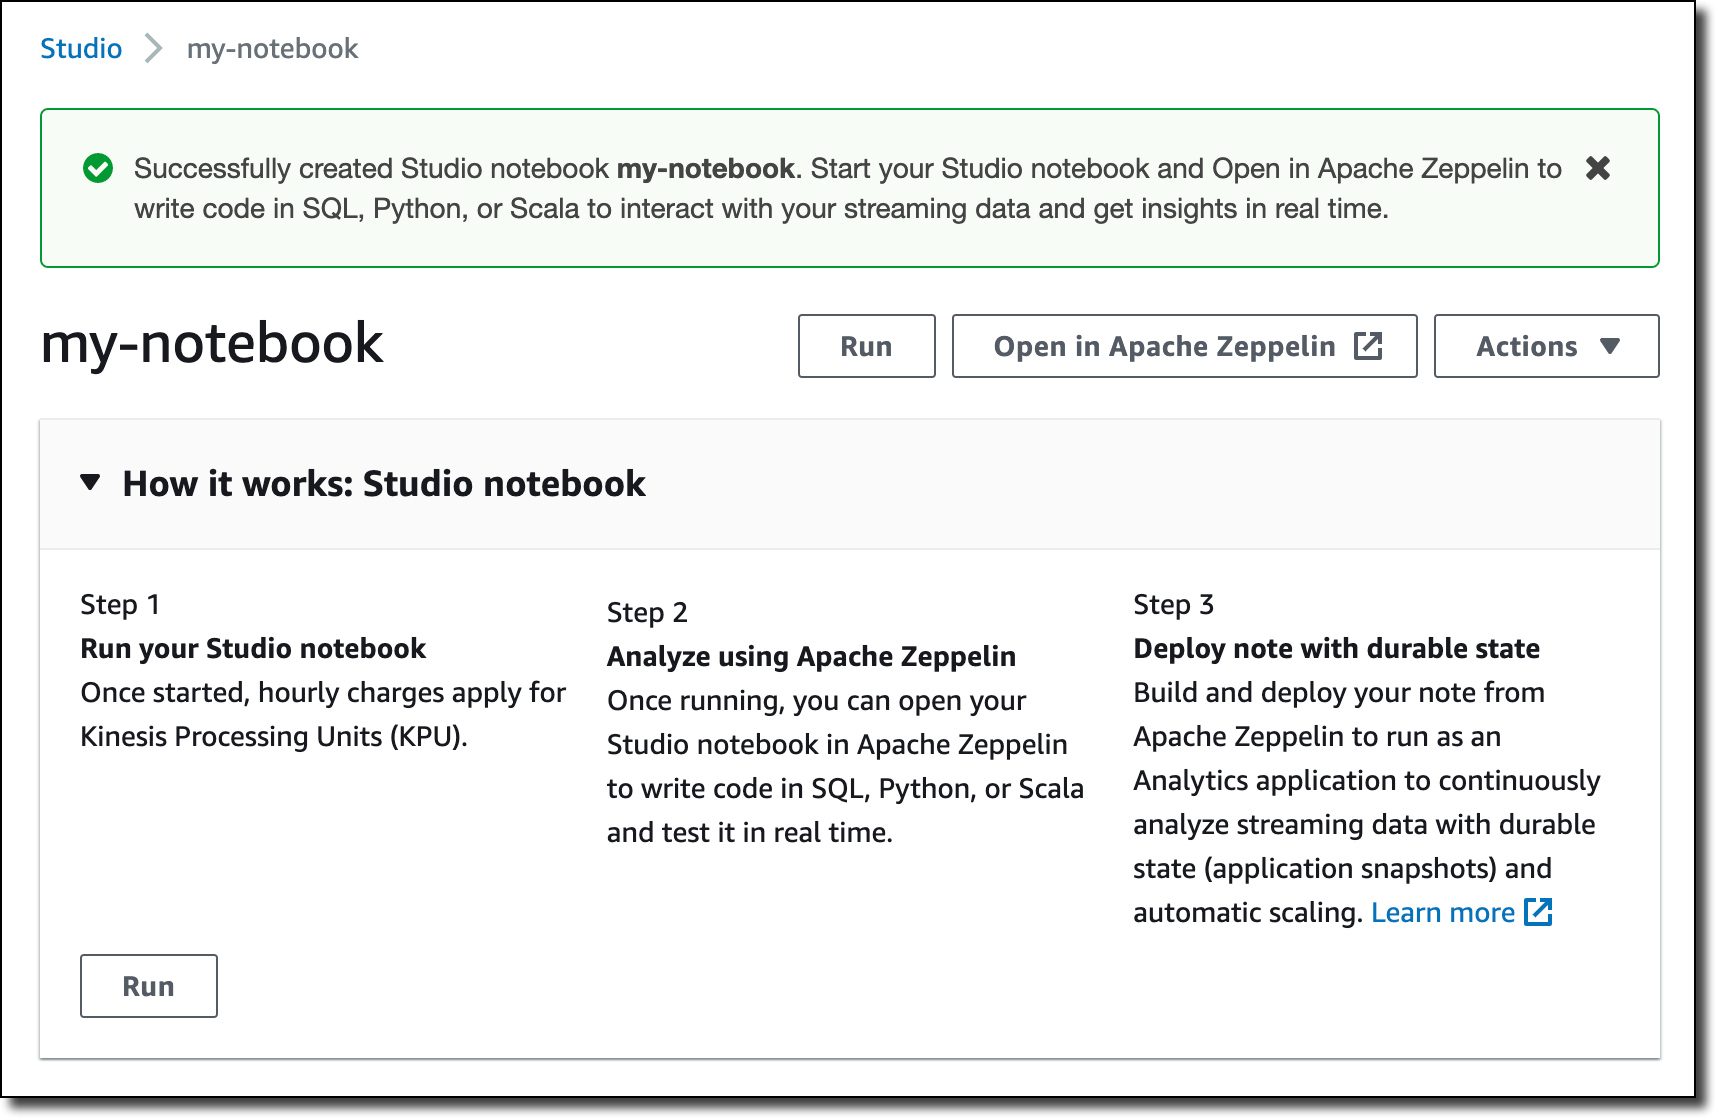
When the notebook is running, I choose Open in Apache Zeppelin to get access to the notebook and write code in SQL, Python, or Scala to interact with my streaming data and get insights in real time.
In the notebook, I create a new note and call it Sensors. Then, I create a sensor_data table describing the format of the data in the stream:
%flink.ssql

CREATE TABLE sensor_data (
    sensor_id INTEGER,
    current_temperature DOUBLE,
    status VARCHAR(6),
    event_time TIMESTAMP(3),
    WATERMARK FOR event_time AS event_time - INTERVAL '5' SECOND
)
PARTITIONED BY (sensor_id)
WITH (
    'connector' = 'kinesis',
    'stream' = 'my-input-stream',
    'aws.region' = 'us-east-1',
    'scan.stream.initpos' = 'LATEST',
    'format' = 'json',
    'json.timestamp-format.standard' = 'ISO-8601'
)
The first line in the previous command tells to Apache Zeppelin to provide a stream SQL environment (%flink.ssql) for the Apache Flink interpreter. I can also interact with the streaming data using a batch SQL environment (%flink.bsql), or Python (%flink.pyflink) or Scala (%flink) code.
The first part of the CREATE TABLE statement is familiar to anyone who has used SQL with a database. A table is created to store the sensor data in the stream. The WATERMARK option is used to measure progress in the event time, as described in the Event Time and Watermarks section of the Apache Flink documentation.
The second part of the CREATE TABLE statement describes the connector used to receive data in the table (for example, kinesis or kafka), the name of the stream, the AWS Region, the overall data format of the stream (such as json or csv), and the syntax used for timestamps (in this case, ISO 8601). I can also choose the starting position to process the stream, I am using LATEST to read the most recent data first.
When the table is ready, I find it in the AWS Glue Data Catalog database I selected when I created the notebook:

Now I can run SQL queries on the sensor_data table and use sliding or tumbling windows to get a better understanding of what is happening with my sensors.
For an overview of the data in the stream, I start with a simple SELECT to get all the content of the sensor_data table:
%flink.ssql(type=update)

SELECT * FROM sensor_data;
This time the first line of the command has a parameter (type=update) so that the output of the SELECT, which is more than one row, is continuously updated when new data arrives.
On the terminal of my laptop, I start the random_data_generator.py script:
At first I see a table that contains the data as it comes. To get a better understanding, I select a bar graph view. Then, I group the results by status to see their average current_temperature, as shown here:
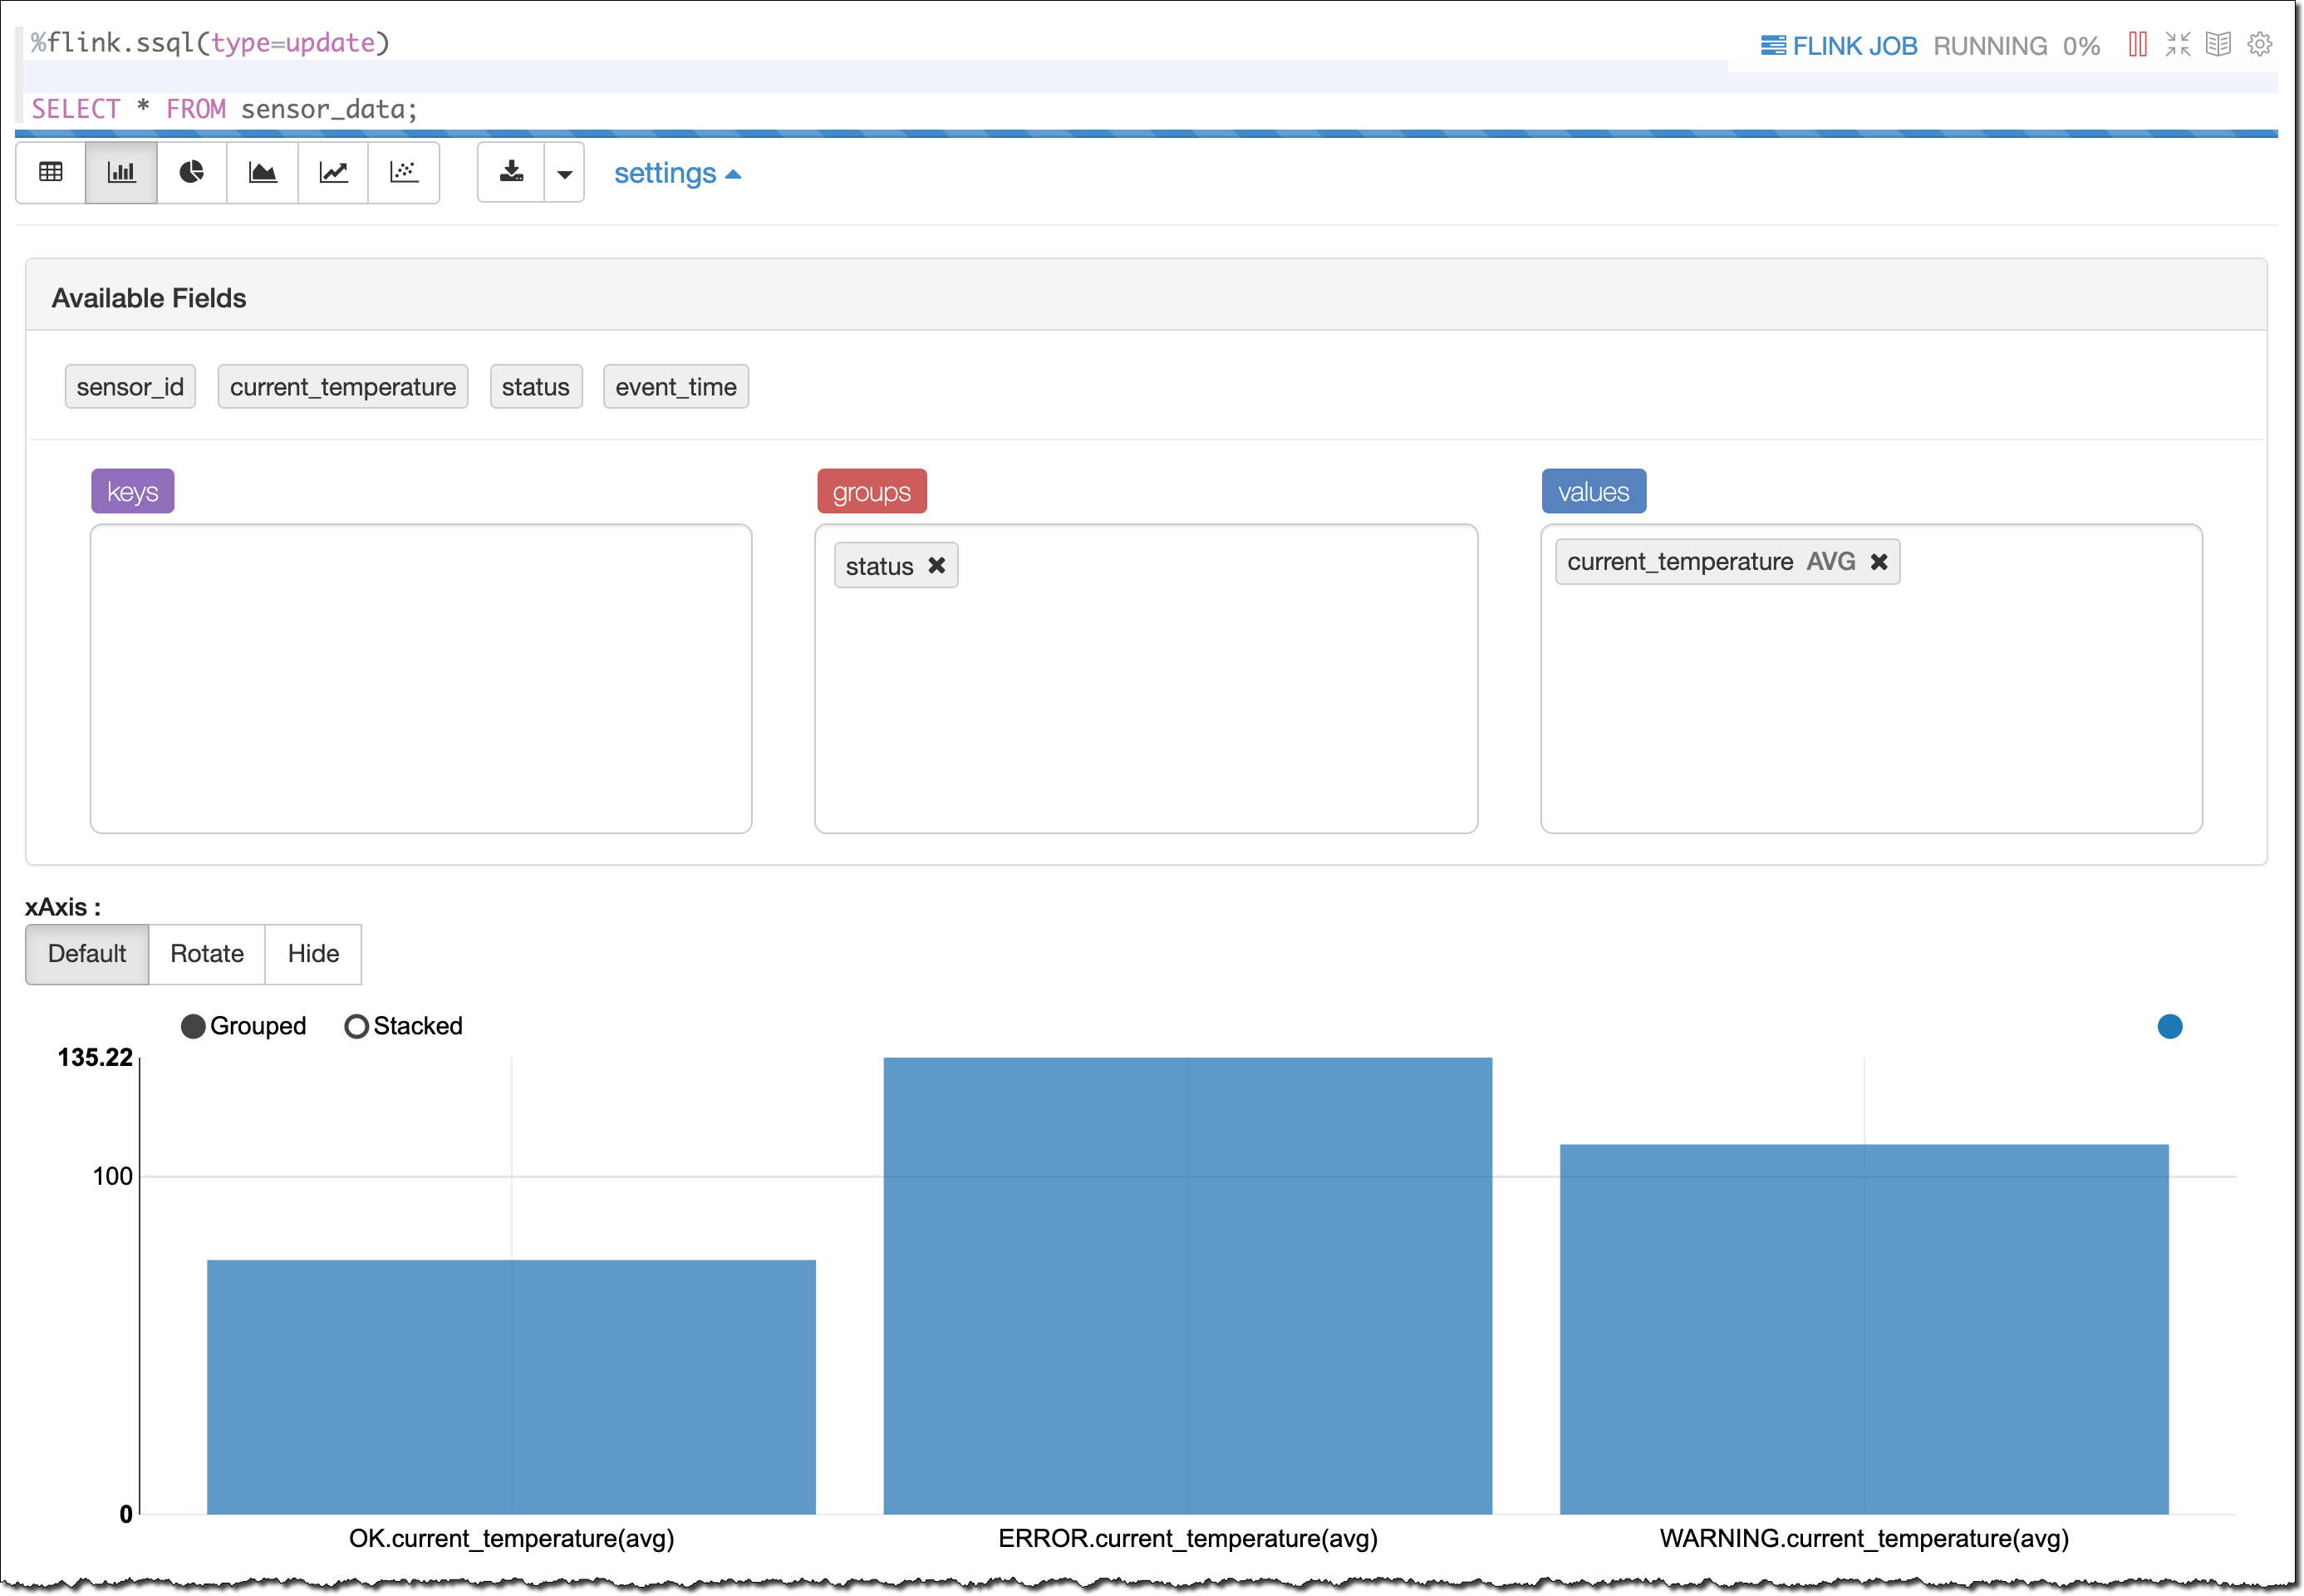
As expected by the way I am generating these results, I have different average temperatures depending on the status (OK, WARNING, or ERROR). The higher the temperature, the greater the probability that something is not working correctly with my sensors.
I can run the aggregated query explicitly using a SQL syntax. This time, I want the result computed on a sliding window of 1 minute with results updated every 10 seconds. To do so, I am using the HOP function in the GROUP BY section of the SELECT statement. To add the time to the output of the select, I use the HOP_ROWTIME function. For more information, see how group window aggregations work in the Apache Flink documentation.
%flink.ssql(type=update)

SELECT sensor_data.status,
       COUNT(*) AS num,
       AVG(sensor_data.current_temperature) AS avg_current_temperature,
       HOP_ROWTIME(event_time, INTERVAL '10' second, INTERVAL '1' minute) as hop_time
  FROM sensor_data
 GROUP BY HOP(event_time, INTERVAL '10' second, INTERVAL '1' minute), sensor_data.status;
This time, I look at the results in table format:

To send the result of the query to a destination stream, I create a table and connect the table to the stream. First, I need to give permissions to the notebook to write into the stream.
In the Kinesis Data Analytics Studio console, I select my-notebook. Then, in the Studio notebooks details section, I choose Edit IAM permissions. Here, I can configure the sources and destinations used by the notebook and the IAM role permissions are updated automatically.

In the Included destinations in IAM policy section, I choose the destination and select my-output-stream. I save changes and wait for the notebook to be updated. I am now ready to use the destination stream.
In the notebook, I create a sensor_state table connected to my-output-stream.
%flink.ssql

CREATE TABLE sensor_state (
    status VARCHAR(6),
    num INTEGER,
    avg_current_temperature DOUBLE,
    hop_time TIMESTAMP(3)
)
WITH (
'connector' = 'kinesis',
'stream' = 'my-output-stream',
'aws.region' = 'us-east-1',
'scan.stream.initpos' = 'LATEST',
'format' = 'json',
'json.timestamp-format.standard' = 'ISO-8601');
I now use this INSERT INTO statement to continuously insert the result of the select into the sensor_state table.
%flink.ssql(type=update)

INSERT INTO sensor_state
SELECT sensor_data.status,
    COUNT(*) AS num,
    AVG(sensor_data.current_temperature) AS avg_current_temperature,
    HOP_ROWTIME(event_time, INTERVAL '10' second, INTERVAL '1' minute) as hop_time
FROM sensor_data
GROUP BY HOP(event_time, INTERVAL '10' second, INTERVAL '1' minute), sensor_data.status;
The data is also sent to the destination Kinesis data stream (my-output-stream) so that it can be used by other applications. For example, the data in the destination stream can be used to update a real-time dashboard, or to monitor the behavior of my sensors after a software update.
I am satisfied with the result. I want to deploy this query and its output as a Kinesis Analytics application. To do so, I need to provide an S3 location to store the application executable.
In the configuration section of the console, I edit the Deploy as application configuration settings. There, I choose a destination bucket in the same region and save changes.

I wait for the notebook to be ready after the update. Then, I create a SensorsApp note in my notebook and copy the statements that I want to execute as part of the application. The tables have already been created, so I just copy the INSERT INTO statement above.
From the menu at the top right of my notebook, I choose Build SensorsApp and export to Amazon S3 and confirm the application name.

When the export is ready, I choose Deploy SensorsApp as Kinesis Analytics application in the same menu. After that, I fine-tune the configuration of the application. I set parallelism to 1 because I have only one shard in my input Kinesis data stream and not a lot of traffic. Then, I run the application, without having to write any code.
From the Kinesis Data Analytics applications console, I choose Open Apache Flink dashboard to get more information about the execution of my application.

Availability and Pricing
You can use Amazon Kinesis Data Analytics Studio today in all AWS Regions where Kinesis Data Analytics is generally available. For more information, see the AWS Regional Services List.
In Kinesis Data Analytics Studio, we run the open-source versions of Apache Zeppelin and Apache Flink, and we contribute changes upstream. For example, we have contributed bug fixes for Apache Zeppelin, and we have contributed to AWS connectors for Apache Flink, such as those for Kinesis Data Streams and Kinesis Data Firehose. Also, we are working with the Apache Flink community to contribute availability improvements, including automatic classification of errors at runtime to understand whether errors are in user code or in application infrastructure.
With Kinesis Data Analytics Studio, you pay based on the average number of Kinesis Processing Units (KPU) per hour, including those used by your running notebooks. One KPU comprises 1 vCPU of compute, 4 GB of memory, and associated networking. You also pay for running application storage and durable application storage. For more information, see the Kinesis Data Analytics pricing page.
Start using Kinesis Data Analytics Studio today to get better insights from your streaming data.
— Danilo