Post Syndicated from Dmitry Lambert original https://blog.zabbix.com/top-5-reasons-to-choose-zabbix-for-network-monitoring/15247/
There are many monitoring solutions and monitoring tools that you can use for different monitoring tasks. But in this post and video, we will focus only on Zabbix and the top five features making Zabbix the best choice to monitor your home office as well as enterprise instances or projects.
Contents
I. Free and open-source solution (0:44)
II. Wide functionality (1:43)
III. No access to your data (03:53)
IV. Balance of flexibility and simplicity (5:35)
V. Commercial services (7:55)
Free and open-source solution
First, Zabbix is a free and open-source solution covered by General Public License (GPL) v2. This means that the Zabbix source code is readily available and can be redistributed or modified. With this in mind, you can always create your own version of Zabbix, if you’re willing to play around with the source code or have a great idea on how to improve the product.
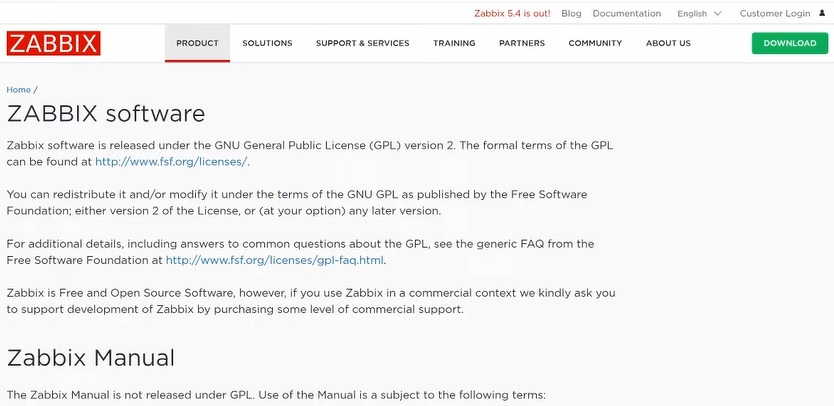 Zabbix software properties
There are no paid versions of Zabbix, no paid functionality, and no hidden costs. You can monitor any number of devices and define your own data retention policies at no cost at all.
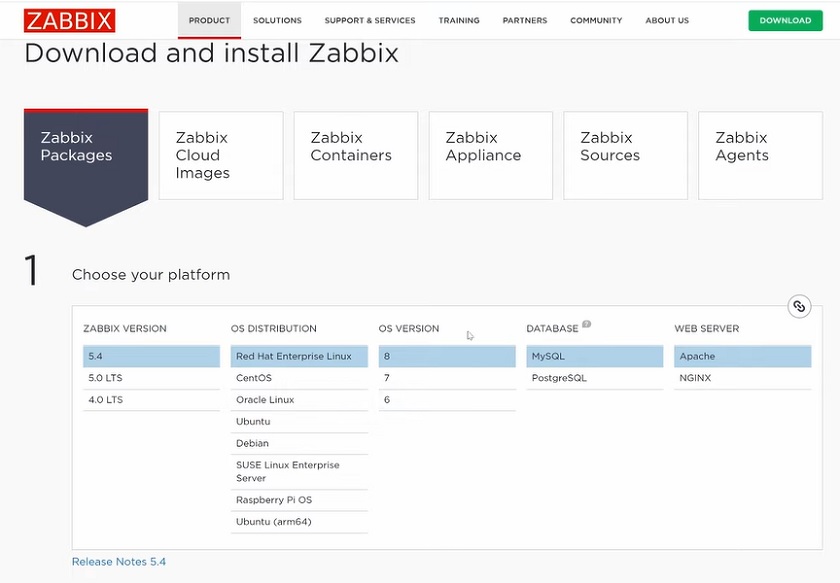
All of the latest features are absolutely free and available in the latest version of Zabbix. You can visit zabbix.com, click the Download button, choose the platform that is best for you and install Zabbix packages on it. Zabbix can be deployed on any kind of environment, be it a virtual machine, physical servers, cloud environments, or even a Docker container. After you have downloaded Zabbix, you are ready to go ahead with the latest Zabbix feature set.
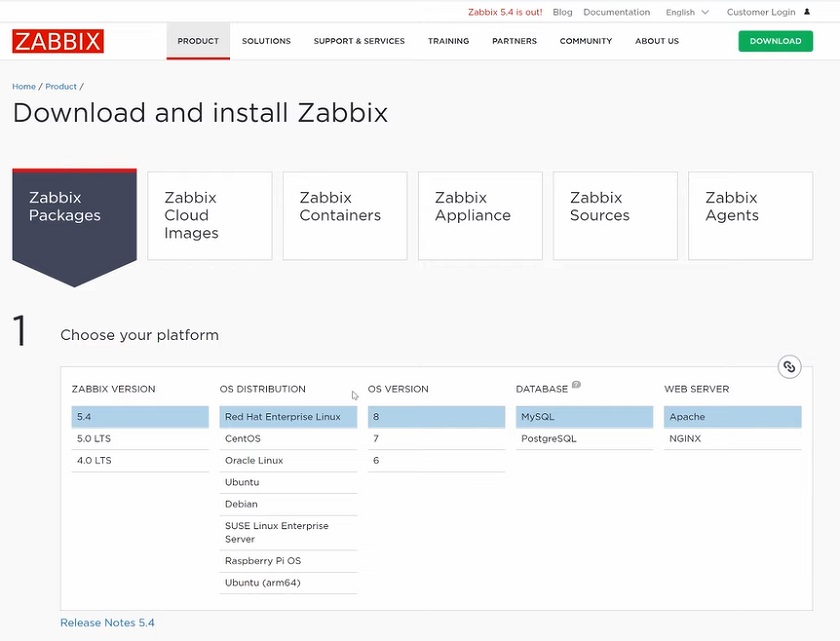 Selecting platform to install Zabbix n Zabbix.com/download
Rich feature set
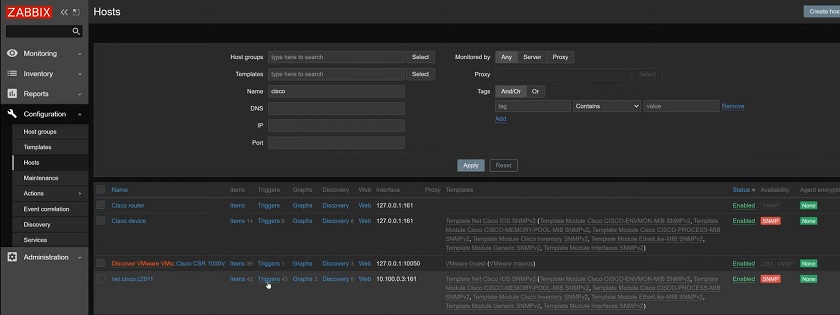
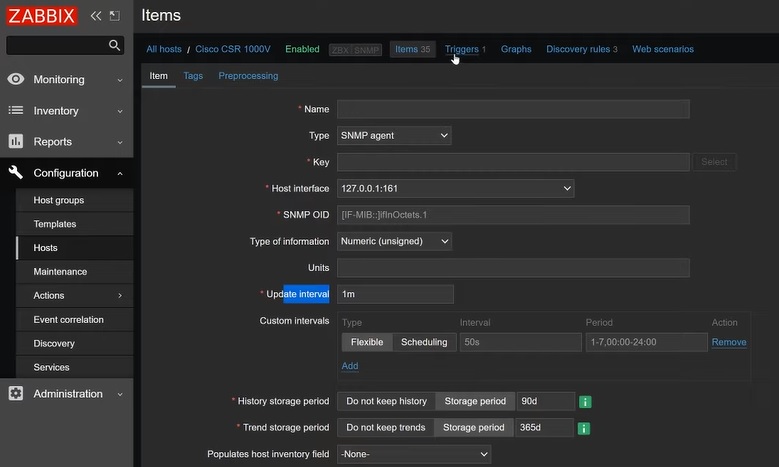
Zabbix is a fully enterprise-ready product with a wide set of features that you can use to achieve any of your monitoring tasks. As a tool, Zabbix is not focused on any single thing, offering users extreme flexibility. For instance, you can monitor Windows or Linux machines agentlessly or opt-in to install a Zabbix agent on them. On the other hand, to monitor network devices, SNMP monitoring might be the easiest approach. All it takes to start monitoring your end-points is creating an item, specifying the metric that you want to monitor together with the data collection interval, and you are good to go.
 Configuring SNMP monitoring parameters
After we have collected the data, we can configure our problem thresholds (also known as triggers in Zabbix) by navigating to Configuration > Hosts > Triggers. Triggers are definitions of our problem thresholds, where you can define a problem threshold, when do you consider your metric to be within that threshold and how do you recover from the problem.
There is a wide array of so called trigger functions – these allow us to define thresholds in different ways. For example, we can analyze the last received value, averages, minimum and maximum values over some time, look for a specific string in a value and much, much more!
We also need to define a way of reacting to a problem – should we receive an e-mail if something goes wrong? Or maybe we want to try and remediate the issue automatically by executing a command or a script? This is where the so-called Actions come in. Actions are based on and/or conditions, that allow you to very granularly define how you’re going to react to a particular problem.
For example, you might define an action that states “If the Trigger name contains ‘SNMPSim’ send an email or a mobile text message to our Network administrator. If the problem still persists after 10 minutes, execute a locally stored script that should fix the problem.

Trigger actions
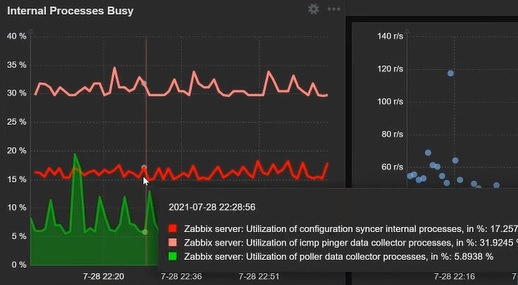
Once you have defined your items, triggers and actions, it’s time to present this information in a user-friendly fashion. For this, you can create a set of multi-page dashboards where you can see all of your collected data by utilizing different dashboard widgets together with a list of active problems,

display the collected metrics on graphs and provide an overview of your infrastructure state on network maps.

The dashboard is completely dynamic and interactive — you can zoom in on any point in time in your graphs, create interactive map hierarchies, navigate to different sections of Zabbix and much more.
Zabbix also supports SLA monitoring for your IT business services. You can define your IT service trees, link them to existing triggers and have access to different SLA related views.
 Configuring and monitoring SLA
Inventory collection and storage is also natively supported by Zabbix. You can collect any inventory information from your devices – your device serial numbers, locations, software versions and much more. This can be done in many different ways – the inventory information can be captured from the collected metrics, populated manually or updated by using the Zabbix API. This information can be used to access different inventory views and group your devices based on the collected inventory data.
You own your data
There are many different ways to deploy Zabbix. You can navigate to zabbix.com/download page and select the installation method that fits your requirements. For Zabbix packages you have the option to choose the required Zabbix version, select from multiple operating systems – from the Red Hat Enterprise Linux to Raspberry Pi, as well as the specific OS version, the database backend, and the web server backend. After everything is selected, you will be presented with a comprehensive list of commands that you can use to get Zabbix up and running in minutes.
Zabbix Packages
If you are interested in cloud deployments then you can also run Zabbix in many different cloud environments, such as AWS, Microsoft Azure, Google Cloud, DigitalOcean, Linode, Red Hat OpenShift, Oracle Cloud or Yandex Cloud. All of these options offer full Zabbix functionality with native cloud images.
 Zabbix Cloud images
Docker images are also available for different Zabbix components. You can run a single component in a container or deploy the whole Zabbix architecture in a containerized environment. The Docker hub page contains a comprehensive list of environment variables and examples of how to deploy container images with a single command.

The quickest way to deploy Zabbix, especially in a PoC environment, would be the Zabbix Appliance. Zabbix Appliance is a virtual machine image with all of the Zabbix components already pre-configured for you. Simply download the image for the hypervisor of your choice, deploy it and you are good to go.
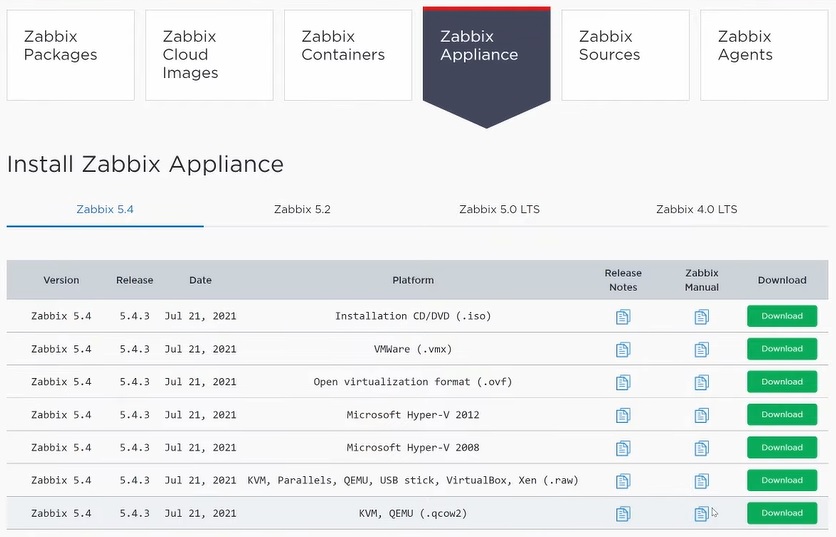
The Zabbix source code is also available for download for different Zabbix versions. This approach is useful for more exotic environments, where installing via packages is not an option.
 Zabbix Sources
Agents are available for download via packages, but if packages is not an option, you can always download the precompiled agents for many different operating systems, including Windows.

Zabbix agents
No matter which option you choose, Zabbix LLC never has any access to your configuration or history data. You are fully in control of your deployment and the data in it. This way you have the guarantee that your data belongs only to you.
Balance of flexibility and simplicity
A good monitoring solution should be simple and approachable even for users that are not experts in monitoring, Linux system, scripting and any other DevOps-related skills. However, simplicity usually comes with at a cost of functionality. If the tool focuses too much on simplicity, it would inevitably restrict the end-users in the set of functionality that they have available for them.
Zabbix provides a balance of simplicity and flexibility. While the amount of features in Zabbix may seem daunting at first, the flexibility it provides is the key benefit of Zabbix. With Zabbix, you can easily extend the out-of-the-box monitoring approaches with your custom monitoring methods. If you have in-house applications specific to your company, you can always extend the Zabbix monitoring functionality and create your own custom checks or use scripts or commands to collect the data. This way you can define custom methods not only for data collection, but also use scripting for robust automatic issue remediation.
This gives you a huge variety of features that you can utilize in Zabbix either by using out-of-the-box templates or defining your own custom checks. All of this can be done within a single central frontend.
Even if you’re monitoring 50 branches in different countries within one Zabbix installation, a Zabbix administrator will be able to maintain and change the configuration — add new items, triggers, etc. Zabbix is also a great fit for multi-tenant environments. The robust permission and role schema enable you to define multiple Zabbix administrators that can have granular access to monitoring entities within their organization.
Commercial services
Open-source solutions are great as you can download the product at any time, irrespective of your goals and use them for both small home lab environments and large enterprise infrastructures. Similar to many open-source solutions, Zabbix also has a large and passionate international community of users ready to help you out on the official forums, different social networks, Zabbix subreddit and other communication channels.
If this not sufficient and you’re still feeling overwhelmed by all of the available features and require additional help to deploy your environment with best practices in mind – this is where the Zabbix commercial services come into play.
 Commercial services
- Zabbix team offers multiple commercial services, starting with a multiple-tier technical support. With technical support services, Zabbix experts will have your back and help you with fixing any issues and answer all of your questions 24/7.
- Zabbix team also offers consulting services, where you can address any topic that you wish to discuss to Zabbix experts — how to deploy Zabbix and start monitoring your infrastructure, whether Zabbix is able to cover all of your needs, receive help with tuning Zabbix configuration and much more.
- Turnkey solutions allow you to engage Zabbix professionals and build everything from scratch with best practices and scalability in mind.
- Zabbix team can lend you a hand with Template building services for your custom in-house application.
- The Zabbix team will document all of the performed steps, so you can have a clear view of what has been done and what was the reason behind it. You can utilize this knowledge down the line to learn and be able to follow the best practice approaches on your own.
- Upgrade procedures can be extremely stressful – you may be worried about minimizing downtime, following your organizational SLA’s or maybe you simply aren’t sure how to properly perform an upgrade. Once again, the Zabbix team can do this for you, document it and guide you through the process so you can learn from it and do it yourself in the later versions.
- Need help with troubleshooting an ongoing issue? Then the remote troubleshooting services are for you. Zabbix team can help you get to the bottom of any issues you may have with your Zabbix architecture.
Zabbix is an extremely fast-growing enterprise-ready project with a vast set of functionality trusted by global brands, capable to support collection of hundreds of thousands of metrics with real-time 24/7 data analysis, powerful visualization options, robust permission schema, out of the box reports and the ability to tailor the tool to your specific needs.
If you have never tried Zabbix, this might be the perfect moment to visit zabbix.com, click Download, and download Zabbix on your local test environment and try to monitor a couple of hosts to get acquainted with the product. I am sure that you’re going to be more than satisfied with the results!