All posts by Dmitry Lambert

Docker Container Monitoring With Zabbix

Post Syndicated from Dmitry Lambert original https://blog.zabbix.com/docker-container-monitoring-with-zabbix/20175/

In this blog post, I will cover Docker container monitoring with Zabbix. We will use the official Docker by Zabbix agent 2 template to make things as simple as possible. The template download link and configuration steps can be found on the Zabbix Integrations page. If you require a visual guide, I invite you to check out my video covering this topic.

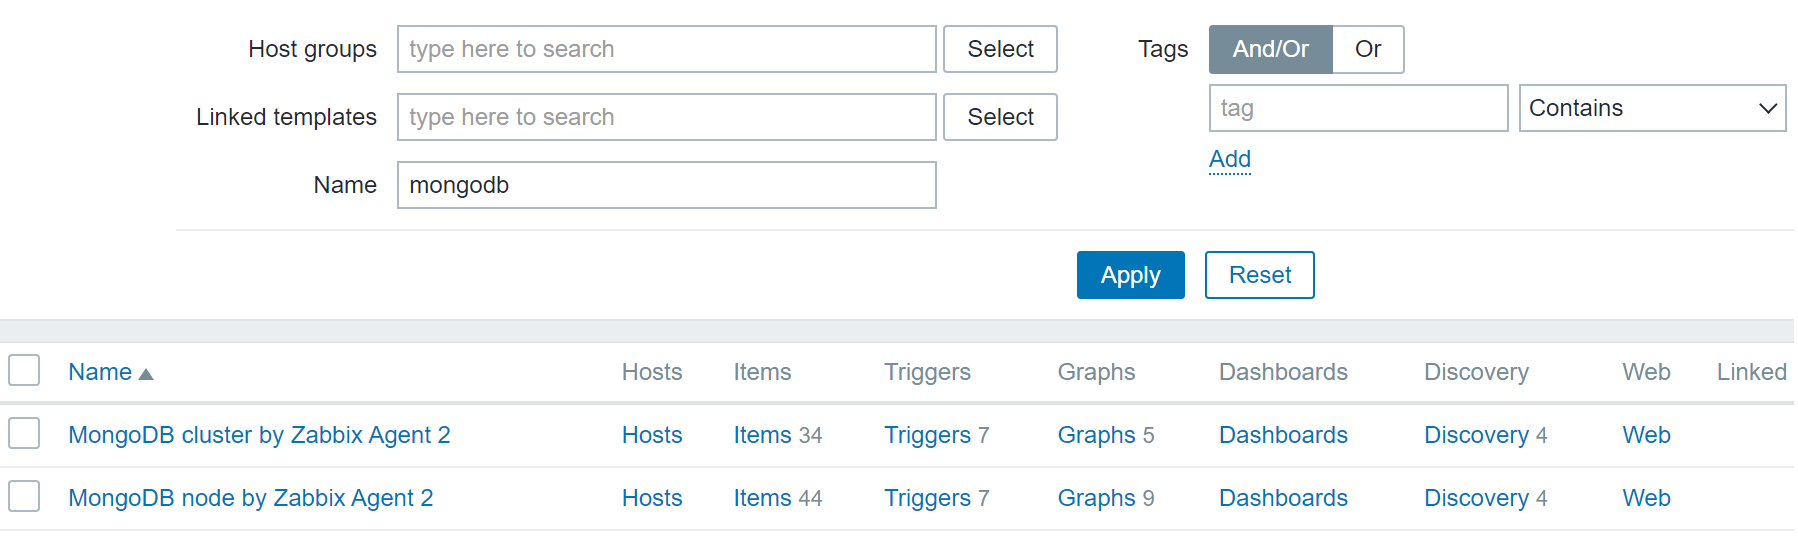
Importing the official Docker template

Importing the Docker by Zabbix agent 2 template

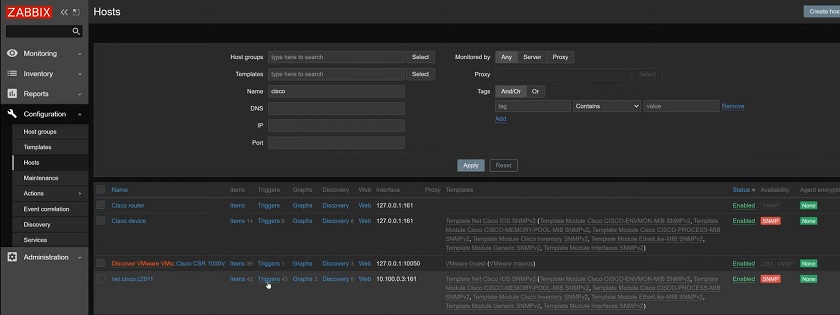
Since we will be using the official Docker by Zabbix agent 2 template, first, we need to make sure that the template is actually available in our Zabbix instance. The template is available for Zabbix versions 5.0, 5.4, and 6.0. If you cannot find this template under Configuration – Templates, chances are that you haven’t imported it into your environment after upgrading Zabbix to one of the aforementioned versions. Remember that Zabbix does not modify or import any templates during the upgrade process, so we will have to import the template manually. If that is so, simply download the template from the official Zabbix git page (or use the link in the introduction) and import it into your Zabbix instance by using the Import button in the Configuration – Templates section.

Installing and configuring Zabbix agent 2

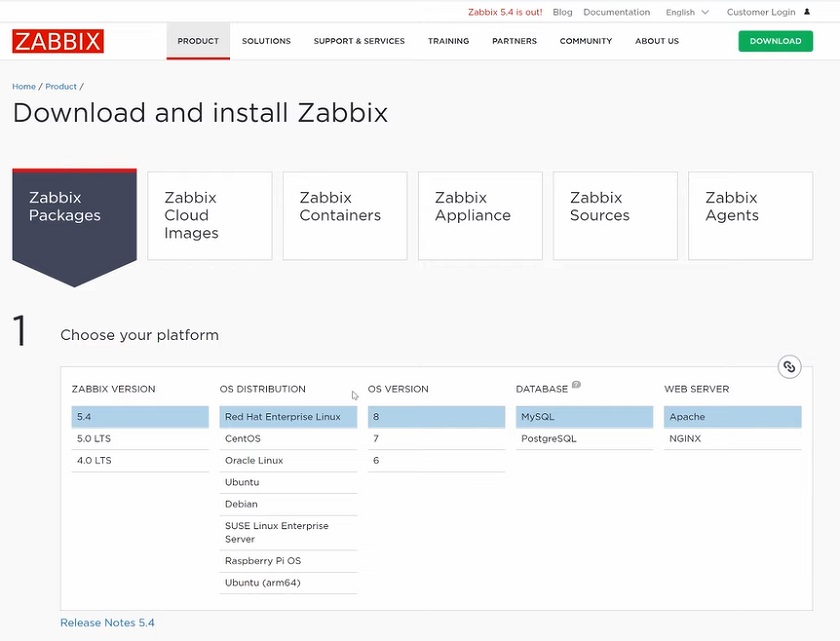
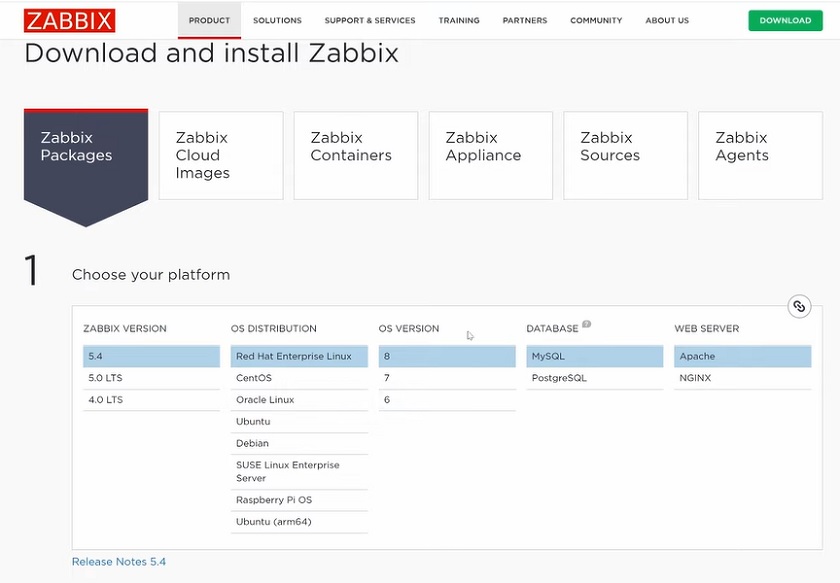
Before we get started with configuring our host, we first have to install Zabbix agent 2 and configure it according to the template guidelines. Follow the steps in the download section of the Zabbix website and install the zabbix-agent2 package. Feel free to use any other agent deployment methods if you want to (like compiling the agent from the source files)

Installing Zabbix agent2 from packages takes just a few simple steps:

Install the Zabbix repository package:

rpm -Uvh https://repo.zabbix.com/zabbix/6.0/rhel/8/x86_64/zabbix-release-6.0-1.el8.noarch.rpm

Install the Zabbix agent 2 package:

dnf install zabbix-agent2

Configure the Server parameter by populating it with your Zabbix server/proxy address

vi /etc/zabbix/zabbix_agent2.conf
### Option: Server
# List of comma delimited IP addresses, optionally in CIDR notation, or DNS names of Zabbix servers and Zabbix proxies.
# Incoming connections will be accepted only from the hosts listed here.
# If IPv6 support is enabled then '127.0.0.1', '::127.0.0.1', '::ffff:127.0.0.1' are treated equally
# and '::/0' will allow any IPv4 or IPv6 address.
# '0.0.0.0/0' can be used to allow any IPv4 address.
# Example: Server=127.0.0.1,192.168.1.0/24,::1,2001:db8::/32,zabbix.example.com
#
# Mandatory: yes, if StartAgents is not explicitly set to 0
# Default:
# Server=

Server=192.168.50.49

Plugin specific Zabbix agent 2 configuration

Zabbix agent 2 provides plugin-specific configuration parameters. Mostly these are optional parameters related to a specific plugin. You can find the full list of plugin-specific configuration parameters in the Zabbix documentation. In the newer versions of Zabbix agent 2, the plugin-specific parameters are defined in separate plugin configuration files, located in /etc/zabbix/zabbix_agent2.d/plugins.d/, while in older versions, they are defined directly in the zabbix_agent2.conf file.

For the Zabbix agent 2 Docker plugin, we have to provide the Docker daemon unix-socket location. This can be done by specifying the following plugin parameter:

### Option: Plugins.Docker.Endpoint
# Docker API endpoint.
#
# Mandatory: no
# Default: unix:///var/run/docker.sock
# Plugins.Docker.Endpoint=unix:///var/run/docker.sock

The default socket location will be correct for your Docker environment – in that case, you can leave the configuration file as-is.

Once we have made the necessary changes in the Zabbix agent 2 configuration files, start and enable the agent:

systemctl enable zabbix-agent2 --now

Check if the Zabbix agent2 is running:

tail -f /var/log/zabbix/zabbix_agent2.log

Before we move on to Zabbix frontend, I would like to point your attention to the Docker socket file permission – the zabbix user needs to have access to the Docker socket file. The zabbix user should be added to the docker group to resolve the following error messages.

[Docker] cannot fetch data: Get http://1.28/info: dial unix /var/run/docker.sock: connect: permission denied
ZBX_NOTSUPPORTED: Cannot fetch data.

You can add the zabbix user to the Docker group by executing the following command:

usermod -aG docker zabbix

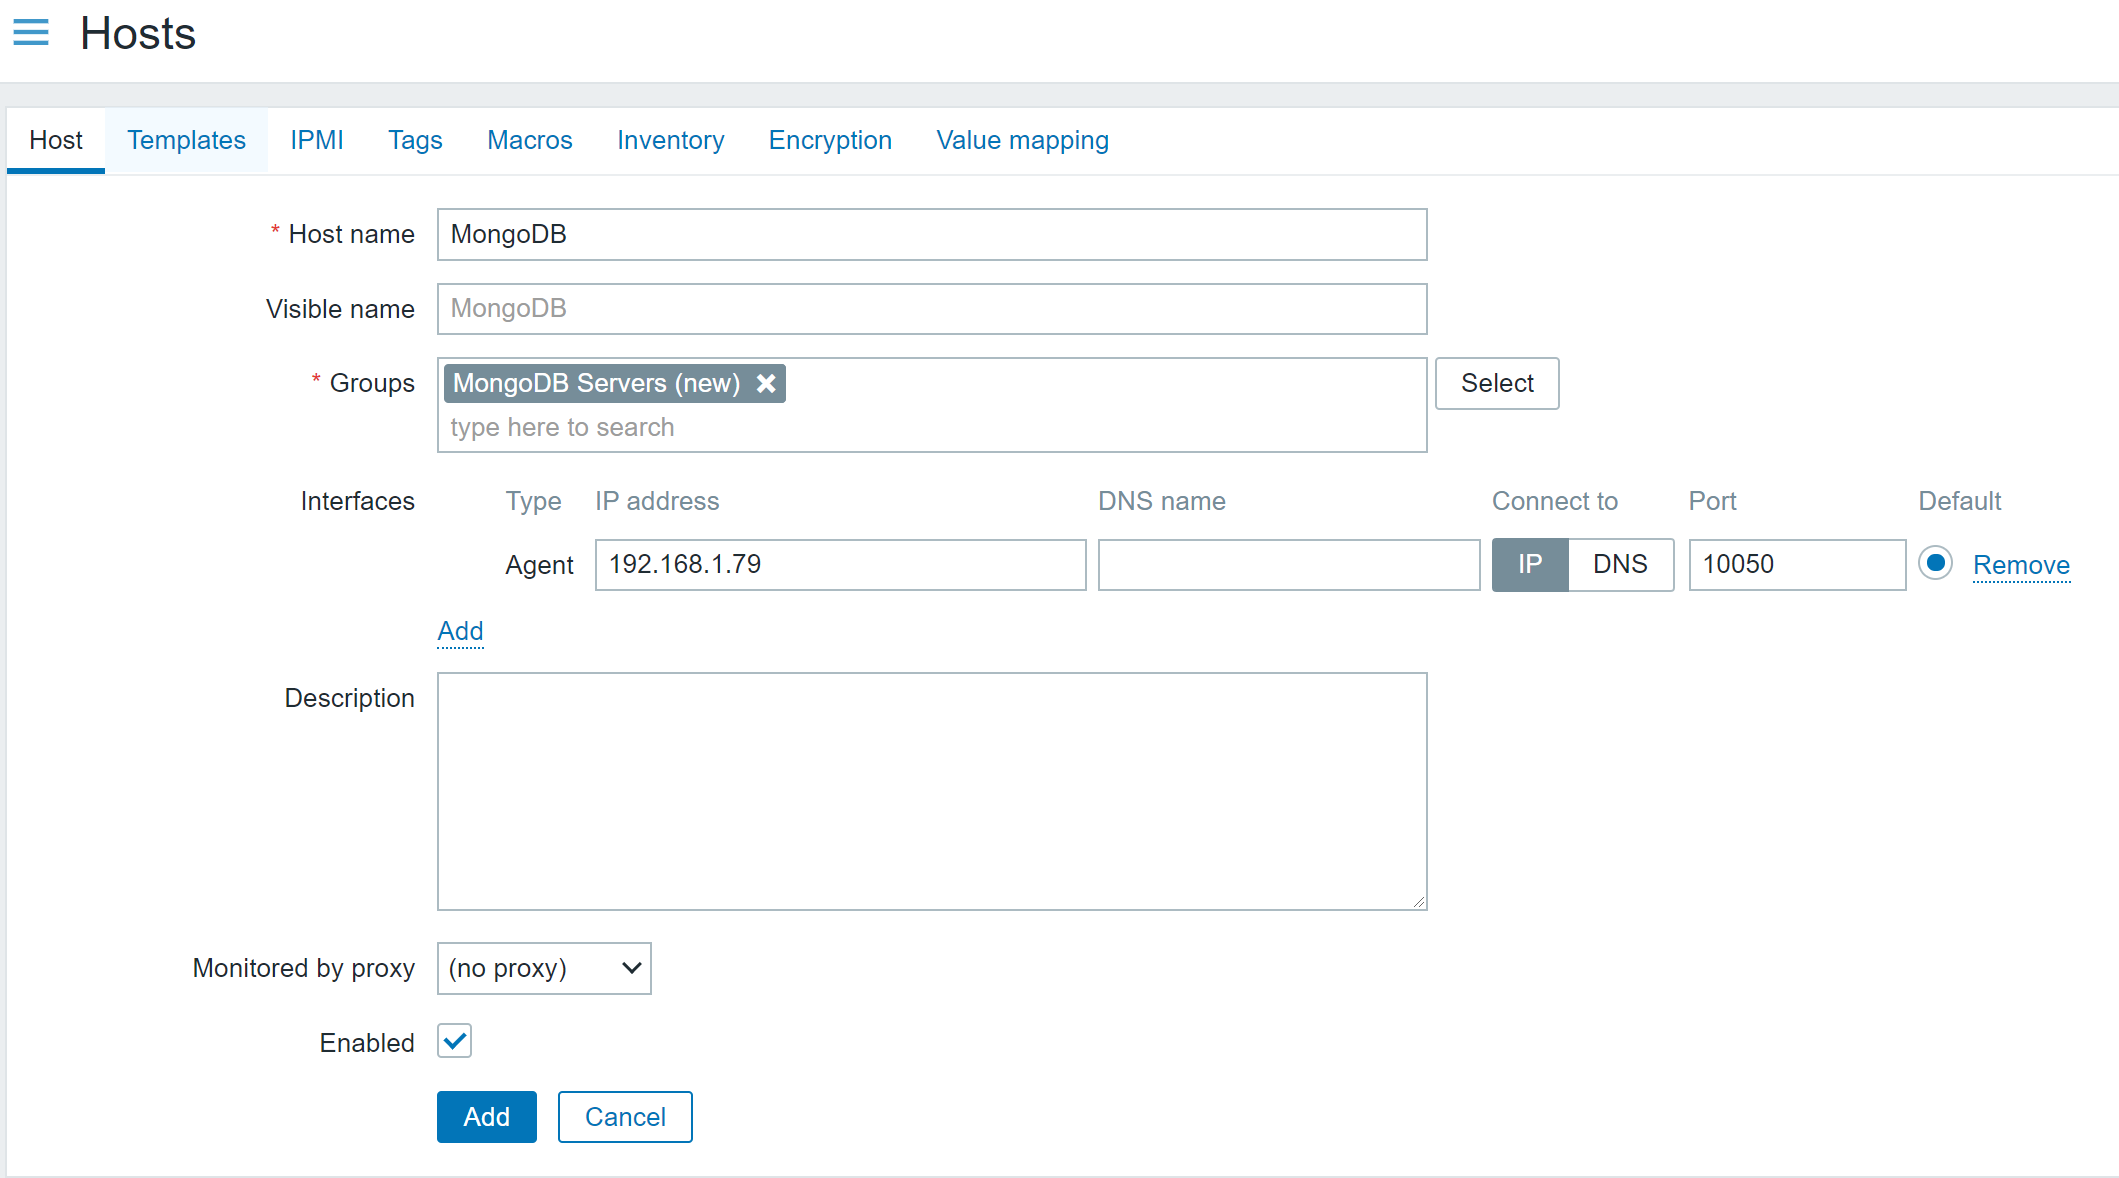
Configuring the docker host

Configuring the host representing our Docker environment

After importing the template, we have to create a host which will represent our Docker instance. Give the host a name and assign it to a Host group – I will assign it to the Linux servers host group. Assign the Docker by Zabbix agent 2 template to the host. Since the template uses Zabbix agent 2 to collect the metrics, we also have to add an agent interface on this host. The address of the interface should point to the machine running your Docker containers. Finish up the host configuration by clicking the Add button.

Docker by Zabbix agent 2 template

Regular docker template items

The template contains a set of regular items for the general Docker instance metrics, such as the number of available images, Docker architecture information, the total number of containers, and more.

Docker tempalte Low-level discovery rules

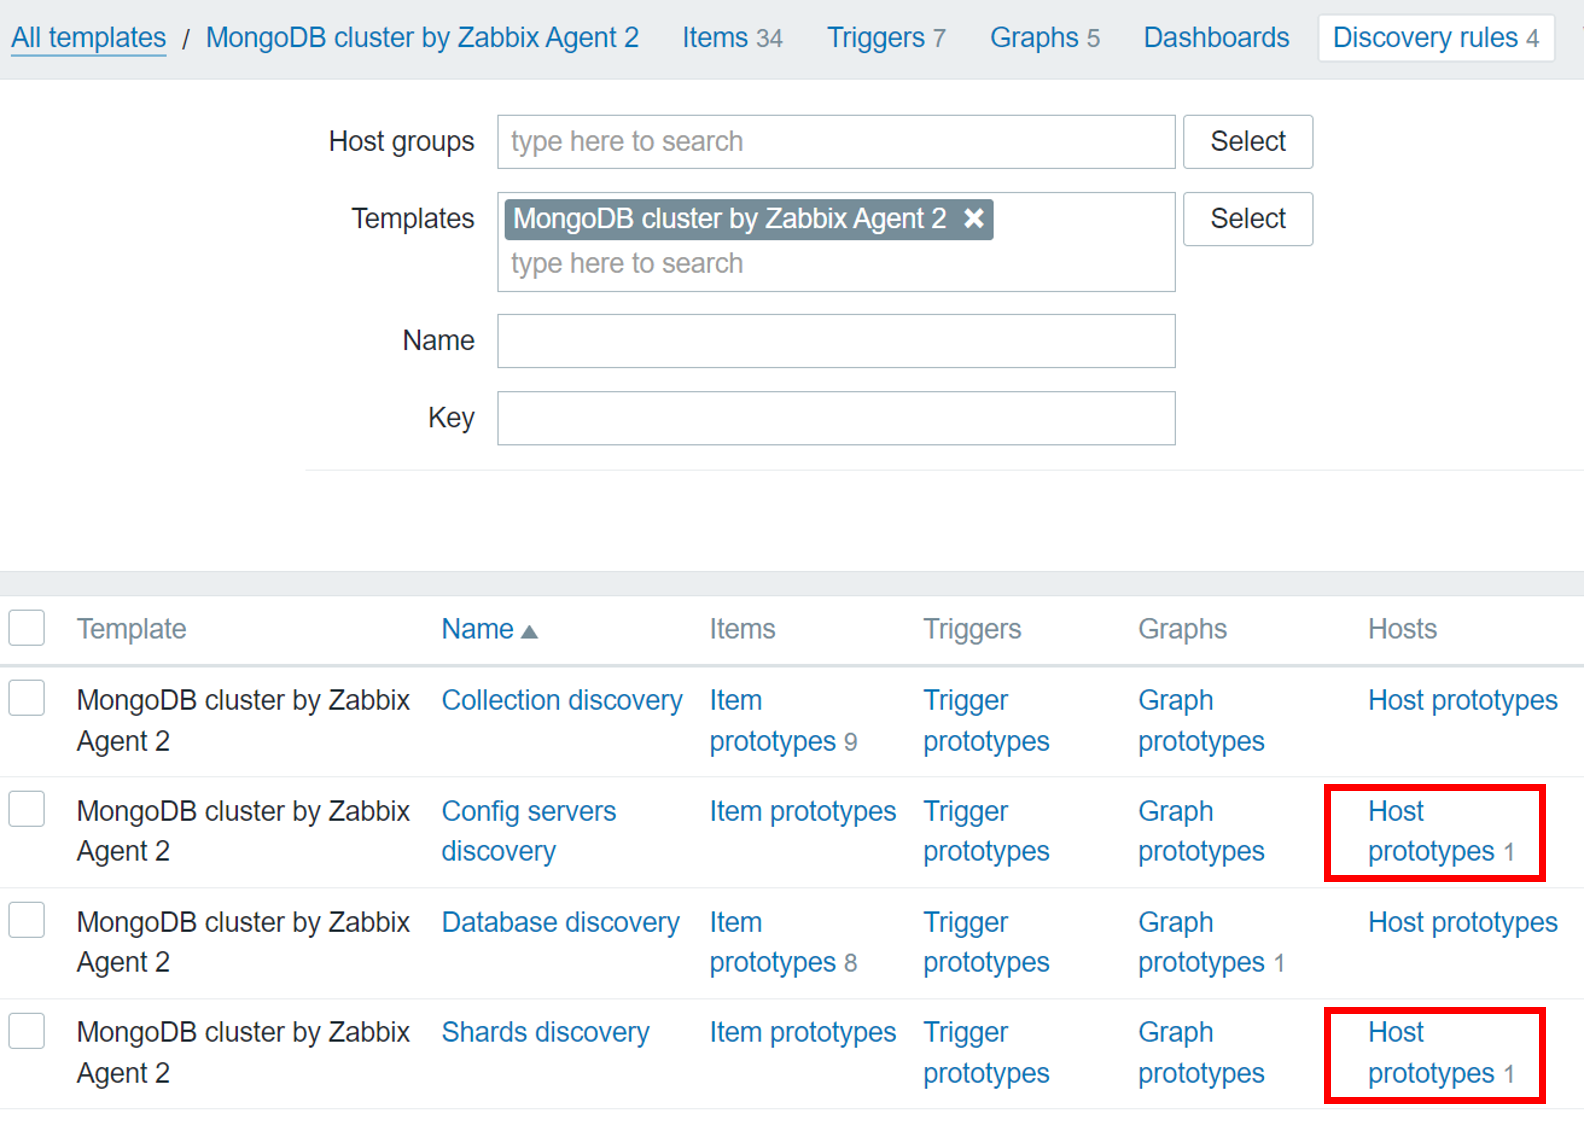
On top of that, the template also gathers container and image-specific information by using low-level discovery rules.

Once Zabbix discovers your containers and images, these low-level discovery rules will then be used to create items, triggers, and graphs from prototypes for each of your containers and images. This way, we can monitor container or image-specific metrics, such as container memory, network information, container status, and more.

Docker templates Low-level discovery item prototypes

Verifying the host and template configuration

To verify that the agent and the host are configured correctly, we can use Zabbix get command-line tool and try to poll our agent. If you haven’t installed Zabbix get, do so on your Zabbix server or Zabbix proxy host:

dnf install zabbix-get

Now we can use zabbix-get to verify that our agent can obtain the Docker-related metrics. Execute the following command:

zabbix_get -s docker-host -k docker.info

Use the -s parameter to specify your agent host’s host name or IP address. The -k parameter specifies the item key for which we wish to obtain the metrics by polling the agent with Zabbix get.

zabbix_get -s 192.168.50.141 -k docker.info

{"Id":"SJYT:SATE:7XZE:7GEC:XFUD:KZO5:NYFI:L7M5:4RGO:P2KX:QJFD:TAVY","Containers":2,"ContainersRunning":2,"ContainersPaused":0,"ContainersStopped":0,"Images":2,"Driver":"overlay2","MemoryLimit":true,"SwapLimit":true,"KernelMemory":true,"KernelMemoryTCP":true,"CpuCfsPeriod":true,"CpuCfsQuota":true,"CPUShares":true,"CPUSet":true,"PidsLimit":true,"IPv4Forwarding":true,"BridgeNfIptables":true,"BridgeNfIP6tables":true,"Debug":false,"NFd":39,"OomKillDisable":true,"NGoroutines":43,"LoggingDriver":"json-file","CgroupDriver":"cgroupfs","NEventsListener":0,"KernelVersion":"5.4.17-2136.300.7.el8uek.x86_64","OperatingSystem":"Oracle Linux Server 8.5","OSVersion":"8.5","OSType":"linux","Architecture":"x86_64","IndexServerAddress":"https://index.docker.io/v1/","NCPU":1,"MemTotal":1776848896,"DockerRootDir":"/var/lib/docker","Name":"localhost.localdomain","ExperimentalBuild":false,"ServerVersion":"20.10.14","ClusterStore":"","ClusterAdvertise":"","DefaultRuntime":"runc","LiveRestoreEnabled":false,"InitBinary":"docker-init","SecurityOptions":["name=seccomp,profile=default"],"Warnings":null}

In addition, we can also use the low-level discovery key – docker.containers.discovery[false] to check the result of the low-level discovery.

zabbix_get -s 192.168.50.141 -k docker.containers.discovery[false]

[{"{#ID}":"a1ad32f5ee680937806bba62a1aa37909a8a6663d8d3268db01edb1ac66a49e2","{#NAME}":"/apache-server"},{"{#ID}":"120d59f3c8b416aaeeba50378dee7ae1eb89cb7ffc6cc75afdfedb9bc8cae12e","{#NAME}":"/mysql-server"}]

We can see that Zabbix will discover and start monitoring two containers – apache-server and mysql-server. Any agent low-level discovery rule or item can be checked with Zabbix get.

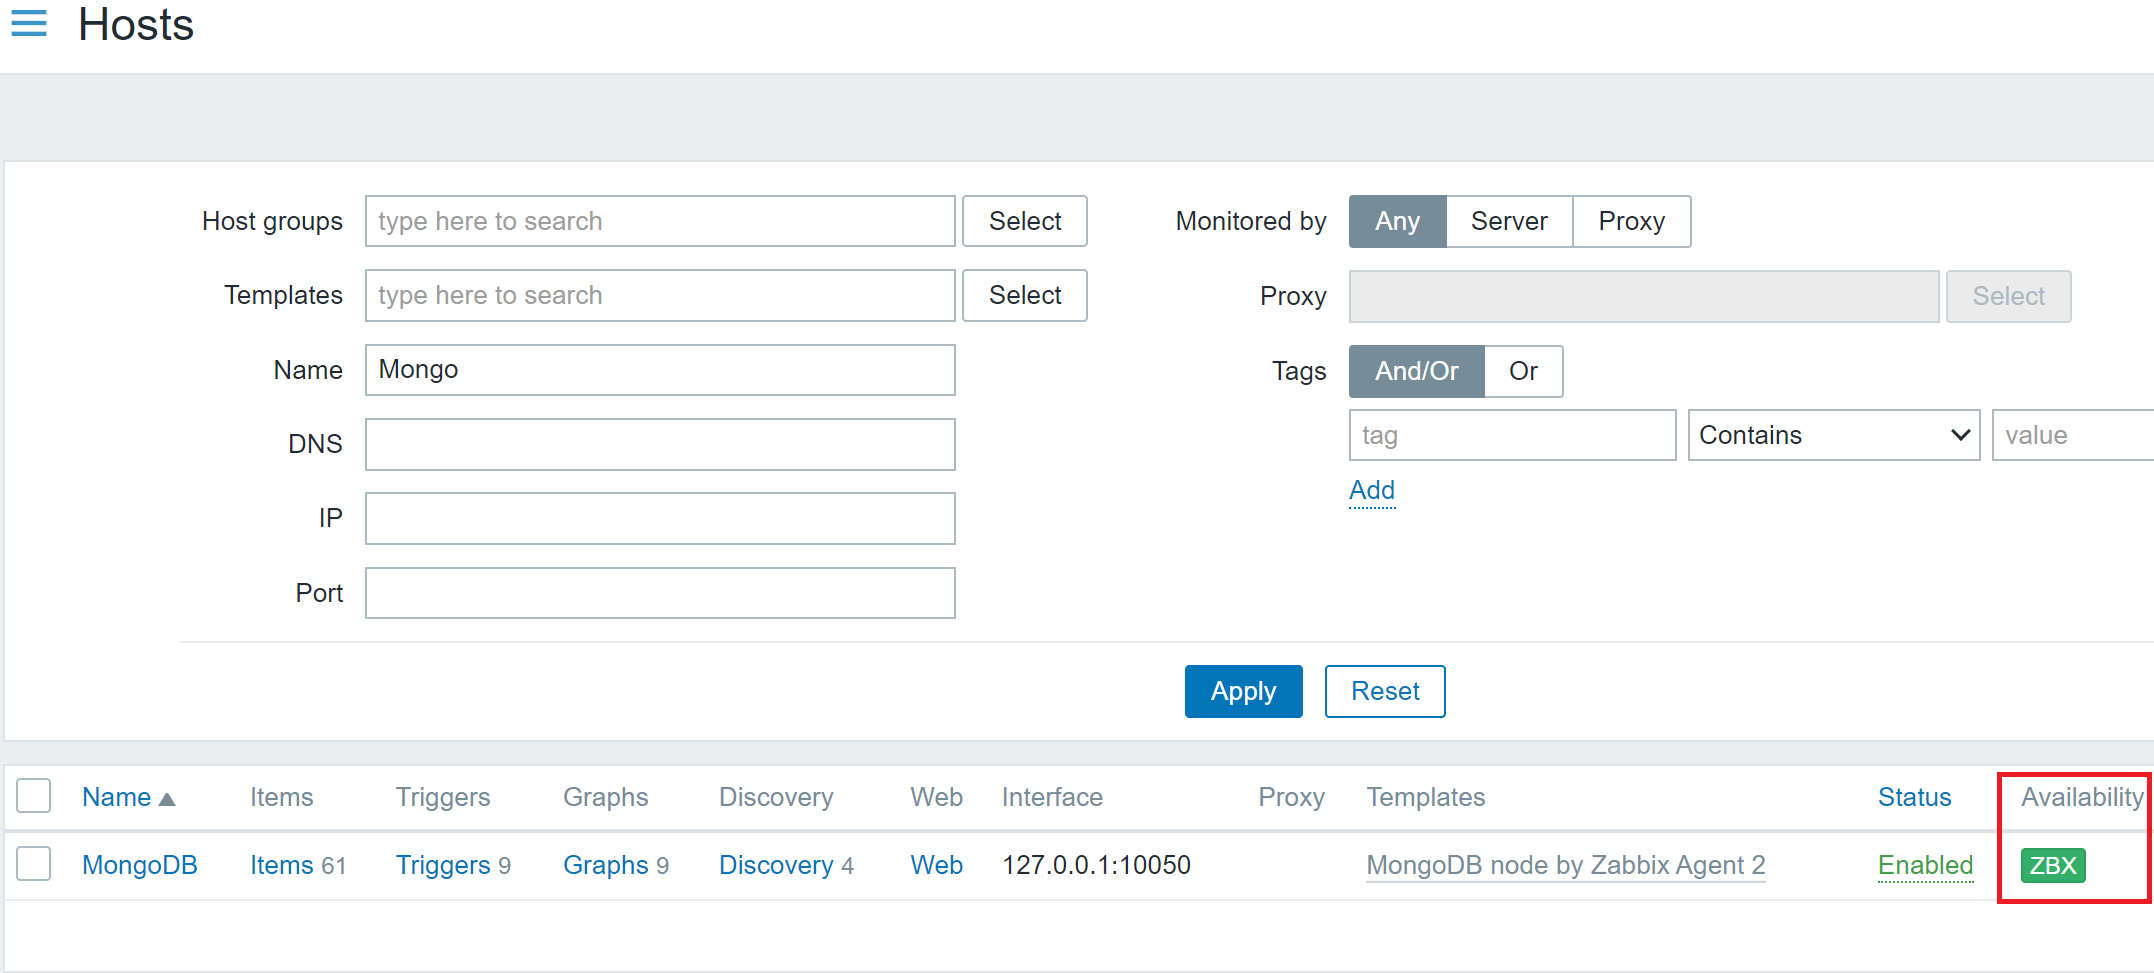
Docker template in action

Discovered items on our Docker host

Now that we have configured our agent and host, applied the Docker template, and verified that everything is working, we should be able to see the discovered entities in the frontend.

Collected Docker container metrics

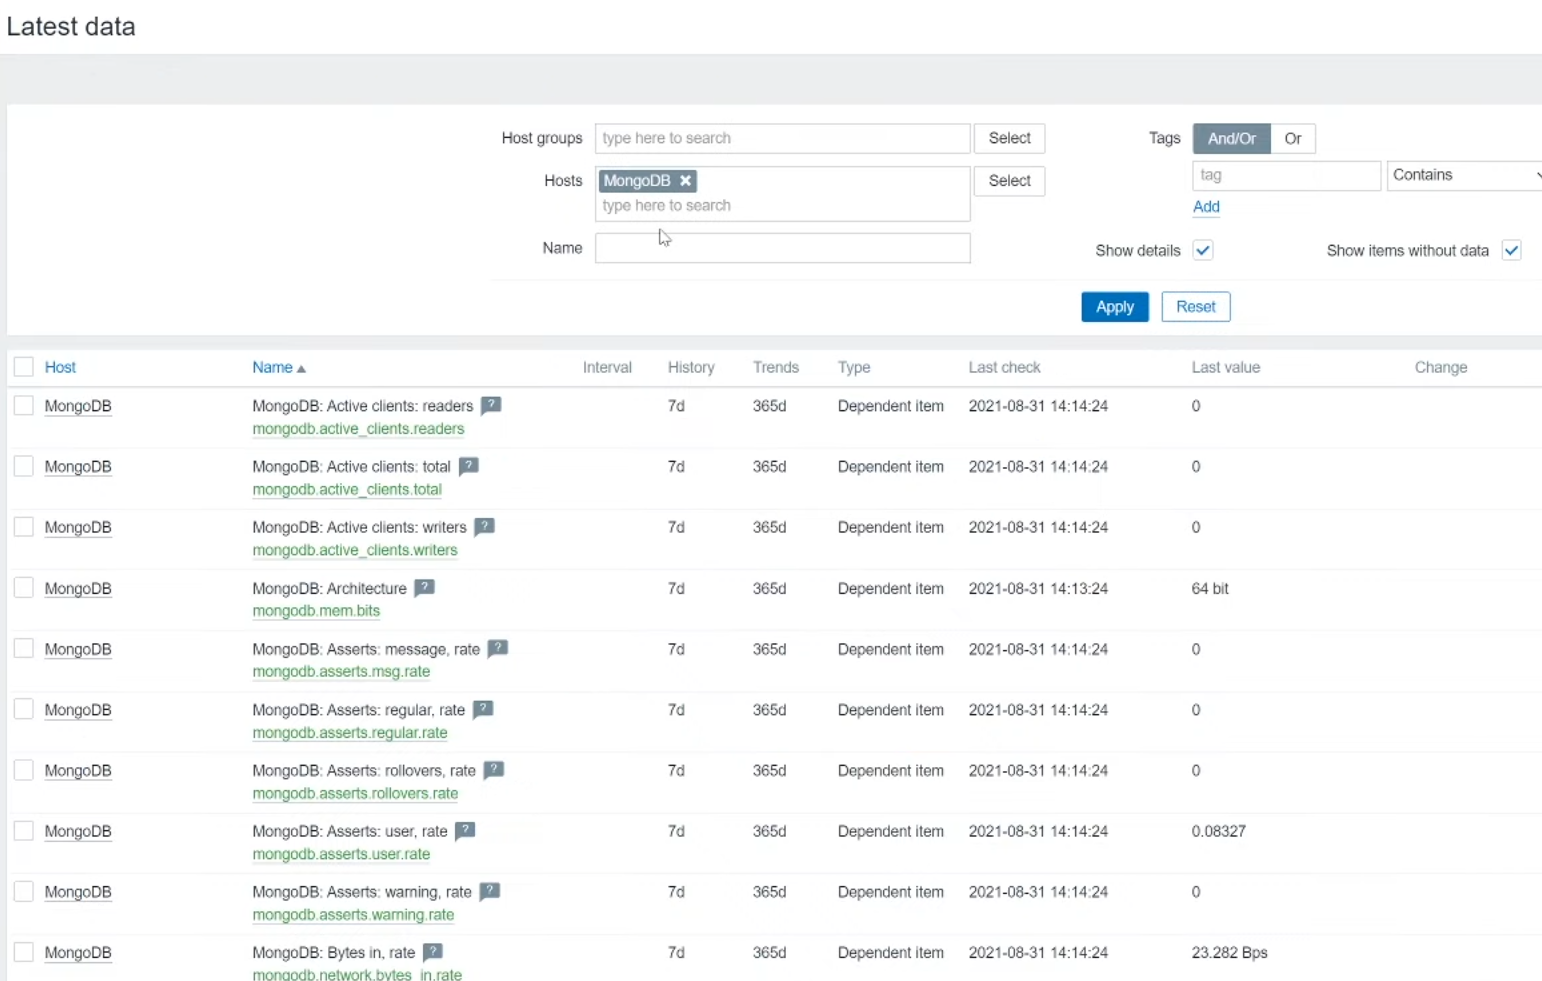
In addition, our metrics should have also started coming in. We can check the Latest data section and verify that they are indeed getting collected.

Macros inherited from the Docker template

Lastly, we have a few additional options for further modifying the template and the results of our low-level discovery. If you open the Macros section of your host and select Inherited and host macros, you will notice that there are 4 macros inherited from the Docker template. These macros are responsible for filtering in/out the discovered containers and images. Feel free to modify these values if you wish to filter in/out the discovery of these entities as per your requirements.

Notice that the container discovery item also has one parameter, which is defined as false on the template:

  • docker.containers.discovery[false] – Discover only running containers
  • docker.containers.discovery[true] – Discover all containers, no matter their state.

And that’s it! We successfully imported the template, installed and configured Zabbix agent 2, created a host, and applied the Docker template. Finally – our Zabbix instance is now monitoring our Docker environment! If you have any other questions or comments, feel free to leave a response in the comments section of this post.


The post Docker Container Monitoring With Zabbix appeared first on Zabbix Blog.

ZABBIX – Open-Source Monitoring Software for Automotive Monitoring

Post Syndicated from Dmitry Lambert original https://blog.zabbix.com/zabbix-open-source-monitoring-software-for-automotive-monitoring/18776/

In this article, I will try to cover the theoretical models on monitoring your vehicle fleet with minimal to no cost at all by using the ELM327 microcontroller, a python library to process the collected data and a Zabbix proxy running on a small Raspberry Pi device to store and sent the collected metrics to the central Zabbix server.

Expanding the scope of our Zabbix instance

The first thing that comes to mind when someone mentions a monitoring system is pretty simple. People think about server monitoring, and with servers, we usually mean Linux and Windows systems and also network monitoring for all kinds of flavors of switches, routers, firewalls, etc. But by putting so much focus on these standard things, we are someway limiting the possibilities of monitoring systems. Zabbix has proven itself as an extremely powerful monitoring tool that can combine and monitor all client infrastructure – no matter if we are talking about the aforementioned servers, network devices, services, applications, or anything else. And most important – Zabbix is truly a 100% open-source product, which allows anyone to use all listed functionalities for free.

Please, keep in mind that no doubt there are systems available that are created exactly for the same purpose I will cover here. Maybe they are more reliable. Perhaps they require less effort to achieve the desired result. But that is the exact reason why the presented model is mostly theoretical, with the primary goal being to show that it is hard to put Zabbix in some functionality boundaries. Usually, the only limitation is our imagination. And it is up to you to treat this information for pure entertainment or try to implement it in a place where you find it suitable.

Monitoring a car fleet

Let’s get straight to the point. You don’t need to own a huge logistics company with a thousand vehicle fleet to understand it. In simple words – if you or any of your relatives own a car, you should be aware that cars tend to break. Just like it usually happens, there could be many types of issues, starting with a flat tire and ending with some ongoing damage in the gearbox or engine. It is important to understand that vehicles themselves are becoming smarter. If in the past it was a purely mechanical device, then nowadays it is a highly complicated electronic system on top of that mechanical device that can diagnose the slightest deviations from accepted norms that are set by the manufacturer and inform about this malfunction either with an indicator light on your dash or simply with a log message that will be accessible only when read with specialized software or tools.

No alt text provided for this image


Keep in mind that malfunctions in vehicles are not as simple as boolean ( works or not ). In most cases an issue is noticed before the car is not able to move forward, and the purpose of that is to be informed and fix the issue before it has turned into a defect that actually prevents the vehicle from functioning.

And now think about this from an automotive business perspective. We may be talking about hundreds of vehicles that are always on the move to deliver something or someone in time. It should be straightforward that in such a niche business, each of these vehicles should be able to traverse close to a thousand kilometers per day.

No alt text provided for this image


Thankfully, as mentioned previously, the smart diagnostic system will let you know about all the potential problems. On the other hand, the driver of the vehicle usually has nothing to do with its repairs or technical condition. So in a perfect world, we should have a few technical employees that would simply ask returning driver whether everything is fine with the car after his shift – are there any errors, and connect with diagnostic software to read its logs to make sure that everything actually is ok. If it’s not ok, information should be passed to the technical department to move this vehicle to the maintenance.

Why such pressure? Well, remember that most of these notifications serve as a warning that something is not working as it should, but currently, it is not causing harm. However, if it is ignored, there is a high chance that at some point, the vehicle will not be able to continue its way to the destination.

No alt text provided for this image


So this is where Zabbix joins the conversation. Imagine if all this data transfer from the vehicle diagnostic system to the responsible employees would happen automatically, with potential error prioritization and escalation to further levels if any vehicle has an ongoing issue that remains active for multiple days. And remember that Zabbix is a completely free and open-source system, which means that we could achieve this result for free. And we are absolutely not limited to DTC ( Diagnostic Trouble Codes ) readings. Combining this ecosystem with the recent Zabbix 6.0 LTS release, we can create a geomap with the current location of any vehicle from our fleet. With a little effort, we can also get speed measurements, long stops, starts, and much more.

This is the part when the tested but still theoretical model comes into action. By now, we are aware that a car is way smarter than it may look, and it gathers and stores a lot of useful information. However, the Zabbix monitoring system as per the most common standard sits somewhere in our headquarters and monitors generic metrics of our IT infrastructure. So how could we potentially get this information from our vehicle to Zabbix?

No alt text provided for this image


Since all information is stored in ECU (Electronic Control Unit), there is also a way to read it. And it is achieved through OBD (On-Board Diagnostic) socket through the standardized protocol. Just like anything else, OBD has multiple versions or protocols of communications. Still, if we are talking about seamlessly modern cars, most likely we are talking about OBD-II, which included Electronic signaling and messaging format.

Using ELM327 to gather data

precisely OBD-II will help us to gather all information from the vehicle, to further transfer it to our Zabbix monitoring system. Initially, this may yet sound very unclear because we have some kind of socket to access our ECU, but how can we actually gather some meaningful data? For that, we will need ELM327

No alt text provided for this image


ELM327 is a programmed microcontroller produced by ELM Electronics for translating the OBD interface. Even today ELM327 command protocol is one of the most popular PC to OBD interface standards. Typically ELM abstracts the low-level protocol and presents a simple interface that can be called via UART, typically by a hand-held diagnostic tool or a computer program connected by USB, RS-232, Bluetooth, or WiFi. In our case, we don’t need and don’t have any dedicated diagnostic tool, so we will have to use something else to work with OBD-II and translate all incoming data. With the ELM-327, it is straightforward. You can purchase an ELM327 OBD2-Bluetooth adapter on Amazon for a couple of dollars, and it will be enough to provide the required functionality.

No alt text provided for this image

Data processing with Python-OBD and Raspberry Pi

As it usually happens, for all things that we need, we can find a Python library published under GPLv2. And as you already noticed from the screenshot, we are not limited to stored DTC values. In addition to that, we are able to read live data from our vehicle, such as speed, fuel pressure, coolant temperature, intake temperature, and much more.

No alt text provided for this image


The closer we get to the result, the simpler the task starts to look. At this point, we basically have everything that we need. We have the data, and we have the interface from which to read it. ELM327 allows us to transport this data to our device, and the python library will enable us to translate and process this information, therefore allowing sending clean data to our Zabbix. The only open question is what device should we use in our vehicle, on which we could run our Python script, and which would have GSM access to transfer gathered data to the Zabbix server. In my example choice was as simple as cheap – Raspberry Pi.

No alt text provided for this image


And then it’s a matter of choice when you have Raspberry set up on a vehicle, connected via Bluetooth or any other way to your ELM327, that is plugged into an OBD-II connector. With Python script running on Pi device to receive and process data from our ECM, we need to decide what piece of software from Zabbix we want on this device.

Zabbix proxy for data storage

Considering that the car could be driving through different areas where internet coverage could not be the best, but we also don’t want to lose any data simply because there was no connection, I think it is best to install Zabbix proxy on Raspberry Pi.

Zabbix proxy perfectly suits such a small setup and helps us with its main purpose. Proxy has a local database that stores all information that has to be sent to our Zabbix server. If because of some networking trouble this data can’t be passed to our server, it will be kept in the local database for a moment when a network connection is restored and data is sent. Luckily for us, Zabbix has Official Packages for Raspberry Pi OS, so we don’t need to tailor any magic around it.

The functionality of the Zabbix proxy allows us to choose between two modes ( Active and Passive ), which basically allows us to choose the direction of communication. It might not be the cheapest approach to purchase a static IP address for each unit. Therefore we will be using Zabbix Proxy (Active), which simply will connect to our Zabbix server and send all gathered information. Of course, there are security measures for validation to make sure that only designated devices will be able to send data to a server. If an even more secure approach is required, users may choose to use TLS encryption with PSK or Certificates.

No alt text provided for this image

Collecting the current latitude and longitude

Previously I mentioned, that with the new Geomap widget, it is possible to achieve a live view of the current location from all your fleet on a single dashboard. To do that, we obviously need live latitude and longitude readings, which ECU and stock Raspberry Pi are not able to provide. But this is the beauty of Raspberry Pi. With minimal investments, we can purchase a GPS unit and combine it with our Pi.

No alt text provided for this image

With a very simplified Python script, we can gather all required data, and move it to our Zabbix proxy that is installed on localhost, which then will parse this information to our Zabbix Server that will allow us to see it in the dashboard. As this is not a very native and straightforward approach to monitoring, we won’t be able to use native item types to collect this data. This means that all the collection must be done within the script, and then we need to pass this data using the Zabbix-sender utility. The purpose of this utility is very simple, without any complications, take data that is provided and send it to a specified Hostname.

No alt text provided for this image


Since Zabbix has a very powerful preprocessing engine, we don’t have to make our script over-complicated with data transformation to meet guidelines for data visualization within Zabbix. We can send raw data, just like it is, and then use any suitable preprocessing step in the Zabbix frontend to extract the value we need to visualize.

No alt text provided for this image

The many uses of the collected data

When the data arrives in the Latest data in our Zabbix frontend, consider the most complicated part of this task is done. And just like before the idea of automotive monitoring with Zabbix, the only limitation is your imagination. You can simply collect this data without any actions. Monitor it on your own, from time to time, just to see if you can do anything meaningful with it.

You are also able to utilize a wide list of trigger functions within Zabbix to define that it is a problem when some particular value is received. For example, when some DTC appeared on a device, or let’s say, the average speed of the vehicle exceeds a threshold. Maybe you want to set some borders for coordinates, and if a particular vehicle gets outside of a specified radius, it could raise a problem in your monitoring system.

It is up to you how to react to these triggers. It could be just a flashing light on your Problems view within the Zabbix frontend. It could also automatically create incidents for your maintenance team with a message that a particular vehicle has worn out brake pads that has to be replaced. But maybe if these brake pads are not replaced for a full week since the first time it was noticed, you want to receive a personalized message on your mobile phone so that you can escalate this issue further.

No secret that there are flaws and downsides. As I mentioned right in beginning, there are software and devices that are developed and adopted exactly for this purpose, however, my approach may not be 100% reliable. Data transfer from ECU is not as live as reading CPU utilization from your computer. All of this is just a reminder that monitoring is not limited to network devices and servers. And Zabbix, which is growing every year, provides more and more features to its users while remaining absolutely free and open-source, is here to support all your ideas and help them come to life.

The post ZABBIX – Open-Source Monitoring Software for Automotive Monitoring appeared first on Zabbix Blog.

Monitoring MongoDB nodes and clusters with Zabbix

Post Syndicated from Dmitry Lambert original https://blog.zabbix.com/monitoring-mongodb-nodes-and-clusters-with-zabbix/16031/

Zabbix Agent 2 enables our users to monitor a whole set of new systems with minimal configuration required on the monitored systems. Forget about writing custom monitoring scripts, deploying additional packages, or configuring ODBC. A great use-case for Zabbix Agent 2  is monitoring one of the most popular NoSQL DB backends – MongoDB. Below, you can read a detailed description and step-by-step guide through the use case or refer to the video available here.

Zabbix MongoDB template

For this example, we will be using Zabbix version 5.4, but MongoDB monitoring by Zabbix Agent 2 is supported starting from version 5.0. If you have a fresh deployment of Zabbix version 5.0 or newer, you will be able to find the MongoDB template in your ‘Configuration‘ – ‘Templates‘ section.

MongoDB Node and Cluster templates

On the other hand, if you have an instance that you deployed before the release of Zabbix 5.0 and then upgraded to Zabbix 5.0 or newer, you will have to import the template manually from our git page. Let’s remember that Zabbix DOES NOT apply new templates or modify existing templates during an upgrade. Therefore, newly released templates have to be IMPORTED MANUALLY!

We can see that we have two MongoDB templates – ‘MongoDB cluster by Zabbix Agent 2’ and ‘MongoDB node by Zabbix agent 2’. Depending on your MongoDB setup – individual nodes or a cluster, apply the corresponding template. Note that the MongoDB cluster template can automatically create hosts for your config servers and shards and apply the MongoDB node template on these hosts.

Host prototypes for config servers and shards

Deploying Zabbix Agent 2 on your Host

Since the data collection is done by Zabbix Agent 2, first, let’s deploy Zabbix Agent 2 on our MongoDB node or cluster host. Let’s start with adding the Zabbix 5.4 repository and install the Zabbix Agent 2 via a  package.

Add the Zabbix 5.4 repository:

rpm -Uvh https://repo.zabbix.com/zabbix/5.4/rhel/8/x86_64/zabbix-release-5.4-1.el8.noarch.rpm

Install Zabbix Agent 2:

yum install zabbix-agent2

What if you already have the regular Zabbix Agent running on this machine? In this case, we have two options for how we can proceed. We can simply remove the regular Zabbix Agent and Deploy Zabbix Agent 2. In this case, make sure you make a backup of the Zabbix Agent configuration file and migrate all of the changes to the Zabbix Agent 2 configuration file.

The second option is running both of the Zabbix Agents in parallel. In this case, we need to make sure that both agents – Zabbix Agent and Zabbix Agent 2 are listening on their own specific ports because, by default, both agents are listening for connections on port 10050. This can be configured in the Zabbix Agent configuration file by changing the ‘ListenPort’ parameter.

Don’t forget to specify the ‘Server‘ parameter in the Zabbix Agent 2 configuration file. This parameter should contain your Zabbix Server address or DNS name. By defining it here, you will allow Zabbix Agent 2 to accept the metric poll requests from Zabbix Server.

After you have made the configuration changes in the Zabbix Agent 2 configuration file, don’t forget to restart Zabbix Agent 2 to apply the changes:

systemctl restart zabbix-agent2

Creating a MongoDB user for monitoring

Once the agent has been deployed and configured, you need to ensure that you have a MongoDB database user that we can use for monitoring purposes. Below you can find a brief example of how you can create a MongoDB user:

Access the MongoDB shell:

mongosh

Switch to the MongoDB admin database:

use admin

Create a user with ‘userAdminAnyDatabase‘ permissions:

db.createUser(
... {
..... user: "zabbix_mon",
..... pwd: "zabbix_mon",
..... roles: [ { role: "userAdminAnyDatabase", db: "admin" } ]
..... }
... )

The username for the newly created user is ‘zabbix_mon’. The password is also ‘zabbix_mon‘ – feel free to change these as per your security policy.

Creating and configuring a MongoDB host

Next, you need to open your Zabbix frontend and create a new host representing your MongoDB node. You can see that in our example, we called our node ‘MongoDB’ and assigned it to a ‘MongoDB Servers’ host group. You can use more detailed naming in a production environment and use your own host group assignment logic. But remember – a host needs to belong to AT LEAST a single host group! 

Since the metrics are collected by Zabbix Agent 2, you must also create an Agent interface on the host. Zabbix Server will connect to this interface and request the metrics from the Zabbix Agent 2. Define the IP address or DNS name of your MongoDB host, where you previously deployed Zabbix Agent 2. Mind the port – by default, we have port 10050 defined over here, but if you have modified the ‘ListenPort’ parameter in the Zabbix Agent 2 config and changed the value from the default one (10050) to something else, you also need to use the same port number here.

MongoDB host configuration example

Next, navigate to the ‘Templates’ tab and assign the corresponding template – either ‘MongoDB node by Zabbix agent 2’ or ‘MongoDB cluster by Zabbix Agent 2’. In our example, we will assign the MongoDB node template.

Before adding the host, you also need to provide authentication and connection parameters by editing the corresponding User Macros. These User Macros are used by the items that specify which metrics should we be collecting. Essentially, we are forwarding the connectivity and authentication information to Zabbix Agent 2, telling it to use these values when collecting the metrics from our MongoDB instance.

To do this, navigate to the ‘Macros’ tab in the host configuration screen. Then, select ‘Inherited and host macros’ to display macros inherited from the MongoDB template.

We can see a bunch of macros here – some of them are related to trigger thresholds and discovery filters, but what we’re interested in right now are the following macros:

  • {$MONGODB.PASSWORD} –  MongoDB username. For our example, we will set this to zabbix_mon
  • {$MONGODB.USER} – MongoDB password. For our example, we will set this to zabbix_mon
  • {$MONGODB.CONNSTRING} – MongoDB connection string. Specify the MongoDB address and port here to which the Zabbix Agent 2 should connect and perform the metric collection

Now we are ready to add the host. Once the host has been added, we might have to wait for a minute or so before Zabbix begins to monitor the host. This is because Zabbix Server doesn’t instantly pick up the configuration changes. By default, Zabbix Server updates the Configuration Cache once a minute.

Fine-tuning MongoDB monitoring

At this point, we should see a green ZBX Icon next to our MongoDB host.

Data collection on the MongoDB host has started – note the green ‘ZBX’ icon.

This means that the Zabbix Server has successfully connected to our Zabbix Agent 2, and the metric collection has begun. You can now navigate to the ‘Monitoring’ – ‘Latest data’ section, filter the view by your MongoDB host, and you should see all of the collected metrics here.

MongoDB metrics in ‘Monitoring’ – ‘Latest data’

The final task is to tune the MongoDB monitoring on your hosts, collecting only the required metrics. Navigate to ‘Configuration’ –Hosts’, find your MongoDB hosts, and go through the different entity types on the host – items, triggers, discovery rules. See an item that you don’t wish to collect metrics for? Feel free to disable it. Open up the discovery rules – change the update intervals on them or disable the unnecessary ones.

Note: Be careful not to disable master items. Many of the items and discovery rules here are of type ‘Dependent item’ which means, that they require a so-called ‘Master item’. Feel free to read more about dependent items here.

Remember the ‘Macros’ section in the host configuration? Let’s return to it. here we can see some macros which are used in our trigger thresholds, like:

  • {$MONGODB.REPL.LAG.MAX.WARN} – Maximum replication lag in seconds
  • {$MONGODB.CURSOR.OPEN.MAX.WARN} – Maximum number of open cursors

Feel free to change these as per your problem threshold requirements.

One last thing here – we can filter which elements get discovered by our discovery rules. This is once again defined by user macros like:

  • {$MONGODB.LLD.FILTER.DB.MATCHES} – Databases that should be discovered (By default, the value here is ‘.*’, which will match everything)
  • {$MONGODB.LLD.FILTER.DB.NOT_MATCHES} – Databases that should be excluded from the discovery

And that’s it! After some additional tuning has been applied, we are good to go – our MongoDB entities are being discovered, metrics are getting collected, and problem thresholds have been defined. And all of it has been done with the native Zabbix Agent 2 functionality and an out-of-the-box MongoDB template!

Top 5 reasons to choose Zabbix for network monitoring

Post Syndicated from Dmitry Lambert original https://blog.zabbix.com/top-5-reasons-to-choose-zabbix-for-network-monitoring/15247/

There are many monitoring solutions and monitoring tools that you can use for different monitoring tasks. But in this post and video, we will focus only on Zabbix and the top five features making Zabbix the best choice to monitor your home office as well as enterprise instances or projects.

Contents

I. Free and open-source solution (0:44)
II. Wide functionality (1:43)
III. No access to your data (03:53)
IV. Balance of flexibility and simplicity (5:35)
V. Commercial services (7:55)

Free and open-source solution

First, Zabbix is a free and open-source solution covered by General Public License (GPL) v2. This means that the Zabbix source code is readily available and can be redistributed or modified. With this in mind, you can always create your own version of Zabbix, if you’re willing to play around with the source code or have a great idea on how to improve the product.

Zabbix software properties

There are no paid versions of Zabbix, no paid functionality, and no hidden costs. You can monitor any number of devices and define your own data retention policies at no cost at all.

All of the latest features are absolutely free and available in the latest version of Zabbix. You can visit zabbix.com, click the Download button, choose the platform that is best for you and install Zabbix packages on it. Zabbix can be deployed on any kind of environment, be it a virtual machine, physical servers, cloud environments, or even a Docker container. After you have downloaded Zabbix, you are ready to go ahead with the latest Zabbix feature set.

Selecting platform to install Zabbix n Zabbix.com/download

Rich feature set

Zabbix is a fully enterprise-ready product with a wide set of features that you can use to achieve any of your monitoring tasks. As a tool, Zabbix is not focused on any single thing, offering users extreme flexibility. For instance, you can monitor Windows or Linux machines agentlessly or opt-in to install a Zabbix agent on them. On the other hand, to monitor network devices, SNMP monitoring might be the easiest approach. All it takes to start monitoring your end-points is creating an item, specifying the metric that you want to monitor together with the data collection interval, and you are good to go.

Configuring SNMP monitoring parameters

After we have collected the data, we can configure our problem thresholds (also known as triggers in Zabbix) by navigating to Configuration > Hosts > Triggers. Triggers are definitions of our problem thresholds, where you can define a problem threshold, when do you consider your metric to be within that threshold and how do you recover from the problem.

There is a wide array of so called trigger functions – these allow us to define thresholds in different ways. For example, we can analyze the last received value, averages, minimum and maximum values over some time, look for a specific string in a value and much, much more!


We also need to define a way of reacting to a problem – should we receive an e-mail if something goes wrong? Or maybe we want to try and remediate the issue automatically by executing a command or a script? This is where the so-called Actions come in. Actions are based on and/or conditions, that allow you to very granularly define how you’re going to react to a particular problem.

For example, you might define an action that states “If the Trigger name contains ‘SNMPSim’ send an email or a mobile text message to our Network administrator. If the problem still persists after 10 minutes, execute a locally stored script that should fix the problem.

Trigger actions

Once you have defined your items, triggers and actions, it’s time to present this information in a user-friendly fashion. For this, you can create a set of multi-page dashboards where you can see all of your collected data by utilizing different dashboard widgets together with a list of active problems,

display the collected metrics on graphs and provide an overview of your infrastructure state on network maps.

The dashboard is completely dynamic and interactive — you can zoom in on any point in time in your graphs, create interactive map hierarchies, navigate to different sections of Zabbix and much more.

Zabbix also supports SLA monitoring for your IT business services. You can define your IT service trees, link them to existing triggers and have access to different SLA related views.

Configuring and monitoring SLA

Inventory collection and storage is also natively supported by Zabbix. You can collect any inventory information from your devices – your device serial numbers, locations, software versions and much more. This can be done in many different ways – the inventory information can be captured from the collected metrics, populated manually or updated by using the Zabbix API. This information can be used to access different inventory views and group your devices based on the collected inventory data.

You own your data

There are many different ways to deploy Zabbix. You can navigate to zabbix.com/download page and select the installation method that fits your requirements. For Zabbix packages you have the option to choose the required Zabbix version, select from multiple operating systems – from the Red Hat Enterprise Linux to Raspberry Pi, as well as the specific OS version, the database backend, and the web server backend. After everything is selected, you will be presented with a comprehensive list of commands that you can use to get Zabbix up and running in minutes.

Zabbix Packages

If you are interested in cloud deployments then you can also run Zabbix in many different cloud environments, such as AWS, Microsoft Azure, Google Cloud, DigitalOcean, Linode, Red Hat OpenShift, Oracle Cloud or Yandex Cloud. All of these options offer full Zabbix functionality with native cloud images.

Zabbix Cloud images

Docker images are also available for different Zabbix components. You can run a single component in a container or deploy the whole Zabbix architecture in a containerized environment. The Docker hub page contains a comprehensive list of environment variables and examples of how to deploy container images with a single command.


The quickest way to deploy Zabbix, especially in a PoC environment, would be the Zabbix Appliance. Zabbix Appliance is a virtual machine image with all of the Zabbix components already pre-configured for you. Simply download the image for the hypervisor of your choice, deploy it and you are good to go.


The Zabbix source code is also available for download for different Zabbix versions. This approach is useful for more exotic environments, where installing via packages is not an option.

Zabbix Sources

Agents are available for download via packages, but if packages is not an option, you can always download the precompiled agents for many different operating systems, including Windows.

Zabbix agents

No matter which option you choose, Zabbix LLC never has any access to your configuration or history data. You are fully in control of your deployment and the data in it. This way you have the guarantee that your data belongs only to you.

Balance of flexibility and simplicity

A good monitoring solution should be simple and approachable even for users that are not experts in monitoring, Linux system, scripting and any other DevOps-related skills. However, simplicity usually comes with at a cost of functionality. If the tool focuses too much on simplicity, it would inevitably restrict the end-users in the set of functionality that they have available for them.

Zabbix provides a balance of simplicity and flexibility. While the amount of features in Zabbix may seem daunting at first, the flexibility it provides is the key benefit of Zabbix. With Zabbix, you can easily extend the out-of-the-box monitoring approaches with your custom monitoring methods. If you have in-house applications specific to your company, you can always extend the Zabbix monitoring functionality and create your own custom checks or use scripts or commands to collect the data. This way you can define custom methods not only for data collection, but also use scripting for robust automatic issue remediation.

This gives you a huge variety of features that you can utilize in Zabbix either by using out-of-the-box templates or defining your own custom checks. All of this can be done within a single central frontend.

Even if you’re monitoring 50 branches in different countries within one Zabbix installation, a Zabbix administrator will be able to maintain and change the configuration — add new items, triggers, etc. Zabbix is also a great fit for multi-tenant environments. The robust permission and role schema enable you to define multiple Zabbix administrators that can have granular access to monitoring entities within their organization.

Commercial services

Open-source solutions are great as you can download the product at any time, irrespective of your goals and use them for both small home lab environments and large enterprise infrastructures. Similar to many open-source solutions, Zabbix also has a large and passionate international community of users ready to help you out on the official forums, different social networks, Zabbix subreddit and other communication channels.

If this not sufficient and you’re still feeling overwhelmed by all of the available features and require additional help to deploy your environment with best practices in mind – this is where the Zabbix commercial services come into play.

Commercial services

  • Zabbix team offers multiple commercial services, starting with a multiple-tier technical support. With technical support services, Zabbix experts will have your back and help you with fixing any issues and answer all of your questions 24/7.
  • Zabbix team also offers consulting services, where you can address any topic that you wish to discuss to Zabbix experts — how to deploy Zabbix and start monitoring your infrastructure, whether Zabbix is able to cover all of your needs, receive help with tuning Zabbix configuration and much more.
  • Turnkey solutions allow you to engage Zabbix professionals and build everything from scratch with best practices and scalability in mind.
  • Zabbix team can lend you a hand with Template building services for your custom in-house application.
  • The Zabbix team will document all of the performed steps, so you can have a clear view of what has been done and what was the reason behind it. You can utilize this knowledge down the line to learn and be able to follow the best practice approaches on your own.
  • Upgrade procedures can be extremely stressful – you may be worried about minimizing downtime, following your organizational SLA’s or maybe you simply aren’t sure how to properly perform an upgrade. Once again, the Zabbix team can do this for you, document it and guide you through the process so you can learn from it and do it yourself in the later versions.
  • Need help with troubleshooting an ongoing issue? Then the remote troubleshooting services are for you. Zabbix team can help you get to the bottom of any issues you may have with your Zabbix architecture.

Zabbix is an extremely fast-growing enterprise-ready project with a vast set of functionality trusted by global brands, capable to support collection of hundreds of thousands of metrics with real-time 24/7 data analysis, powerful visualization options, robust permission schema, out of the box reports and the ability to tailor the tool to your specific needs.

If you have never tried Zabbix, this might be the perfect moment to visit zabbix.com, click Download, and download Zabbix on your local test environment and try to monitor a couple of hosts to get acquainted with the product. I am sure that you’re going to be more than satisfied with the results!


How to upgrade to Zabbix 5.2

Post Syndicated from Dmitry Lambert original https://blog.zabbix.com/how-to-upgrade-to-zabbix-5-2/12872/

Zabbix recently released the new 5.2 version with awesome new features overviewed in the video, such as hashicorp vault, IoT monitoring, improved performance, granular permission system, and much more. The upgrade to the latest Zabbix 5.2 is fast and easy.

Contents

I. Upgrade Zabbix on CentOS 8 (0:45)
II. New in Zabbix 5.2 (2:26)
III. Upgrade procedure (3:39)
IV. Conclusion (9:51)

Upgrade Zabbix on CentOS 8

To upgrade the existing Zabbix instance installed on CentOS 7, it is recommended to migrate to CentOS 8 first as currently there are no official packages available of CentOS 7 for Zabbix 5.2. Since there is no clean way to upgrade CentOS installation, it is recommended to create a new server on CentOS 8 and then migrate your database and spin up Zabbix Server there. CentOS 7 is old and has limited packages in the repositories, which are not updated anymore. Even if you use all the latest software and packages from the official repo, it will not be enough to successfully run all of the functionality of Zabbix 5.2. For instance, TLS 1.3 will not be available, as well as database encryption.

If you run the default frontend and default server from the packages, and if you don’t have any customization patches, any custom functionality, or edited PHP source code that you want to save, then the upgrade is straightforward.

New in Zabbix 5.2

To find out what we can expect after the upgrade, on the Zabbix documentation page for the 5.2 release, go to Installation > Upgrade notes for 5.2.0.

  • The minimum required PHP version has been upped from 7.2.0 to 7.2.5, which might be an issue on CentOS 7.
  • User roles. Now you can assign different roles to your existing users through your existing permission system will not be broken.
  • Time zone definition. If you are running your frontend with multiple virtual hosts, you can delete all of those and configure everything natively in the frontend.
  • Refreshing unsupported items setting has been removed from Administration > General > Other, with the item update interval now used for each unsupported item.
  • Template screens converted to dashboards with the screens to be set up in the dashboards now as widgets of template dashboards.
  • The session of the Zabbix frontend is now stored in a cookie.

If you upgrade, you will still have to log in to the frontend providing the username and password.

Upgrade procedure

In the Zabbix documentation page, open Upgrade procedure > Upgrade from packages > 1 Red Hat Enterprise Linux/CentOS, where the upgrade notes are available, which are helpful if you’re upgrading from the old version.

1. Stop Zabbix server.

# systemctl stop zabbix-server

2. Back up the existing Zabbix database. It is very important as there is no rollback functionality. If you can’t test the upgrade in the dev environment, it is recommended to backup the database.

3. Back up configuration files, PHP files, and Zabbix binaries.

Configuration files:

# mkdir /opt/zabbix-backup/
# cp /etc/zabbix/zabbix_server.conf /opt/zabbix-backup/
# cp /etc/httpd/conf.d/zabbix.conf  /opt/zabbix-backup/

PHP files and Zabbix binaries:

# cp -R /usr/share/zabbix/ /opt/zabbix-backup/
# cp -R /usr/share/doc/zabbix-* /opt/zabbix-backup/

This step is optional if you have an official frontend, official server, etc., without any patches or customizations. In this case, you can download the required official files for Zabbix 5.2 from the sources or install them from the repository as a package in case is something goes wrong.

4. Update repository configuration package. To proceed with the upgrade, you need to update your current repository package, especially if you don’t have packages for Zabbix 5.2 yet.

# rpm -Uvh https://repo.zabbix.com/zabbix/5.2/rhel/8/x86_64/zabbix-release-5.2-1.el8.noarch.rpm

Then you can run:

# yum clean all

and

# yum makecache

to make sure that the repository will be picked up. Then you’ll see the new packages of Zabbix 5.2.

Metadata cache created

These commands are not mandatory, but otherwise, you could upgrade your repository and then find out that the Zabbix 5.2.0 upgrade package is ‘not found’.

5. Upgrade Zabbix components. If you’re new to Zabbix and this is your first upgrade, you don’t need to do anything manually, run any database upgrade scripts, manually change or adjust the schema of the database, or do whatever else. All you have to do is upgrade your packages:

# yum upgrade zabbix-server-mysql zabbix-web-mysql zabbix-agent

NOTE. You can substitute the elements of this command depending on the software actually installed.

Type ‘-y‘ to automatically confirm everything. After the update is complete, you can check the installed version by running:

# zabbix_server -V


To upgrade the web frontend with Apache on RHEL 8 correctly, also run:

# yum install zabbix-apache-conf

NOTE. Type ‘y’ when asked for confirmation.

Now all you have to do to start the upgrade automatically is run:

# systemctl start zabbix-server

Then check the log file of the Zabbix server:

# tail -f /var/log/zabbix/zabbix_server.log

or

# less /var/log/zabbix/zabbix_server.log

After starting the new 5.2 binary, you will see in the log file that the current database version is 5.0, while the required mandatory version is 5.2. That’s why the Zabbix server package will start the automatic database upgrade.

Now we need to run:

# systemctl restart httpd php-fpm

as those were still running while we were upgrading the packages.

Then you need to log in as cookies are stored differently.

In the frontend, you’ll see the updated version and new features, such as new roles we can add in Administration > User roles.

User roles

6. Review component configuration parameters. Make sure to see the upgrade notes for details on mandatory changes.

7. Start Zabbix processes.

# systemctl start zabbix-server
# systemctl start zabbix-proxy
# systemctl start zabbix-agent
# systemctl start zabbix-agent2

Conclusion

This was everything required for the installation to run successfully. The process is straightforward if you don’t have any complicated customizations of your frontend, Zabbix server binaries, etc. Though in production, it is recommended to test installation out in the dev environment and make backups.

I definitely recommend you to try out the newest Zabbix 5.2.

Thanks for your attention! Like, comment, subscribe!


Why Zabbix throttling preprocessing is a key point for high-frequency monitoring

Post Syndicated from Dmitry Lambert original https://blog.zabbix.com/why-zabbix-throttling-preprocessing-is-a-key-point-for-high-frequency-monitoring/12364/

Sometimes we need much more than collecting generic data from our servers or network devices. For high-frequency monitoring, we need functionality to offload сore components from the extensive load. Throttling is the exact thing that will allow you to drop repetitive values on a Pre-processing level and collect only changing values.

Contents

I. High-frequency monitoring (0:33)

1. High-frequency monitoring issues (2:25)
2. Throttling (5:55)

Throttling is available since Zabbix 4.2 and is highly effective for high-frequency monitoring.

High-frequency monitoring

We have to set update intervals for all of the items we create in Configuration > Host > Items > Create item.

Setting update interval

The smallest update interval for regular items in Zabbix is one second. If we want to monitor all items, including memory usage, network bandwidth, or CPU load once per second, this can be considered a high-frequency interval. However, in the case of industrial equipment or telemetry data, we’ll most likely need the data more often, for instance, every 1 millisecond.

The easiest way to send data every millisecond is to use Zabbix sender — a small utility to send values to the Zabbix server or the proxy. But first, these values should be gathered.

High-frequency monitoring issues

Selecting an update interval for different items

We have to think about performance, as the more data we have, the more performance issues will arise and the more powerful hardware we’ll have to buy.

If the data grabbed from a host is constantly changing, it makes sense to collect the data every 10 or 100 milliseconds, for instance. This means that we have to process this changing data with the triggers, store it in the database, visualize it in the Latest data, as every time we receive a new value.

There are values that does not have that trend to change very frequently, but without Throttling we would still collect a new value every milisecond and process it with all our triggers and internal processes, even if the value does not change over hours.

Throttling

The greatest way to solve this problem is through throttling.

To illustrate it, in Configuration > Hosts, let’s create a ‘Throttling‘ host and add it to a group.

Creating host

Then we’ll create an item to work as a Zabbix sender item.

Creating Zabbix sender item

NOTE. For a Zabbix sender item, the Type should always be ‘Zabbix trapper’.

Then open the CLI and reload the config cache:

zabbix_server -R config_cache_reload

Now we can send values to the Zabbix sender, specifying IP address of the Zabbix server, hostname, which is case-sensitive, the key, and then the value — 1:

zabbix_sender -z 127.0.0.1 -s Throttling -k youtube -o 1

If we send value “1” several times, they all will be displayed in Monitoring > Latest data.

Displaying the values grabbed from the host

NOTE. It’s possible to filter the Latest data to display only the needed host and set a sufficient range of the last values to be displayed.

Using this method we are spamming the Zabbix server. So, we can add throttling to the settings of our item in the Pre-processing tab in Configuration > Hosts.

NOTE. There are no other parameters to configure besides this Pre-processing step from the throttling menu.

Discard unchanged

Discard unchanged throttling option

With the ‘Discard unchanged‘ throttling option, only new values will be processed by the server, while identical values will be ignored.

Throttling ignores identical values

Discard unchanged with a heartbeat

If we change the pre-processing settings for our item in the Pre-processing tab in Configuration > Hosts to ‘Discard unchanged with a heartbeat‘, we have one additional Parameter to specify — the interval to send the values if they are identical.

Discard unchanged with a heartbeat

So, if we specify 120 seconds, then in Monitoring > Latest data, we’ll get the values once per 120 seconds even if they are identical.

Displaying identical values with an interval

This throttling option is useful when we have nodata() triggers. So, with the Discard unchanged throttling option, the nodata() triggers will fire as identical data will be dropped. If we use Discard unchanged with heartbeat even identical values will be grabbed, so the trigger won’t fire.

In simpler words, the ‘Discard unchanged‘ throttling option will drop all identical values, while ‘Discard unchanged with heartbeat‘ will send even the identical values with the specified interval.

Watch the video.