Post Syndicated from Brian van Baekel original https://blog.zabbix.com/monitoring-juniper-mist-wireless-network/19093/
As Premium Zabbix partner, Opensource ICT Solutions is building Zabbix solutions all over the world. That means we have customers with a broad variety of requirements, thoughts on how to monitor things, which metrics are important and how to alert upon it. If one of those customers approaches us with a question concerning a task the likes of which we have never done before, it’s a challenge. And we love challenges! This blog post will cover one such challenge that we solved some time ago.
Quanza is a leading infrastructure operator offering a broad portfolio of services to completely take over the management of networks, data centers and cloud services. With more than 70 colleagues and at least as many specializations, everyone at Quanza works towards the same goal: designing, building, and operating an optimal IT infrastructure. Exactly like you would expect it… and then some. Quanza understands that you prefer to focus on your own innovation. By continuously mapping out your wishes, Quanza provides customized solutions that keep your network up and running 24×7. Today and in the future.
With a relentless focus on mission-critical environments, often of relevance to society, Quanza has an impressive line-up of customers. Some enterprises that chose to partner up with Quanza are SURF, Payvision, the Volksbank, and the Amsterdam Internet Exchange (AMS-IX), one of the world’s largest internet hubs.
Recently, customers started asking Quanza to embed Juniper MIST products for wired and wireless networks in their service portfolio. In order to fully support the network’s lifecycle (build, operate and innovate), the Juniper MIST products will need to be monitored by their 24×7 NOC. This is where we came into play, with our Zabbix knowledge.
We quickly decided to combine the knowledge Quanza has of the Juniper MIST equipment and API and our Zabbix knowledge to build the best possible monitoring solution.
SNMP or cloud?
The Juniper MIST solution is a cloud-based solution that provides a single pane of management for Juniper Networks products. As it’s cloud-based, it’s not a “traditional” network solution. As such, SNMP is not an option for device monitoring as they are communicating only with “the cloud” and we cannot access them directly like we used to do with traditional network equipment.
So, we started to investigate other options. One of the most common options right now is talking to some sort of API and pulling the metrics from that API. With Zabbix “HTTP agent” item key, this is no problem at all. Unfortunately, that’s not how the MIST API works. It’s pushing data instead of letting you pull it (actually, it does – but this doesn’t scale at all). Now, the Zabbix HTTP Agent item type allows trapping, but only in a specific Zabbix sender format. Of course, the MIST API does not allow that.
This means we have a problem. SNMP is not available. Pulling data is not a viable, scalable option. Pushing the data is an option, but Zabbix does not understand that.
Since we are not talking about some sort of proprietary monitoring tool which is completely closed and way too static, there is always a solution with Zabbix as long as you’re creative enough.
Getting data into Zabbix
We needed some middleware. Something that was able to receive that data from MIST and convert it into something that we can push into Zabbix.
That’s exactly what we did. We, together with Quanza, built a middleware that uses an API token to authenticate against the MIST API endpoint. Once the authentication is successful, the middleware is allowed to subscribe to certain “channels”. These channels provide event and performance data. You can compare it with MQTT, where a subscription to channels/topics is needed to get the information you are interested in.
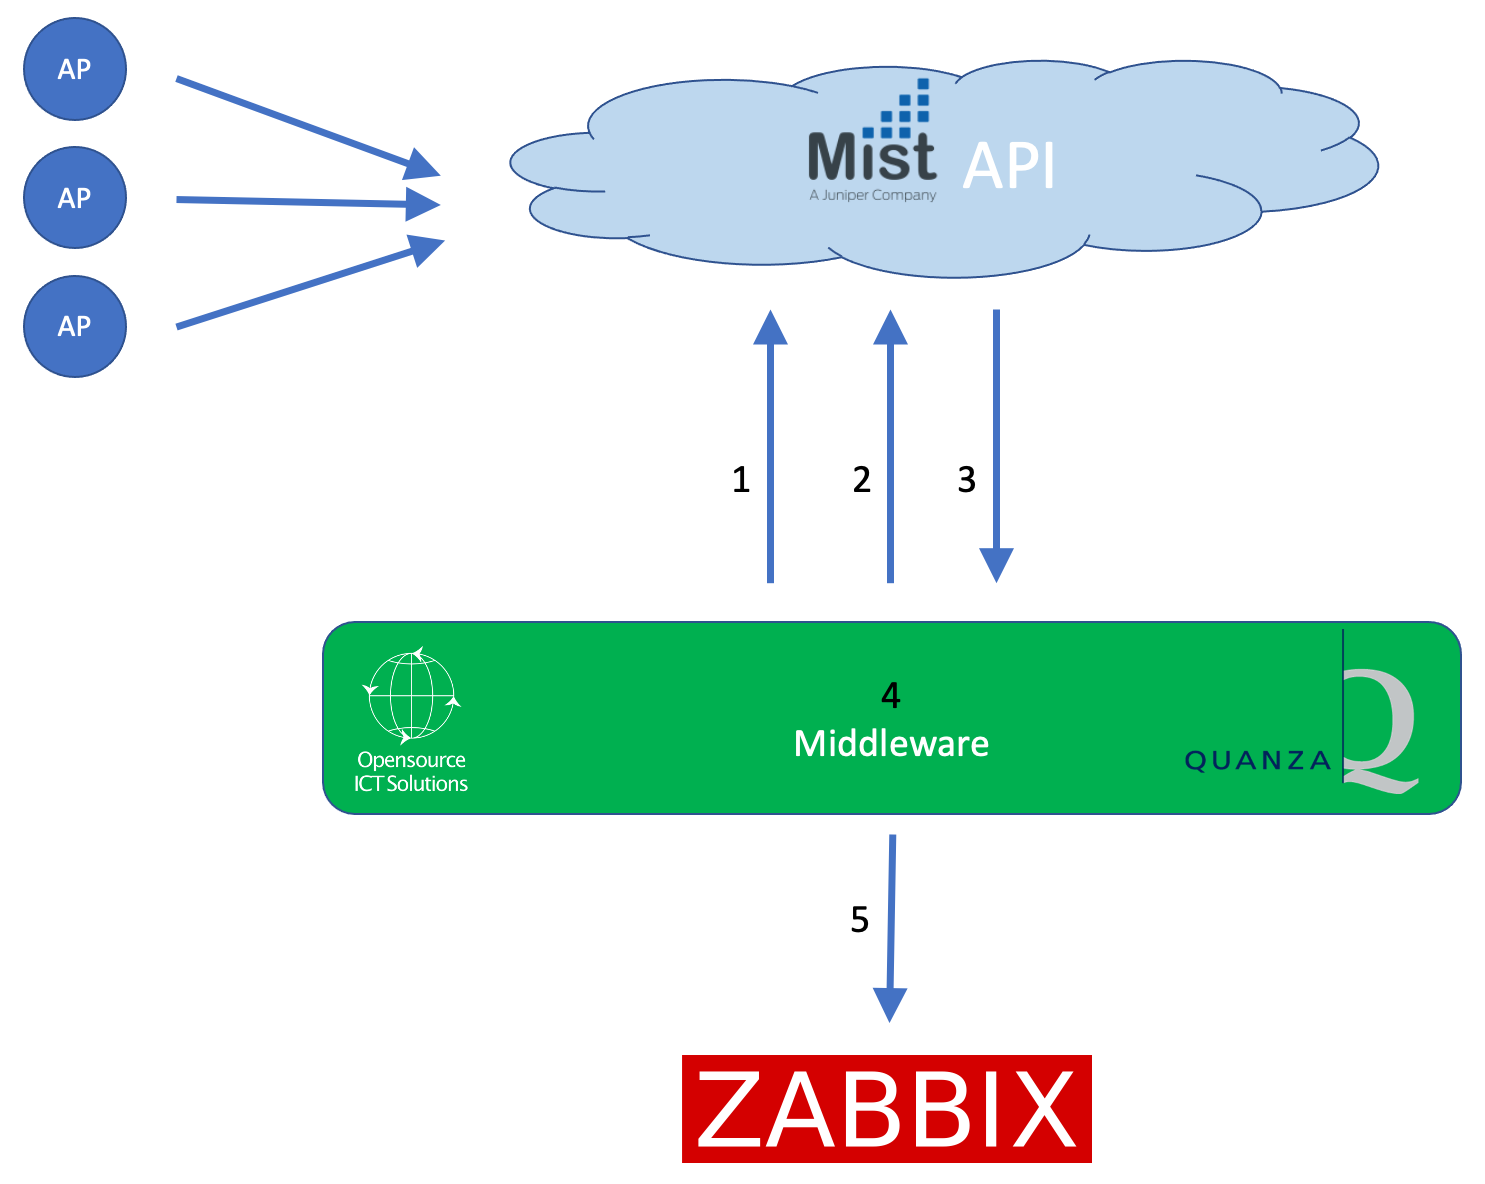
- Step 1: Authenticate using an API token.
- Step 2: Subscribe to channels
- Step 3: Receive performance and event data
- Step 4: Filter out only the relevant (performance) data for Zabbix
- Step 5: Push into Zabbix
Once we had this in place, the MIST part was finished. We had our data and were able to push it into the monitoring solution.
Parsing in Zabbix
So, right now we have the data available for Zabbix. Time to find a neat way to use it. As the environments (both inventory and the types of equipment that are used) might be dynamic, we definitely do not want to apply any manual work to monitor newly added sites/equipment.
That means that low-level discovery rules are pretty much the only viable solution.
Here we go:
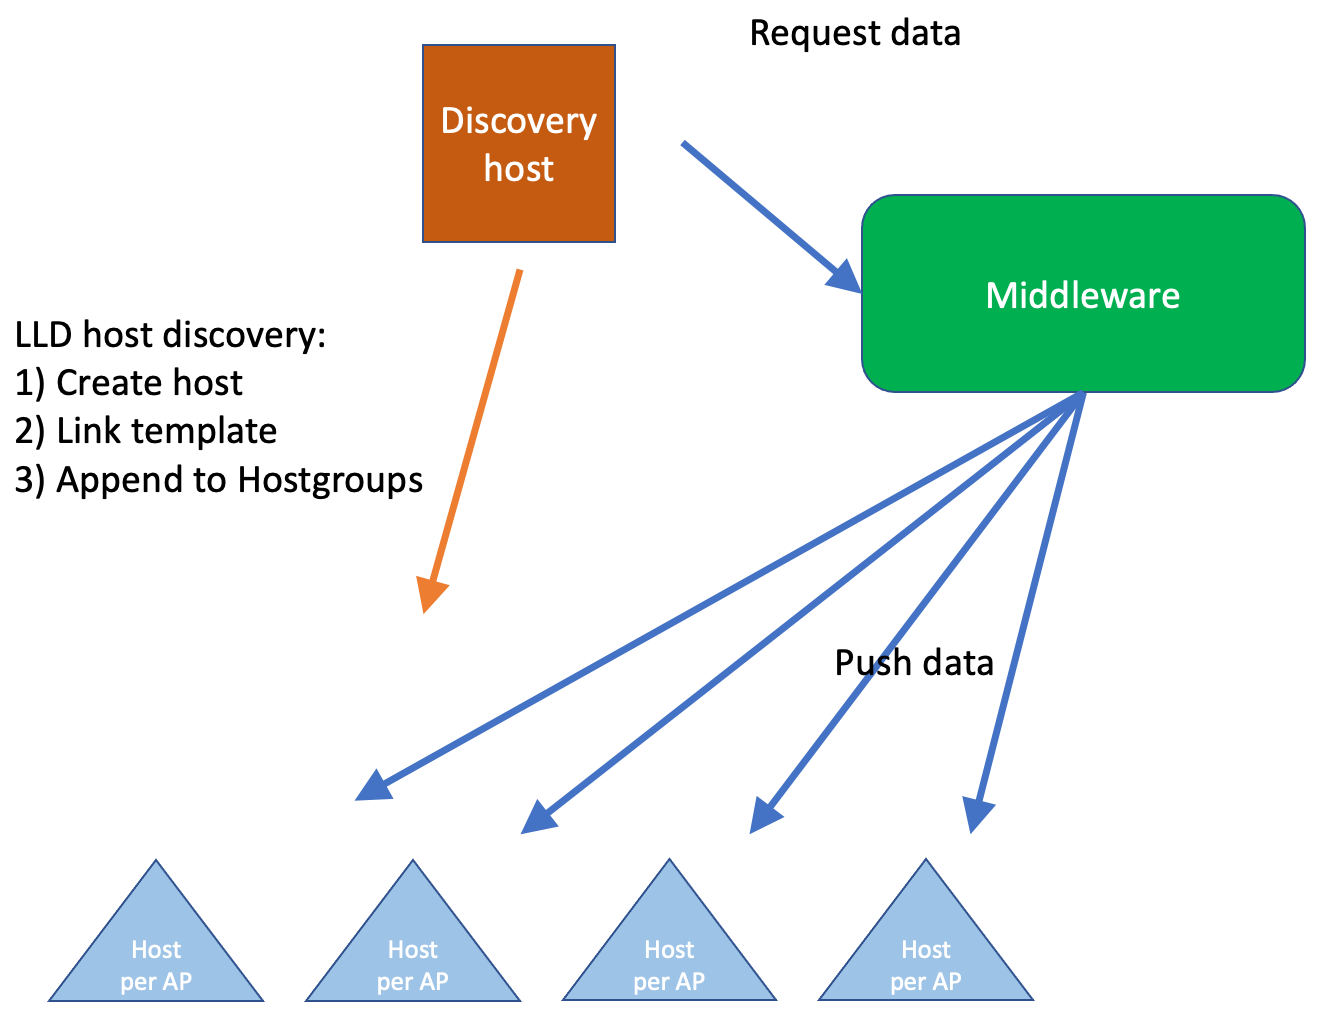
Within Zabbix, we configure 1 host (the Discovery host) and apply a template on that host, with exactly 1 LLD rule: Query our middleware, and based on the information received, create new hosts (Host prototypes).
The data that is received looks like this:
{
"NODEID":"<NODEID>",
"NAME":"AP-<SITE>-<NUMBER",
"SITENAME":"<SITENAME>",
"SITEID":"<SITEID>",
"MAC":"<MAC ADDRESS>",
"ORGNAME":"<ORG NAME>"
},
Those new/discovered hosts will have the names of the AP and corresponding organization and location (in Mist: site). We also link a template to the discovered host and add it to a Host group with the variables we’ll need later, such as the organization, site name, siteID etc.
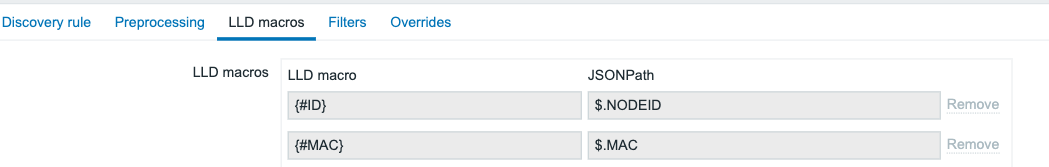
So, We need to parse those JSON elements. Luckily Zabbix provides, within the LLD rule config the option to parse this into LLD macros, so for example the Node id is parsed into {#ID} with the use of JSONPath $.NODEID:
Once this process is complete, we have a new host per AP. Of course, there is no data on that host and querying the middleware or Mist is a bad idea. Scalability will be extremely problematic with more than a few organizations and sites configured in the Mist environment. As we’re building this with a big network integrator, scalability is a thing and we do not want to risk having a noticeable performance impact by using polling.
How about pushing data from the middleware into Zabbix? Once the data is received from Mist by the middleware, it’s parsed, filtered and then it pushes out whatever must be pushed out to Zabbix. We decided the best option is to push per host as we have those already available in Zabbix.
Now we should ensure two things:
-
- do not overwhelm Zabbix with data being pushed in
- Getting all the data with the least number of ‘pushes’ into Zabbix
Again, the flexibility of Zabbix is extremely useful here. On the AP hosts, there is a template with exactly 1 trapper item: receive performance data. From there, everything will be handled by the Zabbix ‘Master/Dependent’ item concept. We then extract data like temperatures, CPU load, memory usage, etc.
At the same time, we receive data regarding network usage (interface statistics) and radio information. As we do not know upfront how many network interfaces and radio’s there are on a particular Access Point, we do not want to hard-code such information. Here we are combining the concept of low-level discovery with dependent items (The following blog post covers the logic behind such an approach: Low-Level Discovery with Dependent items – Zabbix Blog)
Using ‘low-level discovery with dependent Items’, all relevant items are created ‘dynamically’ in such a way that a change on the MIST side (for example a new type of Access Point) doesn’t require changes on the Zabbix side. Monitoring starts within minutes and you’ll never miss any problem that might arise!
Just to give you an idea of the flow:
The Master Item gets a JSON format like this (and we’ve parsed only a small portion here) pushed into it from the middleware:
{
"mac":"<MAC ADDRESS>",
"model":"<MODEL>",
"port_stat":{
"eth0":{
"up":true,
"speed":1000,
"full_duplex":true,
"tx_bytes":37291245,
"tx_pkts":169443,
"rx_bytes":123742282,
"rx_pkts":779249,
"rx_errors":0,
"rx_peak_bps":14184,
"tx_peak_bps":5444
}
},
"cpu_util":2,
"cpu_user":652611,
"cpu_system":901455,
"radio_stat":{
"band_5":{
"num_clients":<CLIENTS>,
"channel":<CHANNEL>,
"bandwidth":0,
"power":0,
"tx_bytes":0,
"tx_pkts":0,
"rx_bytes":0,
"rx_pkts":0,
"noise_floor":<NOISE>,
"disabled":true,
"usage":"5",
"util_all":0,
"util_tx":0,
"util_rx_in_bss":0,
"util_rx_other_bss":0,
"util_unknown_wifi":0,
"util_non_wifi":0
}
"env_stat":{
"cpu_temp":<CPU TEMP>,
"ambient_temp":<AMBIENT TEMP>,
"humidity":0,
"attitude":0,
"pressure":0
}
}
Within the Master item, we’re basically not parsing anything, it’s just there to receive the values and push them into the Dependent items. In the dependent items, we start “cherry-picking” only those metrics that we would like to see. As it’s JSON format, preprocessing step “JSONPath” comes in handy. At the same time, we’re looking into efficiency, so a second step is added: discard unchanged with heartbeat (1d):
Example: Getting out the statistics of the 2.4Ghz band radio:
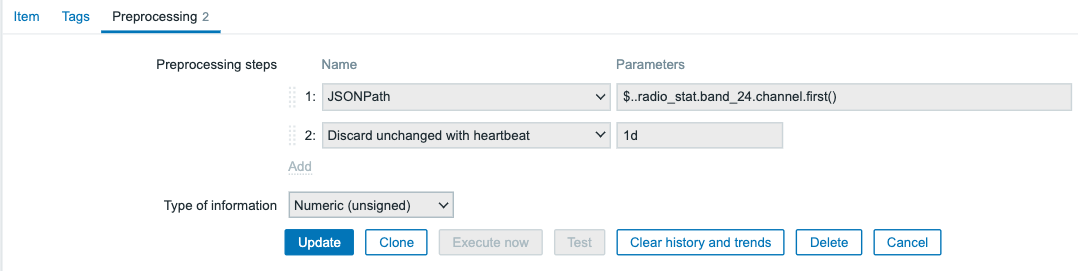
Of course, this has to be done with all items.
So far, we’ve heavily focussed on the technical part, but Zabbix does have quite a few options to visualize the data as well. As we’re waiting on the next LTS release, we have only set up a very small dashboard with a few widgets. One of the better ones:

Here we’re using the new graph type widget, but instead of plotting the number of clients per AP, we’re plotting a dataset with an “aggregate” function. Of course, if we look at the dashboard widgets, there are many more things that can be visualized…
Efficiency and security considerations
As we were building this, we had 2 main considerations:
-
- Efficiency
- Security
Efficiency, as we are anticipating that Quanza will be responsible for quite a few MIST environments on top of the current environments in the near future, combined with a strict limit of allowed API calls against the MIST API. As such, it is really important to keep those API calls as low as possible. Next to that, with every new Access Point added, the load on the Zabbix server is increasing. Now that is not really a problem, as Zabbix is perfectly capable of monitoring thousands of metrics simultaneously, though it has its limits. And you do not want to hit those limits in a production environment with the only solution being migration to beefier hardware.
Security-wise this challenge had a few things going on since we’re talking to an external exposed API. MIST can invoke webhooks. This might’ve been a bit easier (we explored it, but there were of course other things to keep in mind while going down that road), but the main concern was the requirement that Zabbix / an interface to Zabbix is exposed to the internet. That didn’t look too appealing and required a bit more maintenance. The preferable solution was to create that middleware where we have full control of what queries are executed, how the API token is protected, which connections are established etc. etc.
Conclusion
Although this question was challenging, together with Quanza we created a scalable, secure, and dynamic solution. Zabbix is flexible enough to facilitate the tricks required to provide reliable monitoring and alerting in an efficient and secure manner. We strongly believe the only limitation is your own creativity and this case proves that once again.
Quanza can now ensure the availability of their customer Juniper MIST-based networks, and in case something breaks their 24×7 manned NOC will be able to take whatever action is required to ensure the availability of the customers’ network – all thanks to the flexibility of Zabbix.
The post Monitoring Juniper Mist wireless network appeared first on Zabbix Blog.