Post Syndicated from Brian van Baekel original https://blog.zabbix.com/netbox-and-zabbix-an-integration-that-just-fits/31404/

If you are running Zabbix, you know that it can be a tedious job to add hosts, link templates, and (even harder) make sure it is consistent with your CMDB. What if you already have a CMDB? In that case, it means you need to synchronize the CMDB with Zabbix…manually? Of course not!
Before we continue – this blog post and plugin both belong to Opensource ICT Solutions. We specialize in Zabbix (it’s our core business!) and as such try to make a living out of this open-source product. The plugin we will discuss is open source, and as such we do not have a commercial benefit from it – it’s brought to you by us, as a way to give back to the community (and maybe score some consultancy opportunities).
If you are familiar with NetBox already, it’s time to get excited. If you are not familiar with it, NetBox provides a powerful “single source of truth” for managing everything in your network: IP address management (IPAM), data center infrastructure management (DCIM), device inventory, rack layouts, cabling, virtual assets, and more. It’s built under the Apache 2.0 license, so the core software is fully open source, with an active community contributing plugins, integrations, and custom extensions. The platform is highly flexible – you can add custom fields, enforce custom validation and protection rules, integrate via REST and GraphQL APIs, and run multiple automations.
How cool would it be if you could use that in combination with Zabbix, so that if you create a new entity in your CMDB (your single source of truth) and sync that with Zabbix, you could just focus on one product and always can be assured your monitoring is complete?
What are we solving?
Many of our customers use NetBox as their CMDB and Zabbix as their monitoring solution. The challenge they run into is keeping NetBox and Zabbix in sync — a task engineers don’t usually enjoy.
For customers who don’t use a CMDB (or at least not NetBox), there’s always the uncertainty of whether a host in Zabbix has the right templates and macros applied. While Zabbix does allow bulk updates, you still need detailed knowledge of each device’s role to keep things consistent.
NetBox, on the other hand, already stores much richer context about configuration items. A device or virtual machine can have a role, device type, tenant, and even its site or location defined. All that’s missing is a way to leverage this information to make sure those devices are monitored correctly in Zabbix.
On top of that, this approach makes it simple – if a device is registered in the CMDB (and therefore something you’re responsible for), it’s also monitored in the right way. From a project delivery perspective, documentation only needs to be done once, and it ensures that it’s actually done. In short: if it’s not in the CMDB, it’s not monitored — and therefore not our responsibility.
It also means the project delivery engineer(s) don’t necessarily need to know in depth how Zabbix works: as long as they can populate the CMDB – the monitoring will be taken care of automatically.
What did we develop?
In short, a native plugin for NetBox that communicates with the Zabbix API. From there, it will gather information like templates and macros that exist in your Zabbix environment. This is completely API based, so in NetBox you just add an new Zabbix Server and let it synchronize:
At this point, nothing fancy happens. It is just establishing the connection and synchronizing templates, macros, etc. The rest of the configuration is done in your NetBox instance.
How does it look?
|
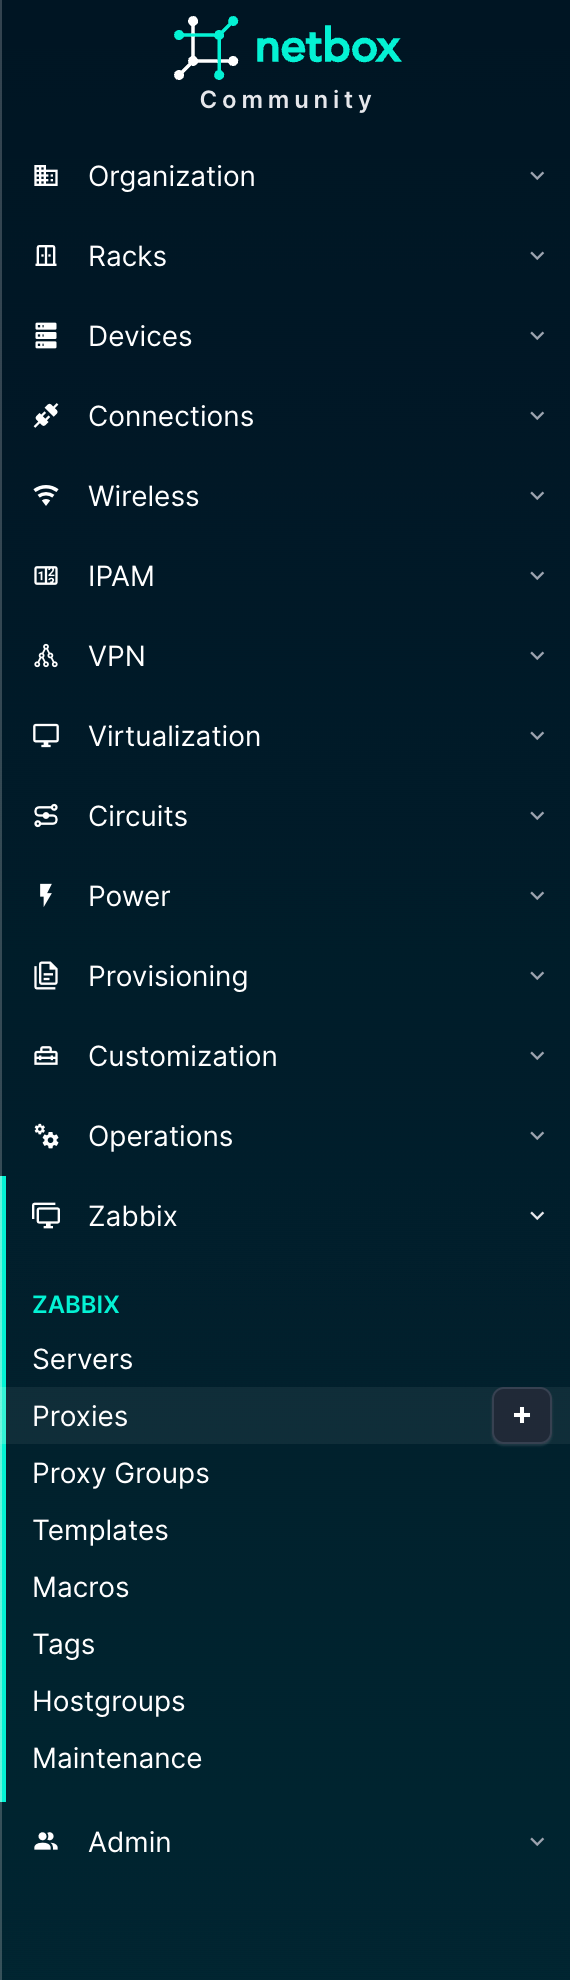
We’ve got the normal/native menu list items from NetBox, and for those familiar with it already the list below shows nothing new except for the “Zabbix” option:
The Zabbix menu is new here and actually gives us control over what is present in Zabbix. The objects here should look familiar if you know Zabbix:
|
|
In the various NetBox native objects, there will be information regarding the Zabbix setup.
Is it available already?
Of course it is, otherwise this blog post would’ve been completely useless! Installation can be done via https://pypi.org/project/nbxsync.
We released our NetBox plugin under the GNU Affero General Public License v3 (AGPL-3.0) because it best protects both our work and the community. Unlike permissive licenses, AGPL ensures that anyone who modifies or extends the plugin must share their changes under the same license, even if the software is only offered as a service. This prevents closed forks, guarantees improvements flow back into the community, and aligns with the collaborative spirit of NetBox and Zabbix.
While AGPL still allows use in commercial environments, it prevents organizations from profiting off private modifications without contributing back. In short, AGPL-3.0 keeps the plugin fair, transparent, and truly open source. This is also the license Zabbix uses, so the community is already familiar with it.
We’ve open-sourced and released the code on our Opensource ICT Solutions GitHub,. and it can be found here: https://github.com/OpensourceICTSolutions/nbxsync
We think documentation is important, as we’ve often been in a situation where we had to discover ourselves how something works due to lack of documentation. We really try to keep you out of that situation and therefor created extensive documentation for this project. Obviously, we can help you when you are lost, but as that costs us time as well it won’t be a free service. The documentation is available here: https://nbxsync.com.
As we think it’s great to work on a project together, we welcome community contributions. However, in order to accept any pull requests, please create an issue on our Github repo first. Please do read our development guidelines and understand that we are more than happy to incorporate suggestions/pull requests if they benefit the wider community.
Can I configure it myself?
Yes. We will assume you’ve got NetBox in place already. If not, please follow the official NetBox documentation to install it: https://netboxlabs.com/docs/netbox/installation/.
As it’s a native plugin, the installation is straightforward and well documented by NetBox: https://netboxlabs.com/docs/netbox/plugins/installation/. In our documentation, we provide the plugin-specific configuration. If this feels daunting, we’re more than happy to assist you with it as part of our consultancy offering.
So, with NetBox in place and the plugin installed, let’s actually walk through the NetBox configuration to give you a feeling of how it works. We will have to configure quite a bit in NetBox as a foundation, which hopefully is done already if you’ve got NetBox implemented in your organization.
In any case, we need to add one or multiple new Zabbix servers. We open the Zabbix menu and click on “Servers” where we add this server:
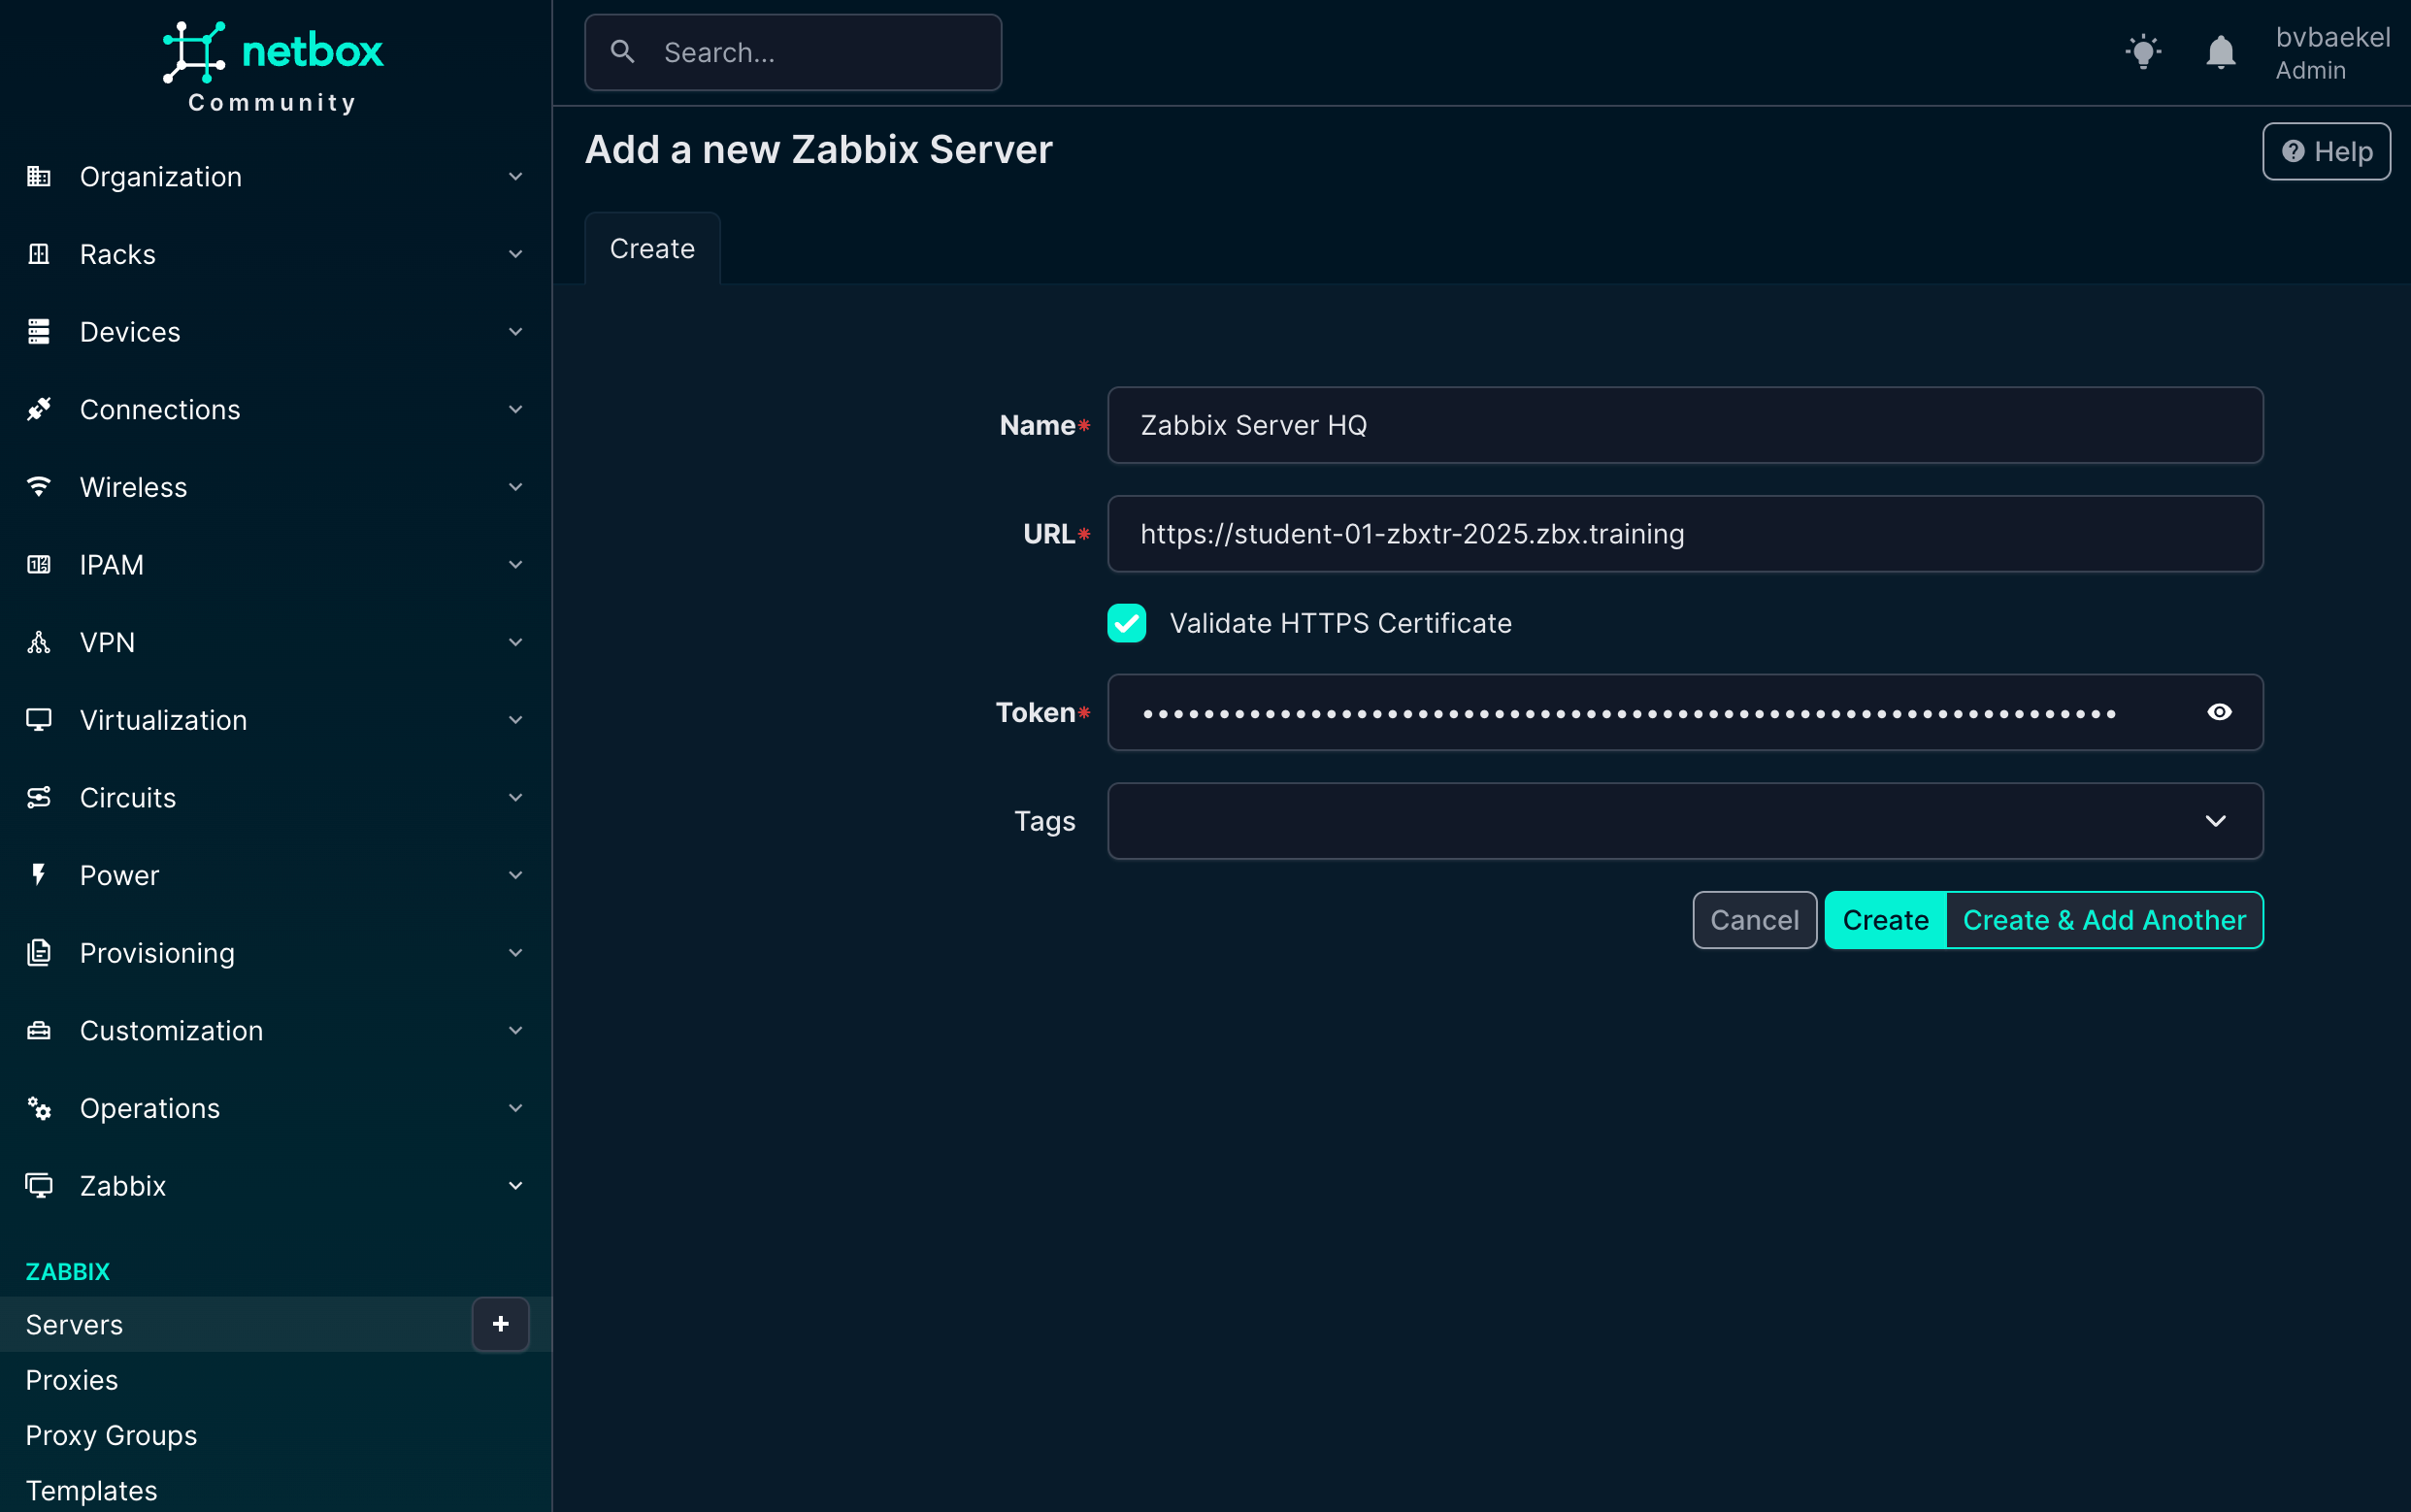
Once added, NetBox will automatically synchronize with the Zabbix server and get the templates out of it, ready to be used! The macros will also get synchronized along with the templates,, so they are also available in NetBox.
NetBox dictates that devices should be in a site, so we start with that. In Organization → Sites we create a new site. A few fields are mandatory and populated in the screenshot below:
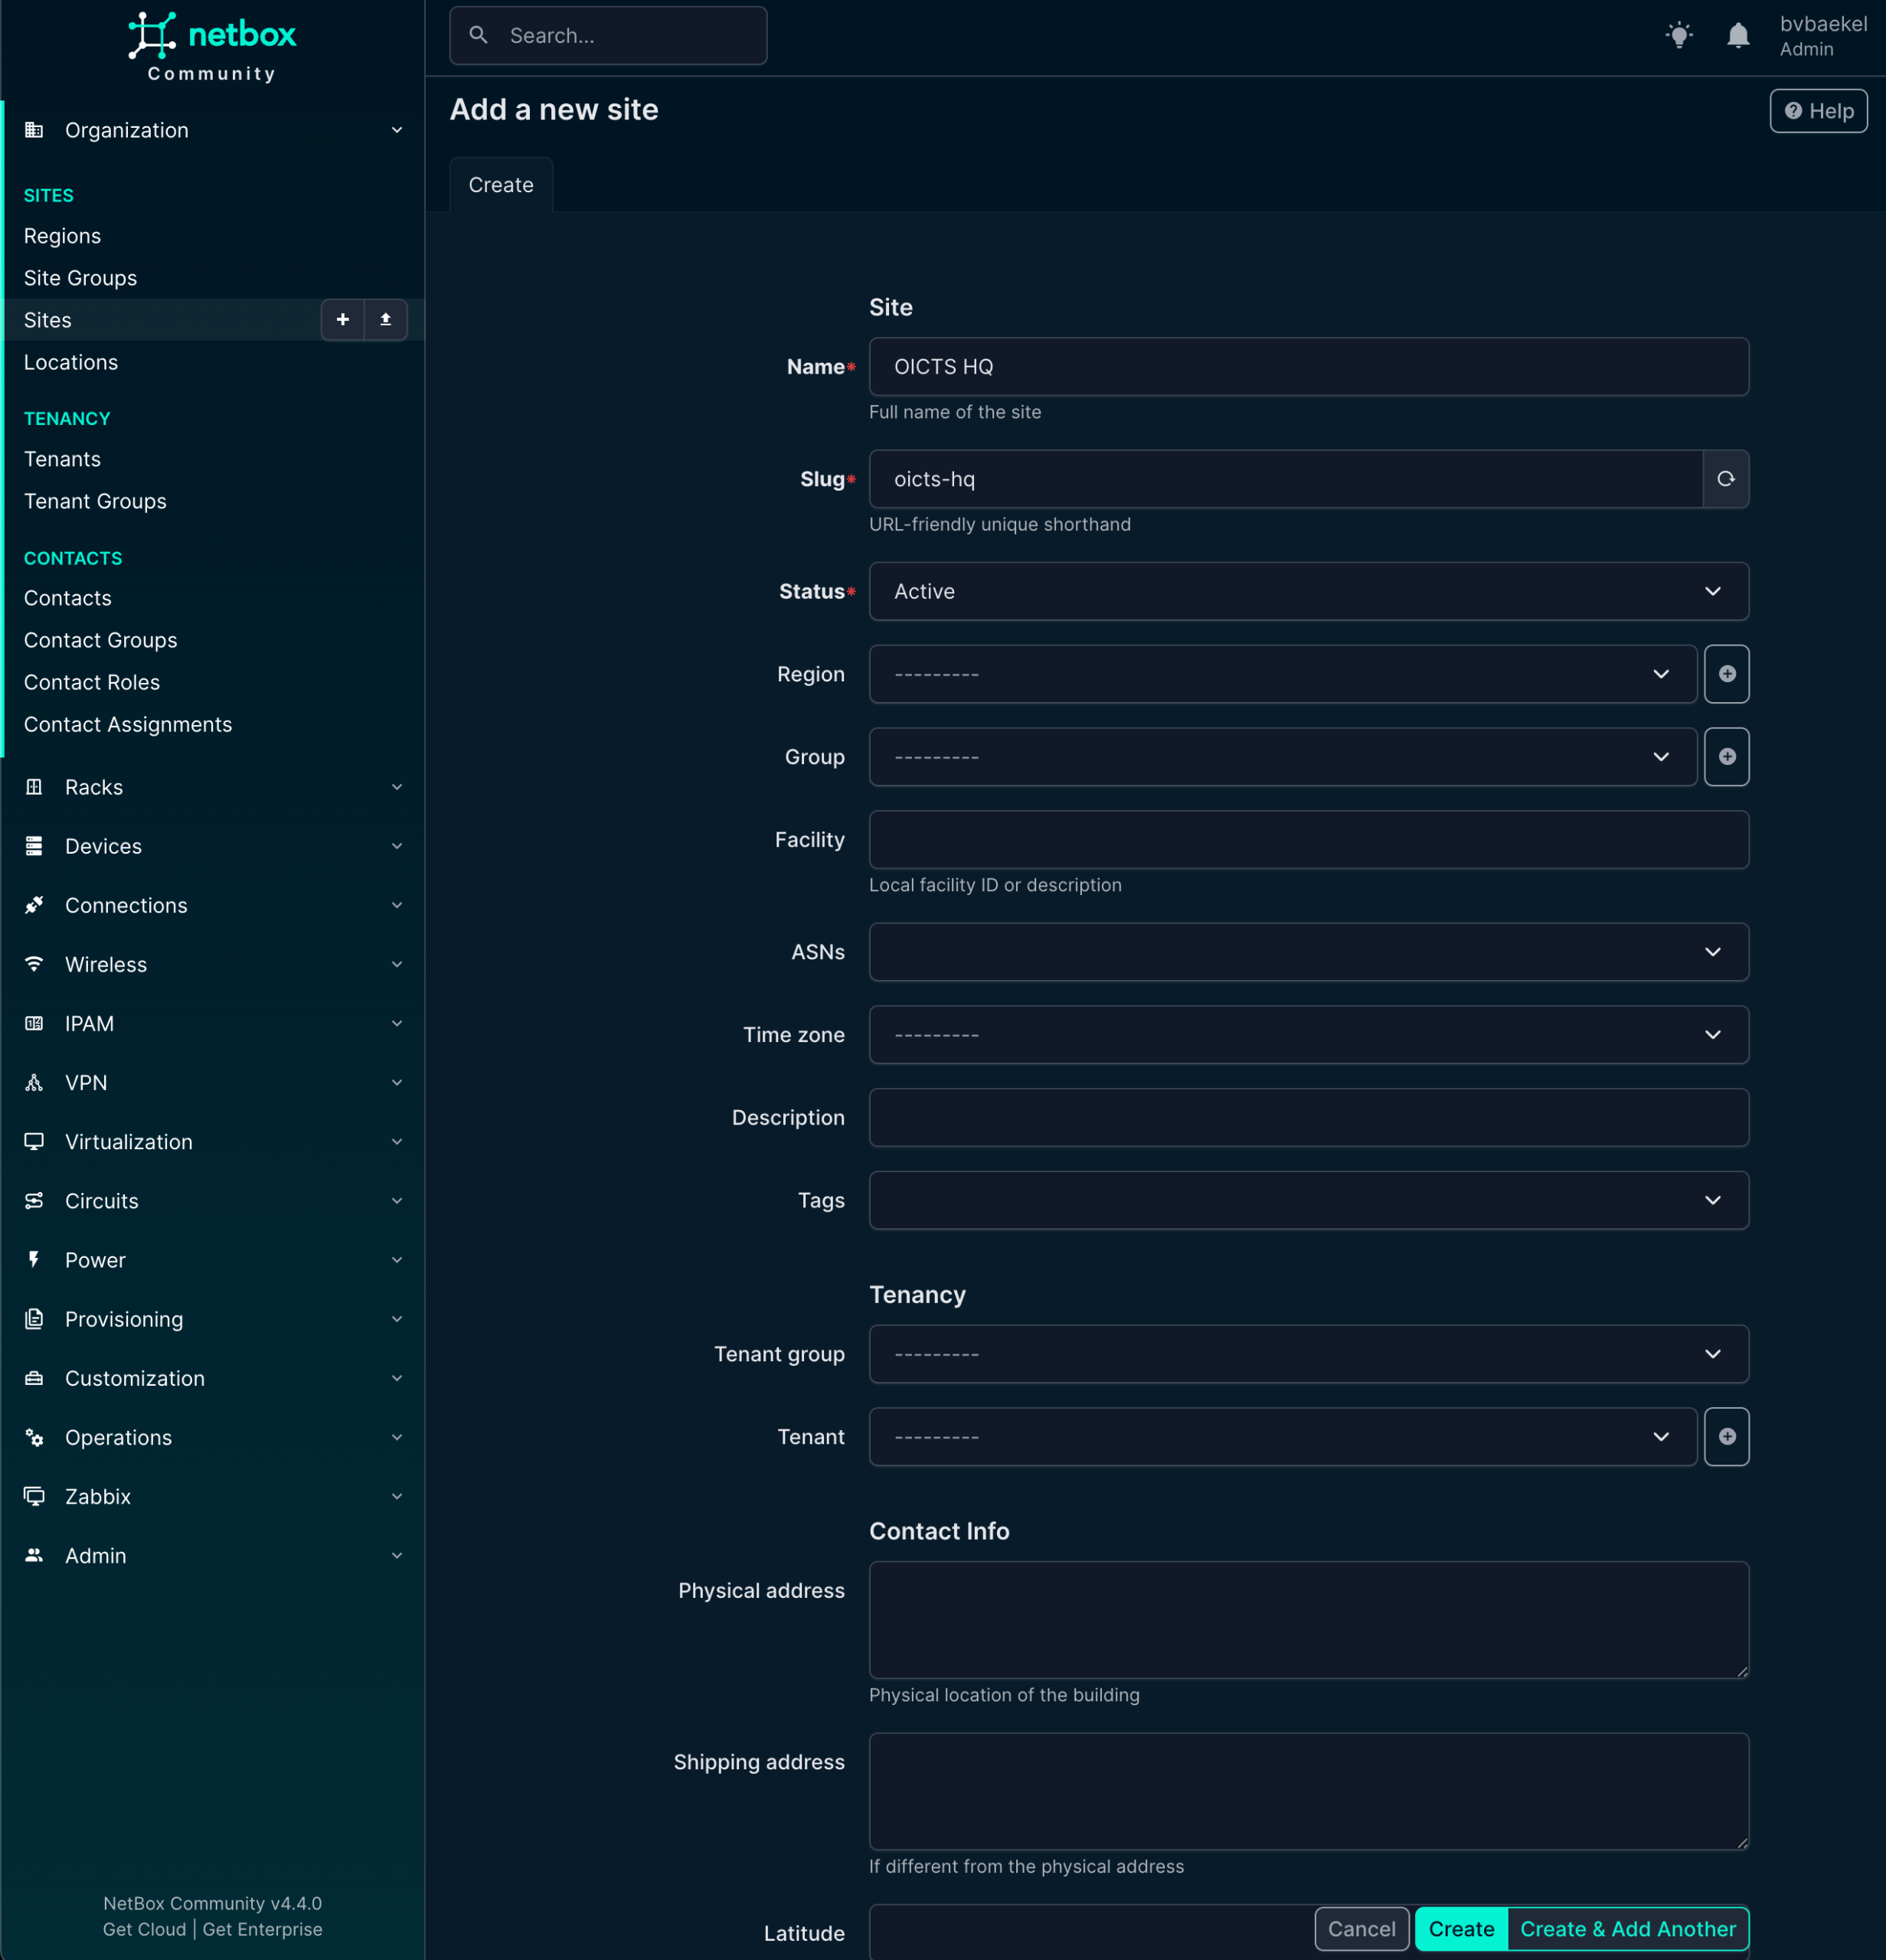
Name, Slug, and Status are mandatory. In a production setup, you probably want to populate some other fields as well, such as Tenant, Region, etc. But we are not writing a NetBox tutorial and as such we will completely ignore that. Once you are done, click on “Create” at the bottom of the configuration.
After the site has been created, it is time to add a Manufacturer under the menu “Devices.”
In this case we will add Cisco as a vendor:
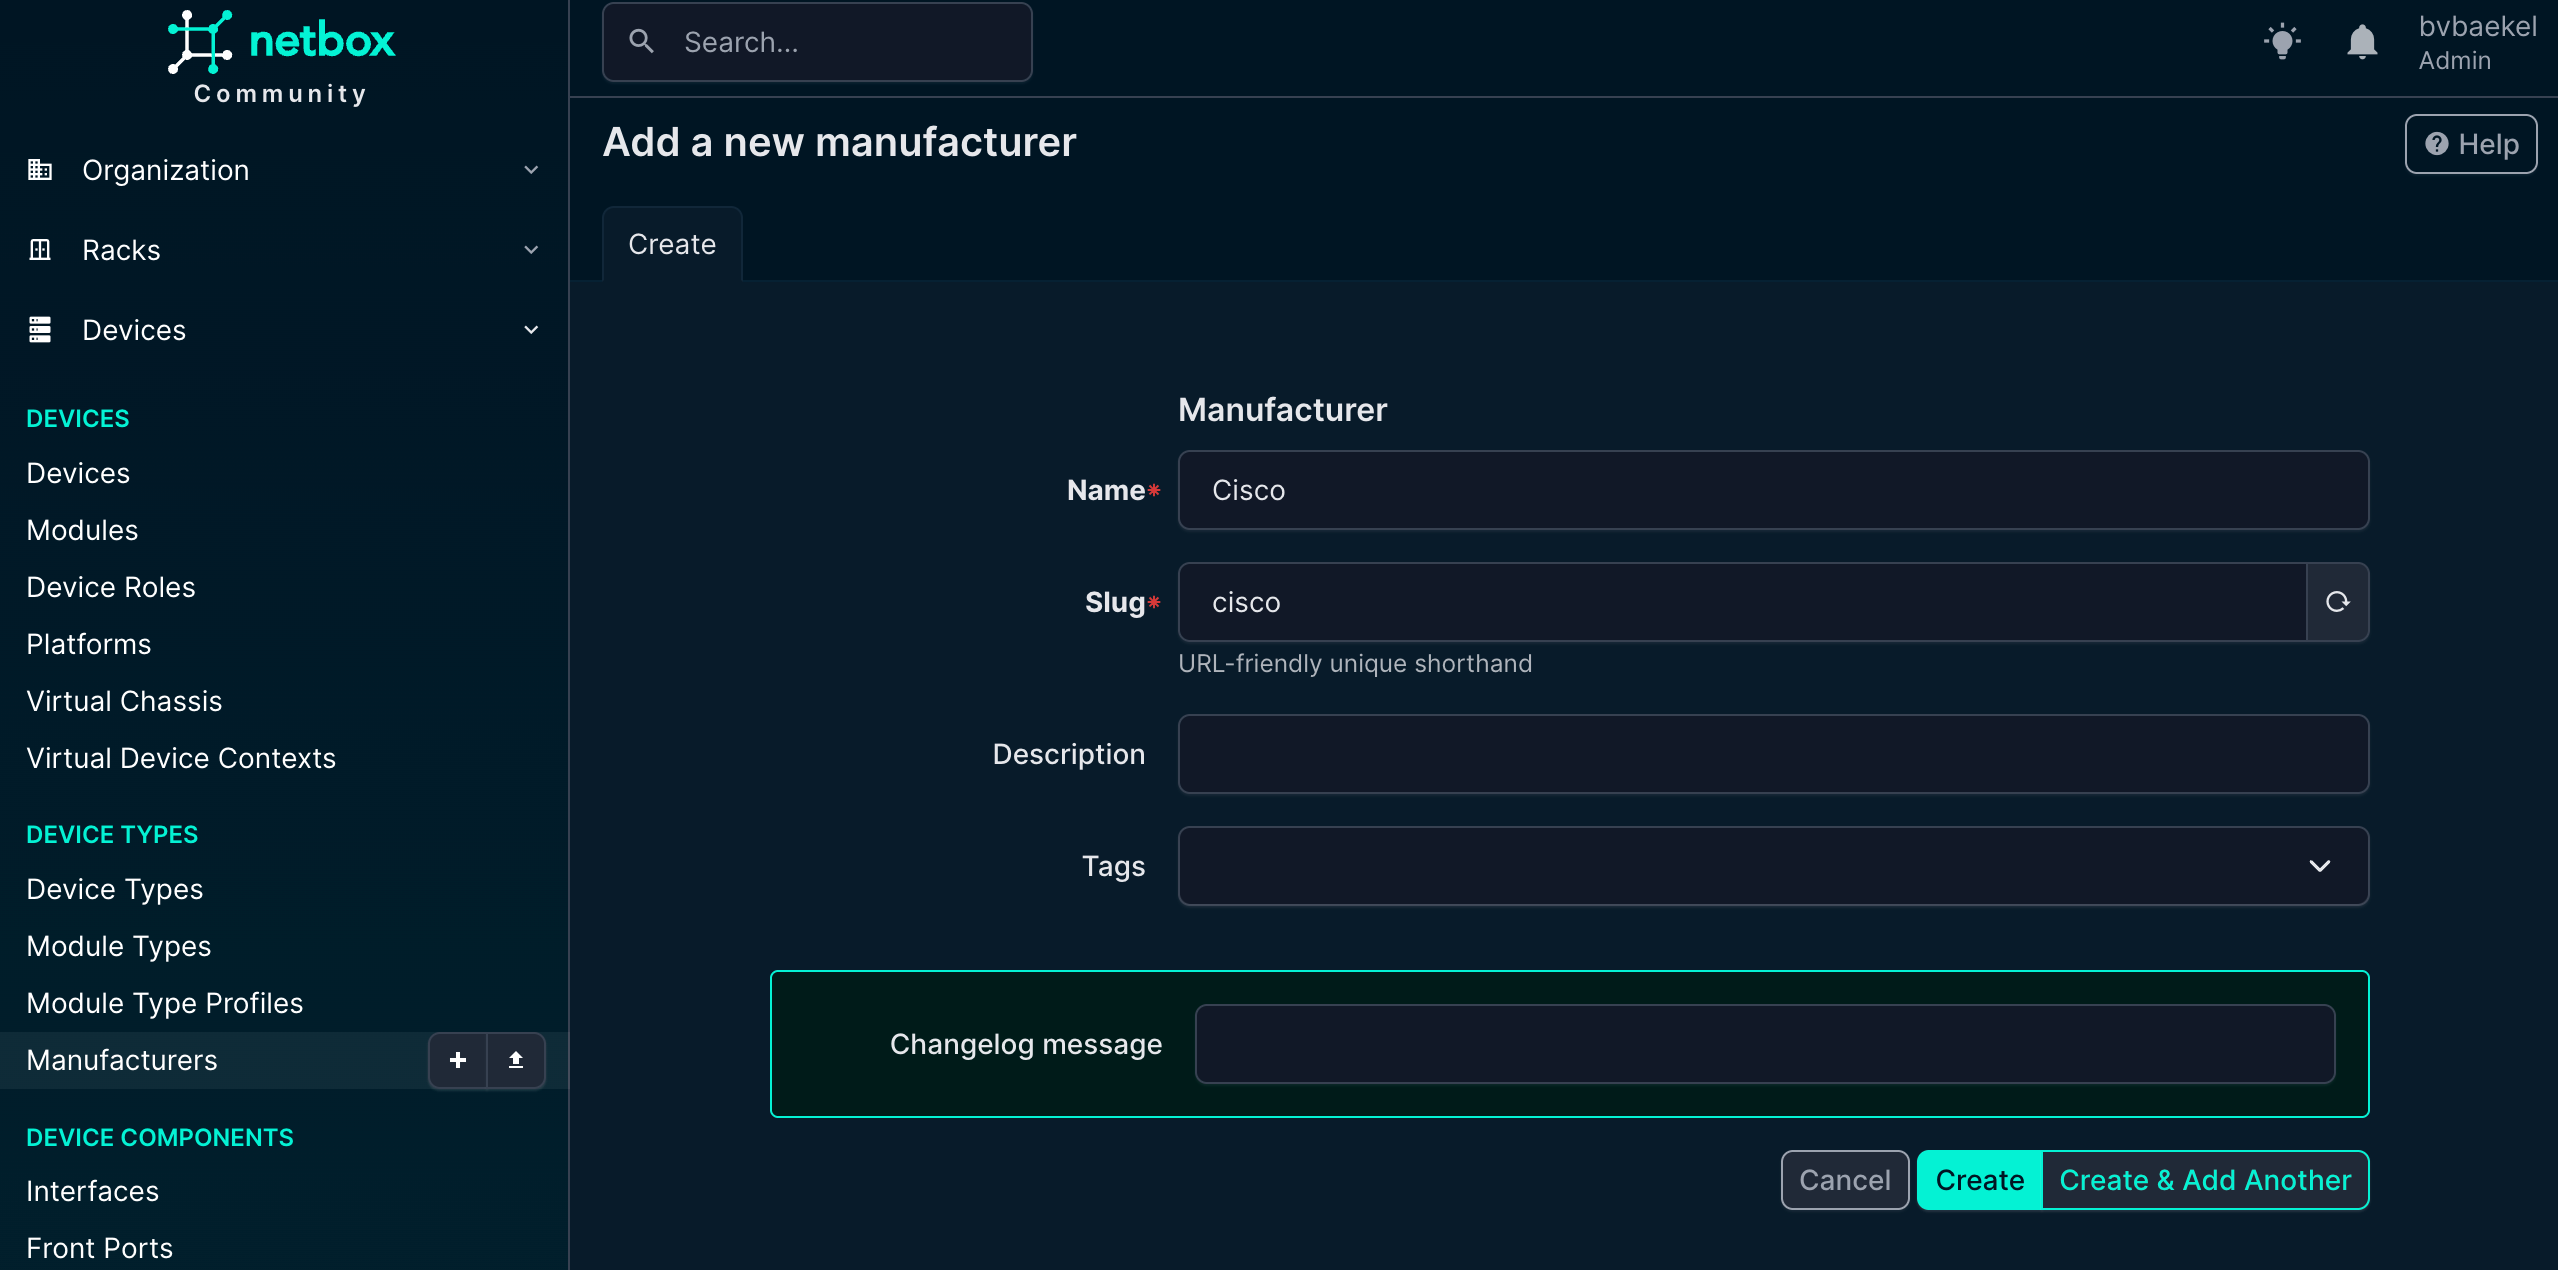
Once done, click on “Create” at the bottom of the configuration. Of course you can (or should) add multiple vendors – all that you actually use!
The next step is device type. In the end, we need to know the vendor, but it is equally important to know what type of device we are monitoring. As such, the next step is to add a device type, again under the main menu “Devices.” As we add in the example, we are going to add a CBS220 switch:
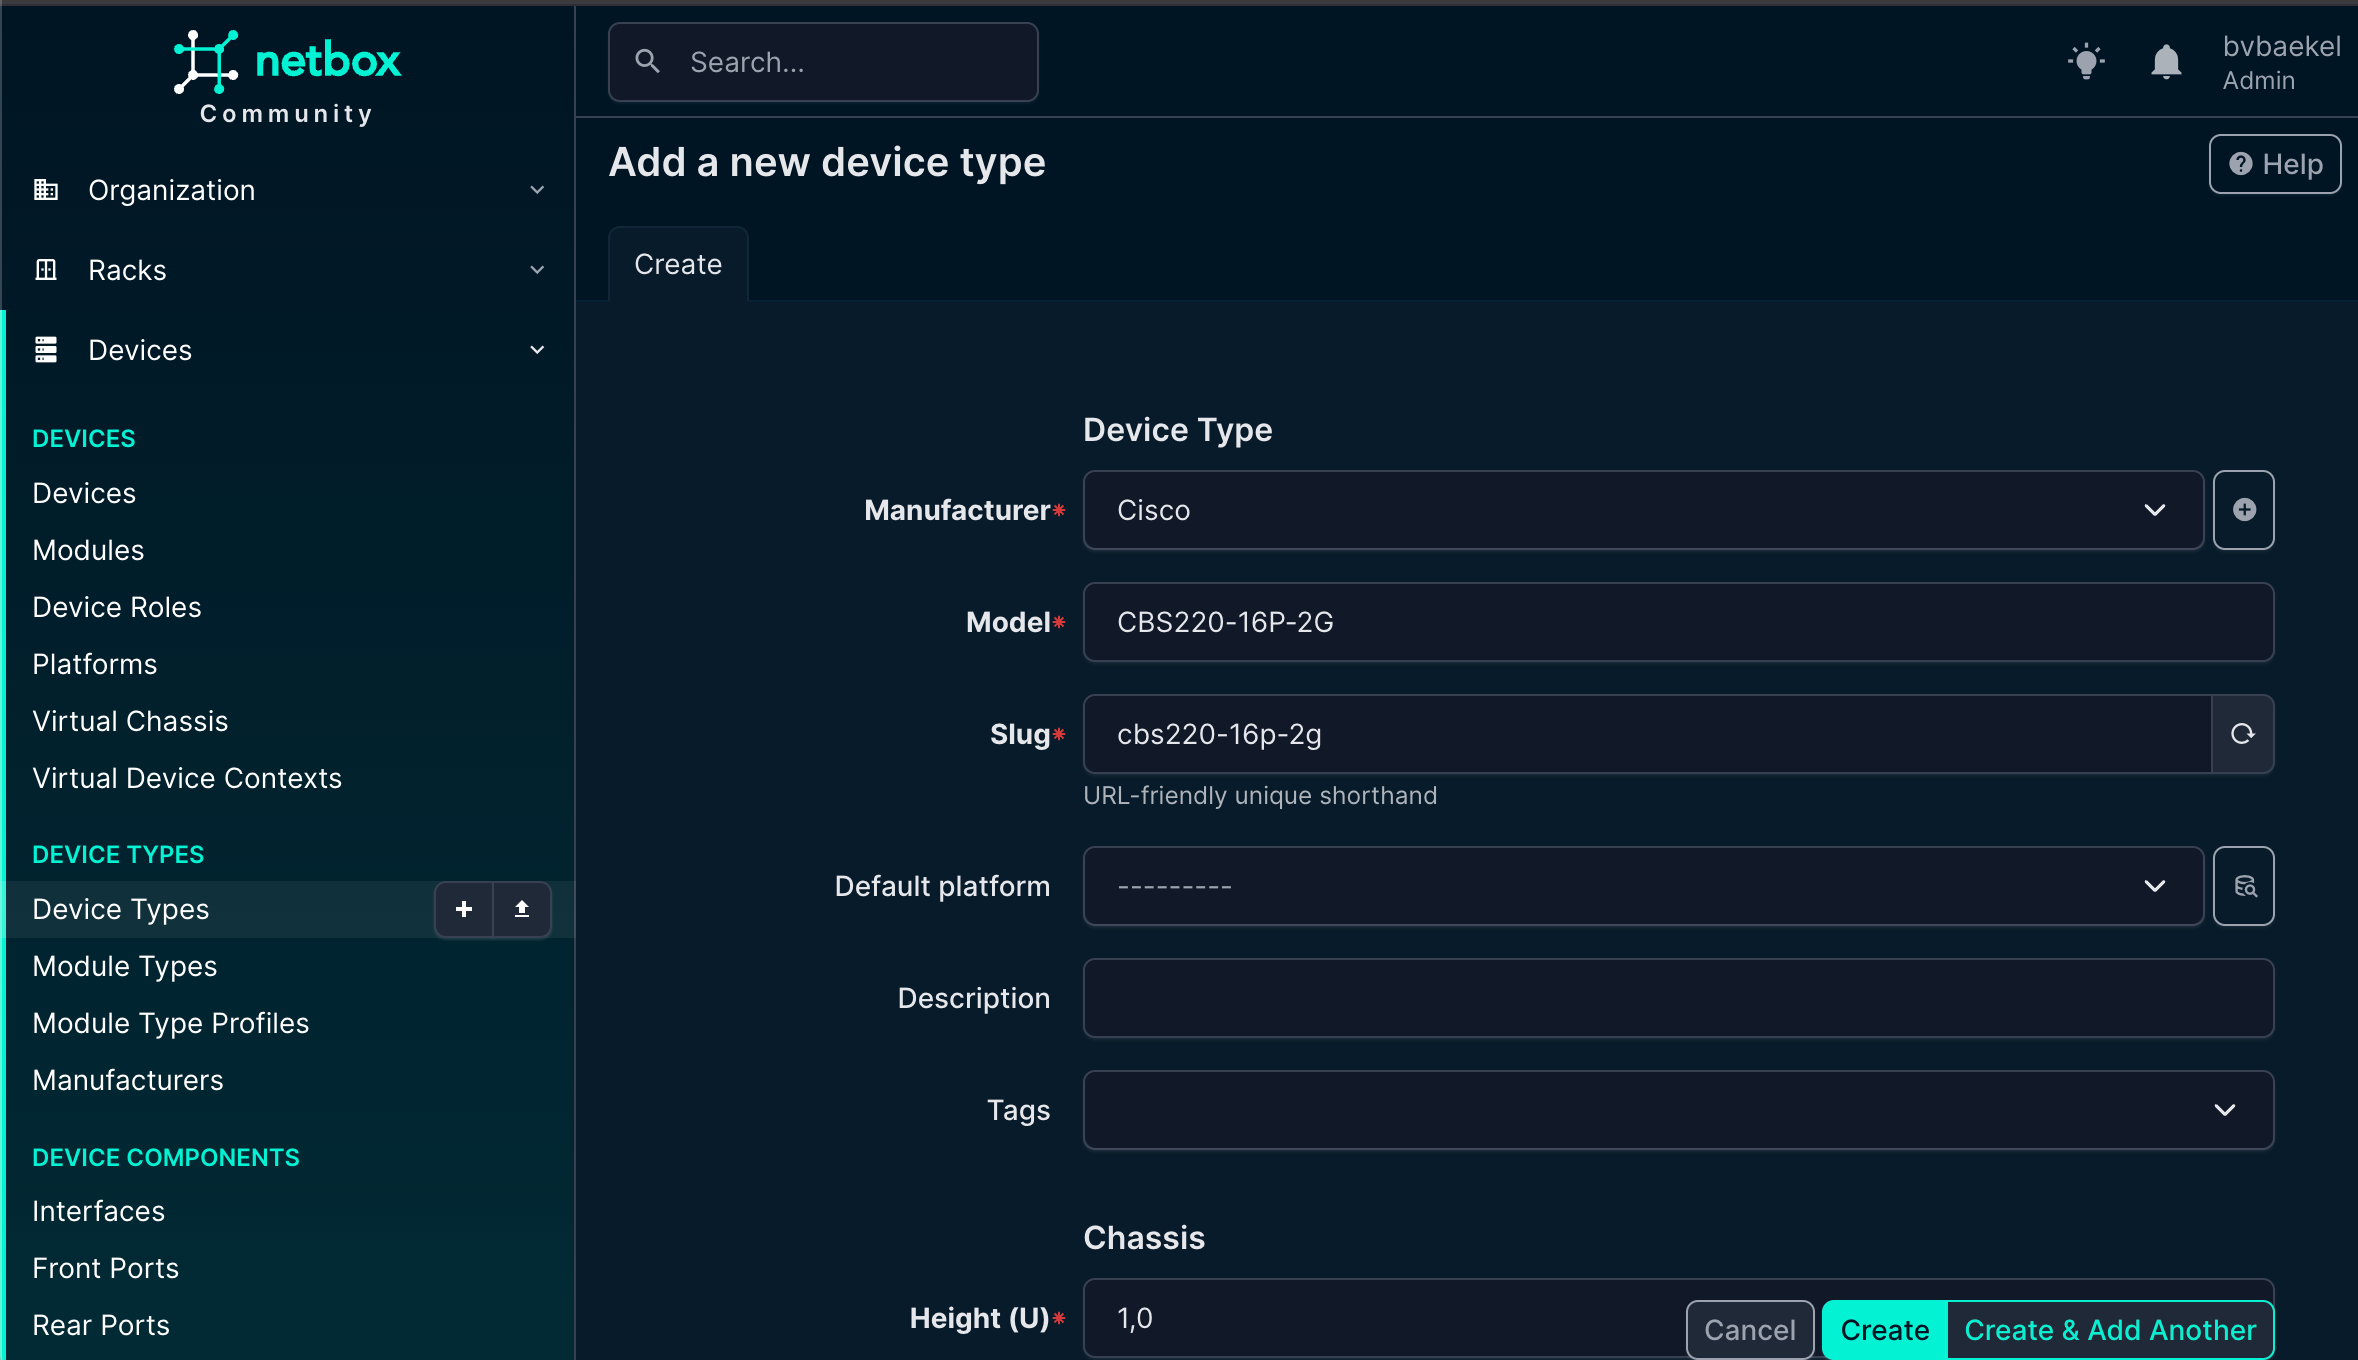
Once again, click on “create” when you are done.
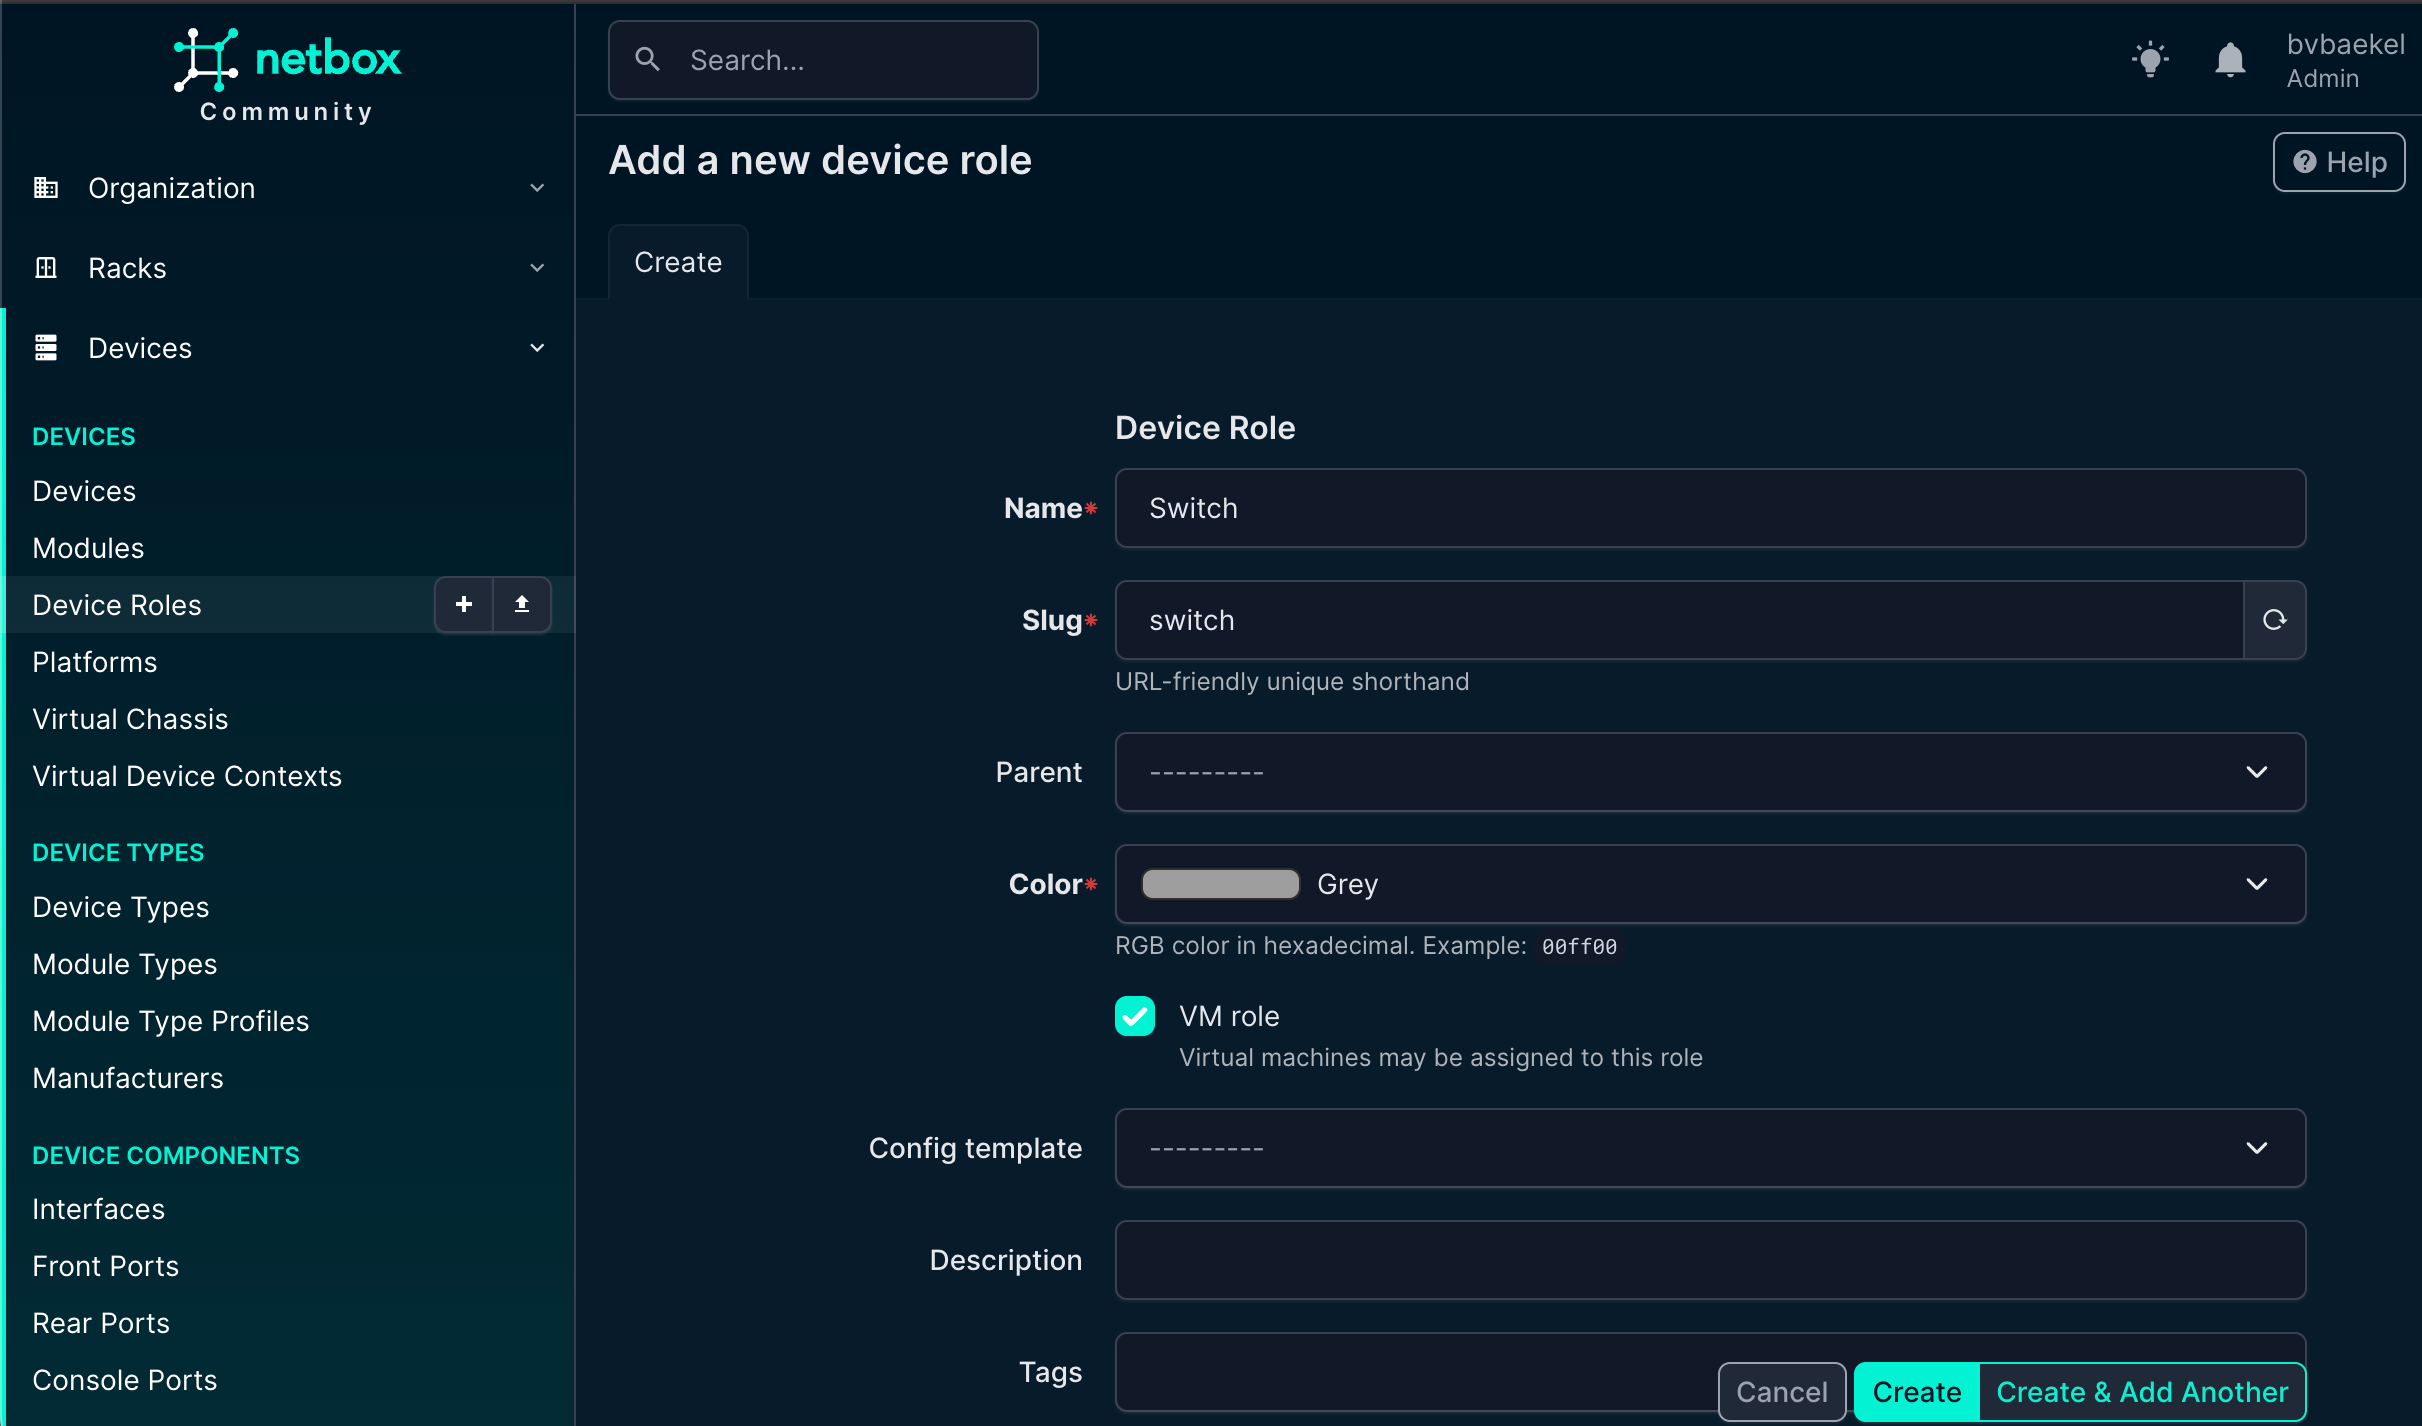
Last but not least, we need to add a device role. The device role is an important attribute because it helps us clearly define the function of the device within the network. By categorizing devices based on their role (such as router, switch, firewall, server, or access point) we create a structured overview that makes it much easier to manage, monitor, and troubleshoot the environment. Assigning roles also ensures consistency, improves documentation quality, and allows us to quickly identify the purpose of each device in larger infrastructures.
We go to “Devices” → Device roles and from there:
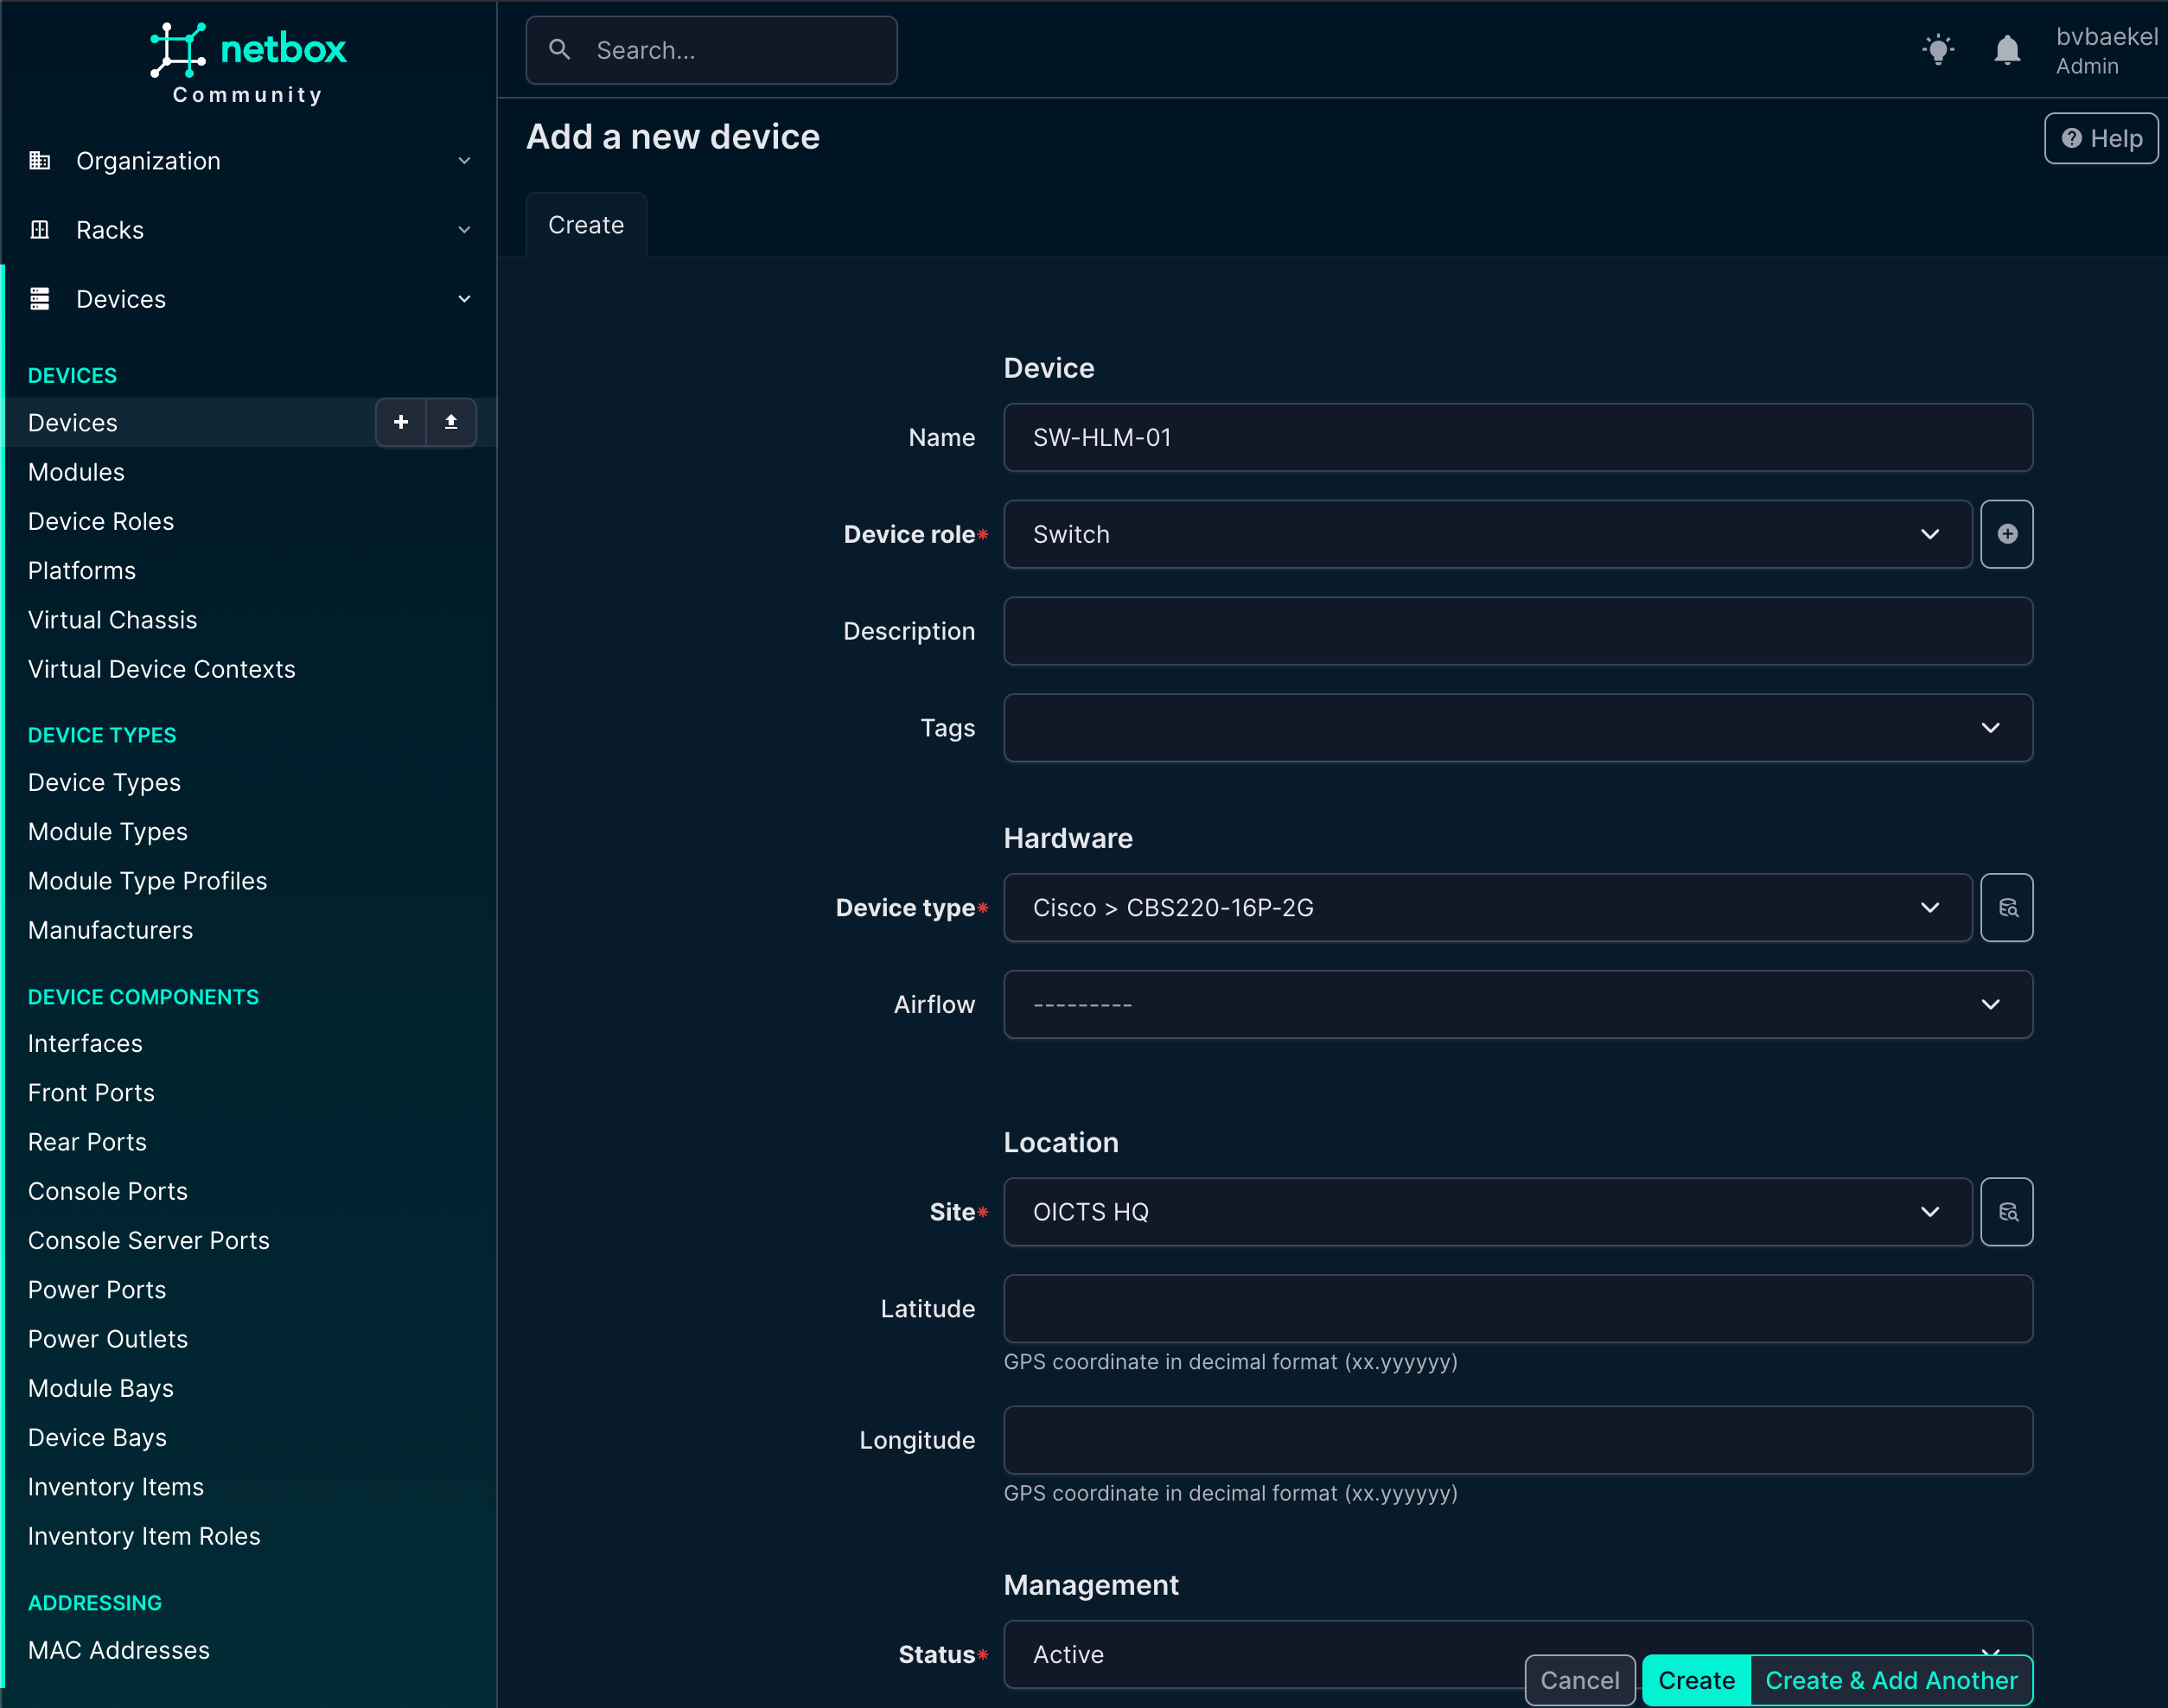
Now we can finally add the device itself! This is what it all is about – the work we’ve done before is really just laying the foundation for this moment. We add a device which will eventually become a Host in Zabbix, with all related properties pushed from NetBox its configuration.
So we navigate to Devices → Devices and from there add it:
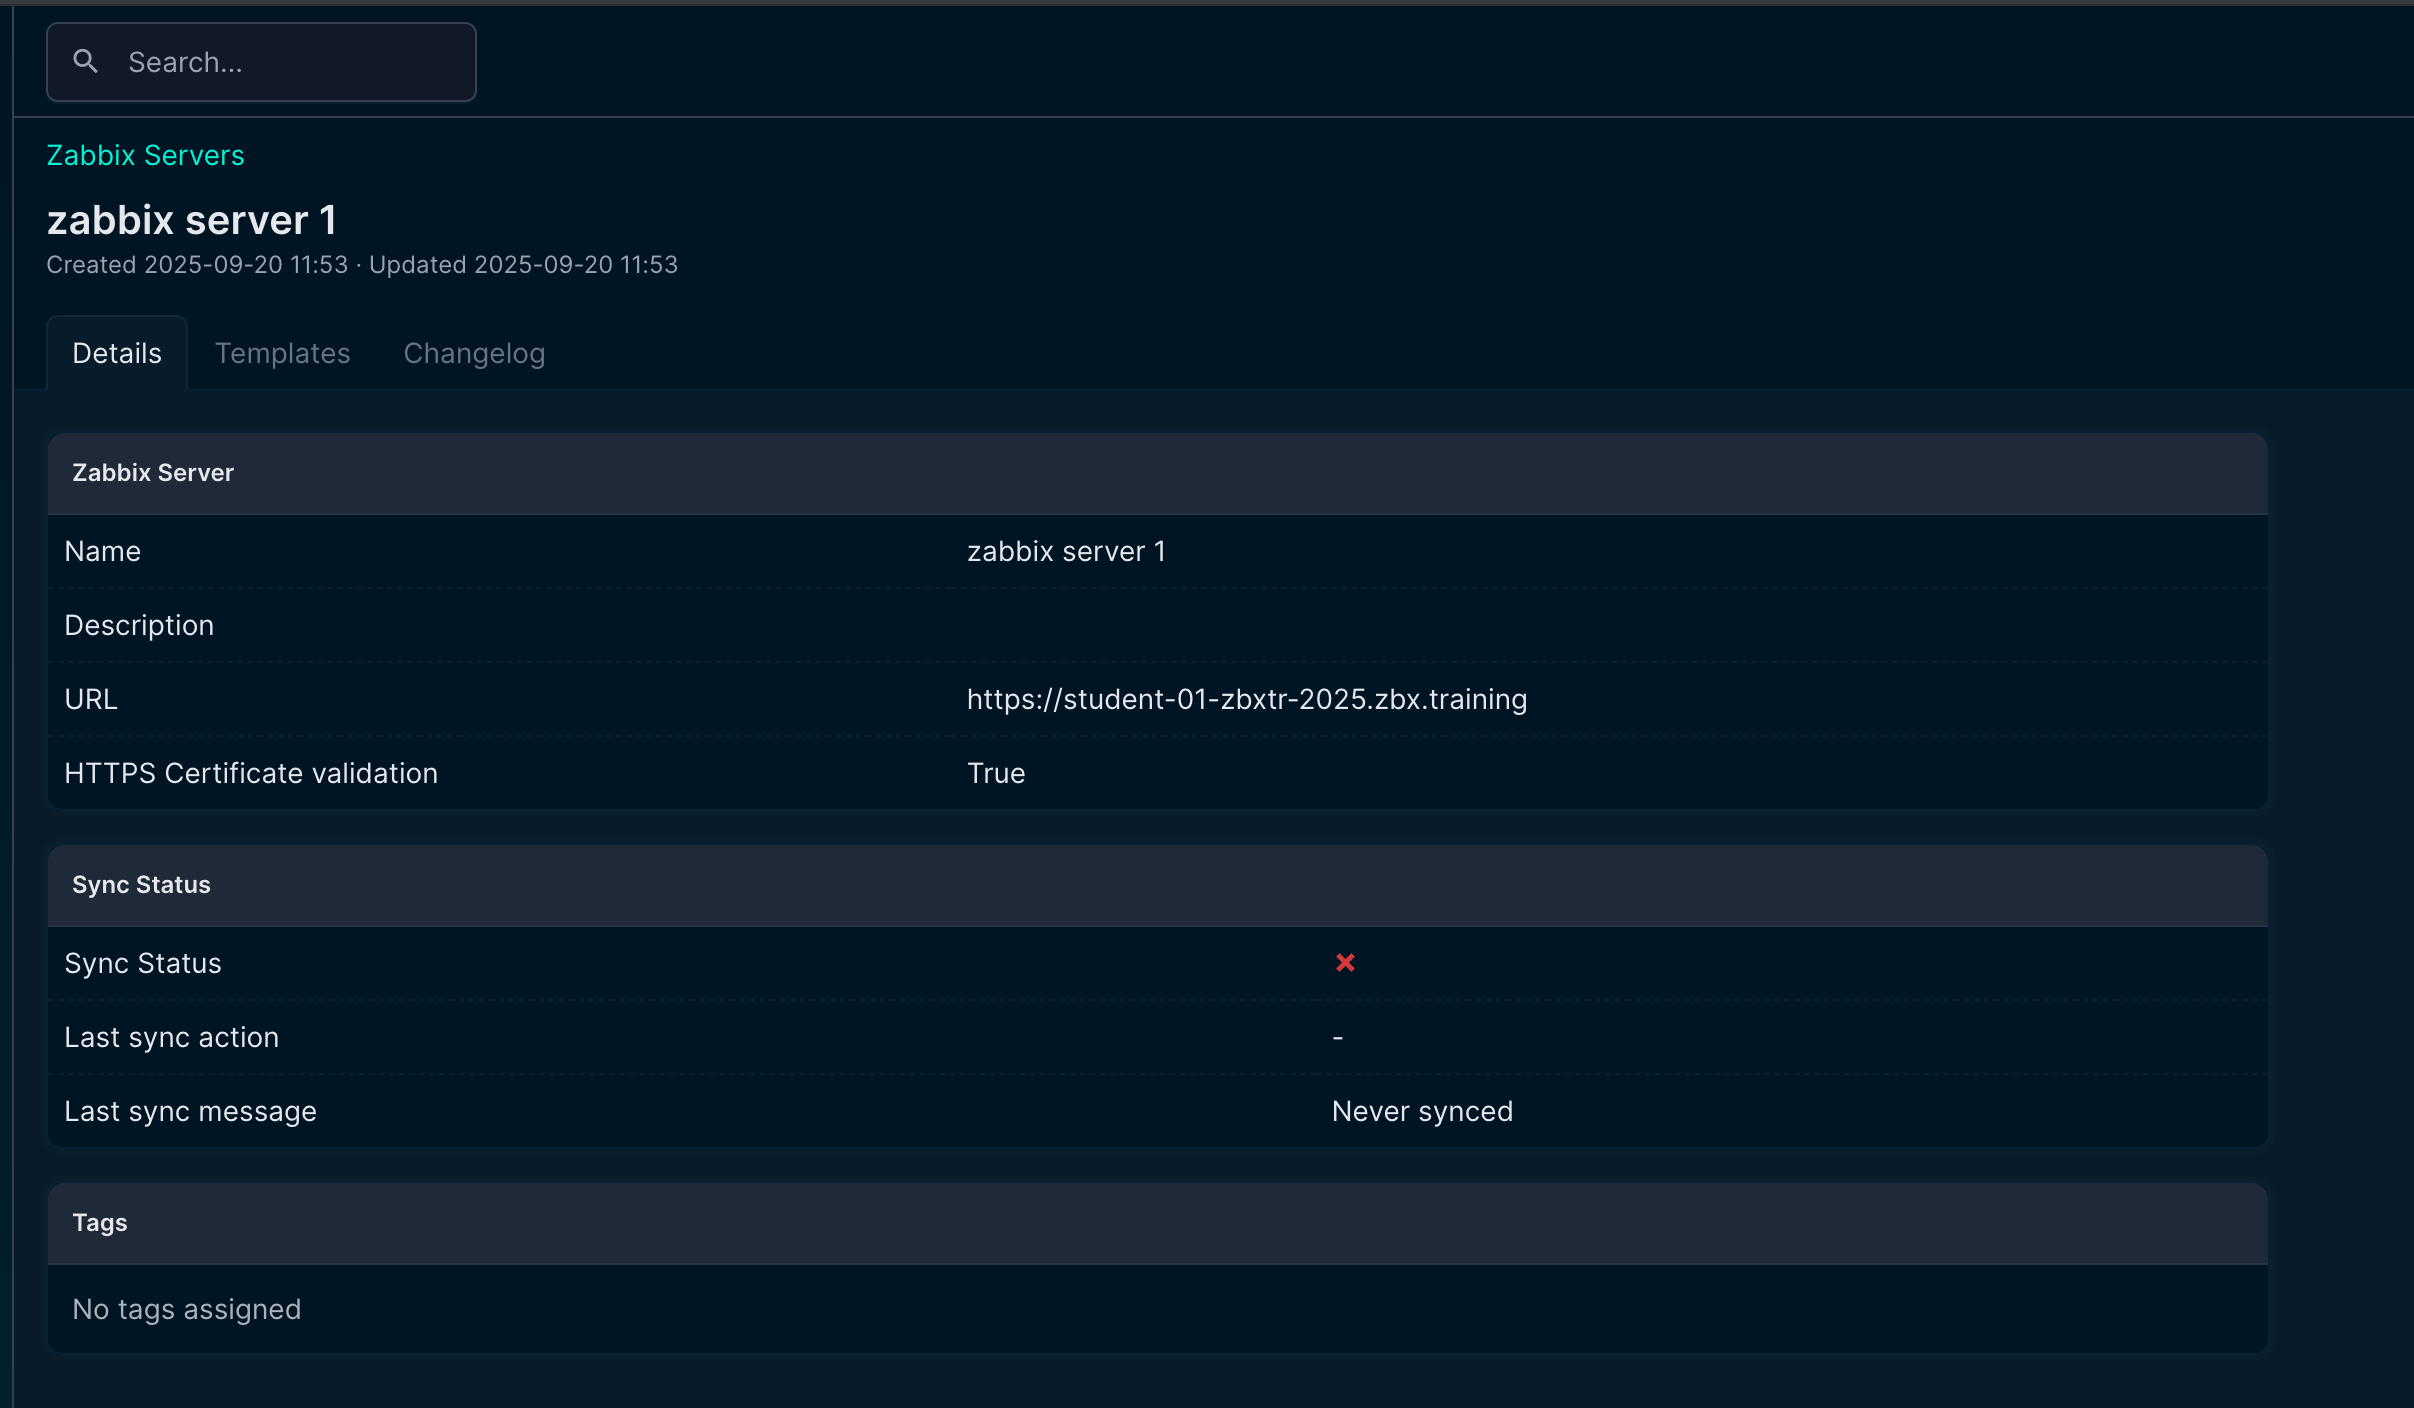
After we save the device by clicking “Create,” NetBox immediately takes us to the newly created device’s detail page. Here we can see an overview of all the information we have just entered, such as the device name, role, site, rack position, and other attributes. This page acts as the central point for managing and extending the device configuration.
From here, we can add interfaces, assign IP addresses, connect cables, or link the device to virtual resources. In other words, once created the device record becomes the foundation for documenting its place and function in the network.
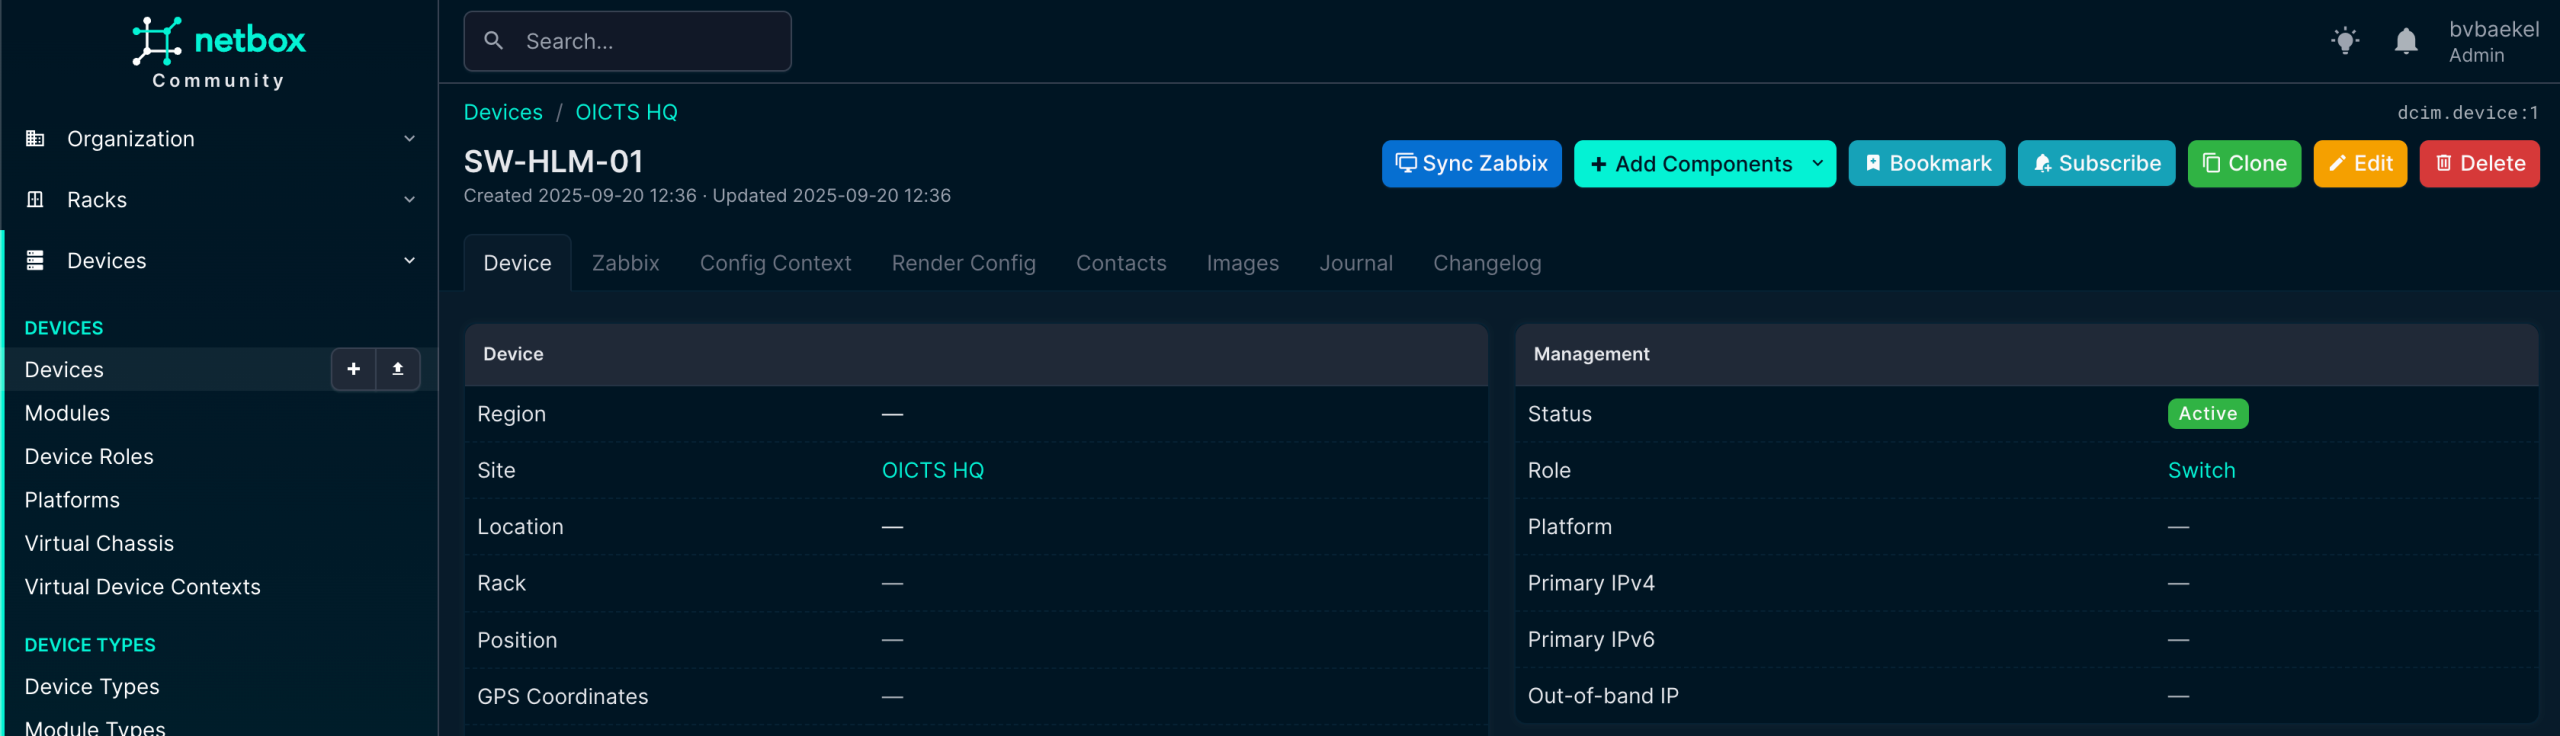
In this screenshot, we can see already that there is a new tab “Zabbix” (just under the device name) and we’ve also got a new button “Sync Zabbix.”
In the tab “Zabbix” we should assign this device to a Zabbix server, as by default it will not get assigned to any. You might think this is a bit strange, especially if you’ve got one Zabbix server. However, the mindset during development is that NetBox typically is used by MSPs, which have multiple Zabbix servers and even might have the need to assign multiple Zabbix servers to this device for operational reasons.
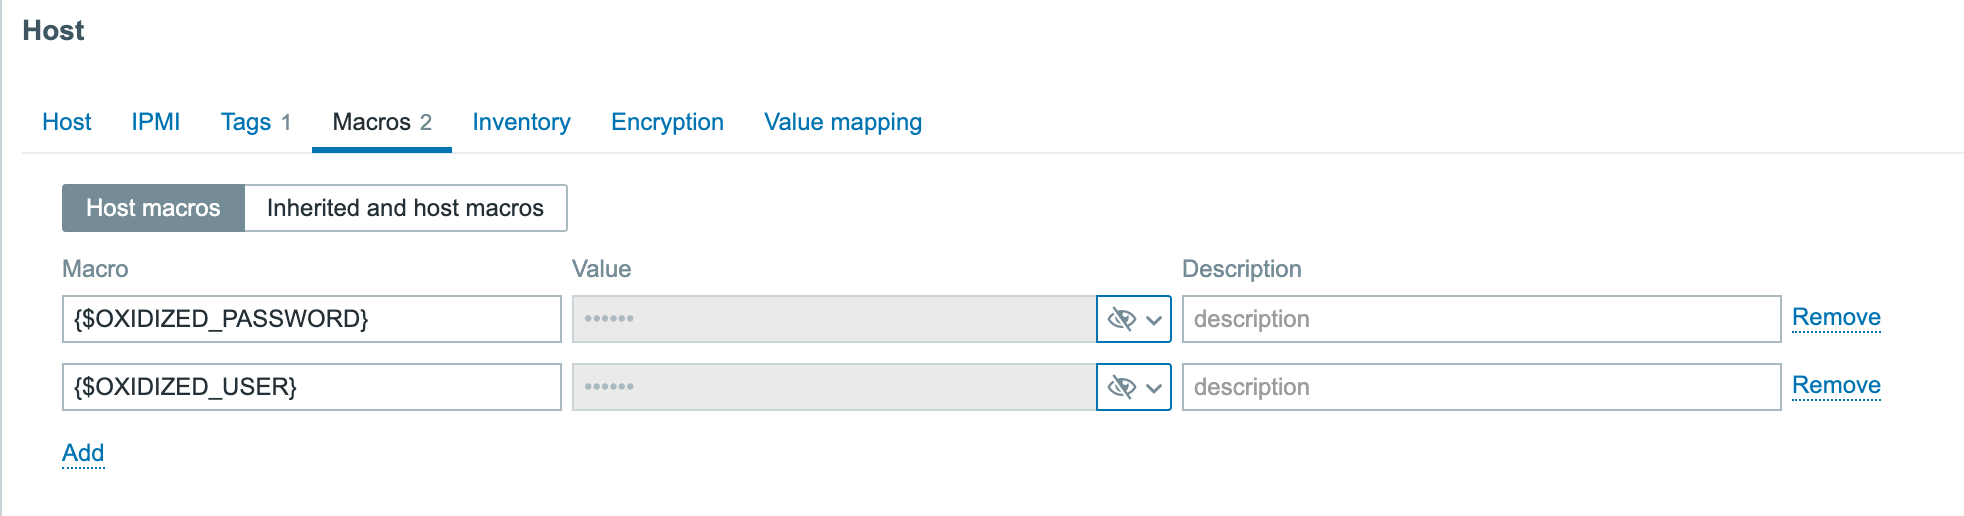
We open the tab “Zabbix” and click on “Add” next to the Zabbix Servers. A new configuration page opens and we select the server we just added:
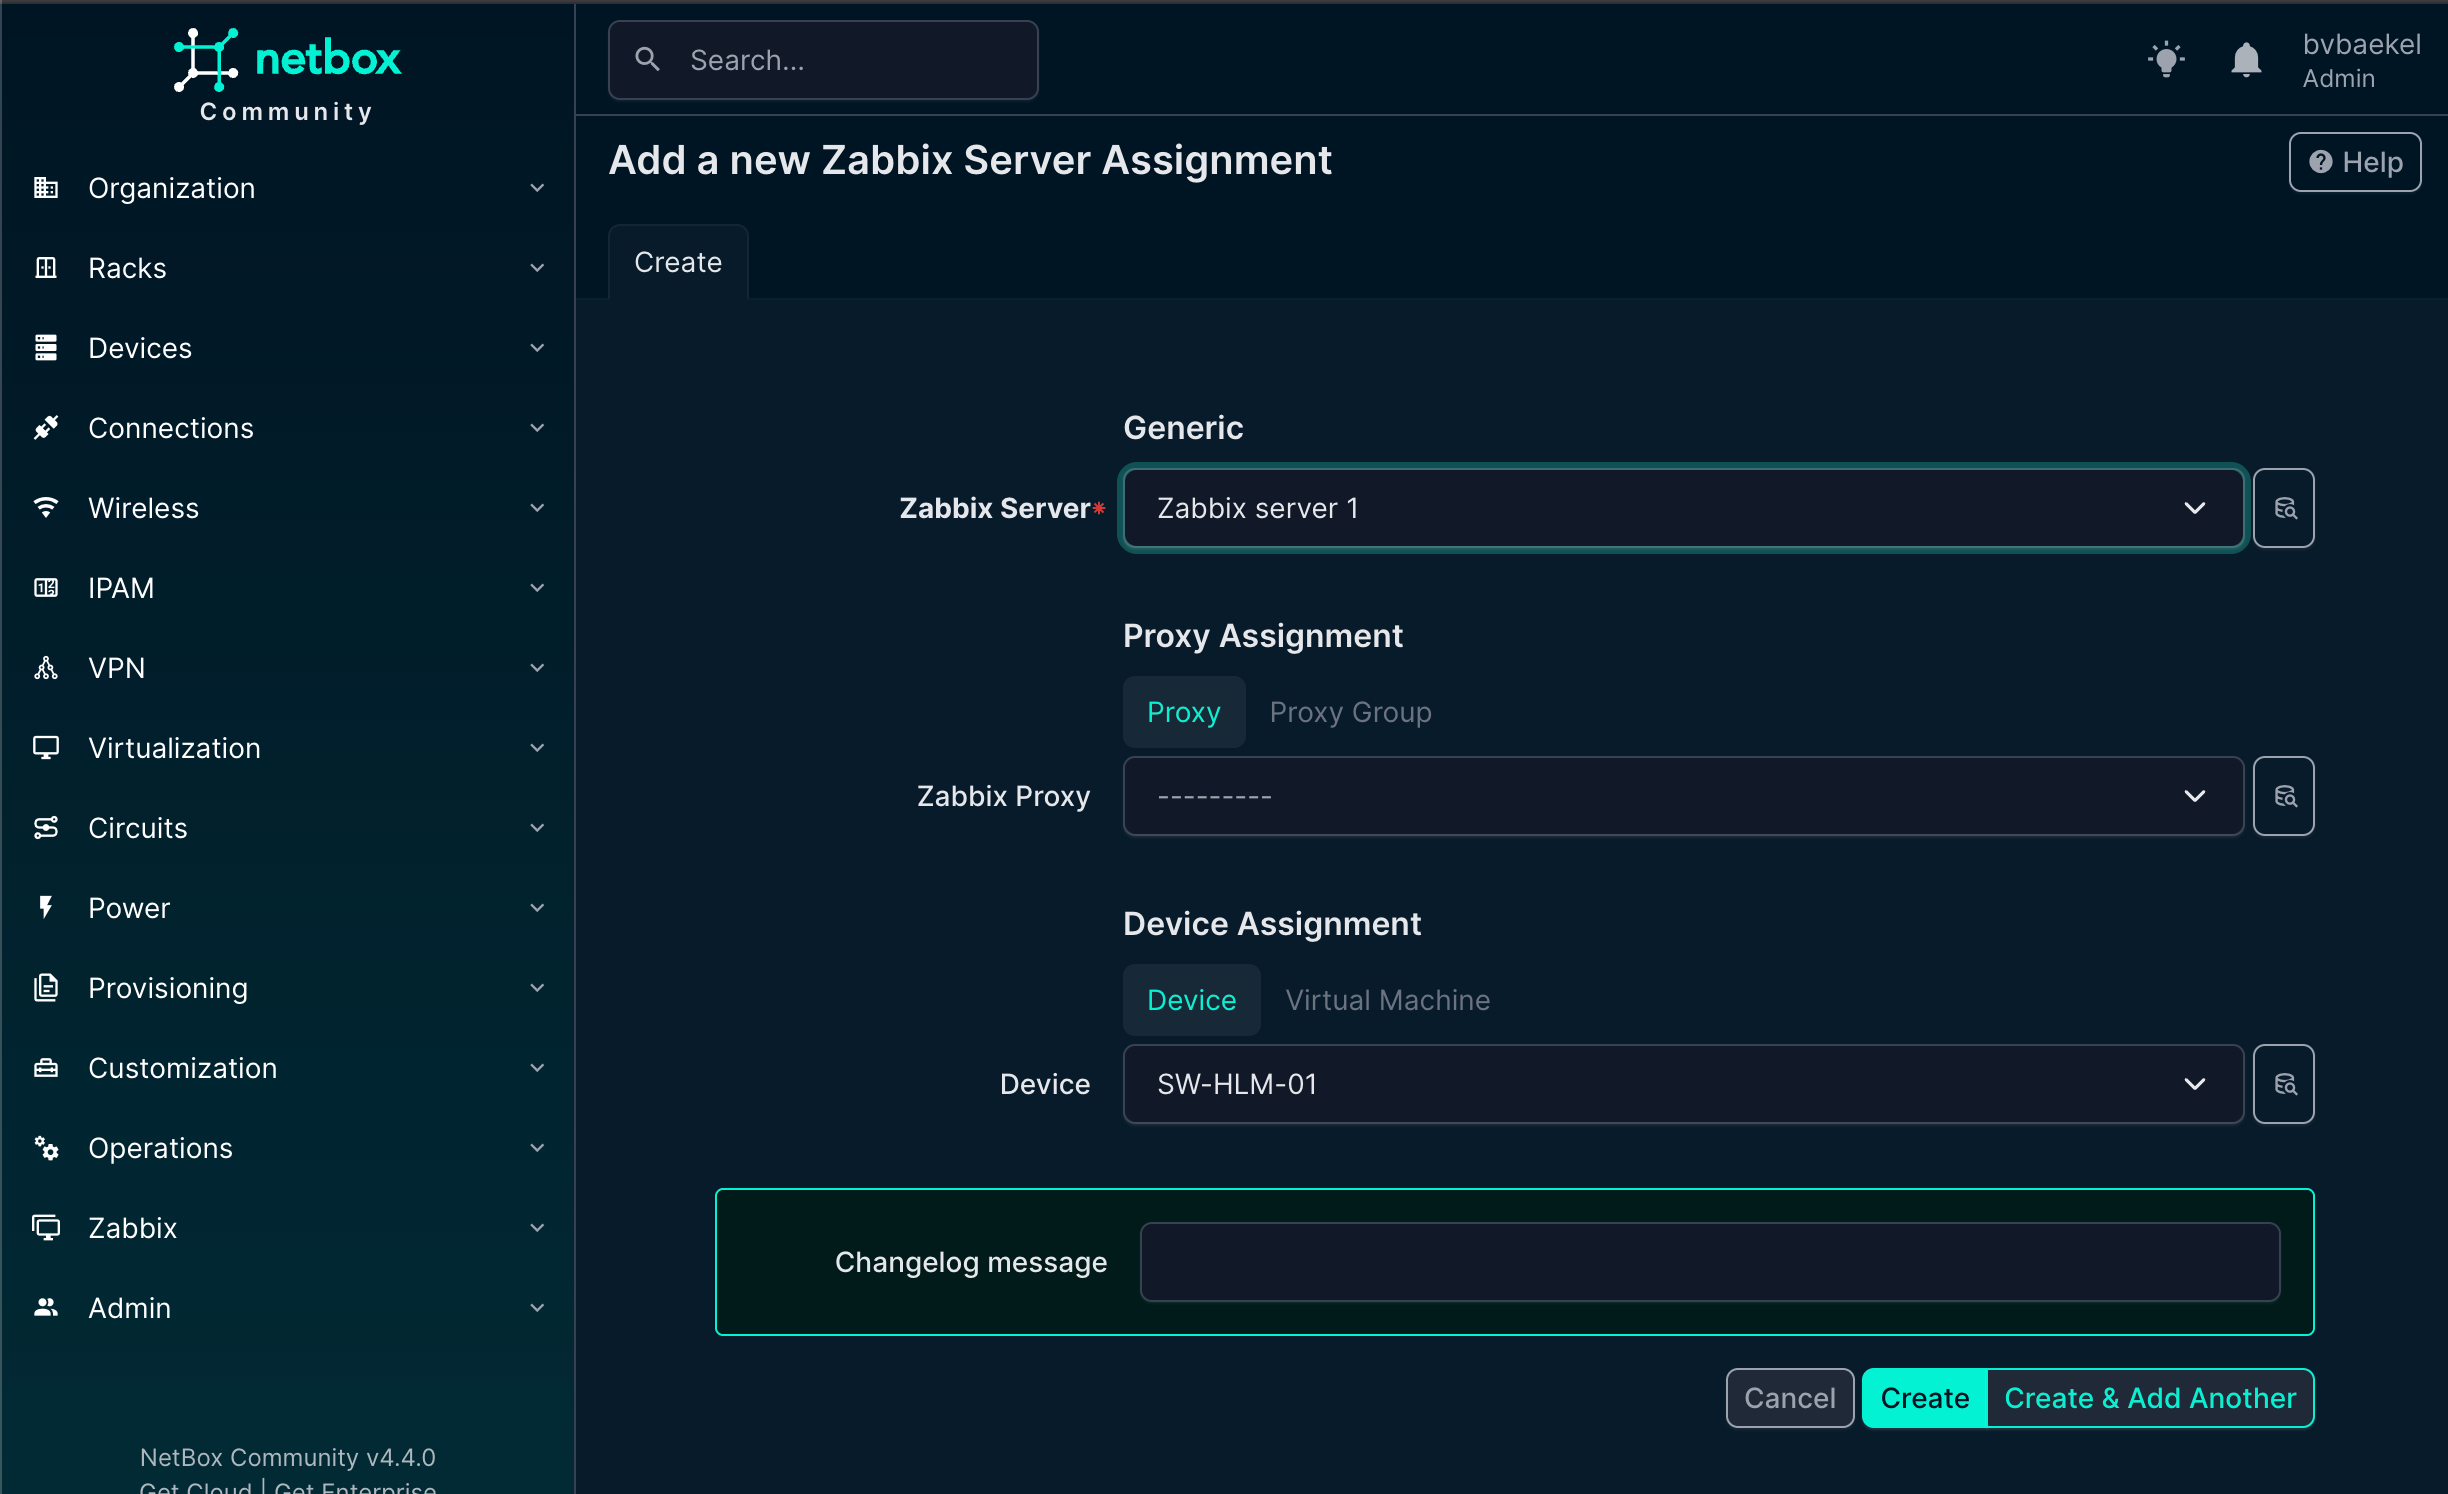
When you click on “create” the server is assigned. We can of course add an template to it, but as we know the vendor and type already, there should be some inheritance!
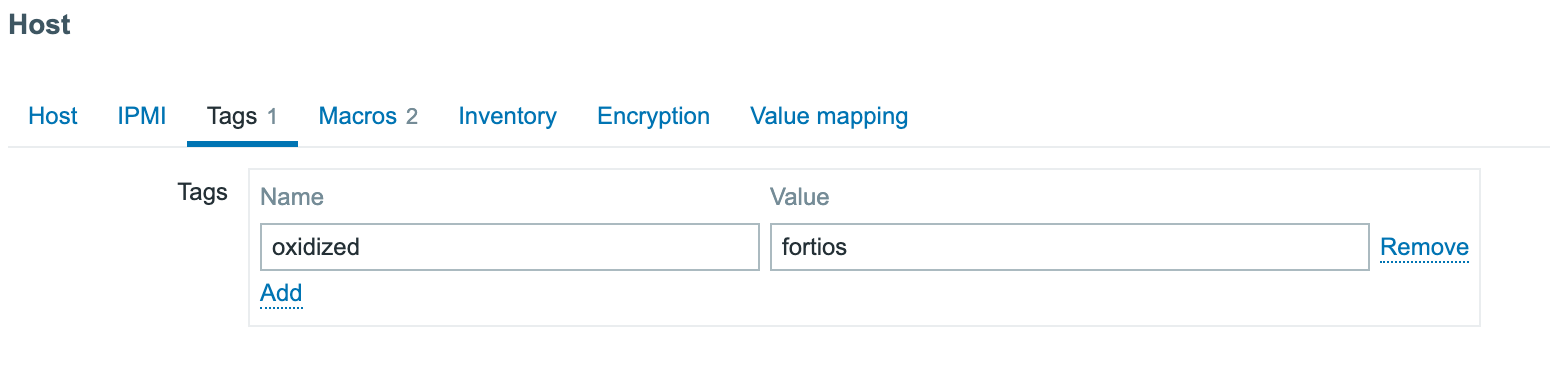
Let’s go back to Device → Manufacturers and click on the vendor(Cisco) we just added. Click on the name and you will see that this object also got a new “Zabbix” tab. In this tab you can configure that for this vendor, always these templates, hostgroups, tags and macros should be used. Here we will just add the template to this vendor, to show inheritance:
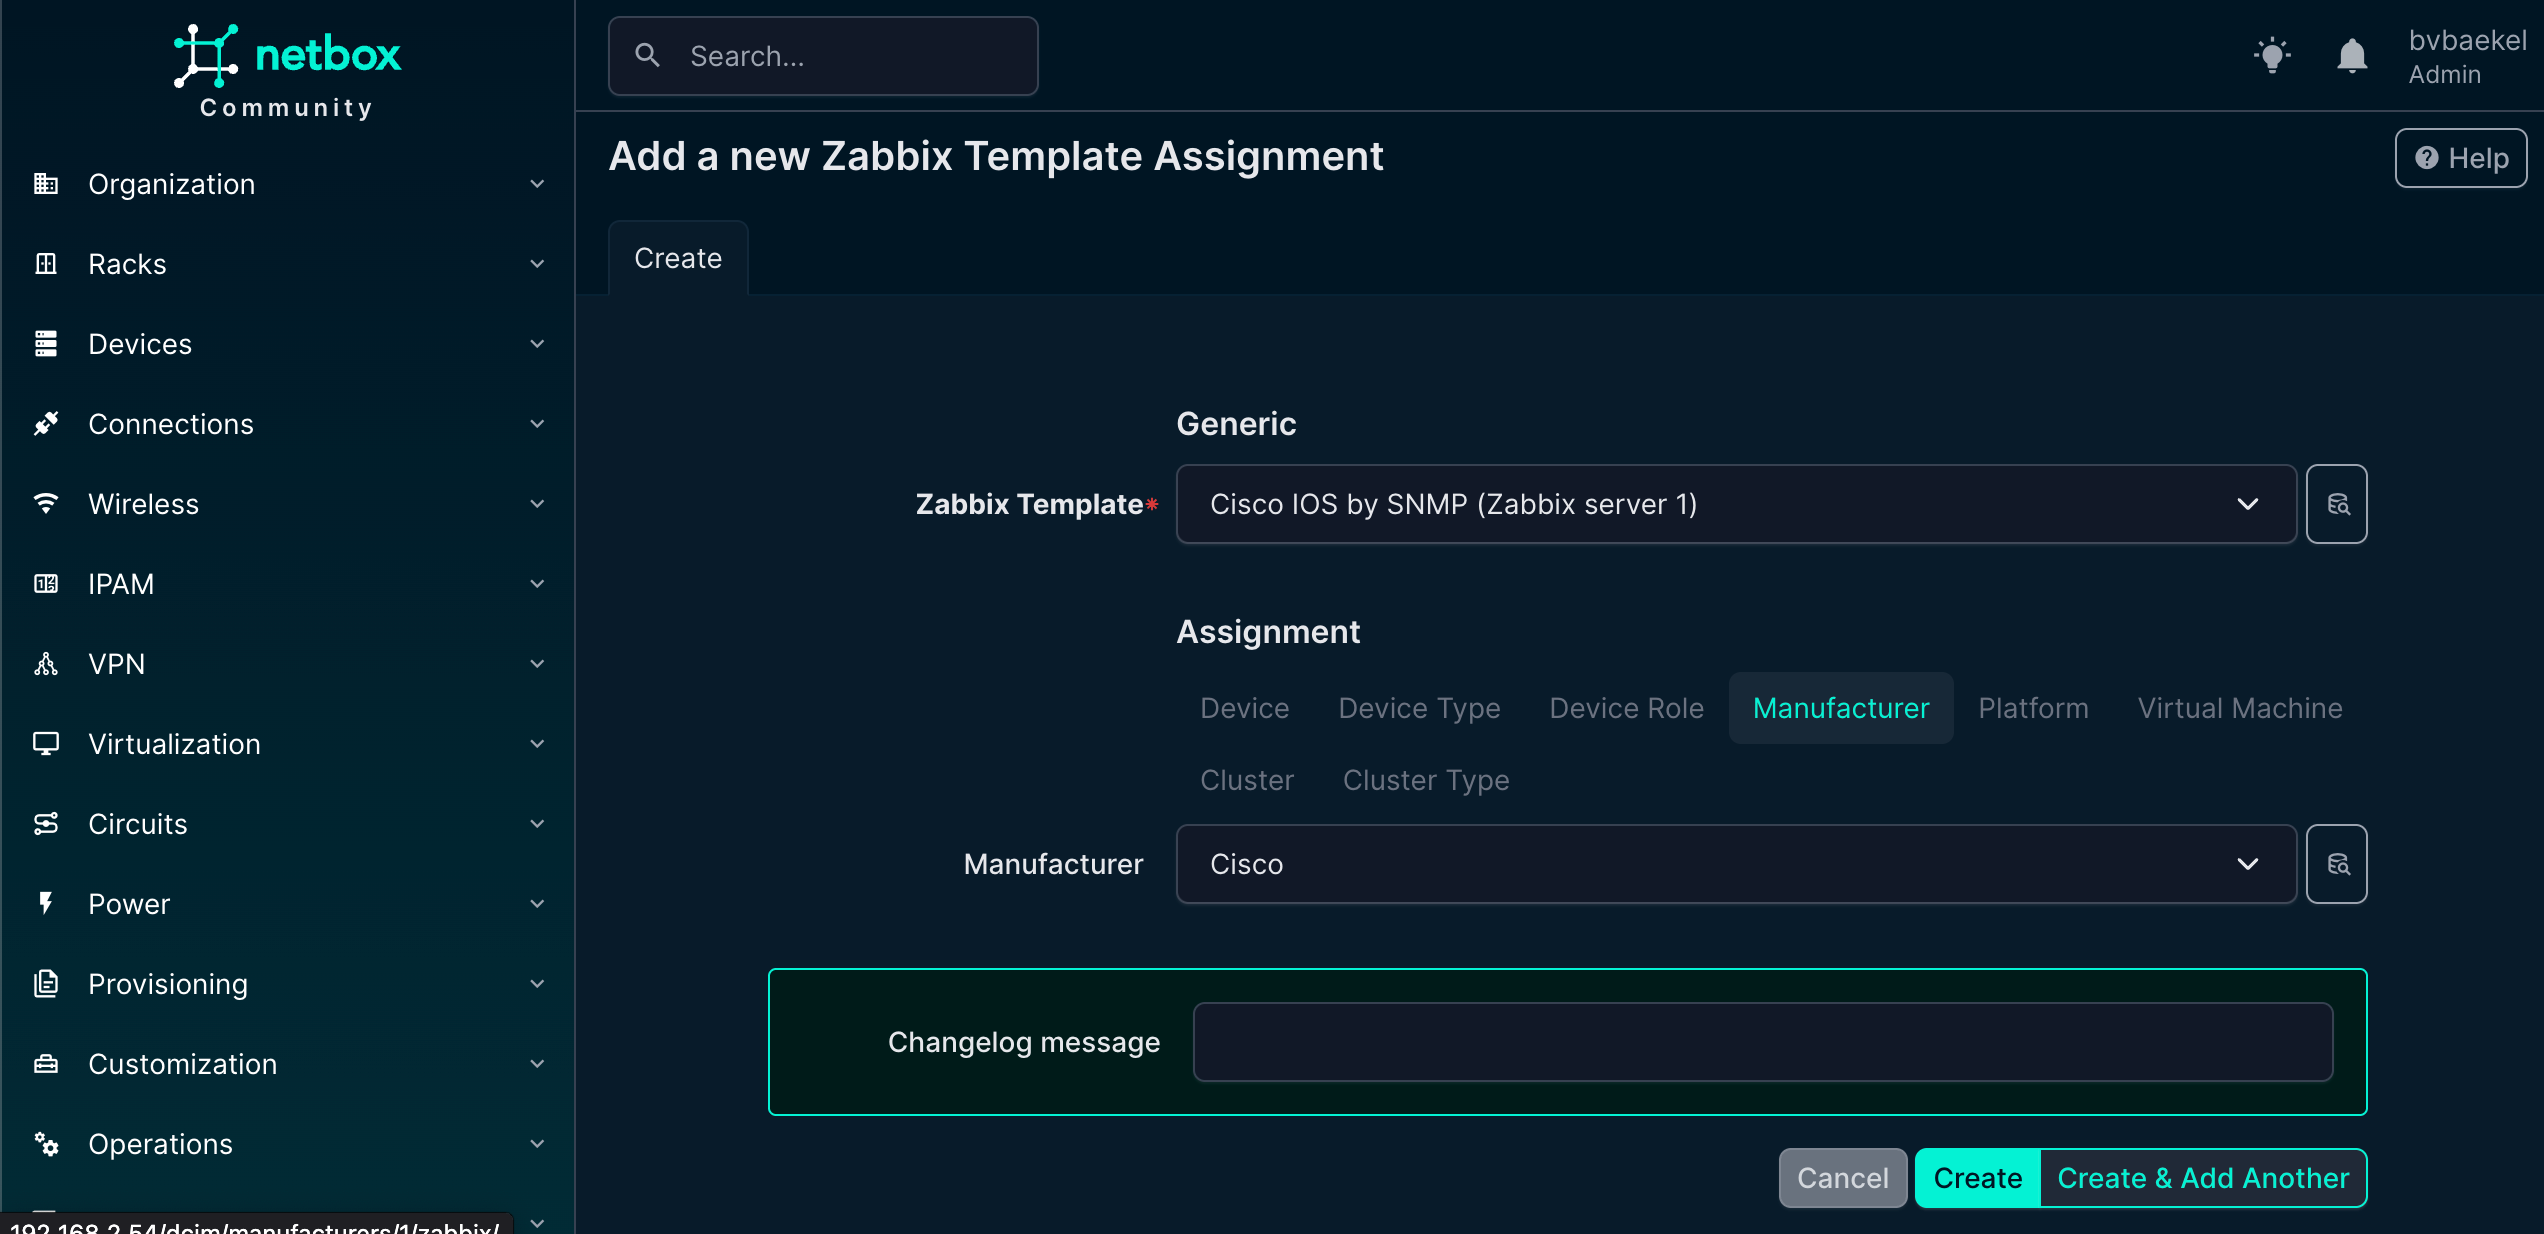
Once you’ve clicked on Create, navigate back to the device we made and observe how the template is inherited. As Zabbix also requires a host group and an interface, we are going to configure that now.
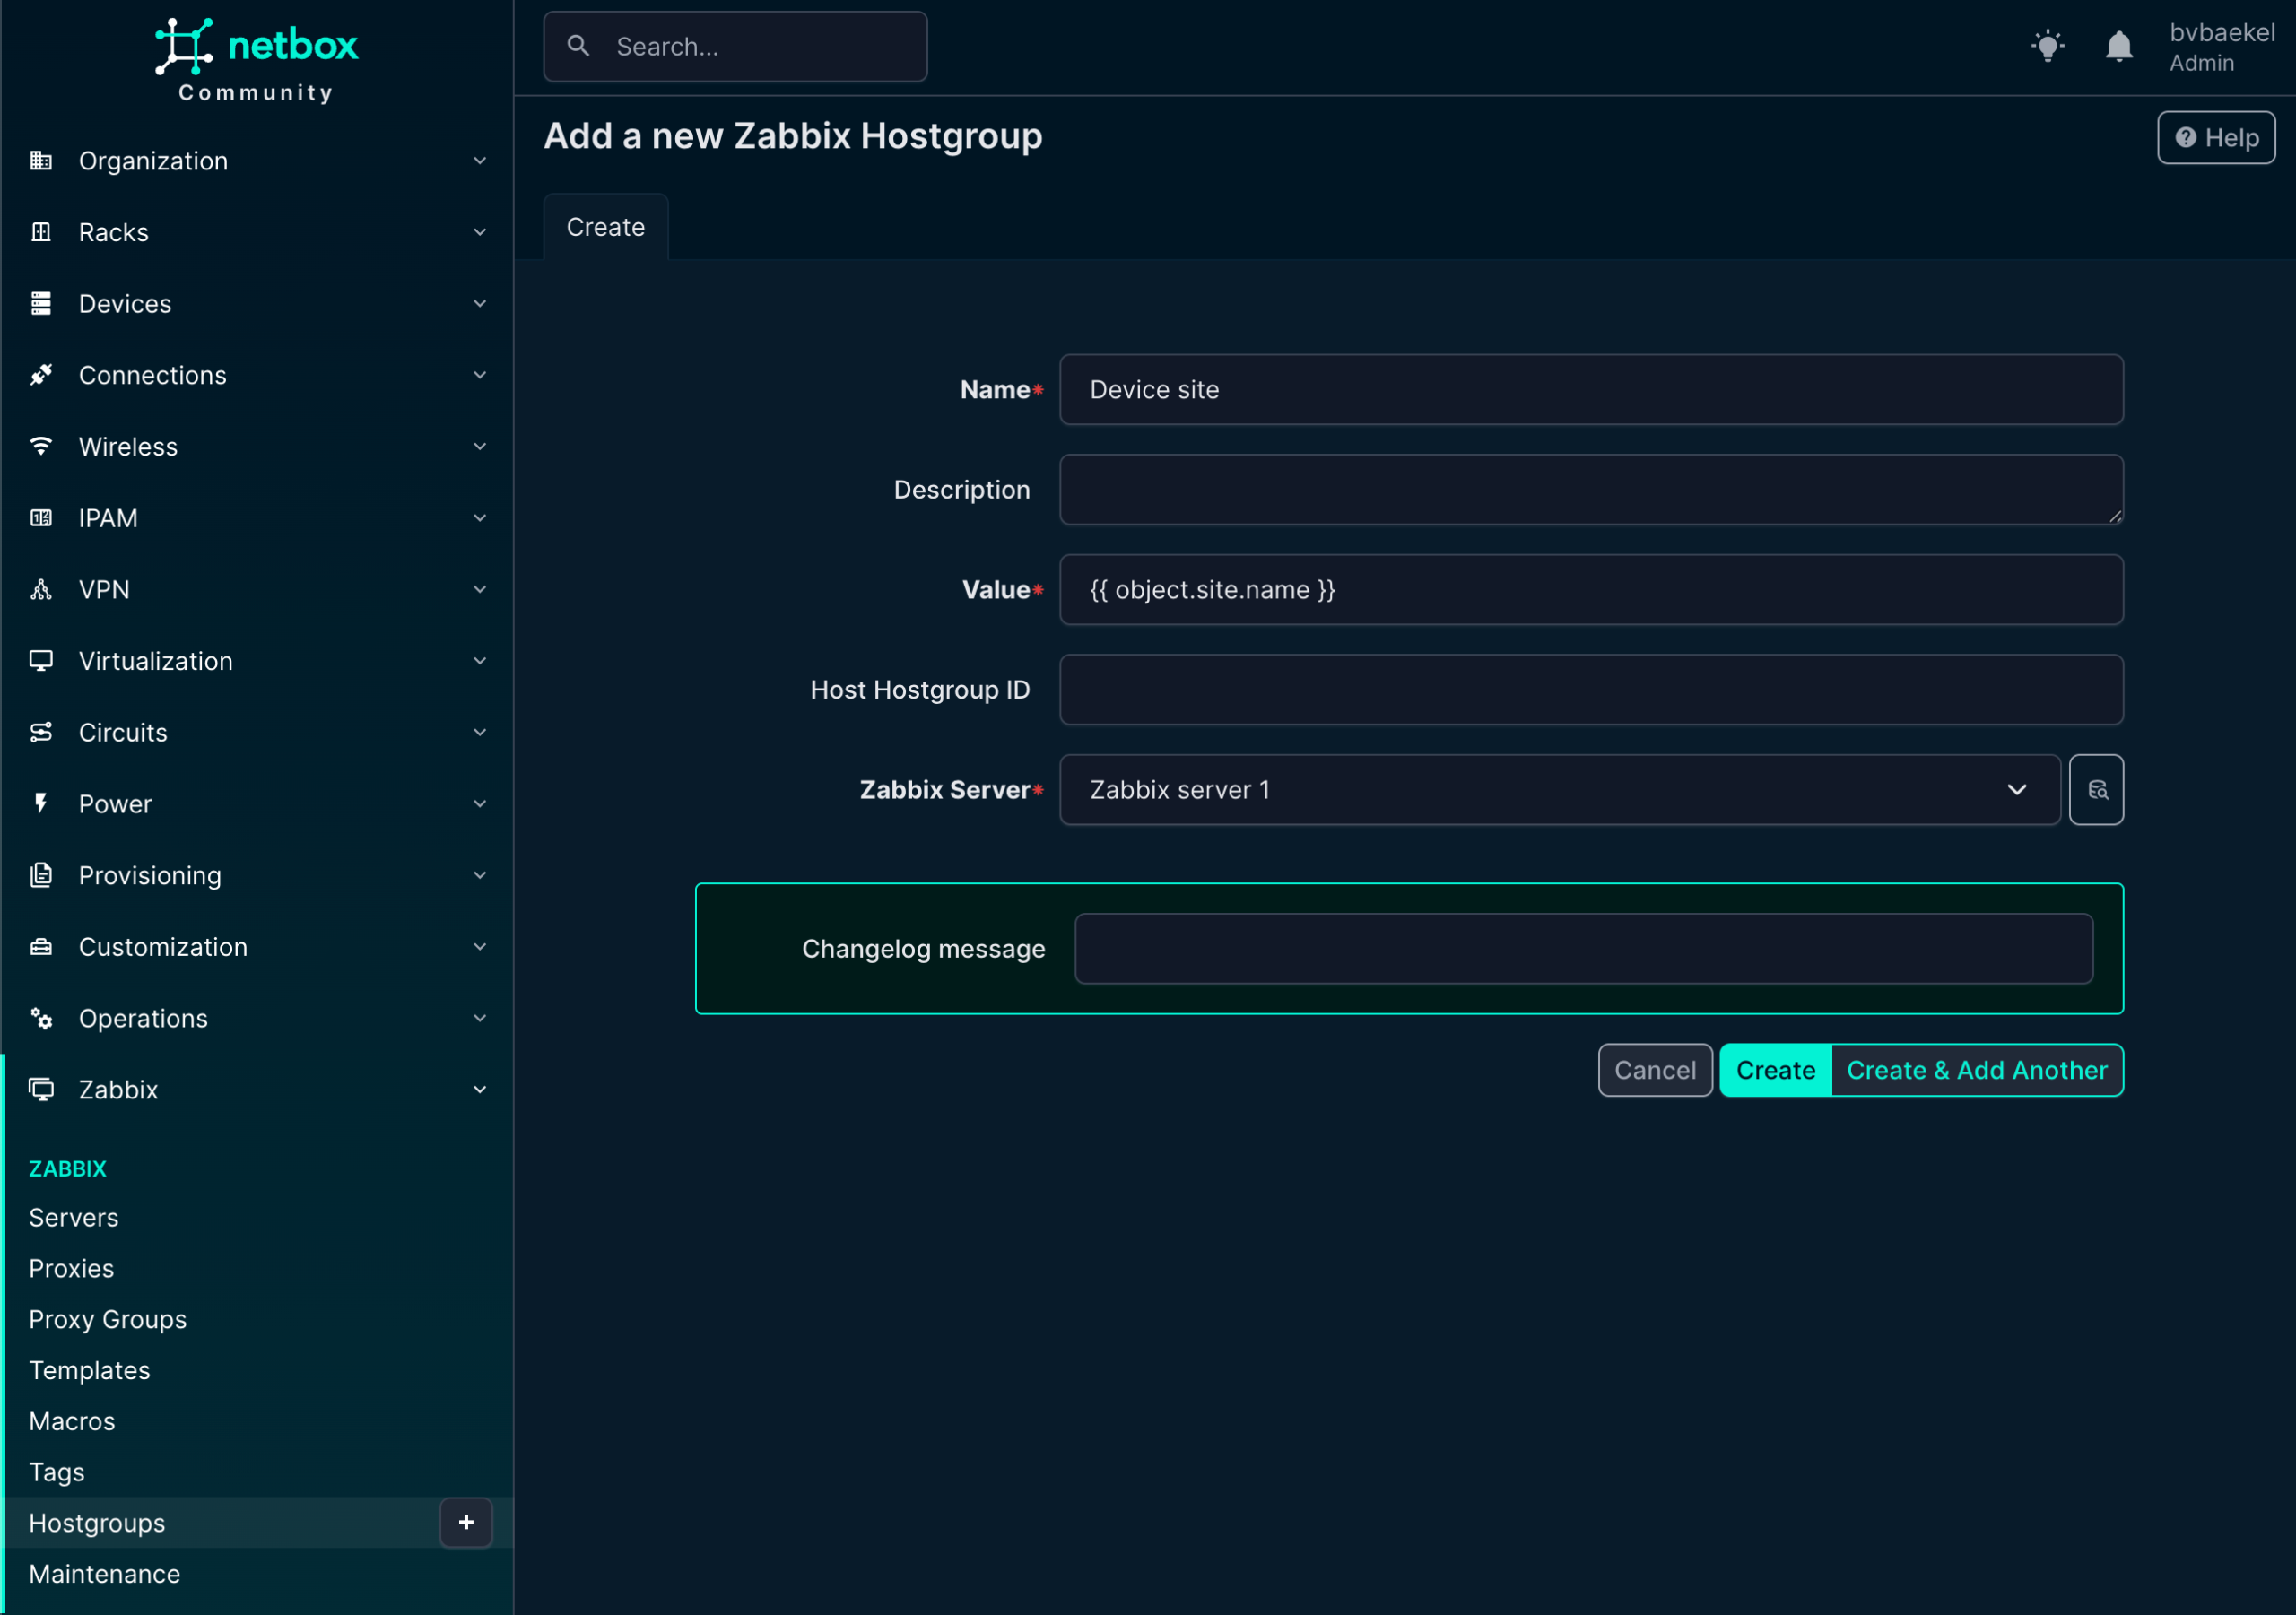
We will start with the host group, so click on Zabbix -> Hostgroups. There we create a new one as per the screenshot below. There is something strange with our configuration, as we use Jinja2 templates instead of static names.
The object name is “Device site” but the actual value will resolve to the site name we created (OICTS HQ) earlier. The power here lies in the variables – if we create a new device for another site and link this hostgroup, it will automatically resolve to the correct site name with no need for static configurations anymore!
Of course, the host group should be assigned to a Zabbix server again:
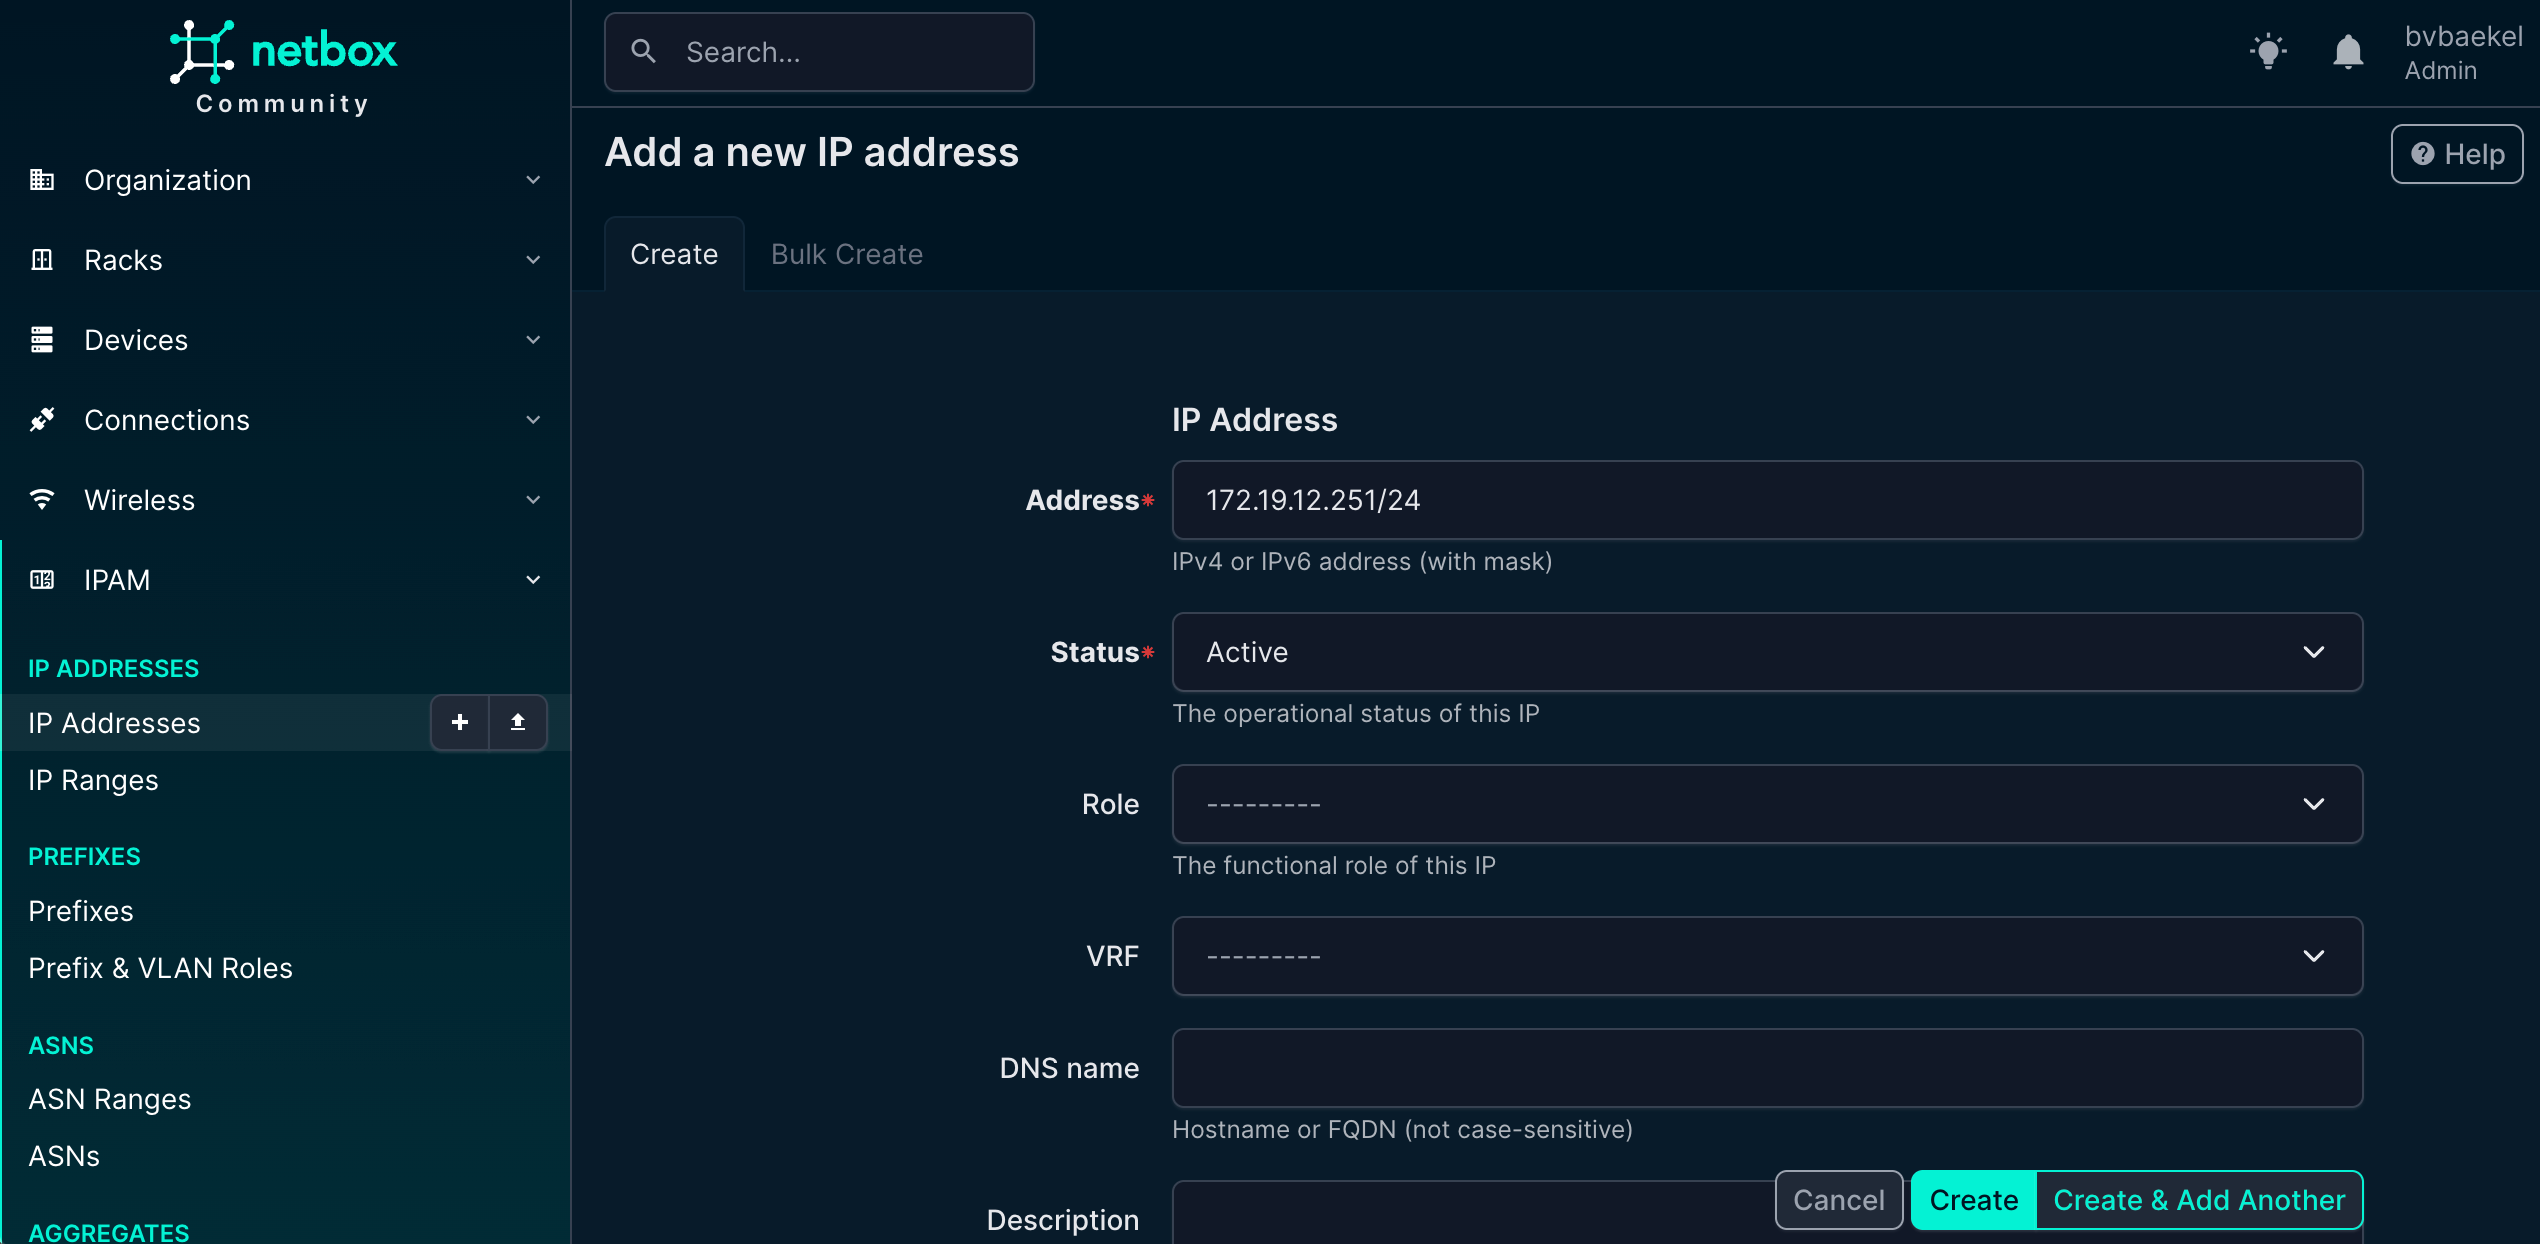
The next step is to create a Zabbix host interface, which is essential for monitoring and communication between Zabbix and the device. To do this, we leverage the IPAM (IP Address Management) functionality within NetBox.
IPAM provides a structured way to manage and allocate addresses across the network, ensuring consistency and avoiding conflicts. In this case, we navigate to IPAM → IP Addresses and add a new IP address that will serve as the management interface for the device. This IP address will later be linked to the Zabbix host configuration, allowing monitoring data to flow seamlessly.
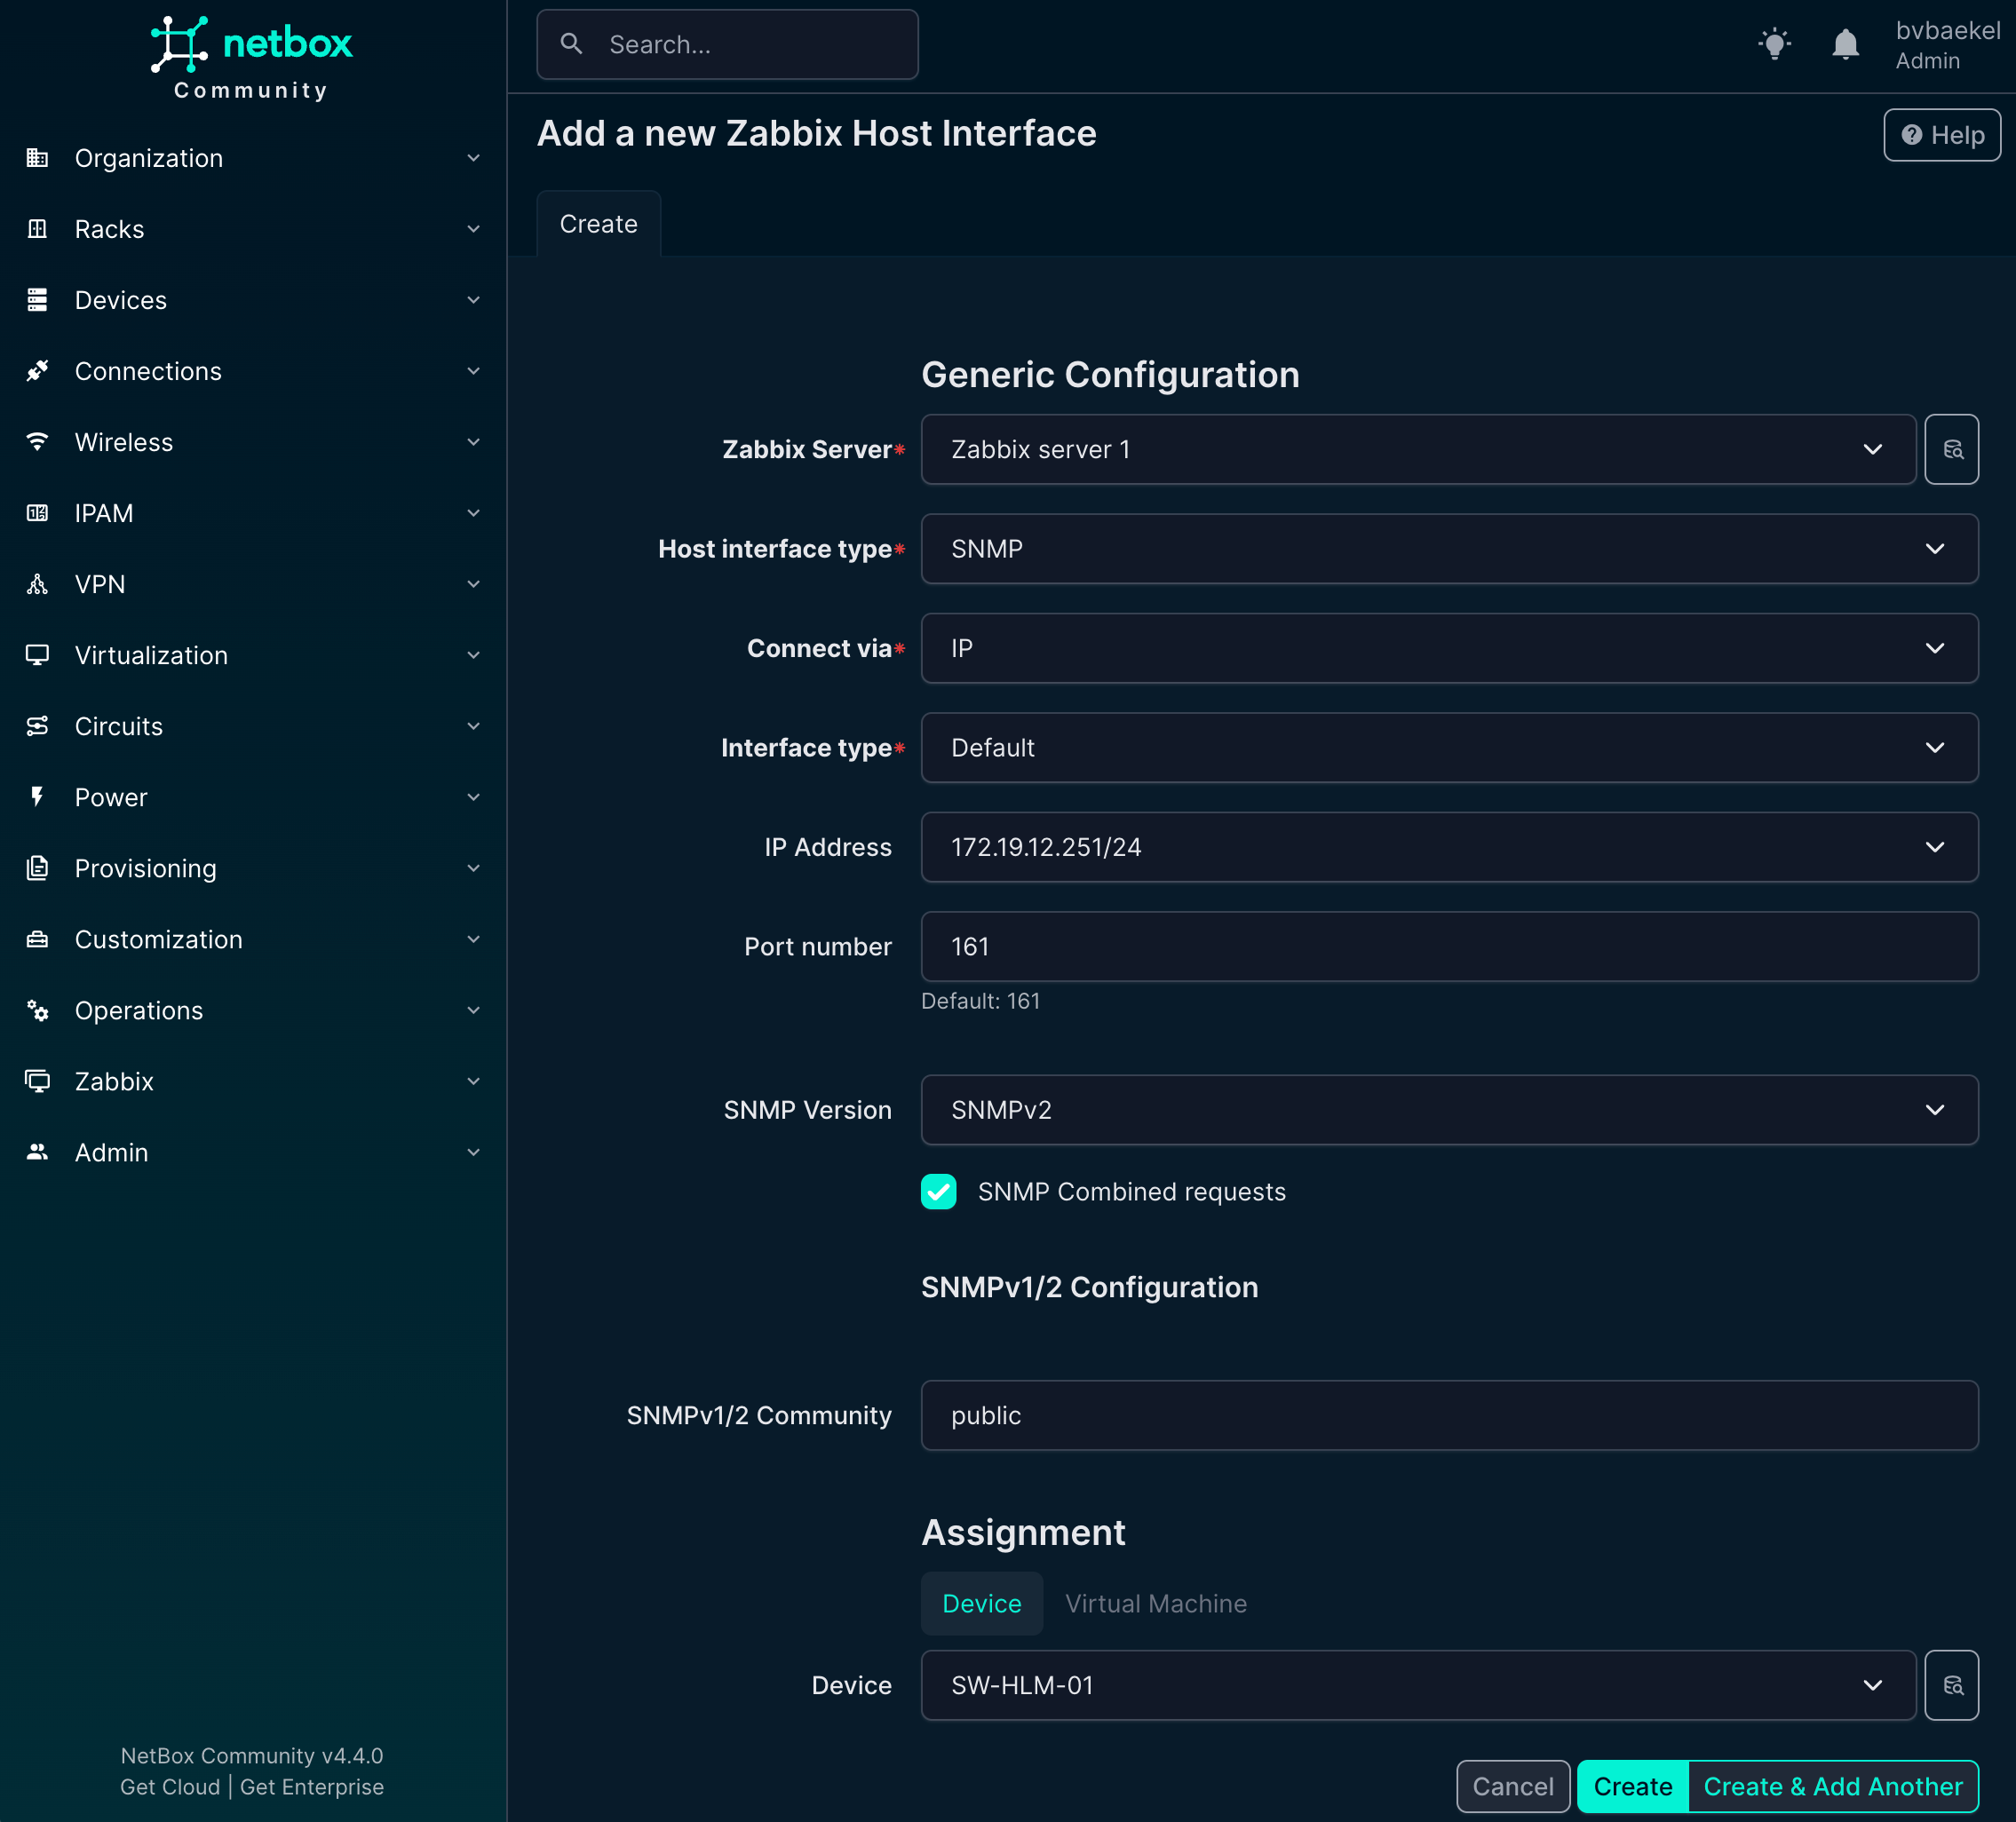
If we now go back to Devices -> the device we want to configure → tab “Zabbix” we should add an Host interface and Host group. Click on Add for the respective config and populate the minimum fields. For the Host interfaces that looks like this:
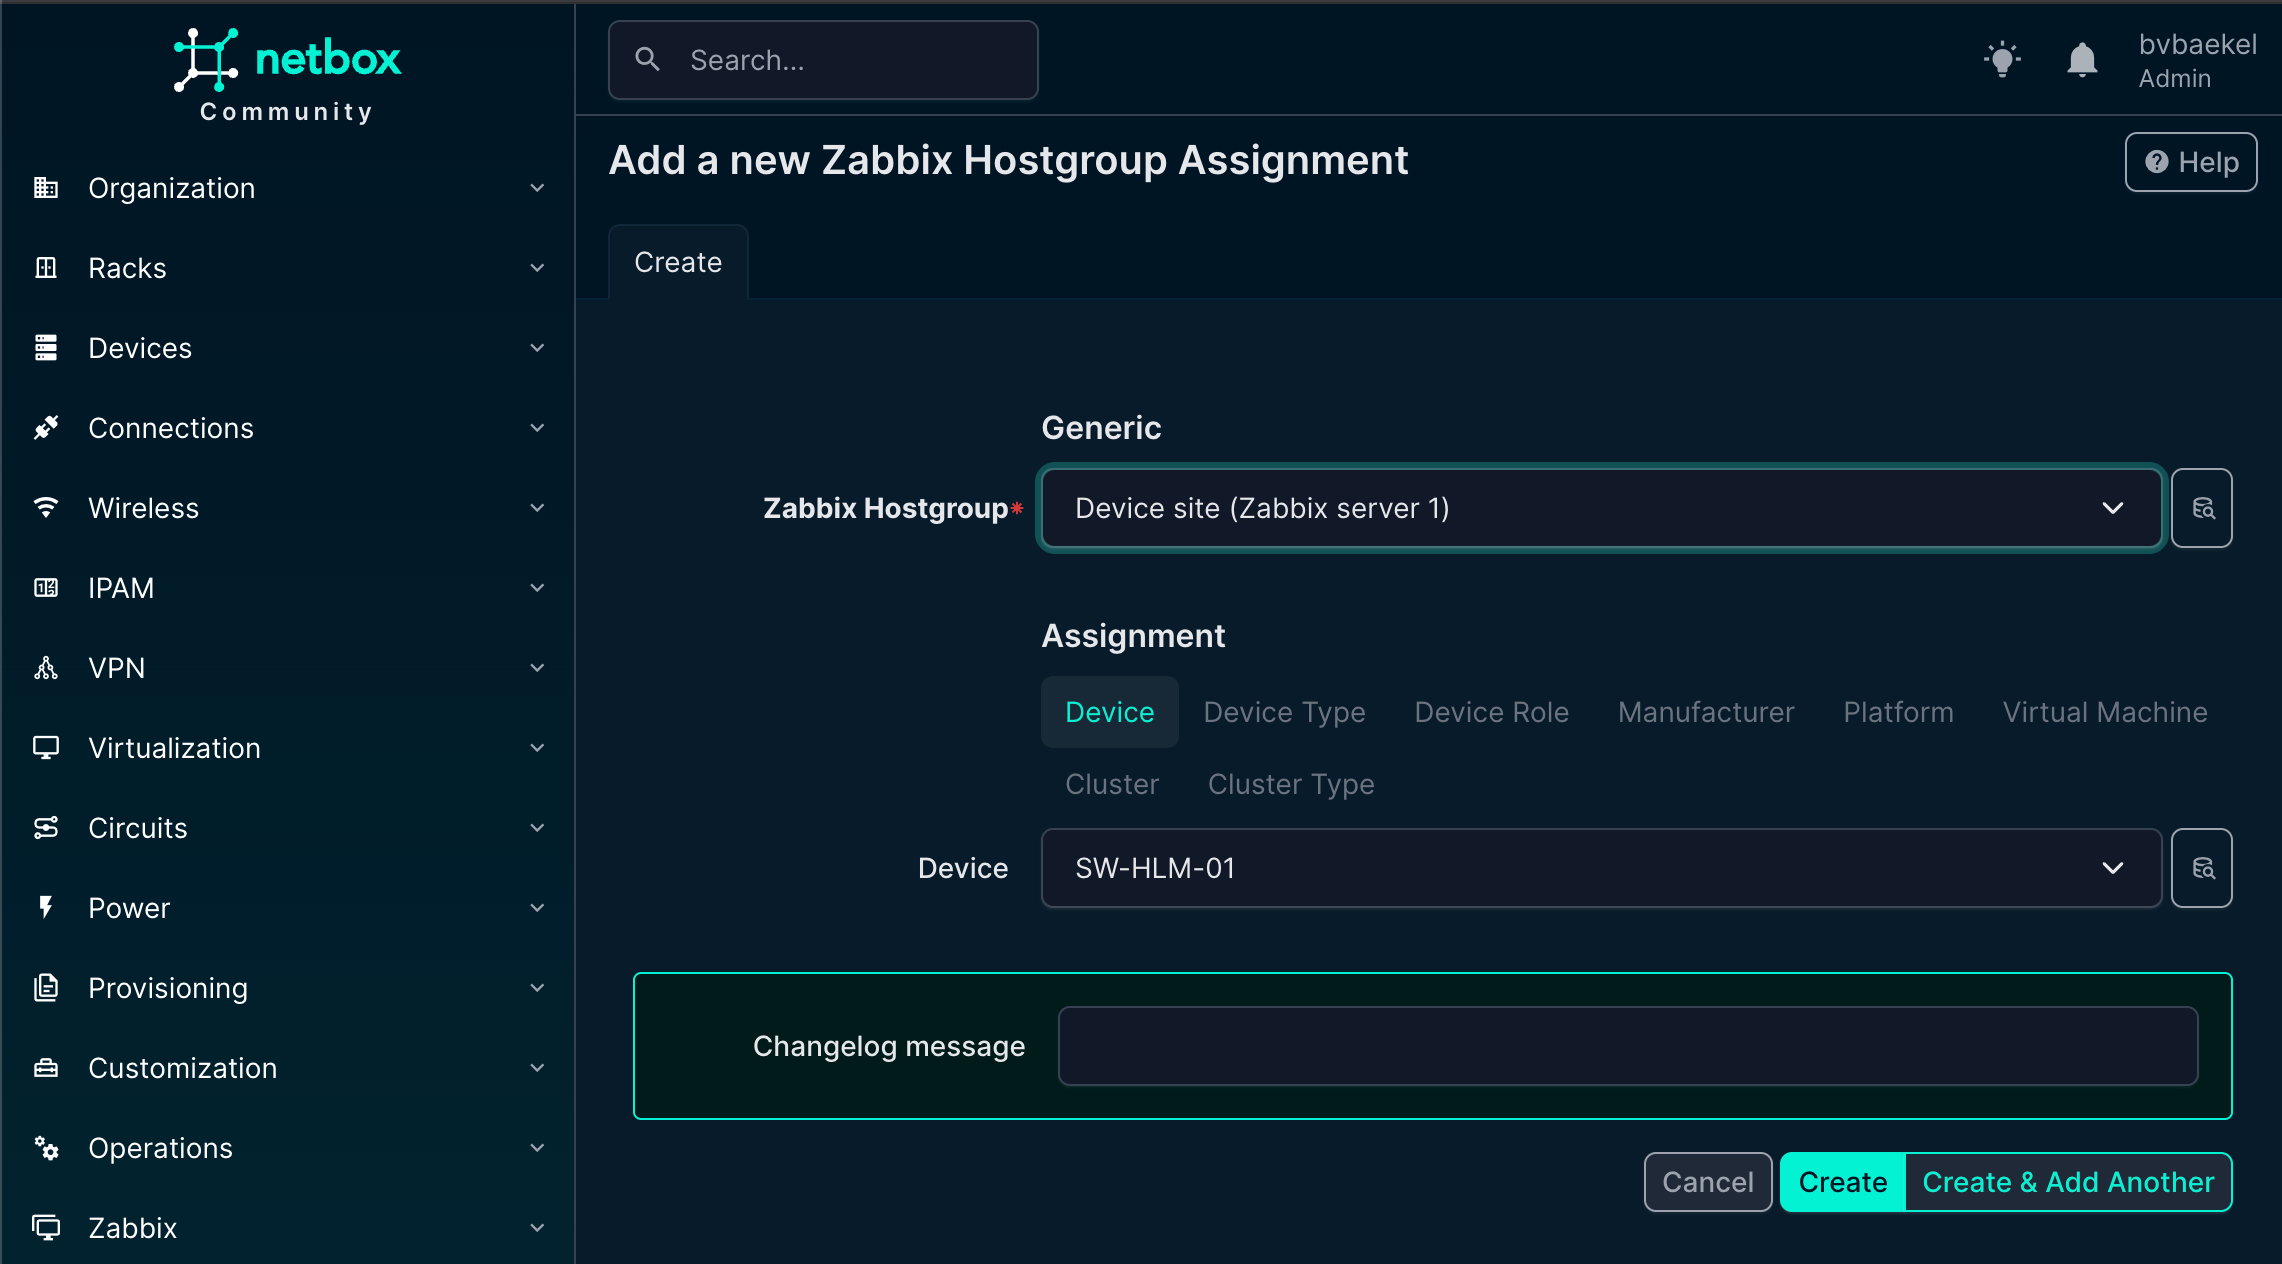
For the host group, there are fewer fields to fill in compared to other objects. All you need to do is select the appropriate group from the available options. This keeps the process straightforward and avoids unnecessary configuration.
Once saved, the host group will be correctly linked and ready for use in Zabbix:
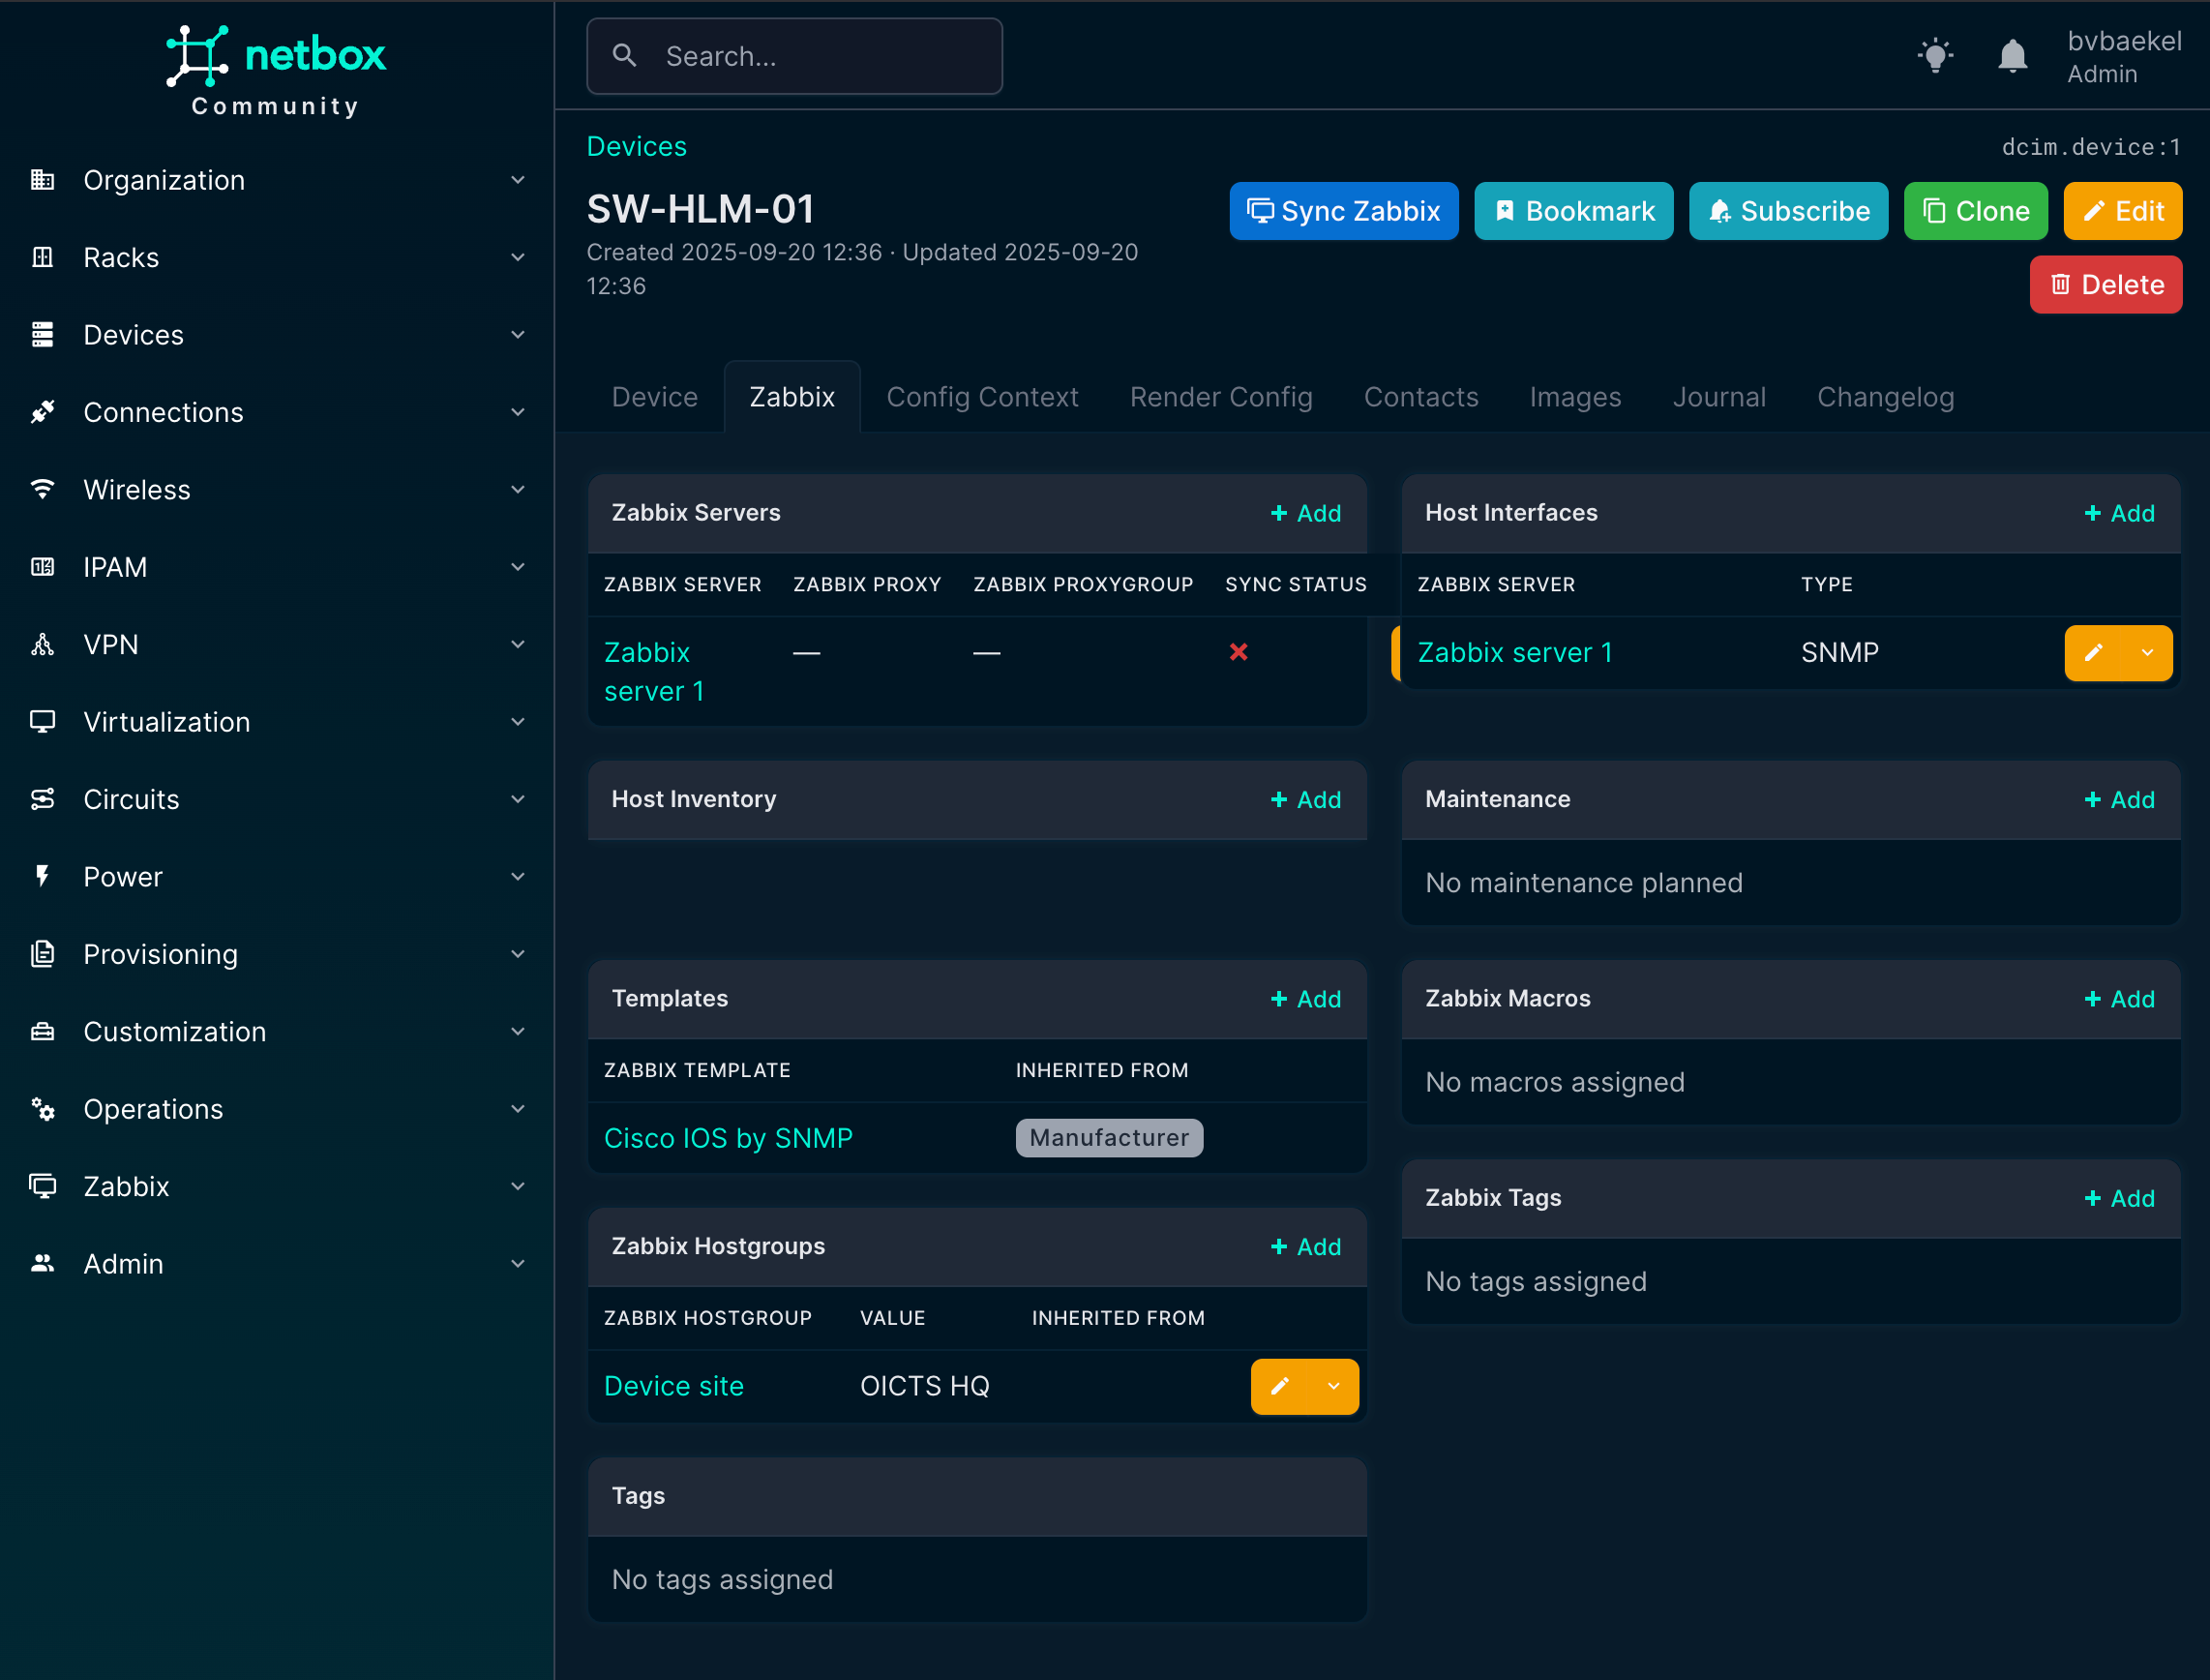
So the final result looks like this. At this point, all of the required elements have been configured in NetBox and properly linked to the Zabbix environment. The device now has its host group, host interface, and templates assigned, giving us a complete picture of how it will appear in monitoring.
What we see here is essentially the end-to-end outcome of the earlier configuration steps, where NetBox acts as the single source of truth and Zabbix automatically inherits the correct setup.
Now it’s time to actually synchronize the device with Zabbix. At the top of the device detail page, right next to the device name, there is a button labeled “Sync Zabbix.” By clicking this button, NetBox will push all the information we’ve configured—such as interfaces, templates, and host groups—directly into Zabbix.
Within a few seconds, the host is created and fully ready for monitoring, without any manual setup inside Zabbix. With the heavy lifting automated, you can sit back and relax knowing that the device has been synchronized correctly.
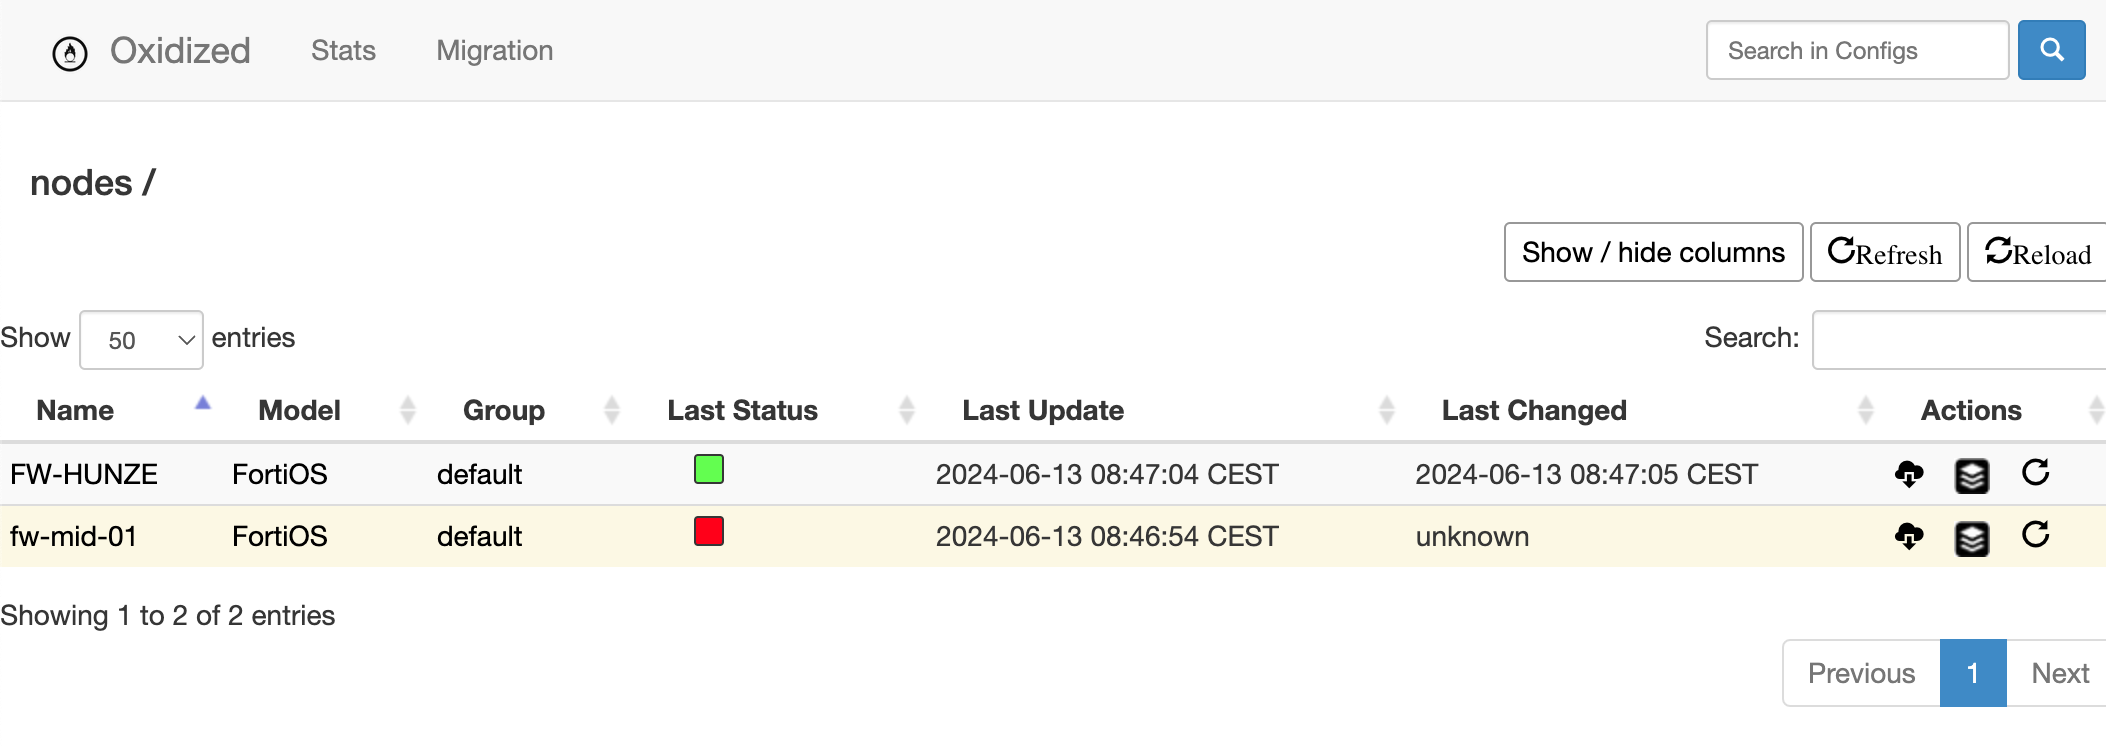
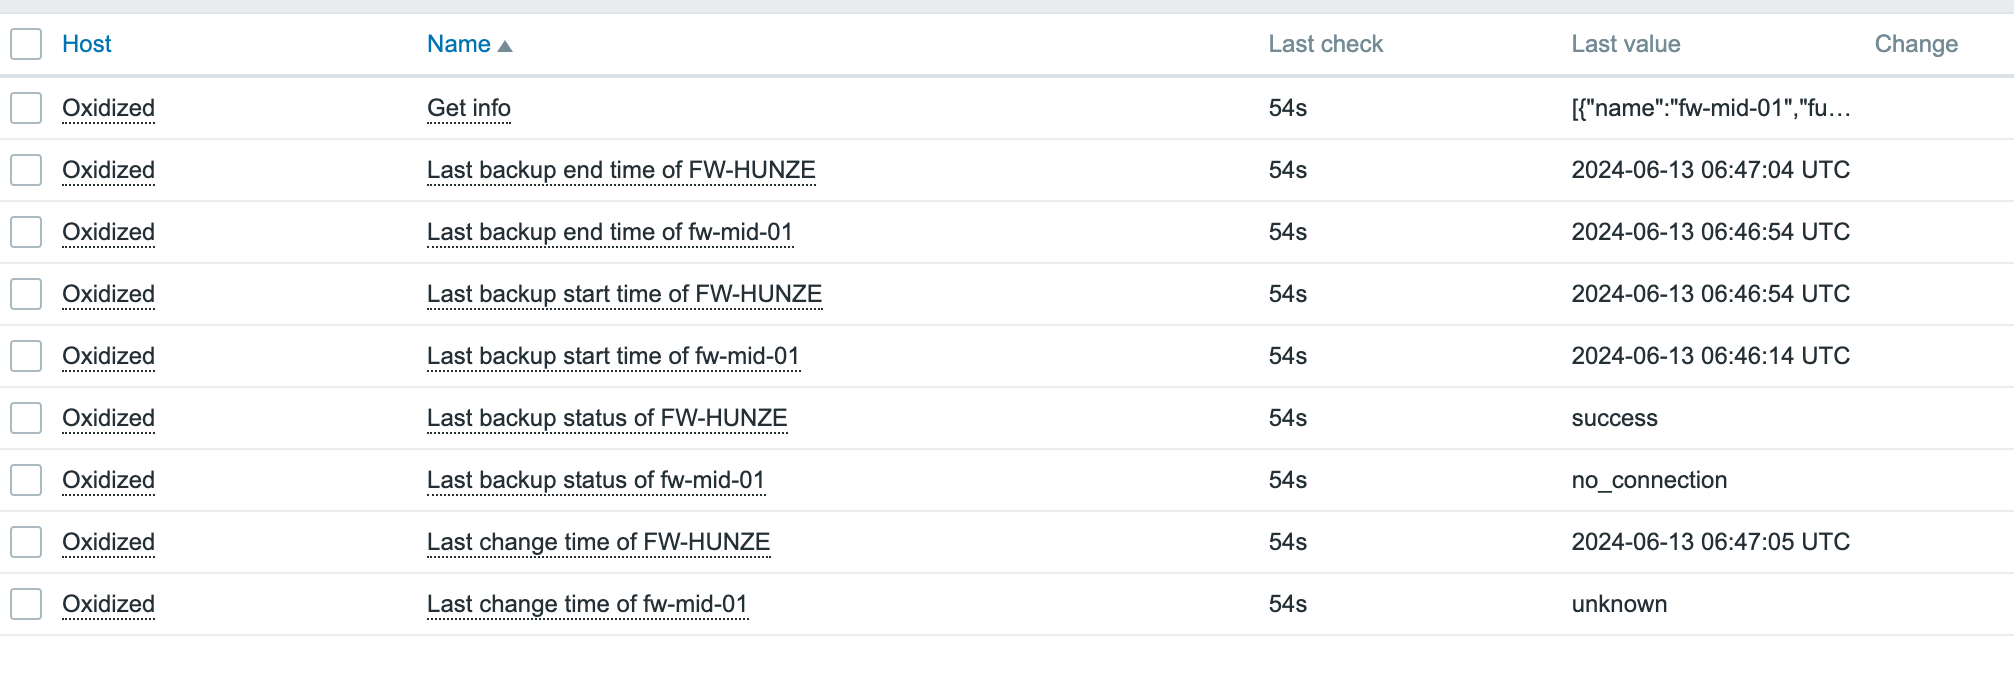
Actually, let’s head over to Zabbix and confirm the synchronization:
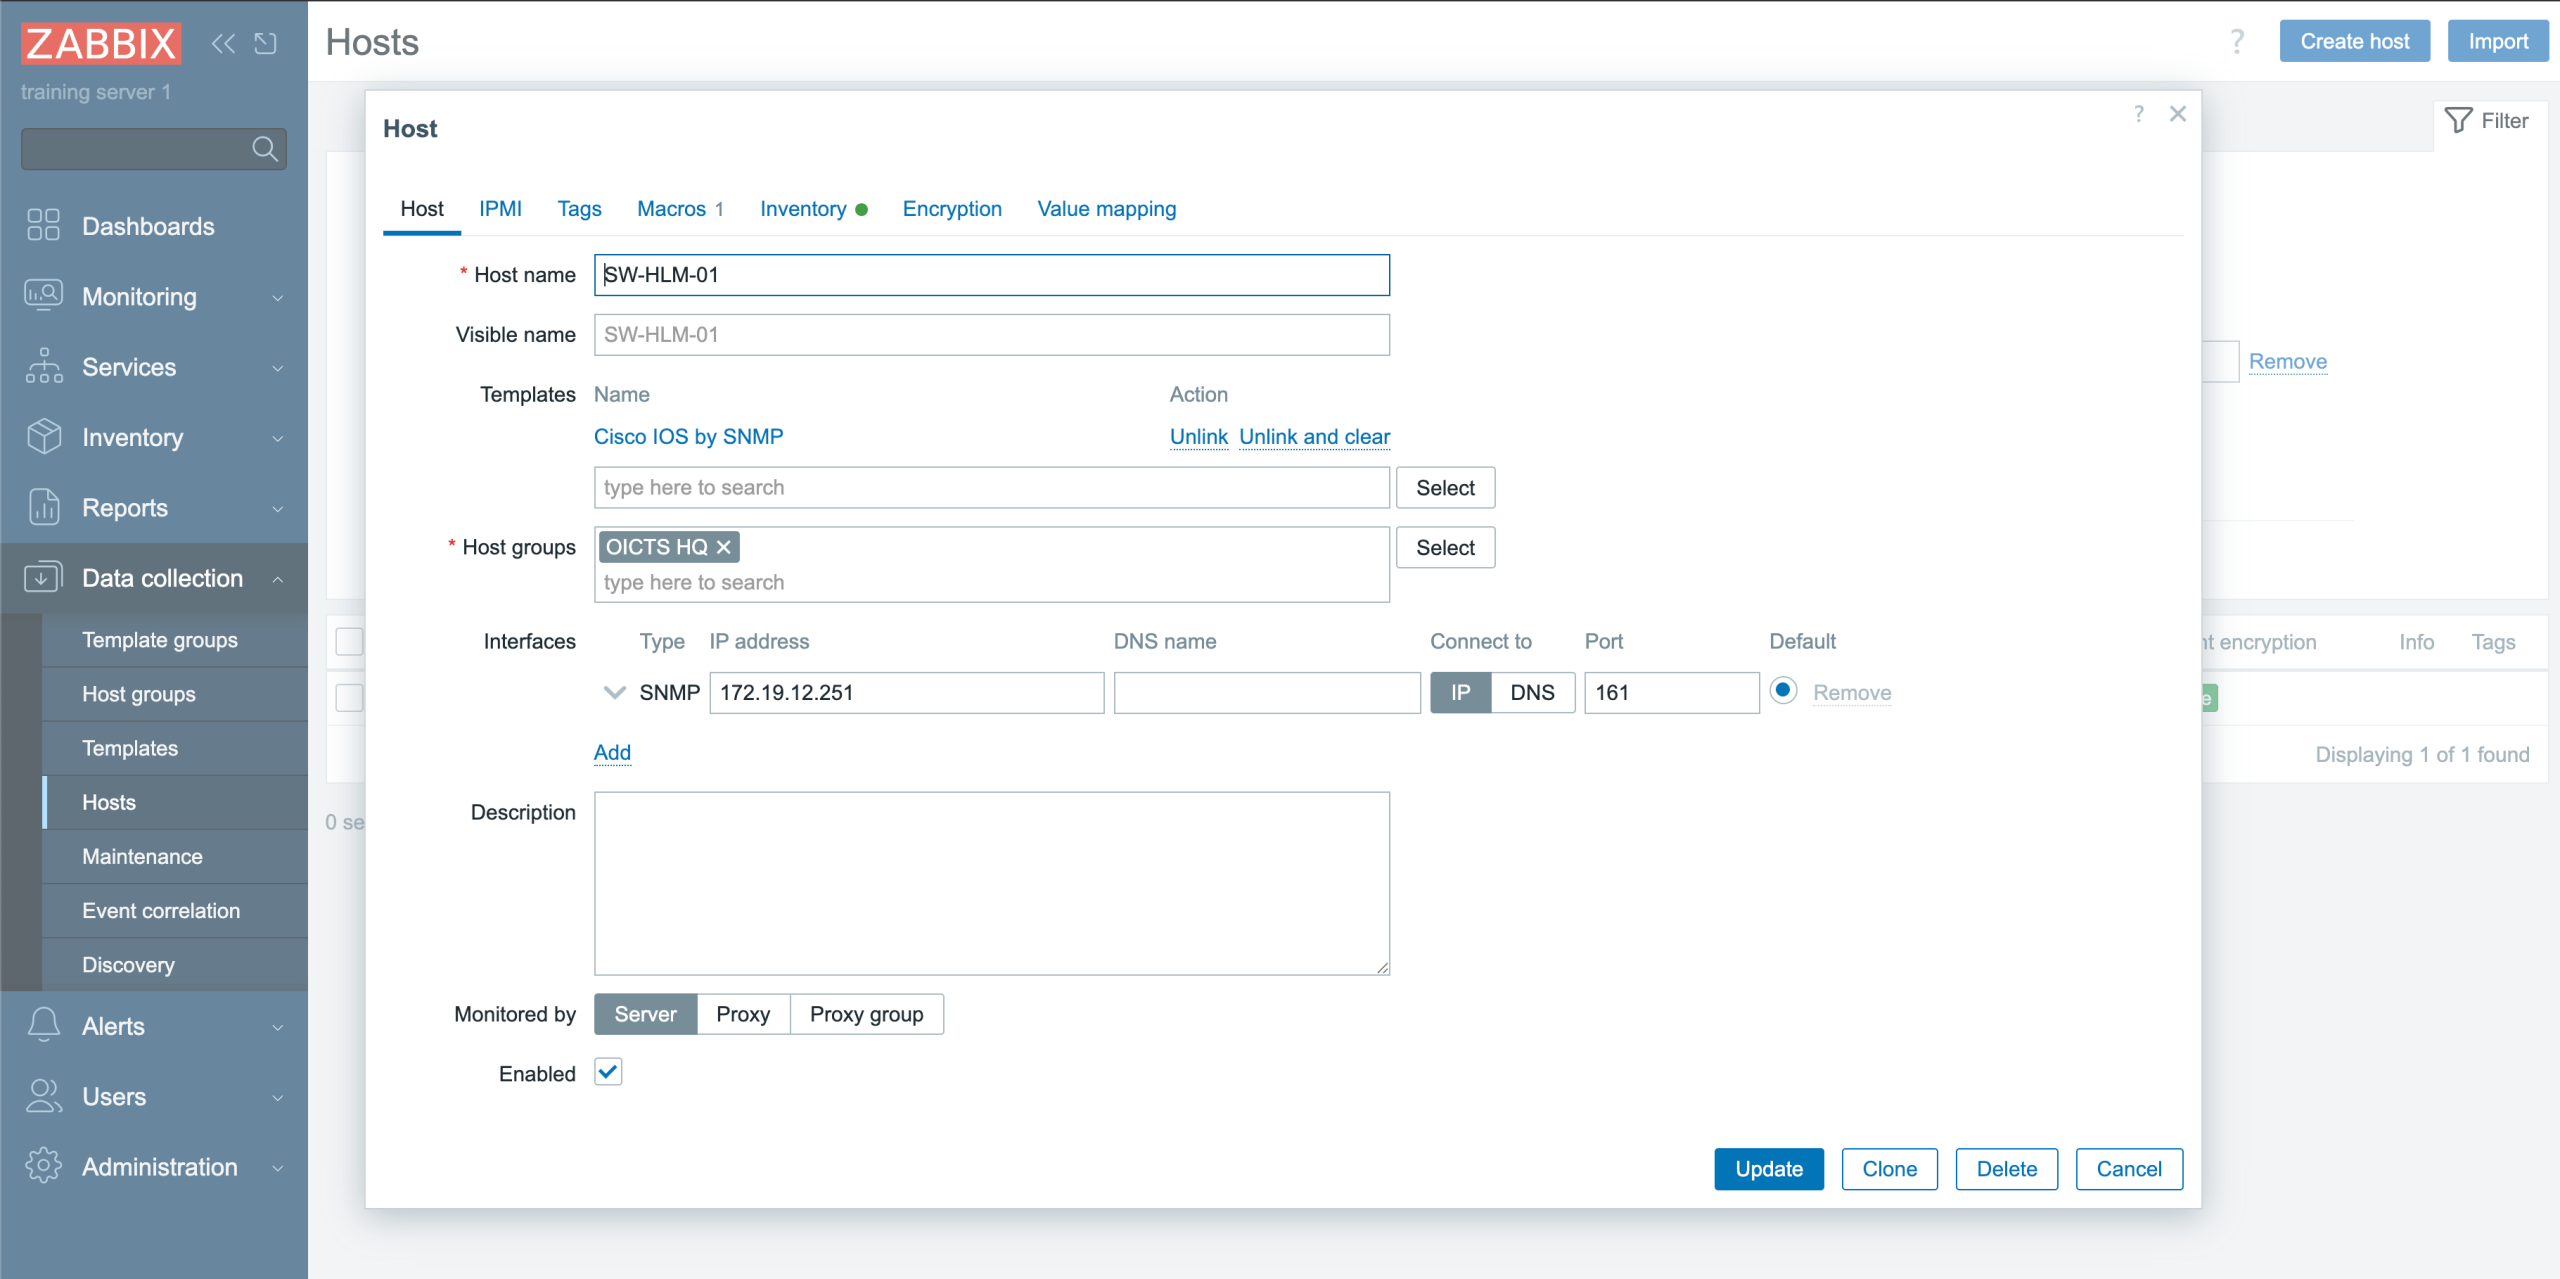
Brilliant! The host is there, the template is linked, the host group automatically was set to “OICTS HQ” and the interface also looks correct. Monitoring will start and we did not touch Zabbix itself!
Want to see it in action?
Can do! We’ve created a YouTube video for you to actually see how it works. On top of that, we plan to host webinars regarding this plugin as well. You can register for all our webinars for free via the Zabbix website.
Is this it?
No! Actually there is a lot more we can do with this NetBox plugin, but it’s just that this blog post is not the correct place to show it all. Just to give you an idea, we can set maintenance from NetBox, which automatically will sync it to Zabbix. This way we again have a single source of truth and make sure we can see from a helicopter view where the impact is.
Furthermore, automatic synchronization can be set up so that any changes in Zabbix are overridden by the NetBox configuration. This way, we make sure there is no drift between NetBox and Zabbix. It also guarantees that if engineers forget to manually synchronize, no harm is done. However, the manual sync button will always be there, as nobody wants to wait to fix the monitoring when changes are made!
In addition, the plugin fully supports proxies and proxy groups – just as you know them from Zabbix. We’ve just haven’t shown it here to keep it somewhat short.
Roadmap
Although this project is just a side gig (we still dedicate our resources to Zabbix) we of course have a vision and roadmap that we would like to chase.
One major feature that’s on the roadmap is to show host problems in NetBox. By retrieving the current problems for a given host and showing them in NetBox, we should be able to limit the time spent in Zabbix even further. Our goal is to realize a “Single Pane of Glass” (just as NetBox is the “Single Source of Truth.”
The post NetBox and Zabbix – An Integration that Just Fits appeared first on Zabbix Blog.

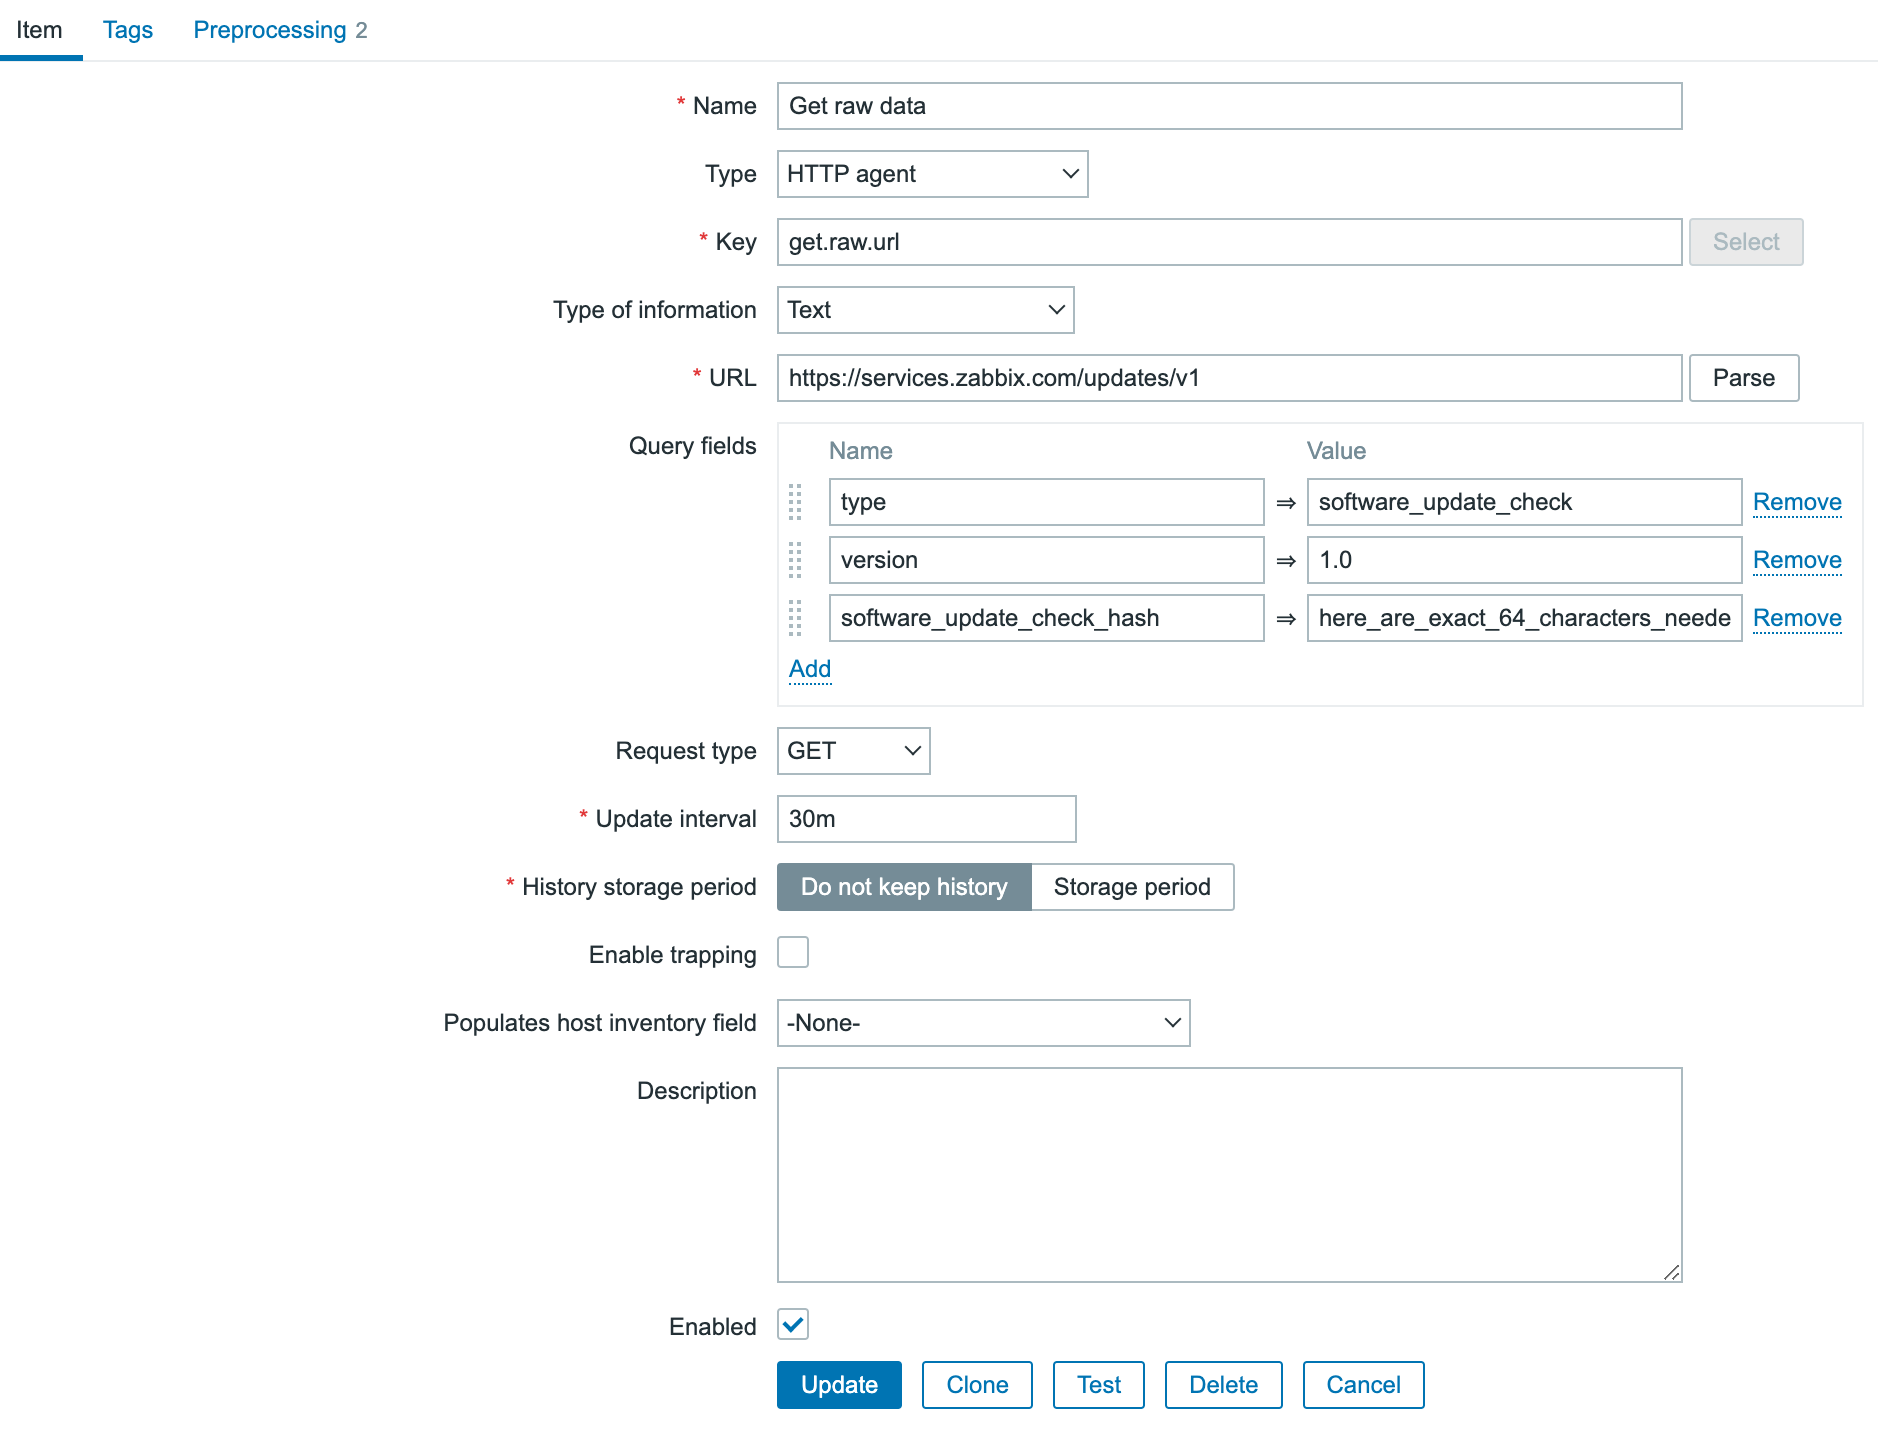
 for the example i just used ‘here_are_exact_64_characters_needed_as_a_custom_hash_for_zabbix_’