Post Syndicated from Lukasz Mierzwa original https://blog.cloudflare.com/monitoring-our-monitoring/

Background

We use Prometheus as our core monitoring system. We’ve been heavy Prometheus users since 2017 when we migrated off our previous monitoring system which used a customized Nagios setup. Despite growing our infrastructure a lot, adding tons of new products and learning some hard lessons about operating Prometheus at scale, our original architecture of Prometheus (see Monitoring Cloudflare’s Planet-Scale Edge Network with Prometheus for an in depth walk through) remains virtually unchanged, proving that Prometheus is a solid foundation for building observability into your services.
One of the key responsibilities of Prometheus is to alert us when something goes wrong and in this blog post we’ll talk about how we make those alerts more reliable – and we’ll introduce an open source tool we’ve developed to help us with that, and share how you can use it too. If you’re not familiar with Prometheus you might want to start by watching this video to better understand the topic we’ll be covering here.
Prometheus works by collecting metrics from our services and storing those metrics inside its database, called TSDB. We can then query these metrics using Prometheus query language called PromQL using ad-hoc queries (for example to power Grafana dashboards) or via alerting or recording rules. A rule is basically a query that Prometheus will run for us in a loop, and when that query returns any results it will either be recorded as new metrics (with recording rules) or trigger alerts (with alerting rules).
Prometheus alerts
Since we’re talking about improving our alerting we’ll be focusing on alerting rules.
To create alerts we first need to have some metrics collected. For the purposes of this blog post let’s assume we’re working with http_requests_total metric, which is used on the examples page. Here are some examples of how our metrics will look:
http_requests_total{job="myserver", handler="/", method=”get”, status=”200”}
http_requests_total{job="myserver", handler="/", method=”get”, status=”500”}
http_requests_total{job="myserver", handler="/posts", method=”get”, status=”200”}
http_requests_total{job="myserver", handler="/posts", method=”get”, status=”500”}
http_requests_total{job="myserver", handler="/posts/new", method=”post”, status=”201”}
http_requests_total{job="myserver", handler="/posts/new", method=”post”, status=”401”}
Let’s say we want to alert if our HTTP server is returning errors to customers.
Since, all we need to do is check our metric that tracks how many responses with HTTP status code 500 there were, a simple alerting rule could like this:
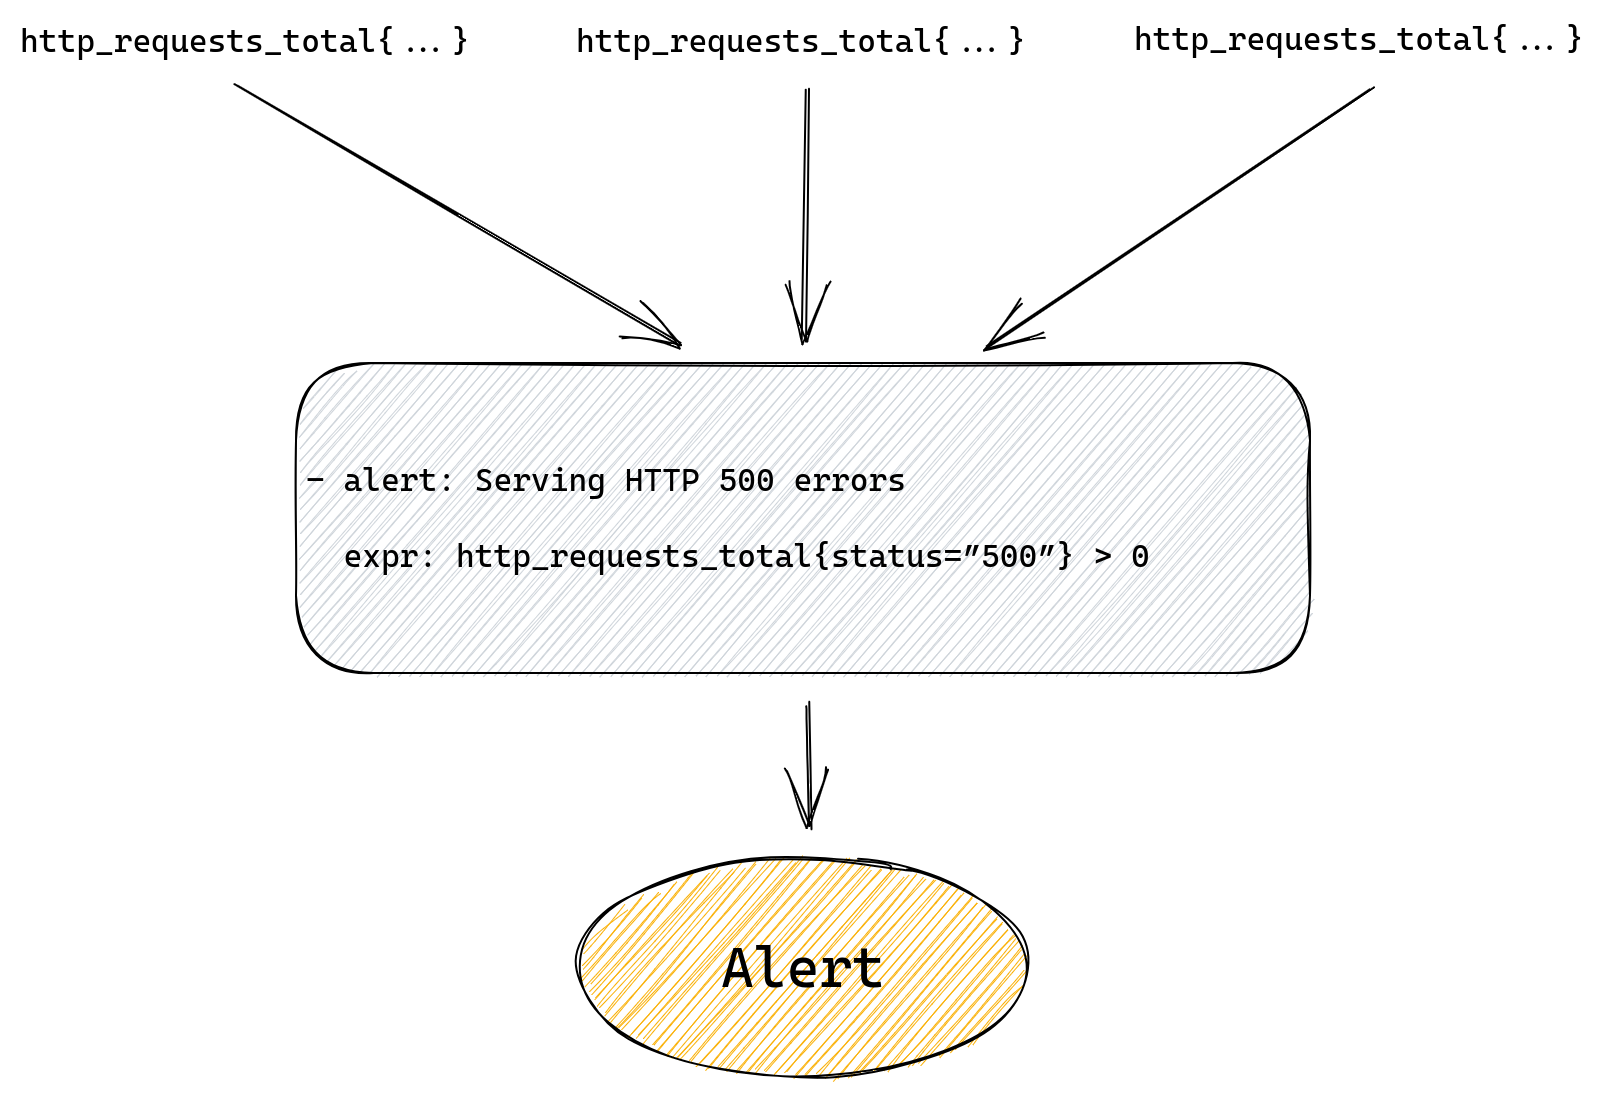
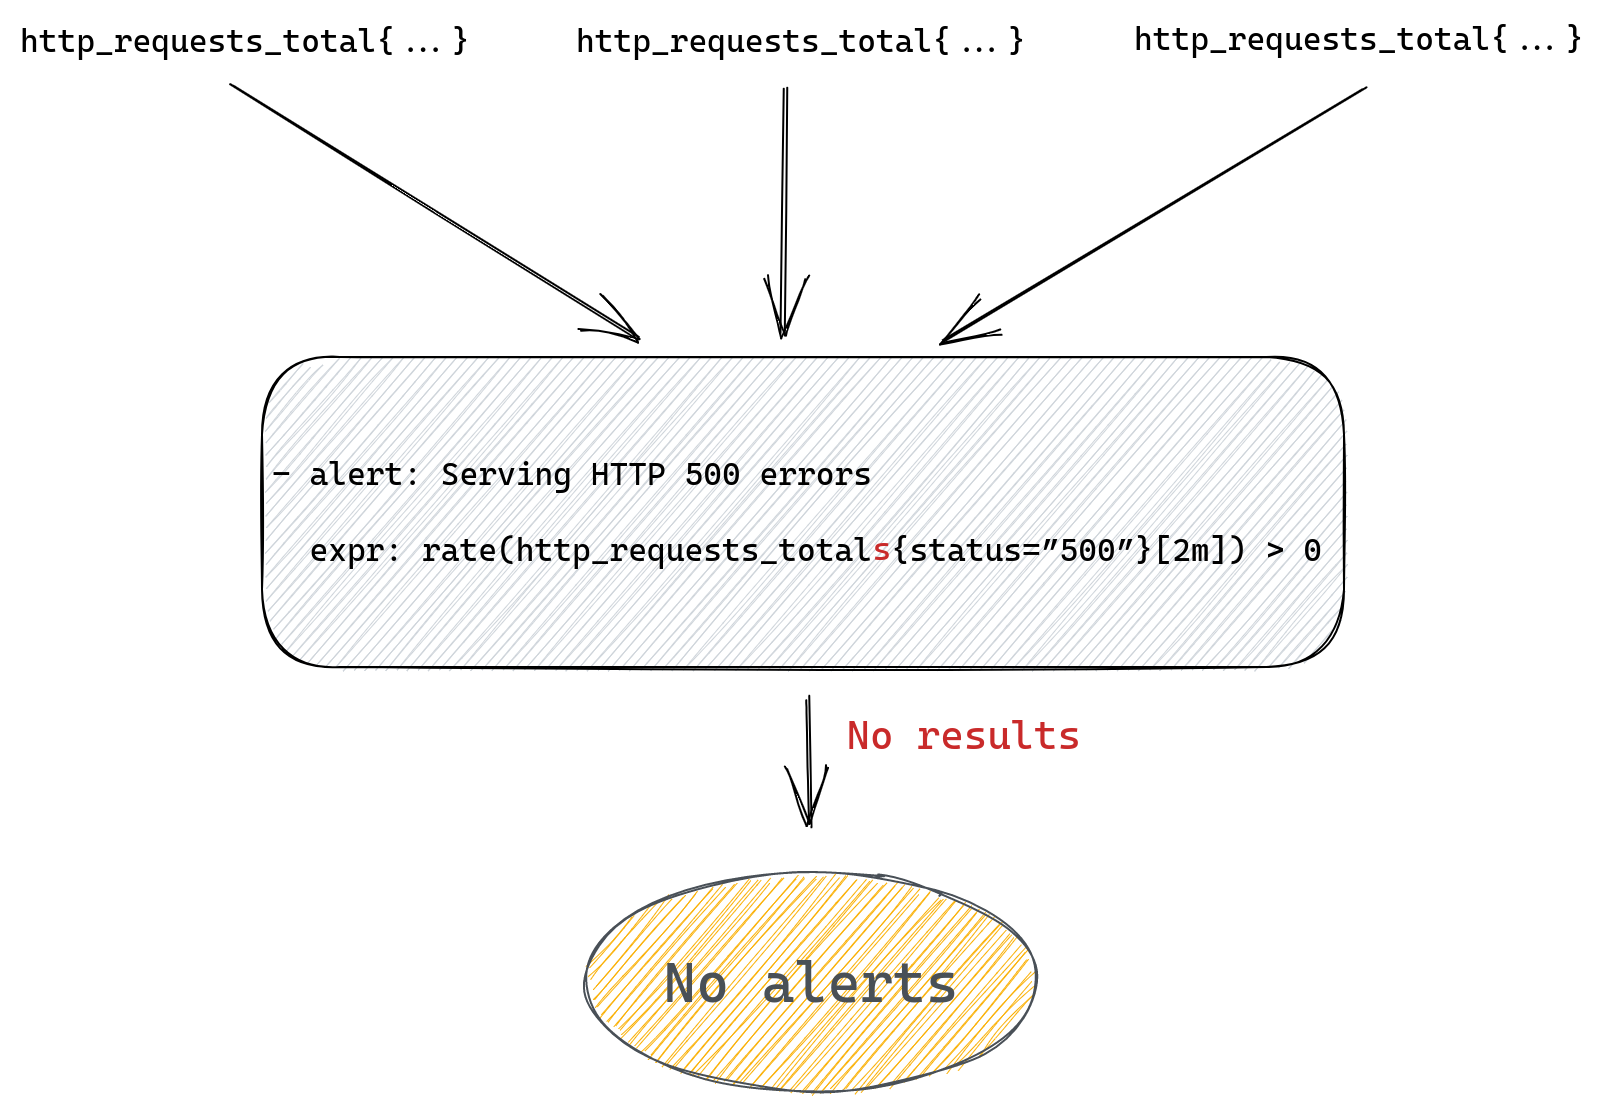
- alert: Serving HTTP 500 errors
  expr: http_requests_total{status=”500”} > 0
This will alert us if we have any 500 errors served to our customers. Prometheus will run our query looking for a time series named http_requests_total that also has a status label with value “500”. Then it will filter all those matched time series and only return ones with value greater than zero.
If our alert rule returns any results a fire will be triggered, one for each returned result.
If our rule doesn’t return anything, meaning there are no matched time series, then alert will not trigger.
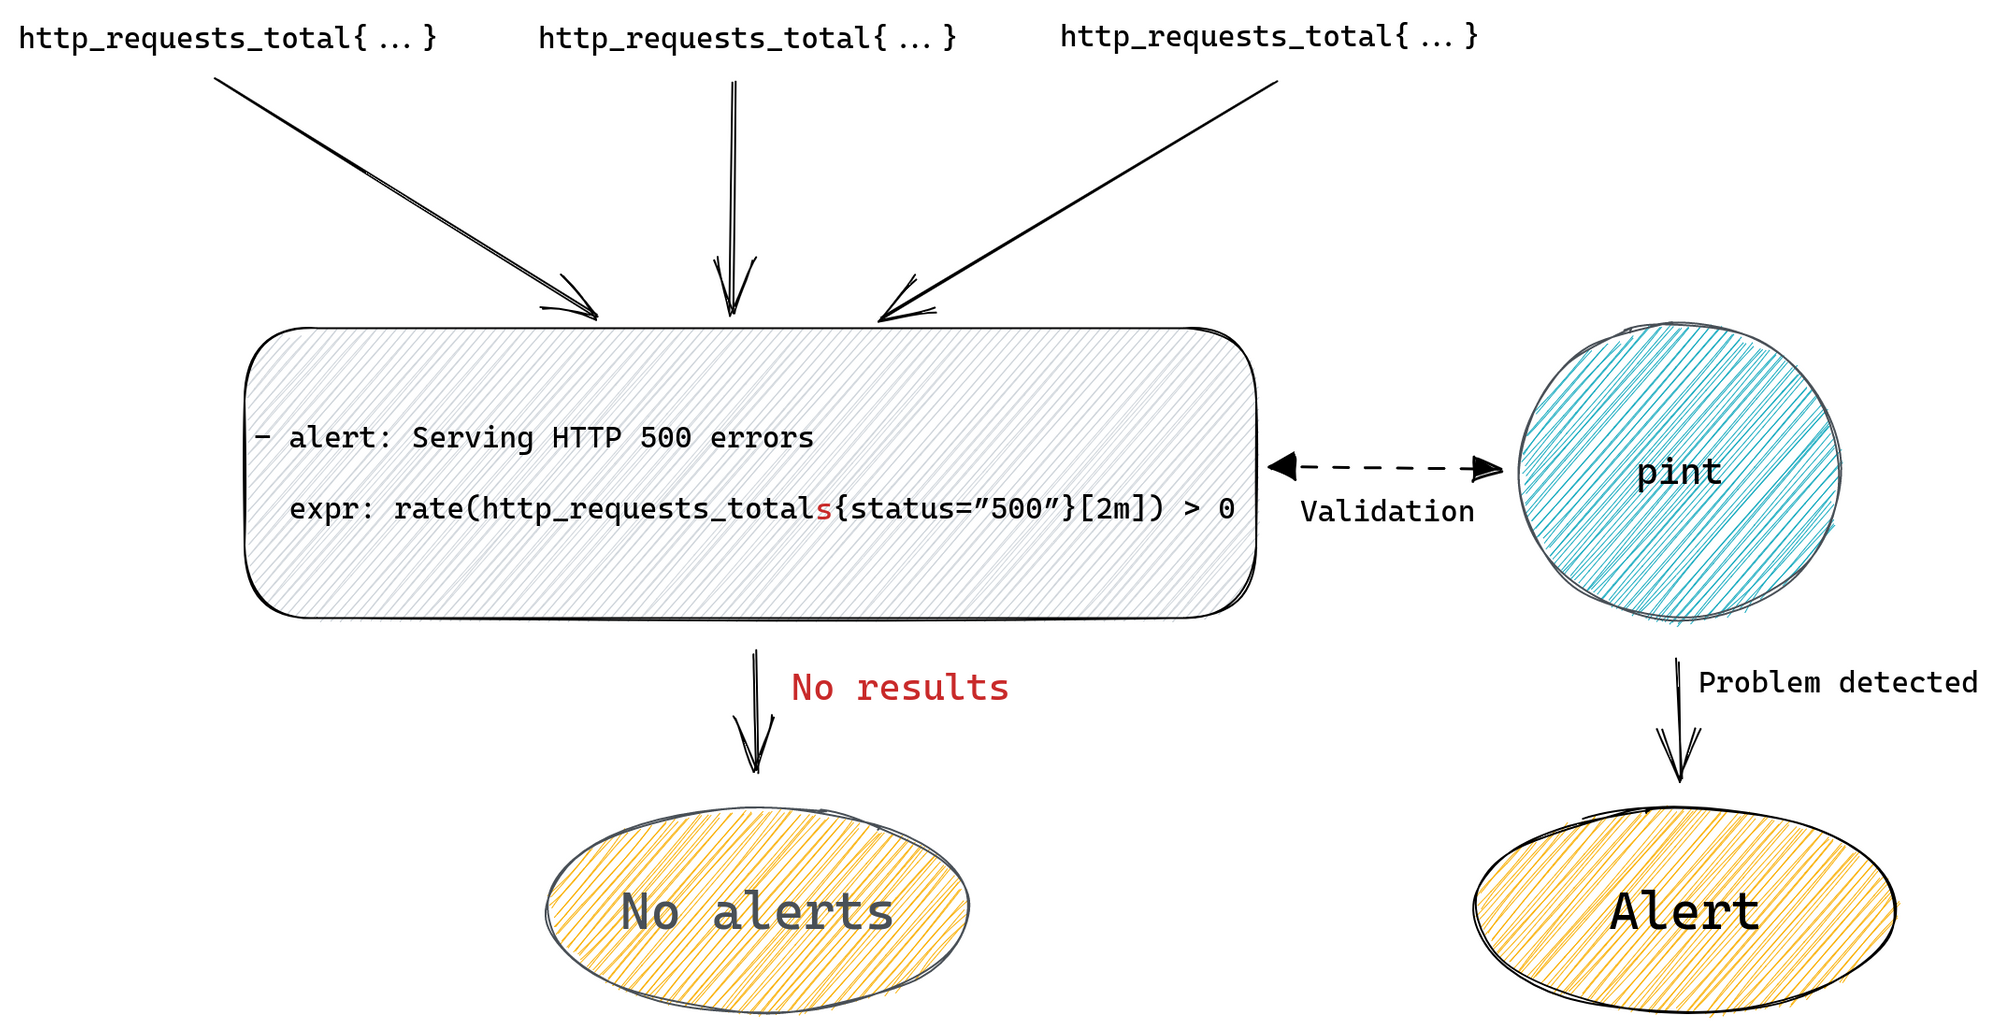
The whole flow from metric to alert is pretty simple here as we can see on the diagram below.
If we want to provide more information in the alert we can by setting additional labels and annotations, but alert and expr fields are all we need to get a working rule.
But the problem with the above rule is that our alert starts when we have our first error, and then it will never go away.
After all, our http_requests_total is a counter, so it gets incremented every time there’s a new request, which means that it will keep growing as we receive more requests. What this means for us is that our alert is really telling us “was there ever a 500 error?” and even if we fix the problem causing 500 errors we’ll keep getting this alert.
A better alert would be one that tells us if we’re serving errors right now.
For that we can use the rate() function to calculate the per second rate of errors.
Our modified alert would be:
- alert: Serving HTTP 500 errors
  expr: rate(http_requests_total{status=”500”}[2m]) > 0
The query above will calculate the rate of 500 errors in the last two minutes. If we start responding with errors to customers our alert will fire, but once errors stop so will this alert.
This is great because if the underlying issue is resolved the alert will resolve too.
We can improve our alert further by, for example, alerting on the percentage of errors, rather than absolute numbers, or even calculate error budget, but let’s stop here for now.
It’s all very simple, so what do we mean when we talk about improving the reliability of alerting? What could go wrong here?
Maybe a spot for a subheading here as you move on from the intro?
What could go wrong?
We can craft a valid YAML file with a rule definition that has a perfectly valid query that will simply not work how we expect it to work. Which, when it comes to alerting rules, might mean that the alert we rely upon to tell us when something is not working correctly will fail to alert us when it should. To better understand why that might happen let’s first explain how querying works in Prometheus.
Prometheus querying basics
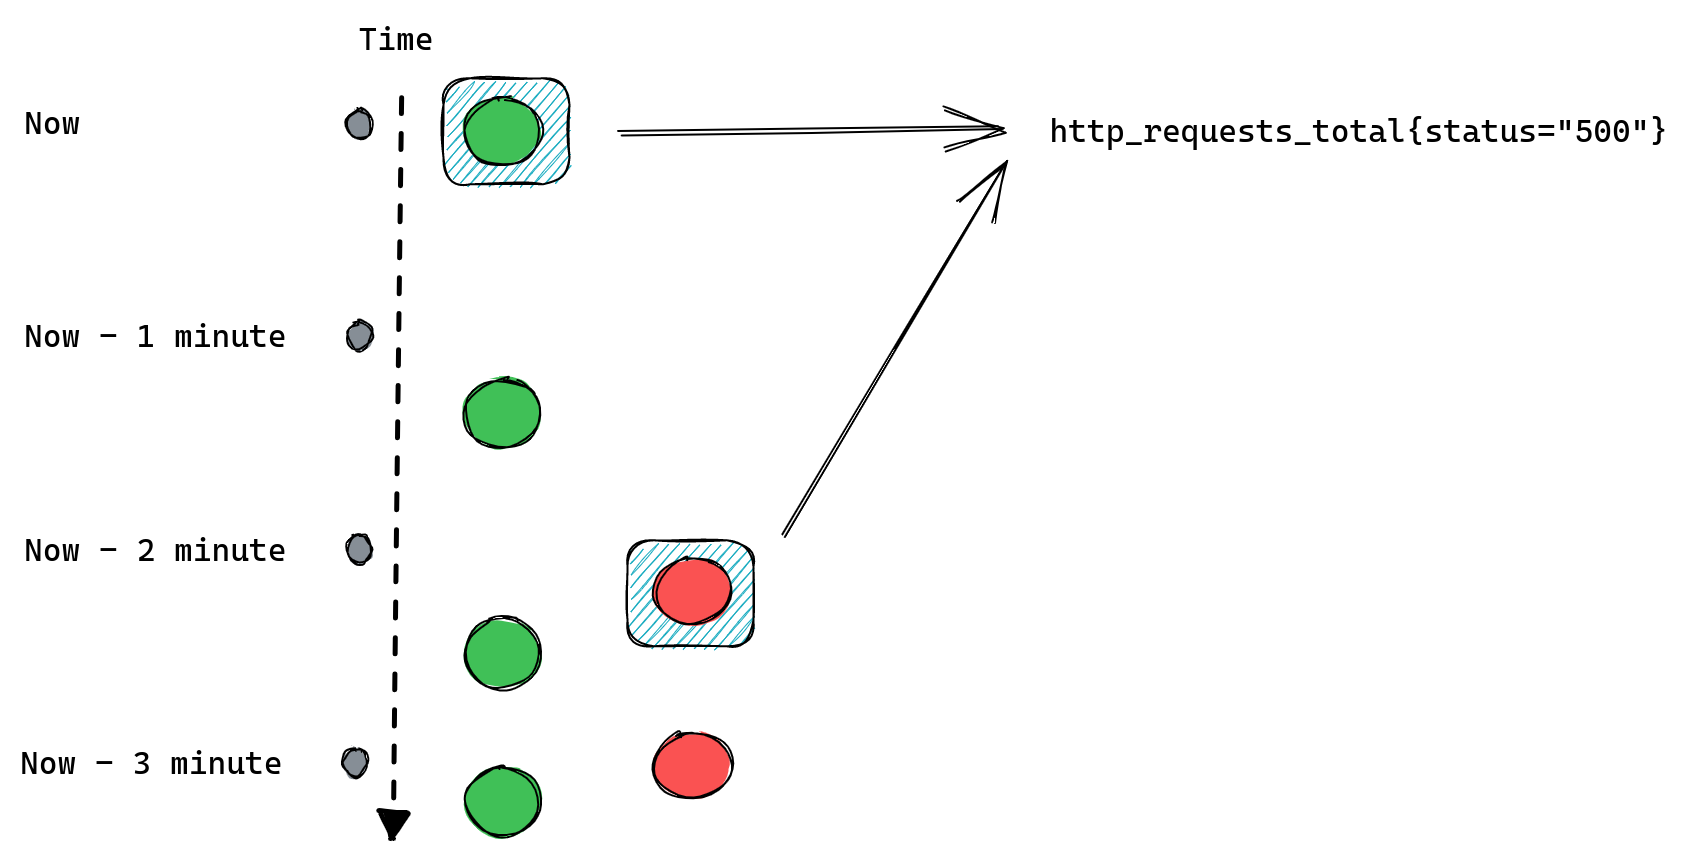
There are two basic types of queries we can run against Prometheus. The first one is an instant query. It allows us to ask Prometheus for a point in time value of some time series. If we write our query as http_requests_total we’ll get all time series named http_requests_total along with the most recent value for each of them. We can further customize the query and filter results by adding label matchers, like http_requests_total{status=”500”}.
Let’s consider we have two instances of our server, green and red, each one is scraped (Prometheus collects metrics from it) every one minute (independently of each other).
This is what happens when we issue an instant query:
There’s obviously more to it as we can use functions and build complex queries that utilize multiple metrics in one expression. But for the purposes of this blog post we’ll stop here.
The important thing to know about instant queries is that they return the most recent value of a matched time series, and they will look back for up to five minutes (by default) into the past to find it. If the last value is older than five minutes then it’s considered stale and Prometheus won’t return it anymore.
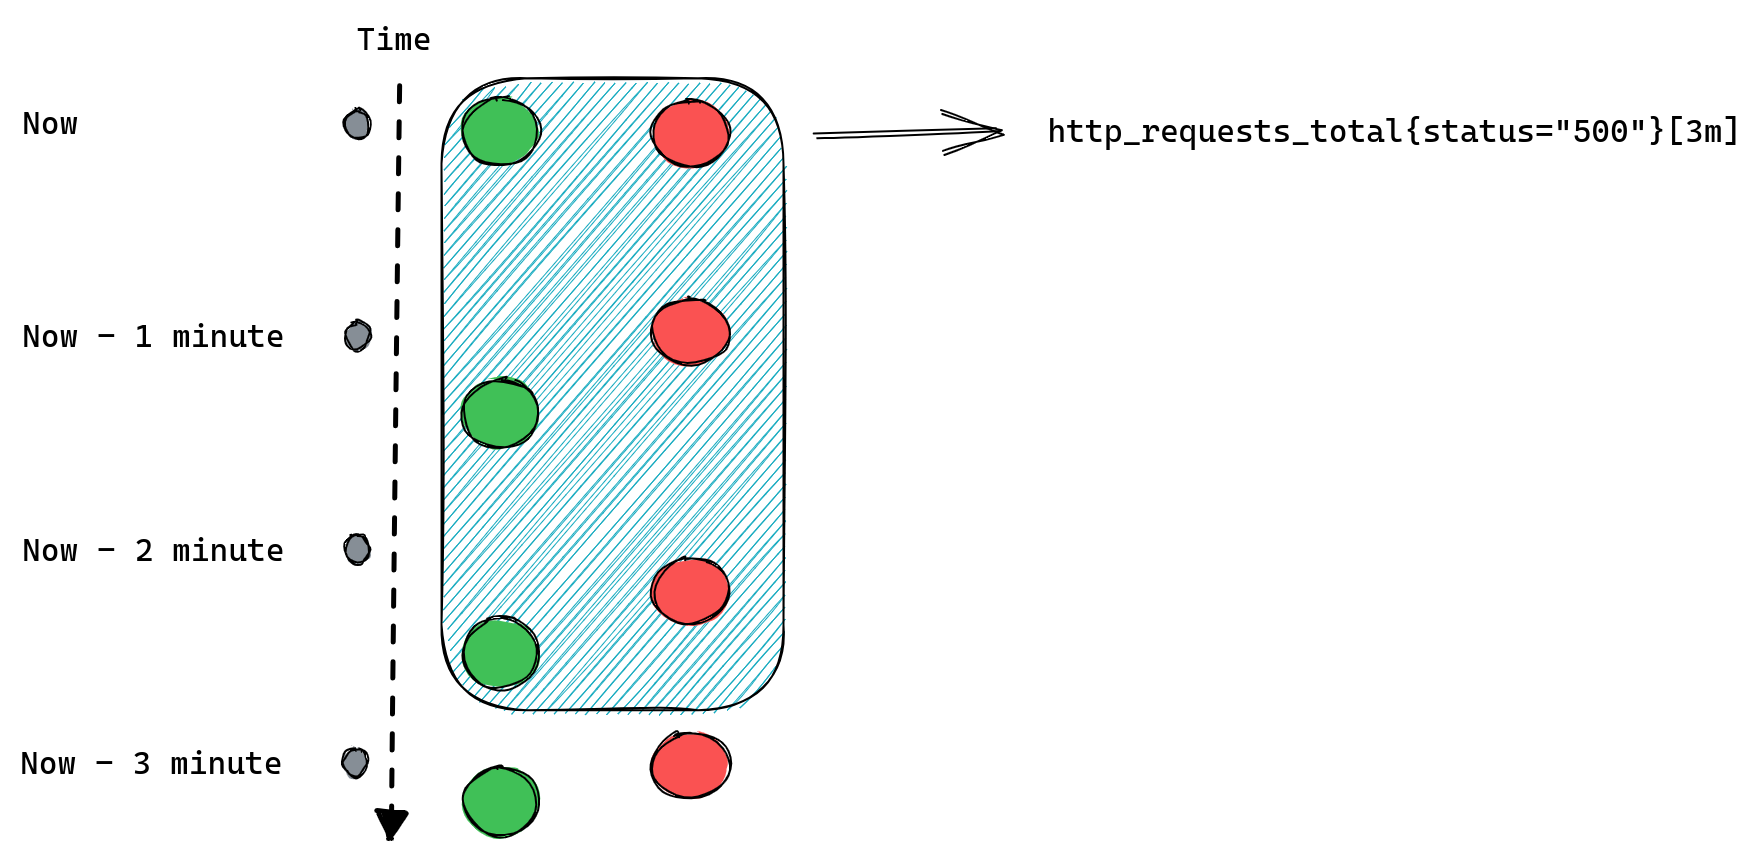
The second type of query is a range query – it works similarly to instant queries, the difference is that instead of returning us the most recent value it gives us a list of values from the selected time range. That time range is always relative so instead of providing two timestamps we provide a range, like “20 minutes”. When we ask for a range query with a 20 minutes range it will return us all values collected for matching time series from 20 minutes ago until now.
An important distinction between those two types of queries is that range queries don’t have the same “look back for up to five minutes” behavior as instant queries. If Prometheus cannot find any values collected in the provided time range then it doesn’t return anything.
If we modify our example to request [3m] range query we should expect Prometheus to return three data points for each time series:
When queries don’t return anything
Knowing a bit more about how queries work in Prometheus we can go back to our alerting rules and spot a potential problem: queries that don’t return anything.
If our query doesn’t match any time series or if they’re considered stale then Prometheus will return an empty result. This might be because we’ve made a typo in the metric name or label filter, the metric we ask for is no longer being exported, or it was never there in the first place, or we’ve added some condition that wasn’t satisfied, like value of being non-zero in our http_requests_total{status=”500”} > 0 example.
Prometheus will not return any error in any of the scenarios above because none of them are really problems, it’s just how querying works. If you ask for something that doesn’t match your query then you get empty results. This means that there’s no distinction between “all systems are operational” and “you’ve made a typo in your query”. So if you’re not receiving any alerts from your service it’s either a sign that everything is working fine, or that you’ve made a typo, and you have no working monitoring at all, and it’s up to you to verify which one it is.
For example, we could be trying to query for http_requests_totals instead of http_requests_total (an extra “s” at the end) and although our query will look fine it won’t ever produce any alert.
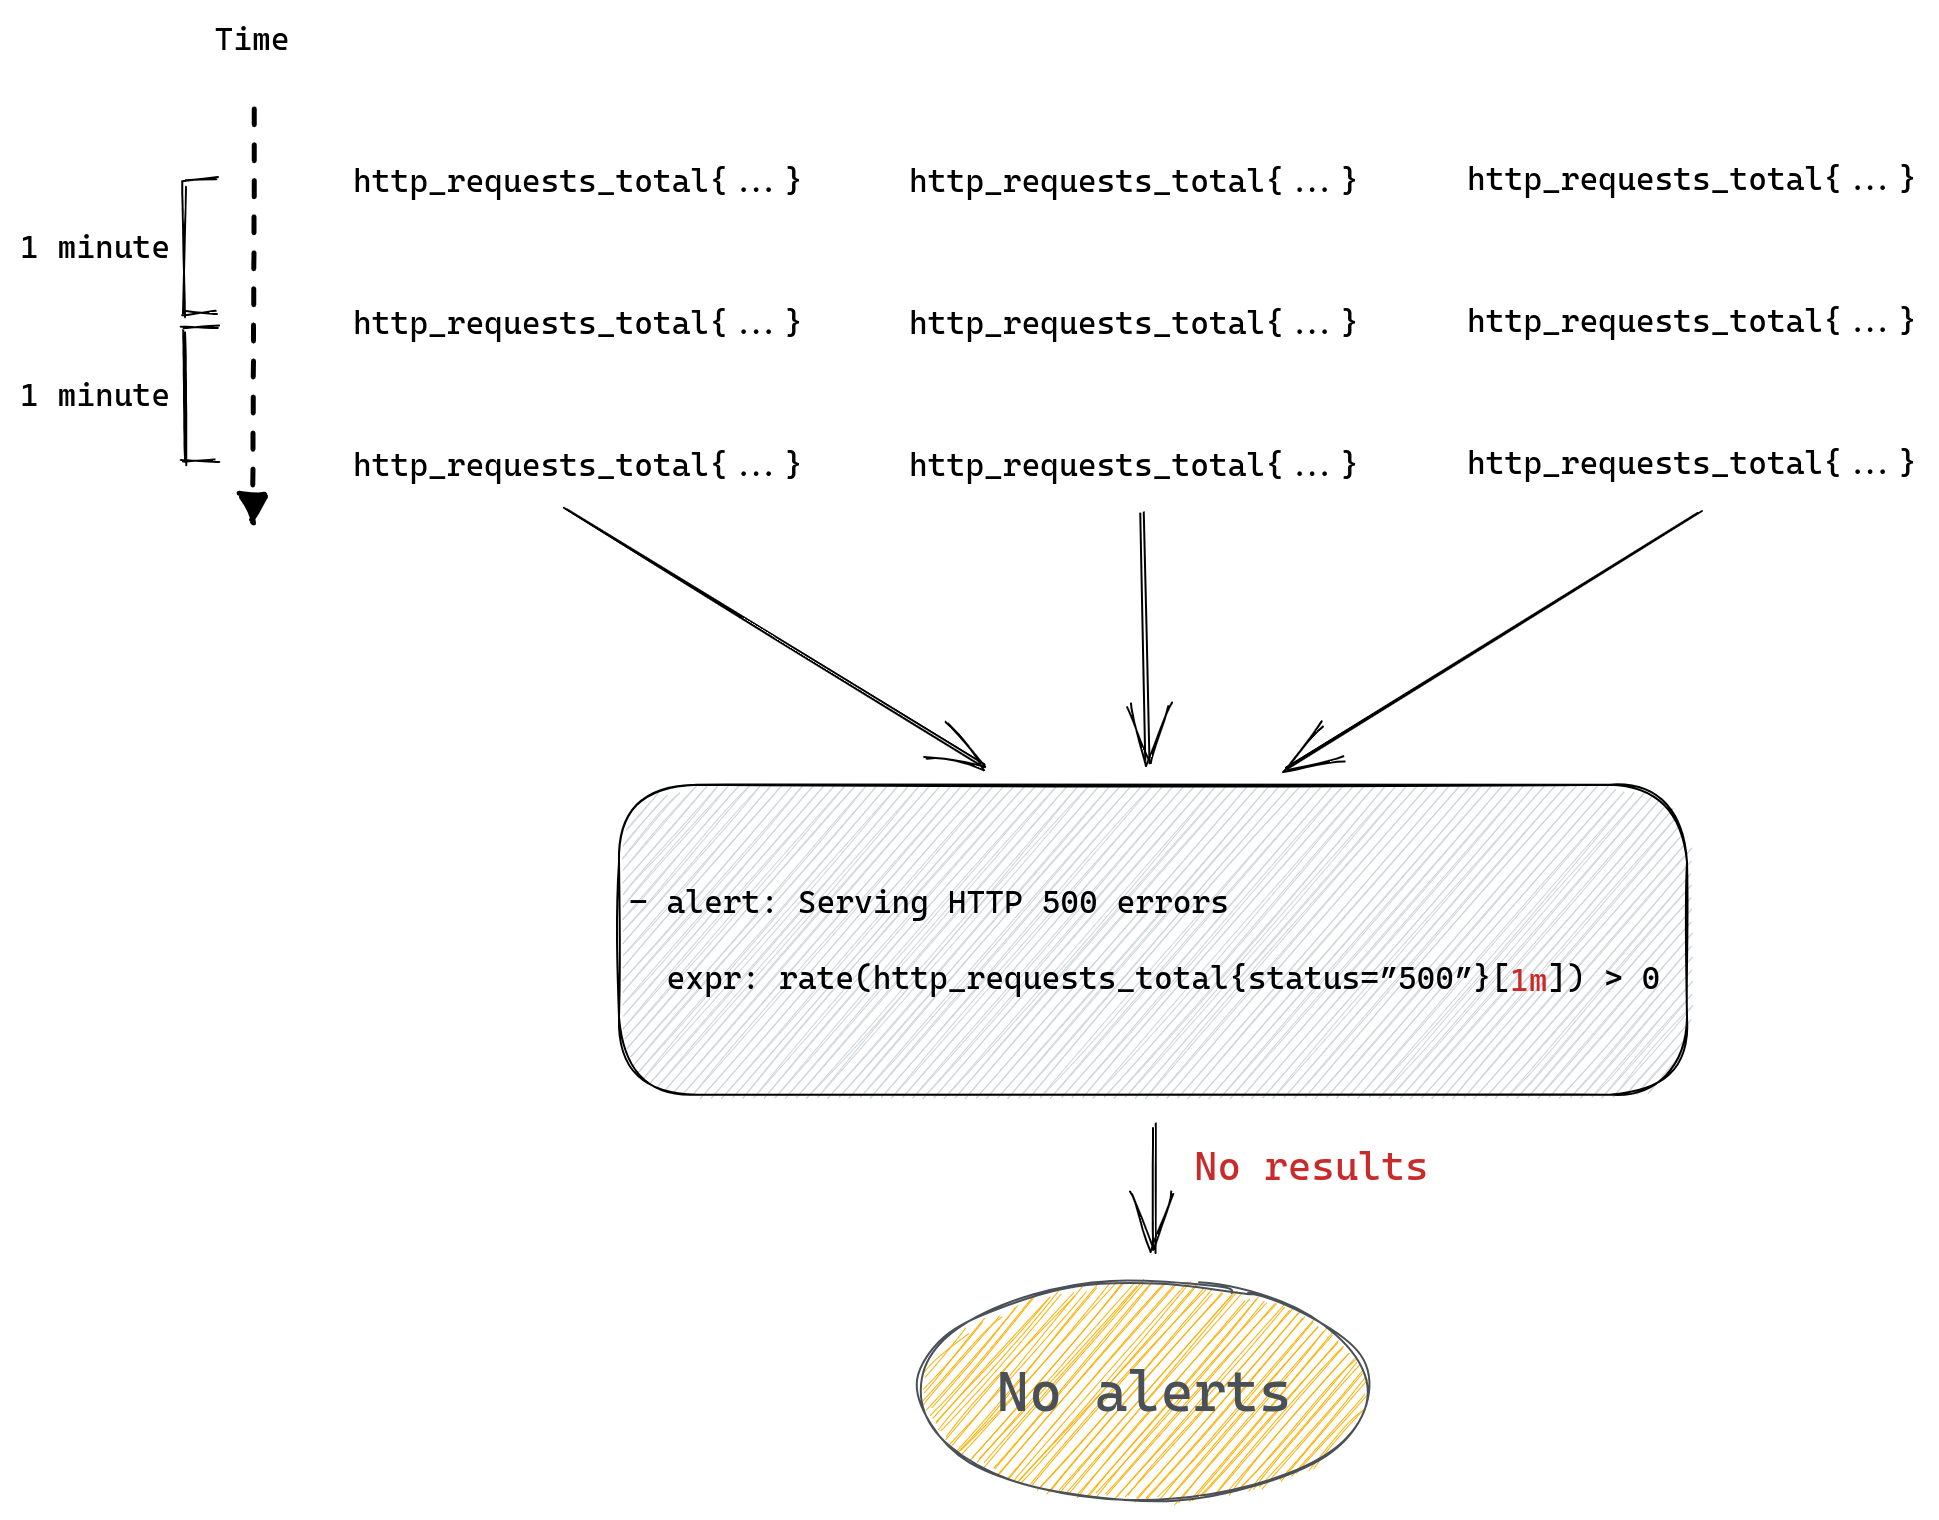
Range queries can add another twist – they’re mostly used in Prometheus functions like rate(), which we used in our example. This function will only work correctly if it receives a range query expression that returns at least two data points for each time series, after all it’s impossible to calculate rate from a single number.
Since the number of data points depends on the time range we passed to the range query, which we then pass to our rate() function, if we provide a time range that only contains a single value then rate won’t be able to calculate anything and once again we’ll return empty results.
The number of values collected in a given time range depends on the interval at which Prometheus collects all metrics, so to use rate() correctly you need to know how your Prometheus server is configured. You can read more about this here and here if you want to better understand how rate() works in Prometheus.
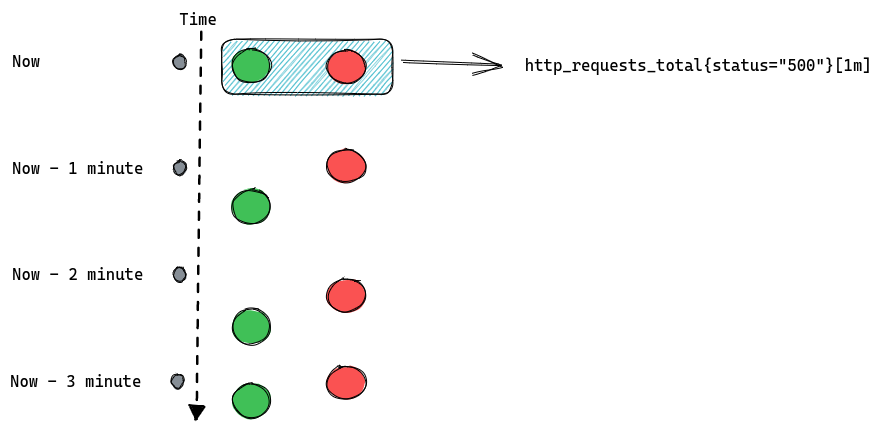
For example if we collect our metrics every one minute then a range query http_requests_total[1m] will be able to find only one data point. Here’s a reminder of how this looks:
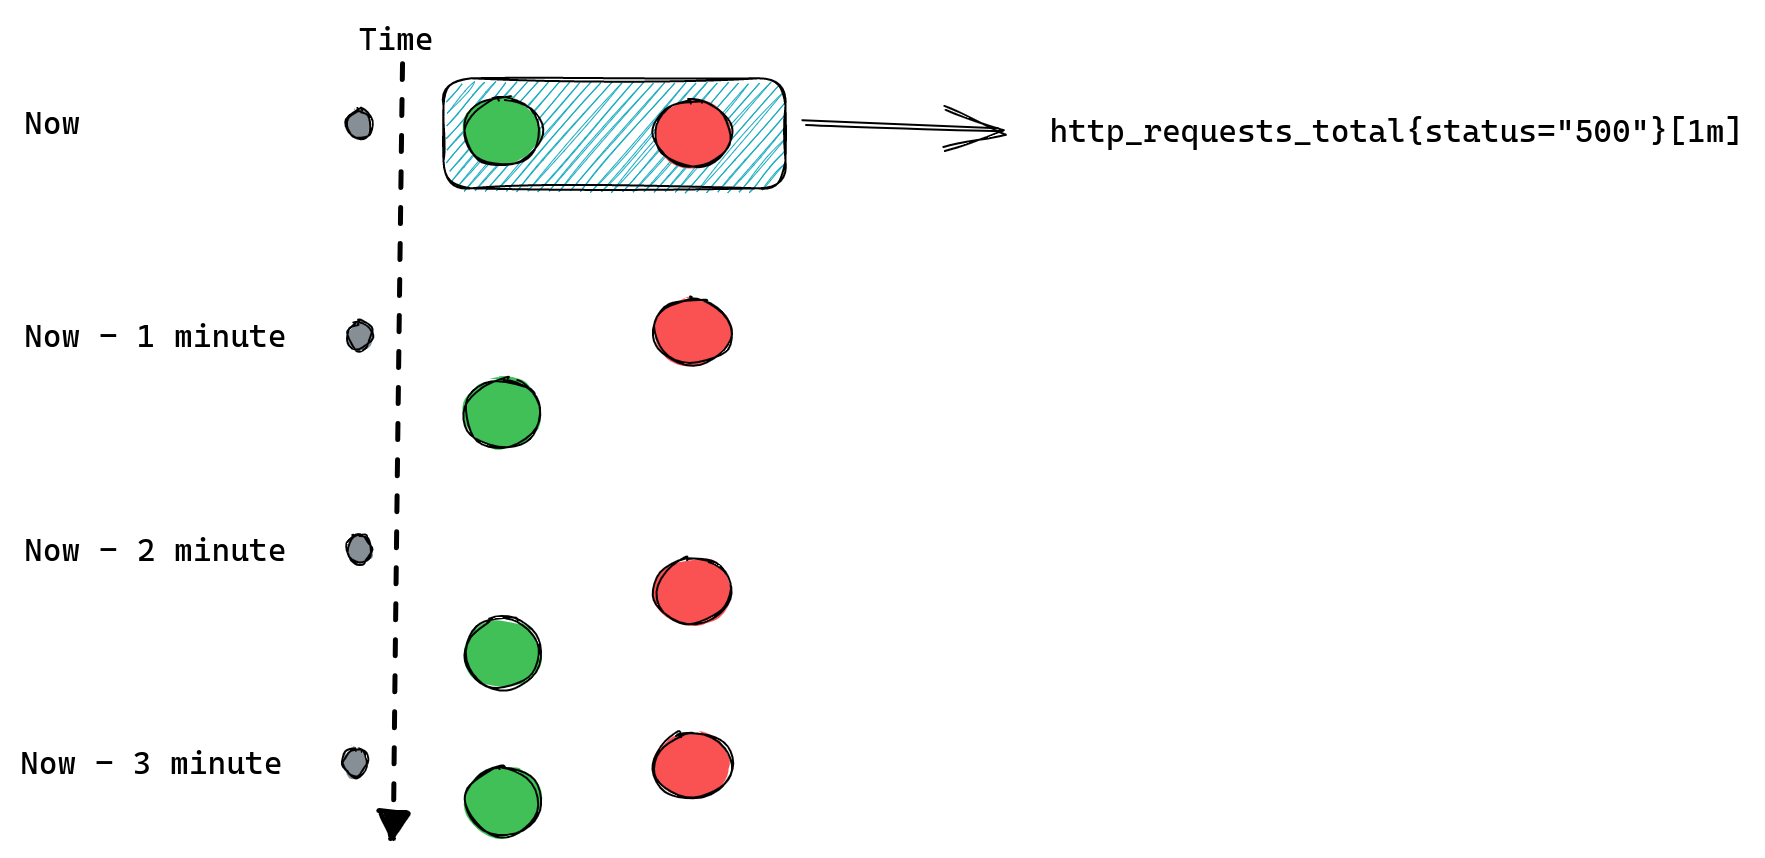
Since, as we mentioned before, we can only calculate rate() if we have at least two data points, calling rate(http_requests_total[1m]) will never return anything and so our alerts will never work.
There are more potential problems we can run into when writing Prometheus queries, for example any operations between two metrics will only work if both have the same set of labels, you can read about this here. But for now we’ll stop here, listing all the gotchas could take a while. The point to remember is simple: if your alerting query doesn’t return anything then it might be that everything is ok and there’s no need to alert, but it might also be that you’ve mistyped your metrics name, your label filter cannot match anything, your metric disappeared from Prometheus, you are using too small time range for your range queries etc.
Renaming metrics can be dangerous
We’ve been running Prometheus for a few years now and during that time we’ve grown our collection of alerting rules a lot. Plus we keep adding new products or modifying existing ones, which often includes adding and removing metrics, or modifying existing metrics, which may include renaming them or changing what labels are present on these metrics.
A lot of metrics come from metrics exporters maintained by the Prometheus community, like node_exporter, which we use to gather some operating system metrics from all of our servers. Those exporters also undergo changes which might mean that some metrics are deprecated and removed, or simply renamed.
A problem we’ve run into a few times is that sometimes our alerting rules wouldn’t be updated after such a change, for example when we upgraded node_exporter across our fleet. Or the addition of a new label on some metrics would suddenly cause Prometheus to no longer return anything for some of the alerting queries we have, making such an alerting rule no longer useful.
It’s worth noting that Prometheus does have a way of unit testing rules, but since it works on mocked data it’s mostly useful to validate the logic of a query. Unit testing won’t tell us if, for example, a metric we rely on suddenly disappeared from Prometheus.
Chaining rules
When writing alerting rules we try to limit alert fatigue by ensuring that, among many things, alerts are only generated when there’s an action needed, they clearly describe the problem that needs addressing, they have a link to a runbook and a dashboard, and finally that we aggregate them as much as possible. This means that a lot of the alerts we have won’t trigger for each individual instance of a service that’s affected, but rather once per data center or even globally.
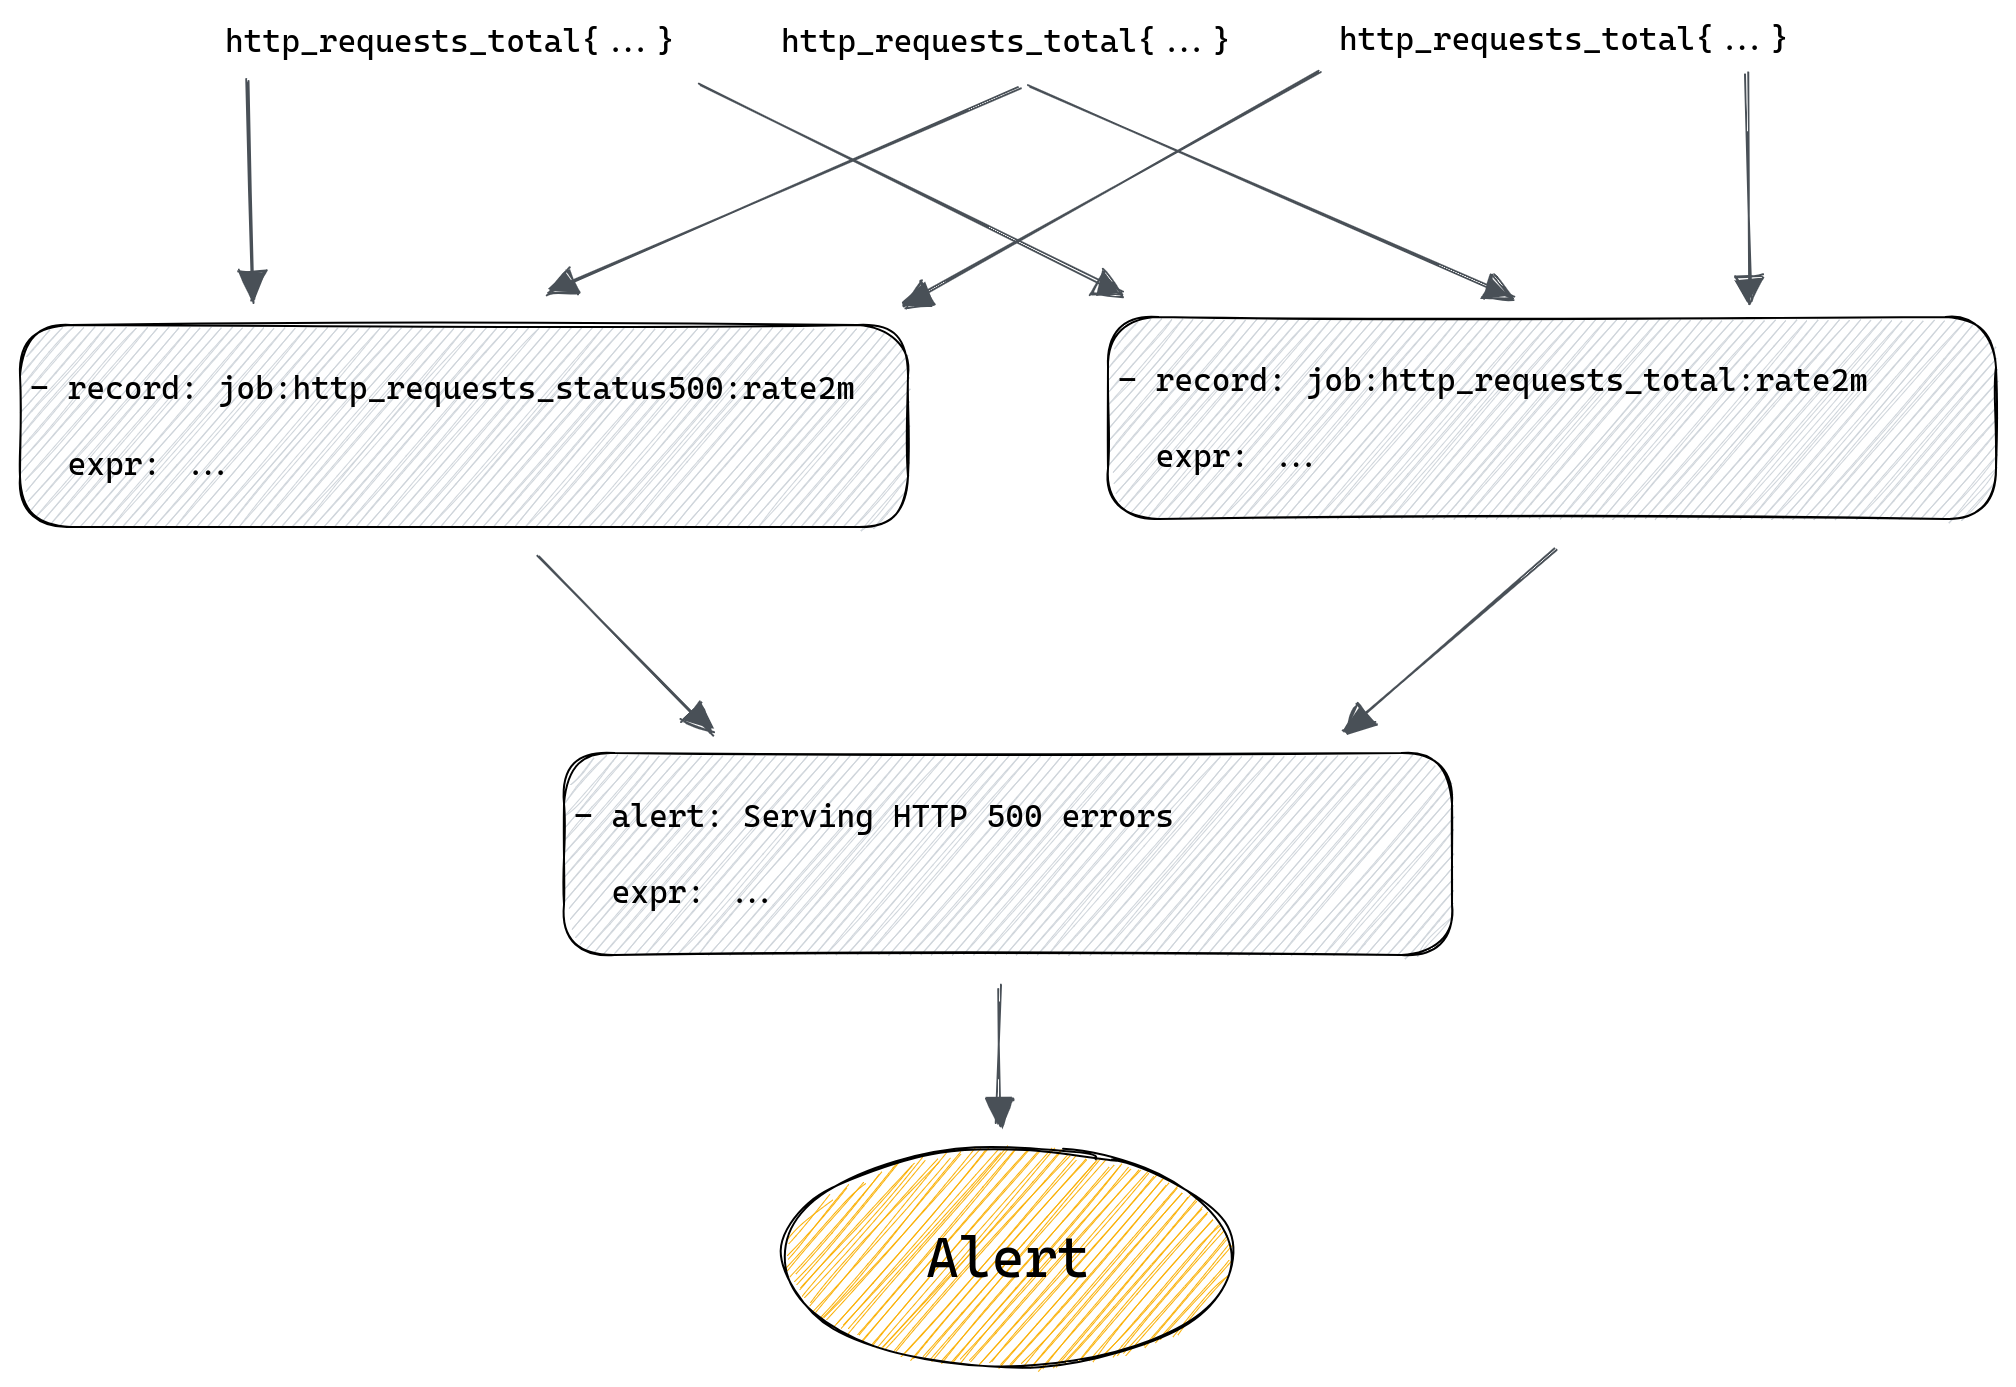
For example, we might alert if the rate of HTTP errors in a datacenter is above 1% of all requests. To do that we first need to calculate the overall rate of errors across all instances of our server. For that we would use a recording rule:
- record: job:http_requests_total:rate2m
  expr: sum(rate(http_requests_total[2m])) without(method, status, instance)

- record: job:http_requests_status500:rate2m
  expr: sum(rate(http_requests_total{status=”500”}[2m])) without(method, status, instance)
First rule will tell Prometheus to calculate per second rate of all requests and sum it across all instances of our server. Second rule does the same but only sums time series with status labels equal to “500”. Both rules will produce new metrics named after the value of the record field.
Now we can modify our alert rule to use those new metrics we’re generating with our recording rules:
- alert: Serving HTTP 500 errors
  expr: job:http_requests_status500:rate2m / job:http_requests_total:rate2m > 0.01
If we have a data center wide problem then we will raise just one alert, rather than one per instance of our server, which can be a great quality of life improvement for our on-call engineers.
But at the same time we’ve added two new rules that we need to maintain and ensure they produce results. To make things more complicated we could have recording rules producing metrics based on other recording rules, and then we have even more rules that we need to ensure are working correctly.
What if all those rules in our chain are maintained by different teams? What if the rule in the middle of the chain suddenly gets renamed because that’s needed by one of the teams? Problems like that can easily crop up now and then if your environment is sufficiently complex, and when they do, they’re not always obvious, after all the only sign that something stopped working is, well, silence – your alerts no longer trigger. If you’re lucky you’re plotting your metrics on a dashboard somewhere and hopefully someone will notice if they become empty, but it’s risky to rely on this.
We definitely felt that we needed something better than hope.
Introducing pint: a Prometheus rule linter
To avoid running into such problems in the future we’ve decided to write a tool that would help us do a better job of testing our alerting rules against live Prometheus servers, so we can spot missing metrics or typos easier. We also wanted to allow new engineers, who might not necessarily have all the in-depth knowledge of how Prometheus works, to be able to write rules with confidence without having to get feedback from more experienced team members.
Since we believe that such a tool will have value for the entire Prometheus community we’ve open-sourced it, and it’s available for anyone to use – say hello to pint!
You can find sources on github, there’s also online documentation that should help you get started.
Pint works in 3 different ways:
- You can run it against a file(s) with Prometheus rules
- It can run as a part of your CI pipeline
- Or you can deploy it as a side-car to all your Prometheus servers
It doesn’t require any configuration to run, but in most cases it will provide the most value if you create a configuration file for it and define some Prometheus servers it should use to validate all rules against. Running without any configured Prometheus servers will limit it to static analysis of all the rules, which can identify a range of problems, but won’t tell you if your rules are trying to query non-existent metrics.
First mode is where pint reads a file (or a directory containing multiple files), parses it, does all the basic syntax checks and then runs a series of checks for all Prometheus rules in those files.
Second mode is optimized for validating git based pull requests. Instead of testing all rules from all files pint will only test rules that were modified and report only problems affecting modified lines.
Third mode is where pint runs as a daemon and tests all rules on a regular basis. If it detects any problem it will expose those problems as metrics. You can then collect those metrics using Prometheus and alert on them as you would for any other problems. This way you can basically use Prometheus to monitor itself.
What kind of checks can it run for us and what kind of problems can it detect?
All the checks are documented here, along with some tips on how to deal with any detected problems. Let’s cover the most important ones briefly.
As mentioned above the main motivation was to catch rules that try to query metrics that are missing or when the query was simply mistyped. To do that pint will run each query from every alerting and recording rule to see if it returns any result, if it doesn’t then it will break down this query to identify all individual metrics and check for the existence of each of them. If any of them is missing or if the query tries to filter using labels that aren’t present on any time series for a given metric then it will report that back to us.
So if someone tries to add a new alerting rule with http_requests_totals typo in it, pint will detect that when running CI checks on the pull request and stop it from being merged. Which takes care of validating rules as they are being added to our configuration management system.
Another useful check will try to estimate the number of times a given alerting rule would trigger an alert. Which is useful when raising a pull request that’s adding new alerting rules – nobody wants to be flooded with alerts from a rule that’s too sensitive so having this information on a pull request allows us to spot rules that could lead to alert fatigue.
Similarly, another check will provide information on how many new time series a recording rule adds to Prometheus. In our setup a single unique time series uses, on average, 4KiB of memory. So if a recording rule generates 10 thousand new time series it will increase Prometheus server memory usage by 10000*4KiB=40MiB. 40 megabytes might not sound like but our peak time series usage in the last year was around 30 million time series in a single Prometheus server, so we pay attention to anything that’s might add a substantial amount of new time series, which pint helps us to notice before such rule gets added to Prometheus.
On top of all the Prometheus query checks, pint allows us also to ensure that all the alerting rules comply with some policies we’ve set for ourselves. For example, we require everyone to write a runbook for their alerts and link to it in the alerting rule using annotations.
We also require all alerts to have priority labels, so that high priority alerts are generating pages for responsible teams, while low priority ones are only routed to karma dashboard or create tickets using jiralert. It’s easy to forget about one of these required fields and that’s not something which can be enforced using unit testing, but pint allows us to do that with a few configuration lines.
With pint running on all stages of our Prometheus rule life cycle, from initial pull request to monitoring rules deployed in our many data centers, we can rely on our Prometheus alerting rules to always work and notify us of any incident, large or small.
GitHub: https://github.com/cloudflare/pint
Putting it all together
Let’s see how we can use pint to validate our rules as we work on them.
We can begin by creating a file called “rules.yml” and adding both recording rules there.
The goal is to write new rules that we want to add to Prometheus, but before we actually add those, we want pint to validate it all for us.
groups:
- name: Demo recording rules
  rules:
  - record: job:http_requests_total:rate2m
    expr: sum(rate(http_requests_total[2m])) without(method, status, instance)

  - record: job:http_requests_status500:rate2m
    expr: sum(rate(http_requests_total{status="500"}[2m]) without(method, status, instance)
Next we’ll download the latest version of pint from GitHub and run check our rules.
$ pint lint rules.yml
level=info msg="File parsed" path=rules.yml rules=2
rules.yml:8: syntax error: unclosed left parenthesis (promql/syntax)
    expr: sum(rate(http_requests_total{status="500"}[2m]) without(method, status, instance)

level=info msg="Problems found" Fatal=1
level=fatal msg="Execution completed with error(s)" error="problems found"
Whoops, we have “sum(rate(…)” and so we’re missing one of the closing brackets. Let’s fix that and try again.
groups:
- name: Demo recording rules
  rules:
  - record: job:http_requests_total:rate2m
    expr: sum(rate(http_requests_total[2m])) without(method, status, instance)

  - record: job:http_requests_status500:rate2m
    expr: sum(rate(http_requests_total{status="500"}[2m])) without(method, status, instance)
$ pint lint rules.yml
level=info msg="File parsed" path=rules.yml rules=2
Our rule now passes the most basic checks, so we know it’s valid. But to know if it works with a real Prometheus server we need to tell pint how to talk to Prometheus. For that we’ll need a config file that defines a Prometheus server we test our rule against, it should be the same server we’re planning to deploy our rule to. Here we’ll be using a test instance running on localhost. Let’s create a “pint.hcl” file and define our Prometheus server there:
prometheus "prom1" {
  uri     = "http://localhost:9090"
  timeout = "1m"
}
Now we can re-run our check using this configuration file:
$ pint -c pint.hcl lint rules.yml
level=info msg="Loading configuration file" path=pint.hcl
level=info msg="File parsed" path=rules.yml rules=2
rules.yml:5: prometheus "prom1" at http://localhost:9090 didn't have any series for "http_requests_total" metric in the last 1w (promql/series)
    expr: sum(rate(http_requests_total[2m])) without(method, status, instance)

rules.yml:8: prometheus "prom1" at http://localhost:9090 didn't have any series for "http_requests_total" metric in the last 1w (promql/series)
    expr: sum(rate(http_requests_total{status="500"}[2m])) without(method, status, instance)

level=info msg="Problems found" Bug=2
level=fatal msg="Execution completed with error(s)" error="problems found"
Yikes! It’s a test Prometheus instance, and we forgot to collect any metrics from it.
Let’s fix that by starting our server locally on port 8080 and configuring Prometheus to collect metrics from it:
scrape_configs:
  - job_name: webserver
    static_configs:
      - targets: ['localhost:8080’]
Let’ re-run our checks once more:
$ pint -c pint.hcl lint rules.yml
level=info msg="Loading configuration file" path=pint.hcl
level=info msg="File parsed" path=rules.yml rules=2
This time everything works!
Now let’s add our alerting rule to our file, so it now looks like this:
groups:
- name: Demo recording rules
  rules:
  - record: job:http_requests_total:rate2m
    expr: sum(rate(http_requests_total[2m])) without(method, status, instance)

  - record: job:http_requests_status500:rate2m
    expr: sum(rate(http_requests_total{status="500"}[2m])) without(method, status, instance)

- name: Demo alerting rules
  rules:
  - alert: Serving HTTP 500 errors
    expr: job:http_requests_status500:rate2m / job:http_requests_total:rate2m > 0.01
And let’s re-run pint once again:
$ pint -c pint.hcl lint rules.yml
level=info msg="Loading configuration file" path=pint.hcl
level=info msg="File parsed" path=rules.yml rules=3
rules.yml:13: prometheus "prom1" at http://localhost:9090 didn't have any series for "job:http_requests_status500:rate2m" metric in the last 1w but found recording rule that generates it, skipping further checks (promql/series)
    expr: job:http_requests_status500:rate2m / job:http_requests_total:rate2m > 0.01

rules.yml:13: prometheus "prom1" at http://localhost:9090 didn't have any series for "job:http_requests_total:rate2m" metric in the last 1w but found recording rule that generates it, skipping further checks (promql/series)
    expr: job:http_requests_status500:rate2m / job:http_requests_total:rate2m > 0.01

level=info msg="Problems found" Information=2
It all works according to pint, and so we now can safely deploy our new rules file to Prometheus.
Notice that pint recognised that both metrics used in our alert come from recording rules, which aren’t yet added to Prometheus, so there’s no point querying Prometheus to verify if they exist there.
Now what happens if we deploy a new version of our server that renames the “status” label to something else, like “code”?
$ pint -c pint.hcl lint rules.yml
level=info msg="Loading configuration file" path=pint.hcl
level=info msg="File parsed" path=rules.yml rules=3
rules.yml:8: prometheus "prom1" at http://localhost:9090 has "http_requests_total" metric but there are no series with "status" label in the last 1w (promql/series)
    expr: sum(rate(http_requests_total{status="500"}[2m])) without(method, status, instance)

rules.yml:13: prometheus "prom1" at http://localhost:9090 didn't have any series for "job:http_requests_status500:rate2m" metric in the last 1w but found recording rule that generates it, skipping further checks (promql/series)
    expr: job:http_requests_status500:rate2m / job:http_requests_total:rate2m > 0.01

level=info msg="Problems found" Bug=1 Information=1
level=fatal msg="Execution completed with error(s)" error="problems found"
Luckily pint will notice this and report it, so we can adopt our rule to match the new name.
But what if that happens after we deploy our rule? For that we can use the “pint watch” command that runs pint as a daemon periodically checking all rules.
Please note that validating all metrics used in a query will eventually produce some false positives. In our example metrics with status=”500” label might not be exported by our server until there’s at least one request ending in HTTP 500 error.
The promql/series check responsible for validating presence of all metrics has some documentation on how to deal with this problem. In most cases you’ll want to add a comment that instructs pint to ignore some missing metrics entirely or stop checking label values (only check if there’s “status” label present, without checking if there are time series with status=”500”).
Summary
Prometheus metrics don’t follow any strict schema, whatever services expose will be collected. At the same time a lot of problems with queries hide behind empty results, which makes noticing these problems non-trivial.
We use pint to find such problems and report them to engineers, so that our global network is always monitored correctly, and we have confidence that lack of alerts proves how reliable our infrastructure is.