Post Syndicated from Lukasz Mierzwa original https://blog.cloudflare.com/how-cloudflare-runs-prometheus-at-scale/


We use Prometheus to gain insight into all the different pieces of hardware and software that make up our global network. Prometheus allows us to measure health & performance over time and, if there’s anything wrong with any service, let our team know before it becomes a problem.
At the moment of writing this post we run 916 Prometheus instances with a total of around 4.9 billion time series. Here’s a screenshot that shows exact numbers:
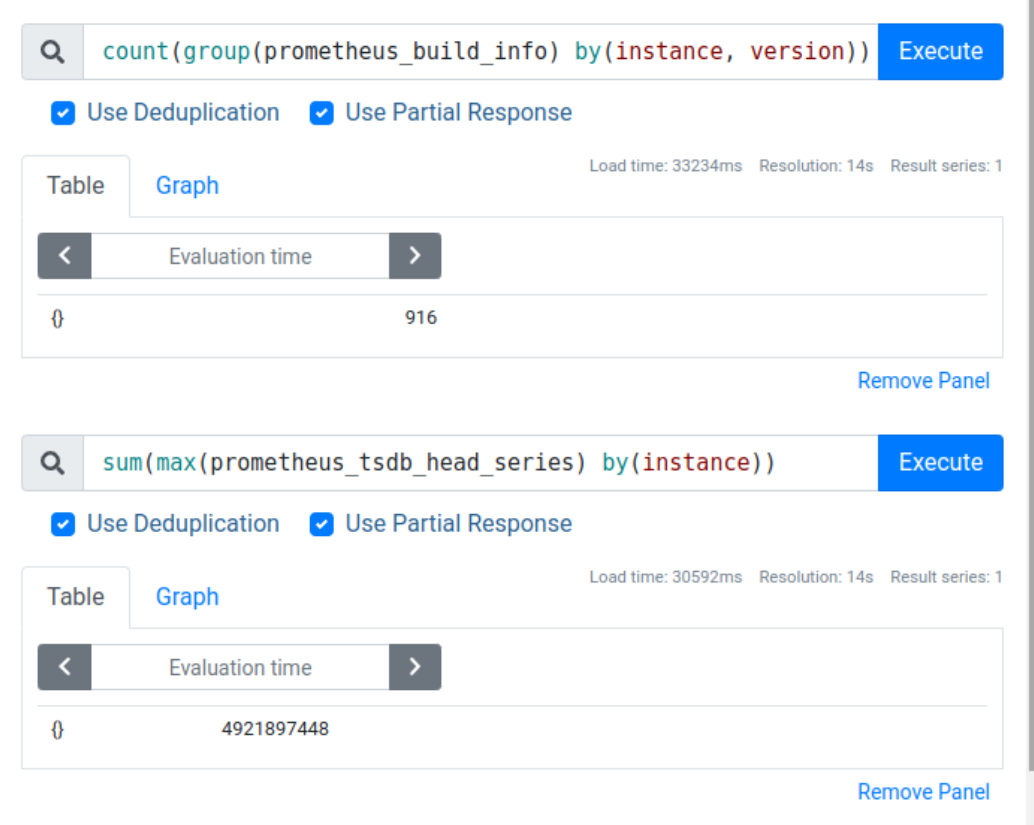
That’s an average of around 5 million time series per instance, but in reality we have a mixture of very tiny and very large instances, with the biggest instances storing around 30 million time series each.
Operating such a large Prometheus deployment doesn’t come without challenges. In this blog post we’ll cover some of the issues one might encounter when trying to collect many millions of time series per Prometheus instance.
Metrics cardinality
One of the first problems you’re likely to hear about when you start running your own Prometheus instances is cardinality, with the most dramatic cases of this problem being referred to as “cardinality explosion”.
So let’s start by looking at what cardinality means from Prometheus’ perspective, when it can be a problem and some of the ways to deal with it.
Let’s say we have an application which we want to instrument, which means add some observable properties in the form of metrics that Prometheus can read from our application. A metric can be anything that you can express as a number, for example:
- The speed at which a vehicle is traveling.
- Current temperature.
- The number of times some specific event occurred.
To create metrics inside our application we can use one of many Prometheus client libraries. Let’s pick client_python for simplicity, but the same concepts will apply regardless of the language you use.
from prometheus_client import Counter

# Declare our first metric.
# First argument is the name of the metric.
# Second argument is the description of it.
c = Counter(mugs_of_beverage_total, 'The total number of mugs drank.')

# Call inc() to increment our metric every time a mug was drank.
c.inc()
c.inc()
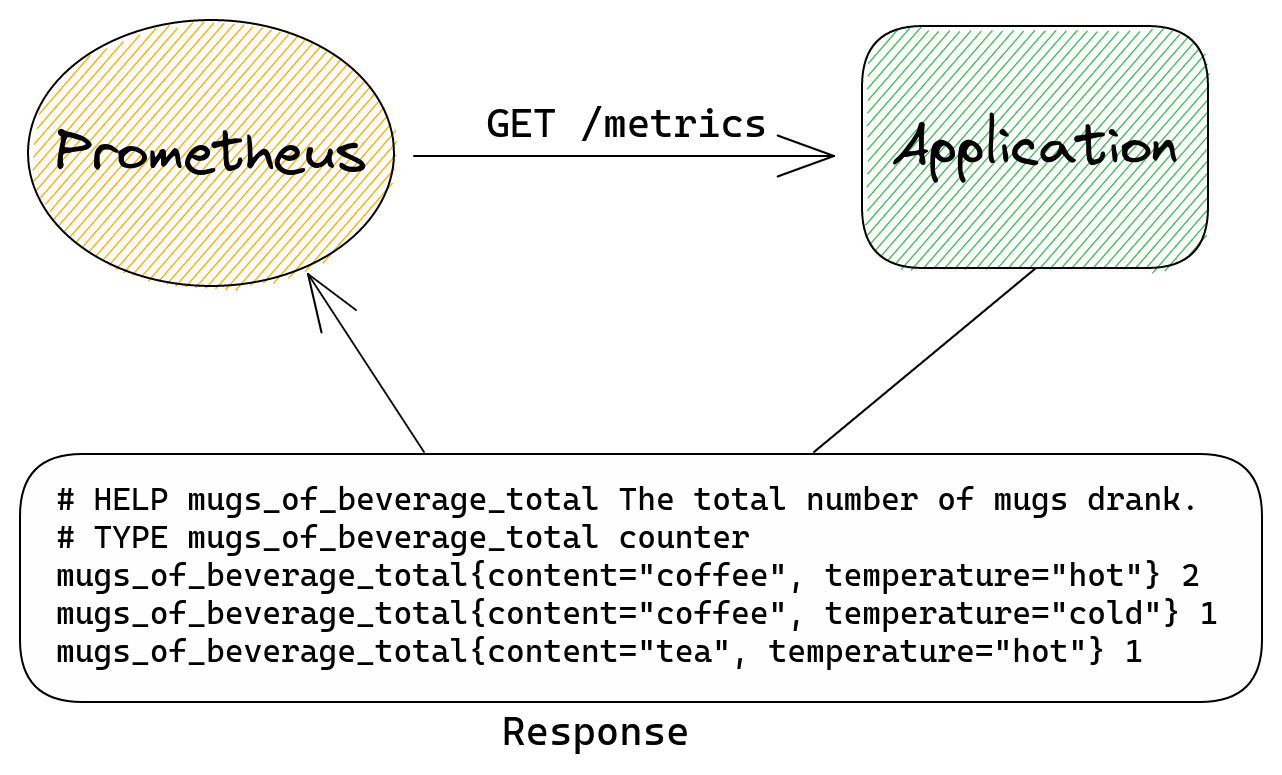
With this simple code Prometheus client library will create a single metric. For Prometheus to collect this metric we need our application to run an HTTP server and expose our metrics there. The simplest way of doing this is by using functionality provided with client_python itself – see documentation here.
When Prometheus sends an HTTP request to our application it will receive this response:
# HELP mugs_of_beverage_total The total number of mugs drank.
# TYPE mugs_of_beverage_total counter
mugs_of_beverage_total 2
This format and underlying data model are both covered extensively in Prometheus’ own documentation.
Please see data model and exposition format pages for more details.
We can add more metrics if we like and they will all appear in the HTTP response to the metrics endpoint.
Prometheus metrics can have extra dimensions in form of labels. We can use these to add more information to our metrics so that we can better understand what’s going on.
With our example metric we know how many mugs were consumed, but what if we also want to know what kind of beverage it was? Or maybe we want to know if it was a cold drink or a hot one? Adding labels is very easy and all we need to do is specify their names. Once we do that we need to pass label values (in the same order as label names were specified) when incrementing our counter to pass this extra information.
Let’s adjust the example code to do this.
from prometheus_client import Counter

c = Counter(mugs_of_beverage_total, 'The total number of mugs drank.', ['content', 'temperature'])

c.labels('coffee', 'hot').inc()
c.labels('coffee', 'hot').inc()
c.labels('coffee', 'cold').inc()
c.labels('tea', 'hot').inc()
Our HTTP response will now show more entries:
# HELP mugs_of_beverage_total The total number of mugs drank.
# TYPE mugs_of_beverage_total counter
mugs_of_beverage_total{content="coffee", temperature="hot"} 2
mugs_of_beverage_total{content="coffee", temperature="cold"} 1
mugs_of_beverage_total{content="tea", temperature="hot"} 1
As we can see we have an entry for each unique combination of labels.
And this brings us to the definition of cardinality in the context of metrics. Cardinality is the number of unique combinations of all labels. The more labels you have and the more values each label can take, the more unique combinations you can create and the higher the cardinality.
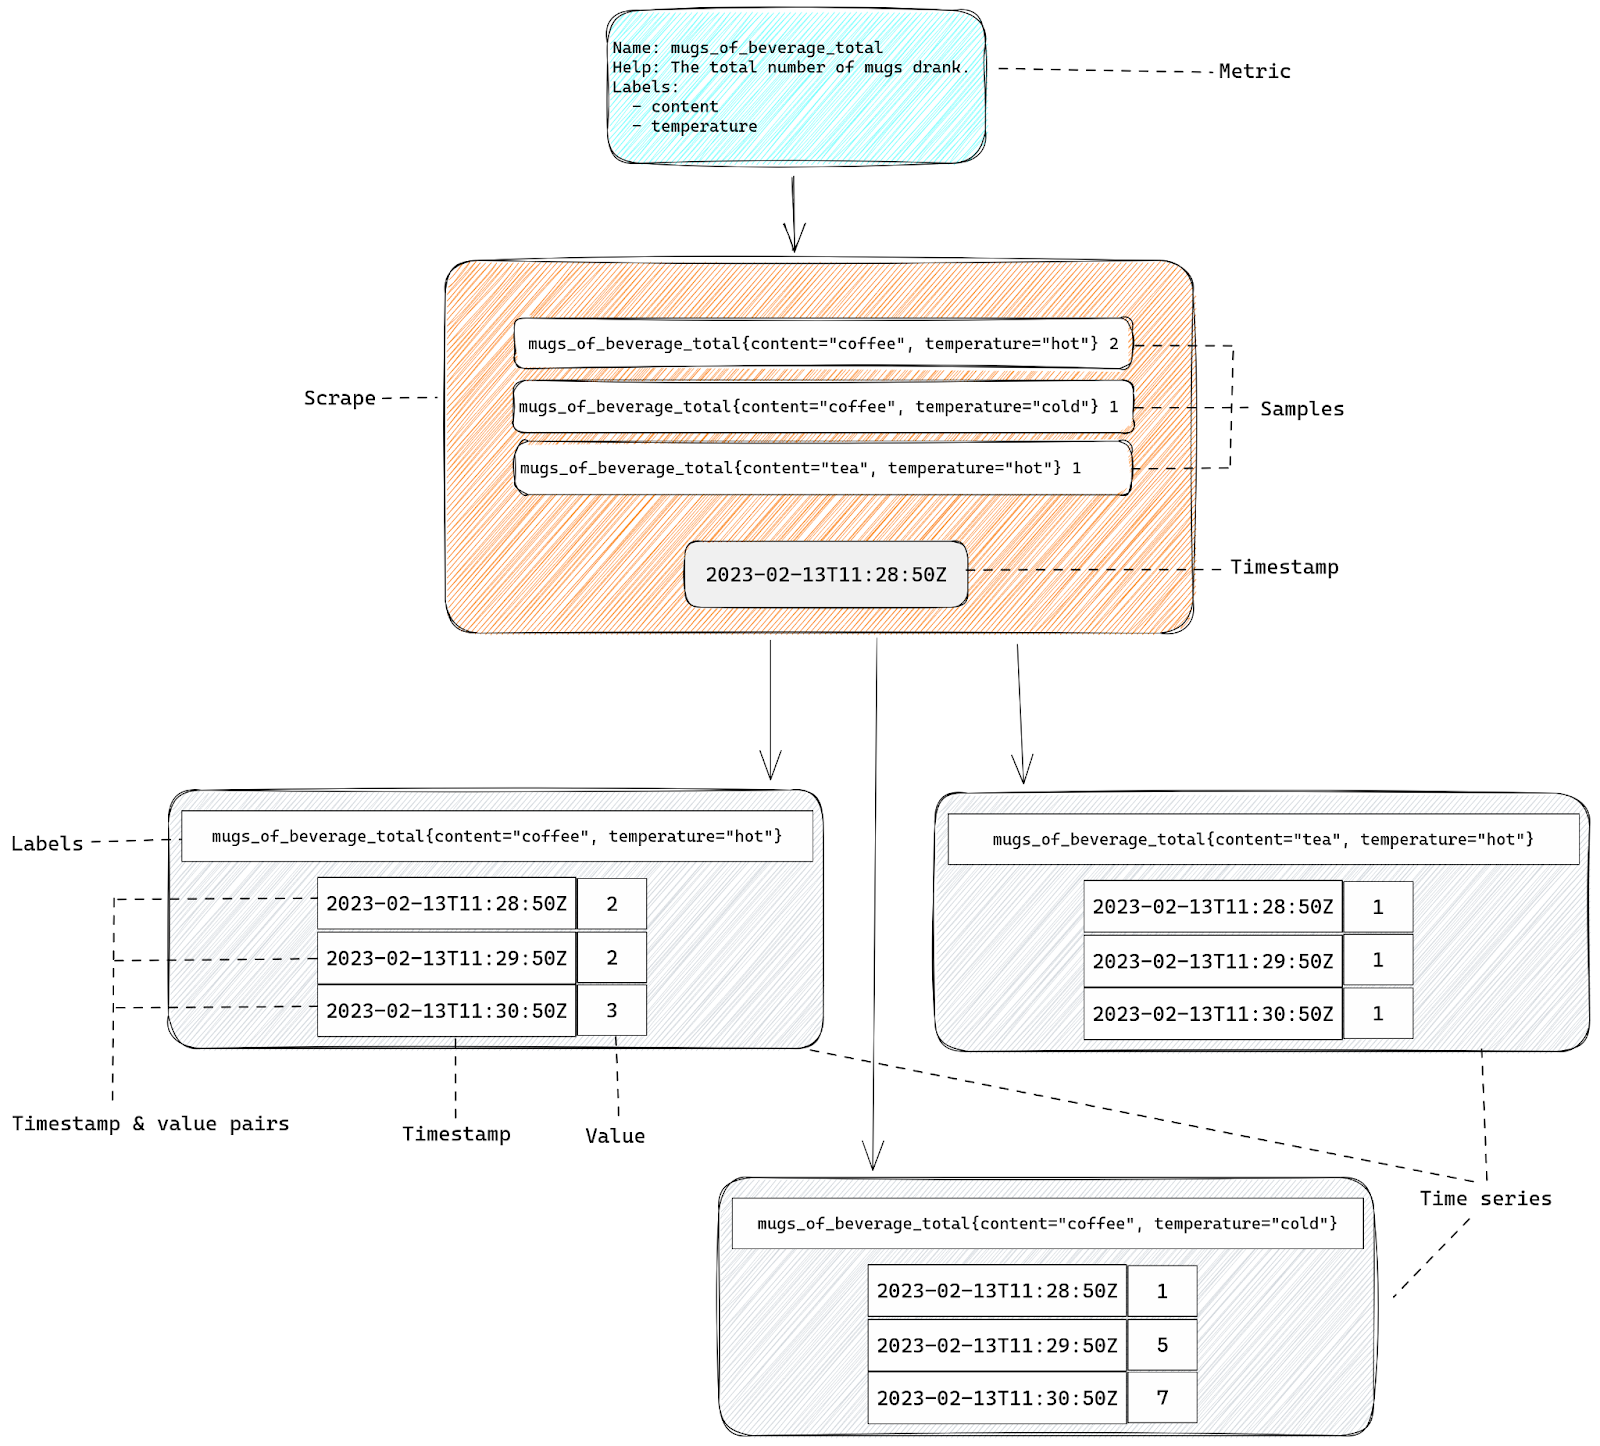
Metrics vs samples vs time series
Now we should pause to make an important distinction between metrics and time series.
A metric is an observable property with some defined dimensions (labels). In our example case it’s a Counter class object.
A time series is an instance of that metric, with a unique combination of all the dimensions (labels), plus a series of timestamp & value pairs – hence the name “time series”. Names and labels tell us what is being observed, while timestamp & value pairs tell us how that observable property changed over time, allowing us to plot graphs using this data.
What this means is that a single metric will create one or more time series. The number of time series depends purely on the number of labels and the number of all possible values these labels can take.
Every time we add a new label to our metric we risk multiplying the number of time series that will be exported to Prometheus as the result.
In our example we have two labels, “content” and “temperature”, and both of them can have two different values. So the maximum number of time series we can end up creating is four (2*2). If we add another label that can also have two values then we can now export up to eight time series (2*2*2). The more labels we have or the more distinct values they can have the more time series as a result.
If all the label values are controlled by your application you will be able to count the number of all possible label combinations. But the real risk is when you create metrics with label values coming from the outside world.
If instead of beverages we tracked the number of HTTP requests to a web server, and we used the request path as one of the label values, then anyone making a huge number of random requests could force our application to create a huge number of time series. To avoid this it’s in general best to never accept label values from untrusted sources.
To make things more complicated you may also hear about “samples” when reading Prometheus documentation. A sample is something in between metric and time series – it’s a time series value for a specific timestamp. Timestamps here can be explicit or implicit. If a sample lacks any explicit timestamp then it means that the sample represents the most recent value – it’s the current value of a given time series, and the timestamp is simply the time you make your observation at.
If you look at the HTTP response of our example metric you’ll see that none of the returned entries have timestamps. There’s no timestamp anywhere actually. This is because the Prometheus server itself is responsible for timestamps. When Prometheus collects metrics it records the time it started each collection and then it will use it to write timestamp & value pairs for each time series.
That’s why what our application exports isn’t really metrics or time series – it’s samples.
Confusing? Let’s recap:
- We start with a metric – that’s simply a definition of something that we can observe, like the number of mugs drunk.
- Our metrics are exposed as a HTTP response. That response will have a list of samples – these are individual instances of our metric (represented by name & labels), plus the current value.
- When Prometheus collects all the samples from our HTTP response it adds the timestamp of that collection and with all this information together we have a time series.
Cardinality related problems
Each time series will cost us resources since it needs to be kept in memory, so the more time series we have, the more resources metrics will consume. This is true both for client libraries and Prometheus server, but it’s more of an issue for Prometheus itself, since a single Prometheus server usually collects metrics from many applications, while an application only keeps its own metrics.
Since we know that the more labels we have the more time series we end up with, you can see when this can become a problem. Simply adding a label with two distinct values to all our metrics might double the number of time series we have to deal with. Which in turn will double the memory usage of our Prometheus server. If we let Prometheus consume more memory than it can physically use then it will crash.
This scenario is often described as “cardinality explosion” – some metric suddenly adds a huge number of distinct label values, creates a huge number of time series, causes Prometheus to run out of memory and you lose all observability as a result.
How is Prometheus using memory?
To better handle problems with cardinality it’s best if we first get a better understanding of how Prometheus works and how time series consume memory.
For that let’s follow all the steps in the life of a time series inside Prometheus.
Step one – HTTP scrape
The process of sending HTTP requests from Prometheus to our application is called “scraping”. Inside the Prometheus configuration file we define a “scrape config” that tells Prometheus where to send the HTTP request, how often and, optionally, to apply extra processing to both requests and responses.
It will record the time it sends HTTP requests and use that later as the timestamp for all collected time series.
After sending a request it will parse the response looking for all the samples exposed there.
Step two – new time series or an update?
Once Prometheus has a list of samples collected from our application it will save it into TSDB – Time Series DataBase – the database in which Prometheus keeps all the time series.
But before doing that it needs to first check which of the samples belong to the time series that are already present inside TSDB and which are for completely new time series.
As we mentioned before a time series is generated from metrics. There is a single time series for each unique combination of metrics labels.
This means that Prometheus must check if there’s already a time series with identical name and exact same set of labels present. Internally time series names are just another label called __name__, so there is no practical distinction between name and labels. Both of the representations below are different ways of exporting the same time series:
mugs_of_beverage_total{content="tea", temperature="hot"} 1
{__name__="mugs_of_beverage_total", content="tea", temperature="hot"} 1
Since everything is a label Prometheus can simply hash all labels using sha256 or any other algorithm to come up with a single ID that is unique for each time series.
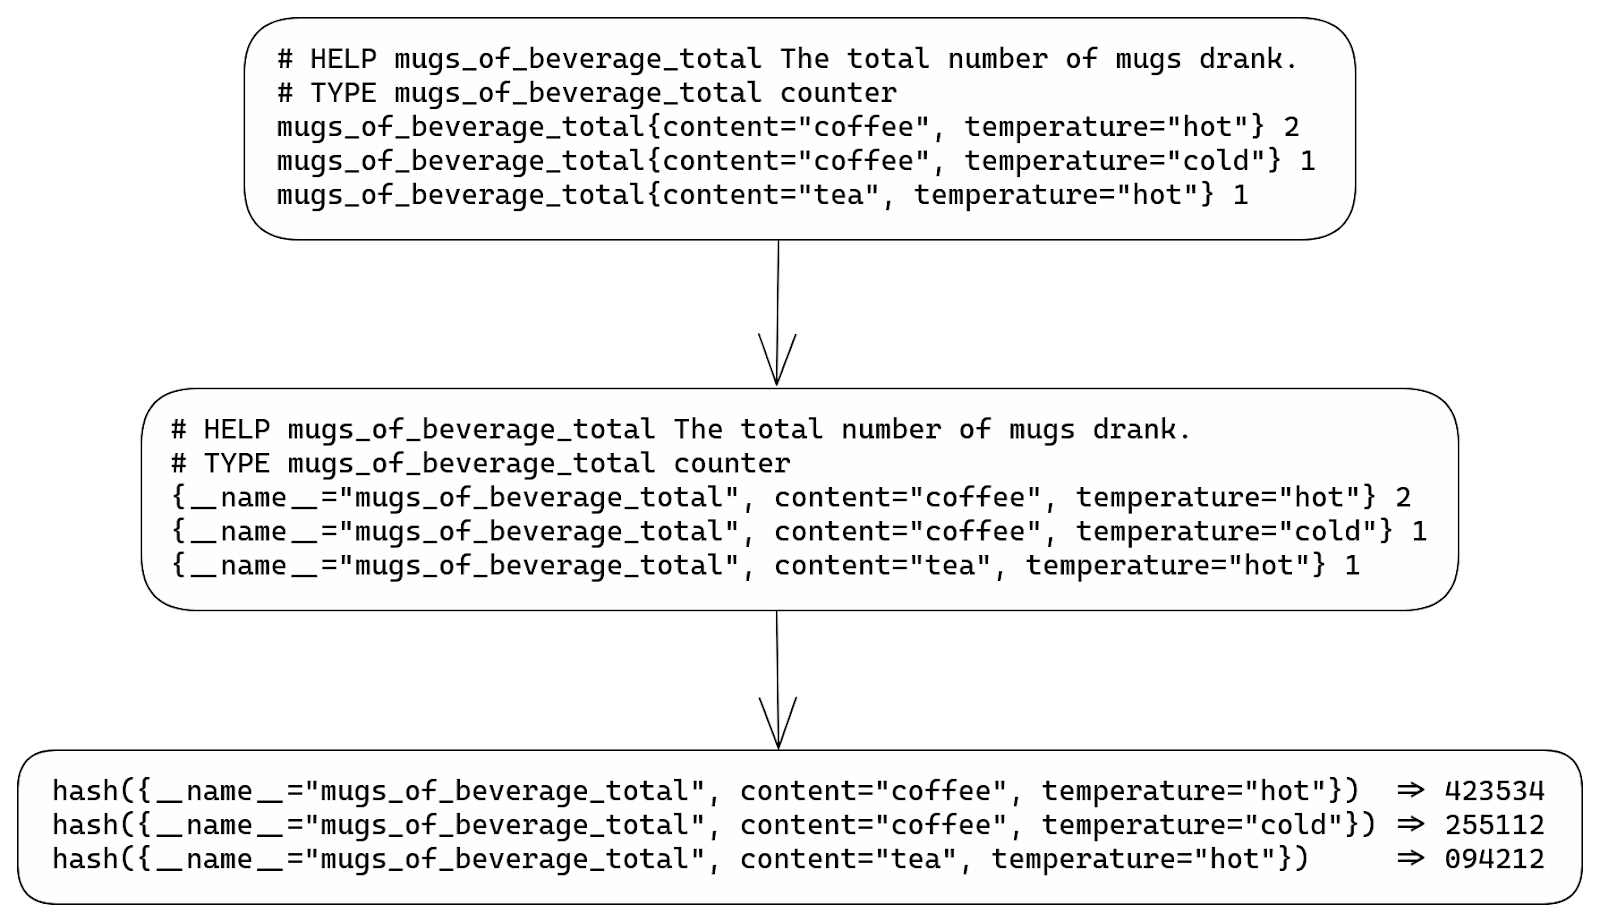
Knowing that it can quickly check if there are any time series already stored inside TSDB that have the same hashed value. Basically our labels hash is used as a primary key inside TSDB.
Step three – appending to TSDB
Once TSDB knows if it has to insert new time series or update existing ones it can start the real work.
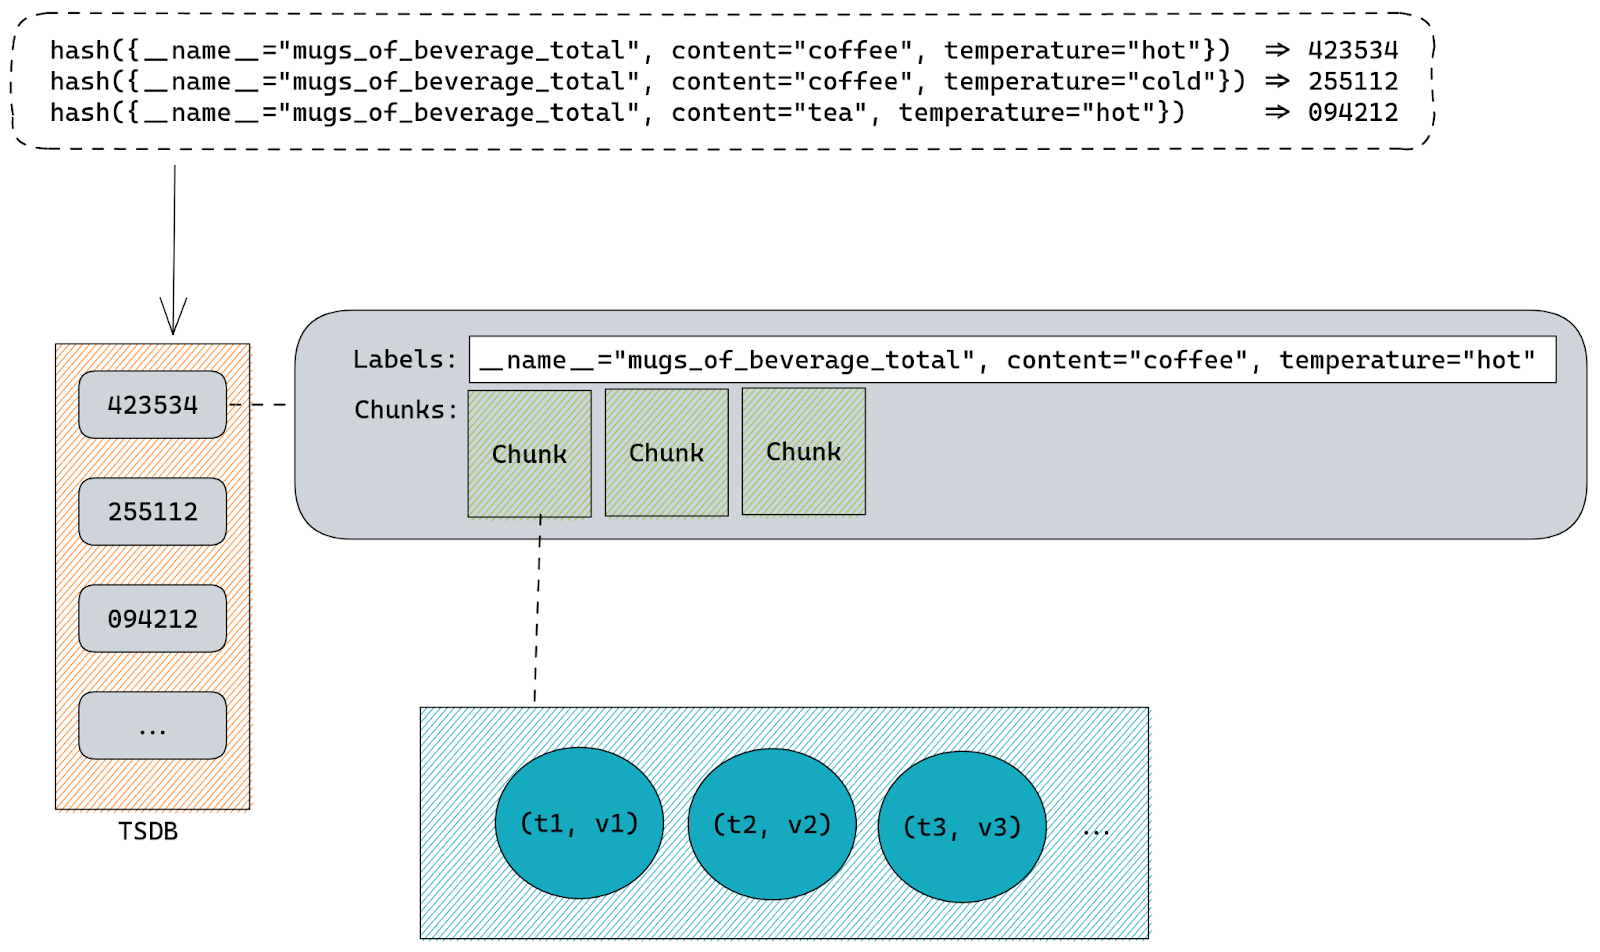
Internally all time series are stored inside a map on a structure called Head. That map uses labels hashes as keys and a structure called memSeries as values. Those memSeries objects are storing all the time series information. The struct definition for memSeries is fairly big, but all we really need to know is that it has a copy of all the time series labels and chunks that hold all the samples (timestamp & value pairs).
Labels are stored once per each memSeries instance.
Samples are stored inside chunks using “varbit” encoding which is a lossless compression scheme optimized for time series data. Each chunk represents a series of samples for a specific time range. This helps Prometheus query data faster since all it needs to do is first locate the memSeries instance with labels matching our query and then find the chunks responsible for time range of the query.
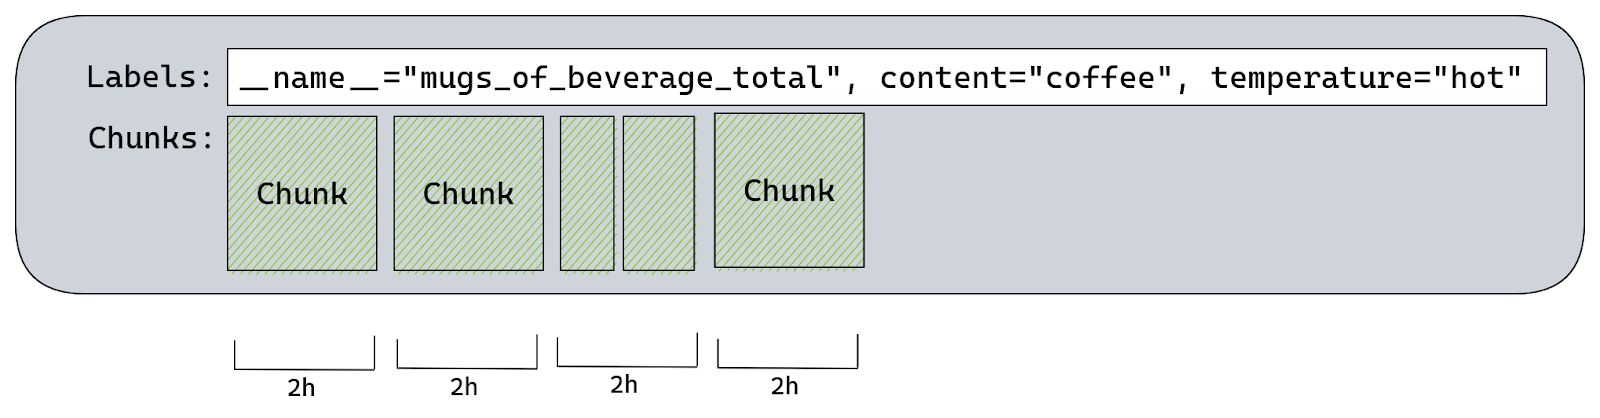
By default Prometheus will create a chunk per each two hours of wall clock. So there would be a chunk for: 00:00 – 01:59, 02:00 – 03:59, 04:00 – 05:59, …, 22:00 – 23:59.
There’s only one chunk that we can append to, it’s called the “Head Chunk”. It’s the chunk responsible for the most recent time range, including the time of our scrape. Any other chunk holds historical samples and therefore is read-only.
There is a maximum of 120 samples each chunk can hold. This is because once we have more than 120 samples on a chunk efficiency of “varbit” encoding drops. TSDB will try to estimate when a given chunk will reach 120 samples and it will set the maximum allowed time for current Head Chunk accordingly.
If we try to append a sample with a timestamp higher than the maximum allowed time for current Head Chunk, then TSDB will create a new Head Chunk and calculate a new maximum time for it based on the rate of appends.
All chunks must be aligned to those two hour slots of wall clock time, so if TSDB was building a chunk for 10:00-11:59 and it was already “full” at 11:30 then it would create an extra chunk for the 11:30-11:59 time range.
Since the default Prometheus scrape interval is one minute it would take two hours to reach 120 samples.
What this means is that using Prometheus defaults each memSeries should have a single chunk with 120 samples on it for every two hours of data.
Going back to our time series – at this point Prometheus either creates a new memSeries instance or uses already existing memSeries. Once it has a memSeries instance to work with it will append our sample to the Head Chunk. This might require Prometheus to create a new chunk if needed.
Step four – memory-mapping old chunks
After a few hours of Prometheus running and scraping metrics we will likely have more than one chunk on our time series:
- One “Head Chunk” – containing up to two hours of the last two hour wall clock slot.
- One or more for historical ranges – these chunks are only for reading, Prometheus won’t try to append anything here.
Since all these chunks are stored in memory Prometheus will try to reduce memory usage by writing them to disk and memory-mapping. The advantage of doing this is that memory-mapped chunks don’t use memory unless TSDB needs to read them.
The Head Chunk is never memory-mapped, it’s always stored in memory.
Step five – writing blocks to disk
Up until now all time series are stored entirely in memory and the more time series you have, the higher Prometheus memory usage you’ll see. The only exception are memory-mapped chunks which are offloaded to disk, but will be read into memory if needed by queries.
This allows Prometheus to scrape and store thousands of samples per second, our biggest instances are appending 550k samples per second, while also allowing us to query all the metrics simultaneously.
But you can’t keep everything in memory forever, even with memory-mapping parts of data.
Every two hours Prometheus will persist chunks from memory onto the disk. This process is also aligned with the wall clock but shifted by one hour.
When using Prometheus defaults and assuming we have a single chunk for each two hours of wall clock we would see this:
- 02:00 – create a new chunk for 02:00 – 03:59 time range
- 03:00 – write a block for 00:00 – 01:59
- 04:00 – create a new chunk for 04:00 – 05:59 time range
- 05:00 – write a block for 02:00 – 03:59
- …
- 22:00 – create a new chunk for 22:00 – 23:59 time range
- 23:00 – write a block for 20:00 – 21:59
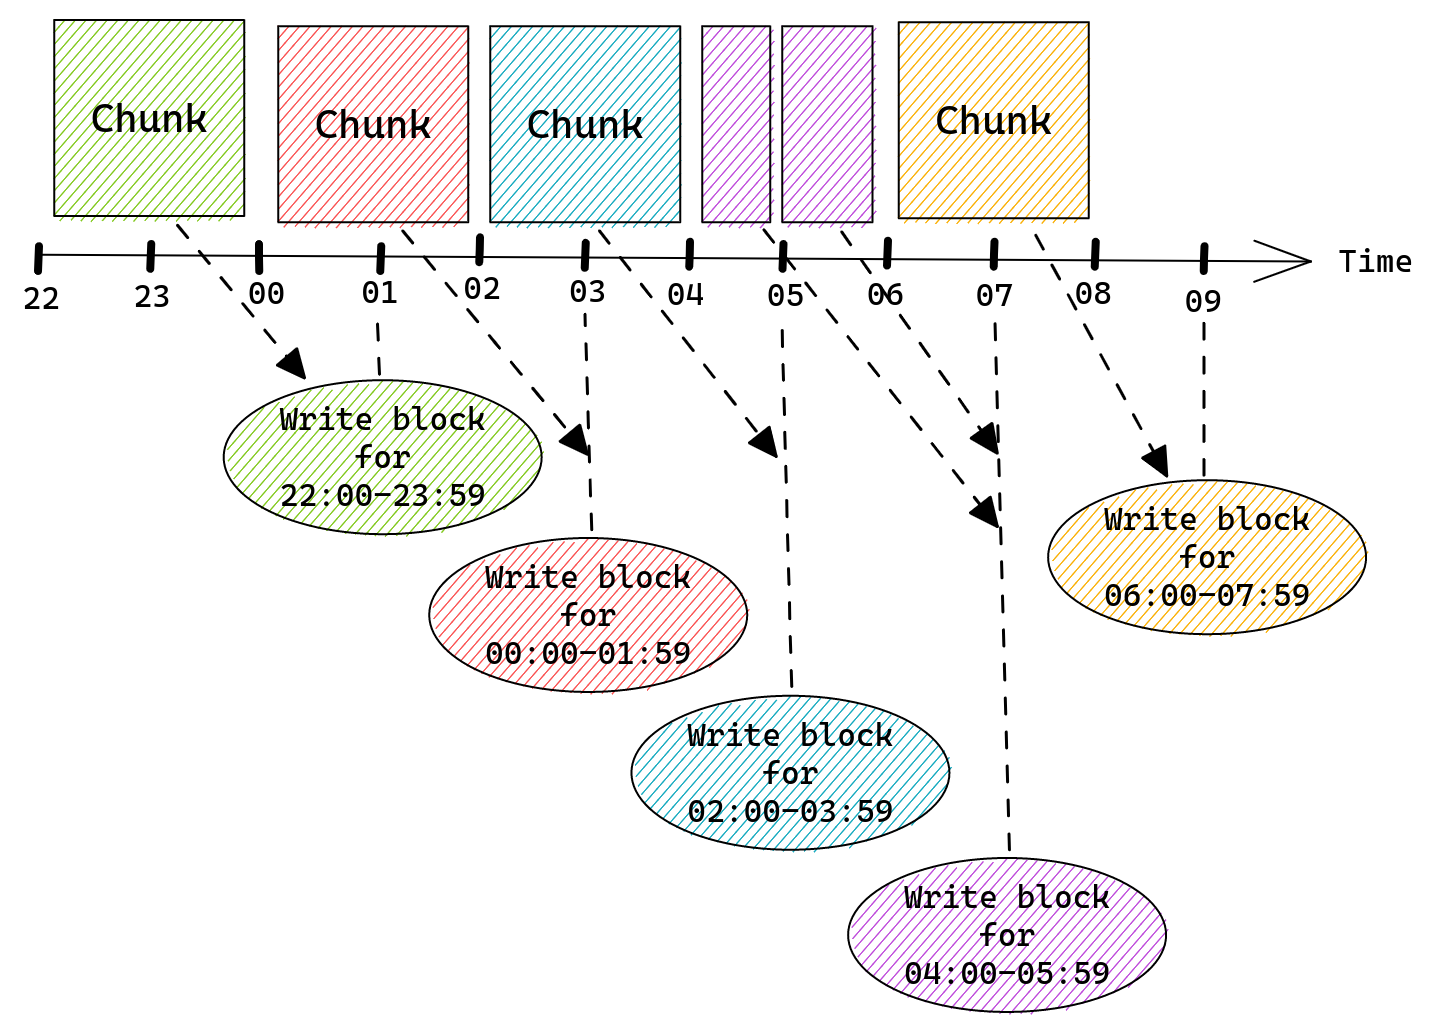
Once a chunk is written into a block it is removed from memSeries and thus from memory. Prometheus will keep each block on disk for the configured retention period.
Blocks will eventually be “compacted”, which means that Prometheus will take multiple blocks and merge them together to form a single block that covers a bigger time range. This process helps to reduce disk usage since each block has an index taking a good chunk of disk space. By merging multiple blocks together, big portions of that index can be reused, allowing Prometheus to store more data using the same amount of storage space.
Step six – garbage collection
After a chunk was written into a block and removed from memSeries we might end up with an instance of memSeries that has no chunks. This would happen if any time series was no longer being exposed by any application and therefore there was no scrape that would try to append more samples to it.
A common pattern is to export software versions as a build_info metric, Prometheus itself does this too:
prometheus_build_info{version="2.42.0"} 1
When Prometheus 2.43.0 is released this metric would be exported as:
prometheus_build_info{version="2.43.0"} 1
Which means that a time series with version=”2.42.0” label would no longer receive any new samples.
Once the last chunk for this time series is written into a block and removed from the memSeries instance we have no chunks left. This means that our memSeries still consumes some memory (mostly labels) but doesn’t really do anything.
To get rid of such time series Prometheus will run “head garbage collection” (remember that Head is the structure holding all memSeries) right after writing a block. This garbage collection, among other things, will look for any time series without a single chunk and remove it from memory.
Since this happens after writing a block, and writing a block happens in the middle of the chunk window (two hour slices aligned to the wall clock) the only memSeries this would find are the ones that are “orphaned” – they received samples before, but not anymore.
What does this all mean?
TSDB used in Prometheus is a special kind of database that was highly optimized for a very specific workload:
- Time series scraped from applications are kept in memory.
- Samples are compressed using encoding that works best if there are continuous updates.
- Chunks that are a few hours old are written to disk and removed from memory.
- When time series disappear from applications and are no longer scraped they still stay in memory until all chunks are written to disk and garbage collection removes them.
This means that Prometheus is most efficient when continuously scraping the same time series over and over again. It’s least efficient when it scrapes a time series just once and never again – doing so comes with a significant memory usage overhead when compared to the amount of information stored using that memory.
If we try to visualize how the perfect type of data Prometheus was designed for looks like we’ll end up with this:
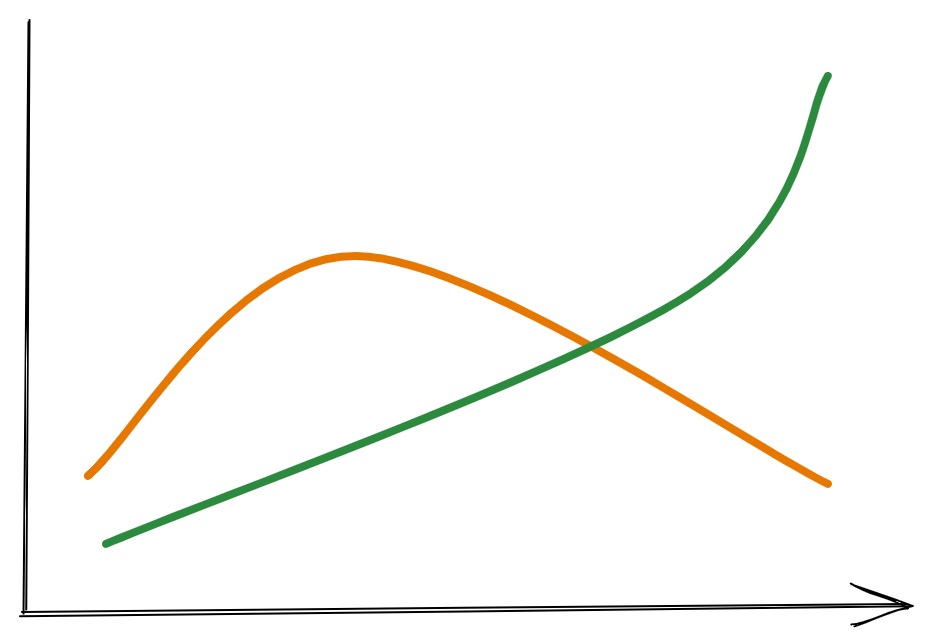
A few continuous lines describing some observed properties.
If, on the other hand, we want to visualize the type of data that Prometheus is the least efficient when dealing with, we’ll end up with this instead:
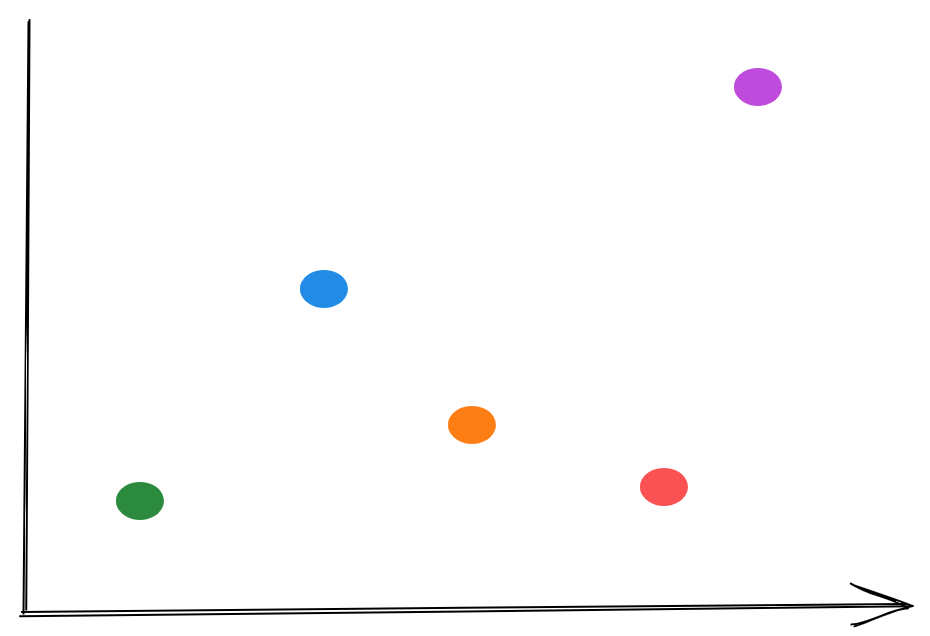
Here we have single data points, each for a different property that we measure.
Although you can tweak some of Prometheus’ behavior and tweak it more for use with short lived time series, by passing one of the hidden flags, it’s generally discouraged to do so. These flags are only exposed for testing and might have a negative impact on other parts of Prometheus server.
To get a better understanding of the impact of a short lived time series on memory usage let’s take a look at another example.
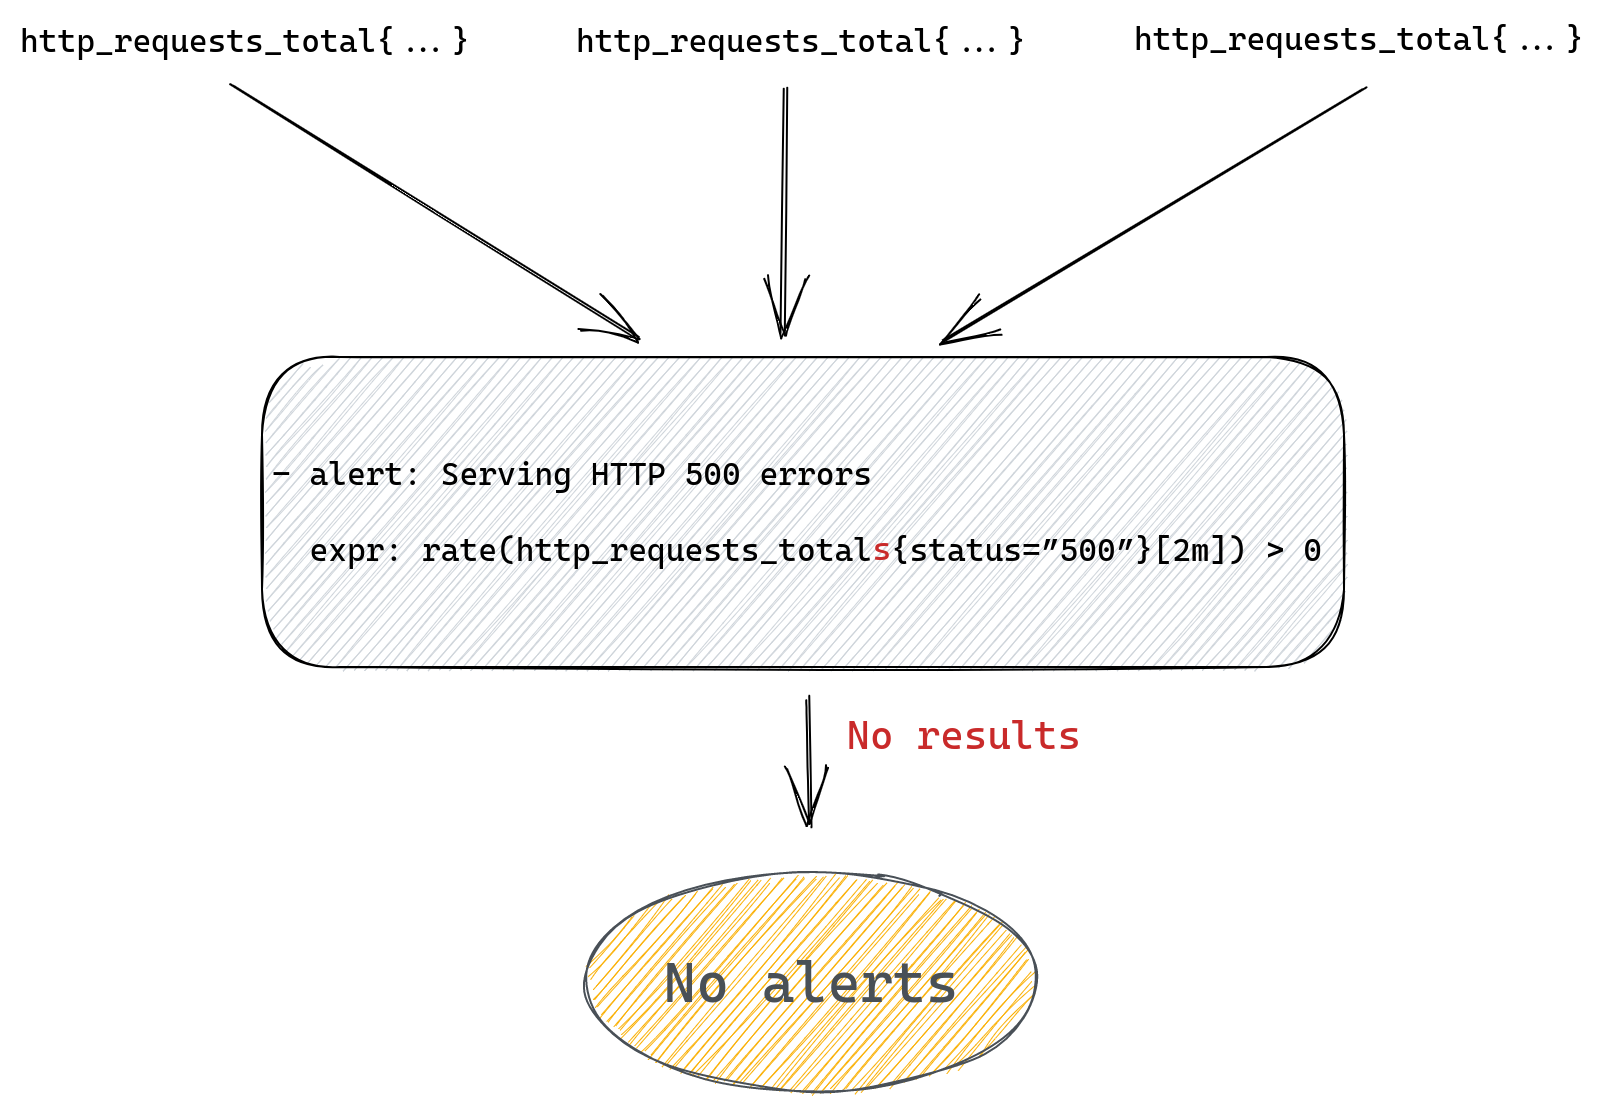
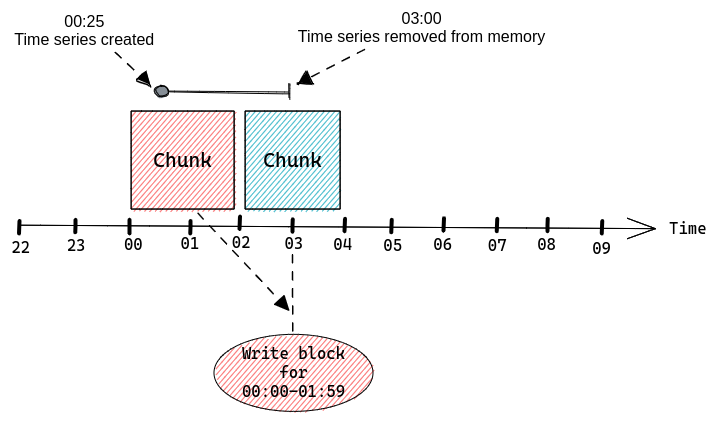
Let’s see what happens if we start our application at 00:25, allow Prometheus to scrape it once while it exports:
prometheus_build_info{version="2.42.0"} 1
And then immediately after the first scrape we upgrade our application to a new version:
prometheus_build_info{version="2.43.0"} 1
At 00:25 Prometheus will create our memSeries, but we will have to wait until Prometheus writes a block that contains data for 00:00-01:59 and runs garbage collection before that memSeries is removed from memory, which will happen at 03:00.
This single sample (data point) will create a time series instance that will stay in memory for over two and a half hours using resources, just so that we have a single timestamp & value pair.
If we were to continuously scrape a lot of time series that only exist for a very brief period then we would be slowly accumulating a lot of memSeries in memory until the next garbage collection.
Looking at memory usage of such Prometheus server we would see this pattern repeating over time:
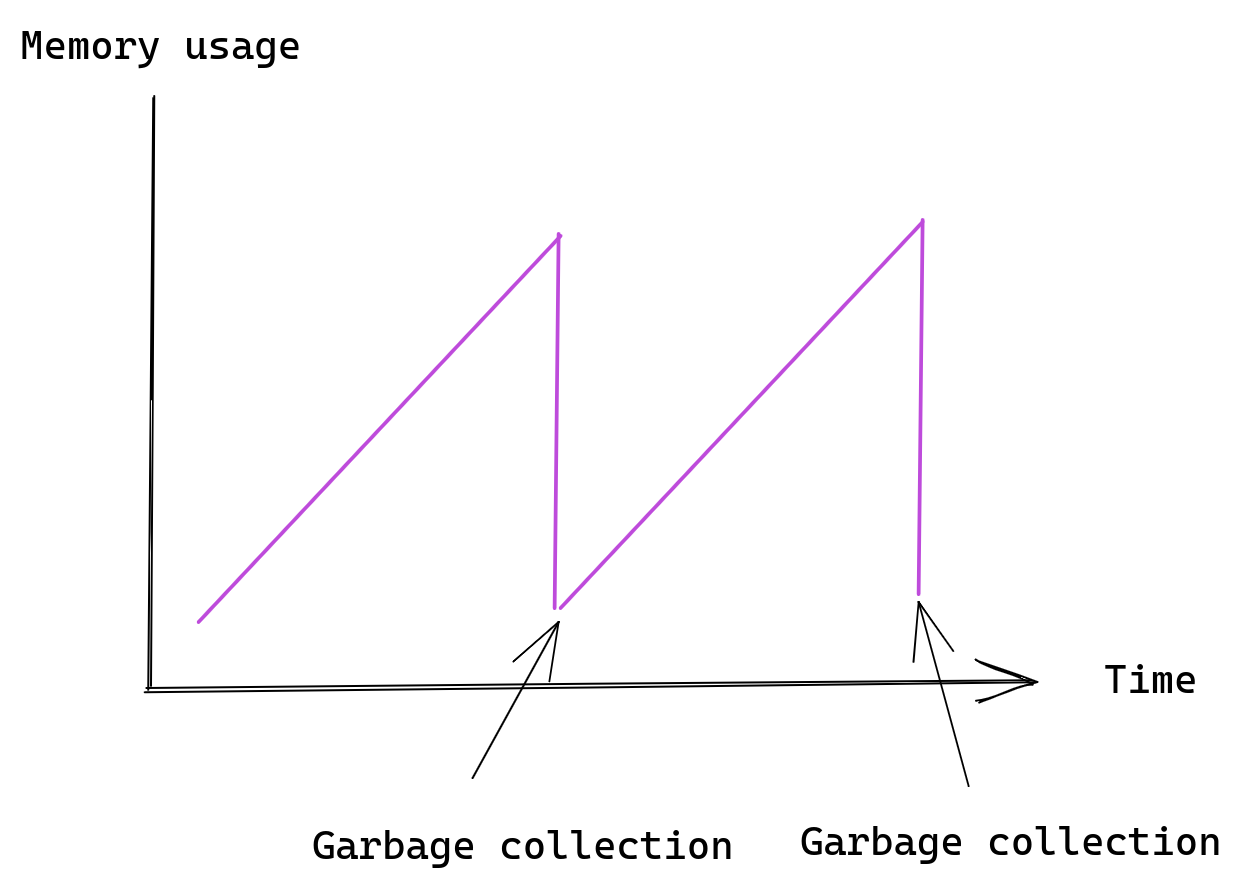
The important information here is that short lived time series are expensive. A time series that was only scraped once is guaranteed to live in Prometheus for one to three hours, depending on the exact time of that scrape.
The cost of cardinality
At this point we should know a few things about Prometheus:
- We know what a metric, a sample and a time series is.
- We know that the more labels on a metric, the more time series it can create.
- We know that each time series will be kept in memory.
- We know that time series will stay in memory for a while, even if they were scraped only once.
With all of that in mind we can now see the problem – a metric with high cardinality, especially one with label values that come from the outside world, can easily create a huge number of time series in a very short time, causing cardinality explosion. This would inflate Prometheus memory usage, which can cause Prometheus server to crash, if it uses all available physical memory.
To get a better idea of this problem let’s adjust our example metric to track HTTP requests.
Our metric will have a single label that stores the request path.
from prometheus_client import Counter

c = Counter(http_requests_total, 'The total number of HTTP requests.', ['path'])

# HTTP request handler our web server will call
def handle_request(path):
  c.labels(path).inc()
  ...
If we make a single request using the curl command:
> curl https://app.example.com/index.html
We should see these time series in our application:
# HELP http_requests_total The total number of HTTP requests.
# TYPE http_requests_total counter
http_requests_total{path="/index.html"} 1
But what happens if an evil hacker decides to send a bunch of random requests to our application?
> curl https://app.example.com/jdfhd5343
> curl https://app.example.com/3434jf833
> curl https://app.example.com/1333ds5
> curl https://app.example.com/aaaa43321
Extra time series would be created:
# HELP http_requests_total The total number of HTTP requests.
# TYPE http_requests_total counter
http_requests_total{path="/index.html"} 1
http_requests_total{path="/jdfhd5343"} 1
http_requests_total{path="/3434jf833"} 1
http_requests_total{path="/1333ds5"} 1
http_requests_total{path="/aaaa43321"} 1
With 1,000 random requests we would end up with 1,000 time series in Prometheus. If our metric had more labels and all of them were set based on the request payload (HTTP method name, IPs, headers, etc) we could easily end up with millions of time series.
Often it doesn’t require any malicious actor to cause cardinality related problems. A common class of mistakes is to have an error label on your metrics and pass raw error objects as values.
from prometheus_client import Counter

c = Counter(errors_total, 'The total number of errors.', [error])

def my_func:
  try:
    ...
  except Exception as err:
    c.labels(err).inc()
This works well if errors that need to be handled are generic, for example “Permission Denied”:
errors_total{error="Permission Denied"} 1
But if the error string contains some task specific information, for example the name of the file that our application didn’t have access to, or a TCP connection error, then we might easily end up with high cardinality metrics this way:
errors_total{error="file not found: /myfile.txt"} 1
errors_total{error="file not found: /other/file.txt"} 1
errors_total{error="read udp 127.0.0.1:12421->127.0.0.2:443: i/o timeout"} 1
errors_total{error="read udp 127.0.0.1:14743->127.0.0.2:443: i/o timeout"} 1
Once scraped all those time series will stay in memory for a minimum of one hour. It’s very easy to keep accumulating time series in Prometheus until you run out of memory.
Even Prometheus’ own client libraries had bugs that could expose you to problems like this.
How much memory does a time series need?
Each time series stored inside Prometheus (as a memSeries instance) consists of:
- Copy of all labels.
- Chunks containing samples.
- Extra fields needed by Prometheus internals.
The amount of memory needed for labels will depend on the number and length of these. The more labels you have, or the longer the names and values are, the more memory it will use.
The way labels are stored internally by Prometheus also matters, but that’s something the user has no control over. There is an open pull request which improves memory usage of labels by storing all labels as a single string.
Chunks will consume more memory as they slowly fill with more samples, after each scrape, and so the memory usage here will follow a cycle – we start with low memory usage when the first sample is appended, then memory usage slowly goes up until a new chunk is created and we start again.
You can calculate how much memory is needed for your time series by running this query on your Prometheus server:
go_memstats_alloc_bytes / prometheus_tsdb_head_series
Note that your Prometheus server must be configured to scrape itself for this to work.
Secondly this calculation is based on all memory used by Prometheus, not only time series data, so it’s just an approximation. Use it to get a rough idea of how much memory is used per time series and don’t assume it’s that exact number.
Thirdly Prometheus is written in Golang which is a language with garbage collection. The actual amount of physical memory needed by Prometheus will usually be higher as a result, since it will include unused (garbage) memory that needs to be freed by Go runtime.
Protecting Prometheus from cardinality explosions
Prometheus does offer some options for dealing with high cardinality problems. There are a number of options you can set in your scrape configuration block. Here is the extract of the relevant options from Prometheus documentation:
# An uncompressed response body larger than this many bytes will cause the
# scrape to fail. 0 means no limit. Example: 100MB.
# This is an experimental feature, this behaviour could
# change or be removed in the future.
[ body_size_limit: <size> | default = 0 ]
# Per-scrape limit on number of scraped samples that will be accepted.
# If more than this number of samples are present after metric relabeling
# the entire scrape will be treated as failed. 0 means no limit.
[ sample_limit: <int> | default = 0 ]

# Per-scrape limit on number of labels that will be accepted for a sample. If
# more than this number of labels are present post metric-relabeling, the
# entire scrape will be treated as failed. 0 means no limit.
[ label_limit: <int> | default = 0 ]

# Per-scrape limit on length of labels name that will be accepted for a sample.
# If a label name is longer than this number post metric-relabeling, the entire
# scrape will be treated as failed. 0 means no limit.
[ label_name_length_limit: <int> | default = 0 ]

# Per-scrape limit on length of labels value that will be accepted for a sample.
# If a label value is longer than this number post metric-relabeling, the
# entire scrape will be treated as failed. 0 means no limit.
[ label_value_length_limit: <int> | default = 0 ]

# Per-scrape config limit on number of unique targets that will be
# accepted. If more than this number of targets are present after target
# relabeling, Prometheus will mark the targets as failed without scraping them.
# 0 means no limit. This is an experimental feature, this behaviour could
# change in the future.
[ target_limit: <int> | default = 0 ]
Setting all the label length related limits allows you to avoid a situation where extremely long label names or values end up taking too much memory.
Going back to our metric with error labels we could imagine a scenario where some operation returns a huge error message, or even stack trace with hundreds of lines. If such a stack trace ended up as a label value it would take a lot more memory than other time series, potentially even megabytes. Since labels are copied around when Prometheus is handling queries this could cause significant memory usage increase.
Setting label_limit provides some cardinality protection, but even with just one label name and huge number of values we can see high cardinality. Passing sample_limit is the ultimate protection from high cardinality. It enables us to enforce a hard limit on the number of time series we can scrape from each application instance.
The downside of all these limits is that breaching any of them will cause an error for the entire scrape.
If we configure a sample_limit of 100 and our metrics response contains 101 samples, then Prometheus won’t scrape anything at all. This is a deliberate design decision made by Prometheus developers.
The main motivation seems to be that dealing with partially scraped metrics is difficult and you’re better off treating failed scrapes as incidents.
How does Cloudflare deal with high cardinality?
We have hundreds of data centers spread across the world, each with dedicated Prometheus servers responsible for scraping all metrics.
Each Prometheus is scraping a few hundred different applications, each running on a few hundred servers.
Combined that’s a lot of different metrics. It’s not difficult to accidentally cause cardinality problems and in the past we’ve dealt with a fair number of issues relating to it.
Basic limits
The most basic layer of protection that we deploy are scrape limits, which we enforce on all configured scrapes. These are the sane defaults that 99% of application exporting metrics would never exceed.
By default we allow up to 64 labels on each time series, which is way more than most metrics would use.
We also limit the length of label names and values to 128 and 512 characters, which again is more than enough for the vast majority of scrapes.
Finally we do, by default, set sample_limit to 200 – so each application can export up to 200 time series without any action.
What happens when somebody wants to export more time series or use longer labels? All they have to do is set it explicitly in their scrape configuration.
Those limits are there to catch accidents and also to make sure that if any application is exporting a high number of time series (more than 200) the team responsible for it knows about it. This helps us avoid a situation where applications are exporting thousands of times series that aren’t really needed. Once you cross the 200 time series mark, you should start thinking about your metrics more.
CI validation
The next layer of protection is checks that run in CI (Continuous Integration) when someone makes a pull request to add new or modify existing scrape configuration for their application.
These checks are designed to ensure that we have enough capacity on all Prometheus servers to accommodate extra time series, if that change would result in extra time series being collected.
For example, if someone wants to modify sample_limit, let’s say by changing existing limit of 500 to 2,000, for a scrape with 10 targets, that’s an increase of 1,500 per target, with 10 targets that’s 10*1,500=15,000 extra time series that might be scraped. Our CI would check that all Prometheus servers have spare capacity for at least 15,000 time series before the pull request is allowed to be merged.
This gives us confidence that we won’t overload any Prometheus server after applying changes.
Our custom patches
One of the most important layers of protection is a set of patches we maintain on top of Prometheus. There is an open pull request on the Prometheus repository. This patchset consists of two main elements.
First is the patch that allows us to enforce a limit on the total number of time series TSDB can store at any time. There is no equivalent functionality in a standard build of Prometheus, if any scrape produces some samples they will be appended to time series inside TSDB, creating new time series if needed.
This is the standard flow with a scrape that doesn’t set any sample_limit:
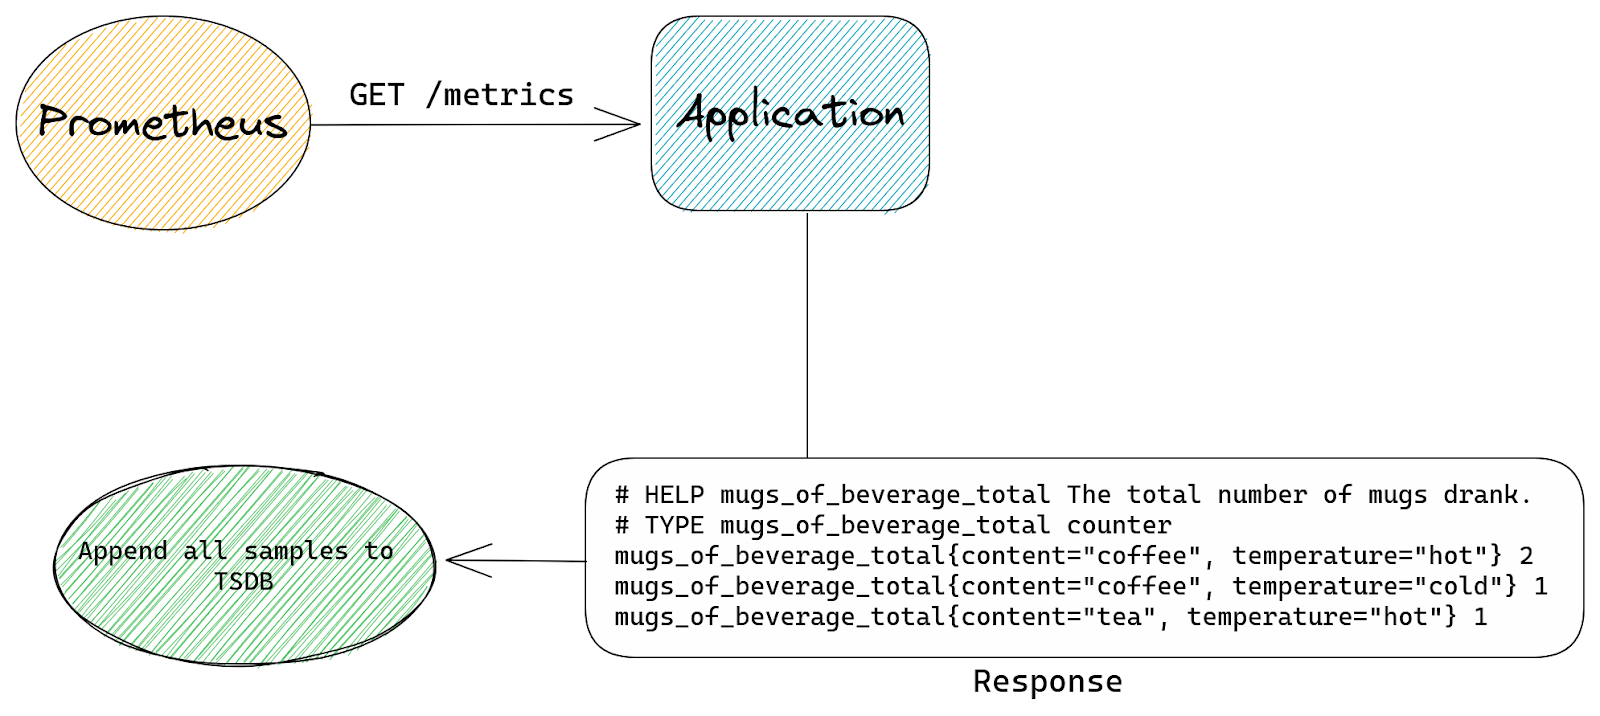
With our patch we tell TSDB that it’s allowed to store up to N time series in total, from all scrapes, at any time. So when TSDB is asked to append a new sample by any scrape, it will first check how many time series are already present.
If the total number of stored time series is below the configured limit then we append the sample as usual.
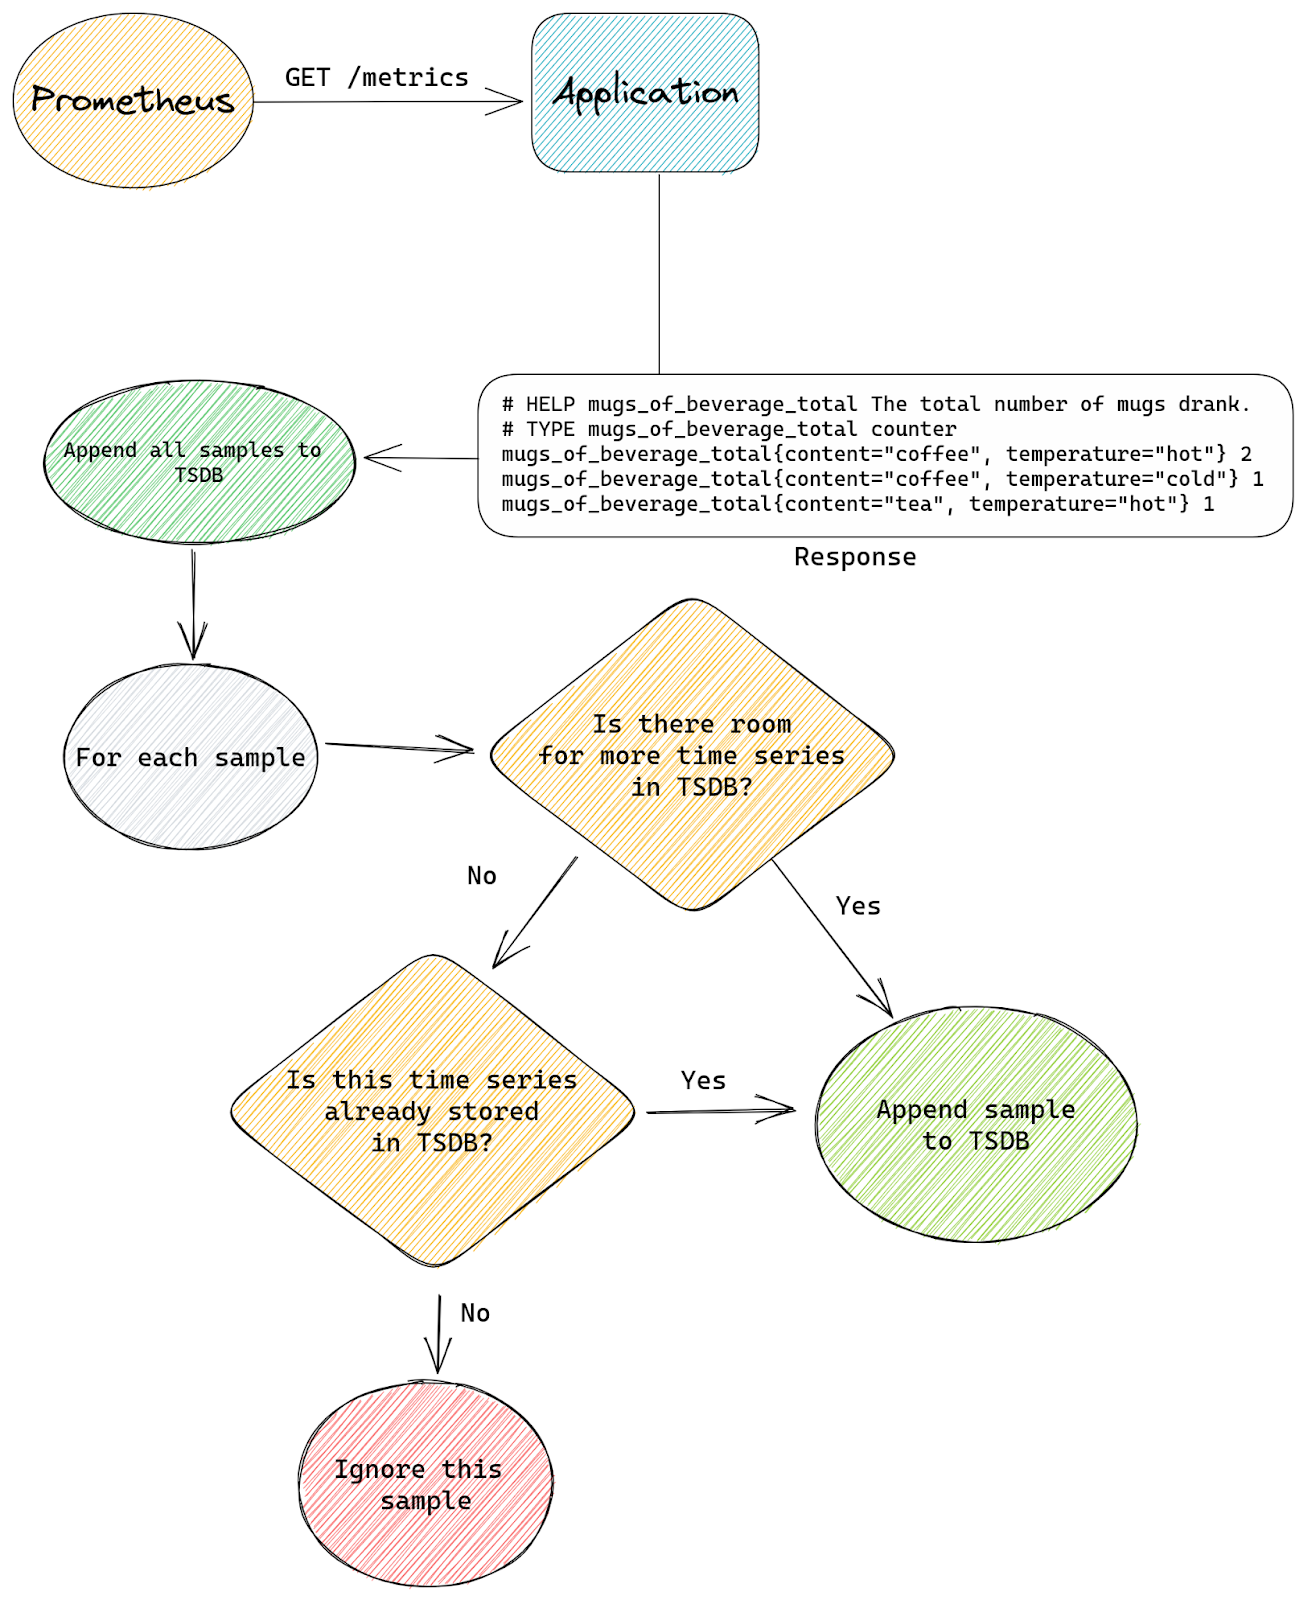
The difference with standard Prometheus starts when a new sample is about to be appended, but TSDB already stores the maximum number of time series it’s allowed to have. Our patched logic will then check if the sample we’re about to append belongs to a time series that’s already stored inside TSDB or is it a new time series that needs to be created.
If the time series already exists inside TSDB then we allow the append to continue. If the time series doesn’t exist yet and our append would create it (a new memSeries instance would be created) then we skip this sample. We will also signal back to the scrape logic that some samples were skipped.
This is the modified flow with our patch:
By running “go_memstats_alloc_bytes / prometheus_tsdb_head_series” query we know how much memory we need per single time series (on average), we also know how much physical memory we have available for Prometheus on each server, which means that we can easily calculate the rough number of time series we can store inside Prometheus, taking into account the fact the there’s garbage collection overhead since Prometheus is written in Go:
memory available to Prometheus / bytes per time series = our capacity
This doesn’t capture all complexities of Prometheus but gives us a rough estimate of how many time series we can expect to have capacity for.
By setting this limit on all our Prometheus servers we know that it will never scrape more time series than we have memory for. This is the last line of defense for us that avoids the risk of the Prometheus server crashing due to lack of memory.
The second patch modifies how Prometheus handles sample_limit – with our patch instead of failing the entire scrape it simply ignores excess time series. If we have a scrape with sample_limit set to 200 and the application exposes 201 time series, then all except one final time series will be accepted.
This is the standard Prometheus flow for a scrape that has the sample_limit option set:
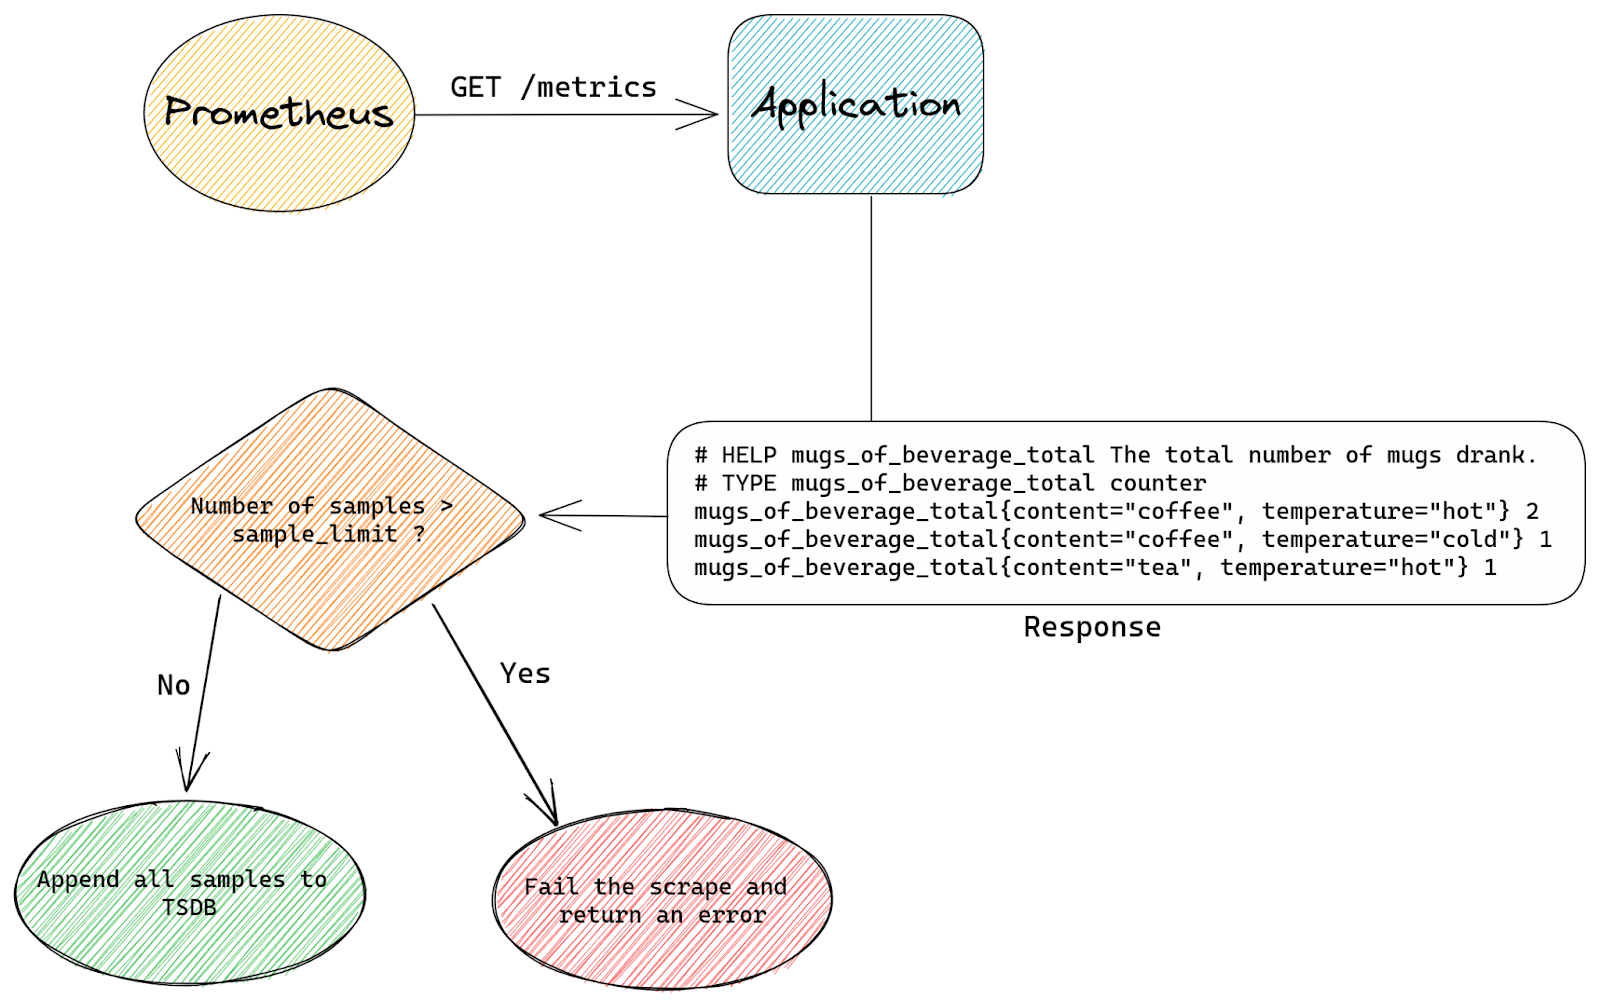
The entire scrape either succeeds or fails. Prometheus simply counts how many samples are there in a scrape and if that’s more than sample_limit allows it will fail the scrape.
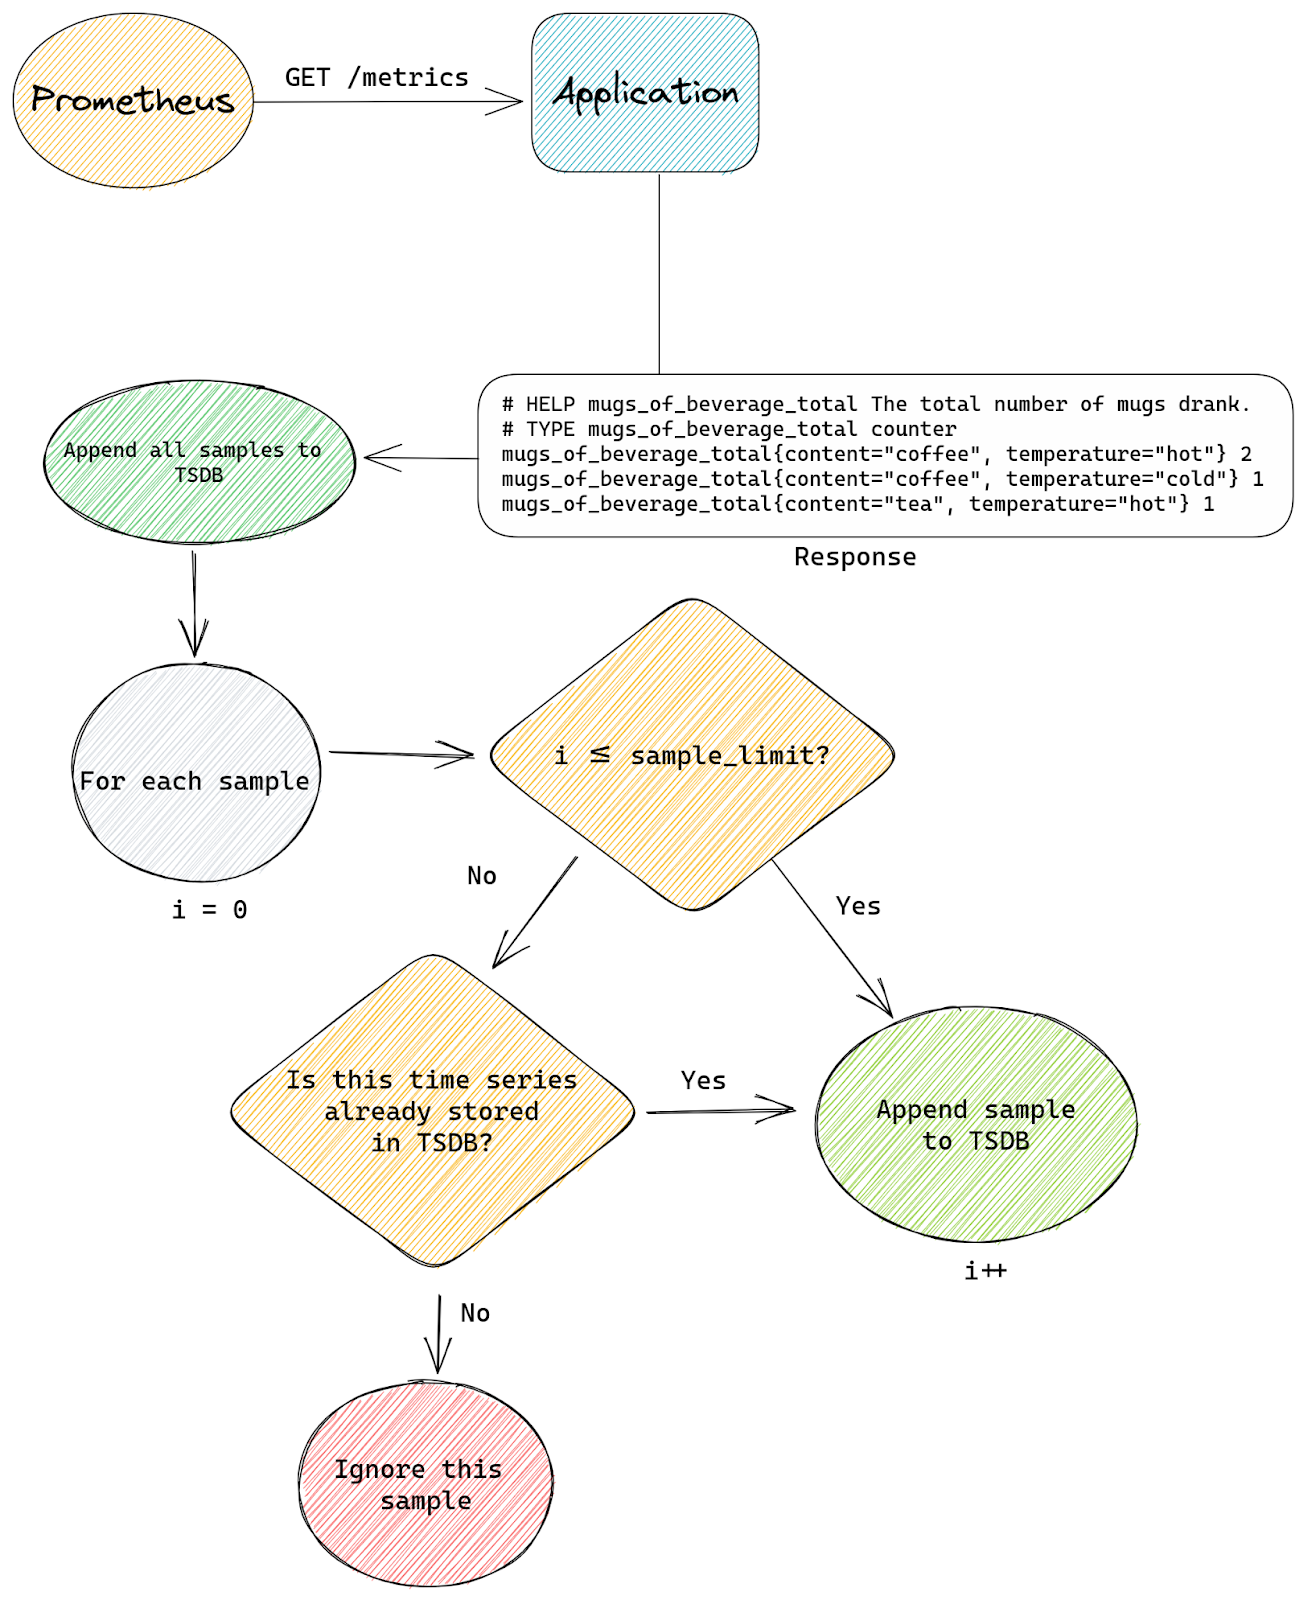
With our custom patch we don’t care how many samples are in a scrape. Instead we count time series as we append them to TSDB. Once we appended sample_limit number of samples we start to be selective.
Any excess samples (after reaching sample_limit) will only be appended if they belong to time series that are already stored inside TSDB.
The reason why we still allow appends for some samples even after we’re above sample_limit is that appending samples to existing time series is cheap, it’s just adding an extra timestamp & value pair.
Creating new time series on the other hand is a lot more expensive – we need to allocate new memSeries instances with a copy of all labels and keep it in memory for at least an hour.
This is how our modified flow looks:
Both patches give us two levels of protection.
The TSDB limit patch protects the entire Prometheus from being overloaded by too many time series.
This is because the only way to stop time series from eating memory is to prevent them from being appended to TSDB. Once they’re in TSDB it’s already too late.
While the sample_limit patch stops individual scrapes from using too much Prometheus capacity, which could lead to creating too many time series in total and exhausting total Prometheus capacity (enforced by the first patch), which would in turn affect all other scrapes since some new time series would have to be ignored. At the same time our patch gives us graceful degradation by capping time series from each scrape to a certain level, rather than failing hard and dropping all time series from affected scrape, which would mean losing all observability of affected applications.
It’s also worth mentioning that without our TSDB total limit patch we could keep adding new scrapes to Prometheus and that alone could lead to exhausting all available capacity, even if each scrape had sample_limit set and scraped fewer time series than this limit allows.
Extra metrics exported by Prometheus itself tell us if any scrape is exceeding the limit and if that happens we alert the team responsible for it.
This also has the benefit of allowing us to self-serve capacity management – there’s no need for a team that signs off on your allocations, if CI checks are passing then we have the capacity you need for your applications.
The main reason why we prefer graceful degradation is that we want our engineers to be able to deploy applications and their metrics with confidence without being subject matter experts in Prometheus. That way even the most inexperienced engineers can start exporting metrics without constantly wondering “Will this cause an incident?”.
Another reason is that trying to stay on top of your usage can be a challenging task. It might seem simple on the surface, after all you just need to stop yourself from creating too many metrics, adding too many labels or setting label values from untrusted sources.
In reality though this is as simple as trying to ensure your application doesn’t use too many resources, like CPU or memory – you can achieve this by simply allocating less memory and doing fewer computations. It doesn’t get easier than that, until you actually try to do it. The more any application does for you, the more useful it is, the more resources it might need. Your needs or your customers’ needs will evolve over time and so you can’t just draw a line on how many bytes or cpu cycles it can consume. If you do that, the line will eventually be redrawn, many times over.
In general, having more labels on your metrics allows you to gain more insight, and so the more complicated the application you’re trying to monitor, the more need for extra labels.
In addition to that in most cases we don’t see all possible label values at the same time, it’s usually a small subset of all possible combinations. For example our errors_total metric, which we used in example before, might not be present at all until we start seeing some errors, and even then it might be just one or two errors that will be recorded. This holds true for a lot of labels that we see are being used by engineers.
This means that looking at how many time series an application could potentially export, and how many it actually exports, gives us two completely different numbers, which makes capacity planning a lot harder.
Especially when dealing with big applications maintained in part by multiple different teams, each exporting some metrics from their part of the stack.
For that reason we do tolerate some percentage of short lived time series even if they are not a perfect fit for Prometheus and cost us more memory.
Documentation
Finally we maintain a set of internal documentation pages that try to guide engineers through the process of scraping and working with metrics, with a lot of information that’s specific to our environment.
Prometheus and PromQL (Prometheus Query Language) are conceptually very simple, but this means that all the complexity is hidden in the interactions between different elements of the whole metrics pipeline.
Managing the entire lifecycle of a metric from an engineering perspective is a complex process.
You must define your metrics in your application, with names and labels that will allow you to work with resulting time series easily. Then you must configure Prometheus scrapes in the correct way and deploy that to the right Prometheus server. Next you will likely need to create recording and/or alerting rules to make use of your time series. Finally you will want to create a dashboard to visualize all your metrics and be able to spot trends.
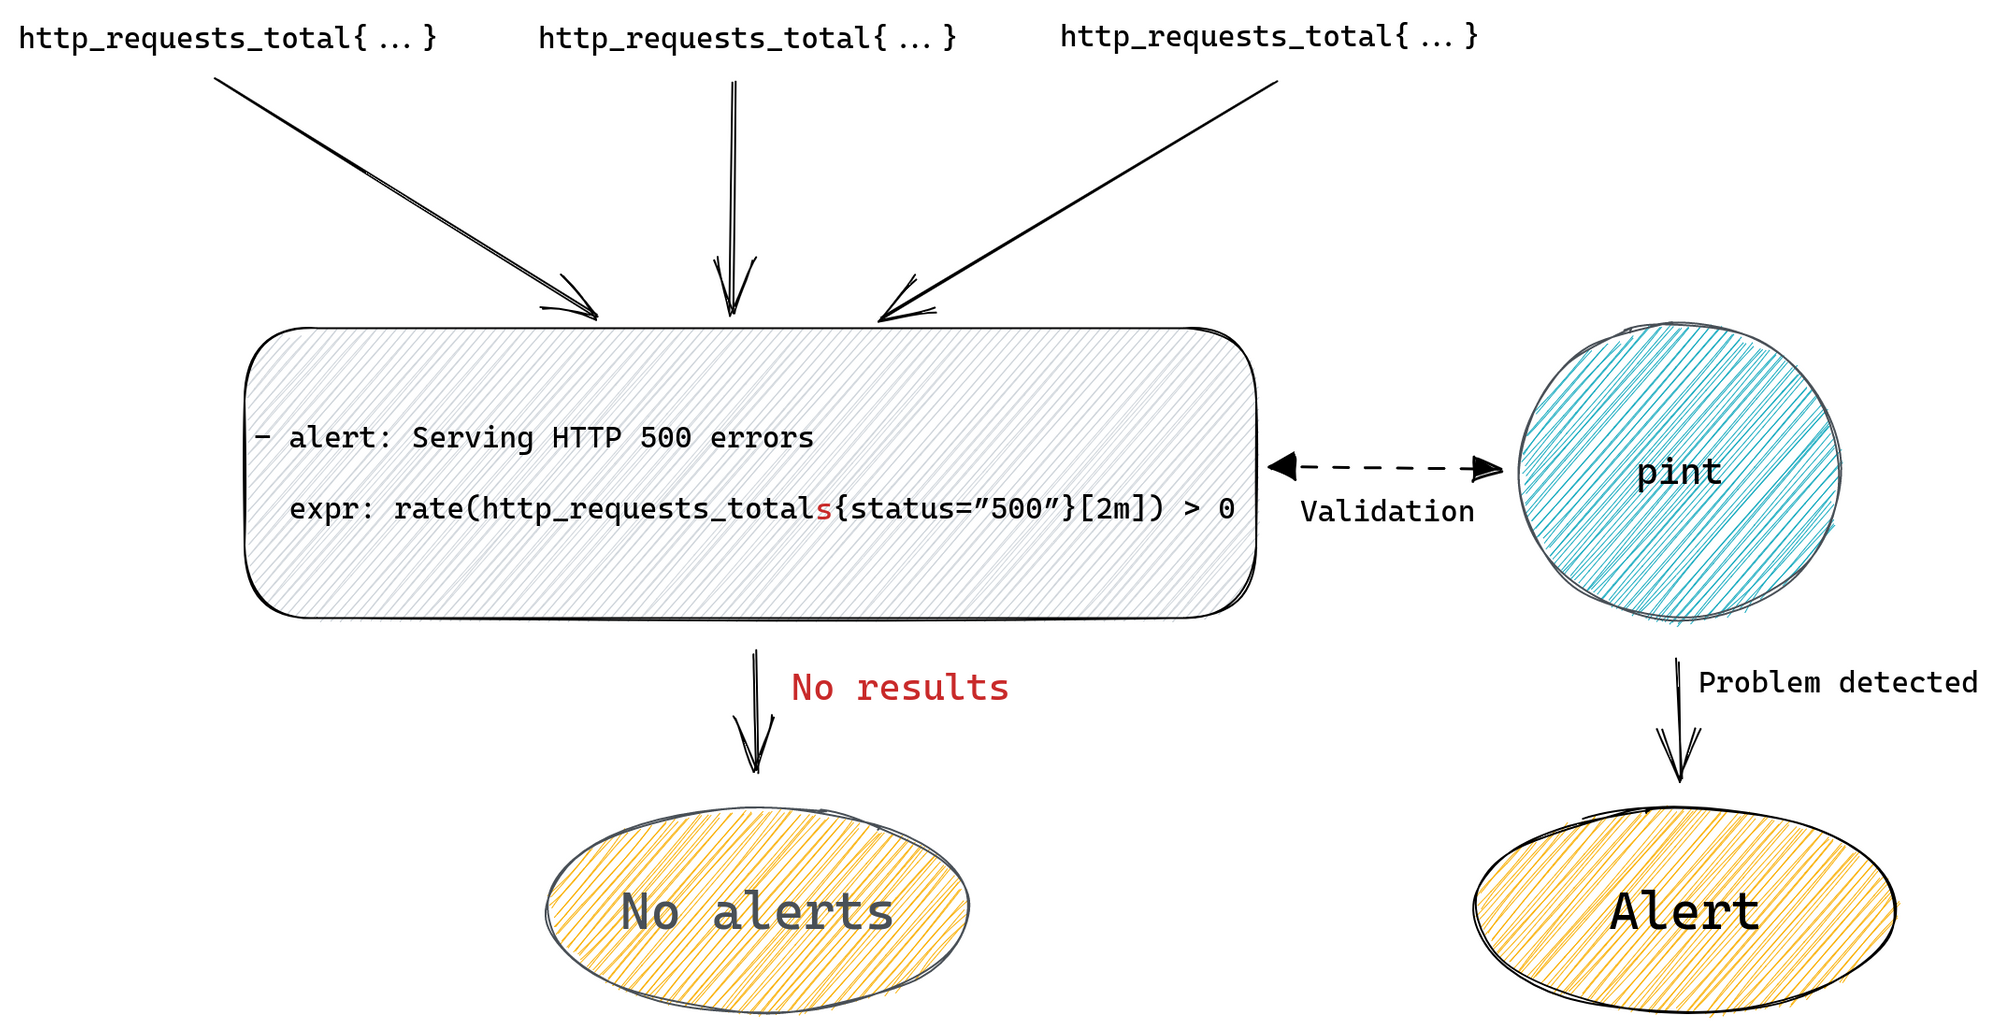
There will be traps and room for mistakes at all stages of this process. We covered some of the most basic pitfalls in our previous blog post on Prometheus – Monitoring our monitoring. In the same blog post we also mention one of the tools we use to help our engineers write valid Prometheus alerting rules.
Having good internal documentation that covers all of the basics specific for our environment and most common tasks is very important. Being able to answer “How do I X?” yourself without having to wait for a subject matter expert allows everyone to be more productive and move faster, while also avoiding Prometheus experts from answering the same questions over and over again.
Closing thoughts
Prometheus is a great and reliable tool, but dealing with high cardinality issues, especially in an environment where a lot of different applications are scraped by the same Prometheus server, can be challenging.
We had a fair share of problems with overloaded Prometheus instances in the past and developed a number of tools that help us deal with them, including custom patches.
But the key to tackling high cardinality was better understanding how Prometheus works and what kind of usage patterns will be problematic.
Having better insight into Prometheus internals allows us to maintain a fast and reliable observability platform without too much red tape, and the tooling we’ve developed around it, some of which is open sourced, helps our engineers avoid most common pitfalls and deploy with confidence.