Post Syndicated from David Boyne original https://aws.amazon.com/blogs/compute/introducing-container-database-and-queue-utilization-metrics-for-the-amazon-mwaa-environment/
This post is written by Uma Ramadoss (Senior Specialist Solutions Architect), and Jeetendra Vaidya (Senior Solutions Architect).
Today, AWS is announcing the availability of container, database, and queue utilization metrics for Amazon Managed Workflows for Apache Airflow (Amazon MWAA). This is a new collection of metrics published by Amazon MWAA in addition to existing Apache Airflow metrics in Amazon CloudWatch. With these new metrics, you can better understand the performance of your Amazon MWAA environment, troubleshoot issues related to capacity, delays, and get insights on right-sizing your Amazon MWAA environment.
Previously, customers were limited to Apache Airflow metrics such as DAG processing parse times, pool running slots, and scheduler heartbeat to measure the performance of the Amazon MWAA environment. While these metrics are often effective in diagnosing Airflow behavior, they lack the ability to provide complete visibility into the utilization of the various Apache Airflow components in the Amazon MWAA environment. This could limit the ability for some customers to monitor the performance and health of the environment effectively.
Overview
Amazon MWAA is a managed service for Apache Airflow. There are a variety of deployment techniques with Apache Airflow. The Amazon MWAA deployment architecture of Apache Airflow is carefully chosen to allow customers to run workflows in production at scale.
Amazon MWAA has distributed architecture with multiple schedulers, auto-scaled workers, and load balanced web server. They are deployed in their own Amazon Elastic Container Service (ECS) cluster using AWS Fargate compute engine. Amazon Simple Queue Service (SQS) queue is used to decouple Airflow workers and schedulers as part of Celery Executor architecture. Amazon Aurora PostgreSQL-Compatible Edition is used as the Apache Airflow metadata database. From today, you can get complete visibility into the scheduler, worker, web server, database, and queue metrics.
In this post, you can learn about the new metrics published for Amazon MWAA environment, build a sample application with a pre-built workflow, and explore the metrics using CloudWatch dashboard.
Container, database, and queue utilization metrics
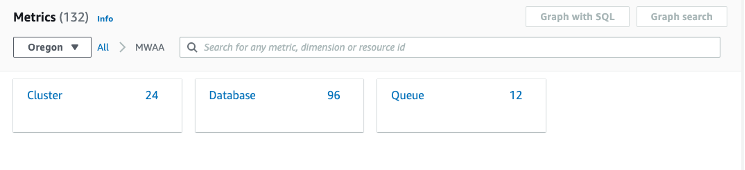
- In the CloudWatch console, in Metrics, select All metrics.
- From the metrics console that appears on the right, expand AWS namespaces and select MWAA tile.
- You can see a tile of dimensions, each corresponding to the container (cluster), database, and queue metrics.

MWAA metrics
MWAA metrics drilldown
Cluster metrics
The base MWAA environment comes up with three Amazon ECS clusters – scheduler, one worker (BaseWorker), and a web server. Workers can be configured with minimum and maximum numbers. When you configure more than one minimum worker, Amazon MWAA creates another ECS cluster (AdditionalWorker) to host the workers from 2 up to n where n is the max workers configured in your environment.
When you select Cluster from the console, you can see the list of metrics for all the clusters. To learn more about the metrics, visit the Amazon ECS product documentation.

MWAA metrics list
CPU usage is the most important factor for schedulers due to DAG file processing. When you have many DAGs, CPU usage can be higher. You can improve the performance by setting min_file_process_interval higher. Similarly, you can apply other techniques described in the Apache Airflow Scheduler page to fine tune the performance.
Higher CPU or memory utilization in the worker can be due to moving large files or doing computation on the worker itself. This can be resolved by offloading the compute to purpose-built services such as Amazon ECS, Amazon EMR, and AWS Glue.
Database metrics
Amazon Aurora DB clusters used by Amazon MWAA come up with a primary DB instance and a read replica to support the read operations. Amazon MWAA publishes database metrics for both READER and WRITER instances. When you select Database tile, you can view the list of metrics available for the database cluster.
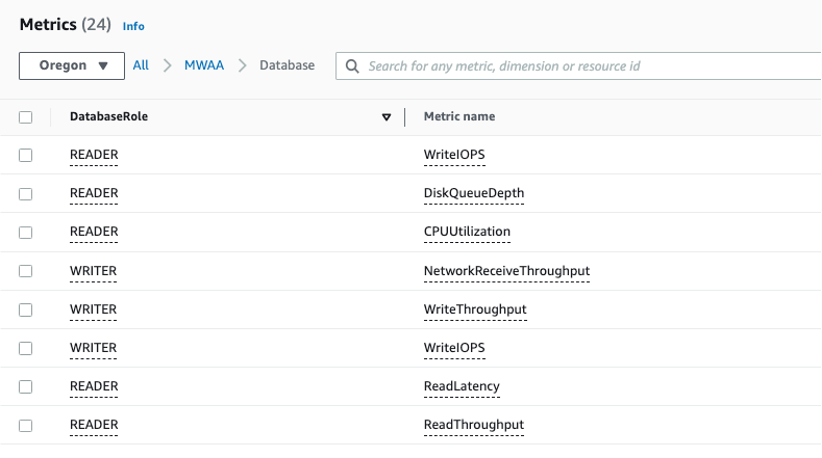
Database metrics
Amazon MWAA uses connection pooling technique so the database connections from scheduler, workers, and web servers are taken from the connection pool. If you have many DAGs scheduled to start at the same time, it can overload the scheduler and increase the number of database connections at a high frequency. This can be minimized by staggering the DAG schedule.
SQS metrics
An SQS queue helps decouple scheduler and worker so they can independently scale. When workers read the messages, they are considered in-flight and not available for other workers. Messages become available for other workers to read if they are not deleted before the 12 hours visibility timeout. Amazon MWAA publishes in-flight message count (RunningTasks), messages available for reading count (QueuedTasks) and the approximate age of the earliest non-deleted message (ApproximateAgeOfOldestTask).

Database metrics
Getting started with container, database and queue utilization metrics for Amazon MWAA
The following sample project explores some key metrics using an Amazon CloudWatch dashboard to help you find the number of workers running in your environment at any given moment.
The sample project deploys the following resources:
- Amazon Virtual Private Cloud (Amazon VPC).
- Amazon MWAA environment of size small with 2 minimum workers and 10 maximum workers.
- A sample DAG that fetches NOAA Global Historical Climatology Network Daily (GHCN-D) data, uses AWS Glue Crawler to create tables and AWS Glue Job to produce an output dataset in Apache Parquet format that contains the details of precipitation readings for the US between year 2010 and 2022.
- Amazon MWAA execution role.
- Two Amazon S3 buckets – one for Amazon MWAA DAGs, one for AWS Glue job scripts and weather data.
- AWSGlueServiceRole to be used by AWS Glue Crawler and AWS Glue job.
Prerequisites
There are a few tools required to deploy the sample application. Ensure that you have each of the following in your working environment:
Setting up the Amazon MWAA environment and associated resources
- From your local machine, clone the project from the GitHub repository.
- Navigate to mwaa_utilization_cw_metric directory.
- Run the makefile.
- Makefile runs the terraform template from the infra/terraform directory. While the template is being applied, you are prompted if you want to perform these actions.
git clone https://github.com/aws-samples/amazon-mwaa-examples
cd usecases/mwaa_utilization_cw_metric
make deploy

MWAA utilization terminal
This provisions the resources and copies the necessary files and variables for the DAG to run. This process can take approximately 30 minutes to complete.
Generating metric data and exploring the metrics
- Login into your AWS account through the AWS Management Console.
- In the Amazon MWAA environment console, you can see your environment with the Airflow UI link in the right of the console.
- Select the link Open Airflow UI. This loads the Apache Airflow UI.
- From the Apache Airflow UI, enable the DAG using Pause/Unpause DAG toggle button and run the DAG using the Trigger DAG link.
- You can see the Treeview of the DAG run with the tasks running.
- Navigate to the Amazon CloudWatch dashboard in another browser tab. You can see a dashboard by the name, MWAA_Metric_Environment_env_health_metric_dashboard.
- Access the dashboard to view different key metrics across cluster, database, and queue.
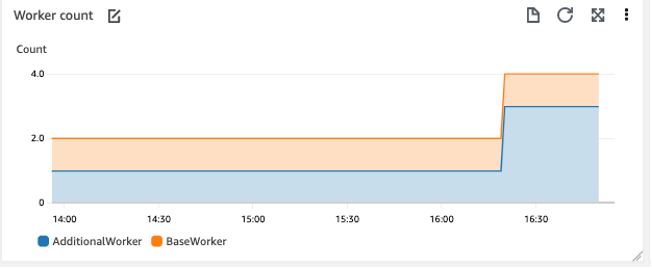
- After the DAG run is complete, you can look into the dashboard for worker count metrics. Worker count started with 2 and increased to 4.

MMQA environment console
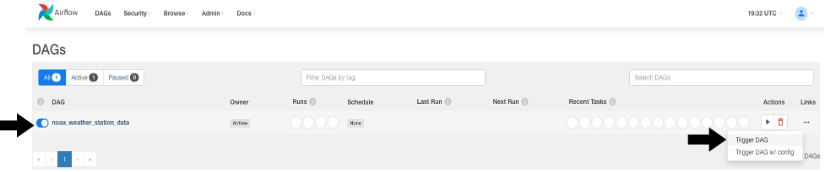
Apache Airflow UI

MWAA dashboard
When you trigger the DAG, the DAG runs 13 tasks in parallel to fetch weather data from 2010-2022. With two small size workers, the environment can run 10 parallel tasks. The rest of the tasks wait for either the running tasks to complete or automatic scaling to start. As the tasks take more than a few minutes to finish, MWAA automatic scaling adds additional workers to handle the workload. Worker count graph now plots higher with AdditionalWorker count increased to 3 from 1.
Cleanup
To delete the sample application infrastructure, use the following command from the usecases/mwaa_utilization_cw_metric directory.
make undeploy
Conclusion
This post introduces the new Amazon MWAA container, database, and queue utilization metrics. The example shows the key metrics and how you can use the metrics to solve a common question of finding the Amazon MWAA worker counts. These metrics are available to you from today for all versions supported by Amazon MWAA at no additional cost.
Start using this feature in your account to monitor the health and performance of your Amazon MWAA environment, troubleshoot issues related to capacity and delays, and to get insights into right-sizing the environment
Build your own CloudWatch dashboard using the metrics data JSON and Airflow metrics. To deploy more solutions in Amazon MWAA, explore the Amazon MWAA samples GitHub repo.
For more serverless learning resources, visit Serverless Land.
Apache, Apache Airflow, and Airflow are either registered trademarks or trademarks of the Apache Software Foundation in the United States and/or other countries.