All posts by David Boyne

Sending and receiving CloudEvents with Amazon EventBridge

Post Syndicated from David Boyne original https://aws.amazon.com/blogs/compute/sending-and-receiving-cloudevents-with-amazon-eventbridge/

Amazon EventBridge helps developers build event-driven architectures (EDA) by connecting loosely coupled publishers and consumers using event routing, filtering, and transformation. CloudEvents is an open-source specification for describing event data in a common way. Developers can publish CloudEvents directly to EventBridge, filter and route them, and use input transformers and API Destinations to send CloudEvents to downstream AWS services and third-party APIs.

Overview

Event design is an important aspect in any event-driven architecture. Developers building event-driven architectures often overlook the event design process when building their architectures. This leads to unwanted side effects like exposing implementation details, lack of standards, and version incompatibility.

Without event standards, it can be difficult to integrate events or streams of messages between systems, brokers, and organizations. Each system has to understand the event structure or rely on custom-built solutions for versioning or validation.

CloudEvents is a specification for describing event data in common formats to provide interoperability between services, platforms, and systems using Cloud Native Computing Foundation (CNCF) projects. As CloudEvents is a CNCF graduated project, many third-party brokers and systems adopt this specification.

Using CloudEvents as a standard format to describe events makes integration easier and you can use open-source tooling to help build event-driven architectures and future proof any integrations. EventBridge can route and filter CloudEvents based on common metadata, without needing to understand the business logic within the event itself.

CloudEvents support two implementation modes, structured mode and binary mode, and a range of protocols including HTTP, MQTT, AMQP, and Kafka. When publishing events to an EventBridge bus, you can structure events as CloudEvents and route them to downstream consumers. You can use input transformers to transform any event into the CloudEvents specification. Events can also be forwarded to public APIs, using EventBridge API destinations, which supports both structured and binary mode encodings, enhancing interoperability with external systems.

Standardizing events using Amazon EventBridge

When publishing events to an EventBridge bus, EventBridge uses its own event envelope and represents events as JSON objects. EventBridge requires that you define top-level fields, such as detail-type and source. You can use any event/payload in the detail field.

This example event shows an OrderPlaced event from the orders-service that is unstructured without any event standards. The data within the event contains the order_id, customer_id and order_total.

{
  "version": "0",
  "id": "dbc1c73a-c51d-0c0e-ca61-ab9278974c57",
  "account": "1234567890",
  "time": "2023-05-23T11:38:46Z",
  "region": "us-east-1",
  "detail-type": "OrderPlaced",
  "source": "myapp.orders-service",
  "resources": [],
  "detail": {
    "data": {
      "order_id": "c172a984-3ae5-43dc-8c3f-be080141845a",
      "customer_id": "dda98122-b511-4aaf-9465-77ca4a115ee6",
      "order_total": "120.00"
    }
  }
}

Publishers may also choose to add an additional metadata field along with the data field within the detail field to help define a set of standards for their events.

{
  "version": "0",
  "id": "dbc1c73a-c51d-0c0e-ca61-ab9278974c58",
  "account": "1234567890",
  "time": "2023-05-23T12:38:46Z",
  "region": "us-east-1",
  "detail-type": "OrderPlaced",
  "source": "myapp.orders-service",
  "resources": [],
  "detail": {
    "metadata": {
      "idempotency_key": "29d2b068-f9c7-42a0-91e3-5ba515de5dbe",
      "correlation_id": "dddd9340-135a-c8c6-95c2-41fb8f492222",
      "domain": "ORDERS",
      "time": "1707908605"
    },
    "data": {
      "order_id": "c172a984-3ae5-43dc-8c3f-be080141845a",
      "customer_id": "dda98122-b511-4aaf-9465-77ca4a115ee6",
      "order_total": "120.00"
    }
  }
}

This additional event information helps downstream consumers, improves debugging, and can manage idempotency. While this approach offers practical benefits, it duplicates solutions that are already solved with the CloudEvents specification.

Publishing CloudEvents using Amazon EventBridge

When publishing events to EventBridge, you can use CloudEvents structured mode. A structured-mode message is where the entire event (attributes and data) is encoded in the message body, according to a specific event format. A binary-mode message is where the event data is stored in the message body, and event attributes are stored as part of the message metadata.

CloudEvents has a list of required fields but also offers flexibility with optional attributes and extensions. CloudEvents also offers a solution to implement idempotency, requiring that the combination of id and source must uniquely identify an event, which can be used as the idempotency key in downstream implementations.

{
  "version": "0",
  "id": "dbc1c73a-c51d-0c0e-ca61-ab9278974c58",
  "account": "1234567890",
  "time": "2023-05-23T12:38:46Z",
  "region": "us-east-1",
  "detail-type": "OrderPlaced",
  "source": "myapp.orders-service",
  "resources": [],
  "detail": {
    "specversion": "1.0",
    "id": "bba4379f-b764-4d90-9fb2-9f572b2b0b61",
    "source": "myapp.orders-service",
    "type": "OrderPlaced",
    "data": {
      "order_id": "c172a984-3ae5-43dc-8c3f-be080141845a",
      "customer_id": "dda98122-b511-4aaf-9465-77ca4a115ee6",
      "order_total": "120.00"
    },
    "time": "2024-01-01T17:31:00Z",
    "dataschema": "https://us-west-2.console.aws.amazon.com/events/home?region=us-west-2#/registries/discovered-schemas/schemas/myapp.orders-service%40OrderPlaced",
    "correlationid": "dddd9340-135a-c8c6-95c2-41fb8f492222",
    "domain": "ORDERS"
  }
}

By incorporating the required fields, the OrderPlaced event is now CloudEvents compliant. The event also contains optional and extension fields for additional information. Optional fields such as dataschema can be useful for brokers and consumers to retrieve a URI path to the published event schema. This example event references the schema in the EventBridge schema registry, so downstream consumers can fetch the schema to validate the payload.

Mapping existing events into CloudEvents using input transformers

When you define a target in EventBridge, input transformations allow you to modify the event before it reaches its destination. Input transformers are configured per target, allowing you to convert events when your downstream consumer requires the CloudEvents format and you want to avoid duplicating information.

Input transformers allow you to map EventBridge fields, such as id, region, detail-type, and source, into corresponding CloudEvents attributes.

This example shows how to transform any EventBridge event into CloudEvents format using input transformers, so the target receives the required structure.

{
  "version": "0",
  "id": "dbc1c73a-c51d-0c0e-ca61-ab9278974c58",
  "account": "1234567890",
  "time": "2024-01-23T12:38:46Z",
  "region": "us-east-1",
  "detail-type": "OrderPlaced",
  "source": "myapp.orders-service",
  "resources": [],
  "detail": {
    "order_id": "c172a984-3ae5-43dc-8c3f-be080141845a",
    "customer_id": "dda98122-b511-4aaf-9465-77ca4a115ee6",
    "order_total": "120.00"
  }
}

Using this input transformer and input template EventBridge transforms the event schema into the CloudEvents specification for downstream consumers.

Input transformer for CloudEvents:

{
  "id": "$.id",
  "source": "$.source",
  "type": "$.detail-type",
  "time": "$.time",
  "data": "$.detail"
}

Input template for CloudEvents:

{
  "specversion": "1.0",
  "id": "<id>",
  "source": "<source>",
  "type": "<type>",
  "time": "<time>",
  "data": <data>
}

This example shows the event payload that is received by downstream targets, which is mapped to the CloudEvents specification.

{
  "specversion": "1.0",
  "id": "dbc1c73a-c51d-0c0e-ca61-ab9278974c58",
  "source": "myapp.orders-service",
  "type": "OrderPlaced",
  "time": "2024-01-23T12:38:46Z",
  "data": {
      "order_id": "c172a984-3ae5-43dc-8c3f-be080141845a",
      "customer_id": "dda98122-b511-4aaf-9465-77ca4a115ee6",
      "order_total": "120.00"
    }
}

For more information on using input transformers with CloudEvents, see this pattern on Serverless Land.

Transforming events into CloudEvents using API destinations

EventBridge API destinations allows you to trigger HTTP endpoints based on matched rules to integrate with third-party systems using public APIs. You can route events to APIs that support the CloudEvents format by using input transformations and custom HTTP headers to convert EventBridge events to CloudEvents. API destinations now supports custom content-type headers. This allows you to send structured or binary CloudEvents to downstream consumers.

Sending binary CloudEvents using API destinations

When sending binary CloudEvents over HTTP, you must use the HTTP binding specification and set the necessary CloudEvents headers. These headers tell the downstream consumer that the incoming payload uses the CloudEvents format. The body of the request is the event itself.

CloudEvents headers are prefixed with ce-. You can find the list of headers in the HTTP protocol binding documentation.

This example shows the Headers for a binary event:

POST /order HTTP/1.1 
Host: webhook.example.com
ce-specversion: 1.0
ce-type: OrderPlaced
ce-source: myapp.orders-service
ce-id: bba4379f-b764-4d90-9fb2-9f572b2b0b61
ce-time: 2024-01-01T17:31:00Z
ce-dataschema: https://us-west-2.console.aws.amazon.com/events/home?region=us-west-2#/registries/discovered-schemas/schemas/myapp.orders-service%40OrderPlaced
correlationid: dddd9340-135a-c8c6-95c2-41fb8f492222
domain: ORDERS
Content-Type: application/json; charset=utf-8

This example shows the body for a binary event:

{
  "order_id": "c172a984-3ae5-43dc-8c3f-be080141845a",
  "customer_id": "dda98122-b511-4aaf-9465-77ca4a115ee6",
  "order_total": "120.00"
}

For more information when using binary CloudEvents with API destinations, explore this pattern available on Serverless Land.

Sending structured CloudEvents using API destinations

To support structured mode with CloudEvents, you must specify the content-type as application/cloudevents+json; charset=UTF-8, which tells the API consumer that the payload of the event is adhering to the CloudEvents specification.

POST /order HTTP/1.1
Host: webhook.example.com
 
Content-Type: application/cloudevents+json; charset=utf-8
{
    "specversion": "1.0",
    "id": "bba4379f-b764-4d90-9fb2-9f572b2b0b61",
    "source": "myapp.orders-service",
    "type": "OrderPlaced",      
    "data": {
      "order_id": "c172a984-3ae5-43dc-8c3f-be080141845a",
      "customer_id": "dda98122-b511-4aaf-9465-77ca4a115ee6",
      "order_total": "120.00"
    },
    "time": "2024-01-01T17:31:00Z",
    "dataschema": "https://us-west-2.console.aws.amazon.com/events/home?region=us-west-2#/registries/discovered-schemas/schemas/myapp.orders-service%40OrderPlaced",
    "correlationid": "dddd9340-135a-c8c6-95c2-41fb8f492222",
    "domain":"ORDERS"
}

Conclusion

Carefully designing events plays an important role when building event-driven architectures to integrate producers and consumers effectively. The open-source CloudEvents specification helps developers to standardize integration processes, simplifying interactions between internal systems and external partners.

EventBridge allows you to use a flexible payload structure within an event’s detail property to standardize events. You can publish structured CloudEvents directly onto an event bus in the detail field and use payload transformations to allow downstream consumers to receive events in the CloudEvents format.

EventBridge simplifies integration with third-party systems using API destinations. Using the new custom content-type headers with input transformers to modify the event structure, you can send structured or binary CloudEvents to integrate with public APIs.

For more serverless learning resources, visit Serverless Land.

Introducing advanced logging controls for AWS Lambda functions

Post Syndicated from David Boyne original https://aws.amazon.com/blogs/compute/introducing-advanced-logging-controls-for-aws-lambda-functions/

This post is written by Nati Goldberg, Senior Solutions Architect and Shridhar Pandey, Senior Product Manager, AWS Lambda

Today, AWS is launching advanced logging controls for AWS Lambda, giving developers and operators greater control over how function logs are captured, processed, and consumed.

This launch introduces three new capabilities to provide a simplified and enhanced default logging experience on Lambda.

First, you can capture Lambda function logs in JSON structured format without having to use your own logging libraries. JSON structured logs make it easier to search, filter, and analyze large volumes of log entries.

Second, you can control the log level granularity of Lambda function logs without making any code changes, enabling more effective debugging and troubleshooting.

Third, you can also set which Amazon CloudWatch log group Lambda sends logs to, making it easier to aggregate and manage logs at scale.

Overview

Being able to identify and filter relevant log messages is essential to troubleshoot and fix critical issues. To help developers and operators monitor and troubleshoot failures, the Lambda service automatically captures and sends logs to CloudWatch Logs.

Previously, Lambda emitted logs in plaintext format, also known as unstructured log format. This unstructured format could make the logs challenging to query or filter. For example, you had to search and correlate logs manually using well-known string identifiers such as “START”, “END”, “REPORT” or the request id of the function invocation. Without a native way to enrich application logs, you needed custom work to extract data from logs for automated analysis or to build analytics dashboards.

Previously, operators could not control the level of log detail generated by functions. They relied on application development teams to make code changes to emit logs with the required granularity level, such as INFO, DEBUG, or ERROR.

Lambda-based applications often comprise microservices, where a single microservice is composed of multiple single-purpose Lambda functions. Before this launch, Lambda sent logs to a default CloudWatch log group created with the Lambda function with no option to select a log group. Now you can aggregate logs from multiple functions in one place so you can uniformly apply security, governance, and retention policies to your logs.

Capturing Lambda logs in JSON structured format

Lambda now natively supports capturing structured logs in JSON format as a series of key-value pairs, making it easier to search and filter logs more easily.

JSON also enables you to add custom tags and contextual information to logs, enabling automated analysis of large volumes of logs to help understand the function performance. The format adheres to the OpenTelemetry (OTel) Logs Data Model, a popular open-source logging standard, enabling you to use open-source tools to monitor functions.

To set the log format in the Lambda console, select the Configuration tab, choose Monitoring and operations tools on the left pane, then change the log format property:

Currently, Lambda natively supports capturing application logs (logs generated by the function code) and system logs (logs generated by the Lambda service) in JSON structured format.

This is for functions that use non-deprecated versions of Python, Node.js, and Java Lambda managed runtimes, when using Lambda recommended logging methods such as using logging library for Python, console object for Node.js, and LambdaLogger or Log4j for Java.

For other managed runtimes, Lambda currently only supports capturing system logs in JSON structured format. However, you can still capture application logs in JSON structured format for these runtimes by manually configuring logging libraries. See configuring advanced logging controls section in the Lambda Developer Guide to learn more. You can also use Powertools for AWS Lambda to capture logs in JSON structured format.

Changing log format from text to JSON can be a breaking change if you parse logs in a telemetry pipeline. AWS recommends testing any existing telemetry pipelines after switching log format to JSON.

Working with JSON structured format for Node.js Lambda functions

You can use JSON structured format with CloudWatch Embedded Metric Format (EMF) to embed custom metrics alongside JSON structured log messages, and CloudWatch automatically extracts the custom metrics for visualization and alarming. However, to use JSON log format along with EMF libraries for Node.js Lambda functions, you must use the latest version of the EMF client library for Node.js or the latest version of Powertools for AWS Lambda (TypeScript) library.

Configuring log level granularity for Lambda function

You can now filter Lambda logs by log level, such as ERROR, DEBUG, or INFO, without code changes. Simplified log level filtering enables you to choose the required logging granularity level for Lambda functions, without sifting through large volumes of logs to debug errors.

You can specify separate log level filters for application logs (which are logs generated by the function code) and system logs (which are logs generated by the Lambda service, such as START and REPORT log messages). Note that log level controls are only available if the log format of the function is set to JSON.

The Lambda console allows setting both the Application log level and System log level properties:

You can define the granularity level of each log event in your function code. The following statement prints out the event input of the function, emitted as a DEBUG log message:

console.debug(event);

Once configured, log events emitted with a lower log level than the one selected are not published to the function’s CloudWatch log stream. For example, setting the function’s log level to INFO results in DEBUG log events being ignored.

This capability allows you to choose the appropriate amount of logs emitted by functions. For example, you can set a higher log level to improve the signal-to-noise ratio in production logs, or set a lower log level to capture detailed log events for testing or troubleshooting purposes.

Customizing Lambda function’s CloudWatch log group

Previously, you could not specify a custom CloudWatch log group for functions, so you could not stream logs from multiple functions into a shared log group. Also, to set custom retention policy for multiple log groups, you had to create each log group separately using a pre-defined name (for example, /aws/lambda/<function name>).

Now you can select a custom CloudWatch log group to aggregate logs from multiple functions automatically within an application in one place. You can apply security, governance, and retention policies at the application level instead of individually to every function.

To distinguish between logs from different functions in a shared log group, each log stream contains the Lambda function name and version.

You can share the same log group between multiple functions to aggregate logs together. The function’s IAM policy must include the logs:CreateLogStream and logs:PutLogEvents permissions for Lambda to create logs in the specified log group. The Lambda service can optionally create these permissions, when you configure functions in the Lambda console.

You can set the custom log group in the Lambda console by entering the destination log group name. If the entered log group does not exist, Lambda creates it automatically.

Advanced logging controls for Lambda can be configured using Lambda APIAWS Management ConsoleAWS Command Line Interface (CLI), and infrastructure as code (IaC) tools such as AWS Serverless Application Model (AWS SAM) and AWS CloudFormation.

Example of Lambda advanced logging controls

This section demonstrates how to use the new advanced logging controls for Lambda using AWS SAM to build and deploy the resources in your AWS account.

Overview

The following diagram shows Lambda functions processing newly created objects inside an Amazon S3 bucket, where both functions emit logs into the same CloudWatch log group:

The architecture includes the following steps:

  1. A new object is created inside an S3 bucket.
  2. S3 publishes an event using S3 Event Notifications to Amazon EventBridge.
  3. EventBridge triggers two Lambda functions asynchronously.
  4. Each function processes the object to extract labels and text, using Amazon Rekognition and Amazon Textract.
  5. Both functions then emit logs into the same CloudWatch log group.

This uses AWS SAM to define the Lambda functions and configure the required logging controls. The IAM policy allows the function to create a log stream and emit logs to the selected log group:

DetectLabelsFunction:
    Type: AWS::Serverless::Function 
    Properties:
      CodeUri: detect-labels/
      Handler: app.lambdaHandler
      Runtime: nodejs18.x
      Policies:
        ...
        - Version: 2012-10-17
          Statement:
            - Sid: CloudWatchLogGroup
              Action: 
                - logs:CreateLogStream
                - logs:PutLogEvents
              Resource: !GetAtt CloudWatchLogGroup.Arn
              Effect: Allow
      LoggingConfig:
        LogFormat: JSON 
        ApplicationLogLevel: DEBUG 
        SystemLogLevel: INFO 
        LogGroup: !Ref CloudWatchLogGroup 

Deploying the example

To deploy the example:

  1. Clone the GitHub repository and explore the application.
    git clone https://github.com/aws-samples/advanced-logging-controls-lambda/
    
    cd advanced-logging-controls-lambda
  2. Use AWS SAM to build and deploy the resources to your AWS account. This compiles and builds the application using npm, and then populate the template required to deploy the resources:
    sam build
  3. Deploy the solution to your AWS account with a guided deployment, using AWS SAM CLI interactive flow:
    sam deploy --guided
  4. Enter the following values:
    • Stack Name: advanced-logging-controls-lambda
    • Region: your preferred Region (for example, us-east-1)
    • Parameter UploadsBucketName: enter a unique bucket name.
    • Accept the rest of the initial defaults.
  5. To test the application, use the AWS CLI to copy the sample image into the S3 bucket you created.
    aws s3 cp samples/skateboard.jpg s3://example-s3-images-bucket

Explore CloudWatch Logs to view the logs emitted into the log group created, AggregatedLabelsLogGroup:

The DetectLabels Lambda function emits DEBUG log events in JSON format to the log stream. Log events with the same log level from the ExtractText Lambda function are omitted. This is a result of the different application log level settings for each function (DEBUG and INFO).

You can also use CloudWatch Logs Insights to search, filter, and analyze the logs in JSON format using this sample query:

You can see the results:

Conclusion

Advanced logging controls for Lambda give you greater control over logging. Use advanced logging controls to control your Lambda function’s log level and format, allowing you to search, query, and filter logs to troubleshoot issues more effectively.

You can also choose the CloudWatch log group where Lambda sends your logs. This enables you to aggregate logs from multiple functions into a single log group, apply retention, security, governance policies, and easily manage logs at scale.

To get started, specify the required settings in the Logging Configuration for any new or existing Lambda functions.

Advanced logging controls for Lambda are available in all AWS Regions where Lambda is available at no additional cost. Learn more about AWS Lambda Advanced Logging Controls.

For more serverless learning resources, visit Serverless Land.

Introducing logging support for Amazon EventBridge Pipes

Post Syndicated from David Boyne original https://aws.amazon.com/blogs/compute/introducing-logging-support-for-amazon-eventbridge-pipes/

Today, AWS is announcing support for logging with EventBridge Pipes. Amazon EventBridge Pipes is a point to point integration solution that connects event producers and consumers with optional filter, transform, and enrichment steps. EventBridge Pipes reduces the amount of integration code builders must write and maintain when building event-driven applications. Popular integrations include connecting Amazon Kinesis streams together with filtering, Amazon DynamoDB direct integrations with Amazon EventBridge, and Amazon SQS integrations with AWS Step Functions.

Amazon EventBridge Pipes

EventBridge Pipes logging introduces insights into different stages of the pipe execution. It expands on the Amazon CloudWatch metrics support, and provides you with additional methods for troubleshooting and debugging.

You can now gain insights into various successful and failure scenarios within the pipe execution steps. When event transformation or enrichment succeeds or fails, you can use logs to delve deeper and initiate troubleshooting for any issues with their configured pipes.

EventBridge Pipes execution steps

Understanding pipes execution steps can assist you in selecting the appropriate log level, which determines how much information is logged.

A pipe execution is an event or batch of events received by a pipe that travel from the source to the target. As events travel through a pipe, they can be filtered, transformed, or enriched using AWS Step Functions, AWS Lambda, Amazon API Gateway, and EventBridge API Destinations.

A pipe execution consists of two main stages: the enrichment and target. Both of these stages encompass transformation and invocation steps.

You can use input transformers, enabling modification to the payload of the event before the events undergo enrichment or get dispatched to the downstream target. This gives you fine-grained control over the manipulation of event data during the execution of their configured pipes.

When the pipe execution starts, the execution enters the enrichment stage. If you don’t configure an enrichment stage, the execution proceeds to the target stage.

At the pipe execution, transformation, enrichment, and target phases EventBridge can log information to help debug or troubleshoot. Pipes logs can include payloads, errors, transformations, AWS requests, and AWS responses.

To learn more about pipe executions, read this documentation.

Configuring log levels with EventBridge Pipes

When logging is enabled for your pipe, EventBridge produces a log entry for every execution step and sends these logs to the specified log destinations.

EventBridge Pipes supports three log destinations: Amazon CloudWatch Logs, Amazon Kinesis Data Firehose stream, and Amazon S3. The records sent can be customized by configuring the log level of the pipe (OFF, ERROR, INFO, TRACE).

  • OFF – EventBridge does not send any records.
  • ERROR – EventBridge sends records related to errors generated during the pipe execution. Examples include Execution Failed, Execution Timeout and Enrichment Failures.
  • INFO – EventBridge sends records related to errors and selected information performed during pipe execution. Examples include Execution Started, Execution Succeeded and Enrichment Stage Succeeded.
  • TRACE – EventBridge sends any record generated during any step in the pipe execution.

The ERROR log level proves beneficial in gaining insights into the reasons behind a failed pipe execution. Pipe executions may encounter failure due to various reasons, such as timeouts, enrichment failure, transformation failure, or target invocation failure. Enabling ERROR logging allows you to learn more about the specific cause of the pipe error, facilitating the resolution of the issue.

The INFO log level supplements ERROR information with additional details. It not only informs about errors but also provides insights into the commencement of the pipe execution, entry into the enrichment phase, progression into the transformation phase, and the initiation and successful completion of the target stage.

For a more in-depth analysis, you can use the TRACE log level to obtain comprehensive insights into a pipe execution. This encompasses all supported pipe logs, offering a detailed view beyond the INFO and ERROR logs. The TRACE log level reveals crucial information, such as skipped pipe execution stages and the initiation of transformation and enrichment processes.

For more details on the log levels and what logs are sent, you can read the documentation.

Including execution data with EventBridge Pipes logging

To help with further debugging, you can choose to include execution data within the pipe logs. This data comprises event payloads, AWS requests, and responses sent to and received from configured enrichment and target components.

You can also use the execution data to gain further insights into the payloads, requests, and responses sent to AWS services during the execution of the pipe.

Incorporating execution data can enhance understanding of the pipe execution, providing deeper insights and aiding in the debugging of any encountered issues.

Execution data within a log contains three parts:

  • payload: The content of the event itself. The payload of the event may contain sensitive information and EventBridge makes no attempt to redact the contents. Including execution data is optional and can be turned off.
  • awsRequest: The request sent to the enrichment or target in serialized JSON format. For API destinations this includes the HTTP request sent to that endpoint.
  • awsResponse: The response returned by the enrichment or target in JSON format. For API Destinations, this is the response returned from the configured endpoint.

The payload of the event is populated when the event itself can be updated. These stages include the initial pipe execution, enrichment phase, and target phase. The awsRequest and awsResponse are both generated at the final steps of enrichment and targeting.

For more information on log levels and execution data, visit this documentation.

Getting started with EventBridge Pipes logs

This example creates a pipe with logging enabled and includes execution data. The pipe connects two Amazon SQS queues using an input transformer on the target with no enrichment step. The input transformer customizes the payload of the event before reaching the target.

  1. Creating the source and target queues
# Create a queue for the source
aws sqs create-queue --queue-name pipe-source

# Create a queue for the target
aws sqs create-queue --queue-name pipe-target

2. Navigate to EventBridge Pipes and choose Create pipe.

3. Select SQS as the Source and select pipe-source as the SQS Queue.

4. Skip the filter and enrichment phase and add a new Target. Select SQS as the Target service and pipe-target as the Queue.

5. Open Target Input Transformer section and enter the transformer code into the Transformer field.

{

  "body": "Favorite food is <$.body>"

}

6. Choose Pipe settings to configure the log group for the new pipe.

7. Verify that CloudWatch Logs is set as the log destination, and select Trace as the log level. Check the “Include execution data” check box. This logs all traces to the new CloudWatch log group and includes the SQS messages that are sent on the pipe.

8. Choose Create Pipe.

9. Send an SQS message to the source queue.

# Get the Queue URL

aws sqs get-queue-url --queue-name pipe-source

# Send a message to the queue using the URL

aws sqs send-message --queue-url {QUEUE_URL} --message-body "pizza"

10. All trace logs are shown in the monitoring tab, use CloudWatch Logs section for more information.

Conclusion

EventBridge Pipes enables point-to-point integration between event producers and consumers. With logging support for EventBridge Pipes, you can now gain insights into various stages of the pipe execution. Pipe log destinations can be configured to CloudWatch Logs, Kinesis Data Firehose, and Amazon S3.

EventBridge Pipes supports three log levels. The ERROR log level configures EventBridge to send records related to errors to the log destination. The INFO log level configures EventBridge to send records related to errors and selected information during the pipe execution. The TRACE log level sends any record generated to the log destination, useful for debugging and gaining further insights.

You can include execution data in the logs, which includes the event itself, and AWS requests and responses made to AWS services configured in the pipe. This can help you gain further insights into the pipe execution. Read the documentation to learn more about EventBridge Pipes Logs.

For more serverless learning resources, visit Serverless Land.

Implementing an event-driven serverless story generation application with ChatGPT and DALL-E

Post Syndicated from David Boyne original https://aws.amazon.com/blogs/compute/implementing-an-event-driven-serverless-story-generation-application-with-chatgpt-and-dall-e/

This post demonstrates how to integrate AWS serverless services with artificial intelligence (AI) technologies, ChatGPT, and DALL-E. This full stack event-driven application showcases a method of generating unique bedtime stories for children by using predetermined characters and scenes as a prompt for ChatGPT.

Every night at bedtime, the serverless scheduler triggers the application, initiating an event-driven workflow to create and store new unique AI-generated stories with AI-generated images and supporting audio.

These datasets are used to showcase the story on a custom website built with Next.js hosted with AWS App Runner. After the story is created, a notification is sent to the user containing a URL to view and read the story to the children.

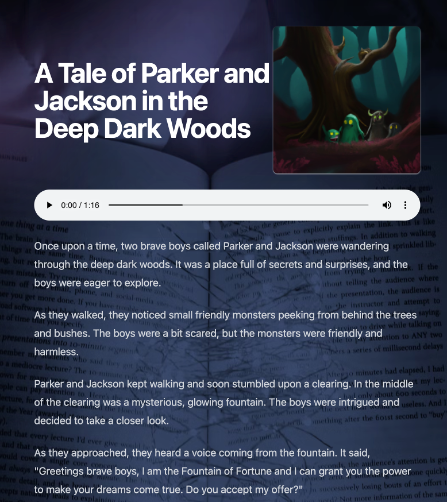
Example notification of a story hosted with Next.js and App Runner

Example notification of a story hosted with Next.js and App Runner

By integrating AWS services with AI technologies, you can now create new and innovative ideas that were previously unimaginable.

The application mentioned in this blog post demonstrates examples of point-to-point messaging with Amazon EventBridge pipes, publish/subscribe patterns with Amazon EventBridge and reacting to change data capture events with DynamoDB Streams.

Understanding the architecture

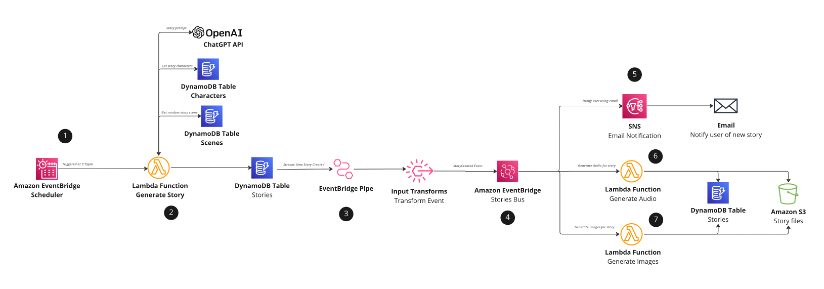
The following image shows the serverless architecture used to generate stories:

Architecture diagram for Serverless bed time story generation with ChatGPT and DALL-E

Architecture diagram for Serverless bed time story generation with ChatGPT and DALL-E

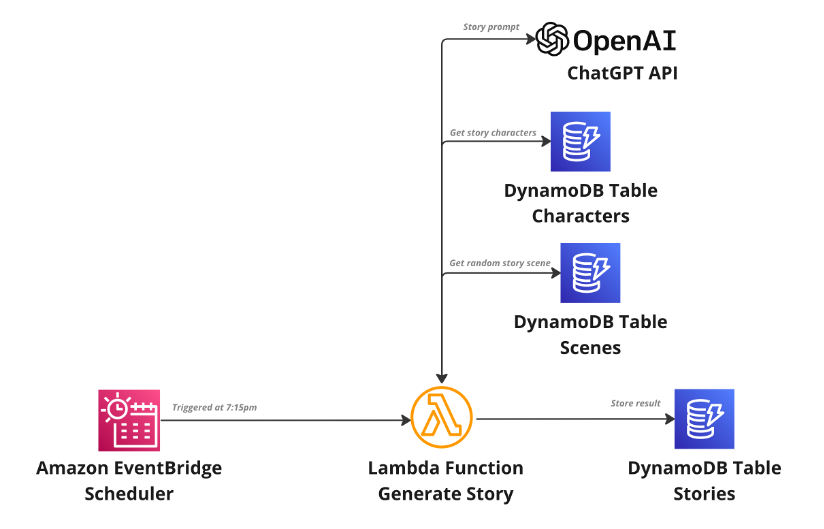
A new children’s story is generated every day at configured time using Amazon EventBridge Scheduler (Step 1). EventBridge Scheduler is a service capable of scaling millions of schedules with over 200 targets and over 6000 API calls. This example application uses EventBridge scheduler to trigger an AWS Lambda function every night at the same time (7:15pm). The Lambda function is triggered to start the generation of the story.

EventBridge scheduler triggers Lambda function every day at 7:15pm (bed time)

EventBridge scheduler triggers Lambda function every day at 7:15pm (bed time)

The “Scenes” and “Characters” Amazon DynamoDB tables contain the characters involved in the story and a scene that is randomly selected during its creation. As a result, ChatGPT receives a unique prompt each time. An example of the prompt may look like this:

“`
Write a title and a rhyming story on 2 main characters called Parker and Jackson. The story needs to be set within the scene haunted woods and be at least 200 words long

“`

After the story is created, it is then saved in the “Stories” DynamoDB table (Step 2).

Scheduler triggering Lambda function to generate the story and store story into DynamoDB

Scheduler triggering Lambda function to generate the story and store story into DynamoDB

Once the story is created this initiates a change data capture event using DynamoDB Streams (Step 3). This event flows through point-to-point messaging with EventBridge pipes and directly into EventBridge. Input transforms are then used to convert the DynamoDB Stream event into a custom EventBridge event, which downstream consumers can comprehend. Adopting this pattern is beneficial as it allows us to separate contracts from the DynamoDB event schema and not having downstream consumers conform to this schema structure, this mapping allows us to remain decoupled from implementation details.

EventBridge Pipes connecting DynamoDB streams directly into EventBridge.

EventBridge Pipes connecting DynamoDB streams directly into EventBridge.

Upon triggering the StoryCreated event in EventBridge, three targets are triggered to carry out several processes (Step 4). Firstly, AI Images are processed, followed by the creation of audio for the story. Finally, the end user is notified of the completed story through Amazon SNS and email subscriptions. This fan-out pattern enables these tasks to be run asynchronously and in parallel, allowing for faster processing times.

EventBridge pub/sub pattern used to start async processing of notifications, audio, and images.

EventBridge pub/sub pattern used to start async processing of notifications, audio, and images.

An SNS topic is triggered by the `StoryCreated` event to send an email to the end user using email subscriptions (Step 6). The email consists of a URL with the id of the story that has been created. Clicking on the URL takes the user to the frontend application that is hosted with App Runner.

Using SNS to notify the user of a new story

Using SNS to notify the user of a new story

Example email sent to the user

Example email sent to the user

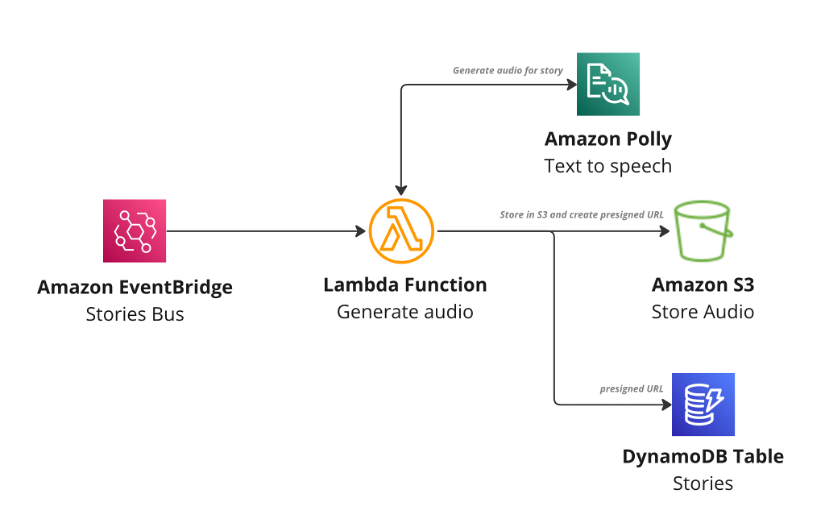
Amazon Polly is used to generate the audio files for the story (Step 6). Upon triggering the `StoryCreated` event, a Lambda function is triggered, and the story description is used and given to Amazon Polly. Amazon Polly then creates an audio file of the story, which is stored in Amazon S3. A presigned URL is generated and saved in DynamoDB against the created story. This allows the frontend application and browser to retrieve the audio file when the user views the page. The presigned URL has a validity of two days, after which it can no longer be accessed or listened to.

Lambda function to generate audio using Amazon Polly, store in S3 and update story with presigned URL

Lambda function to generate audio using Amazon Polly, store in S3 and update story with presigned URL

The `StoryCreated` event also triggers another Lambda function, which uses the OpenAI API to generate an AI image using DALL-E based on the generated story (Step 7). Once the image is generated, the image is downloaded and stored in Amazon S3. Similar to the audio file, the system generates a presigned URL for the image and saves it in DynamoDB against the story. The presigned URL is only valid for two days, after which it becomes inaccessible for download or viewing.

Lambda function to generate images, store in S3 and update story with presigned URL.

Lambda function to generate images, store in S3 and update story with presigned URL.

In the event of a failure in audio or image generation, the frontend application still loads the story, but does not display the missing image or audio at that moment. This ensures that the frontend can continue working and provide value. If you wanted more control and only trigger the user’s notification event once all parallel tasks are complete the aggregator messaging pattern can be considered.

Hosting the frontend Next.js application with AWS App Runner

Next.js is used by the frontend application to render server-side rendered (SSR) pages that can access the stories from the DynamoDB table, which are then hosted with AWS App Runner after being containerized.

Next.js application hosted with App Runner, with permissions into DynamoDB table.

Next.js application hosted with App Runner, with permissions into DynamoDB table.

AWS App Runner enables you to deploy containerized web applications and APIs securely, without needing any prior knowledge of containers or infrastructure. With App Runner, developers can concentrate on their application, while the service handles container startup, running, scaling, and load balancing. After deployment, App Runner provides a secure URL for clients to begin making HTTP requests against.

With App Runner, you have two primary options for deploying your container: source code connections or source images. Using source code connections grants App Runner permission to pull the image file directly from your source code, and with Automatic deployment configured, it can redeploy the application when changes are made. Alternatively, source images provide App Runner with the image’s location in an image registry, and this image is deployed by App Runner.

In this example application, CDK deploys the application using the DockerImageAsset construct with the App Runner construct. Once deployed, App Runner builds and uploads the frontend image to Amazon Elastic Container Registry (ECR) and deploys it. Downstream consumers can access the application using the secure URL provided by App Runner. In this example, the URL is used when the SNS notification is sent to the user when the story is ready to be viewed.

Giving the frontend container permission to DynamoDB table

To grant the Next.js application permission to obtain stories from the Stories DynamoDB table, App Runner instance roles are configured. These roles are optional and can provide the necessary permissions for the container to access AWS services required by the compute service.

If you want to learn more about AWS App Runner, you can explore the free workshop.

Design choices and assumptions

The DynamoDB Time to Live (TTL) feature is ideal for the short-lived nature of daily generated stories. DynamoDB handle the deletion of stories after two days by setting the TTL attribute on each story. Once a story is deleted, it becomes inaccessible through the generated story URLs.

Using Amazon S3 presigned URLs is a method to grant temporary access to a file in S3. This application creates presigned URLs for the audio file and generated images that last for 2 days, after which the URLs for the S3 items become invalid.

Input transforms are used between DynamoDB streams and EventBridge events to decouple the schemas and events consumed by downstream targets. Consuming the events as they are is known as the “conformist” pattern, and couples us to implementation details of DynamoDB streams with downstream EventBridge consumers. This allows the application to remain decoupled from implementation details and remain flexible.

Conclusion

The adoption of artificial intelligence (AI) technology has significantly increased in various industries. ChatGPT, a large language model that can understand and generate human-like responses in natural language, and DALL-E, an image generation system that can create realistic images based on textual descriptions, are examples of such technology. These systems have demonstrated the potential for AI to provide innovative solutions and transform the way we interact with technology.

This blog post explores ways in which you can utilize AWS serverless services with ChatGTP and DALL-E to create a story generation application fronted by a Next.js application hosted with App Runner. EventBridge Scheduler is used to trigger the story creation process then react to change data capture events with DynamoDB streams and EventBridge Pipes, and use Amazon EventBridge to fan out compute tasks to process notifications, images, and audio files.

You can find the documentation and the source code for this application in GitHub.

For more serverless learning resources, visit Serverless Land.

Implementing architectural patterns with Amazon EventBridge Pipes

Post Syndicated from David Boyne original https://aws.amazon.com/blogs/compute/implementing-architectural-patterns-with-amazon-eventbridge-pipes/

This post is written by Dominik Richter (Solutions Architect)

Architectural patterns help you solve recurring challenges in software design. They are blueprints that have been used and tested many times. When you design distributed applications, enterprise integration patterns (EIP) help you integrate distributed components. For example, they describe how to integrate third-party services into your existing applications. But patterns are technology agnostic. They do not provide any guidance on how to implement them.

This post shows you how to use Amazon EventBridge Pipes to implement four common enterprise integration patterns (EIP) on AWS. This helps you to simplify your architectures. Pipes is a feature of Amazon EventBridge to connect your AWS resources. Using Pipes can reduce the complexity of your integrations. It can also reduce the amount of code you have to write and maintain.

Content filter pattern

The content filter pattern removes unwanted content from a message before forwarding it to a downstream system. Use cases for this pattern include reducing storage costs by removing unnecessary data or removing personally identifiable information (PII) for compliance purposes.

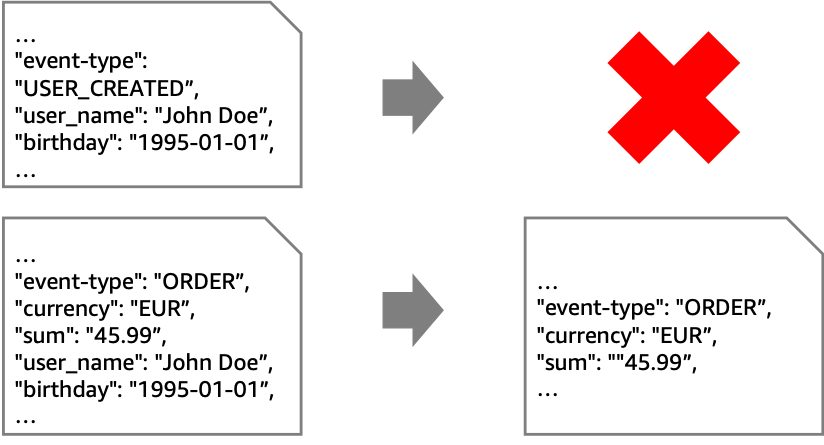
In the following example, the goal is to retain only non-PII data from “ORDER”-events. To achieve this, you must remove all events that aren’t “ORDER” events. In addition, you must remove any field in the “ORDER” events that contain PII.

While you can use this pattern with various sources and targets, the following architecture shows this pattern with Amazon Kinesis. EventBridge Pipes filtering discards unwanted events. EventBridge Pipes input transformers remove PII data from events that are forwarded to the second stream with longer retention.

Instead of using Pipes, you could connect the streams using an AWS Lambda function. This requires you to write and maintain code to read from and write to Kinesis. However, Pipes may be more cost effective than using a Lambda function.

Some situations require an enrichment function. For example, if your goal is to mask an attribute without removing it entirely. For example, you could replace the attribute “birthday” with an “age_group”-attribute.

In this case, if you use Pipes for integration, the Lambda function contains only your business logic. On the other hand, if you use Lambda for both integration and business logic, you do not pay for Pipes. At the same time, you add complexity to your Lambda function, which now contains integration code. This can increase its execution time and cost. Therefore, your priorities determine the best option and you should compare both approaches to make a decision.

To implement Pipes using the AWS Cloud Development Kit (AWS CDK), use the following source code. The full source code for all of the patterns that are described in this blog post can be found in the AWS samples GitHub repo.

const filterPipe = new pipes.CfnPipe(this, 'FilterPipe', {
  roleArn: pipeRole.roleArn,
  source: sourceStream.streamArn,
  target: targetStream.streamArn,
  sourceParameters: { filterCriteria: { filters: [{ pattern: '{"data" : {"event_type" : ["ORDER"] }}' }] }, kinesisStreamParameters: { startingPosition: 'LATEST' } },
  targetParameters: { inputTemplate: '{"event_type": <$.data.event_type>, "currency": <$.data.currency>, "sum": <$.data.sum>}', kinesisStreamParameters: { partitionKey: 'event_type' } },
});

To allow access to source and target, you must assign the correct permissions:

const pipeRole = new iam.Role(this, 'FilterPipeRole', { assumedBy: new iam.ServicePrincipal('pipes.amazonaws.com') });

sourceStream.grantRead(pipeRole);
targetStream.grantWrite(pipeRole);

Message translator pattern

In an event-driven architecture, event producers and consumers are independent of each other. Therefore, they may exchange events of different formats. To enable communication, the events must be translated. This is known as the message translator pattern. For example, an event may contain an address, but the consumer expects coordinates.

If a computation is required to translate messages, use the enrichment step. The following architecture diagram shows how to accomplish this enrichment via API destinations. In the example, you can call an existing geocoding service to resolve addresses to coordinates.

There may be cases where the translation is purely syntactical. For example, a field may have a different name or structure.

You can achieve these translations without enrichment by using input transformers.

Here is the source code for the pipe, including the role with the correct permissions:

const pipeRole = new iam.Role(this, 'MessageTranslatorRole', { assumedBy: new iam.ServicePrincipal('pipes.amazonaws.com'), inlinePolicies: { invokeApiDestinationPolicy } });

sourceQueue.grantConsumeMessages(pipeRole);
targetStepFunctionsWorkflow.grantStartExecution(pipeRole);

const messageTranslatorPipe = new pipes.CfnPipe(this, 'MessageTranslatorPipe', {
  roleArn: pipeRole.roleArn,
  source: sourceQueue.queueArn,
  target: targetStepFunctionsWorkflow.stateMachineArn,
  enrichment: enrichmentDestination.apiDestinationArn,
  sourceParameters: { sqsQueueParameters: { batchSize: 1 } },
});

Normalizer pattern

The normalizer pattern is similar to the message translator but there are different source components with different formats for events. The normalizer pattern routes each event type through its specific message translator so that downstream systems process messages with a consistent structure.

The example shows a system where different source systems store the name property differently. To process the messages differently based on their source, use an AWS Step Functions workflow. You can separate by event type and then have individual paths perform the unifying process. This diagram visualizes that you can call a Lambda function if needed. However, in basic cases like the preceding “name” example, you can modify the events using Amazon States Language (ASL).

In the example, you unify the events using Step Functions before putting them on your event bus. As is often the case with architectural choices, there are alternatives. Another approach is to introduce separate queues for each source system, connected by its own pipe containing only its unification actions.

This is the source code for the normalizer pattern using a Step Functions workflow as enrichment:

const pipeRole = new iam.Role(this, 'NormalizerRole', { assumedBy: new iam.ServicePrincipal('pipes.amazonaws.com') });

sourceQueue.grantConsumeMessages(pipeRole);
enrichmentWorkflow.grantStartSyncExecution(pipeRole);
normalizerTargetBus.grantPutEventsTo(pipeRole);

const normalizerPipe = new pipes.CfnPipe(this, 'NormalizerPipe', {
  roleArn: pipeRole.roleArn,
  source: sourceQueue.queueArn,
  target: normalizerTargetBus.eventBusArn,
  enrichment: enrichmentWorkflow.stateMachineArn,
  sourceParameters: { sqsQueueParameters: { batchSize: 1 } },
});

Claim check pattern

To reduce the size of the events in your event-driven application, you can temporarily remove attributes. This approach is known as the claim check pattern. You split a message into a reference (“claim check”) and the associated payload. Then, you store the payload in external storage and add only the claim check to events. When you process events, you retrieve relevant parts of the payload using the claim check. For example, you can retrieve a user’s name and birthday based on their userID.

The claim check pattern has two parts. First, when an event is received, you split it and store the payload elsewhere. Second, when the event is processed, you retrieve the relevant information. You can implement both aspects with a pipe.

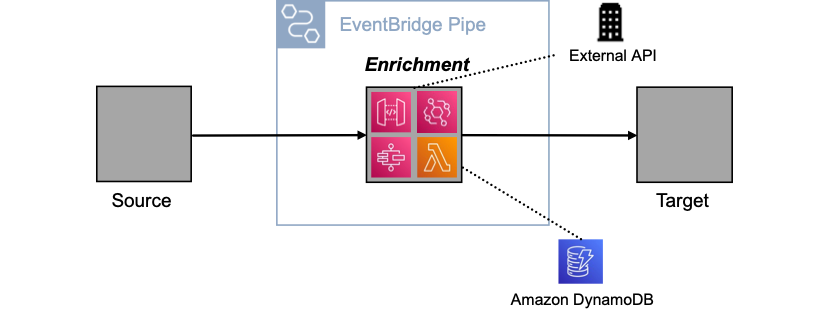
In the first pipe, you use the enrichment to split the event, in the second to retrieve the payload. Below are several enrichment options, such as using an external API via API Destinations, or using Amazon DynamoDB via Lambda. Other enrichment options are Amazon API Gateway and Step Functions.

Using a pipe to split and retrieve messages has three advantages. First, you keep events concise as they move through the system. Second, you ensure that the event contains all relevant information when it is processed. Third, you encapsulate the complexity of splitting and retrieving within the pipe.

The following code implements a pipe for the claim check pattern using the CDK:

const pipeRole = new iam.Role(this, 'ClaimCheckRole', { assumedBy: new iam.ServicePrincipal('pipes.amazonaws.com') });

claimCheckLambda.grantInvoke(pipeRole);
sourceQueue.grantConsumeMessages(pipeRole);
targetWorkflow.grantStartExecution(pipeRole);

const claimCheckPipe = new pipes.CfnPipe(this, 'ClaimCheckPipe', {
  roleArn: pipeRole.roleArn,
  source: sourceQueue.queueArn,
  target: targetWorkflow.stateMachineArn,
  enrichment: claimCheckLambda.functionArn,
  sourceParameters: { sqsQueueParameters: { batchSize: 1 } },
  targetParameters: { stepFunctionStateMachineParameters: { invocationType: 'FIRE_AND_FORGET' } },
});

Conclusion

This blog post shows how you can implement four enterprise integration patterns with Amazon EventBridge Pipes. In many cases, this reduces the amount of code you have to write and maintain. It can also simplify your architectures and, in some scenarios, reduce costs.

You can find the source code for all the patterns on the AWS samples GitHub repo.

For more serverless learning resources, visit Serverless Land. To find more patterns, go directly to the Serverless Patterns Collection.

Visualizing the impact of AWS Lambda code updates

Post Syndicated from David Boyne original https://aws.amazon.com/blogs/compute/visualizing-the-impact-of-aws-lambda-code-updates/

This post is written by Brigit Brown (Solutions Architect), and Helen Ashton (Observability Specialist Solutions Architect).

When using AWS Lambda, changes made to code can impact performance, functionality, and cost. It can be challenging to gain insight into how these code changes impact performance.

This blog post demonstrates how to capture, record, and visualize Lambda code deployment data with other data in an Amazon CloudWatch dashboard. This solution enables serverless developers to gain insight into the impact of code changes to Lambda functions and make data-driven decisions.

There are three steps to this solution:

  1. Capture: Lambda function code updates using Amazon EventBridge.
  2. Record: Lambda function code updates by creating an Amazon CloudWatch metric.
  3. Visualize: The relationship between Lambda function code updates and application KPIs by creating a CloudWatch dashboard.

Overview

EventBridge and CloudWatch are used to monitor and visualize the impact of code changes to Lambda functions on key application metrics.

Architecture diagram for capturing, recording, and visualizing Lambda function updates, showing the AWS Lambda function event being detected by Amazon EventBridge, and finally being sent to Amazon CloudWatch

Step 1: Capturing

AWS CloudTrail records all management events for AWS services. These are the operations performed on resources in your AWS account and include Lambda function code updates.

An EventBridge rule can listen for Lambda functions code updates and send these events to other AWS services, in this case to CloudWatch.

You can create EventBridge rules using an example event syntax as reference. To get the example event, update the code of a Lambda function and search in CloudTrail for all events with Event source of lambda.amazonaws.com, and an Event name starting with UpdateFunctionCode. UpdateFunctionCode is one of many events captured for Lambda functions. For example:

{
  "eventVersion": "1.08",
  "userIdentity": {
    "type": "AssumedRole",
    "principalId": "x",
    "arn": "arn:aws:sts::xxxxxxxxxxxx:assumed-role/Admin/x",
    "accountId": "xxxxxxxxxxxx",
    "accessKeyId": "xxxxxxxxxxxxxxxxx",
    "sessionContext": {
      "sessionIssuer": {
        "type": "Role",
        "principalId": "x",
        "arn": "arn:aws:iam::xxxxxxxxxxxx:role/Admin",
        "accountId": "xxxxxxxxxxxx",
        "userName": "Admin"
      },
      "webIdFederationData": {},
      "attributes": {
        "creationDate": "2022-09-22T16:37:04Z",
        "mfaAuthenticated": "false"
      }
    }
  },
  "eventTime": "2022-09-22T16:42:07Z",
  "eventSource": "lambda.amazonaws.com",
  "eventName": "UpdateFunctionCode20150331v2",
  "awsRegion": "us-east-1",
  "sourceIPAddress": "AWS Internal",
  "userAgent": "AWS Internal",
  "requestParameters": {
    "fullyQualifiedArn": {
      "arnPrefix": {
        "partition": "aws",
        "region": "us-east-1",
        "account": "xxxxxxxxxxxx"
      },
      "relativeId": {
        "functionName": "example-function"
      },
      "functionQualifier": {}
    },
    "functionName": "arn:aws:lambda:us-east-1:xxxxxxxxxxxx:function:example-function",
    "publish": false,
    "dryRun": false
  },
  "responseElements": {
    "functionName": "example-function",
    "functionArn": "arn:aws:lambda:us-east-1:xxxxxxxxxxxx:function:example-function",
    "runtime": "python3.8",
    "role": "arn:aws:iam::xxxxxxxxxxxx:role/role-name",
    "handler": "lambda_function.lambda_handler",
    "codeSize": 1011,
    "description": "",
    "timeout": 123,
    "memorySize": 128,
    "lastModified": "2022-09-22T16:42:07.000+0000",
    "codeSha256": "x",
    "version": "$LATEST",
    "environment": {},
    "tracingConfig": {
      "mode": "PassThrough"
    },
    "revisionId": "x",
    "state": "Active",
    "lastUpdateStatus": "InProgress",
    "lastUpdateStatusReason": "The function is being created.",
    "lastUpdateStatusReasonCode": "Creating",
    "packageType": "Zip",
    "architectures": ["x86_64"],
    "ephemeralStorage": {
      "size": 512
    }
  },
  "requestID": "f566f75f-a7a8-4e87-a177-2db001d40382",
  "eventID": "4f90175d-3063-49b4-a467-04150b418457",
  "readOnly": false,
  "eventType": "AwsApiCall",
  "managementEvent": true,
  "recipientAccountId": "113420664689",
  "eventCategory": "Management",
  "sessionCredentialFromConsole": "true"
}

The key fields are eventSource, eventName, functionName, and eventType. This is the event syntax containing only the key fields.

{
    "eventSource": "lambda.amazonaws.com",
    "eventName": "UpdateFunctionCode20150331v2",
    "responseElements": {
        "functionName": "example-function"
        }
    "eventType": "AwsApiCall",
}

Use this example event as a reference to write the EventBridge rule pattern.

{
  "source": ["aws.lambda"],
  "detail-type": ["AWS API Call via CloudTrail"],
  "detail": {
    "eventSource": ["lambda.amazonaws.com"],
    "eventName": [{
      "prefix": "UpdateFunctionCode"
    }],
    "eventType": ["AwsApiCall"]
  }
}

In this EventBridge rule, the detail section contains properties to match the original UpdateFunctionCode event pattern. The values to match are in square brackets using EventBridge syntax.

The eventName changes with each UpdateFunctionCode event, including date and version information within the value (i.e. UpdateFunctionCode20150331v2) and so a prefix matching filter is used to match the start of the eventName.

The source and the detail-type of the event are two additional fields included by EventBridge. For all Lambda CloudTrail calls, the detail-type is [“AWS API Call via CloudTrail”] and the source is “aws.lambda“.

Next, send an event to CloudWatch. Each EventBridge rule can send events to multiple targets, including Amazon SNS and CloudWatch log groups. Choose a target of CloudWatch log groups, with the log group specified as /aws/events/lambda/updates. EventBridge creates this log group in CloudWatch.

Finally, test the EventBridge rule.

  1. To trigger an event, change the code for any Lambda function and deploy.

    AWS Console

  2. To view the event, navigate to the CloudWatch console > Logs > Log groups.

    Log group


  3. Choose the log group (/aws/events/lambda/updates).

    Selected log group

  4. Select the most recent log stream.

    Recent log stream

  5. If the EventBridge rule is successful, the Lambda code update event is visible. To see the JSON from the event, expand the event with the arrows to the left and see the detail field.

    Expanded view of event

Step 2: Recording

To display the Lambda function update data alongside other CloudWatch metrics, convert the log event into a metric using metric filters. A metric filter is created on a log group. If a log event matches a metric filter, a metric data point is created.

A metric filter uses a filter pattern to match on specific fields in the JSON event. In this case, the filter pattern matches on the eventName starting with UpdateFunctionCode (note the star as a wildcard).

{ $.detail.eventName=UpdateFunctionCode* }

Create a metric filter with the following:

  • Metric namespace: LambdaEvents
  • Metric name: UpdateFunction
  • Metric value: 1
  • Dimensions: DimensionName: FunctionName; Dimension Value: $.detail.responseElements.functionName

Dimensions allow metadata to be added to metrics. Setting a dimension with the JSON path to $.detail.responseElements.functionName allows the FunctionName value to come from the data in the log event. This makes this a generic metric filter for any Lambda function.

The event pattern of a metric filter can be tested on real data in the Test pattern section. Choose the log stream to test the filter on by using the Select log data drop down and selecting Test pattern. This shows a table with the matched events and the field value.

The CloudWatch console provides a view of the metrics for Lambda functions. To see the metric data, update the code for a Lambda function and navigate to the CloudWatch console. Choose Metrics > All metrics from the left menu, the Custom namespace of LambdaEvents, and dimension of FunctionName (as set in the preceding metric filter). To see the data on the chart, check the box beside the metric of interest. The metric can be added to a CloudWatch dashboard under the Actions menu.

Metric filters only create metrics when a new log event is ingested. You must wait for a new log event to see the metrics.

Step 3: Visualizing

A CloudWatch dashboard enables the visualization of metric data and creation of customized views. The dashboard can contain multiple widgets with data from metrics, logs, and alarms.

The following dashboard shows an example of visualizing Lambda code updates alongside other performance data. There is no single visualization that is right for everyone. The data added to the dashboard depends on the questions and actions the business wants to take. This data can be varied and include performance data, KPIs, and user experience.

The dashboard displays data on Lambda function code updates and Lambda performance (duration). A metric line widget shows a time chart of Lambda function duration with the update Lambda code metric data. Duration is a performance metric that is provided for all Lambda functions. Read more in Working with Lambda Function metrics.

A CloudWatch dashboard showing visualization of Lambda update code events alongside Lambda function durations for two functions. The duration is shown as an average value for the last hour and a time chart.

This screenshot shows the Lambda function duration for two different functions: PlaceOrder and AddToBasket. The duration for each function is represented in two ways:

  • A single number showing the average duration in the last hour.
  • A chart of the duration over time.

The Lambda function update event is shown on the duration time chart as an orange dot. The different views of duration show a high-level value and the detailed behavior over time. The detailed behavior is important to understanding the outcome. With only the high-level value, it is difficult to see if an increase in the hourly duration results from a short-term increase in duration, an upward trend, or a step change in behavior.

What is clear from this dashboard is that immediately following an update to the Lambda code, the PlaceOrder function duration dramatically increases from an average of ~100ms to ~300ms. This is a step change in behavior. The same deployment does not have the same impact on the duration of the AddToBasket function. While the duration is increasing near the end of the time period, it is less clear that this is because of the deployment. This dashboard provides awareness to the impact of the change at a function level so that the business can decide if the impact is acceptable.

Resources for creating your own dashboard

Conclusion

This blog demonstrates how to create an EventBridge rule and CloudWatch dashboard to visualize the impact of Lambda function code changes on performance data. First, an EventBridge rule is created to capture Lambda function code update events recorded in CloudTrail. EventBridge sends the event to CloudWatch where UpdateFunctionCode events are stored as a metric. The UpdateFunctionCode event data is visualized in a CloudWatch dashboard alongside Lambda performance data. This visibility enables teams to better understand the impact of code changes and make data-driven solutions.

You can modify the concepts in this blog and apply them to a wide variety of use cases. EventBridge can capture AWS CodeCommit and AWS CloudFormation deployments, and send the events to a CloudWatch dashboard to visualize alongside other metrics.

For more serverless learning resources, visit Serverless Land.

Introducing container, database, and queue utilization metrics for the Amazon MWAA environment

Post Syndicated from David Boyne original https://aws.amazon.com/blogs/compute/introducing-container-database-and-queue-utilization-metrics-for-the-amazon-mwaa-environment/

This post is written by Uma Ramadoss (Senior Specialist Solutions Architect), and Jeetendra Vaidya (Senior Solutions Architect).

Today, AWS is announcing the availability of container, database, and queue utilization metrics for Amazon Managed Workflows for Apache Airflow (Amazon MWAA). This is a new collection of metrics published by Amazon MWAA in addition to existing Apache Airflow metrics in Amazon CloudWatch. With these new metrics, you can better understand the performance of your Amazon MWAA environment, troubleshoot issues related to capacity, delays, and get insights on right-sizing your Amazon MWAA environment.

Previously, customers were limited to Apache Airflow metrics such as DAG processing parse times, pool running slots, and scheduler heartbeat to measure the performance of the Amazon MWAA environment. While these metrics are often effective in diagnosing Airflow behavior, they lack the ability to provide complete visibility into the utilization of the various Apache Airflow components in the Amazon MWAA environment. This could limit the ability for some customers to monitor the performance and health of the environment effectively.

Overview

Amazon MWAA is a managed service for Apache Airflow. There are a variety of deployment techniques with Apache Airflow. The Amazon MWAA deployment architecture of Apache Airflow is carefully chosen to allow customers to run workflows in production at scale.

Amazon MWAA has distributed architecture with multiple schedulers, auto-scaled workers, and load balanced web server. They are deployed in their own Amazon Elastic Container Service (ECS) cluster using AWS Fargate compute engine. Amazon Simple Queue Service (SQS) queue is used to decouple Airflow workers and schedulers as part of Celery Executor architecture. Amazon Aurora PostgreSQL-Compatible Edition is used as the Apache Airflow metadata database. From today, you can get complete visibility into the scheduler, worker, web server, database, and queue metrics.

In this post, you can learn about the new metrics published for Amazon MWAA environment, build a sample application with a pre-built workflow, and explore the metrics using CloudWatch dashboard.

Container, database, and queue utilization metrics

  1. In the CloudWatch console, in Metrics, select All metrics.
  2. From the metrics console that appears on the right, expand AWS namespaces and select MWAA tile.
  3. MWAA metrics

    MWAA metrics

  4. You can see a tile of dimensions, each corresponding to the container (cluster), database, and queue metrics.
  5. MWAA metrics drilldown

    MWAA metrics drilldown

Cluster metrics

The base MWAA environment comes up with three Amazon ECS clusters – scheduler, one worker (BaseWorker), and a web server. Workers can be configured with minimum and maximum numbers. When you configure more than one minimum worker, Amazon MWAA creates another ECS cluster (AdditionalWorker) to host the workers from 2 up to n where n is the max workers configured in your environment.

When you select Cluster from the console, you can see the list of metrics for all the clusters. To learn more about the metrics, visit the Amazon ECS product documentation.

MWAA metrics list

MWAA metrics list

CPU usage is the most important factor for schedulers due to DAG file processing. When you have many DAGs, CPU usage can be higher. You can improve the performance by setting min_file_process_interval higher. Similarly, you can apply other techniques described in the Apache Airflow Scheduler page to fine tune the performance.

Higher CPU or memory utilization in the worker can be due to moving large files or doing computation on the worker itself. This can be resolved by offloading the compute to purpose-built services such as Amazon ECS, Amazon EMR, and AWS Glue.

Database metrics

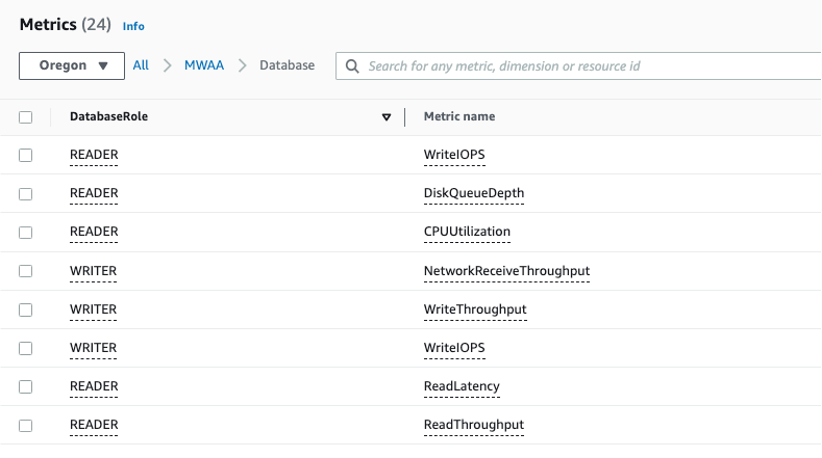
Amazon Aurora DB clusters used by Amazon MWAA come up with a primary DB instance and a read replica to support the read operations. Amazon MWAA publishes database metrics for both READER and WRITER instances. When you select Database tile, you can view the list of metrics available for the database cluster.

Database metrics

Database metrics

Amazon MWAA uses connection pooling technique so the database connections from scheduler, workers, and web servers are taken from the connection pool. If you have many DAGs scheduled to start at the same time, it can overload the scheduler and increase the number of database connections at a high frequency. This can be minimized by staggering the DAG schedule.

SQS metrics

An SQS queue helps decouple scheduler and worker so they can independently scale. When workers read the messages, they are considered in-flight and not available for other workers. Messages become available for other workers to read if they are not deleted before the 12 hours visibility timeout. Amazon MWAA publishes in-flight message count (RunningTasks), messages available for reading count (QueuedTasks) and the approximate age of the earliest non-deleted message (ApproximateAgeOfOldestTask).

Database metrics

Database metrics

Getting started with container, database and queue utilization metrics for Amazon MWAA

The following sample project explores some key metrics using an Amazon CloudWatch dashboard to help you find the number of workers running in your environment at any given moment.

The sample project deploys the following resources:

  • Amazon Virtual Private Cloud (Amazon VPC).
  • Amazon MWAA environment of size small with 2 minimum workers and 10 maximum workers.
  • A sample DAG that fetches NOAA Global Historical Climatology Network Daily (GHCN-D) data, uses AWS Glue Crawler to create tables and AWS Glue Job to produce an output dataset in Apache Parquet format that contains the details of precipitation readings for the US between year 2010 and 2022.
  • Amazon MWAA execution role.
  • Two Amazon S3 buckets – one for Amazon MWAA DAGs, one for AWS Glue job scripts and weather data.
  • AWSGlueServiceRole to be used by AWS Glue Crawler and AWS Glue job.

Prerequisites

There are a few tools required to deploy the sample application. Ensure that you have each of the following in your working environment:

Setting up the Amazon MWAA environment and associated resources

  1. From your local machine, clone the project from the GitHub repository.
  2. git clone https://github.com/aws-samples/amazon-mwaa-examples

  3. Navigate to mwaa_utilization_cw_metric directory.
  4. cd usecases/mwaa_utilization_cw_metric

  5. Run the makefile.
  6. make deploy

  7. Makefile runs the terraform template from the infra/terraform directory. While the template is being applied, you are prompted if you want to perform these actions.
  8. MWAA utilization terminal

    MWAA utilization terminal

This provisions the resources and copies the necessary files and variables for the DAG to run. This process can take approximately 30 minutes to complete.

Generating metric data and exploring the metrics

  1. Login into your AWS account through the AWS Management Console.
  2. In the Amazon MWAA environment console, you can see your environment with the Airflow UI link in the right of the console.
  3. MMQA environment console

    MMQA environment console

  4. Select the link Open Airflow UI. This loads the Apache Airflow UI.
  5. Apache Airflow UI

    Apache Airflow UI

  6. From the Apache Airflow UI, enable the DAG using Pause/Unpause DAG toggle button and run the DAG using the Trigger DAG link.
  7. You can see the Treeview of the DAG run with the tasks running.
  8. Navigate to the Amazon CloudWatch dashboard in another browser tab. You can see a dashboard by the name, MWAA_Metric_Environment_env_health_metric_dashboard.
  9. Access the dashboard to view different key metrics across cluster, database, and queue.
  10. MWAA dashboard

    MWAA dashboard

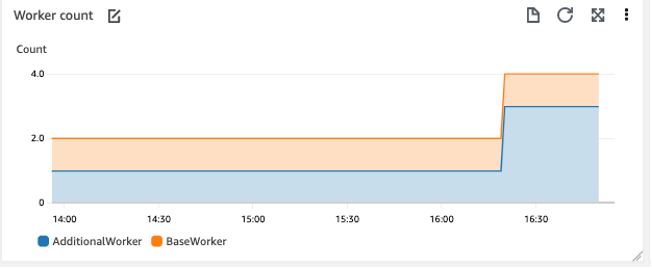
  11. After the DAG run is complete, you can look into the dashboard for worker count metrics. Worker count started with 2 and increased to 4.

When you trigger the DAG, the DAG runs 13 tasks in parallel to fetch weather data from 2010-2022. With two small size workers, the environment can run 10 parallel tasks. The rest of the tasks wait for either the running tasks to complete or automatic scaling to start. As the tasks take more than a few minutes to finish, MWAA automatic scaling adds additional workers to handle the workload. Worker count graph now plots higher with AdditionalWorker count increased to 3 from 1.

Cleanup

To delete the sample application infrastructure, use the following command from the usecases/mwaa_utilization_cw_metric directory.

make undeploy

Conclusion

This post introduces the new Amazon MWAA container, database, and queue utilization metrics. The example shows the key metrics and how you can use the metrics to solve a common question of finding the Amazon MWAA worker counts. These metrics are available to you from today for all versions supported by Amazon MWAA at no additional cost.

Start using this feature in your account to monitor the health and performance of your Amazon MWAA environment, troubleshoot issues related to capacity and delays, and to get insights into right-sizing the environment

Build your own CloudWatch dashboard using the metrics data JSON and Airflow metrics. To deploy more solutions in Amazon MWAA, explore the Amazon MWAA samples GitHub repo.

For more serverless learning resources, visit Serverless Land.

Apache, Apache Airflow, and Airflow are either registered trademarks or trademarks of the Apache Software Foundation in the United States and/or other countries.

ICYMI: Serverless Q3 2022

Post Syndicated from David Boyne original https://aws.amazon.com/blogs/compute/serverless-icymi-q3-2022/

Welcome to the 19th edition of the AWS Serverless ICYMI (in case you missed it) quarterly recap. Every quarter, we share all the most recent product launches, feature enhancements, blog posts, webinars, Twitch live streams, and other interesting things that you might have missed!

In case you missed our last ICYMI, check out what happened last quarter here.

AWS Lambda

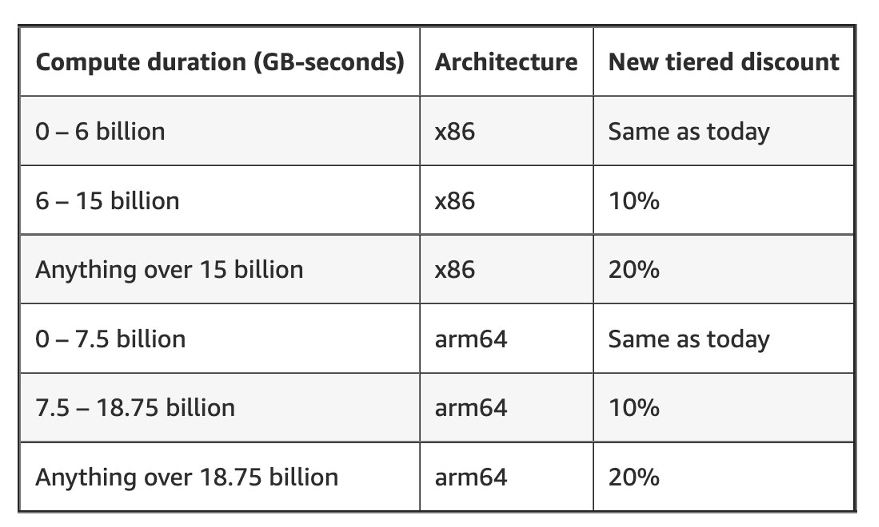
AWS has now introduced tiered pricing for Lambda. With tiered pricing, customers who run large workloads on Lambda can automatically save on their monthly costs. Tiered pricing is based on compute duration measured in GB-seconds. The tiered pricing breaks down as follows:

With tiered pricing, you can save on the compute duration portion of your monthly Lambda bills. This allows you to architect, build, and run large-scale applications on Lambda and take advantage of these tiered prices automatically. To learn more about Lambda cost optimizations, watch the new serverless office hours video.

Developers are using AWS SAM CLI to simplify serverless development making it easier to build, test, package, and deploy their serverless applications.  For JavaScript and TypeScript developers, you can now simplify your Lambda development further using esbuild in the AWS SAM CLI.

Code example of esbuild with SAM

Together with esbuild and SAM Accelerate, you can rapidly iterate on your code changes in the AWS Cloud. You can approximate the same levels of productivity as when testing locally, while testing against a realistic application environment in the cloud. esbuild helps simplify Lambda development with support for tree shaking, minification, source maps, and loaders. To learn more about this feature, read the documentation.

Lambda announced support for Attribute-Based Access Control (ABAC). ABAC is designed to simplify permission management using access permissions based on tags. These can be attached to IAM resources, such as IAM users, and roles. ABAC support for Lambda functions allows you to scale your permissions as your organization innovates. It gives granular access to developers without requiring a policy update when a user or project is added, removed, or updated. To learn more about ABAC, read about ABAC for Lambda.

AWS Lambda Powertools is an open-source library to help customers discover and incorporate serverless best practices more easily. Powertools for TypeScript is now generally available and currently focused on three observability features: distributed tracing (Tracer), structured logging (Logger), and asynchronous business and application metrics (Metrics). Powertools is helping builders around the world with more than 10M downloads it is also available in Python and Java programming languages.

To learn more:

AWS Step Functions

Amazon States Language (ASL) provides a set of functions known as intrinsics that perform basic data transformations. Customers have asked for additional intrinsics to perform more data transformation tasks, such as formatting JSON strings, creating arrays, generating UUIDs, and encoding data. Step functions have now added 14 new intrinsic functions which can be grouped into six categories:

Intrinsic functions allow you to reduce the use of other services to perform basic data manipulations in your workflow. Read the release blog for use-cases and more details.

Step Functions expanded its AWS SDK integrations with support for Amazon Pinpoint API 2.0, AWS Billing Conductor,  Amazon GameSparks, and 195 more AWS API actions. This brings the total to 223 AWS Services and 10,000+ API Actions.

Amazon EventBridge

EventBridge released support for bidirectional event integrations with Salesforce, allowing customers to consume Salesforce events directly into their AWS accounts. Customers can also utilize API Destinations to send EventBridge events back to Salesforce, completing the bidirectional event integrations between Salesforce and AWS.

EventBridge also released the ability to start receiving events from GitHub, Stripe, and Twilio using quick starts. Customers can subscribe to events from these SaaS applications and receive them directly onto their EventBridge event bus for further processing. With Quick Starts, you can use AWS CloudFormation templates to create HTTP endpoints for your event bus that are configured with security best practices.

To learn more:

Amazon DynamoDB

DynamoDB now supports bulk imports from Amazon S3 into new DynamoDB tables. You can use bulk imports to help you migrate data from other systems, load test your applications, facilitate data sharing between tables and accounts, or simplify your disaster recovery and business continuity plans. Bulk imports support CSV, DynamoDB JSON, and Amazon Ion as input formats. You can get started with DynamoDB import via API calls or the AWS Management Console. To learn more, read the documentation or follow this guide.

DynamoDB now supports up to 100 actions per transaction. With Amazon DynamoDB transactions, you can group multiple actions together and submit them as a single all-or-nothing operation. The maximum number of actions in a single transaction has now increased from 25 to 100. The previous limit of 25 actions per transaction would sometimes require writing additional code to break transactions into multiple parts. Now with 100 actions per transaction, builders will encounter this limit much less frequently. To learn more about best practices for transactions, read the documentation.

Amazon SNS

SNS has introduced the public preview of message data protection to help customers discover and protect sensitive data in motion without writing custom code. With message data protection for SNS, you can scan messages in real time for PII/PHI data and receive audit reports containing scan results. You can also prevent applications from receiving sensitive data by blocking inbound messages to an SNS topic or outbound messages to an SNS subscription. These scans include people’s names, addresses, social security numbers, credit card numbers, and prescription drug codes.

To learn more:

EDA Day – London 2022

The Serverless DA team hosted the world’s first event-driven architecture (EDA) day in London on September 1. This brought together prominent figures in the event-driven architecture community, AWS, and customer speakers, and AWS product leadership from EventBridge and Step Functions.

EDA day covered 13 sessions, 3 workshops, and a Q&A panel. The conference was keynoted by Gregor Hohpe and speakers included Sheen Brisals and Sarah Hamilton from Lego, Toli Apostolidis from Cinch, David Boyne and Marcia Villalba from Serverless DA, and the AWS product team leadership for the panel. Customers could also interact with EDA experts at the Serverlesspresso bar and the Ask the Experts whiteboard.

Gregor Hohpe talking at EDA Day London 2022

Gregor Hohpe talking at EDA Day London 2022

Picture of the crowd at EDA day 2022 in London

Serverless snippets collection added to Serverless Land

Serverless Land is a website that is maintained by the Serverless Developer Advocate team to help you build with workshops, patterns, blogs, and videos. The team has extended Serverless Land and introduced the new AWS Serverless snippets collection. Builders can use serverless snippets to find and integrate tools, code examples, and Amazon CloudWatch Logs Insights queries to help with their development workflow.

Serverless Blog Posts

July

Jul 13 – Optimizing Node.js dependencies in AWS Lambda

Jul 15 – Simplifying serverless best practices with AWS Lambda Powertools for TypeScript

Jul 15 – Creating a serverless Apache Kafka publisher using AWS Lambda 

Jul 18 – Understanding AWS Lambda scaling and throughput

Jul 19 – Introducing Amazon CodeWhisperer in the AWS Lambda console (In preview)

Jul 19 – Scaling AWS Lambda permissions with Attribute-Based Access Control (ABAC)

Jul 25 – Migrating mainframe JCL jobs to serverless using AWS Step Functions

Jul 28 – Using AWS Lambda to run external transactions on Db2 for IBM i

August

Aug 1 – Using certificate-based authentication for iOS applications with Amazon SNS

Aug 4 – Introducing tiered pricing for AWS Lambda

Aug 5 – Securely retrieving secrets with AWS Lambda

Aug 8 – Estimating cost for Amazon SQS message processing using AWS Lambda

Aug 9 – Building AWS Lambda governance and guardrails

Aug 11 – Introducing the new AWS Serverless Snippets Collection

Aug 12 – Introducing bidirectional event integrations with Salesforce and Amazon EventBridge

Aug 17 – Using custom consumer group ID support for AWS Lambda event sources for MSK and self-managed Kafka

Aug 24 – Speeding up incremental changes with AWS SAM Accelerate and nested stacks

Aug 29 – Deploying AWS Lambda functions using AWS Controllers for Kubernetes (ACK)

Aug 30 – Building cost-effective AWS Step Functions workflows

September

Sep 05 – Introducing new intrinsic functions for AWS Step Functions

Sep 08 – Introducing message data protection for Amazon SNS

Sep 14 – Lifting and shifting a web application to AWS Serverless: Part 1

Sep 14 – Lifting and shifting a web application to AWS Serverless: Part 2

Videos

Serverless Office Hours – Tues 10AM PT

Weekly live virtual office hours. In each session we talk about a specific topic or technology related to serverless and open it up to helping you with your real serverless challenges and issues. Ask us anything you want about serverless technologies and applications.

YouTube: youtube.com/serverlessland
Twitch: twitch.tv/aws

July

Jul 5 – AWS SAM Accelerate GA + more!

Jul 12 – Infrastructure as actual code

Jul 19 – The AWS Step Functions Workflows Collection

Jul 26 – AWS Lambda Attribute-Based Access Control (ABAC)

August

Aug 2 – AWS Lambda Powertools for TypeScript/Node.js

Aug 9 – AWS CloudFormation Hooks

Aug 16 – Java on Lambda best-practices

Aug 30 – Alex de Brie: DynamoDB Misconceptions

September

Sep 06 – AWS Lambda Cost Optimization

Sep 13 – Amazon EventBridge Salesforce integration

Sep 20 – .NET on AWS Lambda best practices

FooBar Serverless YouTube channel

Marcia Villalba frequently publishes new videos on her popular serverless YouTube channel. You can view all of Marcia’s videos at https://www.youtube.com/c/FooBar_codes.

July

Jul 7 – Amazon Cognito – Add authentication and authorization to your web apps

Jul 14 – Add Amazon Cognito to an existing application – NodeJS-Express and React

Jul 21 – Introduction to Amazon CloudFront – Add CDN to your applications

Jul 28 – Add Amazon S3 storage and use a CDN in an existing application

August

Aug 04 – Testing serverless application locally – Demo with Node.js, Express, and React

Aug 11 – Building Amazon CloudWatch dashboards with AWS CDK

Aug 19 – Let’s code – Lift and Shift migration to Serverless of Node.js, Express, React and Mongo app

Aug 25 – Let’s code – Lift and Shift migration to Serverless, migrating Authentication and Authorization

Aug 29 – Deploying AWS Lambda functions using AWS Controllers for Kubernetes (ACK)

September

Sep 1 – Run Artillery in a Lambda function | Load test your serverless applications

Sep 8 – Let’s code – Lift and Shift migration to Serverless, migrating Storage with Amazon S3 and CloudFront

Sep 15 – What are Event-Driven Architectures? Why we care?

Sep 22 – Queues – Point to Point Messaging – Exploring Event-Driven Patterns

Still looking for more?

The Serverless landing page has more information. The Lambda resources page contains case studies, webinars, whitepapers, customer stories, reference architectures, and even more Getting Started tutorials.

You can also follow the Serverless Developer Advocacy team on Twitter to see the latest news, follow conversations, and interact with the team.