Post Syndicated from Sheila Busser original https://aws.amazon.com/blogs/compute/monitoring-shared-aws-outposts-rack-capacity/
This post is written by Adam Imeson, Sr. Hybrid Edge Specialist Solutions Architect.
AWS Outposts rack is a fully-managed service that offers the same AWS infrastructure, APIs, tools, and a subset of AWS services to any data center, colocation space, or on-premises facility for a consistent hybrid experience. Outposts rack is ideal for workloads that require low latency, access to on-premises systems, local data processing, data residency, and migration of applications with local system interdependencies.
An Outpost is a pool of AWS compute and storage capacity deployed at a customer site. In an Outposts rack deployment, an Outpost may comprise of one or more racks connected together at the site. It’s common for customers to order their Outpost in a dedicated account and then integrate with their multi-account organizational architecture by sharing the Outpost via AWS Resource Access Manager (AWS RAM). This post will explain how to set up cross-account Amazon CloudWatch metrics so that disparate stakeholders within your organization can effectively monitor your Outpost’s capacity to meet their specific needs.
Overview
The AWS account that you use to order an Outpost owns that Outpost. This includes all metrics and health events pertaining to that Outpost. Many customers must integrate Outposts into their multi-account environments, as discussed in the “Best practices: AWS Outposts in a multi-account AWS environment” posts (part 1 and part 2). This post will go into more detail on how to monitor Outposts in these environments.
The nuance here stems from the different ways to share access to AWS resources. AWS RAM allows infrastructure resources to be shared across multiple accounts. Then, the consumer accounts can launch resources on the infrastructure as though they owned it. AWS Identity and Access Management (IAM) allows customers to modify a given account’s permissions such that users in other accounts can make AWS API calls that affect the given account.
An Outpost provides infrastructure resources, so customers can share Outposts via AWS RAM. CloudWatch metrics about Outposts are data which customers retrieve using AWS API calls, so customers can share access to those metrics using IAM.
In a typical customer’s AWS Organization, there are two cases to consider. First, when the customer is sharing an Outpost to multiple development accounts, each account needs to view metrics relevant to the Outpost so that the development accounts can deploy and operate their applications.
Second, when the customer has several accounts that each own different Outposts, the customer’s centralized monitoring account needs to track metrics relevant to each of the Outposts.

This post will explain strategies for both cases.
Customers must monitor the health of the Outpost’s connection to its regional control plane (the Outpost’s service link), as an Outpost is an extension of an AWS Availability Zone (AZ) and is designed to be connected to an AZ at all times. The health of the Outpost’s service link is a crucial variable when application owners are diagnosing disruptions to their application, and also when infrastructure owners are diagnosing disruptions to a site. Customers can monitor their service link’s status with the ConnectedStatus metric.
Customers also must monitor their Outposts’ current capacity. Outposts necessarily have a limited capacity footprint when compared to an AWS Region. Application owners must make informed decisions about capacity as they scale their apps over time or respond to occasional hardware failures. Infrastructure owners also must maintain a holistic view of capacity across all of the Outposts for which they are responsible so that they can plan for capacity expansion over time. Customers can monitor their Outposts’ capacity using the various capacity metrics that Outposts provide.
For an overview of how to set up a capacity dashboard and capacity-based CloudWatch alarms within a single account, see “Monitoring AWS Outposts capacity.” This post will expand on the single-account strategy by introducing cross-account capabilities. See also “Cross-Account Cross-Region Dashboards with Amazon CloudWatch.” These two posts provide practical walkthroughs for setting up the metric flows explained below.
Setting up Outposts metric permissions for your organization
This post assumes that you have multiple Outposts in different accounts that are all part of the same Organization. You’re sharing these Outposts into accounts that development teams use to deploy and operate their applications. You also have a centralized monitoring account where your infrastructure team tracks various metrics across all accounts. Your Organization might look something like this:

The first Outpost is shared to Accounts A and B, and the second Outpost is only shared to Account B. This is just an example of how a customer might set up their environment so that Application A can deploy on Outpost 1, and Application B can deploy on both Outpost 1 and 2.
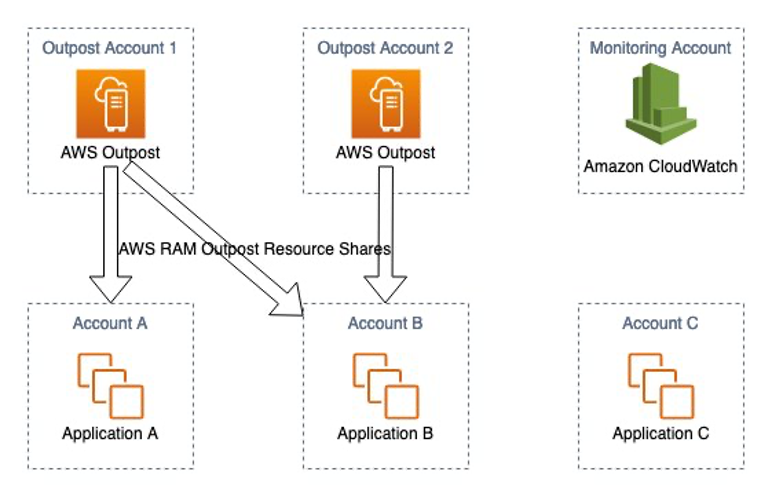
To enable centralized monitoring, each account shares CloudWatch metrics with the central monitoring account as described in “Cross-Account Cross-Region Dashboards with Amazon CloudWatch.”

Now there are application accounts which can launch on the desired Outposts, and all of the accounts are sharing metrics with the central monitoring account. The team responsible for procuring and managing the Outposts can now set up dashboards in the central monitoring account in accordance with “Monitoring AWS Outposts capacity” to get a holistic view of capacity. This is valuable for capacity planning as applications naturally grow over time.
However, this may not be sufficient for operations. Consider that each application team needs to understand how much capacity is available on the Outpost that they’re using. This is crucial for teams operating highly available applications to maintain awareness of whether they still have N+1 capacity available on the Outpost to use in the event of a hardware failure. This is also important for planning expansions to the application ahead of time, as application teams have the best understanding of the future needs of their applications. Finally, application teams can use the metrics to track the operational health of the Outpost, which is crucial for root-causing any application disruptions.
You can implement this by sharing CloudWatch metrics from the Outpost accounts to the application accounts which are consuming the Outposts’ capacity, as shown in the following diagram.

Walkthrough
Log in to your application account and navigate to the CloudWatch console. Open the Settings menu and choose Configure.

Scroll to the bottom. In the View cross-account cross-region section, choose Edit.
Choose your preferred account selection method from the three options and choose Save changes. I recommend the Custom account selector option, as it strikes a good balance between a simple setup and ease of use. If you choose this option, then input the Outpost owner account’s account ID and a human-readable name for the account. This name will appear in the drop-down when you’re using the CloudWatch console to view metrics from other accounts later.

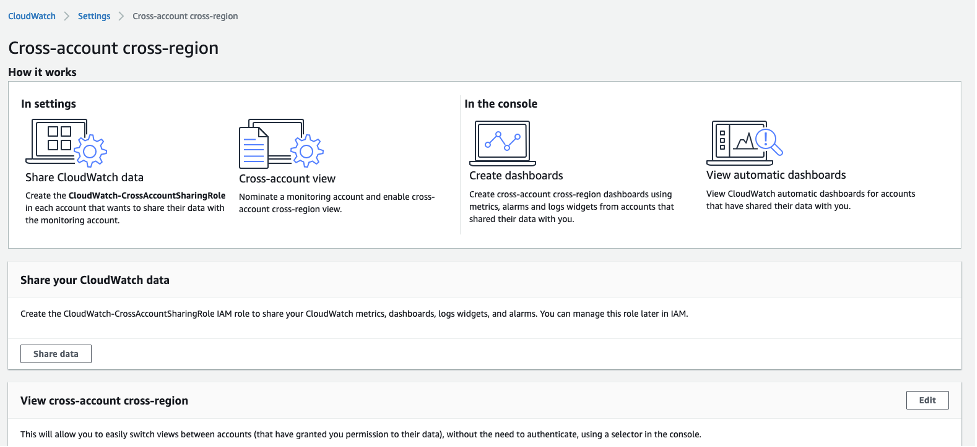
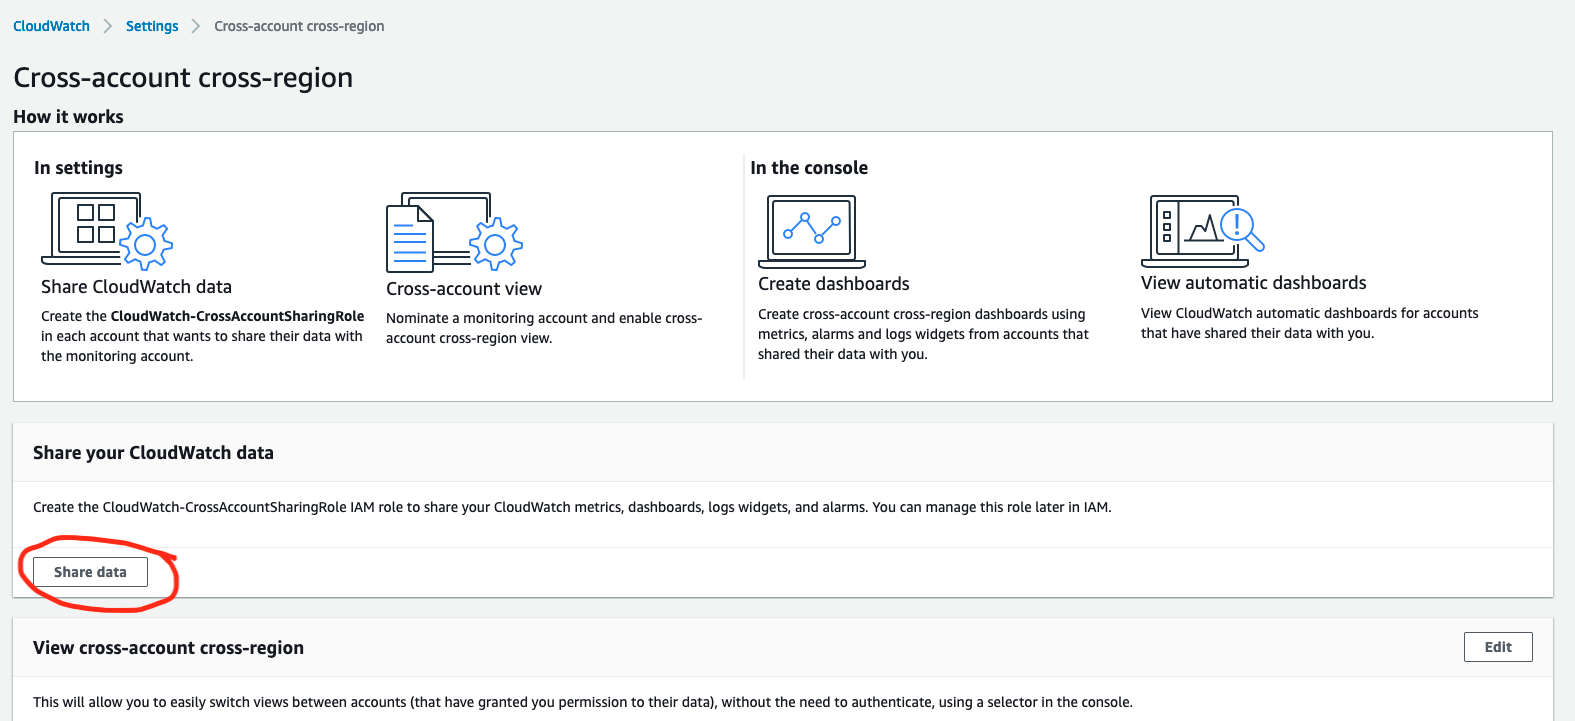
Your application account is now prepared to view metrics from the Outpost owner account. Now log in to the account that owns the Outpost and navigate to the CloudWatch console. You still need to share the Outpost’s metrics to the application account. Open the Settings page again, and choose Configure in the Cross-account cross-region section as before. This time, choose Share data in the Share your CloudWatch data section:
Choose Add account and input the application account’s account ID. Then scroll to the bottom of the page and choose Launch CloudFormation template.

The AWS CloudFormation template will create the CloudWatch-CrossAccountSharingRole. This role gives CloudWatch read access to the AWS account that you specified, the application account. You can view and modify this role using the IAM console if you want to. For example, you might adjust the role to allow read access to an entire Organizational Unit (OU).
Now, log back in to the application account and navigate to the CloudWatch console. Choose All metrics in the left-side menu. In the Metrics section, select the Outpost owner account from the drop-down.

You can now view the metrics from the Outpost owner account and incorporate them into the dashboards in the application account. Now the application teams can track the Outposts’ ConnectedStatus metrics to be alerted on any disconnections from the region, and they can track the Outposts’ capacity metrics as well. It’s a best practice to alarm on Outpost capacity metrics once a consumption threshold defined by business needs has been breached.
Conclusion
Outposts rack allows customers to deploy AWS infrastructure into virtually any data center, colocation space, or on-premises facility. Outposts are tied to the AWS account that ordered them, and customers can share Outposts among AWS accounts within the same Organization. When multiple teams within a customer’s Organization are interacting with the same Outpost, that introduces additional monitoring surface area for capacity and service health. This post explains how customers can accommodate their teams’ different needs by sharing Outposts metrics around their Organization along with their Outposts. As best practices, customers should share their Outposts capacity and ConnectedStatus metrics to teams who are running applications on Outposts. Customers’ operations teams should also work with their stakeholders to define a maximum capacity utilization threshold for a given Outpost and alarm on that threshold.