Post Syndicated from Tanushree Sharma original https://blog.cloudflare.com/workers-production-safety

2024’s Developer Week is all about production readiness. On Monday. April 1, we announced that D1, Queues, Hyperdrive, and Workers Analytics Engine are ready for production scale and generally available. On Tuesday, April 2, we announced the same about our inference platform, Workers AI. And we’re not nearly done yet.
However, production readiness isn’t just about the scale and reliability of the services you build with. You also need tools to make changes safely and reliably. You depend not just on what Cloudflare provides, but on being able to precisely control and tailor how Cloudflare behaves to the needs of your application.
Today we are announcing five updates that put more power in your hands – Gradual Deployments, source mapped stack traces in Tail Workers, a new Rate Limiting API, brand-new API SDKs, and updates to Durable Objects – each built with mission-critical production services in mind. We build our own products using Workers, including Access, R2, KV, Waiting Room, Vectorize, Queues, Stream, and more. We rely on each of these new features ourselves to ensure that we are production ready – and now we’re excited to bring them to everyone.
Gradually deploy changes to Workers and Durable Objects
Deploying a Worker is nearly instantaneous – a few seconds and your change is live everywhere.
When you reach production scale, each change you make carries greater risk, both in terms of volume and expectations. You need to meet your 99.99% availability SLA, or have an ambitious P90 latency SLO. A bad deployment that’s live for 100% of traffic for 45 seconds could mean millions of failed requests. A subtle code change could cause a thundering herd of retries to an overwhelmed backend, if rolled out all at once. These are the kinds of risks we consider and mitigate ourselves for our own services built on Workers.
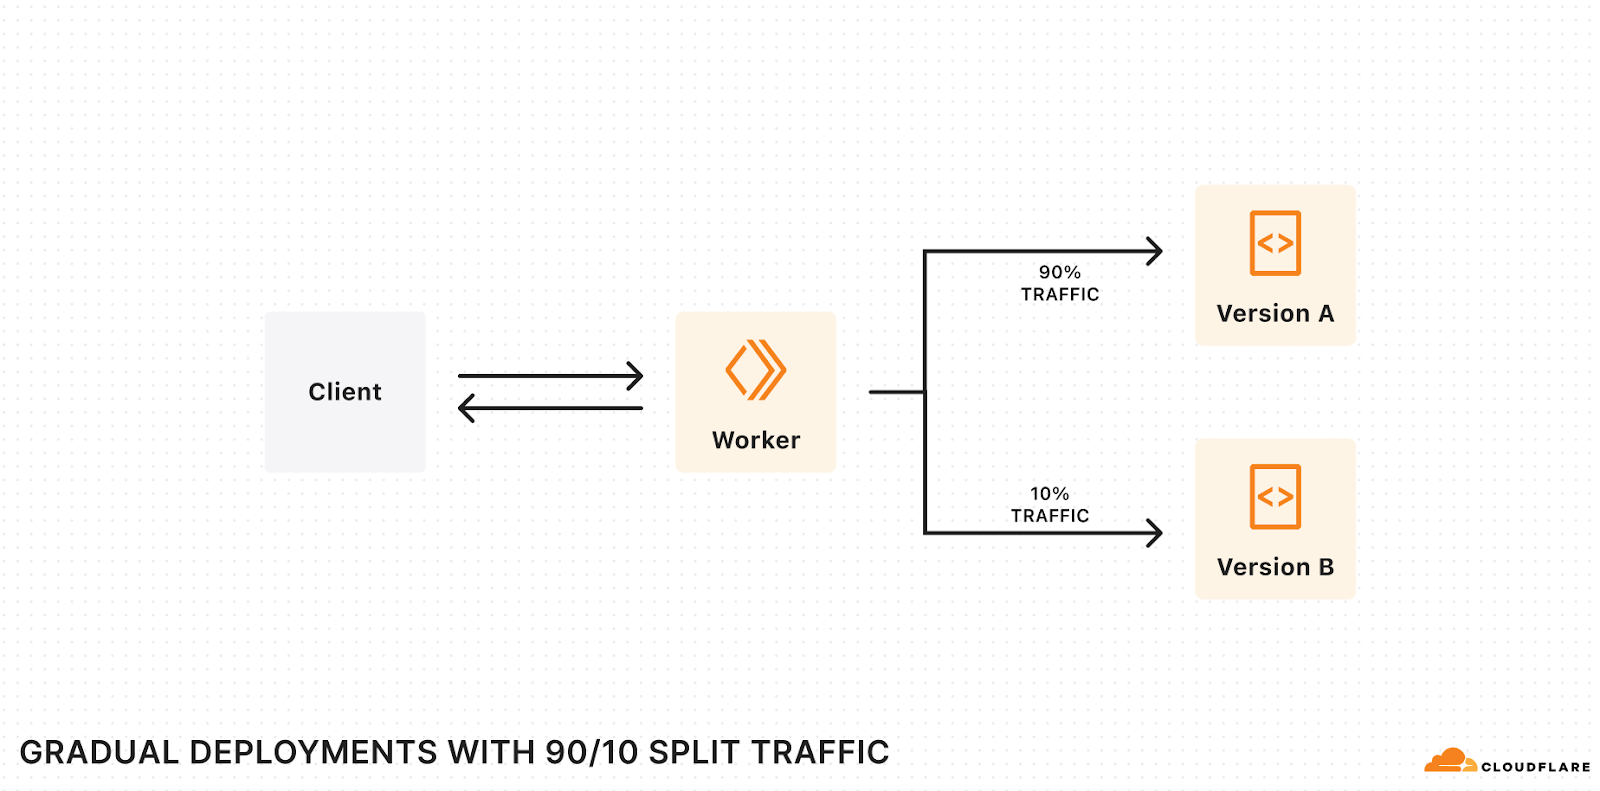
The way to mitigate these risks is to deploy changes gradually – commonly called rolling deployments:
- The current version of your application runs in production.
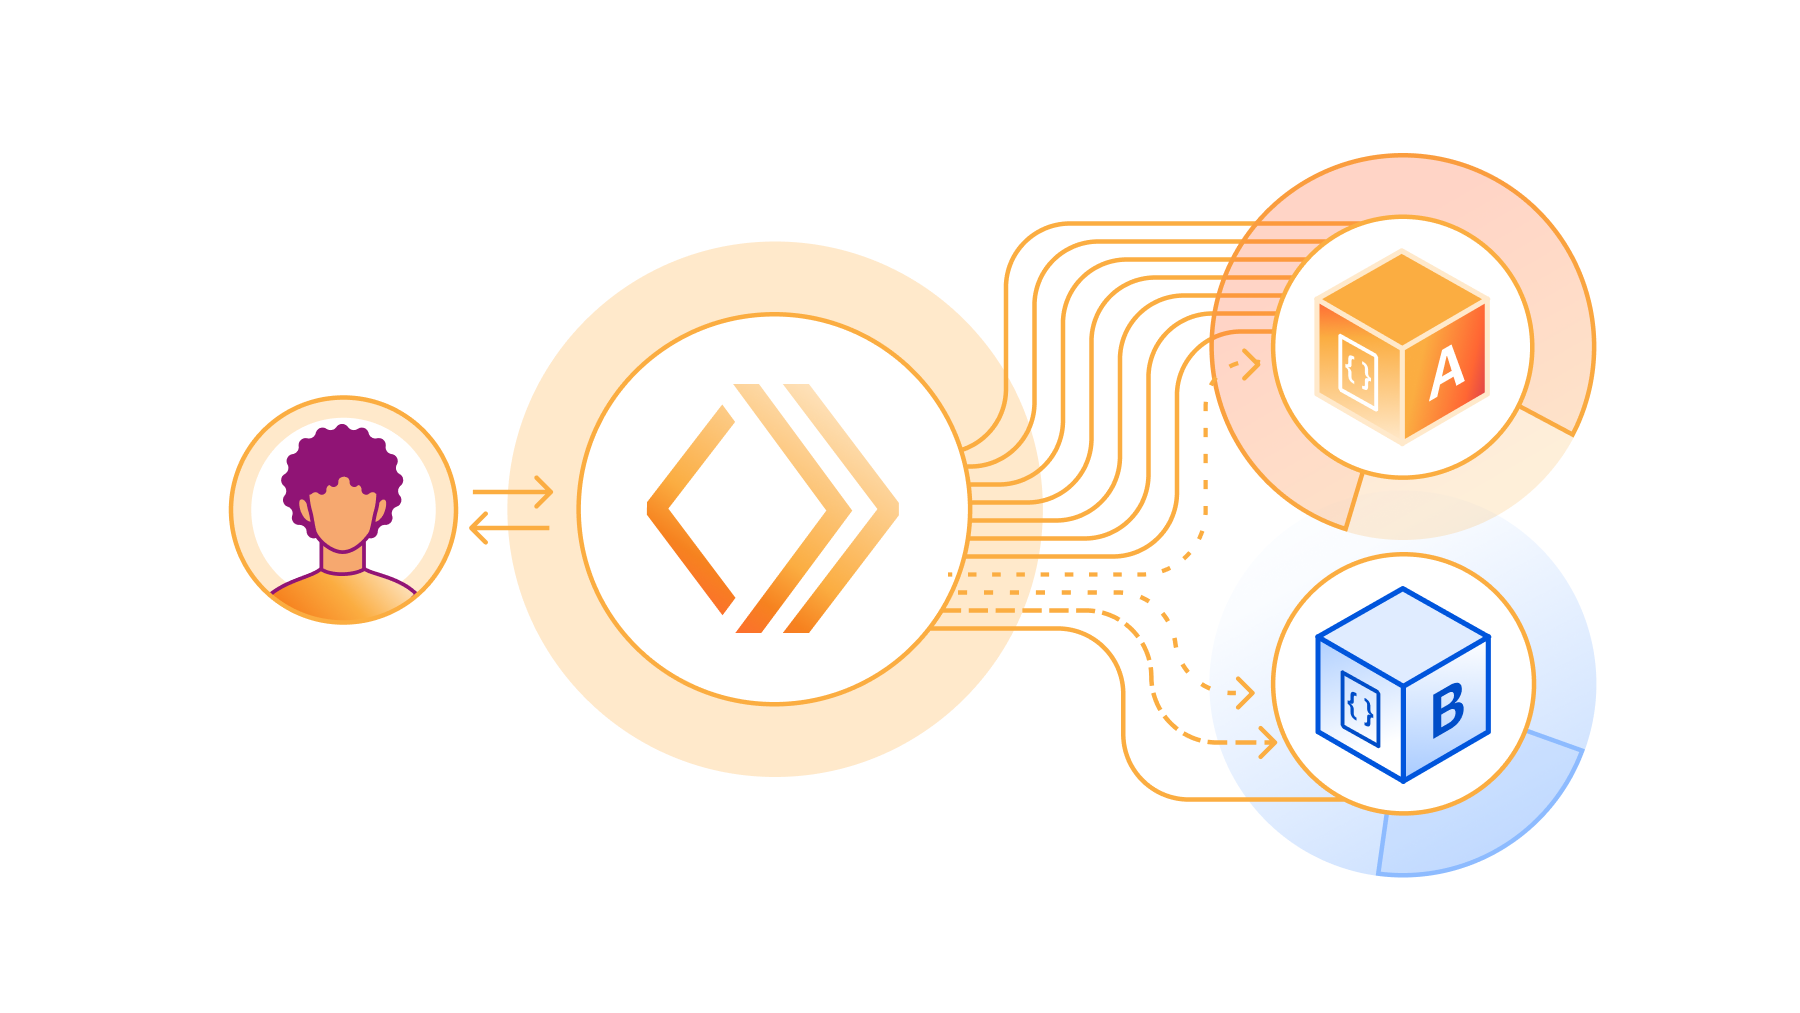
- You deploy the new version of your application to production, but only route a small percentage of traffic to this new version, and wait for it to “soak” in production, monitoring for regressions and bugs. If something bad happens, you’ve caught it early at a small percentage (e.g. 1%) of traffic and can revert quickly.
- You gradually increment the percentage of traffic until the new version receives 100%, at which point it is fully rolled out.
Today we’re opening up a first-class way to deploy code changes gradually to Workers and Durable Objects via the Cloudflare API, the Wrangler CLI, or the Workers dashboard. Gradual Deployments is entering open beta – you can use Gradual Deployments with any Cloudflare account that is on the Workers Free plan, and very soon you’ll be able to start using Gradual Deployments with Cloudflare accounts on the Workers Paid and Enterprise plans. You’ll see a banner on the Workers dashboard once your account has access.

When you have two versions of your Worker or Durable Object running concurrently in production, you almost certainly want to be able to filter your metrics, exceptions, and logs by version. This can help you spot production issues early, when the new version is only rolled out to a small percentage of traffic, or compare performance metrics when splitting traffic 50/50. We’ve also added observability at a version level across our platform:
- You can filter analytics in the Workers dashboard and via the GraphQL Analytics API by version.
- Workers Trace Events and Tail Worker events include the version ID of your Worker, along with optional version message and version tag fields.
- When using wrangler tail to view live logs, you can view logs for a specific version.
- You can access version ID, message, and tag from within your Worker’s code, by configuring the Version Metadata binding.
You may also want to make sure that each client or user only sees a consistent version of your Worker. We’ve added Version Affinity so that requests associated with a particular identifier (such as user, session, or any unique ID) are always handled by a consistent version of your Worker. Session Affinity, when used with Ruleset Engine, gives you full control over both the mechanism and identifier used to ensure “stickiness”.
Gradual Deployments is entering open beta. As we move towards GA, we’re working to support:
- Version Overrides. Invoke a specific version of your Worker in order to test before it serves any production traffic. This will allow you to create Blue-Green Deployments.
- Cloudflare Pages. Let the CI/CD system in Pages automatically progress the deployments on your behalf.
- Automatic rollbacks. Roll back deployments automatically when the error rate spikes for a new version of your Worker.
We’re looking forward to hearing your feedback! Let us know what you think through this feedback form or reach out in our Developer Discord in the #workers-gradual-deployments-beta channel.
Source mapped stack traces in Tail Workers
Production readiness means tracking errors and exceptions, and trying to drive them down to zero. When an error occurs, the first thing you typically want to look at is the error’s stack trace – the specific functions that were called, in what order, from which line and file, and with what arguments.
Most JavaScript code – not just on Workers, but across platforms – is first bundled, often transpiled, and then minified before being deployed to production. This is done behind the scenes to create smaller bundles to optimize performance and convert from Typescript to JavaScript if needed.
If you’ve ever seen an exception return a stack trace like: /src/index.js:1:342,it means the error occurred on the 342nd character of your function’s minified code. This is clearly not very helpful for debugging.
Source maps solve this – they map compiled and minified code back to the original code that you wrote. Source maps are combined with the stack trace returned by the JavaScript runtime in order to present you with a human-readable stack trace. For example, the following stack trace shows that the Worker received an unexpected null value on line 30 of the down.ts file. This is a useful starting point for debugging, and you can move down the stack trace to understand the functions that were called that were set that resulted in the null value.
Unexpected input value: null
  at parseBytes (src/down.ts:30:8)
  at down_default (src/down.ts:10:19)
  at Object.fetch (src/index.ts:11:12)
Here’s how it works:
- When you set upload_source_maps = true in your wrangler.toml, Wrangler will automatically generate and upload any source map files when you run wrangler deploy or wrangler versions upload.
- When your Worker throws an uncaught exception, we fetch the source map and use it to map the stack trace of the exception back to lines of your Worker’s original source code.
- You can then view this deobfuscated stack trace in real-time logs or in Tail Workers.
Starting today, in open beta, you can upload source maps to Cloudflare when you deploy your Worker – get started by reading the docs. And starting on April 15th , the Workers runtime will start using source maps to deobfuscate stack traces. We’ll post a notification in the Cloudflare dashboard and post on our Cloudflare Developers X account when source mapped stack traces are available.
New Rate Limiting API in Workers
An API is only production ready if it has a sensible rate limit. And as you grow, so does the complexity and diversity of limits that you need to enforce in order to balance the needs of specific customers, protect the health of your service, or enforce and adjust limits in specific scenarios. Cloudflare’s own API has this challenge – each of our dozens of products, each with many API endpoints, may need to enforce different rate limits.
You’ve been able to configure Rate Limiting rules on Cloudflare since 2017. But until today, the only way to control this was in the Cloudflare dashboard or via the Cloudflare API. It hasn’t been possible to define behavior at runtime, or write code in a Worker that interacts directly with rate limits – you could only control whether a request is rate limited or not before it hits your Worker.
Today we’re introducing a new API, in open beta, that gives you direct access to rate limits from your Worker. It’s lightning fast, backed by memcached, and dead simple to add to your Worker. For example, the following configuration defines a rate limit of 100 requests within a 60-second period:
[[unsafe.bindings]]
name = "RATE_LIMITER"
type = "ratelimit"
namespace_id = "1001" # An identifier unique to your Cloudflare account

# Limit: the number of tokens allowed within a given period, in a single Cloudflare location
# Period: the duration of the period, in seconds. Must be either 60 or 10
simple = { limit = 100, period = 60 }
Then, in your Worker, you can call the limit method on the RATE_LIMITER binding, providing a key of your choosing. Given the configuration above, this code will return a HTTP 429 response status code once more than 100 requests to a specific path are made within a 60-second period:
export default {
  async fetch(request, env) {
    const { pathname } = new URL(request.url)

    const { success } = await env.RATE_LIMITER.limit({ key: pathname })
    if (!success) {
      return new Response(`429 Failure – rate limit exceeded for ${pathname}`, { status: 429 })
    }

    return new Response(`Success!`)
  }
}
Now that Workers can connect directly to a data store like memcached, what else could we provide? Counters? Locks? An in-memory cache? Rate limiting is the first of many primitives that we’re exploring providing in Workers that address questions we’ve gotten for years about where a temporary shared state that spans many Worker isolates should live. If you rely on putting state in the global scope of your Worker today, we’re working on better primitives that are purpose-built for specific use cases.
The Rate Limiting API in Workers is in open beta, and you can get started by reading the docs.
New auto-generated SDKs for Cloudflare’s API
Production readiness means going from making changes by clicking buttons in a dashboard to making changes programmatically, using an infrastructure-as-code approach like Terraform or Pulumi, or by making API requests directly, either on your own or via an SDK.
The Cloudflare API is massive, and constantly adding new capabilities – on average we update our API schemas between 20 and 30 times per day. But to date, our API SDKs have been built and maintained manually, so we had a burning need to automate this.
We’ve done that, and today we’re announcing new client SDKs for the Cloudflare API in three languages – Typescript, Python and Go – with more languages on the way.
Each SDK is generated automatically using Stainless API, based on the OpenAPI schemas that define the structure and capabilities of each of our API endpoints. This means that when we add any new functionality to the Cloudflare API, across any Cloudflare product, these API SDKs are automatically regenerated, and new versions are published, ensuring that they are correct and up-to-date.
You can install the SDKs by running one of the following commands:
// Typescript
npm install cloudflare

// Python
pip install --pre cloudflare

// Go
go get -u github.com/cloudflare/cloudflare-go/v2
If you use Terraform or Pulumi, under the hood, Cloudflare’s Terraform Provider currently uses the existing, non-automated Go SDK. When you run terraform apply, the Cloudflare Terraform Provider determines which API requests to make in what order, and executes these using the Go SDK.
The new, auto-generated Go SDK clears a path towards more comprehensive Terraform support for all Cloudflare products, providing a base set of tools that can be relied upon to be both correct and up-to-date with the latest API changes. We’re building towards a future where any time a product team at Cloudflare builds a new feature that is exposed via the Cloudflare API, it is automatically supported by the SDKs. Expect more updates on this throughout 2024.
Durable Object namespace analytics and WebSocket Hibernation GA
Many of our own products, including Waiting Room, R2, and Queues, as well as platforms like PartyKit, are built using Durable Objects. Deployed globally, including newly added support for Oceania, you can think of Durable Objects like singleton Workers that can provide a single point of coordination and persist state. They’re perfect for applications that need real-time user coordination, like interactive chat or collaborative editing. Take Atlassian’s word for it:
One of our new capabilities is Confluence whiteboards, which provides a freeform way to capture unstructured work like brainstorming and early planning before teams document it more formally. The team considered many options for real-time collaboration and ultimately decided to use Cloudflare’s Durable Objects. Durable Objects have proven to be a fantastic fit for this problem space, with a unique combination of functionalities that has allowed us to greatly simplify our infrastructure and easily scale to a large number of users. – Atlassian
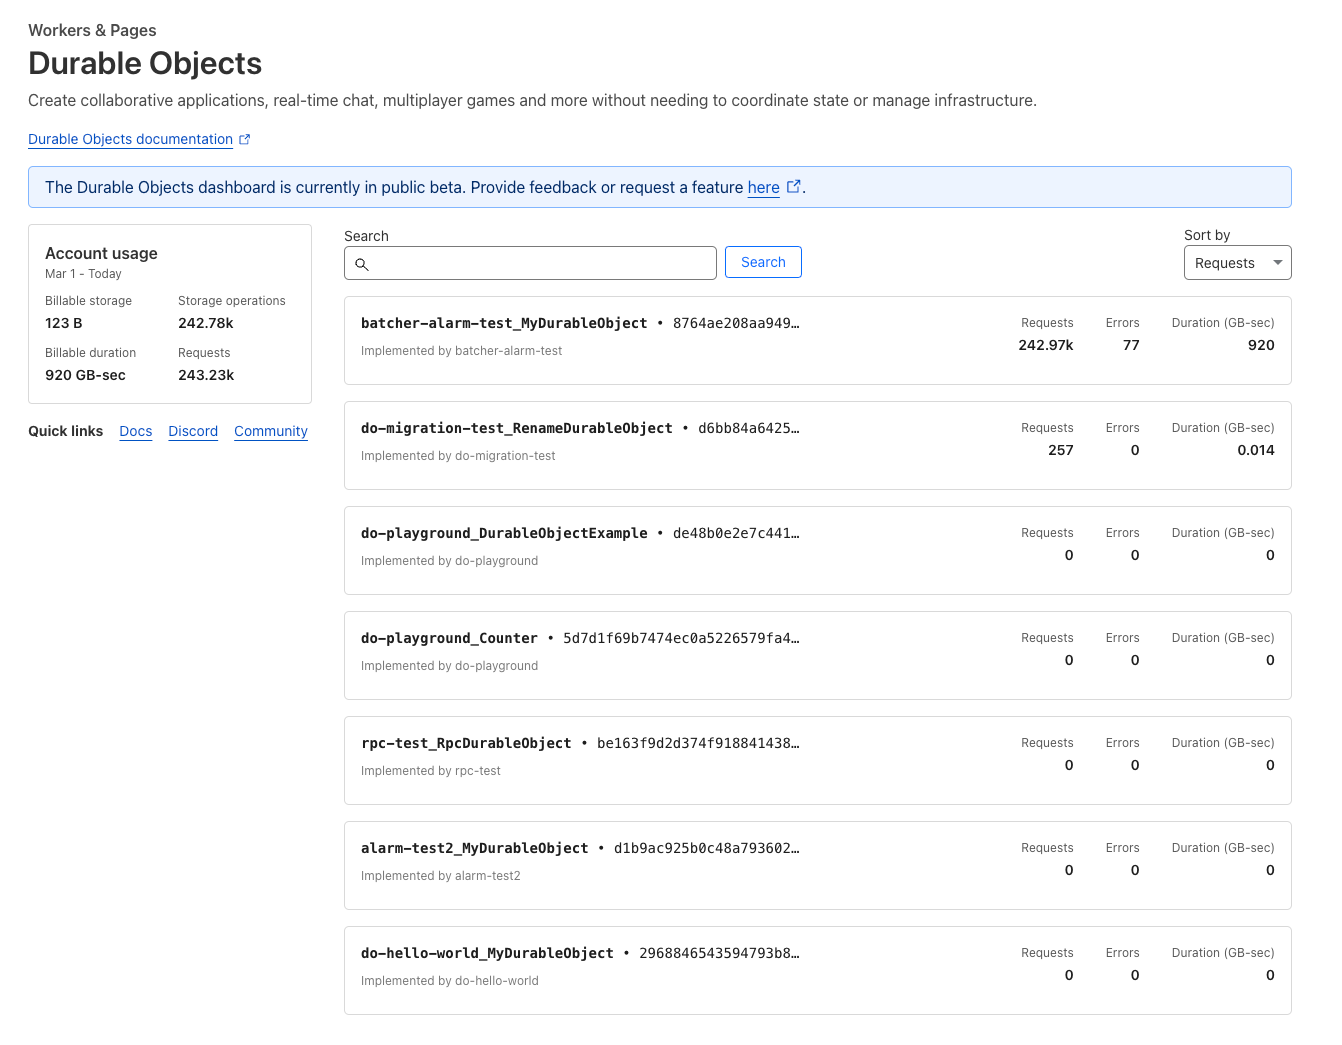
We haven’t previously exposed associated analytical trends in the dashboard, making it hard to understand the usage patterns and error rates within a Durable Objects namespace unless you used the GraphQL Analytics API directly. The Durable Objects dashboard has now been revamped, letting you drill down into metrics, and go as deep as you need.

From day one, Durable Objects have supported WebSockets, allowing many clients to directly connect to a Durable Object to send and receive messages.
However, sometimes client applications open a WebSocket connection and then eventually stop doing…anything. Think about that tab you’ve had sitting open in your browser for the last 5 hours, but haven’t touched. If it uses WebSockets to send and receive messages, it effectively has a long-lived TCP connection that isn’t being used for anything. If this connection is to a Durable Object, the Durable Object must stay running, waiting for something to happen, consuming memory, and costing you money.
We first introduced WebSocket Hibernation to solve this problem, and today we’re announcing that this feature is out of beta and is Generally Available. With WebSocket Hibernation, you set an automatic response to be used while hibernating and serialize state such that it survives hibernation. This gives Cloudflare the inputs we need in order to maintain open WebSocket connections from clients while “hibernating” the Durable Object such that it is not actively running, and you are not billed for idle time. The result is that your state is always available in-memory when you actually need it, but isn’t unnecessarily kept around when it’s not. As long as your Durable Object is hibernating, even if there are active clients still connected over a WebSocket, you won’t be billed for duration.
In addition, we’ve heard developer feedback on the costs of incoming WebSocket messages to Durable Objects, which favor smaller, more frequent messages for real-time communication. Starting today incoming WebSocket messages will be billed at the equivalent of 1/20th of a request (as opposed to 1 message being the equivalent of 1 request as it has been up until now). Following a pricing example:
| WebSocket Connection Requests | Incoming WebSocket Messages | Billed Requests | Request Billing | |
|---|---|---|---|---|
| Before | 10K | 432M | 432,010,000 | $64.65 |
| After | 10K | 432M | 21,610,000 | $3.09 |
Production ready, without production complexity
Becoming production ready on the last generation of cloud platforms meant slowing down how fast you shipped. It meant stitching together many disconnected tools or standing up whole teams to work on internal platforms. You had to retrofit your own productivity layers onto platforms that put up roadblocks.
The Cloudflare Developer Platform is grown up and production ready, and committed to being an integrated platform where products intuitively work together and where there aren’t 10 ways to do the same thing, with no need for a compatibility matrix to help understand what works together. Each of these updates shows this in action, integrating new functionality across products and parts of Cloudflare’s platform.
To that end, we want to hear from you about not only what you want to see next, but where you think we could be even simpler, or where you think our products could work better together. Tell us where you think we could do more – the Cloudflare Developers Discord is always open.