Post Syndicated from Thibault Meunier original https://blog.cloudflare.com/private-rate-limiting/
The way we interact with the Internet is changing. Not long ago, ordering a pizza meant visiting a website, clicking through menus, and entering your payment details. Soon, you might just ask your phone to order a pizza that matches your preferences. A program on your device or on a remote server, which we call an AI agent, would visit the website and orchestrate the necessary steps on your behalf.
Of course, agents can do much more than order pizza. Soon we might use them to buy concert tickets, plan vacations, or even write, review, and merge pull requests. While some of these tasks will eventually run locally, for now, most are powered by massive AI models running in the biggest datacenters in the world. As agentic AI increases in popularity, we expect to see a large increase in traffic from these AI platforms and a corresponding drop in traffic from more conventional sources (like your phone).
This shift in traffic patterns has prompted us to assess how to keep our customers online and secure in the AI era. On one hand, the nature of requests are changing: Websites optimized for human visitors will have to cope with faster, and potentially greedier, agents. On the other hand, AI platforms may soon become a significant source of attacks, originating from malicious users of the platforms themselves.
Unfortunately, existing tools for managing such (mis)behavior are likely too coarse-grained to manage this transition. For example, when Cloudflare detects that a request is part of a known attack pattern, the best course of action often is to block all subsequent requests from the same source. When the source is an AI agent platform, this could mean inadvertently blocking all users of the same platform, even honest ones who just want to order pizza. We started addressing this problem earlier this year. But as agentic AI grows in popularity, we think the Internet will need more fine-grained mechanisms of managing agents without impacting honest users.
At the same time, we firmly believe that any such security mechanism must be designed with user privacy at its core. In this post, we’ll describe how to use anonymous credentials (AC) to build these tools. Anonymous credentials help website operators to enforce a wide range of security policies, like rate-limiting users or blocking a specific malicious user, without ever having to identify any user or track them across requests.
Anonymous credentials are under development at IETF in order to provide a standard that can work across websites, browsers, platforms. It’s still in its early stages, but we believe this work will play a critical role in keeping the Internet secure and private in the AI era. We will be contributing to this process as we work towards real-world deployment. This is still early days. If you work in this space, we hope you will follow along and contribute as well.
To help us discuss how AI agents are affecting web servers, let’s build an agent ourselves. Our goal is to have an agent that can order a pizza from a nearby pizzeria. Without an agent, you would open your browser, figure out which pizzeria is nearby, view the menu and make selections, add any extras (double pepperoni), and proceed to checkout with your credit card. With an agent, it’s the same flow —except the agent is opening and orchestrating the browser on your behalf.
In the traditional flow, there’s a human all along the way, and each step has a clear intent: list all pizzerias within 3 Km of my current location; pick a pizza from the menu; enter my credit card; and so on. An agent, on the other hand, has to infer each of these actions from the prompt “order me a pizza.”
In this section, we’ll build a simple program that takes a prompt and can make outgoing requests. Here’s an example of a simple Worker that takes a specific prompt and generates an answer accordingly. You can find the code on GitHub:
export default {
   async fetch(request: Request, env: Env, ctx: ExecutionContext): Promise<Response> {
       const out = await env.AI.run("@cf/meta/llama-3.1-8b-instruct-fp8", {
           prompt: `I'd like to order a pepperoni pizza with extra cheese.
                    Please deliver it to Cloudflare Austin office.
                    Price should not be more than $20.`,
       });


       return new Response(out.response);
   },
} satisfies ExportedHandler<Env>;
In this context, the LLM provides its best answer. It gives us a plan and instruction, but does not perform the action on our behalf. You and I are able to take a list of instructions and act upon it because we have agency and can affect the world. To allow our agent to interact with more of the world, we’re going to give it control over a web browser.
Cloudflare offers a Browser Rendering service that can bind directly into our Worker. Let’s do that. The following code uses Stagehand, an automation framework that makes it simple to control the browser. We pass it an instance of Cloudflare remote browser, as well as a client for Workers AI.
import { Stagehand } from "@browserbasehq/stagehand";
import { endpointURLString } from "@cloudflare/playwright";
import { WorkersAIClient } from "./workersAIClient"; // wrapper to convert cloudflare AI


export default {
   async fetch(request: Request, env: Env, ctx: ExecutionContext): Promise<Response> {
       const stagehand = new Stagehand({
           env: "LOCAL",
           localBrowserLaunchOptions: { cdpUrl: endpointURLString(env.BROWSER) },
           llmClient: new WorkersAIClient(env.AI),
           verbose: 1,
       });
       await stagehand.init();


       const page = stagehand.page;
       await page.goto("https://mini-ai-agent.cloudflareresearch.com/llm");


       const { extraction } = await page.extract("what are the pizza available on the menu?");
       return new Response(extraction);
   },
} satisfies ExportedHandler<Env>;
You can access that code for yourself on https://mini-ai-agent.cloudflareresearch.com/llm. Here’s the response we got on October 10, 2025:
Margherita Classic: $12.99
Pepperoni Supreme: $14.99
Veggie Garden: $13.99
Meat Lovers: $16.99
Hawaiian Paradise: $15.49
Using the screenshot API of browser rendering, we can also inspect what the agent is doing. Here’s how the browser renders the page in the example above:

Stagehand allows us to identify components on the page, such as page.act(“Click on pepperoni pizza”) and page.act(“Click on Pay now”). This eases interaction between the developer and the browser.
To go further, and instruct the agent to perform the whole flow autonomously, we have to use the appropriately named agent mode of Stagehand. This feature is not yet supported by Cloudflare Workers, but is provided below for completeness.
import { Stagehand } from "@browserbasehq/stagehand";
import { endpointURLString } from "@cloudflare/playwright";
import { WorkersAIClient } from "./workersAIClient";


export default {
   async fetch(request: Request, env: Env, ctx: ExecutionContext): Promise<Response> {
       const stagehand = new Stagehand({
           env: "LOCAL",
           localBrowserLaunchOptions: { cdpUrl: endpointURLString(env.BROWSER) },
           llmClient: new WorkersAIClient(env.AI),
           verbose: 1,
       });
       await stagehand.init();

       const agent = stagehand.agent();
       const result = await agent.execute(`I'd like to order a pepperoni pizza with extra cheese.
                                           Please deliver it to Cloudflare Austin office.
                                           Price should not be more than $20.`);


       return new Response(result.message);
   },
} satisfies ExportedHandler<Env>;
We can see that instead of adding step-by-step instructions, the agent is provided control. To actually pay, it would need access to a payment method such as a virtual credit card.
The prompt had some subtlety in that we’ve scoped the location to Cloudflare’s Austin office. This is because while the agent responds to us, it needs to understand our context. In this case, the agent operates out of Cloudflare edge, a location remote to us. This implies we are unlikely to pick up a pizza from this data center if it was ever delivered.
The more capabilities we provide to the agent, the more it has the ability to create some disruption. Instead of someone having to make 5 clicks at a slow rate of 1 request per 10 seconds, they’d have a program running in a data center possibly making all 5 requests in a second.
This agent is simple, but now imagine many thousands of these — some benign, some not — running at datacenter speeds. This is the challenge origins will face.
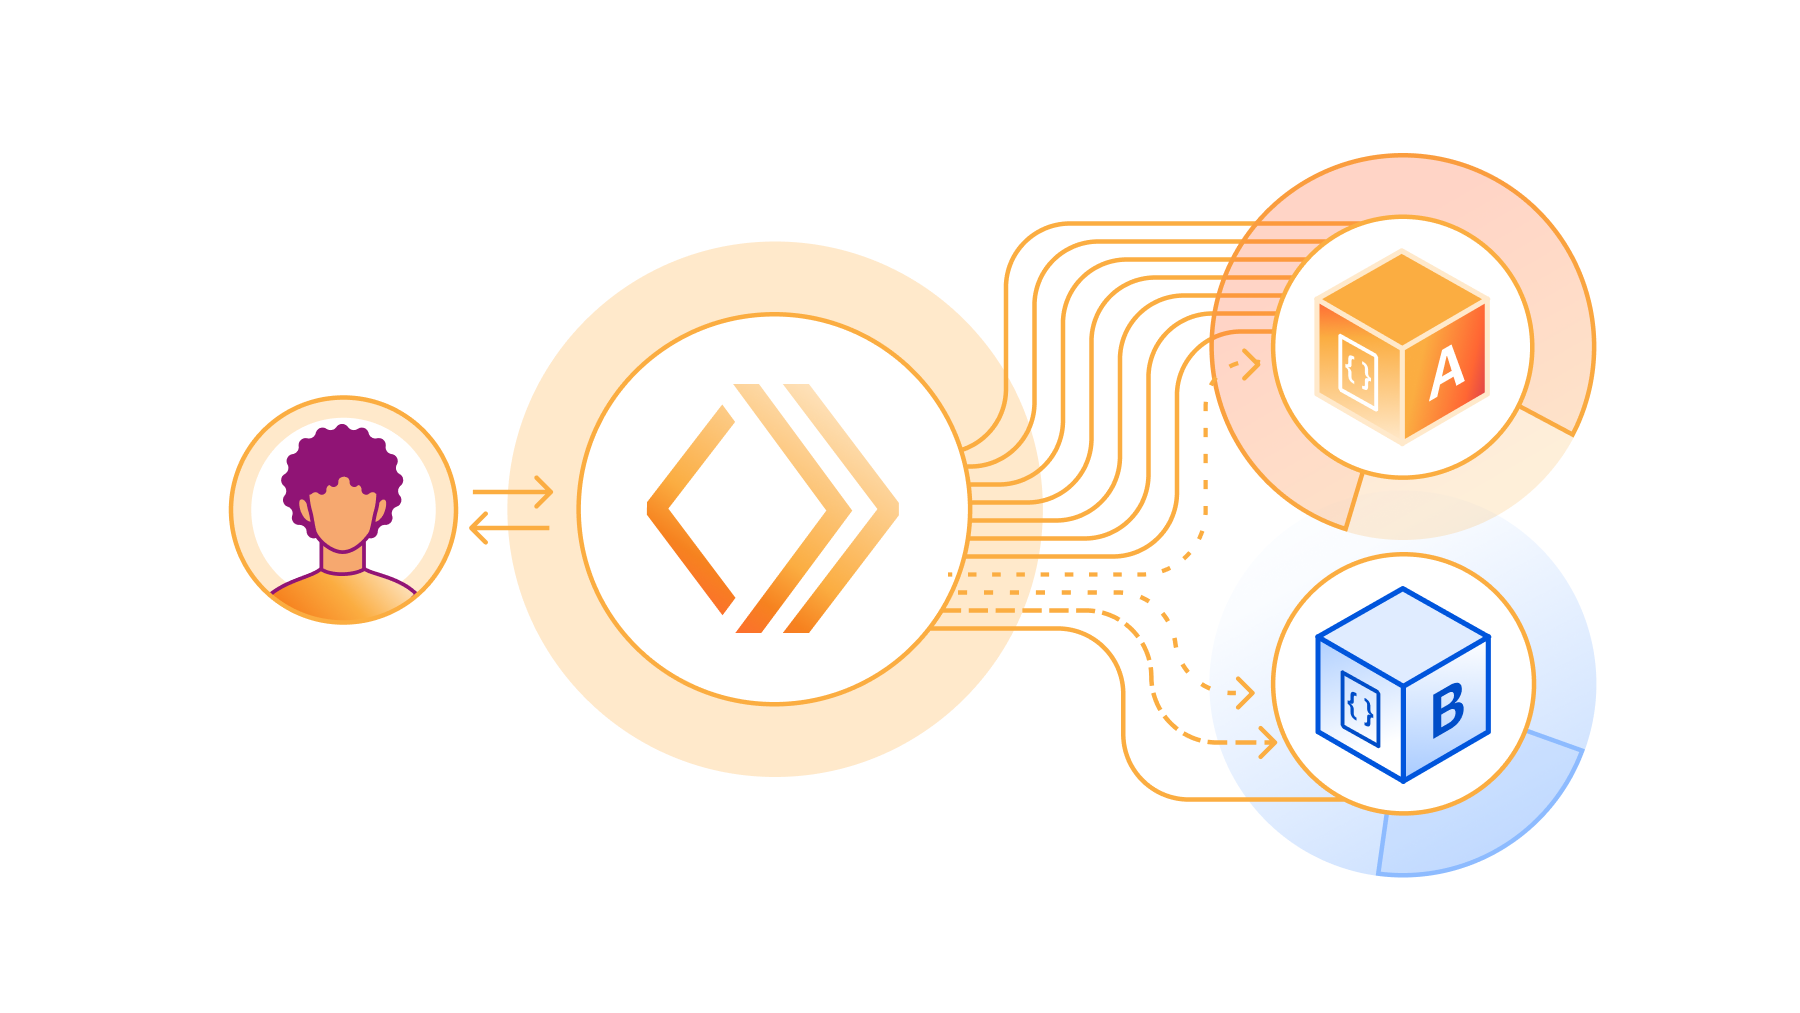
For humans to interact with the online world, they need a web browser and some peripherals with which to direct the behavior of that browser. Agents are another way of directing a browser, so it may be tempting to think that not much is actually changing from the origin’s point of view. Indeed, the most obvious change from the origin’s point of view is merely where traffic comes from:

The reason this change is significant has to do with the tools the server has to manage traffic. Websites generally try to be as permissive as possible, but they also need to manage finite resources (bandwidth, CPU, memory, storage, and so on). There are a few basic ways to do this:
-
Global security policy: A server may opt to slow down, CAPTCHA, or even temporarily block requests from all users. This policy may be applied to an entire site, a specific resource, or to requests classified as being part of a known or likely attack pattern. Such mechanisms may be deployed in reaction to an observed spike in traffic, as in a DDoS attack, or in anticipation of a spike in legitimate traffic, as in Waiting Room.
-
Incentives: Servers sometimes try to incentivize users to use the site when more resources are available. For instance, a server price may be lower depending on the location or request time. This could be implemented with a Cloudflare Snippet.
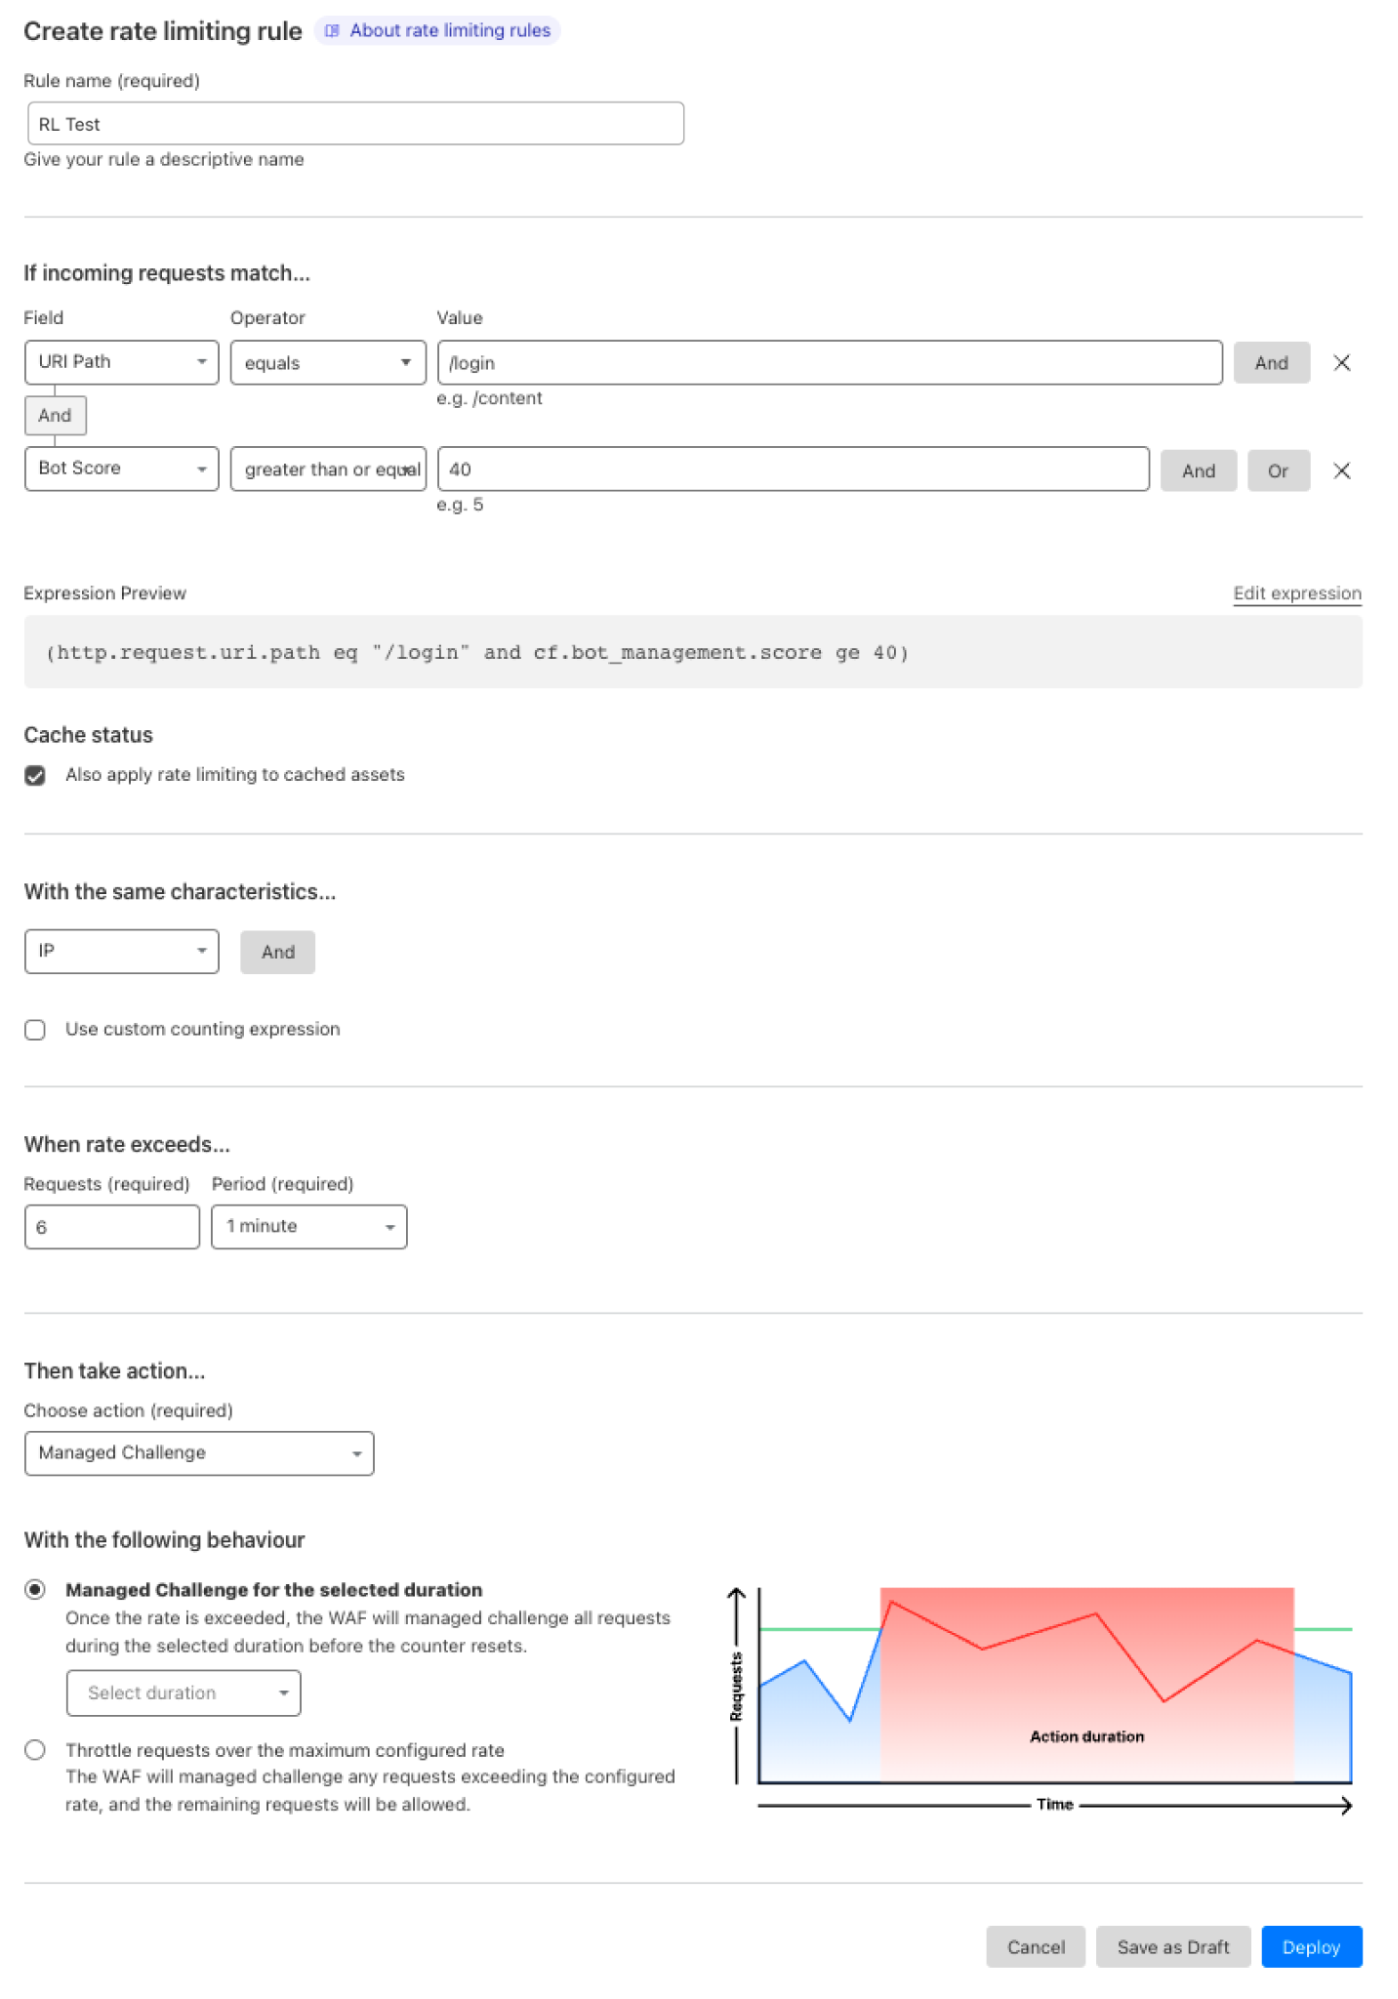
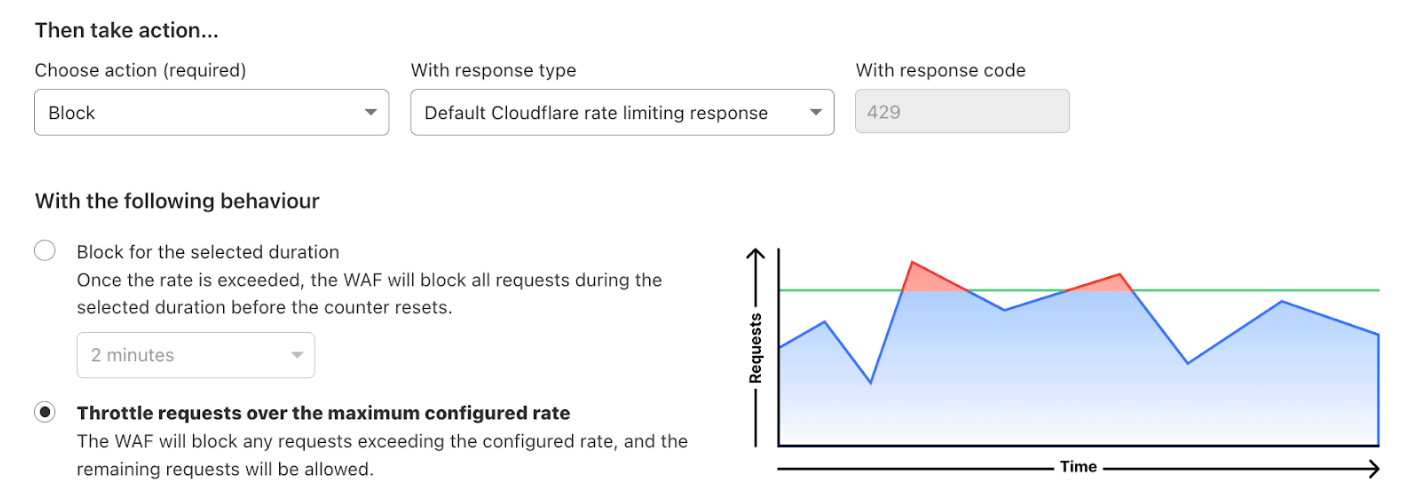
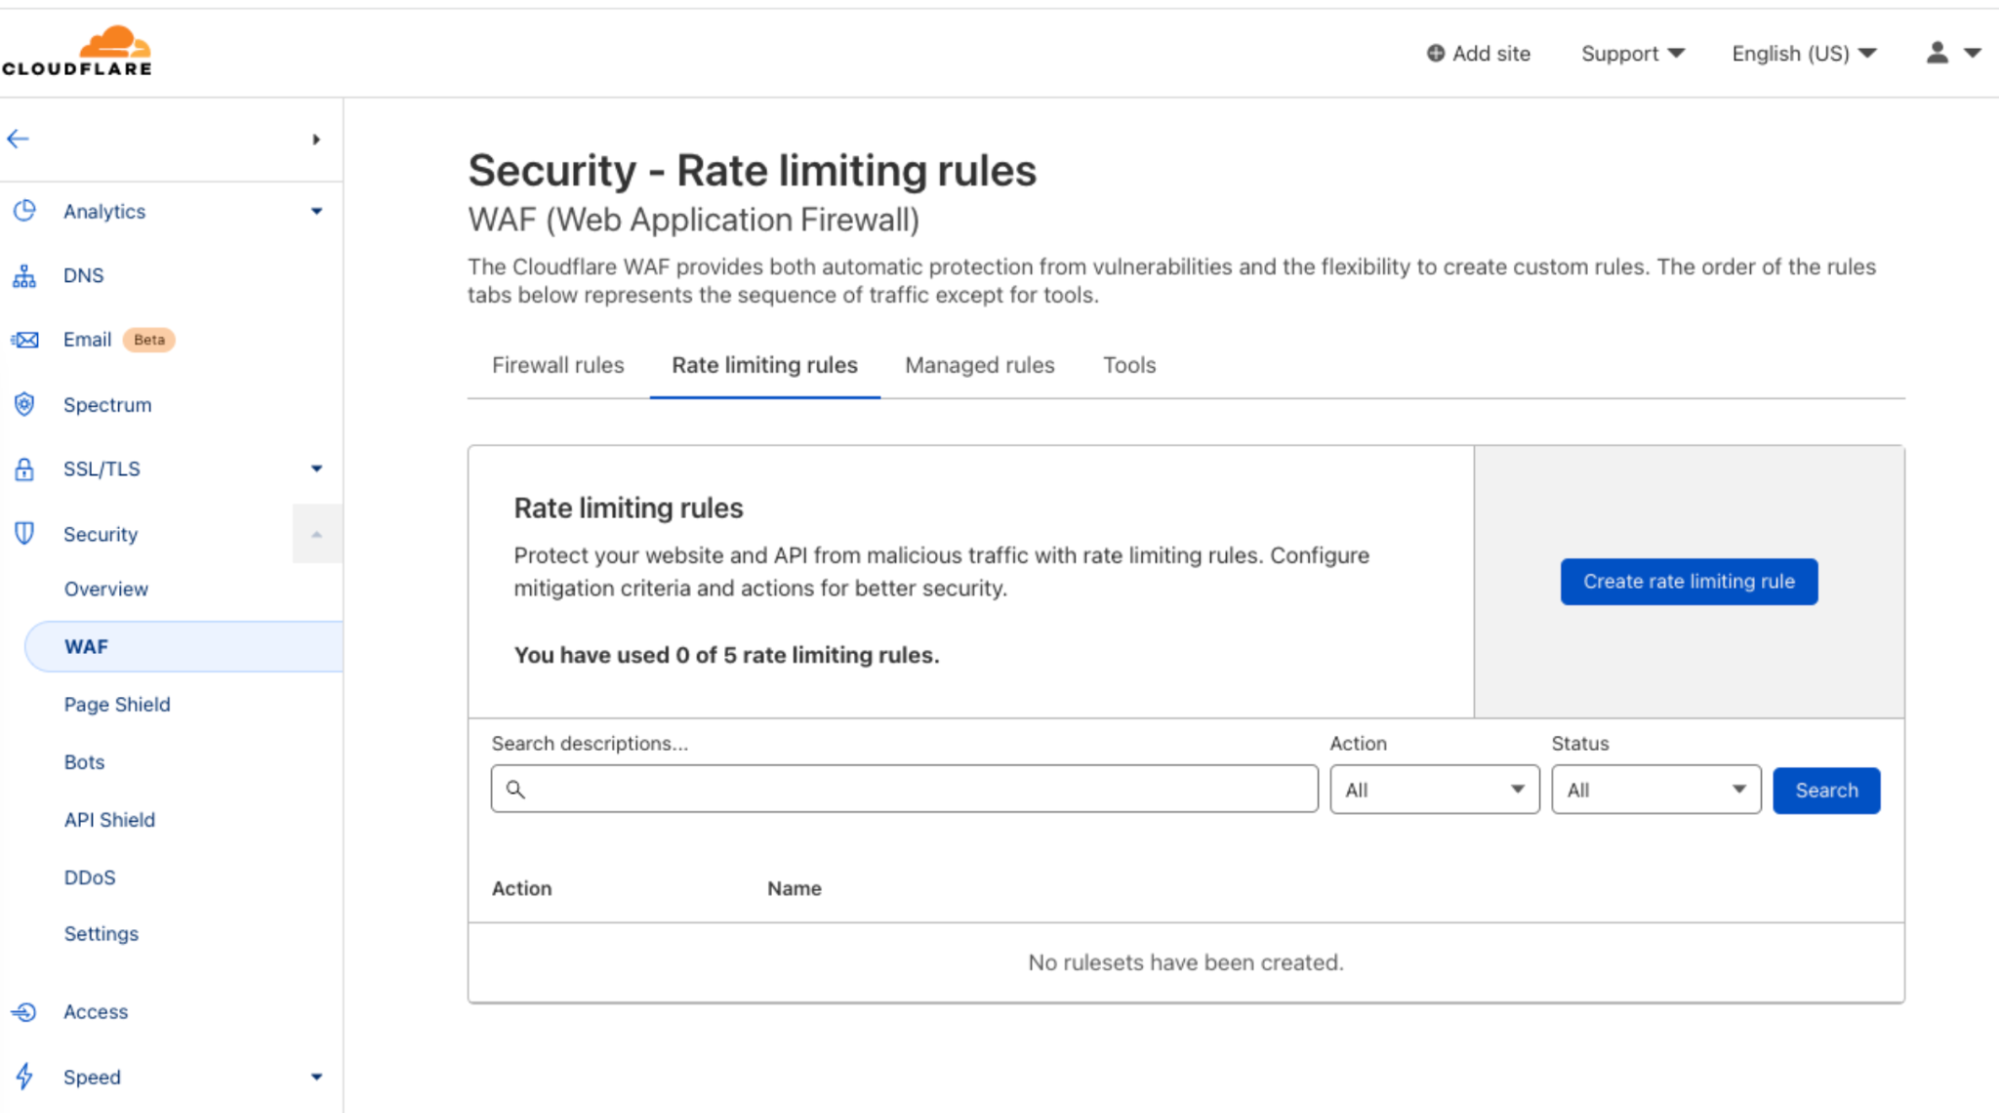
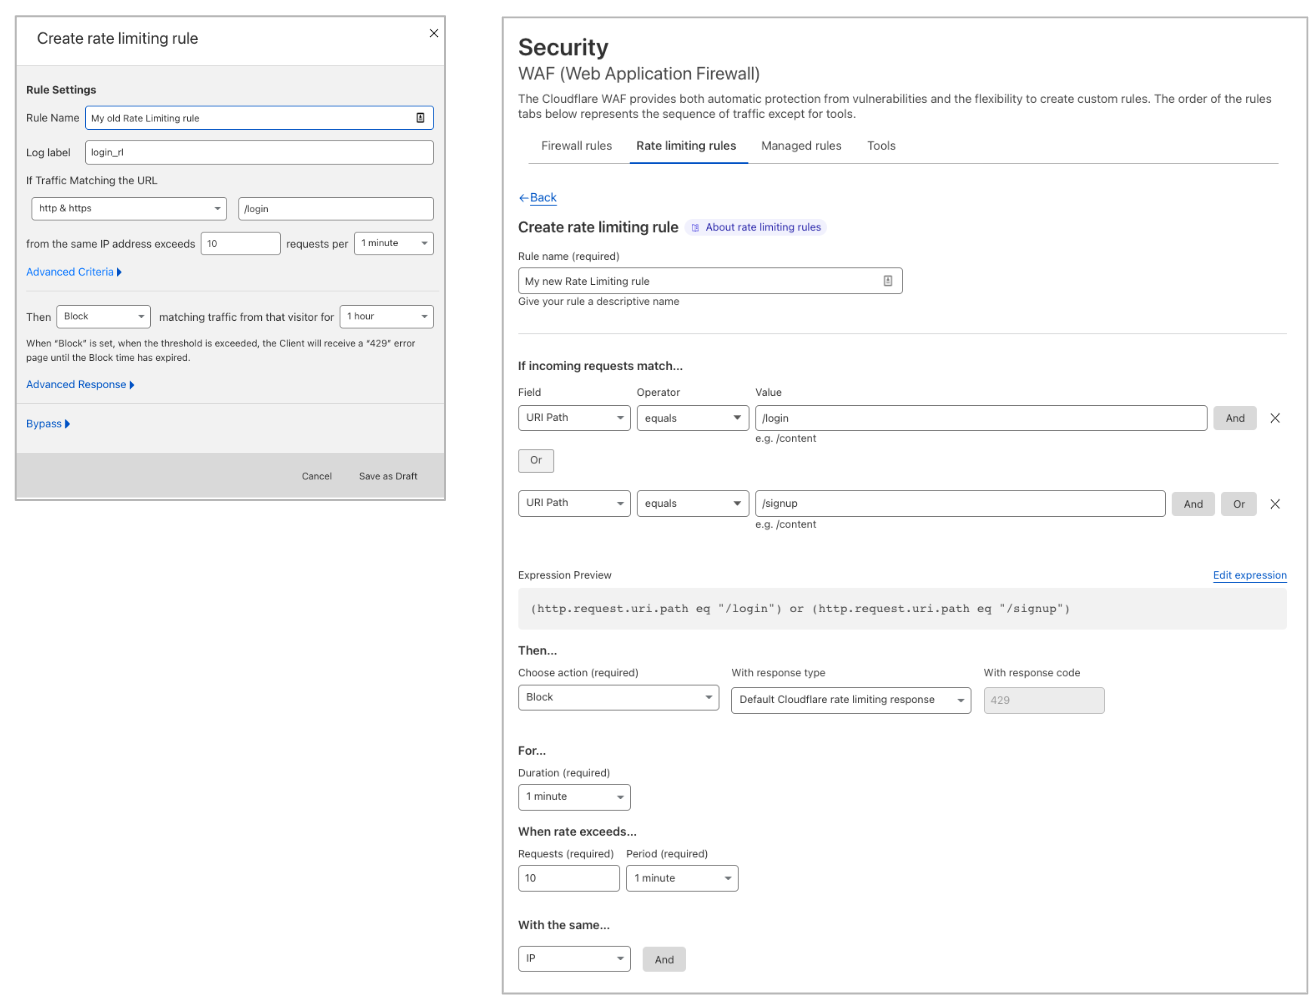
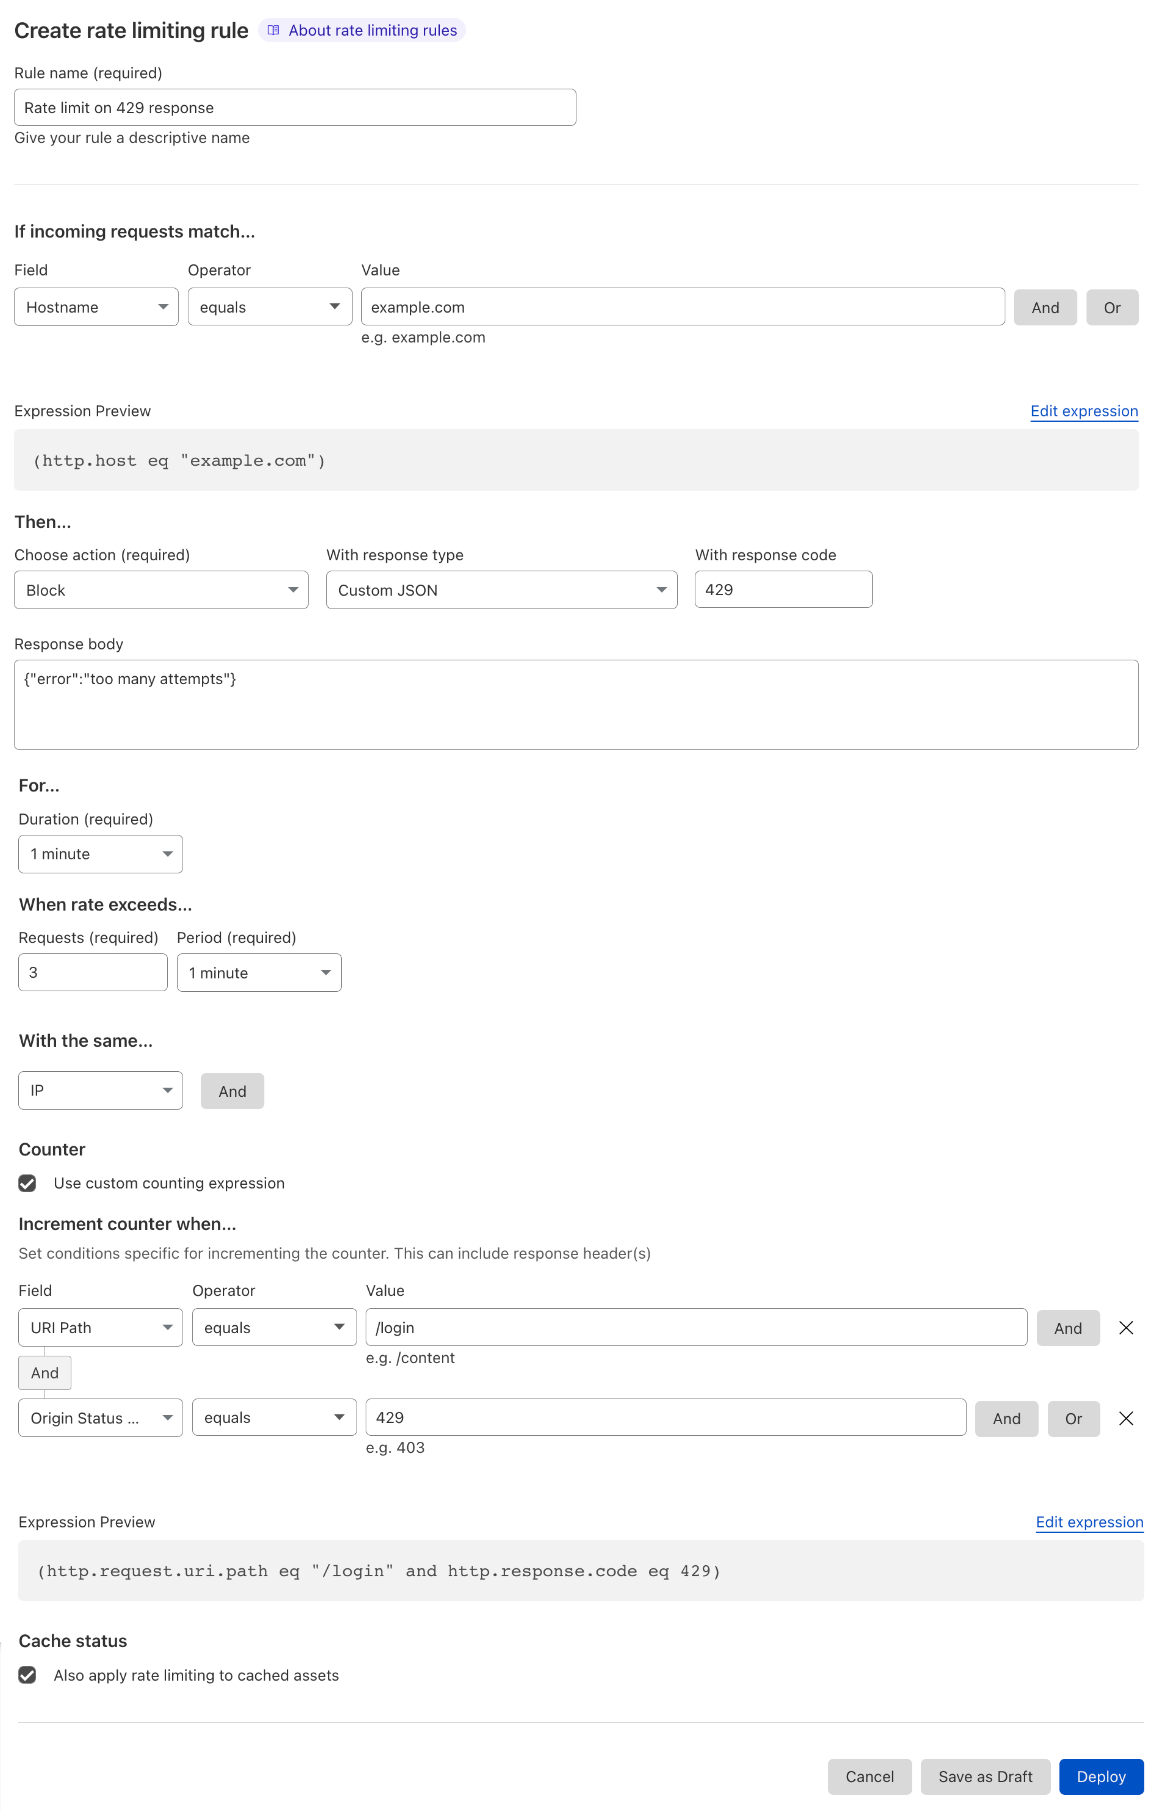
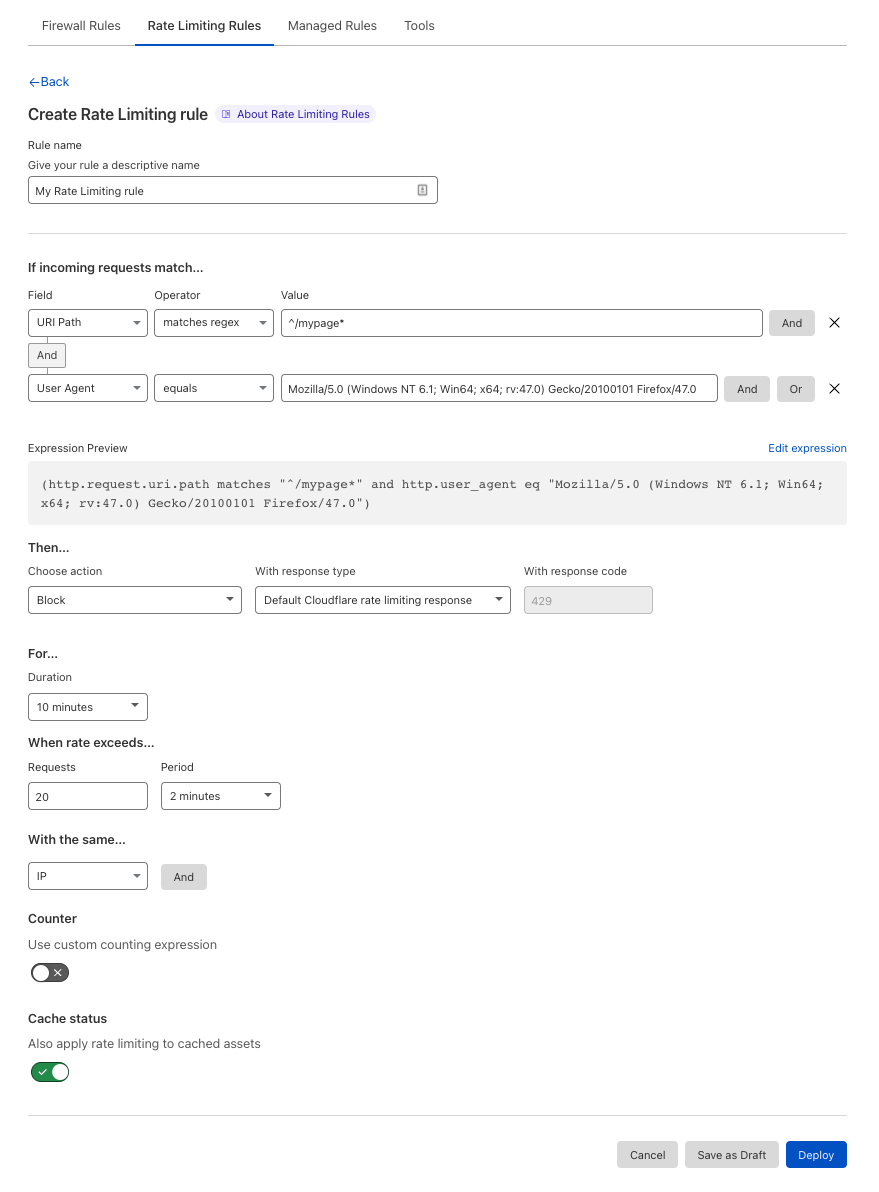
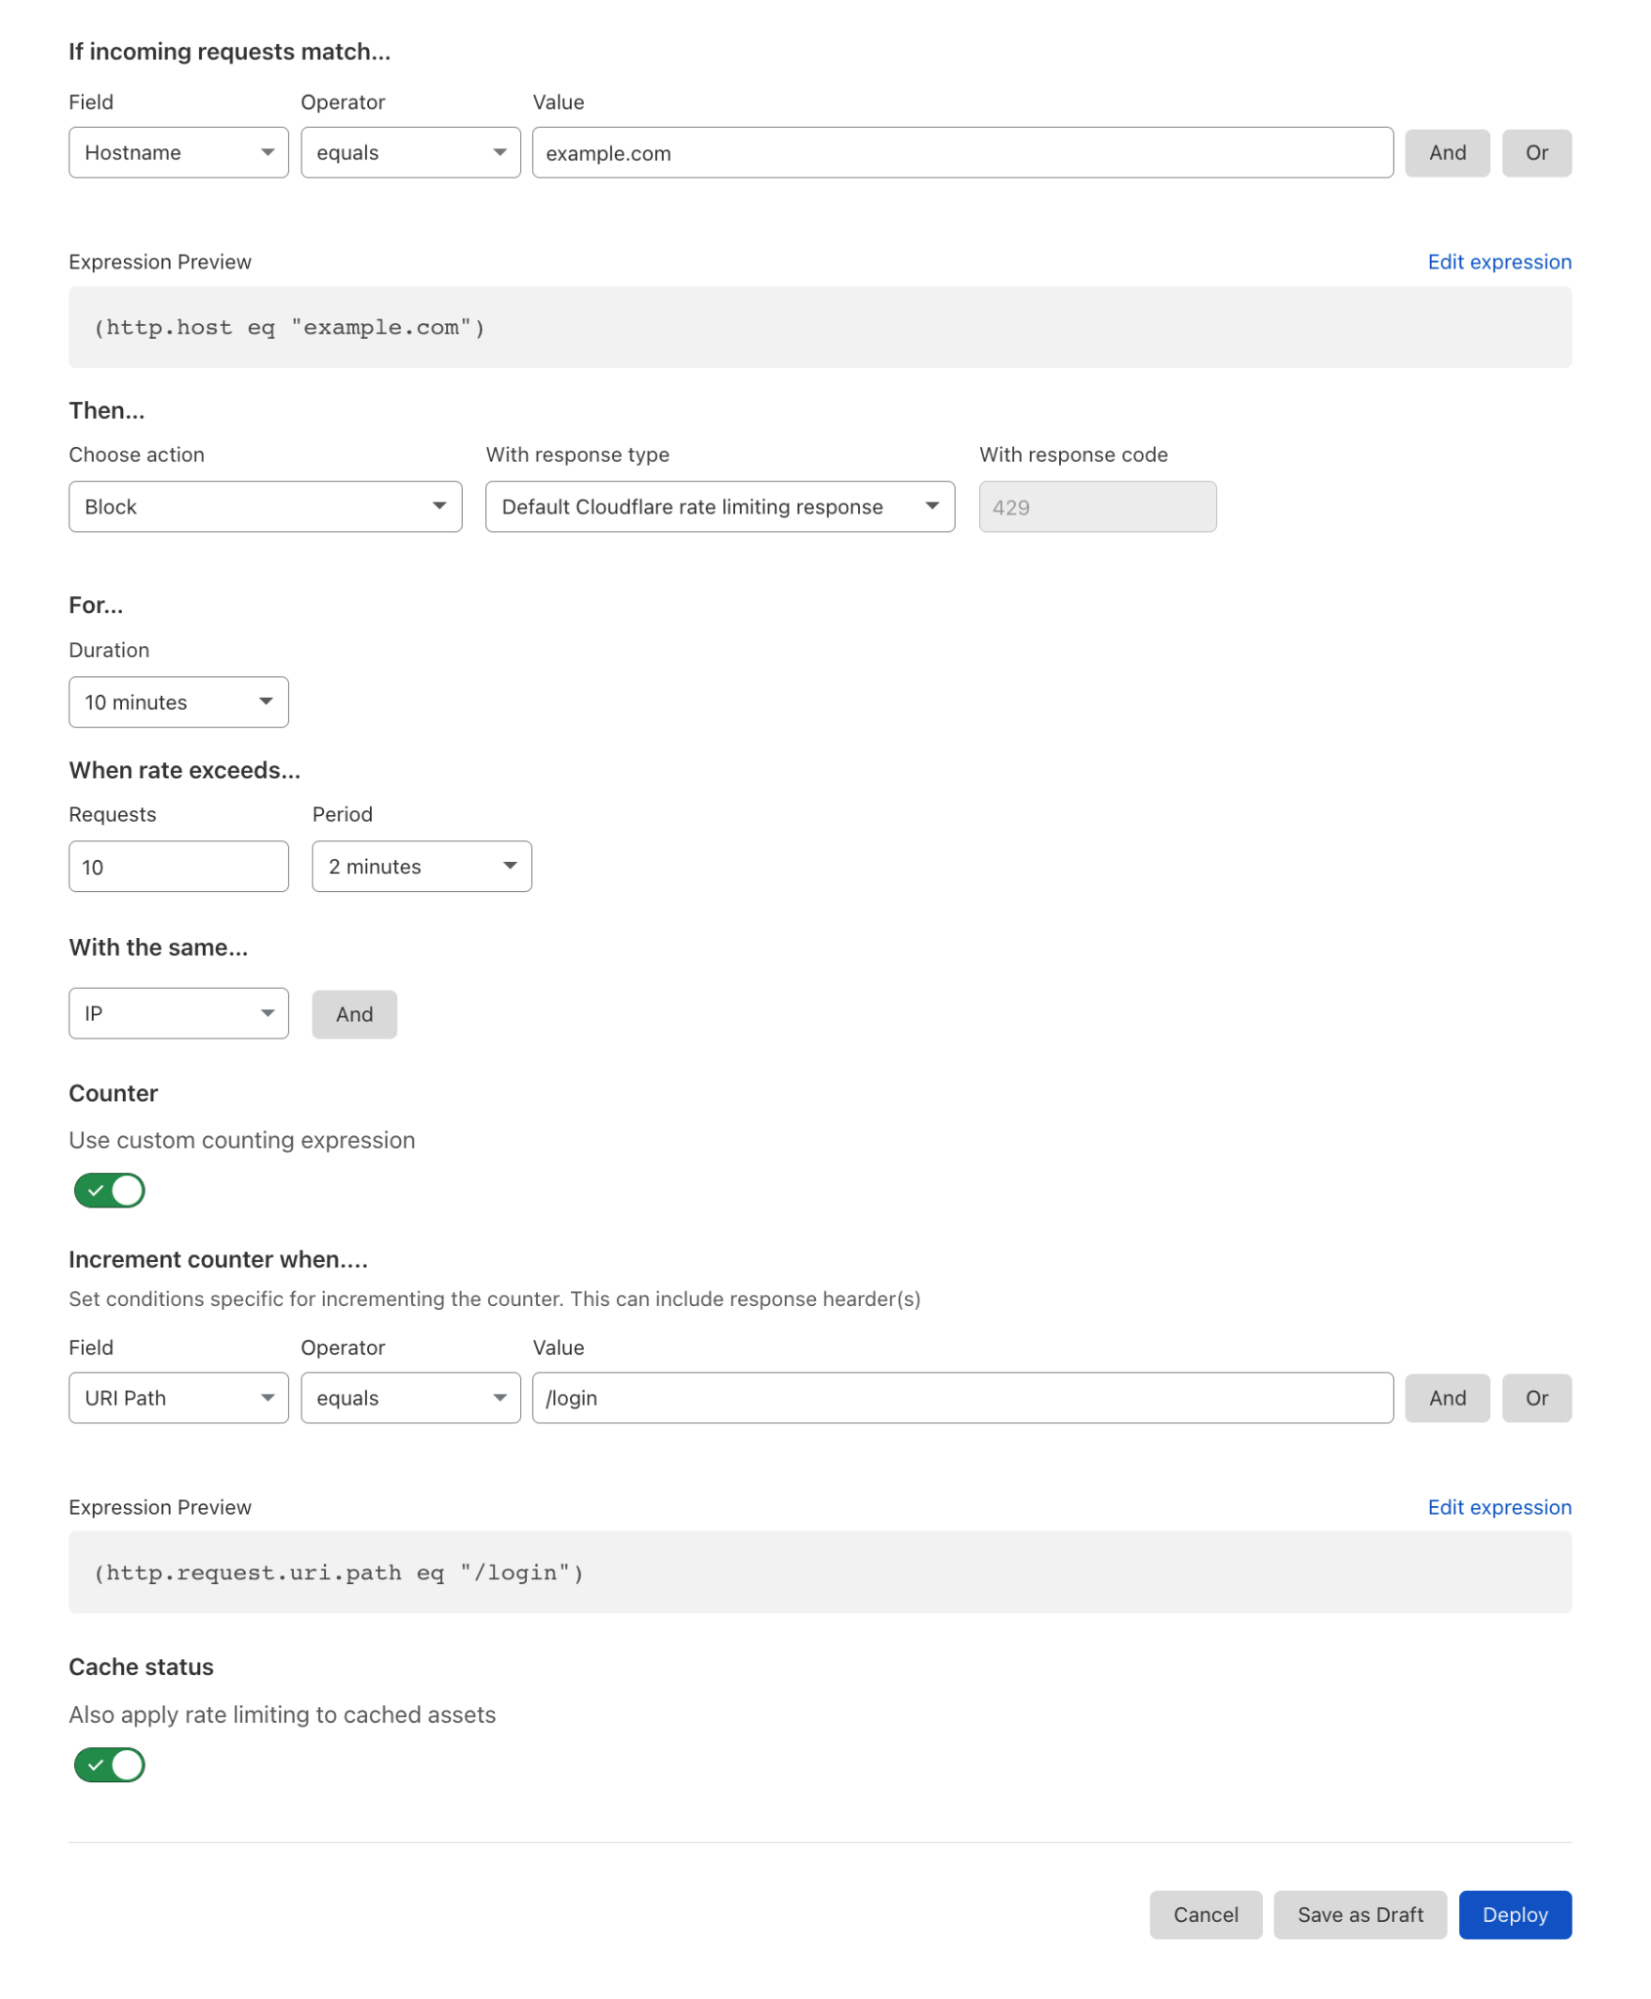
While both tools can be effective, they also sometimes cause significant collateral damage. For example, while rate limiting a website’s login endpoint can help prevent credential stuffing attacks, it also degrades the user experience for non-attackers. Before resorting to such measures, servers will first try to apply the security policy (whether a rate limit, a CAPTCHA, or an outright block) to individual users or groups of users.
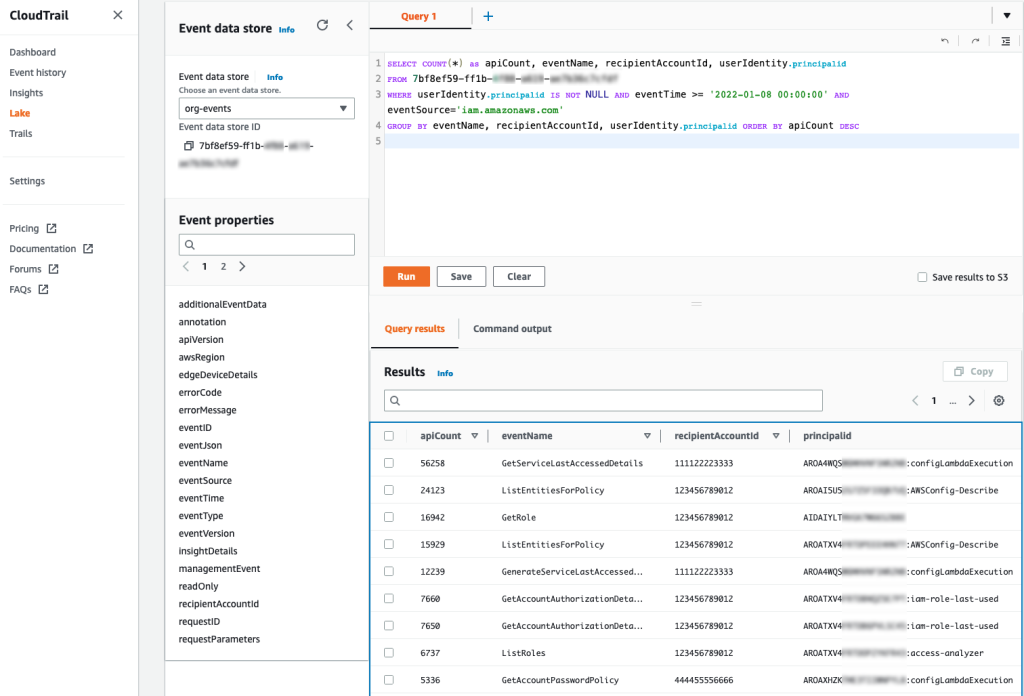
However, in order to apply a security policy to individuals, the server needs some way of identifying them. Historically, this has been done via some combination of IP addresses, User-Agent, an account tied to the user identity (if available), and other fingerprints. Like most cloud service providers, Cloudflare has a dedicated offering for per-user rate limits based on such heuristics.
Fingerprinting works for the most part. However, it’s unequitably distributed. On mobile, users have an especially difficult time solving CAPTCHAs, when using a VPN they’re more likely to be blocked, and when using reading mode they can mess up their fingerprint, preventing rendering of the page.
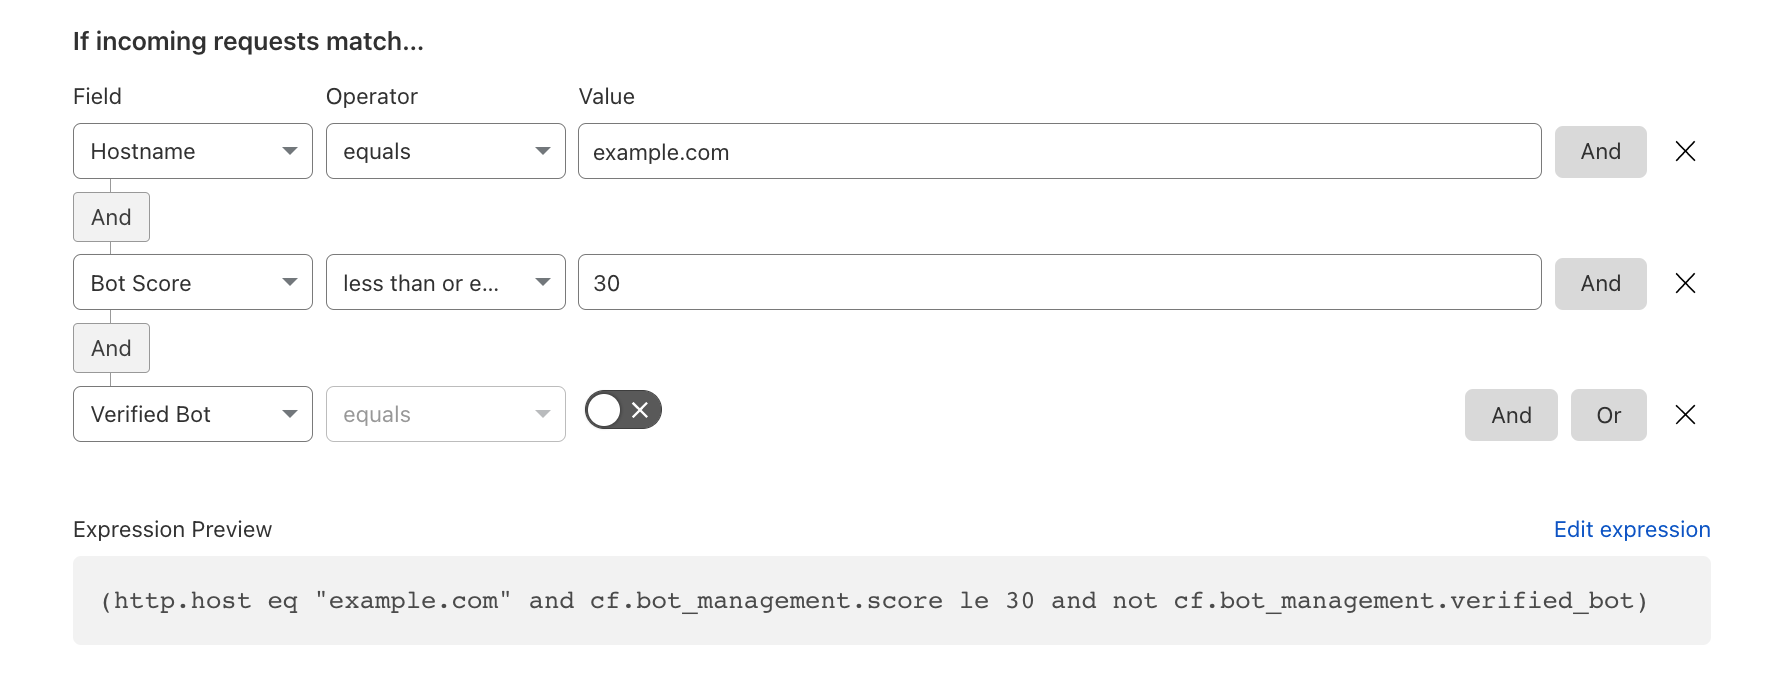
Likewise, agentic AI only exacerbates the limitations of fingerprinting. Not only will more traffic be concentrated on a smaller source IP range, the agents themselves will run the same software and hardware platform, making it harder to distinguish honest from malicious users.
Something that could help is Web Bot Auth, which would allow agents to identify to the origin which platform they’re operated by. However, we wouldn’t want to extend this mechanism — intended for identifying the platform itself — to identifying individual users of the platforms, as this would create an unacceptable privacy risk for these users.
We need some way of implementing security controls for individual users without identifying them. But how? The Privacy Pass protocol provides a partial solution.
Today, one of the most prominent use cases for Privacy Pass is to rate limit requests from a user to an origin, as we have discussed before. The protocol works roughly as follows. The client is issued a number of tokens. Each time it wants to make a request, it redeems one of its tokens to the origin; the origin allows the request through only if the token is fresh, i.e., has never been observed before by the origin.
In order to use Privacy Pass for per-user rate-limiting, it’s necessary to limit the number of tokens issued to each user (e.g., 100 tokens per user per hour). To rate limit an AI agent, this role would be fulfilled by the AI platform. To obtain tokens, the user would log in with the platform, and said platform would allow the user to get tokens from the issuer. The AI platform fulfills the attester role in Privacy Pass parlance. The attester is the party guaranteeing the per-user property of the rate limit. The AI platform, as an attester, is incentivized to enforce this token distribution as it stakes its reputation: Should it allow for too many tokens to be issued, the issuer could distrust them.

The issuance and redemption protocols are designed to have two properties:
-
Tokens are unforgeable: only the issuer can issue valid tokens.
-
Tokens are unlinkable: no party, including the issuer, attester, or origin, can tell which user a token was issued to.
These properties can be achieved using a cryptographic primitive called a blind signature scheme. In a conventional signature scheme, the signer uses its private key to produce a signature for a message. Later on, a verifier can use the signer’s public key to verify the signature. Blind signature schemes work in the same way, except that the message to be signed is blinded such that the signer doesn’t know the message it’s signing. The client “blinds” the message to be signed and sends it to the server, which then computes a blinded signature over the blinded message. The client obtains the final signature by unblinding the signature.
This is exactly how the standardised Privacy Pass issuance protocols are defined by RFC 9578:
-
Issuance: The user generates a random message
$k$
which we call the
nullifier. Concretely, this is just a random, 32-byte string. It then blinds the nullifier and sends it to the issuer. The issuer replies with a blind signature. Finally, the user unblinds the signature to get
$\sigma$,
a signature for the nullifier
$k$. The token is the pair
$(k, \sigma)$. -
Redemption: When the user presents
$(k, \sigma)$,
the origin checks that
$\sigma$
is a valid signature for the nullifier
$k$
and that
$k$
is fresh. If both conditions hold, then it accepts and lets the request through.
Blind signatures are simple, cheap, and perfectly suited for many applications. However, they have some limitations that make them unsuitable for our use case.
First, the communication cost of the issuance protocol is too high. For each token issued, the user sends a 256-byte, blinded nullifier and the issuer replies with a 256-byte blind signature (assuming RSA-2048 is used). That’s 0.5KB of additional communication per request, or 500KB for every 1,000 requests. This is manageable as we’ve seen in a previous experiment for Privacy Pass, but not ideal. Ideally, the bandwidth would be sublinear in the rate limit we want to enforce. An alternative to blind signatures with lower compute time are Oblivious Pseudorandom Functions (VOPRF), but the bandwidth is still asymptotically linear. We’ve discussed them in the past, as they served as the basis for early deployments of Privacy Pass.
Second, blind signatures can’t be used to rate-limit on a per-origin basis. Ideally, when issuing $N$ tokens to the client, the client would be able to redeem at most $N$ tokens at any origin server that can verify the token’s validity. However, the client can’t safely redeem the same token at more than one server because it would be possible for the servers to link those redemptions to the same client. What’s needed is some mechanism for what we’ll call late origin-binding: transforming a token for redemption at a particular origin in a way that’s unlinkable to other redemptions of the same token.
Third, once a token is issued, it can’t be revoked: it remains valid as long as the issuer’s public key is valid. This makes it impossible for an origin to block a specific user if it detects an attack, or if its tokens are compromised. The origin can block the offending request, but the user can continue to make requests using its remaining token budget.
As noted by Chaum in 1985, an anonymous credential system allows users to obtain a credential from an issuer, and later prove possession of this credential, in an unlinkable way, without revealing any additional information. Also, it is possible to demonstrate that some attributes are attached to the credential.
One way to think of an anonymous credential is as a kind of blind signature with some additional capabilities: late-binding (link a token to an origin after issuance), multi-show (generate multiple tokens from a single issuer response), and expiration distinct from key rotation (token validity decoupled of the issuer cryptographic key validity). In the redemption flow for Privacy Pass, the client presents the unblinded message and signature to the server. To accept the redemption, the server needs to verify the signature. In an AC system, the client only presents a part of the message. In order for the server to accept the request, the client needs to prove to the server that it knows a valid signature for the entire message without revealing the whole thing.
The flow we described above would therefore include this additional presentation step.

Note that the tokens generated through blind signatures or VOPRFs can only be used once, so they can be regarded as single-use tokens. However, there exists a type of anonymous credentials that allows tokens to be used multiple times. For this to work, the issuer grants a credential to the user, who can later derive at most N many single-use tokens for redemption. Therefore, the user can send multiple requests, at the expense of a single issuance session.
The table below describes how blind signatures and anonymous credentials provide features of interest to rate limiting.
|
Feature |
Blind Signature |
Anonymous Credential |
|
Issuing Cost |
Linear complexity: issuing 10 signatures is 10x as expensive as issuing one signature |
Sublinear complexity: signing 10 attributes is cheaper than 10 individual signatures |
|
Proof Capability |
Only prove that a message has been signed |
Allow efficient proving of partial statements (i.e., attributes) |
|
State Management |
Stateless |
Stateful |
|
Attributes |
No attributes |
Public (e.g. expiry time) and private state |
Let’s see how a simple anonymous credential scheme works. The client’s message consists of the pair
$(k, C)$,
where
$k$
is a
nullifier and
$C$
is a
counter representing the remaining number of times the client can access a resource. The value of the counter is controlled by the server: when the client redeems its credential, it presents both the nullifier and the counter. In response, the server checks that signature of the message is valid and that the nullifier is fresh, as before. Additionally, the server also
-
checks that the counter is greater than zero; and
-
decrements the counter issuing a new credential for the updated counter and a fresh nullifier.
A blind signature could be used to meet this functionality. However, whereas the nullifier can be blinded as before, it would be necessary to handle the counter in plaintext so that the server can check that the counter is valid (Step 1) and update it (Step 2). This creates an obvious privacy risk since the server, which is in control of the counter, can use it to link multiple presentations by the same client. For example, when you reach out to buy a pepperoni pizza, the origin could assign you a special counter value, which eases fingerprinting when you present it a second time. Fortunately, there exist anonymous credentials designed to close this kind of privacy gap.
The scheme above is a simplified version of Anonymous Credit Tokens (ACT), one of the anonymous credential schemes being considered for adoption by the Privacy Pass working group at IETF. The key feature of ACT is its statefulness: upon successful redemption, the server re-issues a new credential with updated nullifier and counter values. This creates a feedback loop between the client and server that can be used to express a variety of security policies.
By design, it’s not possible to present ACT credentials multiple times simultaneously: the first presentation must be completed so that the re-issued credential can be presented in the next request. Parallelism is the key feature of Anonymous Rate-limited Credential (ARC), another scheme under discussion at the Privacy Pass working group. ARCs can be presented across multiple requests in parallel up to the presentation limit determined during issuance.
Another important feature of ARC is its support for late origin-binding: when a client is issued an ARC with presentation limit $N$, it can safely use its credential to present up to $N$ times to any origin that can verify the credential.
These are just examples of relevant features of some anonymous credentials. Some applications may benefit from a subset of them; others may need additional features. Fortunately, both ACT and ARC can be constructed from a small set of cryptographic primitives that can be easily adapted for other purposes.
ARC and ACT share two primitives in common: algebraic MACs, which provide for limited computations on the blinded message; and zero-knowledge proofs (ZKP) for proving validity of the part of the message not revealed to the server. Let’s take a closer look at each.
A Message Authenticated Code (MAC) is a cryptographic tag used to verify a message’s authenticity (that it comes from the claimed sender) and integrity (that it has not been altered). Algebraic MACs are built from mathematical structures like group actions. The algebraic structure gives them some additional functionality, one of them being a homomorphism that we can blind easily to conceal the actual value of the MAC. Adding a random value on an algebraic MAC blinds the value.
Unlike blind signatures, both ACT and ARC are only privately verifiable, meaning the issuer and the origin must both have the issuer’s private key. Taking Cloudflare as an example, this means that a credential issued by Cloudflare can only be redeemed by an origin behind Cloudflare. Publicly verifiable variants of both are possible, but at an additional cost.
Zero knowledge proofs (ZKP) allow us to prove a statement is true without revealing the exact value that makes the statement true. The ZKP is constructed by a prover in such a way that it can only be generated by someone who actually possesses the secret. The verifier can then run a quick mathematical check on this proof. If the check passes, the verifier is convinced that the prover’s initial statement is valid. The crucial property is that the proof itself is just data that confirms the statement; it contains no other information that could be used to reconstruct the original secret.
For ARC and ACT, we want to prove linear relations of secrets. In ARC, a user needs to prove that different tokens are linked to the same original secret credential. For example, a user can generate a proof showing that a request token was derived from a valid issued credential. The system can verify this proof to confirm the tokens are legitimately connected, all without ever learning the underlying secret credential that ties them together. This allows the system to validate user actions while guaranteeing their privacy.
Proving simple linear relations can be extended to prove a number of powerful statements, for example that a number is in range. For example, this is useful to prove that you have a positive balance on your account. To prove your balance is positive, you prove that you can encode your balance in binary. Let’s say you can at most have 1024 credits in your account. To prove your balance is non-zero when it is, for example, 12, you prove two things simultaneously: first, that you have a set of binary bits, in this case 12=(1100)2, and second, that a linear equation using these bits (8*1 + 4*1 + 2*0 + 1*0) correctly adds up to your total committed balance. This convinces the verifier that the number is validly constructed without them learning the exact value. This is how it works for powers of two, but it can easily be extended to arbitrary ranges.
The mathematical structure of algebraic MACs allows easy blinding and evaluation. The structure also allows for an easy proof that a MAC has been evaluated with the private key without revealing the MAC. In addition, ARC could use ZKPs to prove that a nonce has not been spent before. In contrast, ACT uses ZKPs to prove we have enough of a balance left on our token. The balance is subtracted homomorphically using more group structure.
Anonymous credentials allow for more flexibility, and have the potential to reduce the communication cost, compared to blind signatures in certain applications. To identify such applications, we need to measure the concrete communication cost of these new protocols. In addition, we need to understand how their CPU usage compares to blind signatures and oblivious pseudorandom functions.
We measure the time that each participant spends at each stage of some AC schemes. We also report the size of messages transmitted across the network. For ARC, ACT, and VOPRF, we’ll use ristretto255 as the prime group and SHAKE128 for hashing. For Blind RSA, we’ll use a 2048-bit modulus and SHA-384 for hashing.
Each algorithm was implemented in Go, on top of the CIRCL library. We plan to open source the code once the specifications of ARC and ACT begin to stabilize.
Let’s take a look at the most widely used deployment in Privacy Pass: Blind RSA. Redemption time is low, and most of the cost lies with the server at issuance time. Communication cost is mostly constant and in the order of 256 bytes.
| Blind RSA RFC9474(RSA-2048+SHA384) |
1 Token | ||
|---|---|---|---|
| Time | Message Size | ||
| Issuance | Client (Blind) | 63 µs | 256 B |
| Server (Evaluate) | 2.69 ms | 256 B | |
| Client (Finalize) | 37 µs | 256 B | |
| Redemption | Client | – | 300 B |
| Server | 37 µs | – |
When looking at VOPRF, verification time on the server is slightly higher than for Blind RSA, but communication cost and issuance are much faster. Evaluation time on the server is 10x faster for 1 token, and more than 25x faster when using amortized token issuance. Communication cost per token is also more appealing, with a message size at least 3x lower.
| VOPRF RFC9497(Ristretto255+SHA512) |
1 Token | 1000 Amortized issuances | |||
|---|---|---|---|---|---|
| Time | Message Size | Time (per token) |
Message Size (per token) |
||
| Issuance | Client (Blind) | 54 µs | 32 B | 54 µs | 32 B |
| Server (Evaluate) | 260 µs | 96 B | 99 µs | 32.064 B | |
| Client (Finalize) | 376 µs | 64 B | 173 µs | 64 B | |
| Redemption | Client | – | 96 B | – | |
| Server | 57 µs | – |
This makes VOPRF tokens appealing for applications requiring a lot of tokens that can accept a slightly higher redemption cost, and that don’t need private verifiability.
Now, let’s take a look at the figures for ARC and ACT anonymous credential schemes. For both schemes we measure the time to issue a credential that can be presented at most $N=1000$ times.
| Issuance Credential Generation |
ARC | ACT | ||
|---|---|---|---|---|
| Time | Message Size | Time | Message Size | |
| Client (Request) | 323 µs | 224 B | 64 µs | 141 B |
| Server (Response) | 1349 µs | 448 B | 251 µs | 176 B |
| Client (Finalize) | 1293 µs | 128 B | 204 µs | 176 B |
| Redemption Credential Presentation |
ARC | ACT | ||
| Time | Message Size | Time | Message Size | |
| Client (Present) | 735 µs | 288 B | 1740 µs | 1867 B |
| Server (Verify/Refund) | 740 µs | – | 1785 µs | 141 B |
| Client (Update) | – | – | 508 µs | 176 B |
As we would hope, the communication cost and the server’s runtime is much lower than a batched issuance with either Blind RSA or VOPRF. For example, a VOPRF issuance of 1000 tokens takes 99 ms (99 µs per token) vs 1.35 ms for issuing one ARC credential that allows for 1000 presentations. This is about 70x faster. The trade-off is that presentation is more expensive, both for the client and server.
How about ACT? Like ARC, we would expect the communication cost of issuance grows much slower with respect to the credits issued. Our implementation bears this out. However, there are some interesting performance differences between ARC and ACT: issuance is much cheaper for ACT than it is for ARC, but redemption is the opposite.
What’s going on? The answer has largely to do with what each party needs to prove with ZKPs at each step. For example, during ACT redemption, the client proves to the server (in zero-knowledge) that its counter $C$ is in the desired range, i.e., $0 \leq C \leq N$. The proof size is on the order of $\log_{2} N$, which accounts for the larger message size. In the current version, ARC redemption does not involve range proofs, but a range proof may be added in a future version. Meanwhile, the statements the client and server need to prove during ARC issuance are a bit more complicated than for ARC presentation, which accounts for the difference in runtime there.
The advantage of anonymous credentials, as discussed in the previous sections, is that issuance only has to be performed once. When a server evaluates its cost, it takes into account the cost of all issuances and the cost of all verifications. At present, only accounting for credentials costs, it’s cheaper for a server to issue and verify tokens than verify an anonymous credential presentation.
The advantage of multiple-use anonymous credentials is that instead of the issuer generating $N$ tokens, the bulk of computation is offloaded to the clients. This is more scoped. Late origin binding allows them to work for multiple origins/namespace, range proof to decorrelate expiration from key rotation, and refund to provide a dynamic rate limit. Their current applications are dictated by the limitation of single-use token based schemes, more than by the added efficiency they provide. This seems to be an exciting area to explore, and see if closing the gap is possible.
Managing agents will likely require features from both ARC and ACT.
ARC already has much of the functionality we need: it supports rate limiting, is communication-efficient, and it supports late origin-binding. Its main downside is that, once an ARC credential is issued, it can’t be revoked. A malicious user can always make up to N requests to any origin it wants.
We can allow for a limited form of revocation by pairing ARC with blind signatures (or VOPRF). Each presentation of the ARC credential is accompanied by a Privacy Pass token: upon successful presentation, the client is issued another Privacy Pass token it can use during the next presentation. To revoke a credential, the server would simply not re-issue the token:

This scheme is already quite useful. However, it has some important limitations:
-
Parallel presentation across origins is not possible: the client must wait for the request to one origin to succeed before it can initiate a request to a second origin.
-
Revocation is global rather than per-origin, meaning the credential is not only revoked for the origin to whom it was presented, but for every origin it can be presented to. We suspect this will be undesirable in some cases. For example, an origin may want to revoke if a request violates its
robots.txtpolicy; but the same request may have been accepted by other origins.
A more fundamental limitation of this design is that the decision to revoke can only be made on the basis of a single request — the one in which the credential was presented. It may be risky to decide to block a user on the basis of a single request; in practice, attack patterns may only emerge across many requests. ACT’s statefulness enables at least a rudimentary form of this kind of defense. Consider the following scheme:
-
Issuance: The client is issued an ARC with presentation limit $N=1$.
-
Presentation:
-
When the client presents its ARC credential to an origin for the first time, the server issues an ACT credential with a valid initial state.
-
When the client presents an ACT with valid state (e.g., credit counter greater than 0), the origin either:
-
refuses to issue a new ACT, thereby revoking the credential. It would only do so if it had high confidence that the request was part of an attack; or
-
issues a new ACT with state updated to reduce the ACT credit by the amount of resources consumed while processing the request.
-
-
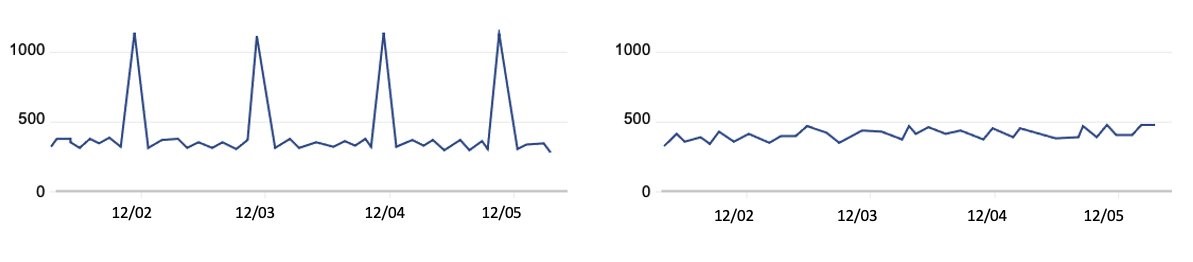
Benign requests wouldn’t change the state by much (if at all), but suspicious requests might impact the state in a way that gets the user closer to their rate limit much faster.
To see how this idea works in practice, let’s look at a working example that uses the Model Context Protocol. The demo below is built using MCP Tools. Tools are extensions the AI agent can call to extend its capabilities. They don’t need to be integrated at release time within the MCP client. This provides a nice and easy prototyping avenue for anonymous credentials.
Tools are offered by the server via an MCP compatible interface. You can see details on how to build such MCP servers in a previous blog.
In our pizza context, this could look like a pizzeria that offers you a voucher. Each voucher gets you 3 pizza slices. Mocking a design, an integration within a chat application could look as follows:


The first panel presents all tools exposed by the MCP server. The second one showcases an interaction performed by the agent calling these tools.
To look into how such a flow would be implemented, let’s write the MCP tools, offer them in an MCP server, and manually orchestrate the calls with the MCP Inspector.
The MCP server should provide two tools:
-
act-issuewhich issues an ACT credential valid for 3 requests. The code used here is an earlier version of the IETF draft which has some limitations. -
act-redeemmakes a presentation of the local credential, and fetches our pizza menu.
First, we run act-issue. At this stage, we could ask the agent to run an OAuth flow, fetch an internal authentication endpoint, or to compute a proof of work.

This gives us 3 credits to spend against an origin. Then, we run act-redeem

Et voilà. If we run act-redeem once more, we see we have one fewer credit.

You can test it yourself, here are the source codes available. The MCP server is written in Rust to integrate with the ACT rust library. The browser-based client works similarly, check it out.
In this post, we’ve presented a concrete approach to rate limit agent traffic. It is in full control of the client, and is built to protect the user’s privacy. It uses emerging standards for anonymous credentials, integrates with MCP, and can be readily deployed on Cloudflare Workers.
We’re on the right track, but there are still questions that remain. As we touched on before, a notable limitation of both ARC and ACT is that they are only privately verifiable. This means that the issuer and origin need to share a private key, for issuing and verifying the credential respectively. There are likely to be deployment scenarios for which this isn’t possible. Fortunately, there may be a path forward for these cases using pairing-based cryptography, as in the BBS signature specification making its way through IETF. We’re also exploring post-quantum implications in a concurrent post.
If you are an agent platform, an agent developer, or a browser, all our code is available on GitHub for you to experiment. Cloudflare is actively working on vetting this approach for real-world use cases.
The specification and discussion are happening within the IETF and W3C. This ensures the protocols are built in the open, and receive participation from experts. Improvements are still to be made to clarify the right performance-to-privacy tradeoff, or even the story to deploy on the open web.
If you’d like to help us, we’re hiring 1,111 interns over the course of next year, and have open positions.