Post Syndicated from Tanushree Sharma original https://blog.cloudflare.com/builder-day-2024-announcements
To celebrate Builder Day 2024, we’re shipping 18 updates inspired by direct feedback from developers building on Cloudflare. Choosing a platform isn’t just about current technologies and services — it’s about betting on a partner that will evolve with your needs as your project grows and the tech landscape shifts. We’re in it for the long haul with you.
Starting today, you can:
-
Persist logs from your Worker and query them directly on the Cloudflare dashboard
-
Connect your Worker to private databases (isolated in VPCs) using Hyperdrive
-
Use a wider set of NPM packages on Cloudflare Workers, via improved Node.js compatibility
-
Deploy Next.js apps that use the Node.js runtime to Cloudflare, via OpenNext
-
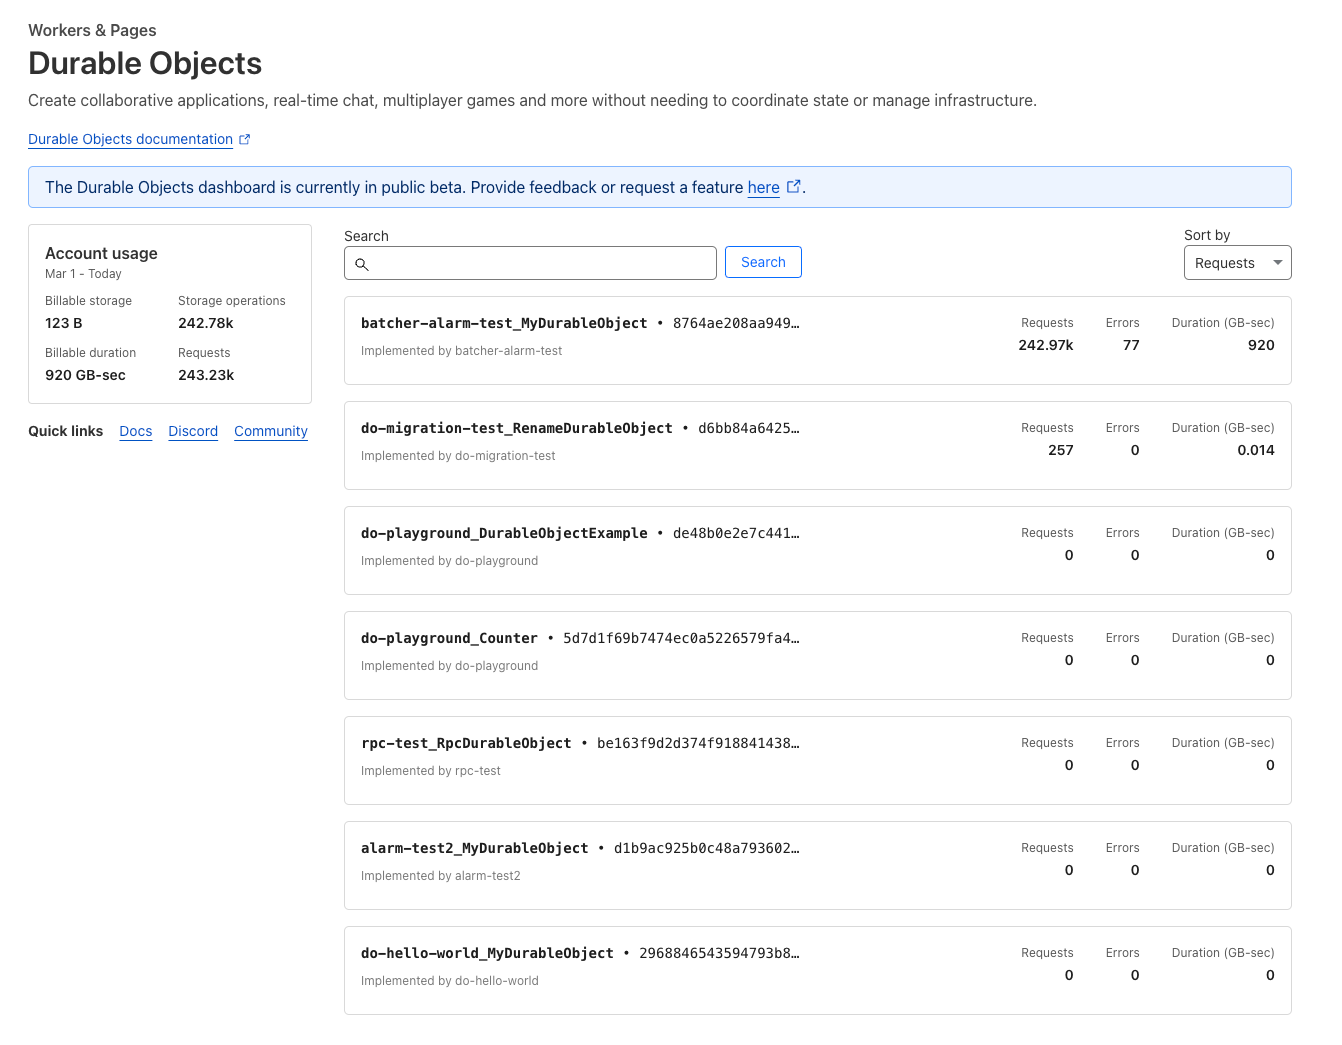
Read from and write to SQLite with zero-latency from every Durable Object
We’ve brought key features from Pages to Workers, allowing you to:
-
Upload and serve static assets as part of your Worker, and use popular frameworks with Workers
-
Automatically build and deploy each pull request to your Worker’s git repository
-
Get back a preview deployment URL for each version of your Worker
Four things are going GA and are officially production-ready:
-
Gradual Deployments: Deploy changes to your Worker gradually, on a percentage basis of traffic
-
Cloudflare Queues: Now with much higher throughput and concurrency limits
-
R2 Event Notifications: Tightly integrated with Queues for event-driven applications
-
Vectorize: Globally distributed vector database, now faster, with larger indexes, and new pricing
The Workers platform is getting faster:
-
We made Workers KV up to 3x faster. Which makes serving static assets from Workers and Pages faster!
-
Workers AI now has much faster Time-to-First-Token (TTFT), backed by more powerful GPUs
And we’re lowering the cost of building on Cloudflare:
-
Requests made through Service Bindings and to Tail Workers are now free
-
Cloudflare Images is introducing a free tier for everyone with a Cloudflare account
-
We’ve simplified Workers AI pricing to use industry standard units of measure
Everything in this post is available for you to use today. Keep reading to learn more, and watch the Builder Day Live Stream for demos and more.
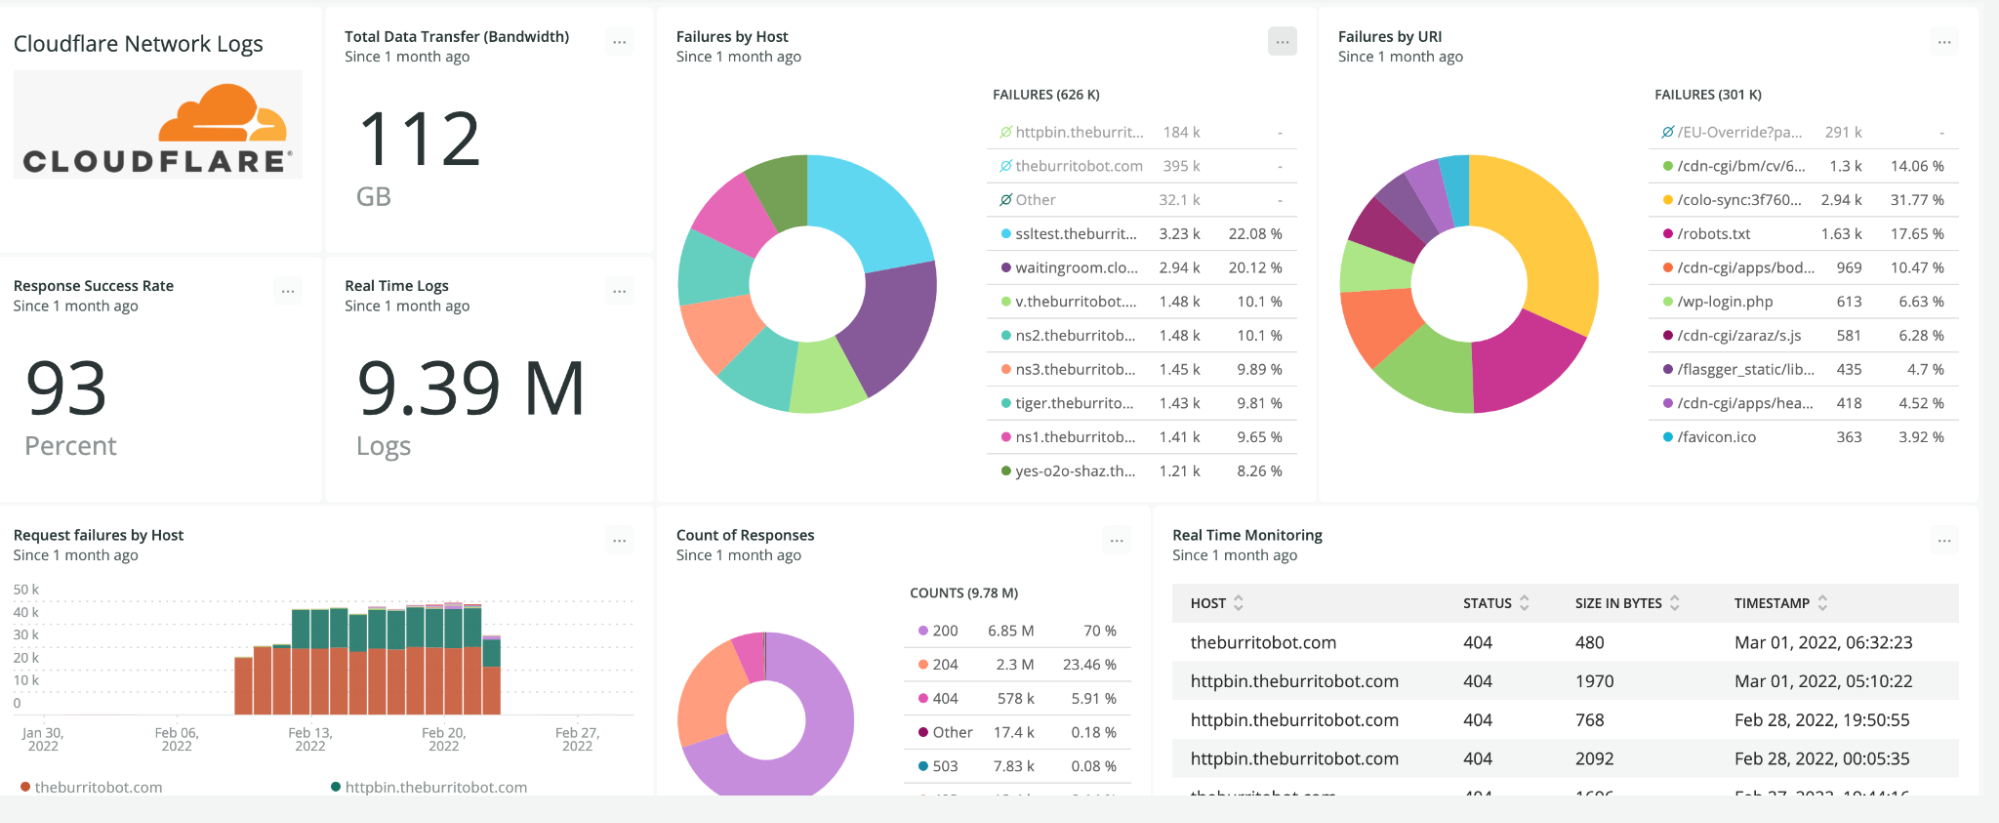
Persistent Logs for every Worker
Starting today in open beta, you can automatically retain logs from your Worker, with full search, query, and filtering capabilities available directly within the Cloudflare dashboard. All newly created Workers will have this setting automatically enabled. This marks the first step in the development of our observability platform, following Cloudflare’s acquisition of Baselime.
Getting started is easy – just add two lines to your Worker’s wrangler.toml and redeploy:
[observability]
enabled = true
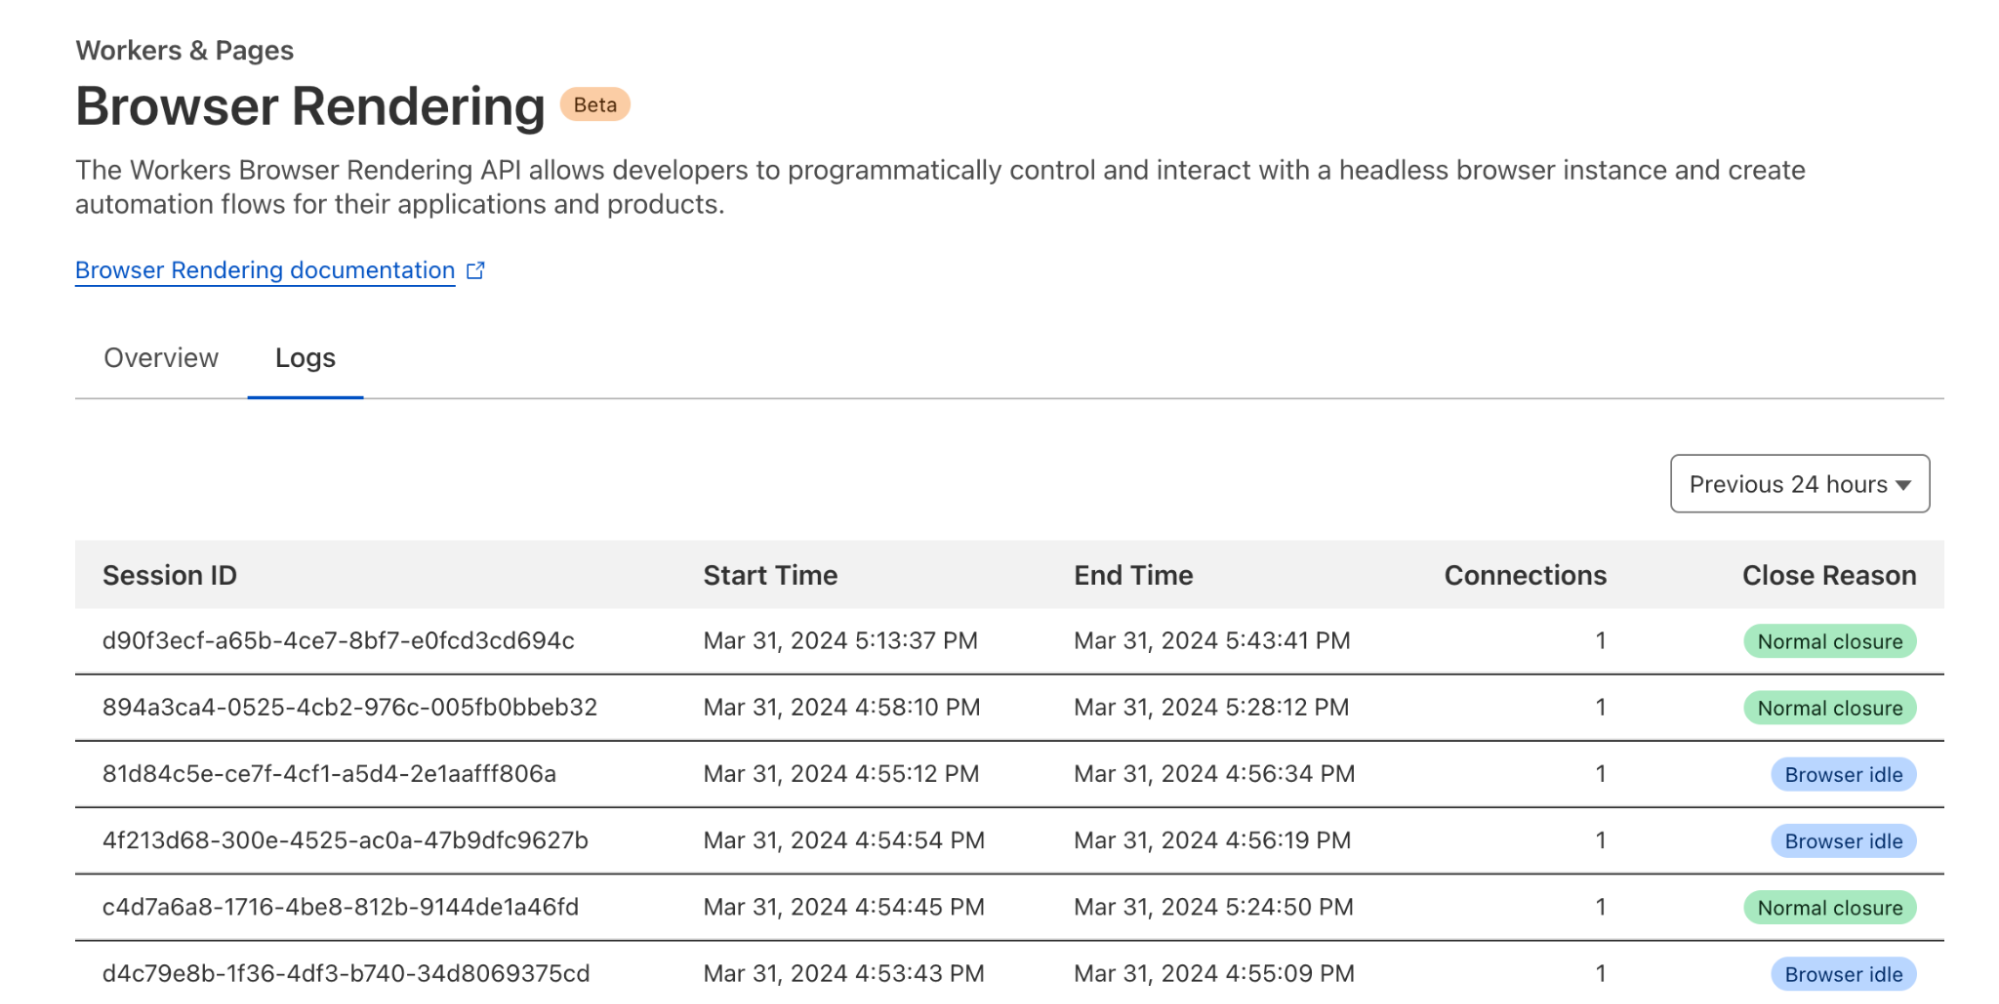
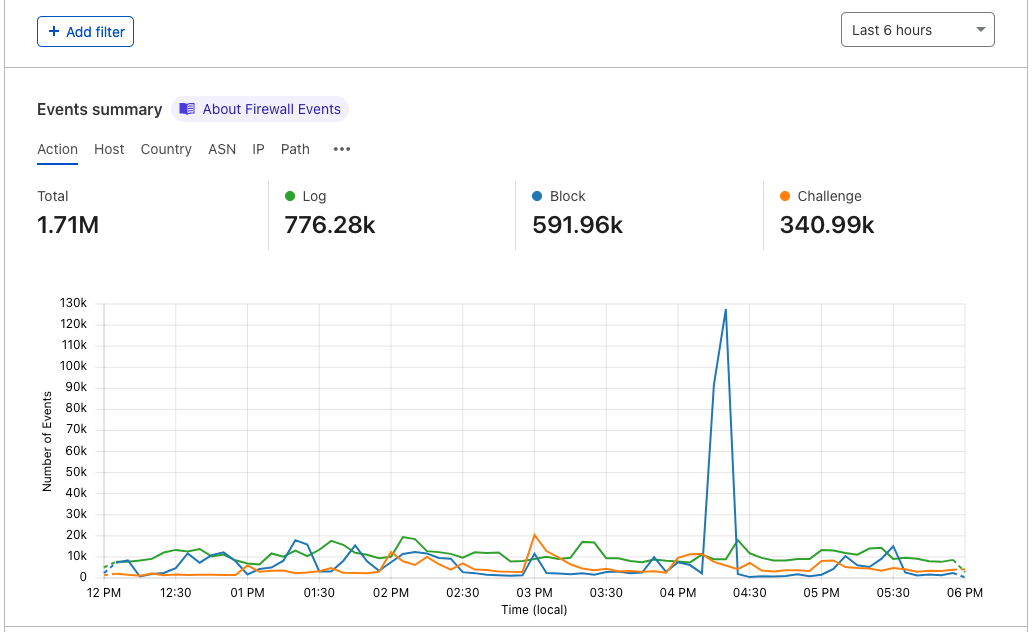
Workers Logs allow you to view all logs emitted from your Worker. When enabled, each console.log message, error, and exception is published as a separate event. Every Worker invocation (i.e. requests, alarms, rpc, etc.) also publishes an enriched execution log that contains invocation metadata. You can view logs in the Logs tab of your Worker in the dashboard, where you can filter on any event field, such as time, error code, message, or your own custom field.
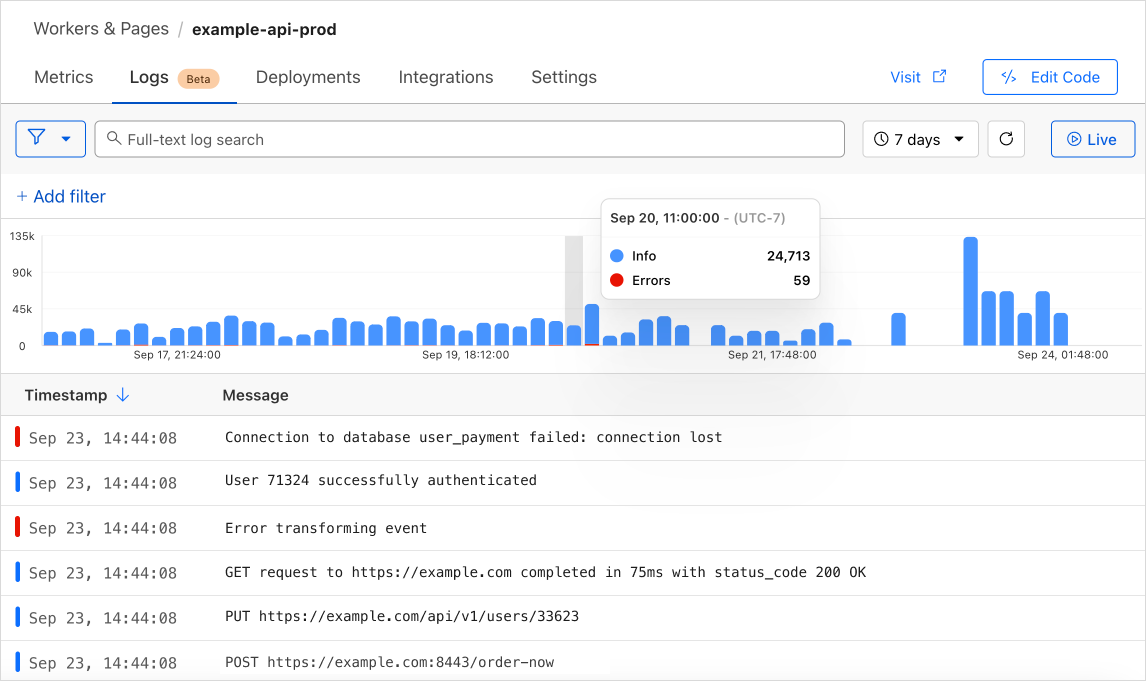
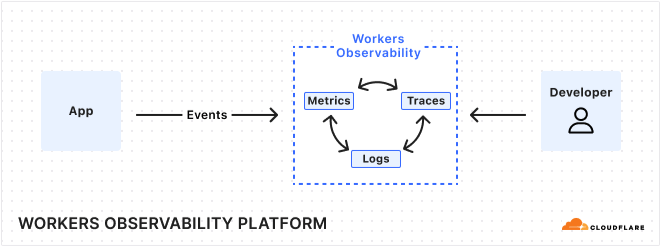
If you’ve ever had to piece together the puzzle of unusual metrics, such as a spike in errors or latency, you know how frustrating it is to connect metrics to traces and logs that often live in independent data silos. Workers Logs is the first piece of a new observability platform we are building that helps you easily correlate telemetry data, and surfaces insights to help you understand. We’ll structure your telemetry data so you have the full context to ask the right questions, and can quickly and easily analyze the behavior of your applications. This is just the beginning for observability tools for Workers. We are already working on automatically emitting distributed traces from Workers, with real time errors and wide, high dimensionality events coming soon as well.
Starting November 1, 2024, Workers Logs will cost $0.60 per million log lines written after the included volume, as shown in the table below. Querying your logs is free. This makes it easy to estimate and forecast your costs — we think you shouldn’t have to calculate the number of ‘Gigabytes Ingested’ to understand what you’ll pay.
| Workers Free | Workers Paid | |
|---|---|---|
| Included Volume | 200,000 logs per day | 20,000,000 logs per month |
| Additional Events | N/A | $0.60 per million logs |
| Retention | 3 days | 7 days |
Try out Workers Logs today. You can learn more from our developer documentation, and give us feedback directly in the #workers-observability channel on Discord.
Connect to private databases from Workers
Starting today, you can now use Hyperdrive, Cloudflare Tunnels and Access together to securely connect to databases that are isolated in a private network.
Hyperdrive enables you to build on Workers with your existing regional databases. It accelerates database queries using Cloudflare’s network, caching data close to end users and pooling connections close to the database. But there’s been a major blocker preventing you from building with Hyperdrive: network isolation.
The majority of databases today aren’t publicly accessible on the Internet. Data is highly sensitive and placing databases within private networks like a virtual private cloud (VPC) keeps data secure. But to date, that has also meant that your data is held captive within your cloud provider, preventing you from building on Workers.
Today, we’re enabling Hyperdrive to securely connect to private databases using Cloudflare Tunnels and Cloudflare Access. With a Cloudflare Tunnel running in your private network, Hyperdrive can securely connect to your database and start speeding up your queries.
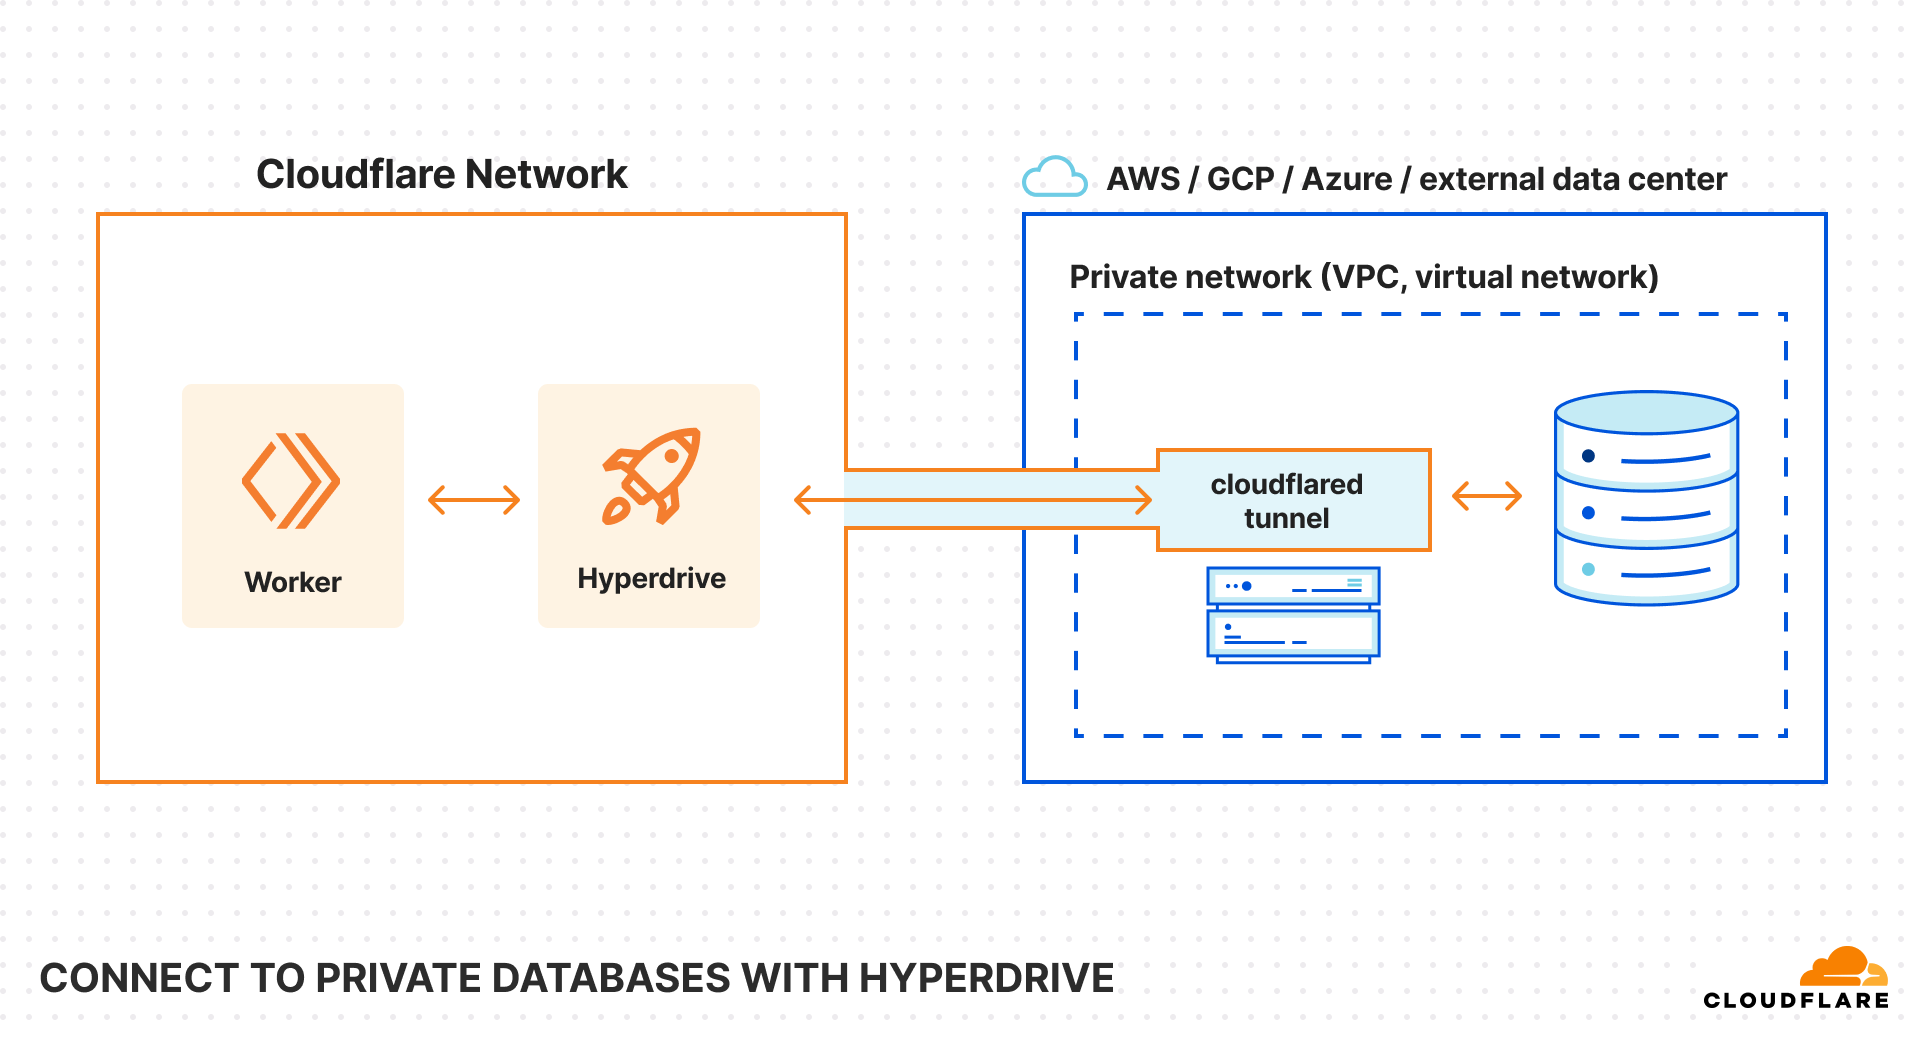
With this update, Hyperdrive makes it possible for you to build full-stack applications on Workers with your existing databases, network-isolated or not. Whether you’re using Amazon RDS, Amazon Aurora, Google Cloud SQL, Azure Database, or any other provider, Hyperdrive can connect to your databases and optimize your database connections to provide the fast performance you’ve come to expect with building on Workers.
Improved Node.js compatibility is now GA
Earlier this month, we overhauled our support for Node.js APIs in the Workers runtime. With twice as many Node APIs now supported on Workers, you can now use a wider set of NPM packages to build a broader range of applications. Today, we’re happy to announce that improved Node.js compatibility is GA.
To give it a try, enable the nodejs_compat compatibility flag, and set your compatibility date to on or after 2024-09-23:
compatibility_flags = ["nodejs_compat"]
compatibility_date = "2024-09-23"
Read the developer documentation to learn more about how to opt-in your Workers to try it today. If you encounter any bugs or want to report feedback, open an issue.
Build frontend applications on Workers with Static Asset Hosting
Starting today in open beta, you now can upload and serve HTML, CSS, and client-side JavaScript directly as part of your Worker. This means you can build dynamic, server-side rendered applications on Workers using popular frameworks such as Astro, Remix, Next.js and Svelte (full list here), with more coming soon.
You can now deploy applications to Workers that previously could only be deployed to Cloudflare Pages and use features that are not yet supported in Pages, including Logpush, Hyperdrive, Cron Triggers, Queue Consumers, and Gradual Deployments.
To get started, create a new project with create-cloudflare. For example, to create a new Astro project:
npm create cloudflare@latest -- my-astro-app --framework=astro --experimental
Visit our developer documentation to learn more about setting up a new front-end application on Workers and watch a quick demo to learn about how you can deploy an existing application to Workers. Static assets aren’t just for Workers written in JavaScript! You can serve static assets from Workers written in Python or even deploy a Leptos app using workers-rs.
If you’re wondering “What about Pages?” — rest assured, Pages will remain fully supported. We’ve heard from developers that as we’ve added new features to Workers and Pages, the choice of which product to use has become challenging. We’re closing this gap by bringing asset hosting, CI/CD and Preview URLs to Workers this Birthday Week.
To make the upfront choice Cloudflare Workers and Pages more transparent, we’ve created a compatibility matrix. Looking ahead, we plan to bridge the remaining gaps between Workers and Pages and provide ways to migrate your Pages projects to Workers.
Cloudflare joins OpenNext to deploy Next.js apps to Workers
Starting today, as an early developer preview, you can use OpenNext to deploy Next.js apps to Cloudflare Workers via @opennextjs/cloudflare, a new npm package that lets you use the Node.js “runtime” in Next.js on Workers.
This new adapter is powered by our new Node.js compatibility layer, newly introduced Static Assets for Workers, and Workers KV, which is now up to 3x faster. It unlocks support for Incremental Static Regeneration (ISR), custom error pages, and other Next.js features that our previous adapter, @cloudflare/next-on-pages, could not support, as it was only compatible with the Edge “runtime” in Next.js.
Cloud providers shouldn’t lock you in. Like cloud compute and storage, open source frameworks should be portable — you should be able to deploy them to different cloud providers. The goal of the OpenNext project is to make sure you can deploy Next.js apps to any cloud platform, originally to AWS, and now Cloudflare. We’re excited to contribute to the OpenNext community, and give developers the freedom to run on the cloud that fits their applications needs (and budget) best.
To get started by reading the OpenNext docs, which provide examples and a guide on how to add @opennextjs/cloudflare to your Next.js app.
We want your feedback! Report issues and contribute code at opennextjs/opennextjs-cloudflare on GitHub, and join the discussion on the OpenNext Discord.
npm create cloudflare@latest -- my-next-app --framework=next --experimental
We want your feedback! Report issues and contribute code at opennextjs/opennextjs-cloudflare on GitHub, and join the discussion on the OpenNext Discord.
Continuous Integration & Delivery (CI/CD) with Workers Builds
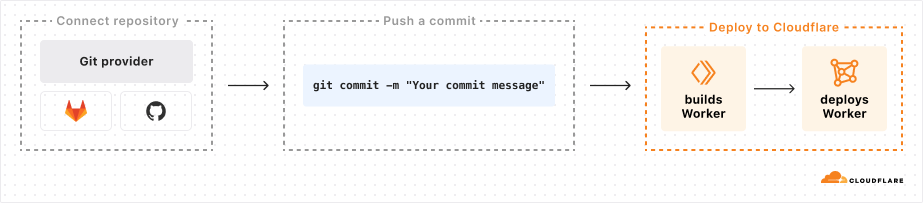
Now in open beta, you can connect a GitHub or GitLab repository to a Worker, and Cloudflare will automatically build and deploy your changes each time you push a commit. Workers Builds provides an integrated CI/CD workflow you can use to build and deploy everything from full-stack applications built with the most popular frameworks to simple static websites. Just add your build command and let Workers Builds take care of the rest.
While in open beta, Workers Builds is free to use, with a limit of one concurrent build per account, and unlimited build minutes per month. Once Workers Builds is Generally Available in early 2025, you will be billed based on the number of build minutes you use each month, and have a higher number of concurrent builds.
| Workers Free | Workers Paid | |
|---|---|---|
| Build minutes, open beta | Unlimited | Unlimited |
| Concurrent builds, open beta | 1 | 1 |
| Build minutes, general availability | 3,000 minutes included per month | 6,000 minutes included per month +$0.005 per additional build minute |
| Concurrent builds, general availability | 1 | 6 |
Read the docs to learn more about how to deploy your first project with Workers Builds.
Workers preview URLs
Each newly uploaded version of a Worker now automatically generates a preview URL. Preview URLs make it easier for you to collaborate with your team during development, and can be used to test and identify issues in a preview environment before they are deployed to production.
When you upload a version of your Worker via the Wrangler CLI, Wrangler will display the preview URL once your upload succeeds. You can also find preview URLs for each version of your Worker in the Cloudflare dashboard:
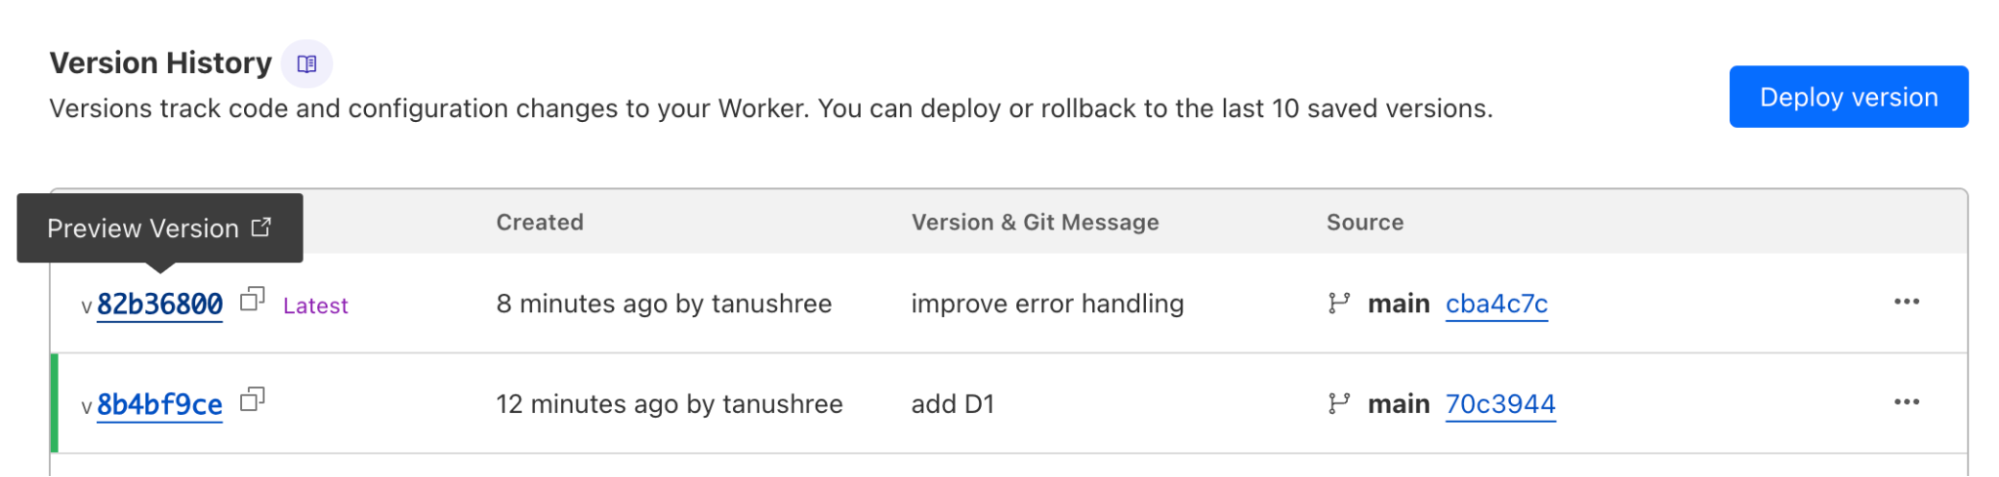
Preview URLs for Workers are similar to Pages preview deployments — they run on your Worker’s workers.dev subdomain and allow you to view changes applied on a new version of your application before the changes are deployed.
Learn more about preview URLs by visiting our developer documentation.
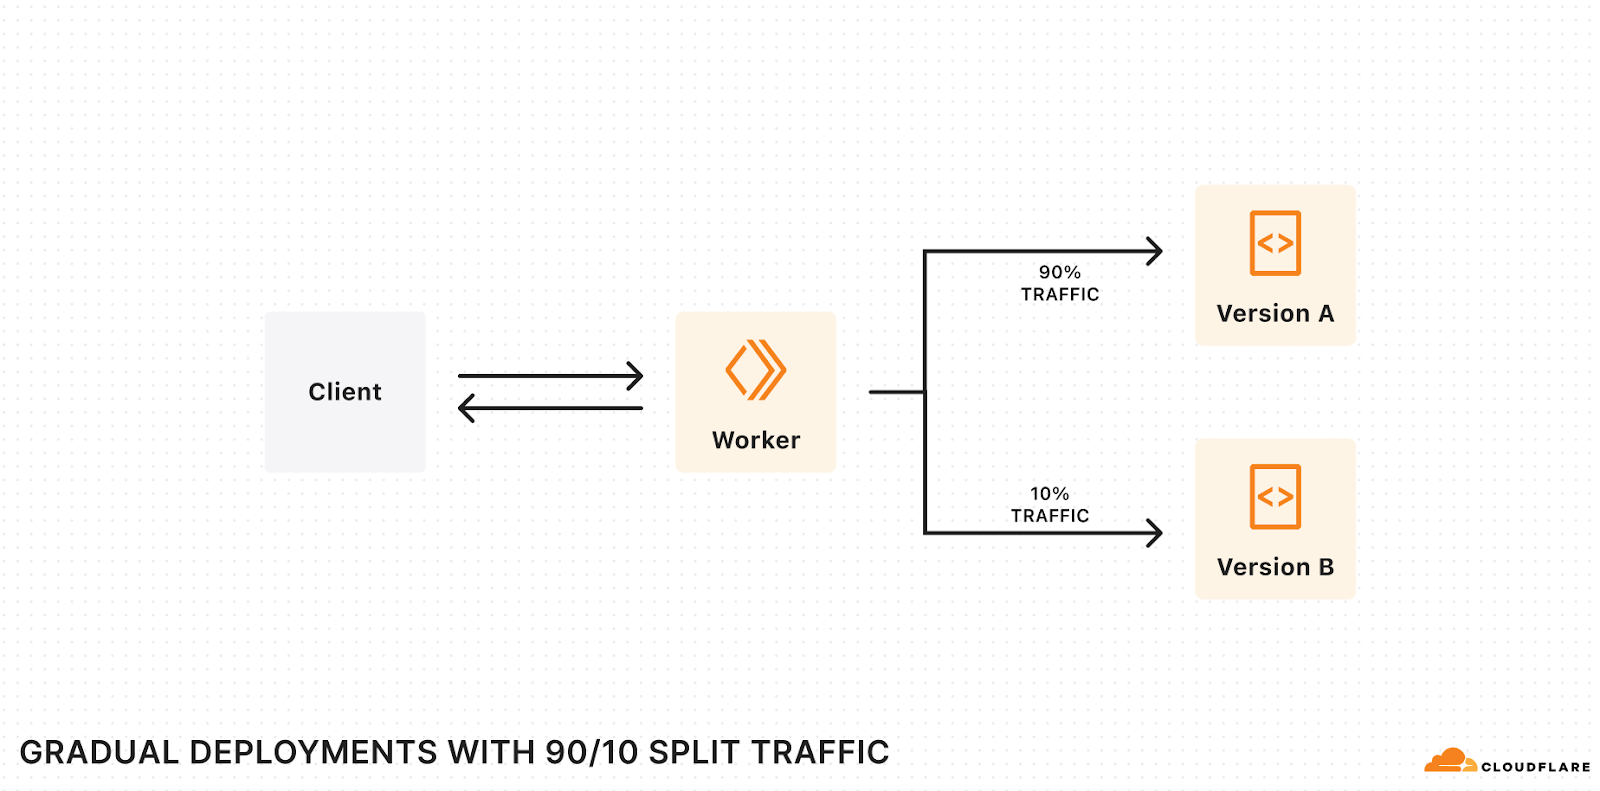
Safely release to production with Gradual Deployments
At Developer Week, we launched Gradual Deployments for Workers and Durable Objects to make it safer and easier to deploy changes to your applications. Gradual Deployments is now GA — we have been using it ourselves at Cloudflare for mission-critical services built on Workers since early 2024.
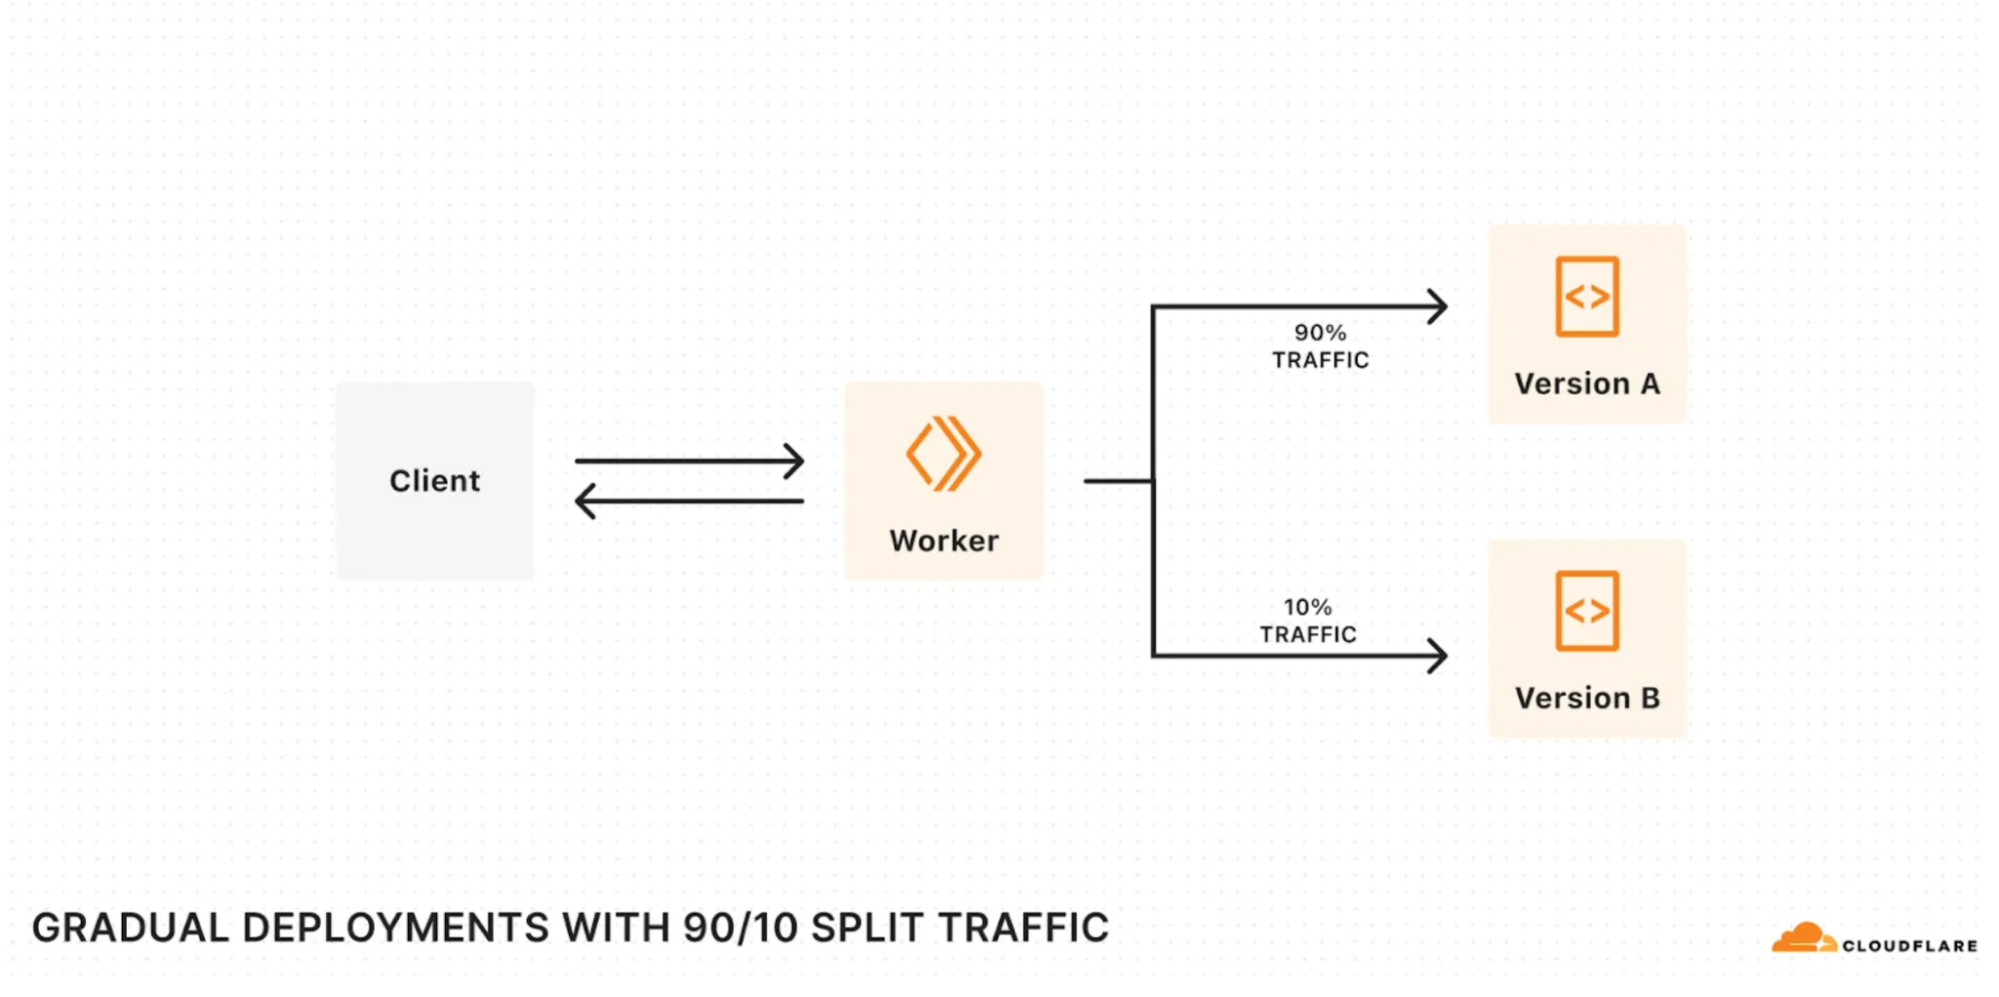
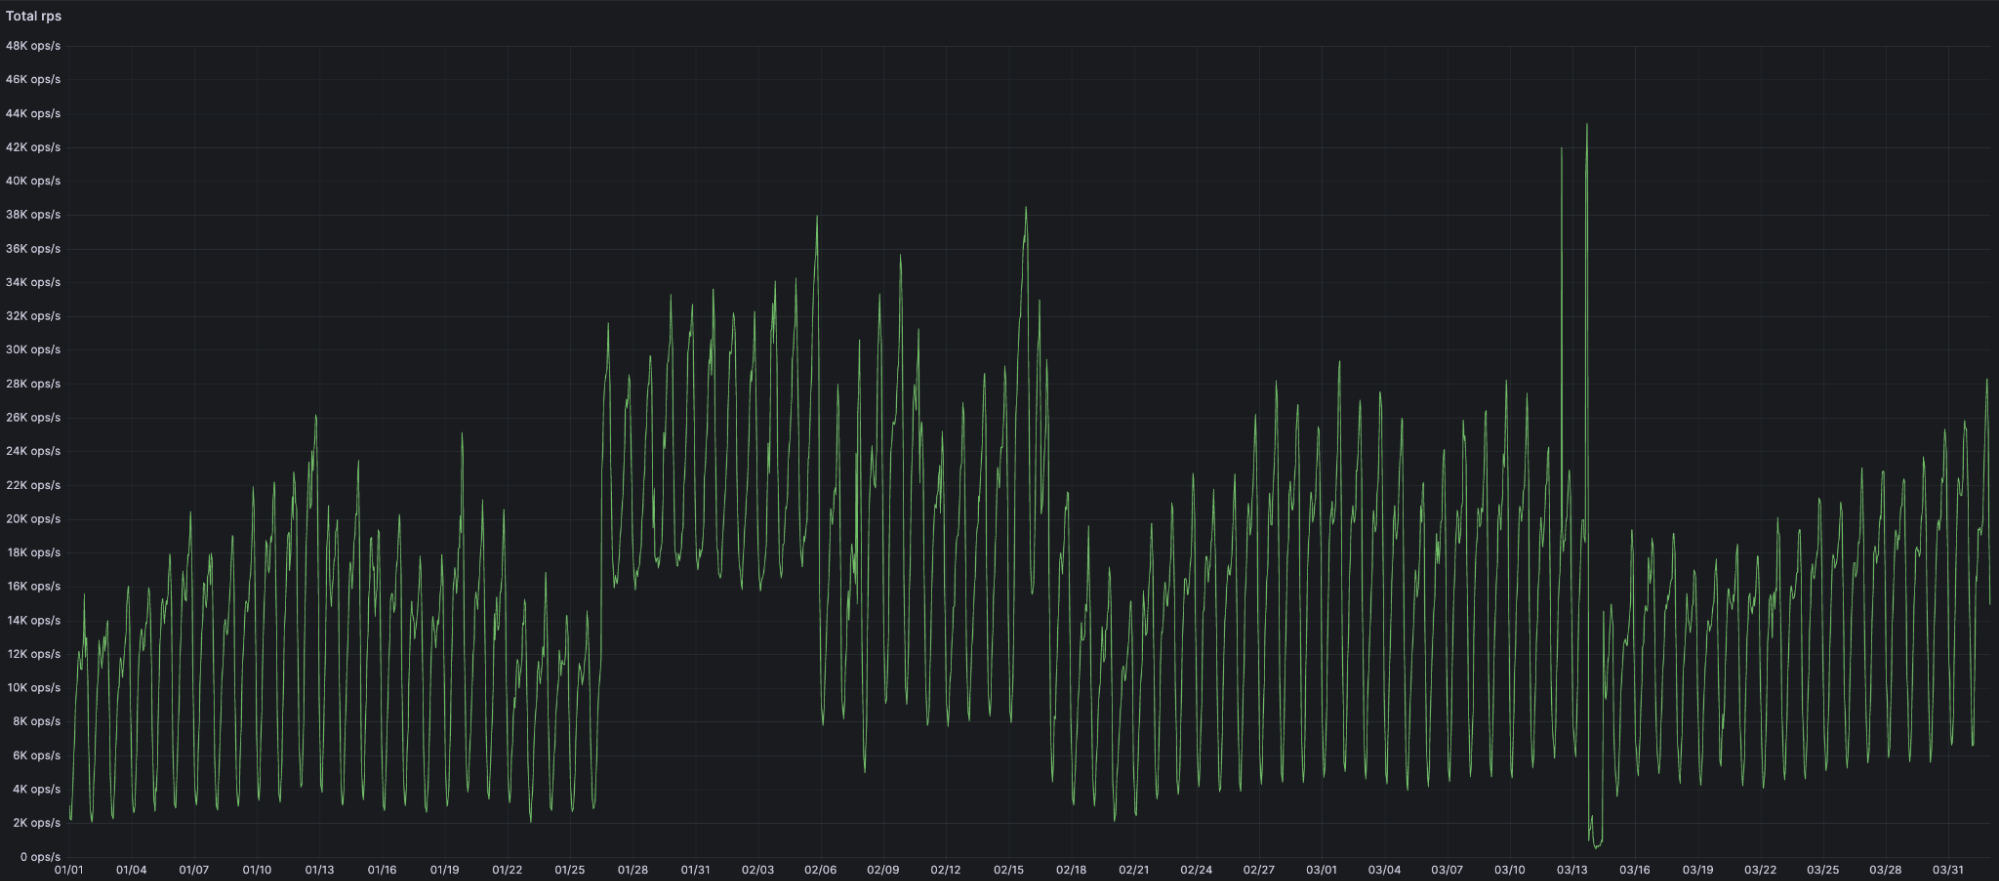
Gradual deployments can help you stay on top of availability SLAs and minimize application downtime by surfacing issues early. Internally at Cloudflare, every single service built on Workers uses gradual deployments to roll out new changes. Each new version gets released in stages —– 0.05%, 0.5%, 3%, 10%, 25%, 50%, 75% and 100% with time to soak between each stage. Throughout the roll-out, we keep an eye on metrics (which are often instrumented with Workers Analytics Engine!) and we roll back if we encounter issues.
Using gradual deployments is as simple as swapping out the wrangler commands, API endpoints, and/or using “Save version” in the code editor that is built into the Workers dashboard. Read the developer documentation to learn more and get started.
Queues is GA, with higher throughput and concurrency limits
Cloudflare Queues is now generally available with higher limits.
Queues let a developer decouple their Workers into event driven services. Producer Workers write events to a Queue, and consumer Workers are invoked to take actions on the events. For example, you can use a Queue to decouple an e-commerce website from a service which sends purchase confirmation emails to users.
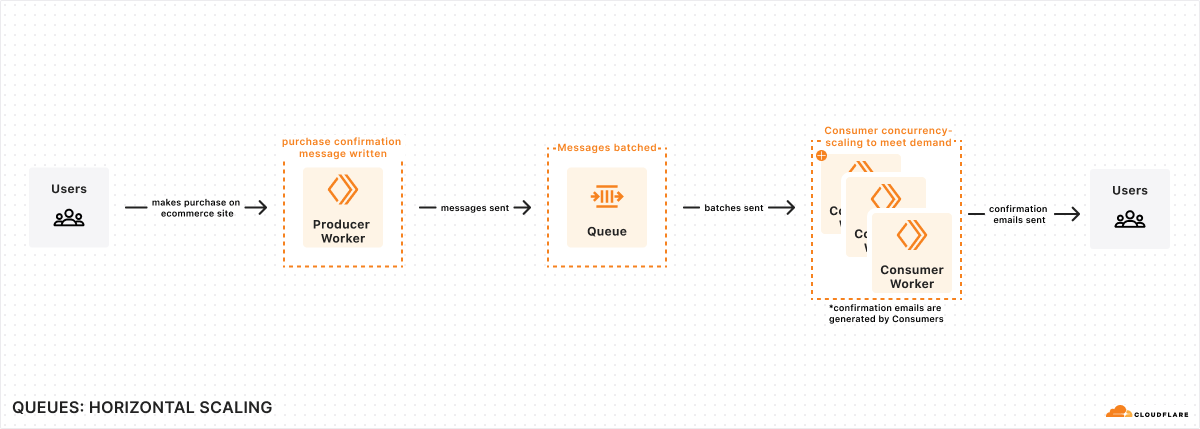
Throughput and concurrency limits for Queues are now significantly higher, which means you can push more messages through a Queue, and consume them faster.
-
Throughput: Each queue can now process 5000 messages per second (previously 400 per second).
-
Concurrency: Each queue can now have up to 250 concurrent consumers (previously 20 concurrent consumers).
Since we announced Queues in beta, we’ve added the following functionality:
-
Batch sizes can be customized, to reduce the number of consumer Worker invocations and thus reduce cost.
-
Individual messages can be delayed, so you can back off due to external API rate limits.
-
HTTP Pull consumers allow messages to be consumed outside Workers, with zero data egress costs.
Queues can be used by any developer on a Workers Paid plan. Head over to our getting started guide to start building with Queues.
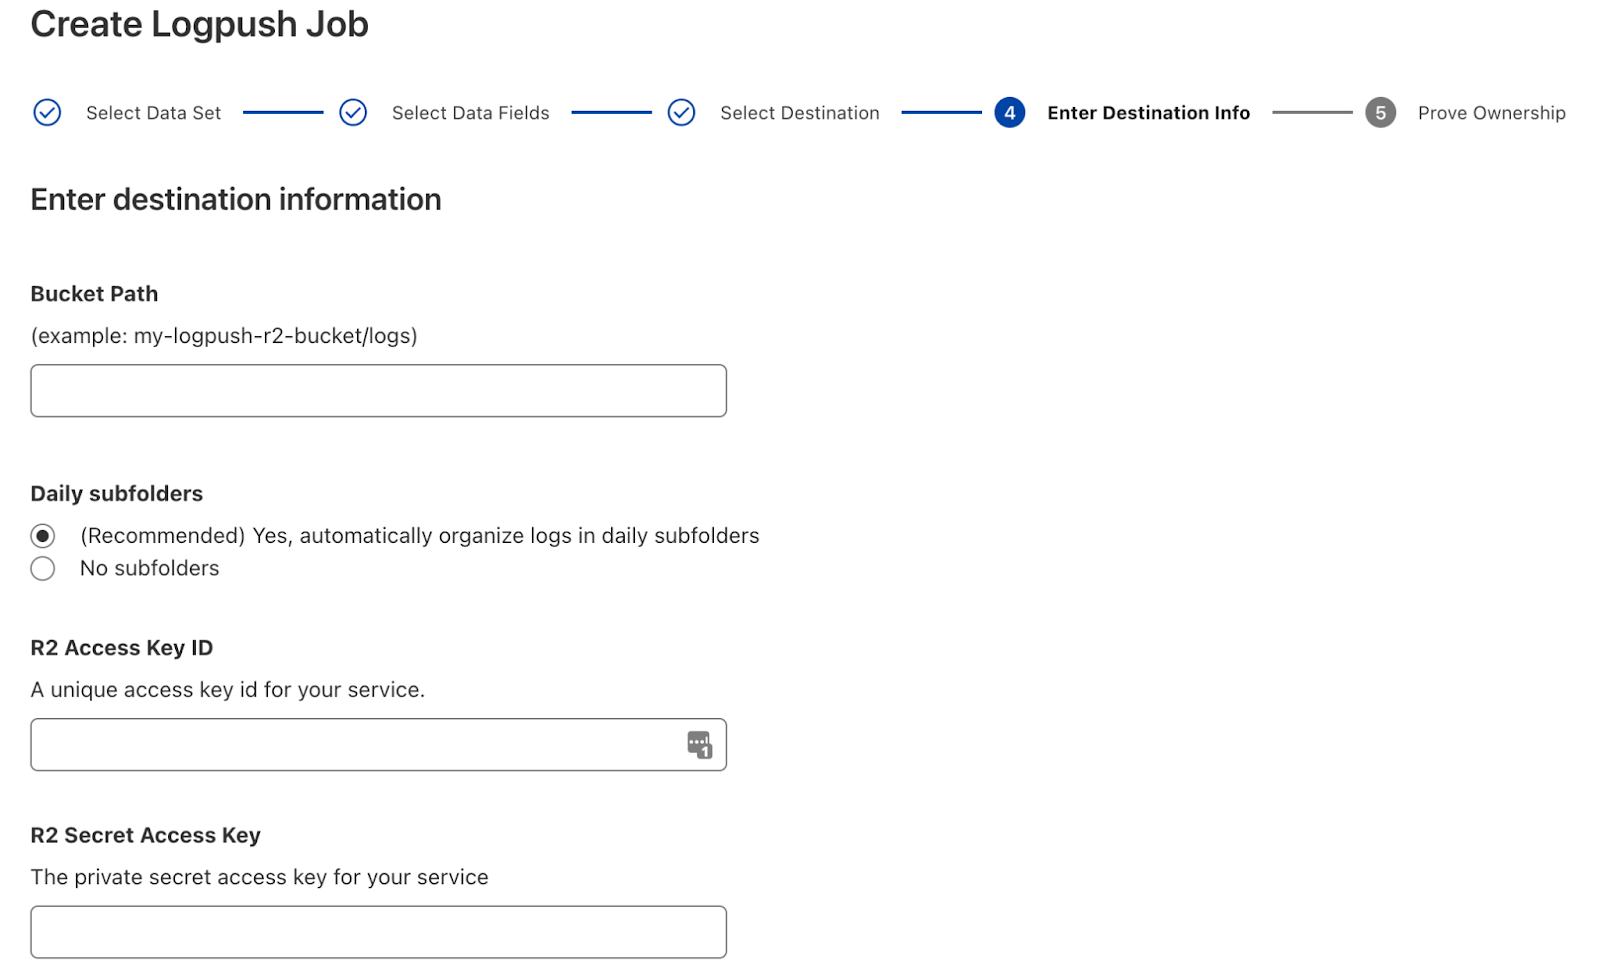
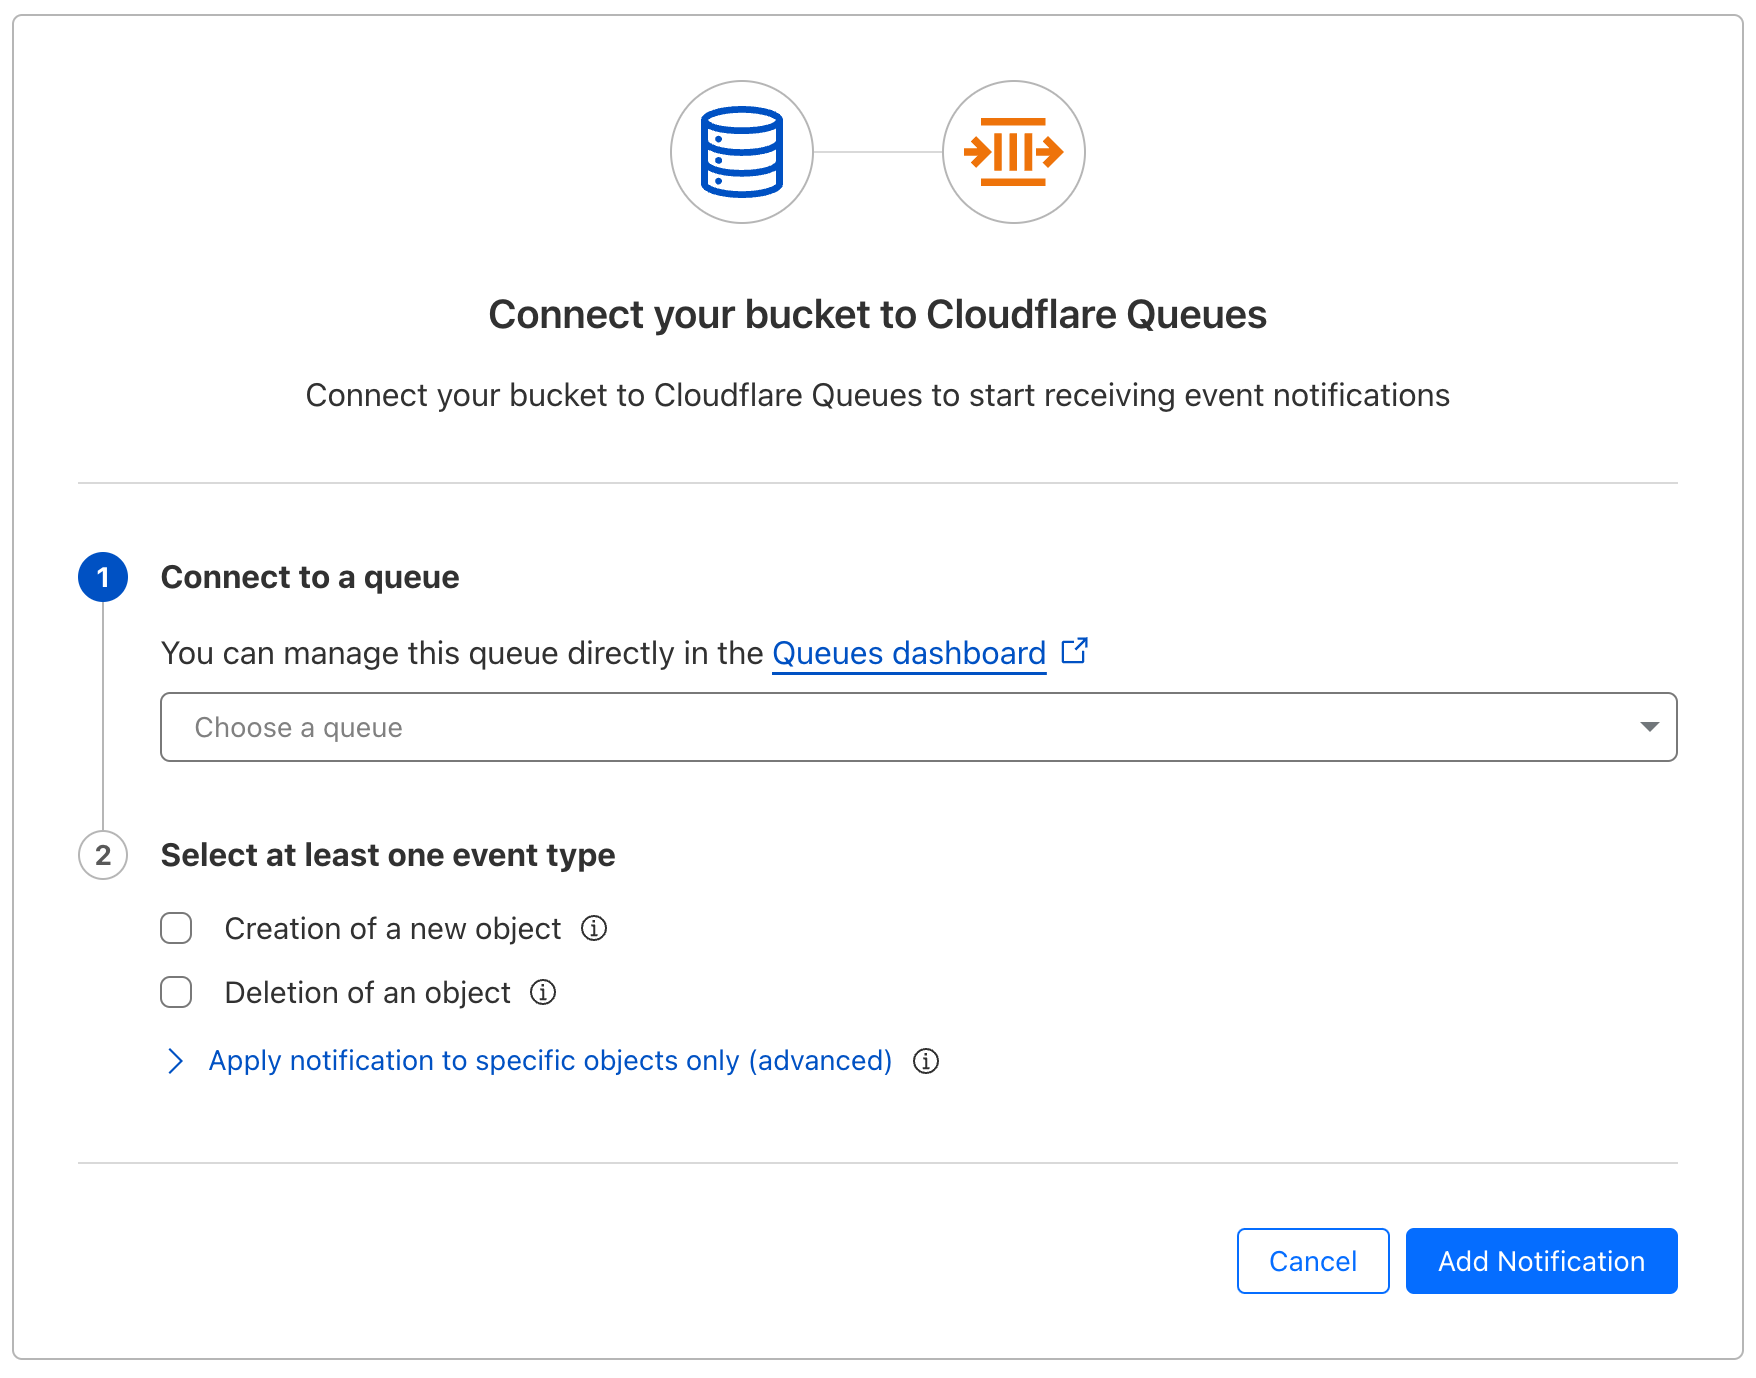
Event notifications for R2 is now GA
We’re excited to announce that event notifications for R2 is now generally available. Whether it’s kicking off image processing after a user uploads a file or triggering a sync to an external data warehouse when new analytics data is generated, many applications need to be able to reliably respond when events happen. Event notifications for Cloudflare R2 give you the ability to build event-driven applications and workflows that react to changes in your data.
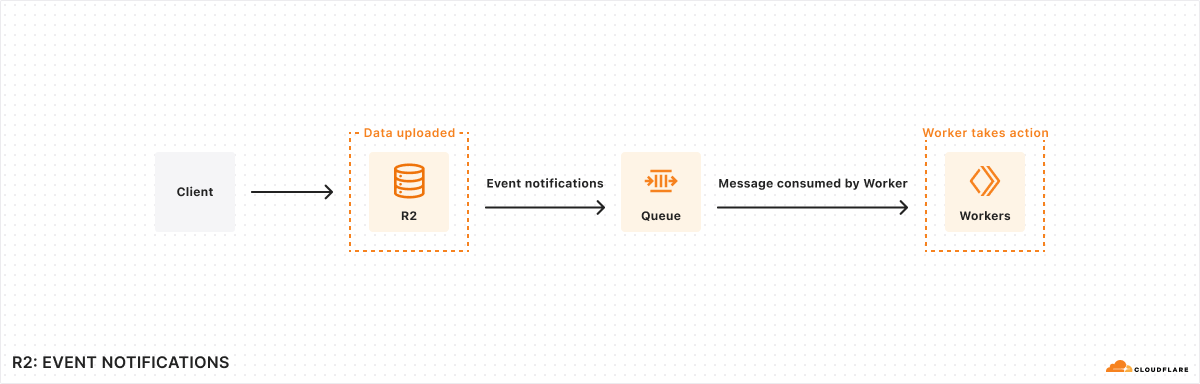
Here’s how it works: When data in your R2 bucket changes, event notifications are sent to your queue. You can consume these notifications with a consumer Worker or pull them over HTTP from outside of Cloudflare Workers.
Since we introduced event notifications in open beta earlier this year, we’ve made significant improvements based on your feedback:
-
We increased reliability of event notifications with throughput improvements from Queues. R2 event notifications can now scale to thousands of writes per second.
-
You can now configure event notifications directly from the Cloudflare dashboard (in addition to Wrangler).
-
There is now support for receiving notifications triggered by object lifecycle deletes.
-
You can now set up multiple notification rules for a single queue on a bucket.
Visit our documentation to learn about how to set up event notifications for your R2 buckets.
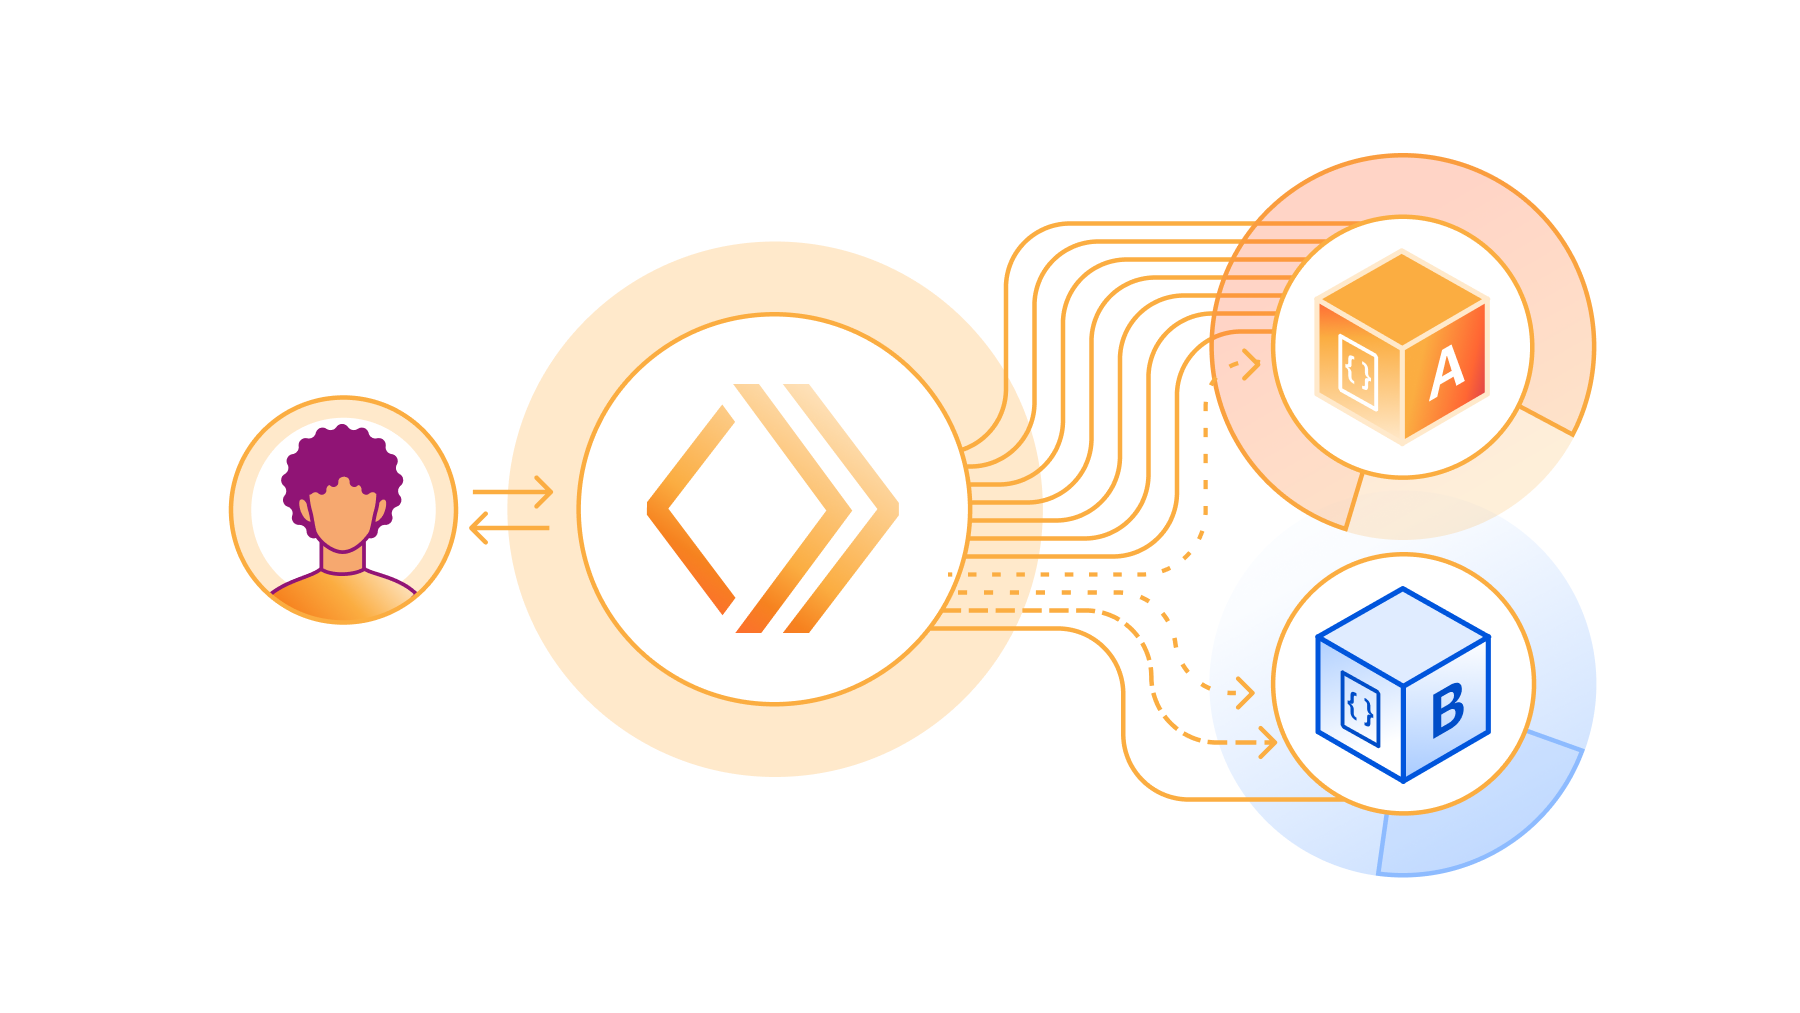
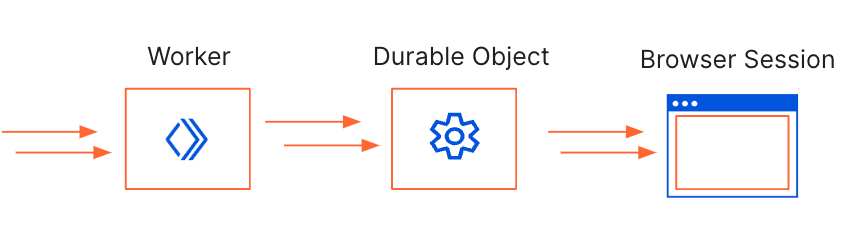
Removing the serverless microservices tax: No more request fees for Service Bindings and Tail Workers
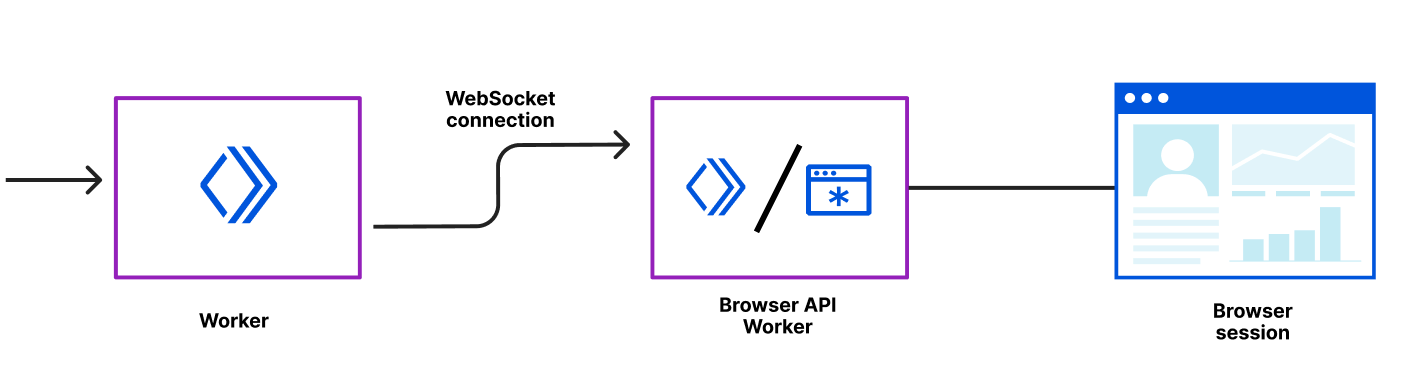
Earlier this year, we quietly changed Workers pricing to lower your costs. As of July 2024, you are no longer charged for requests between Workers on your account made via Service Bindings, or for invocations of Tail Workers. For example, let’s say you have the following chain of Workers:
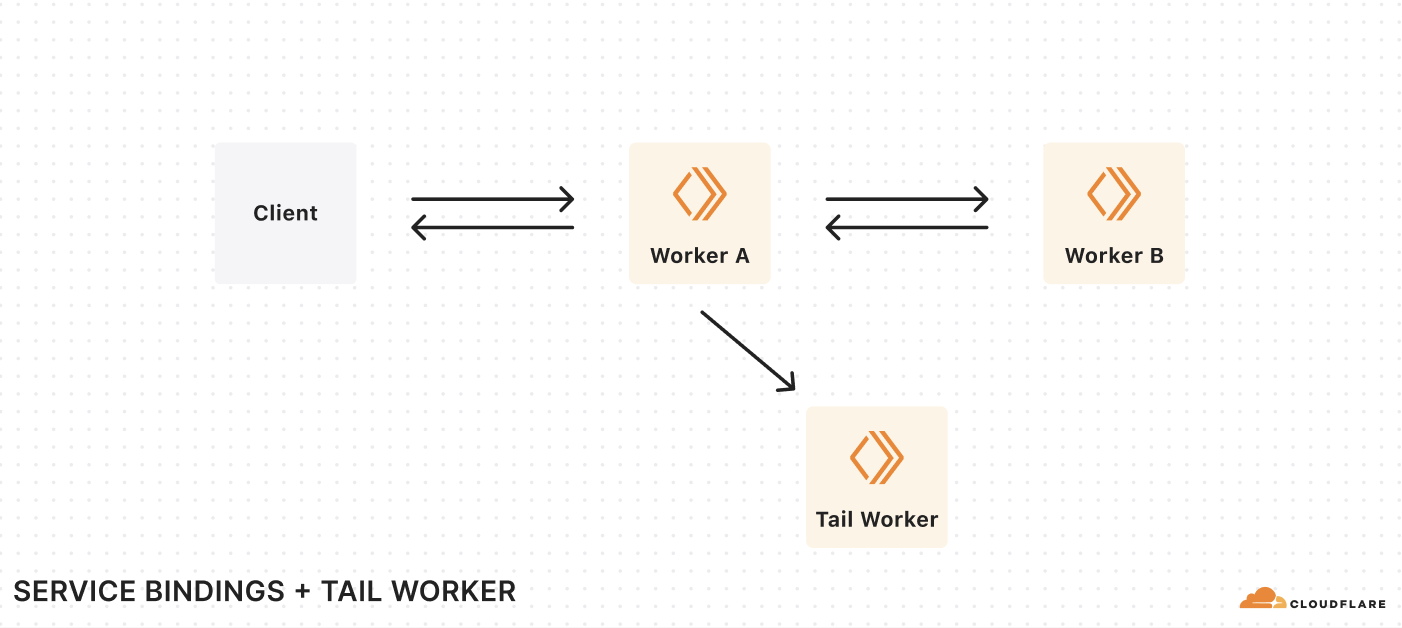
Each request from a client results in three Workers invocations. Previously, we charged you for each of these invocations, plus the CPU time for each of these Workers. With this change, we only charge you for the first request from the client, plus the CPU time used by each Worker.
This eliminates the additional cost of breaking a monolithic serverless app into microservices. In 2023, we introduced new pricing based on CPU time, rather than duration, so you don’t have to worry about being billed for time spent waiting on I/O. This includes I/O to other Workers. With this change, you’re only billed for the first request in the chain, eliminating the other additional cost of using multiple Workers.
When you build microservices on Workers, you face fewer trade offs than on other compute platforms. Service bindings have zero network overhead by default, a built-in JavaScript RPC system, and a security model with fewer footguns and simpler configuration. We’re excited to improve this further with this pricing change.
Image optimization is available to everyone for free — no subscription needed
Starting today, you can use Cloudflare Images for free to optimize your images with up to 5,000 transformations per month.
Large, oversized images can throttle your application speed and page load times. We built Cloudflare Images to let you dynamically optimize images in the correct dimensions and formats for each use case, all while storing only the original image.
In the spirit of Birthday Week, we’re making image optimization available to everyone with a Cloudflare account, no subscription needed. You’ll be able to use Images to transform images that are stored outside of Images, such as in R2.
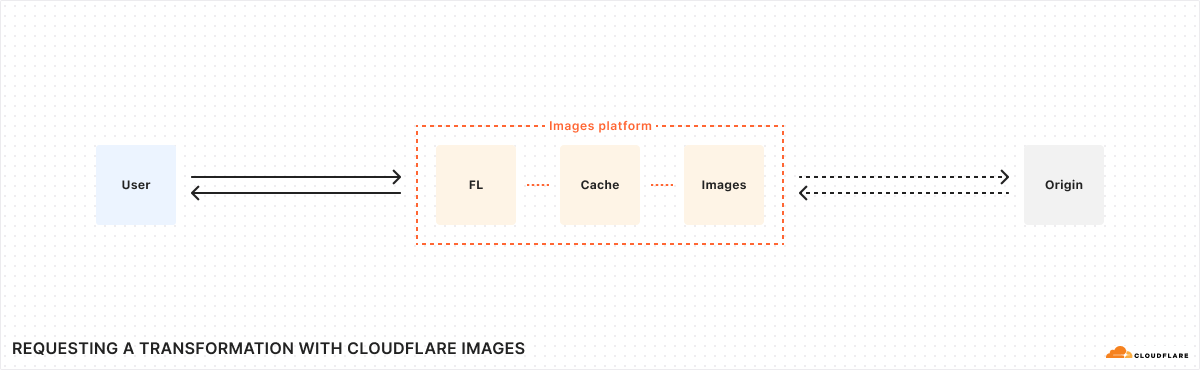
Transformations are served from your zone through a specially formatted URL with parameters that specify how an image should be optimized. For example, the transformation URL below uses the format parameter to automatically serve the image in the most optimal format for the requesting browser:
https://example.com/cdn-cgi/image/format=auto/thumbnail.pngThis means that the original PNG image may be served as AVIF to one user and WebP to another. Without a subscription, transforming images from remote sources is free up to 5,000 unique transformations per month. Once you exceed this limit, any already cached transformations will continue to be served, but you’ll need a paid Images plan to request new transformations or to purchase storage within Images.
To get started, navigate to Images in the dashboard to enable transformations on your zone.
Dive deep into more announcements from Builder Day
We shipped so much that we couldn’t possibly fit it all in one blog post. These posts dive into the technical details of what we’re announcing at Builder Day:
Build the next big thing on Cloudflare
Cloudflare is for builders, and everything we’re announcing at Builder Day, you can start building with right away. We’re now offering $250,000 in credits to use on our Developer Platform to qualified startups, so that you can get going even faster, and become the next company to reach hypergrowth scale with a small team, and not waste time provisioning infrastructure and doing undifferentiated heavy lifting. Focus on shipping, and we’ll take care of the rest.
Apply to the startup program here, or stop by and say hello in the Cloudflare Developers Discord.