Post Syndicated from Janis Eidaks original https://blog.zabbix.com/podman-container-monitoring-with-prometheus-exporter-part-2/30538/
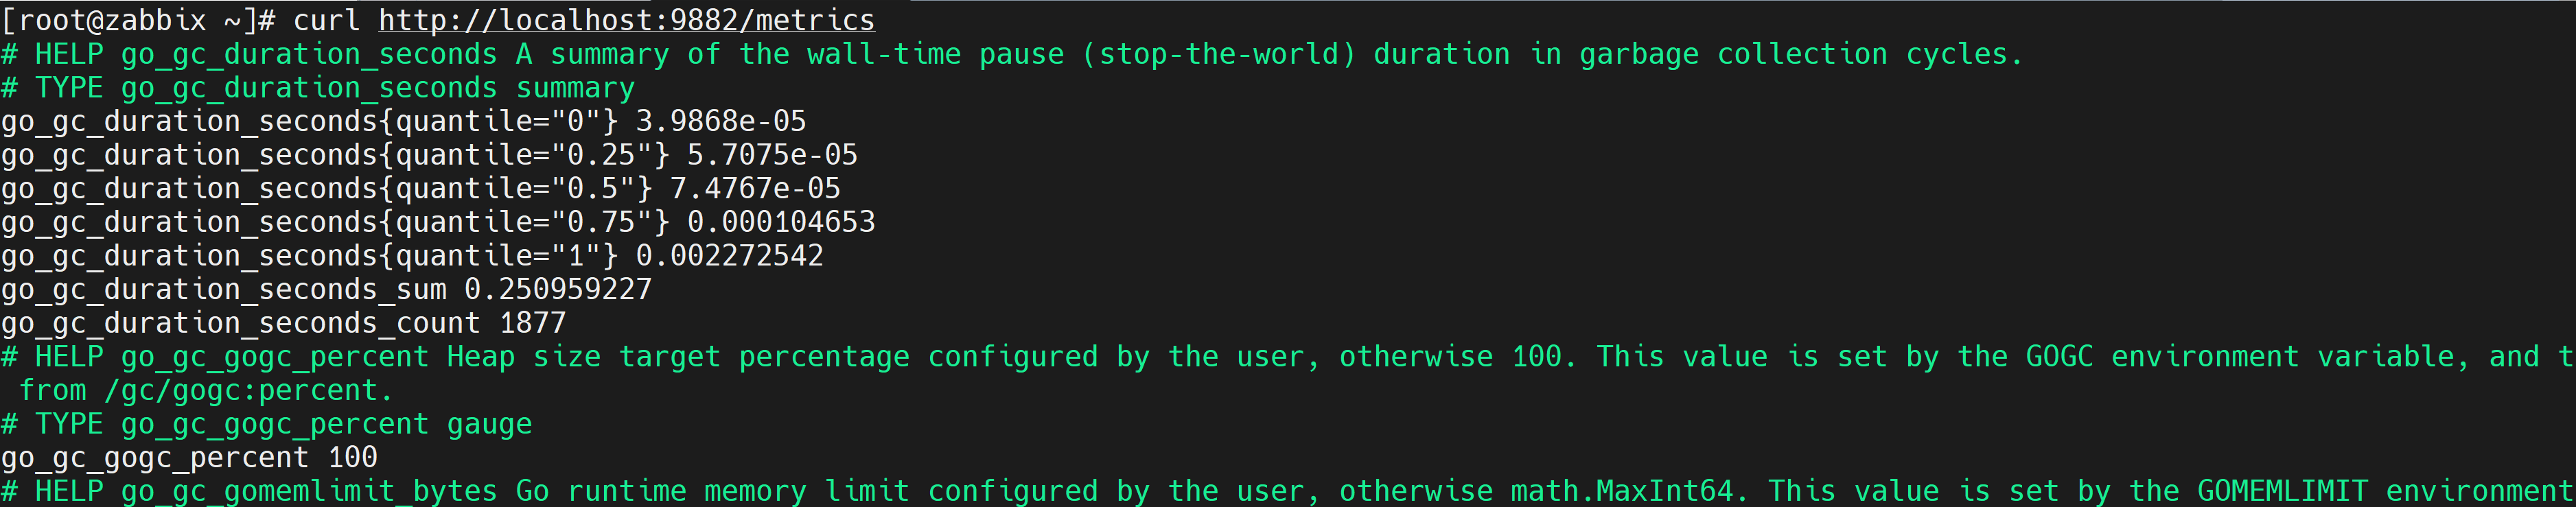
In the first part of this post, we explored how to get data with HTTP agent from the Prometheus Podman exporter and use the same item data for the Podman pods Discovery rule as well as item and trigger prototypes. In part 2 of the same series, we’ll learn how to discover and monitor Podman containers.
Table of Contents
Creating a template discovery rule
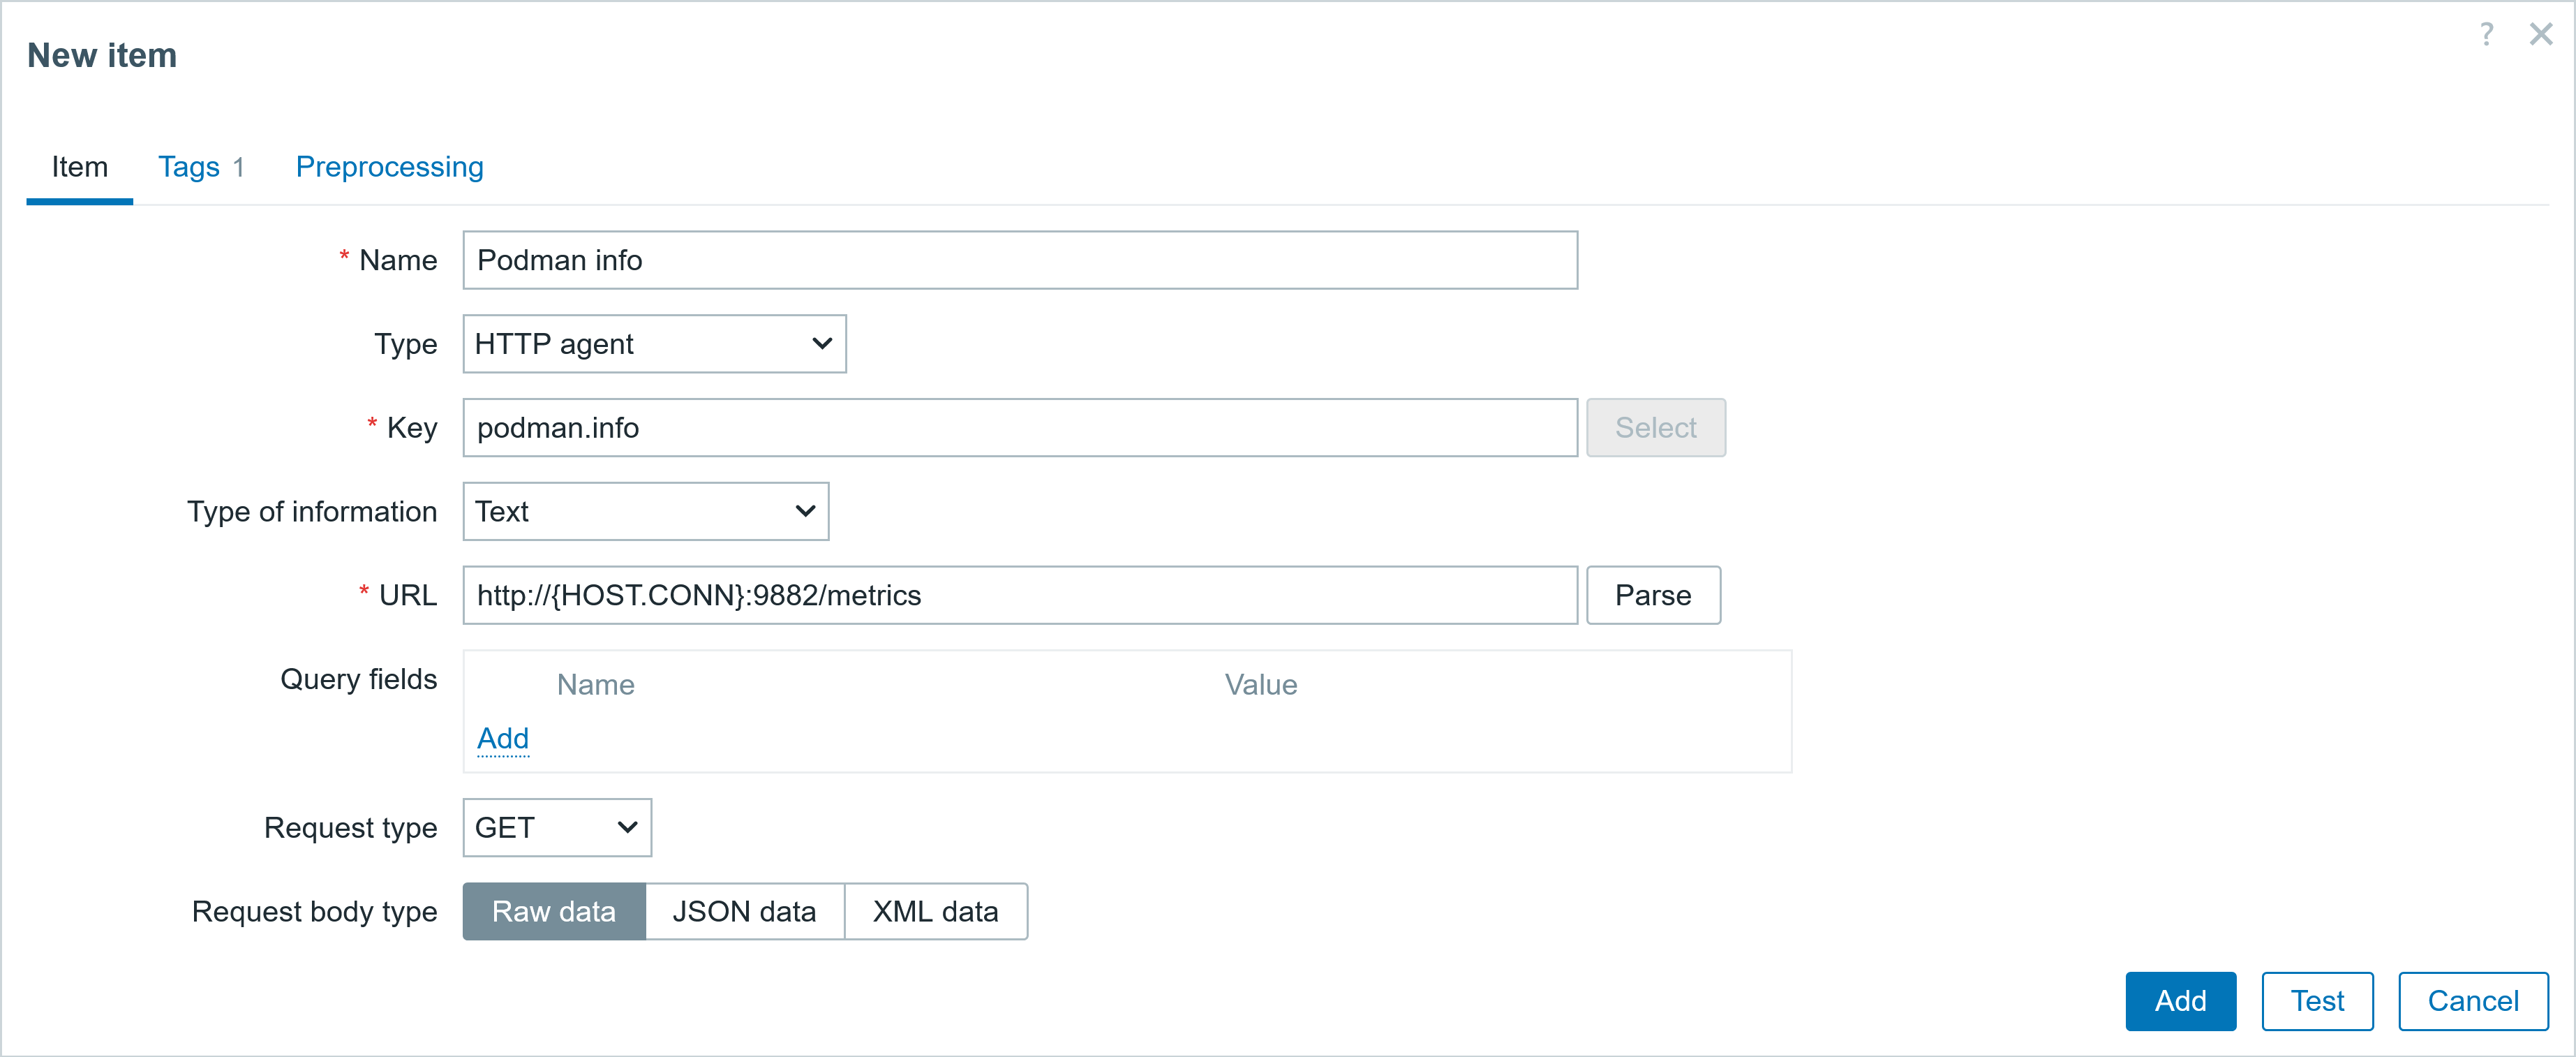
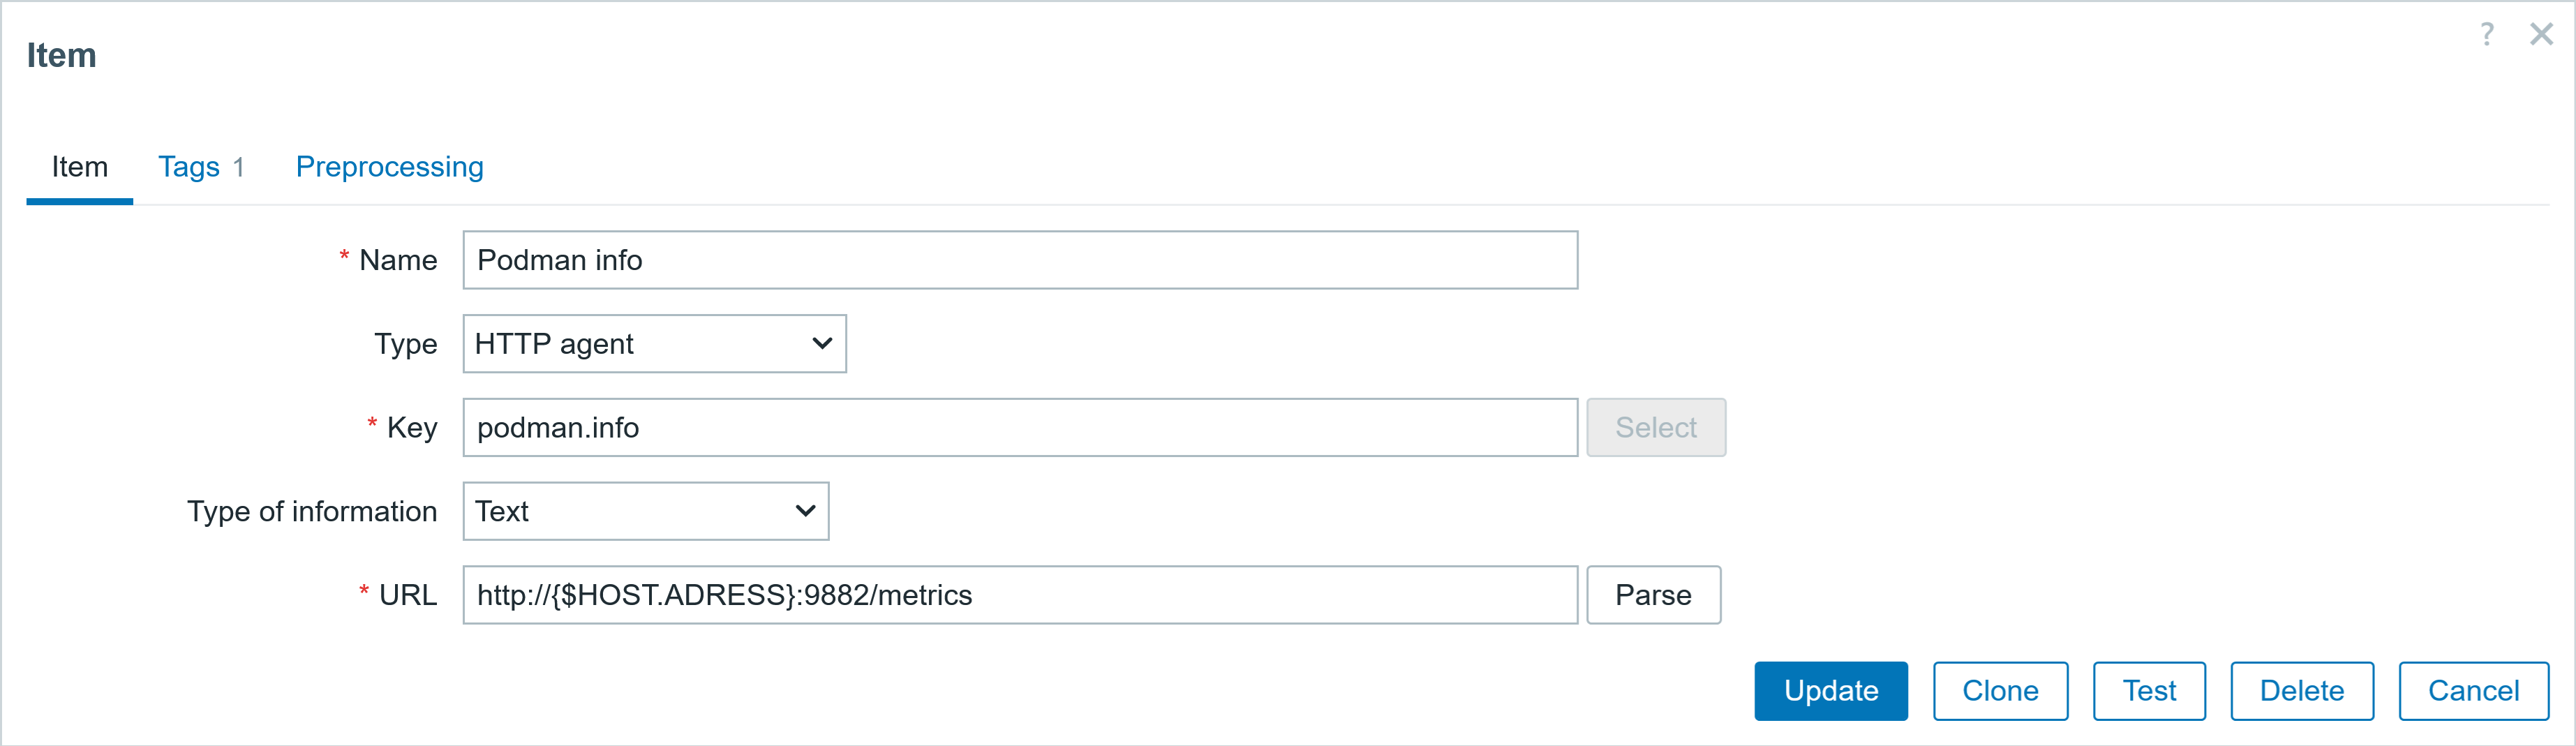
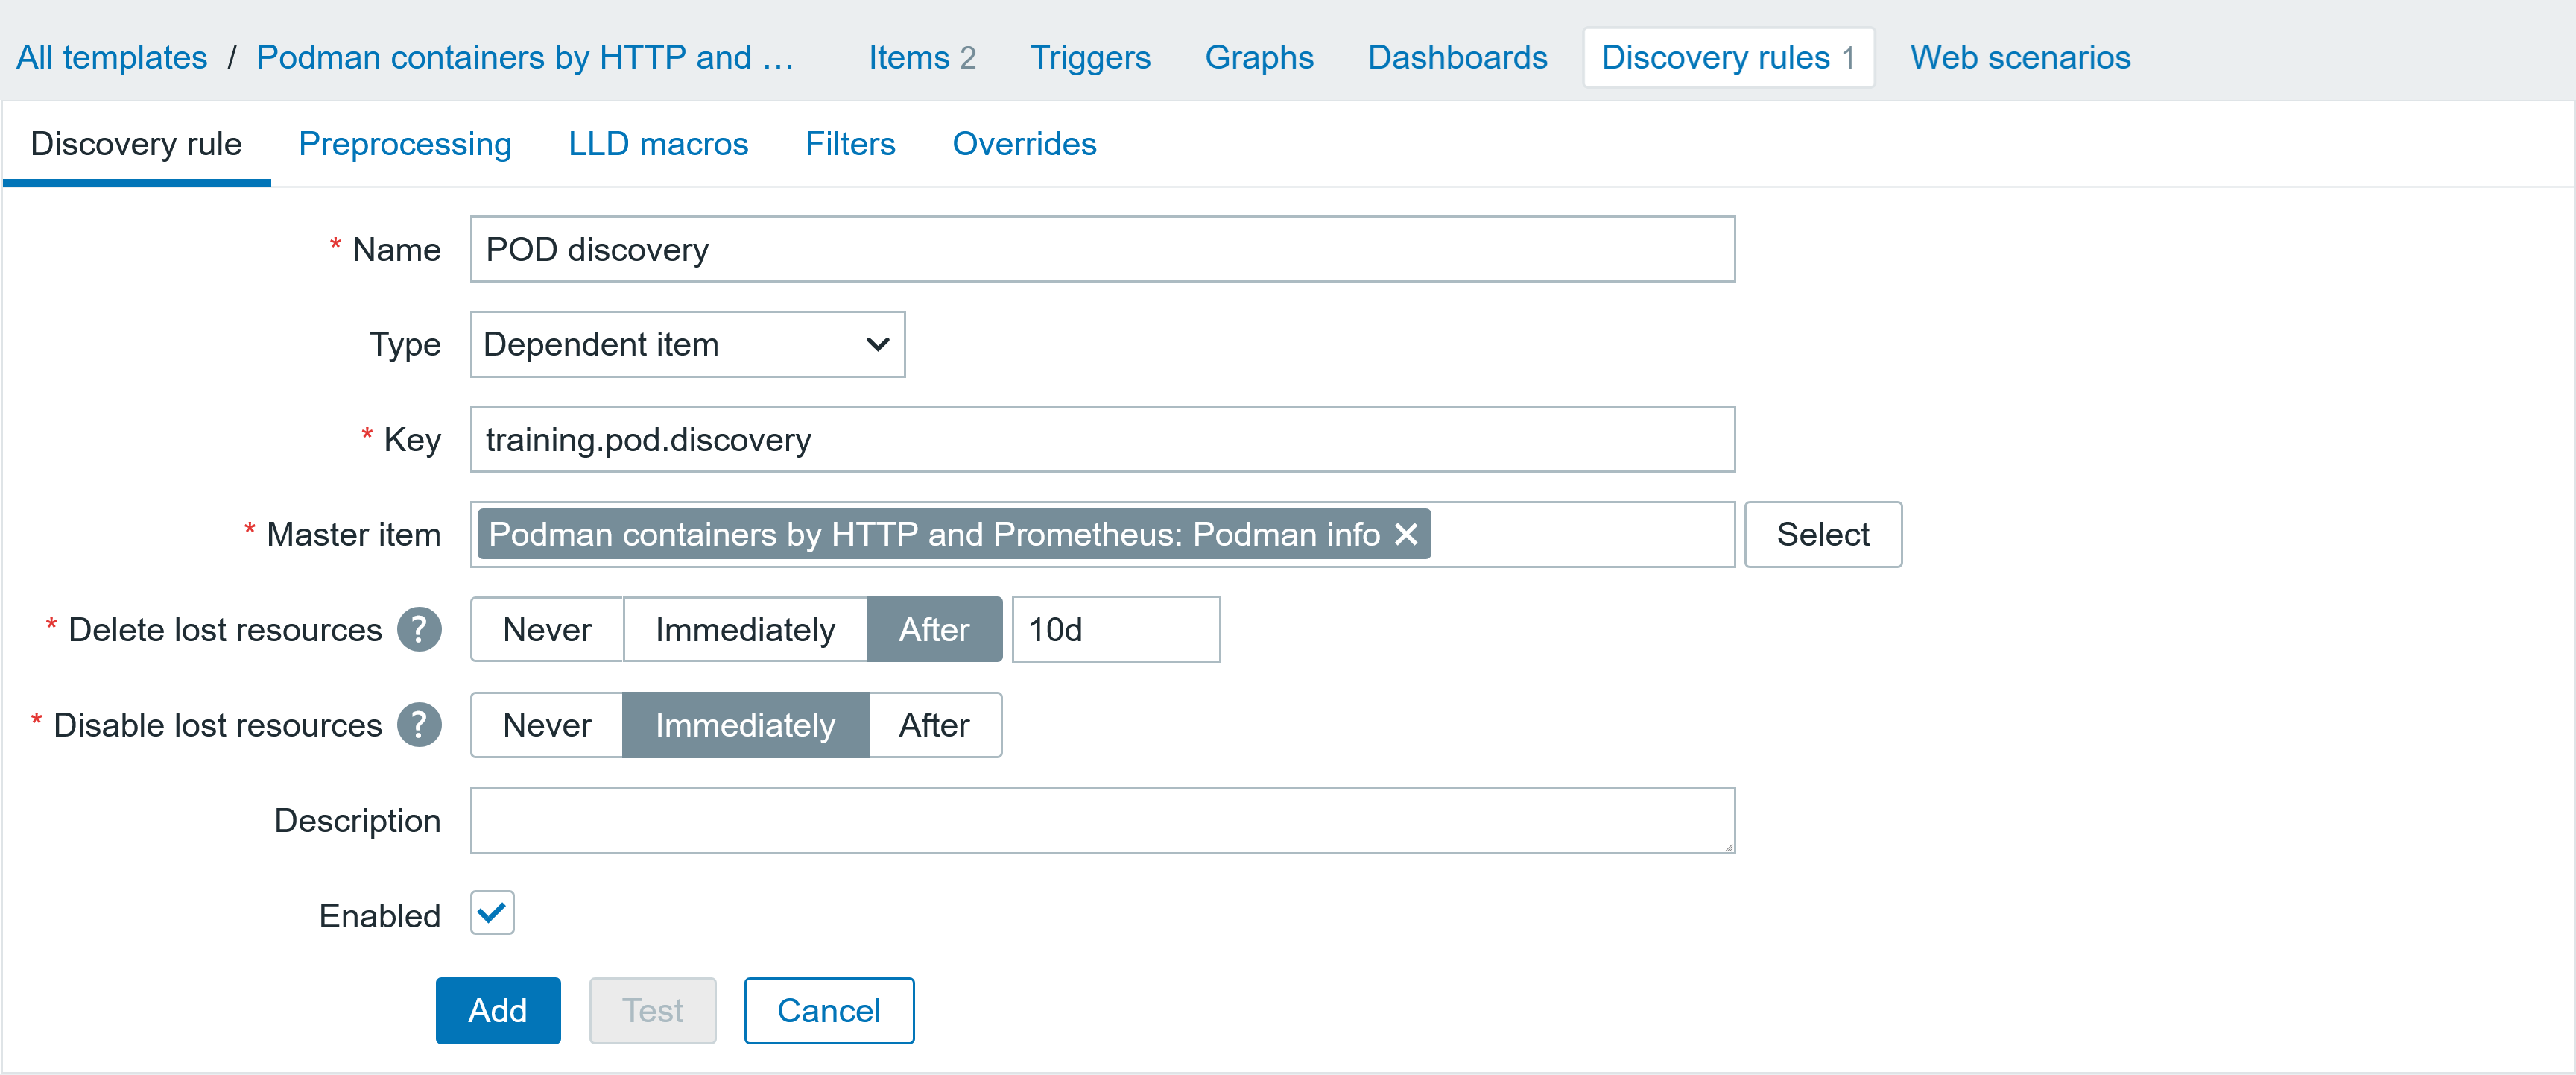
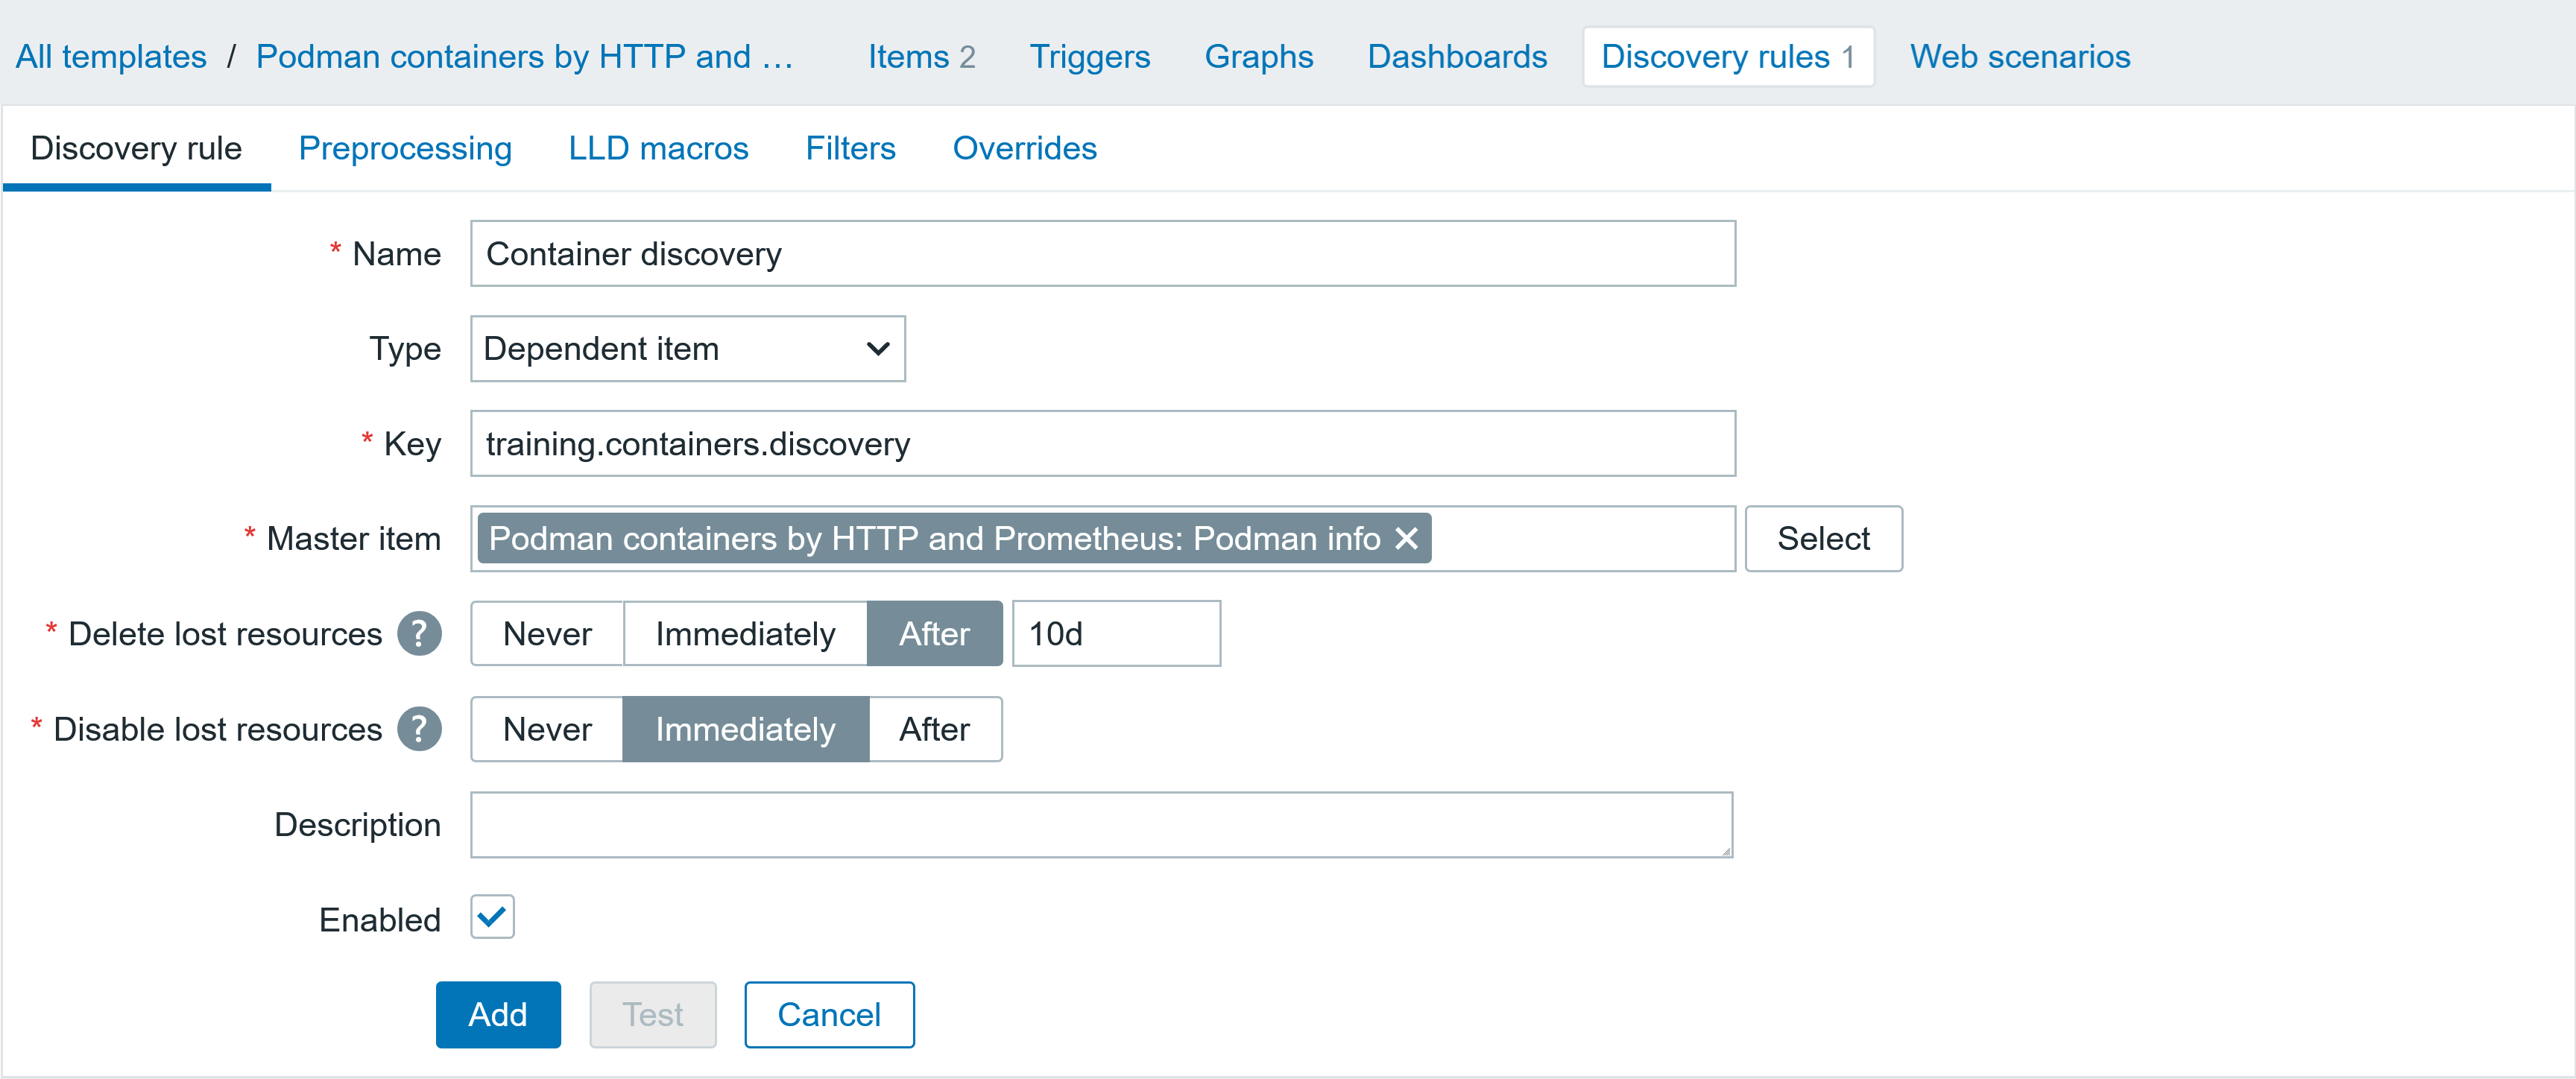
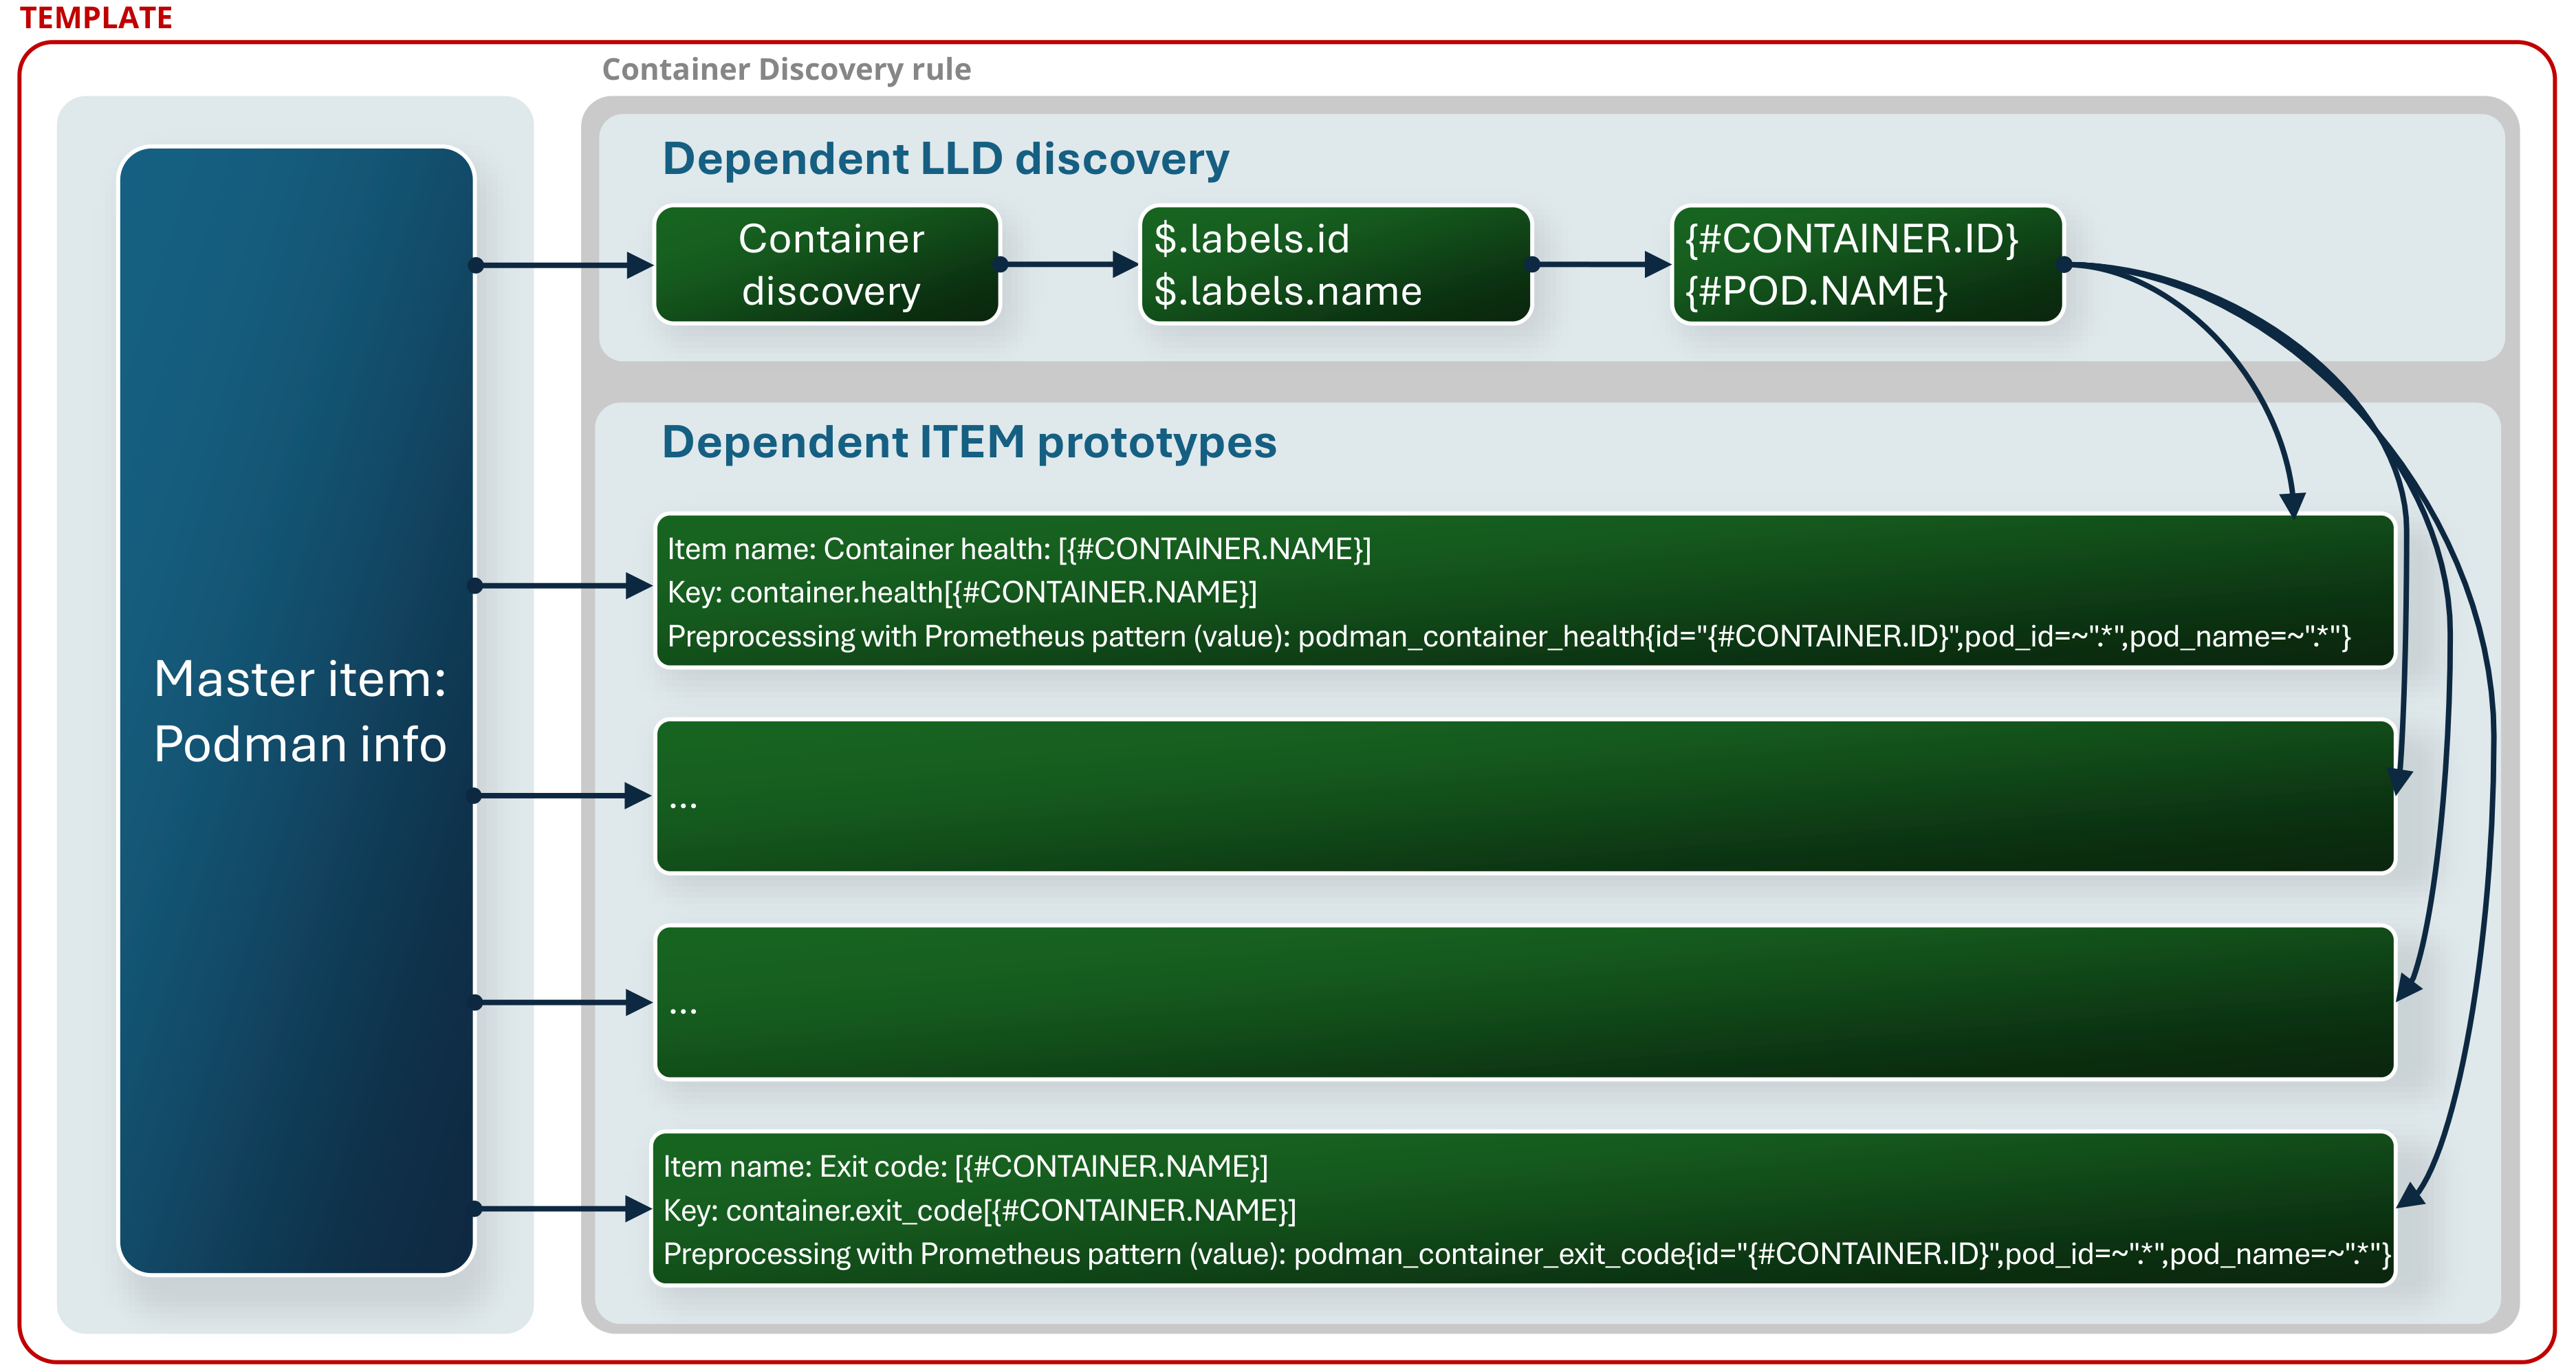
I will create another discovery rule for container discovery. This discovery rule is also based on the same item [Podman info] in the template – Podman containers by HTTP and Prometheus (you can check part one of this series to find out how to configure it). The parameters of the discovery rule are shown below. This discovery rule will allow us to discover the pod name and ID.
Template: Podman containers by HTTP and Prometheus
▲ Discovery rule
▪ Name: Container discovery
▪ Type Dependent item
▪ Key: training.containers.discovery
▪ Master item Podman containers by HTTP and Prometheus: Podman info
▪ Delete lost resources After 10d
▪ Disable lost resources Immediately
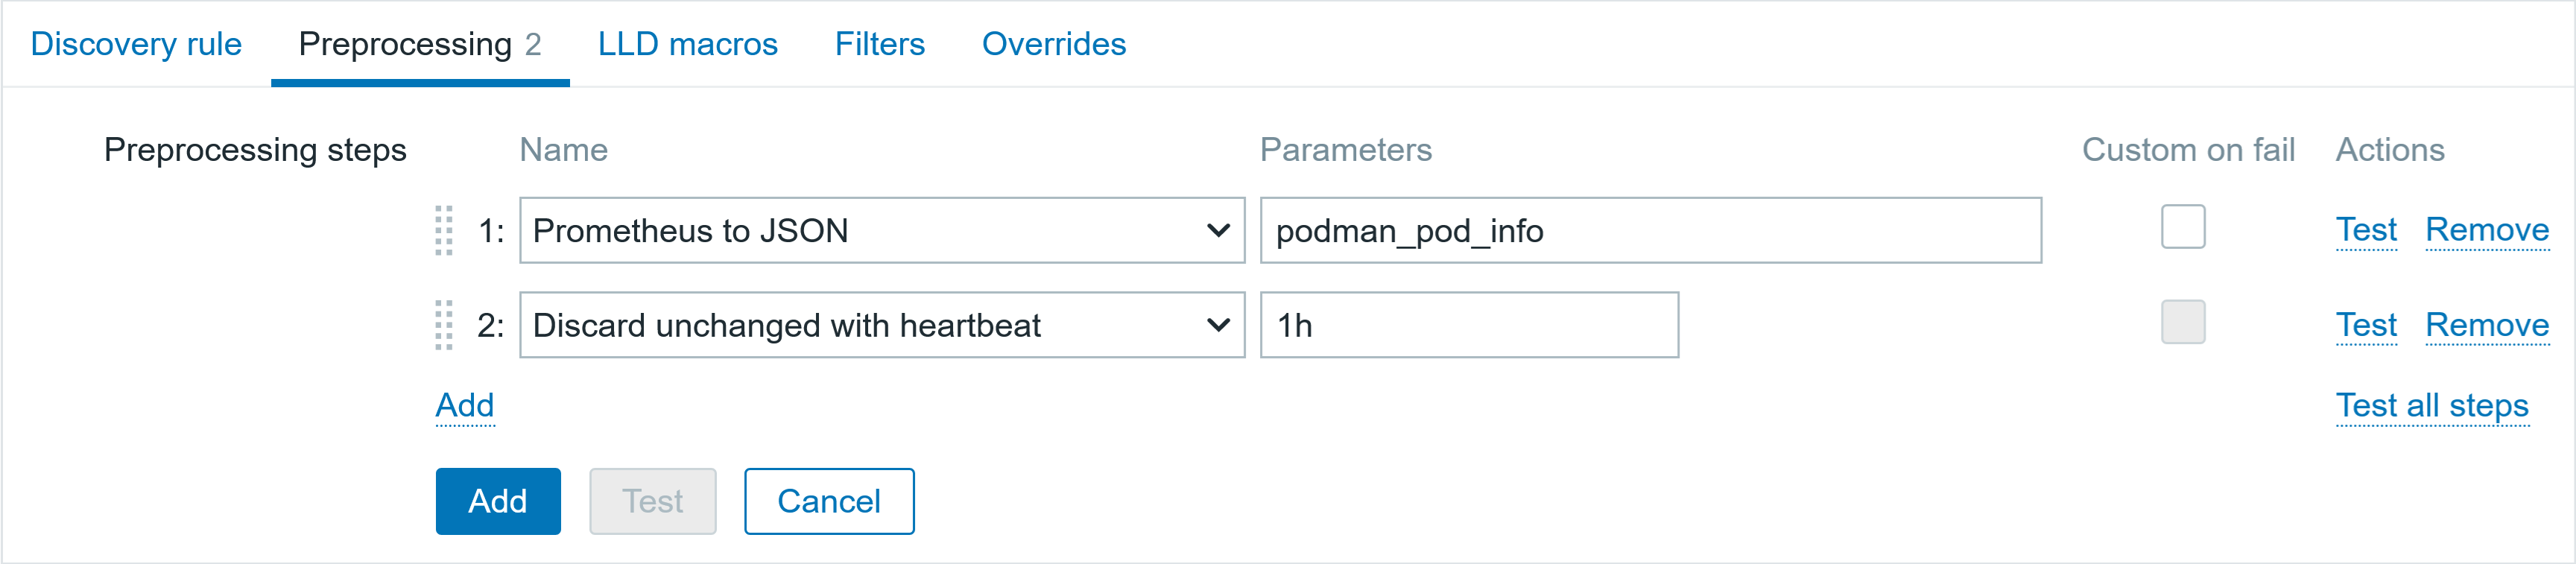
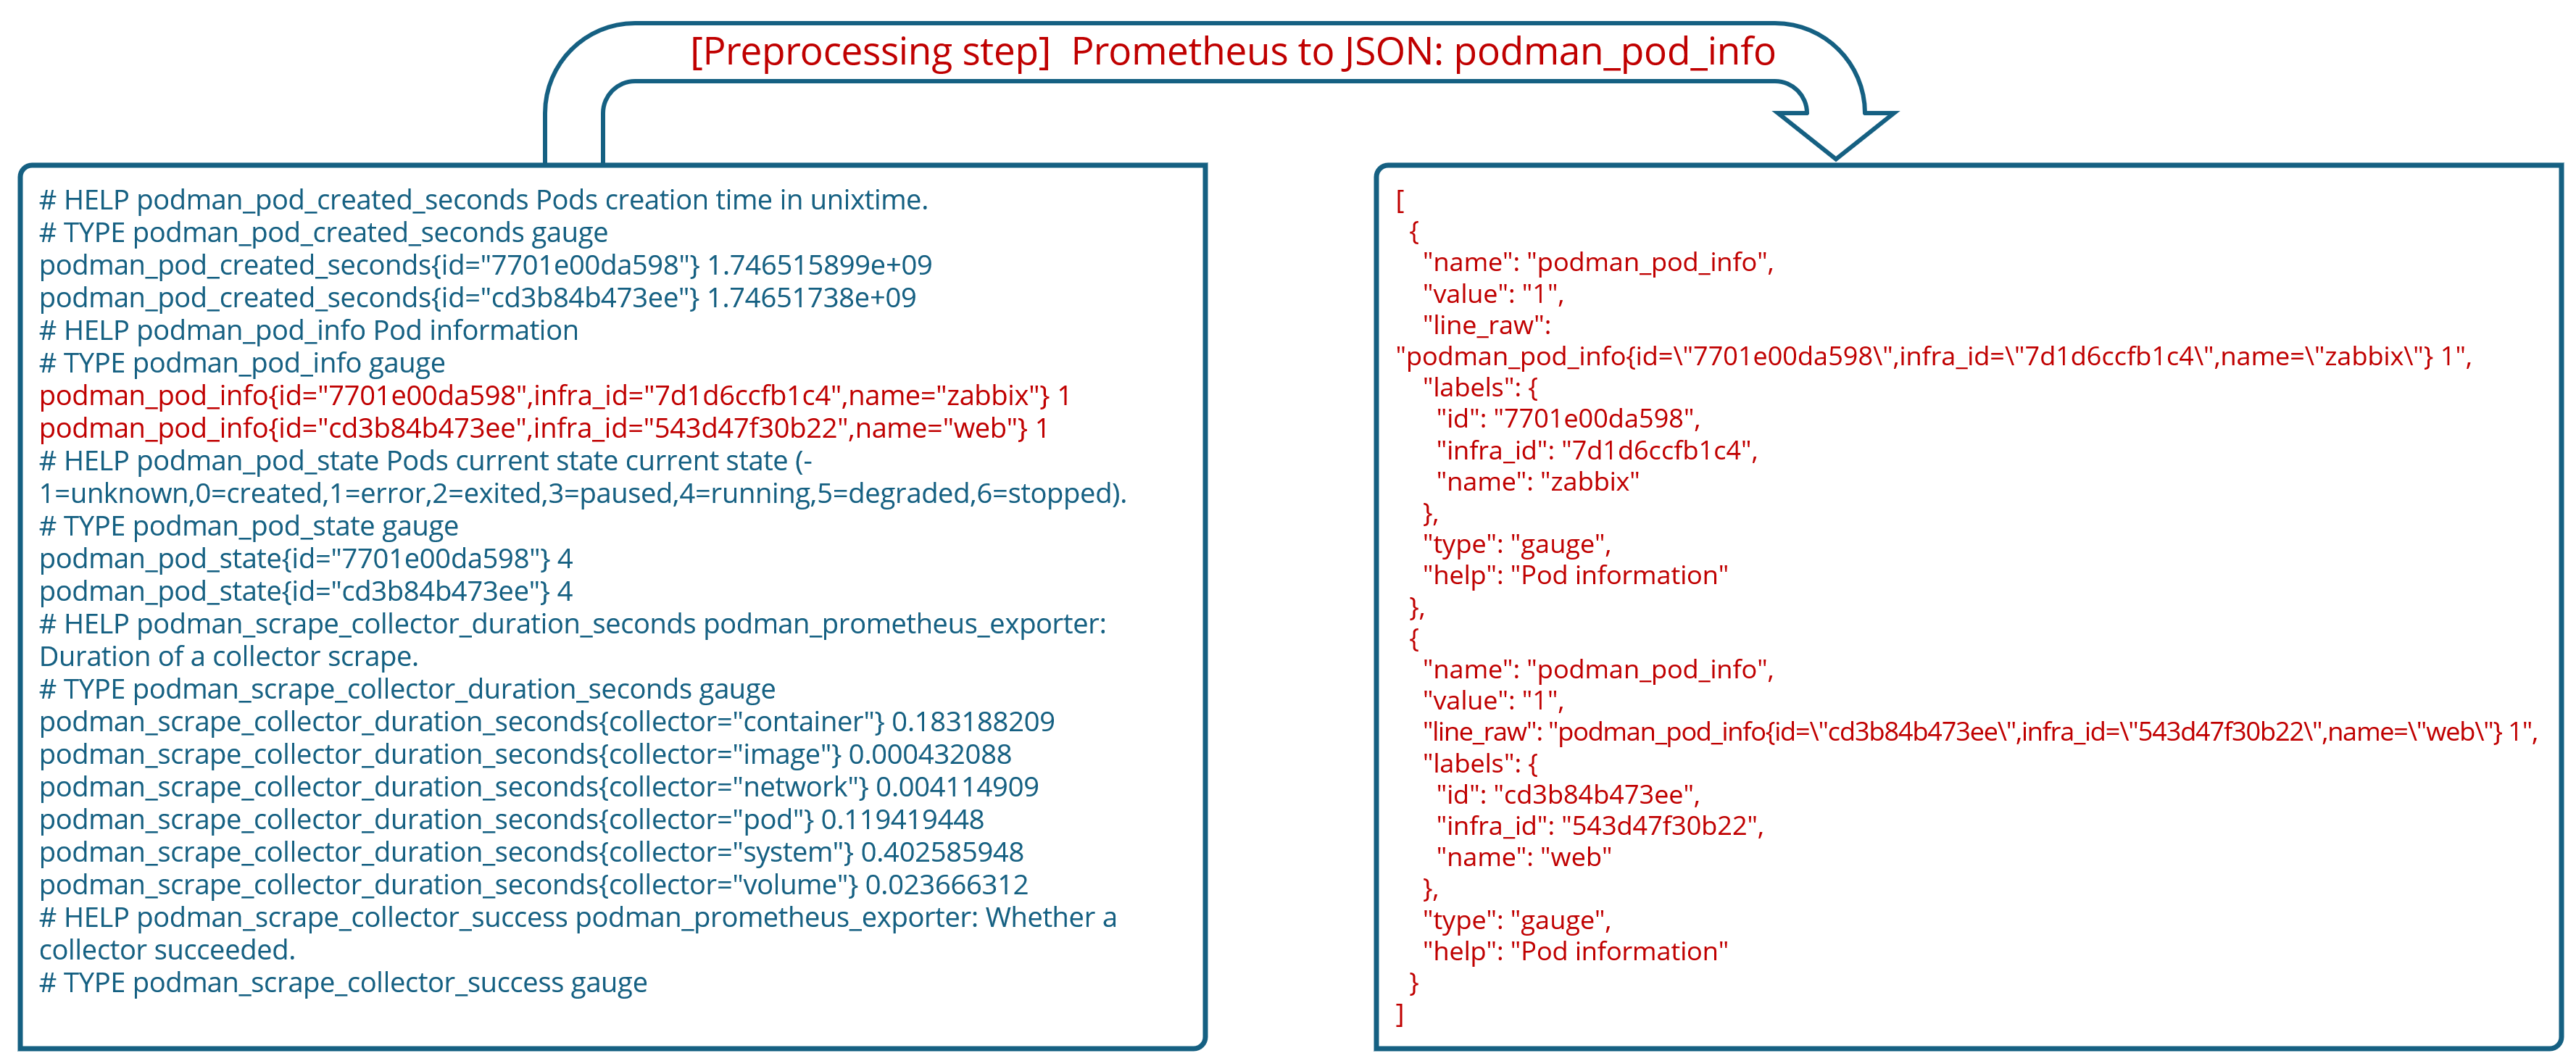
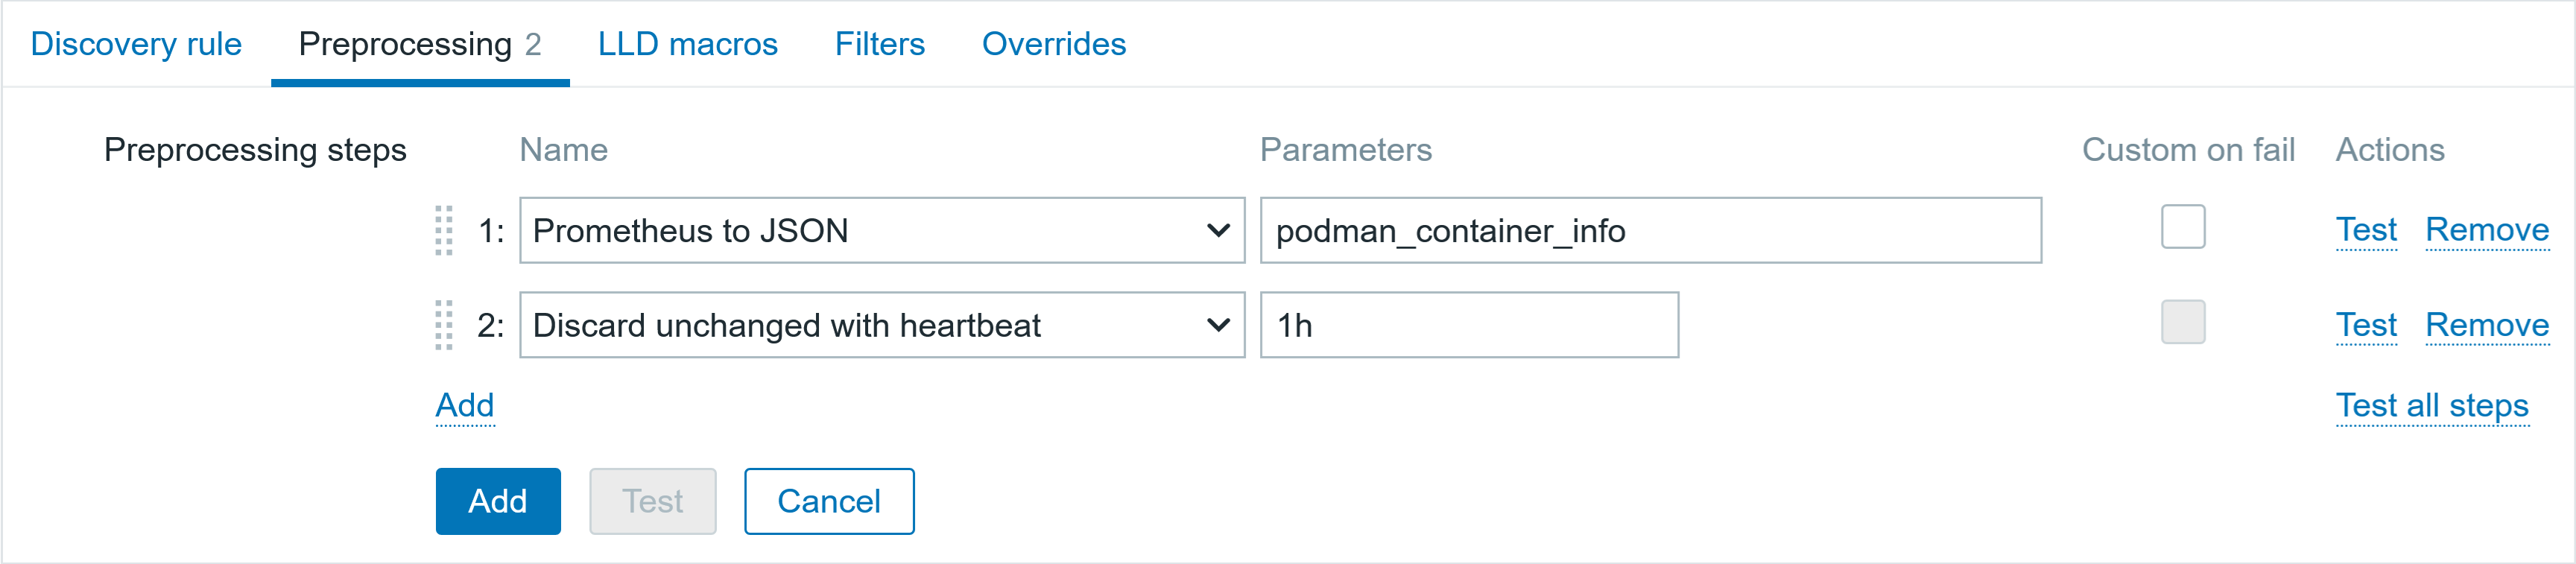
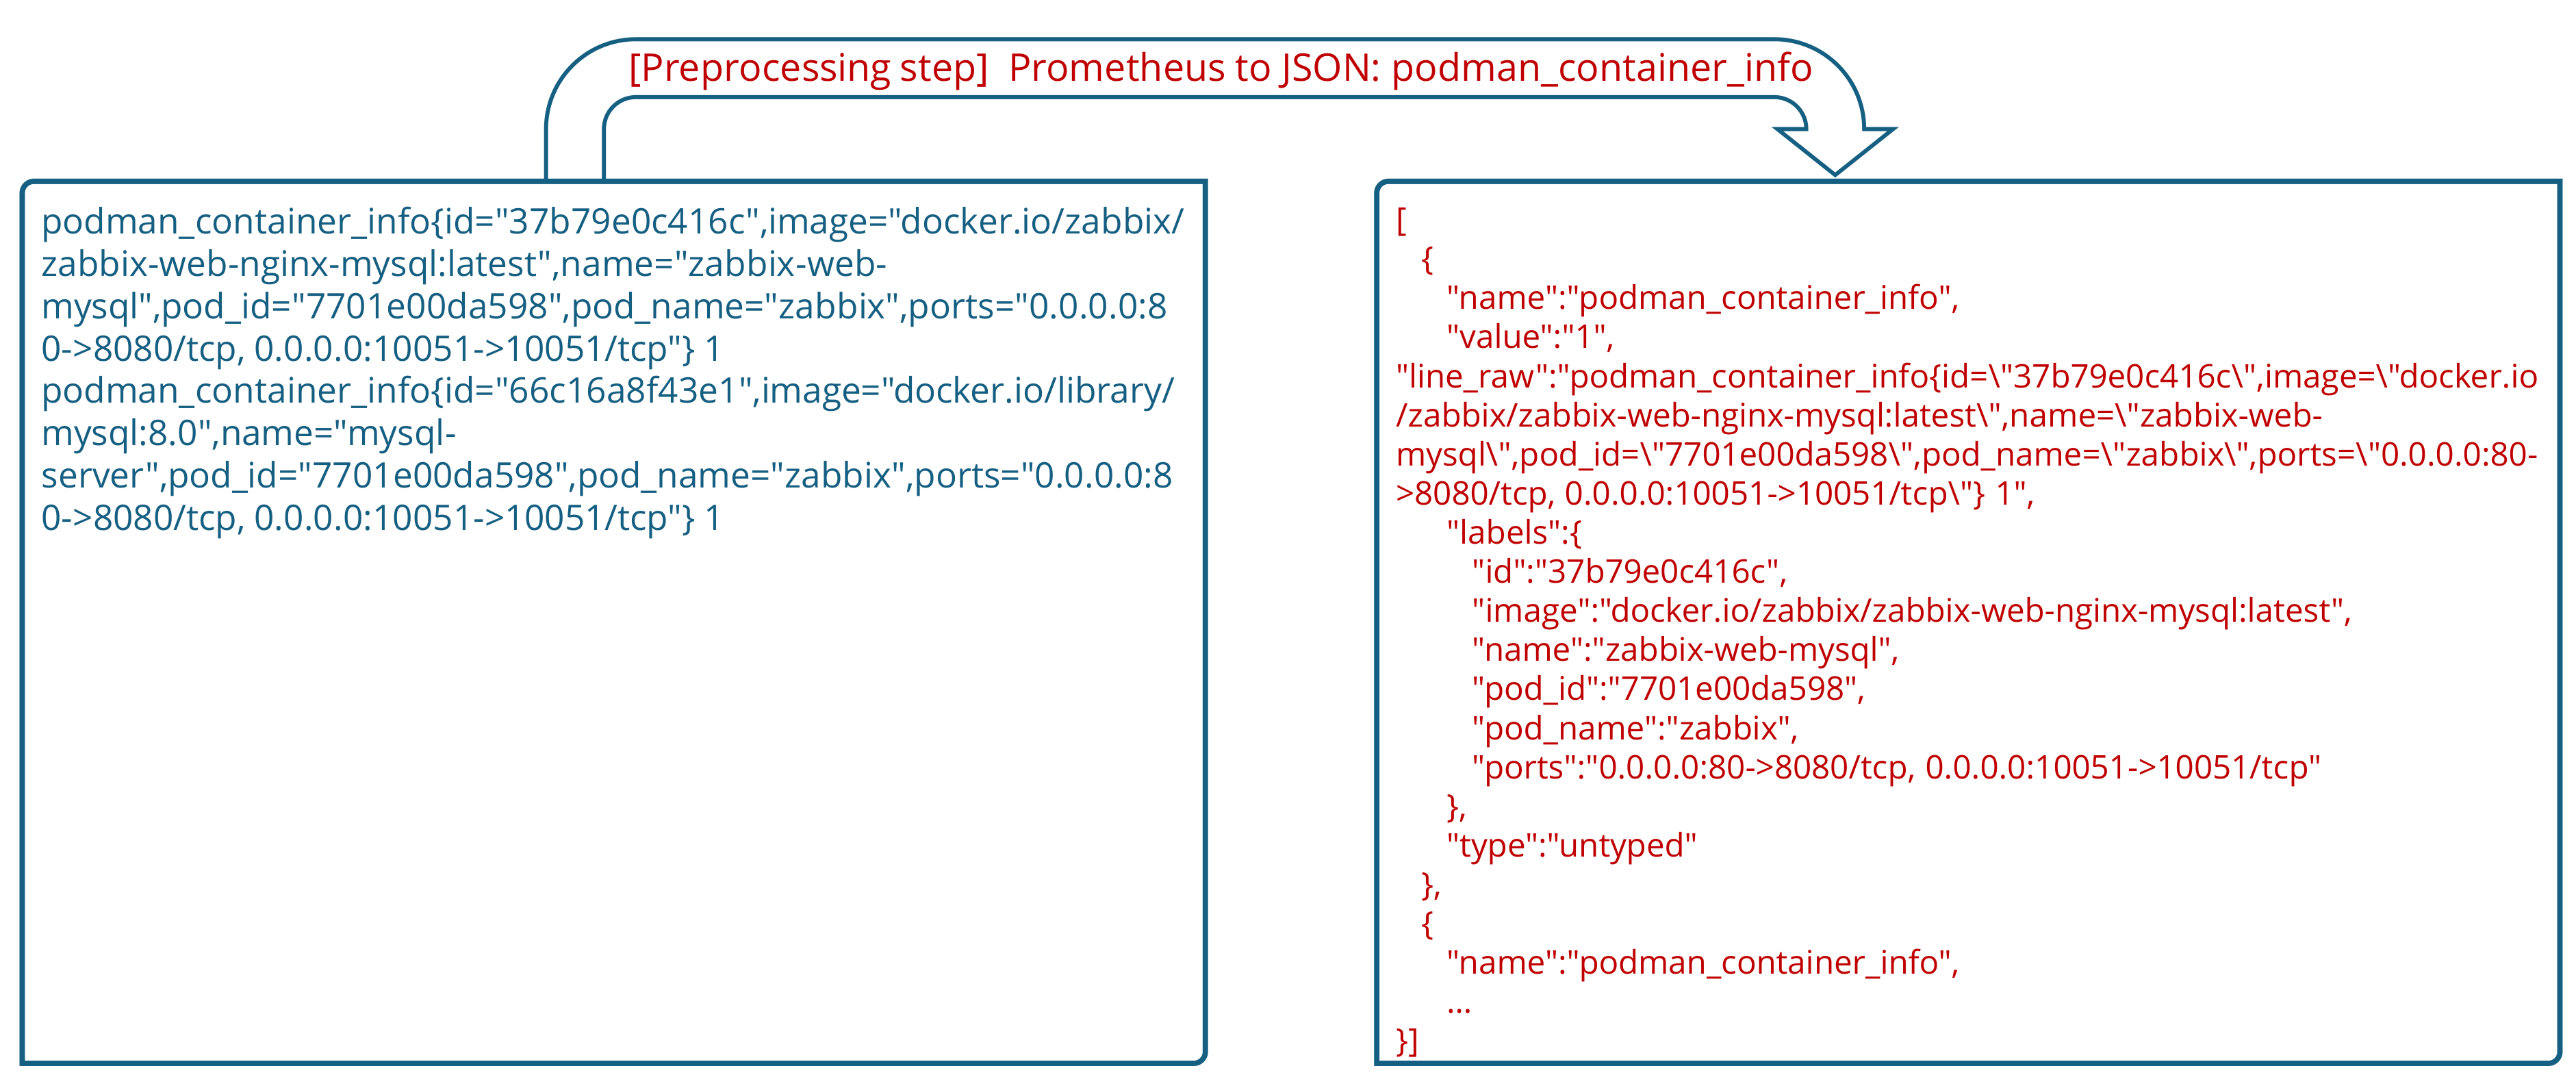
♯ Preprocessing
▪ Prometheus to JSON podman_container_info
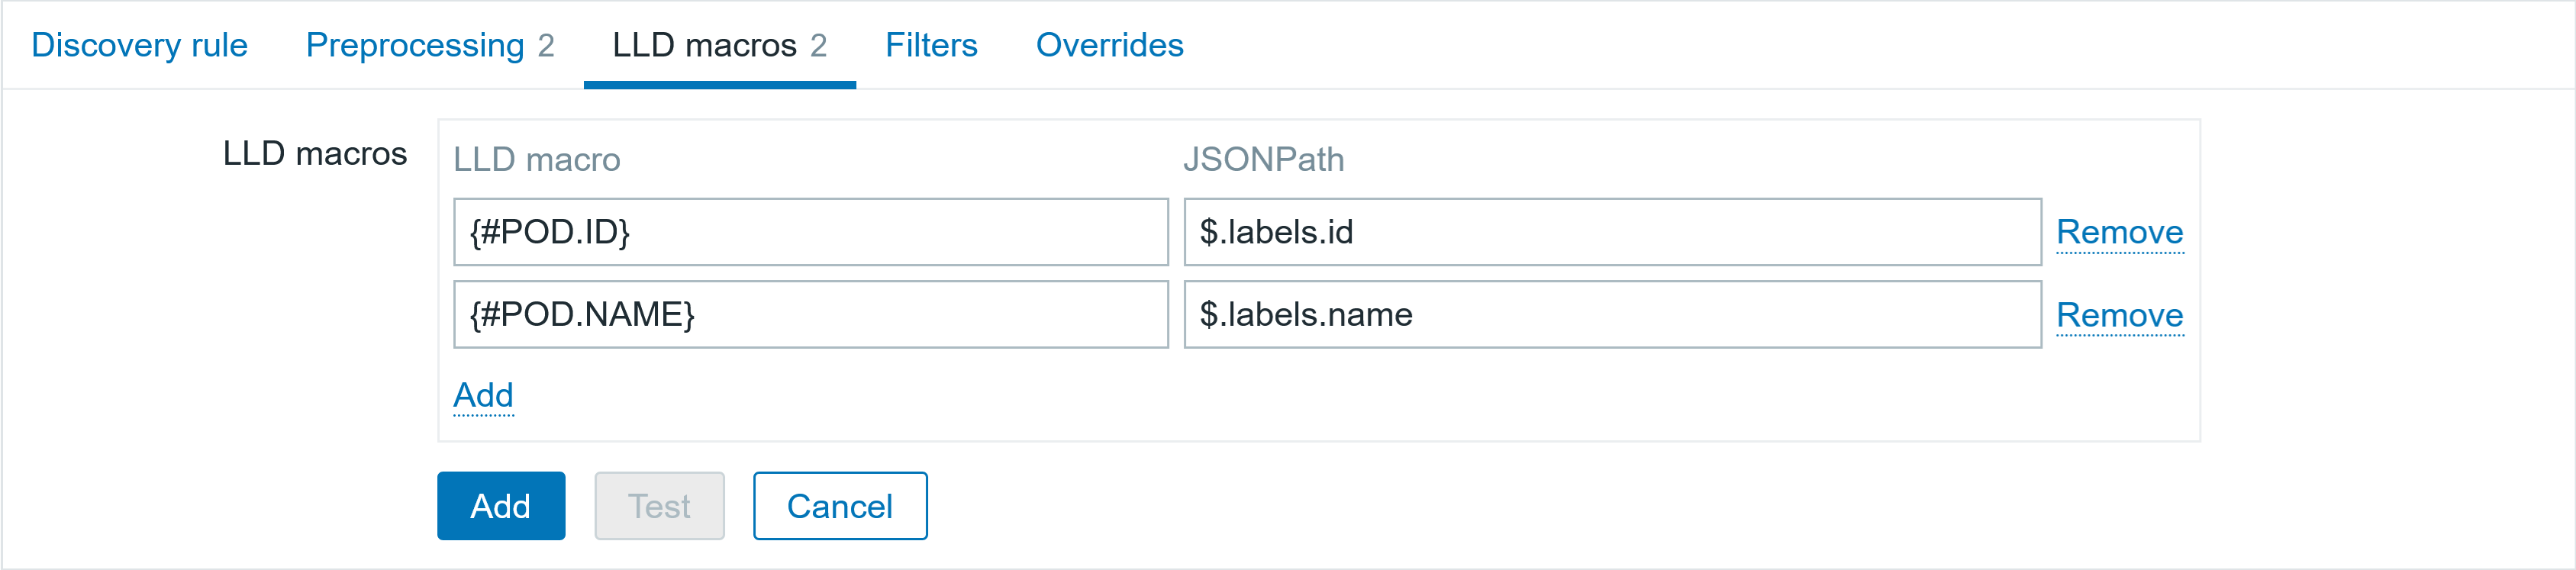
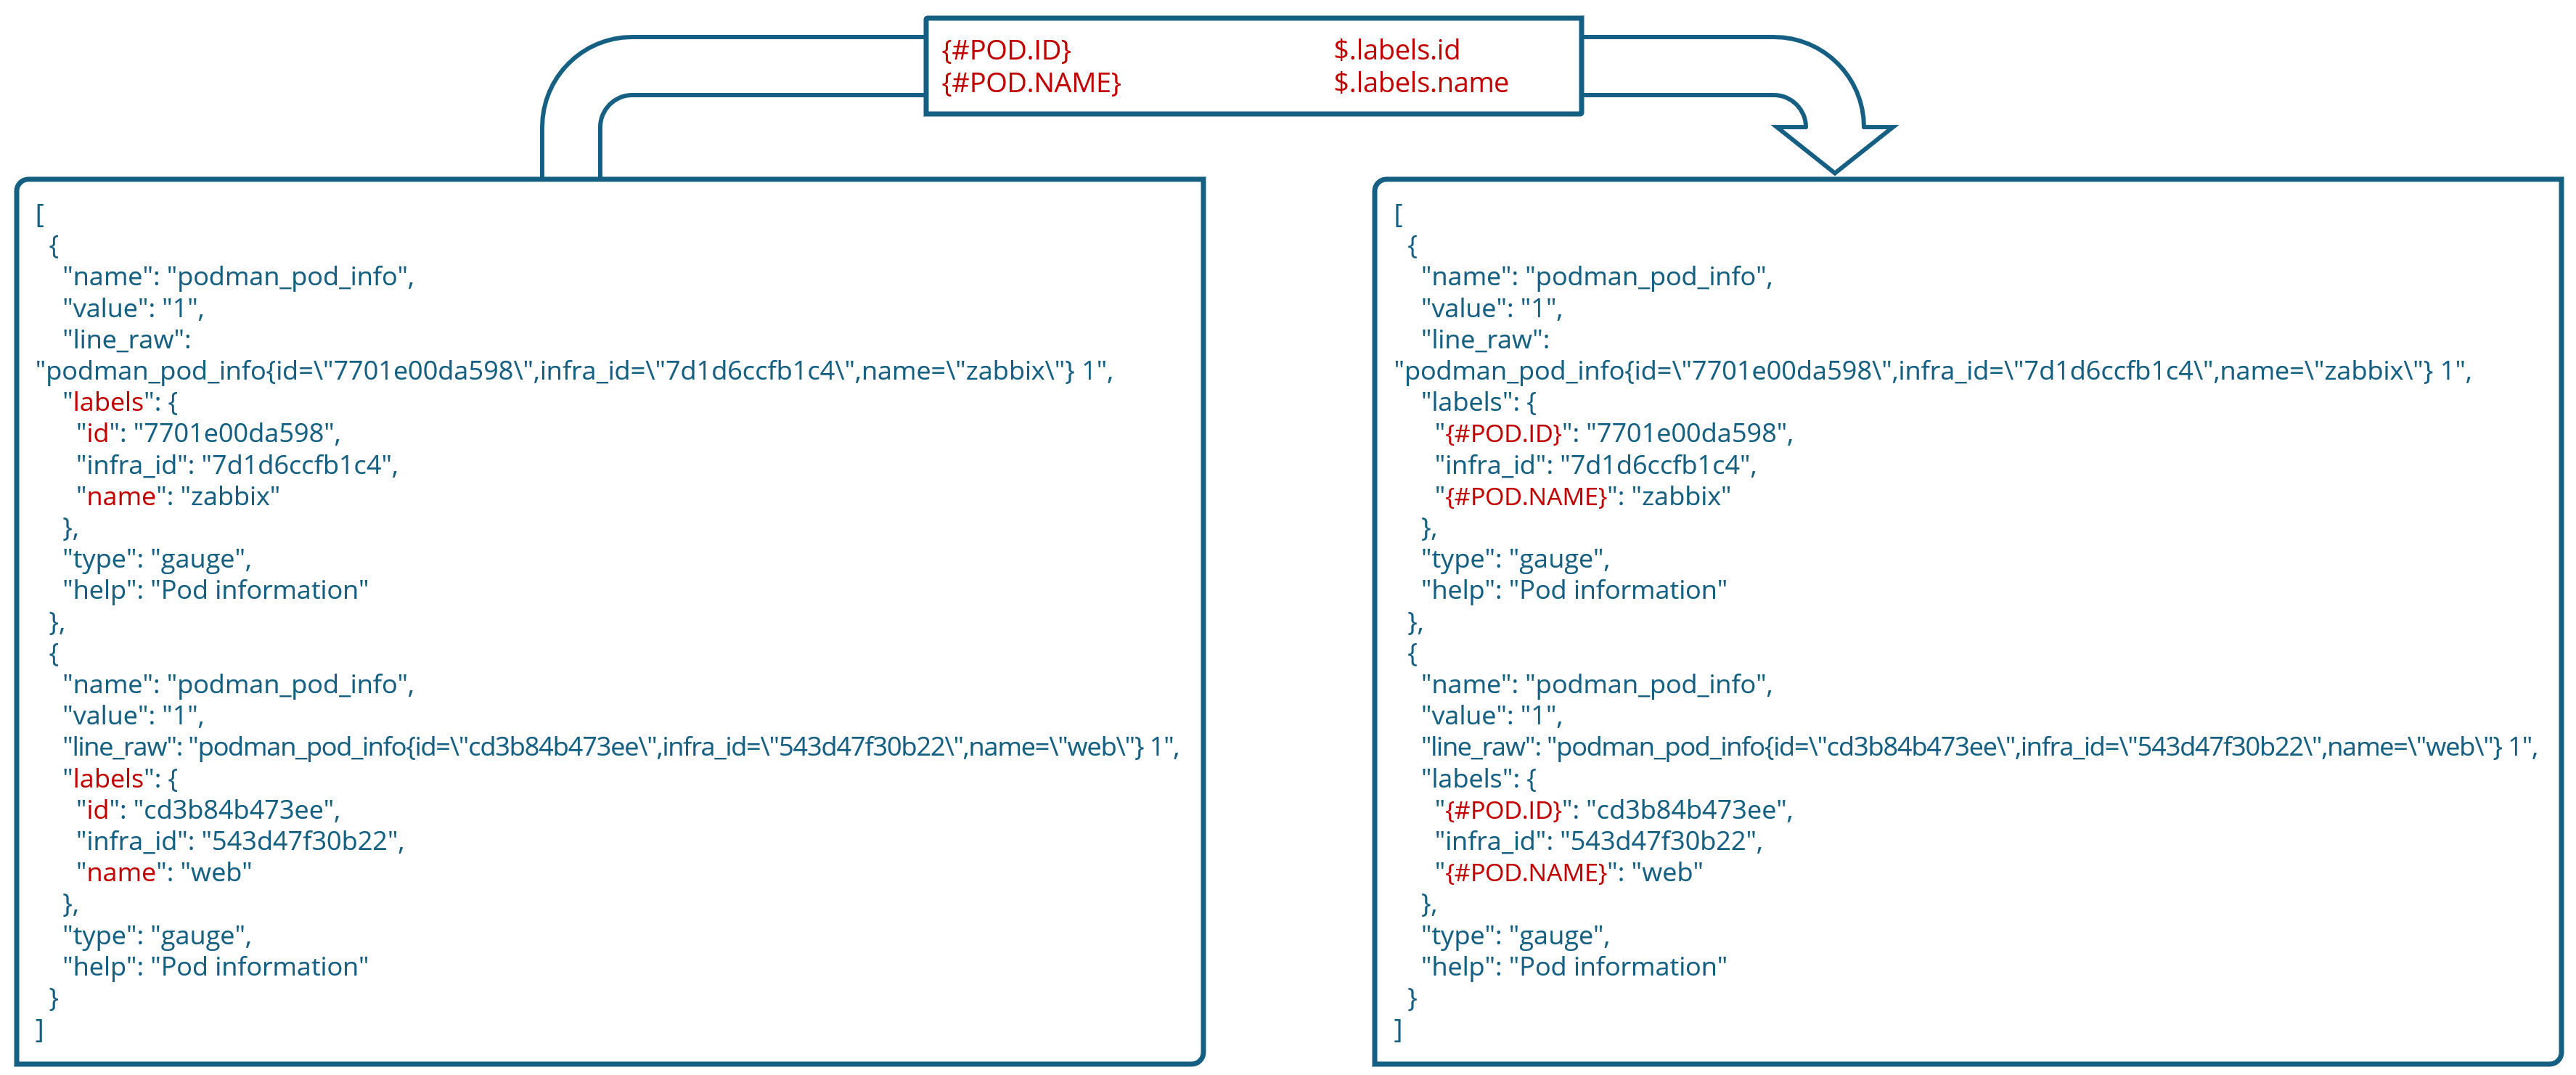
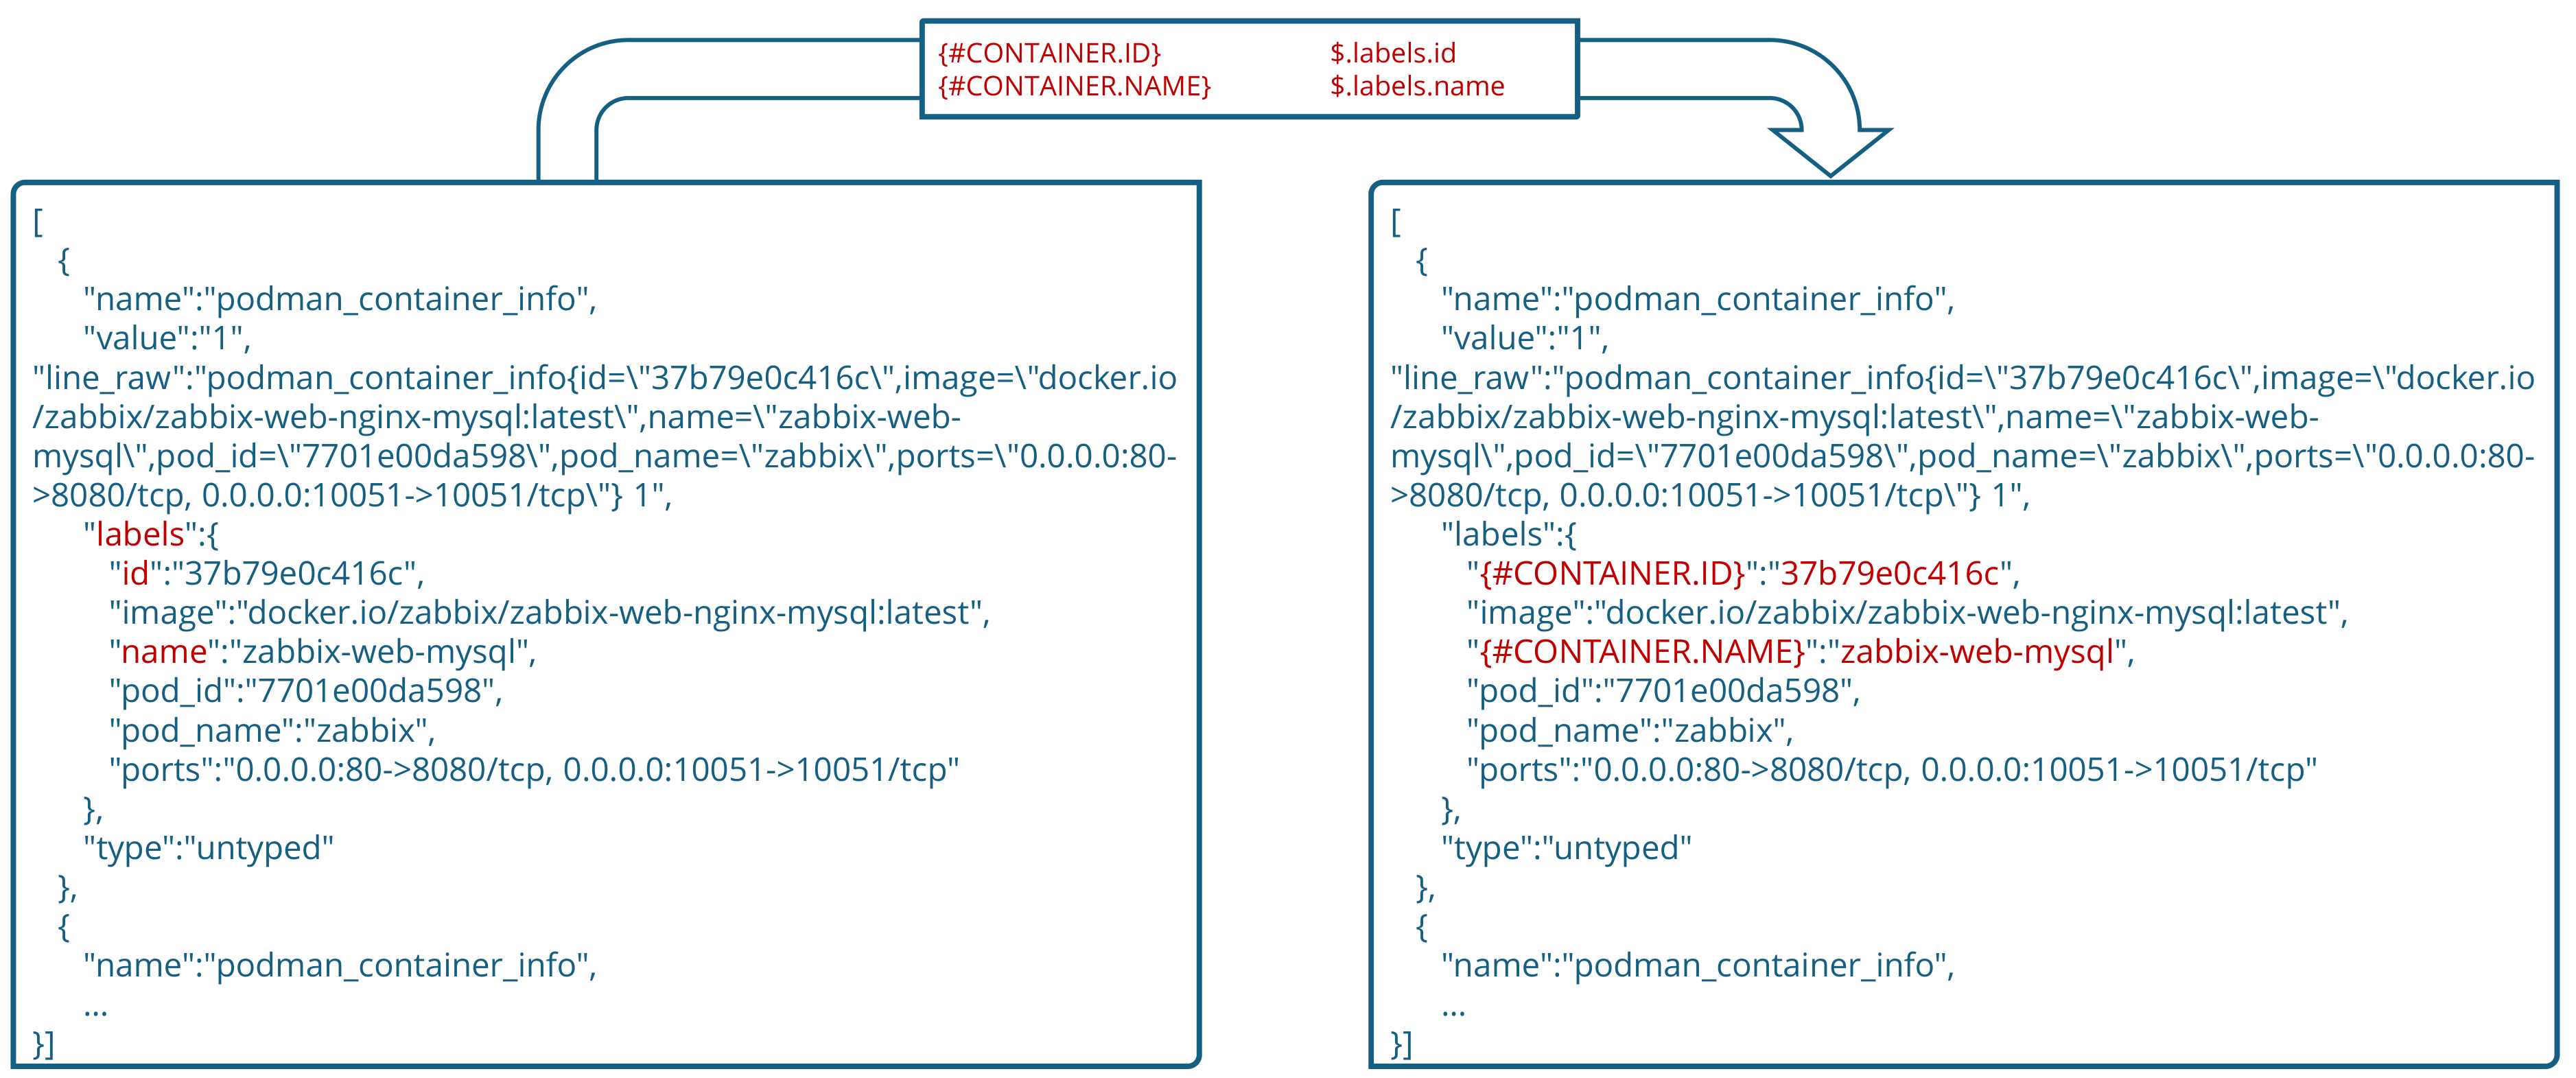
♦ LLD Macros
▪ {#CONTAINER.ID} $.labels.id
▪ {#CONTAINER.NAME} $.labels.name

Next, different dependent item prototypes are created in this container discovery rule. As the Prometheus Podman exporter provides a lot of different metrics about the containers, I will create multiple such items: state, health, creation date, input/output network traffic information, and so on. So, check out what metrics can be acquired and use what is relevant for you.
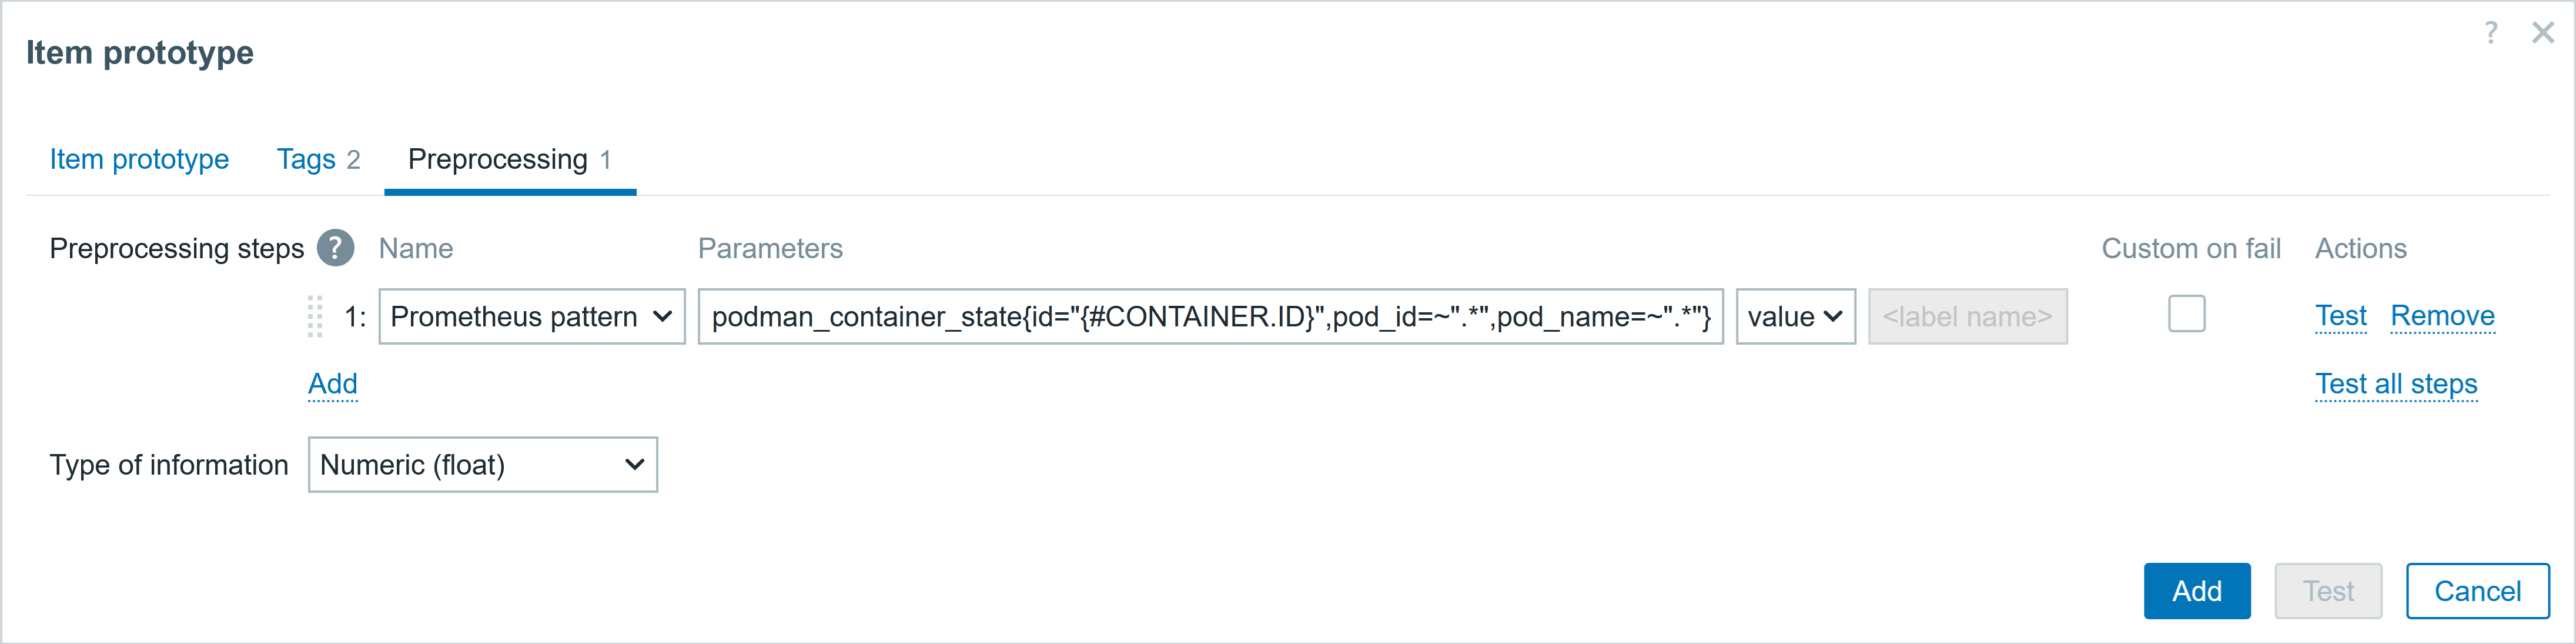
You can also add a description of each item prototype. I am interested only in metrics with the discovered container ID macros, and I am not interested in what values are for the other fields, such as pod_id, pod_name, so I use ~”.*”, which matches any value. I will show the item prototype configuration screenshots of one of the item prototypes.
These item prototypes are similar to each other, with some minor differences, such as Prometheus patterns, or in some cases, with a different master item (item prototype as master item).
Creating a template discovery rule: Item prototypes
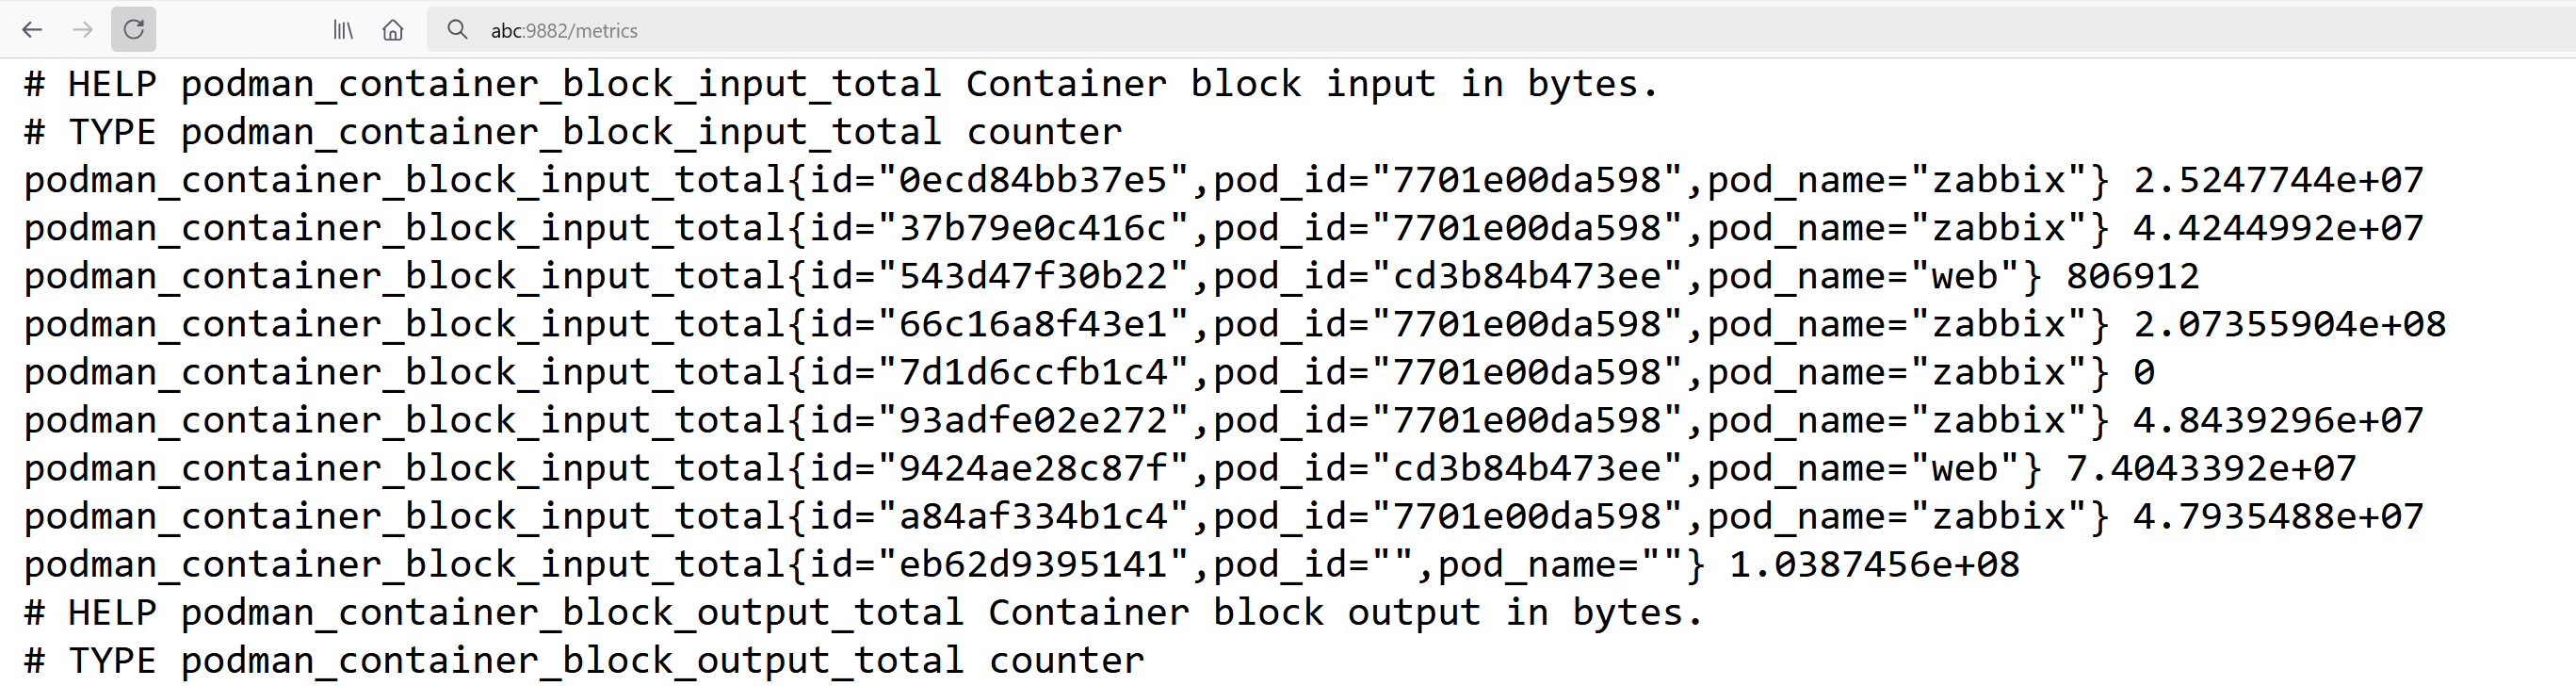
After the containers have been discovered, we have to create item prototypes. These prototypes will also be dependent item prototypes and will use the same item as the discovery rule: Podman info. Prometheus Podman exported returns a lot more metrics for the containers than it did for the pods.
You can get container metrics such as container health, state, creation date, disk read/write, memory usage, network usage, and more. In this blog post, I have added most of them, so check what metrics are relevant to your monitoring needs and start monitoring.
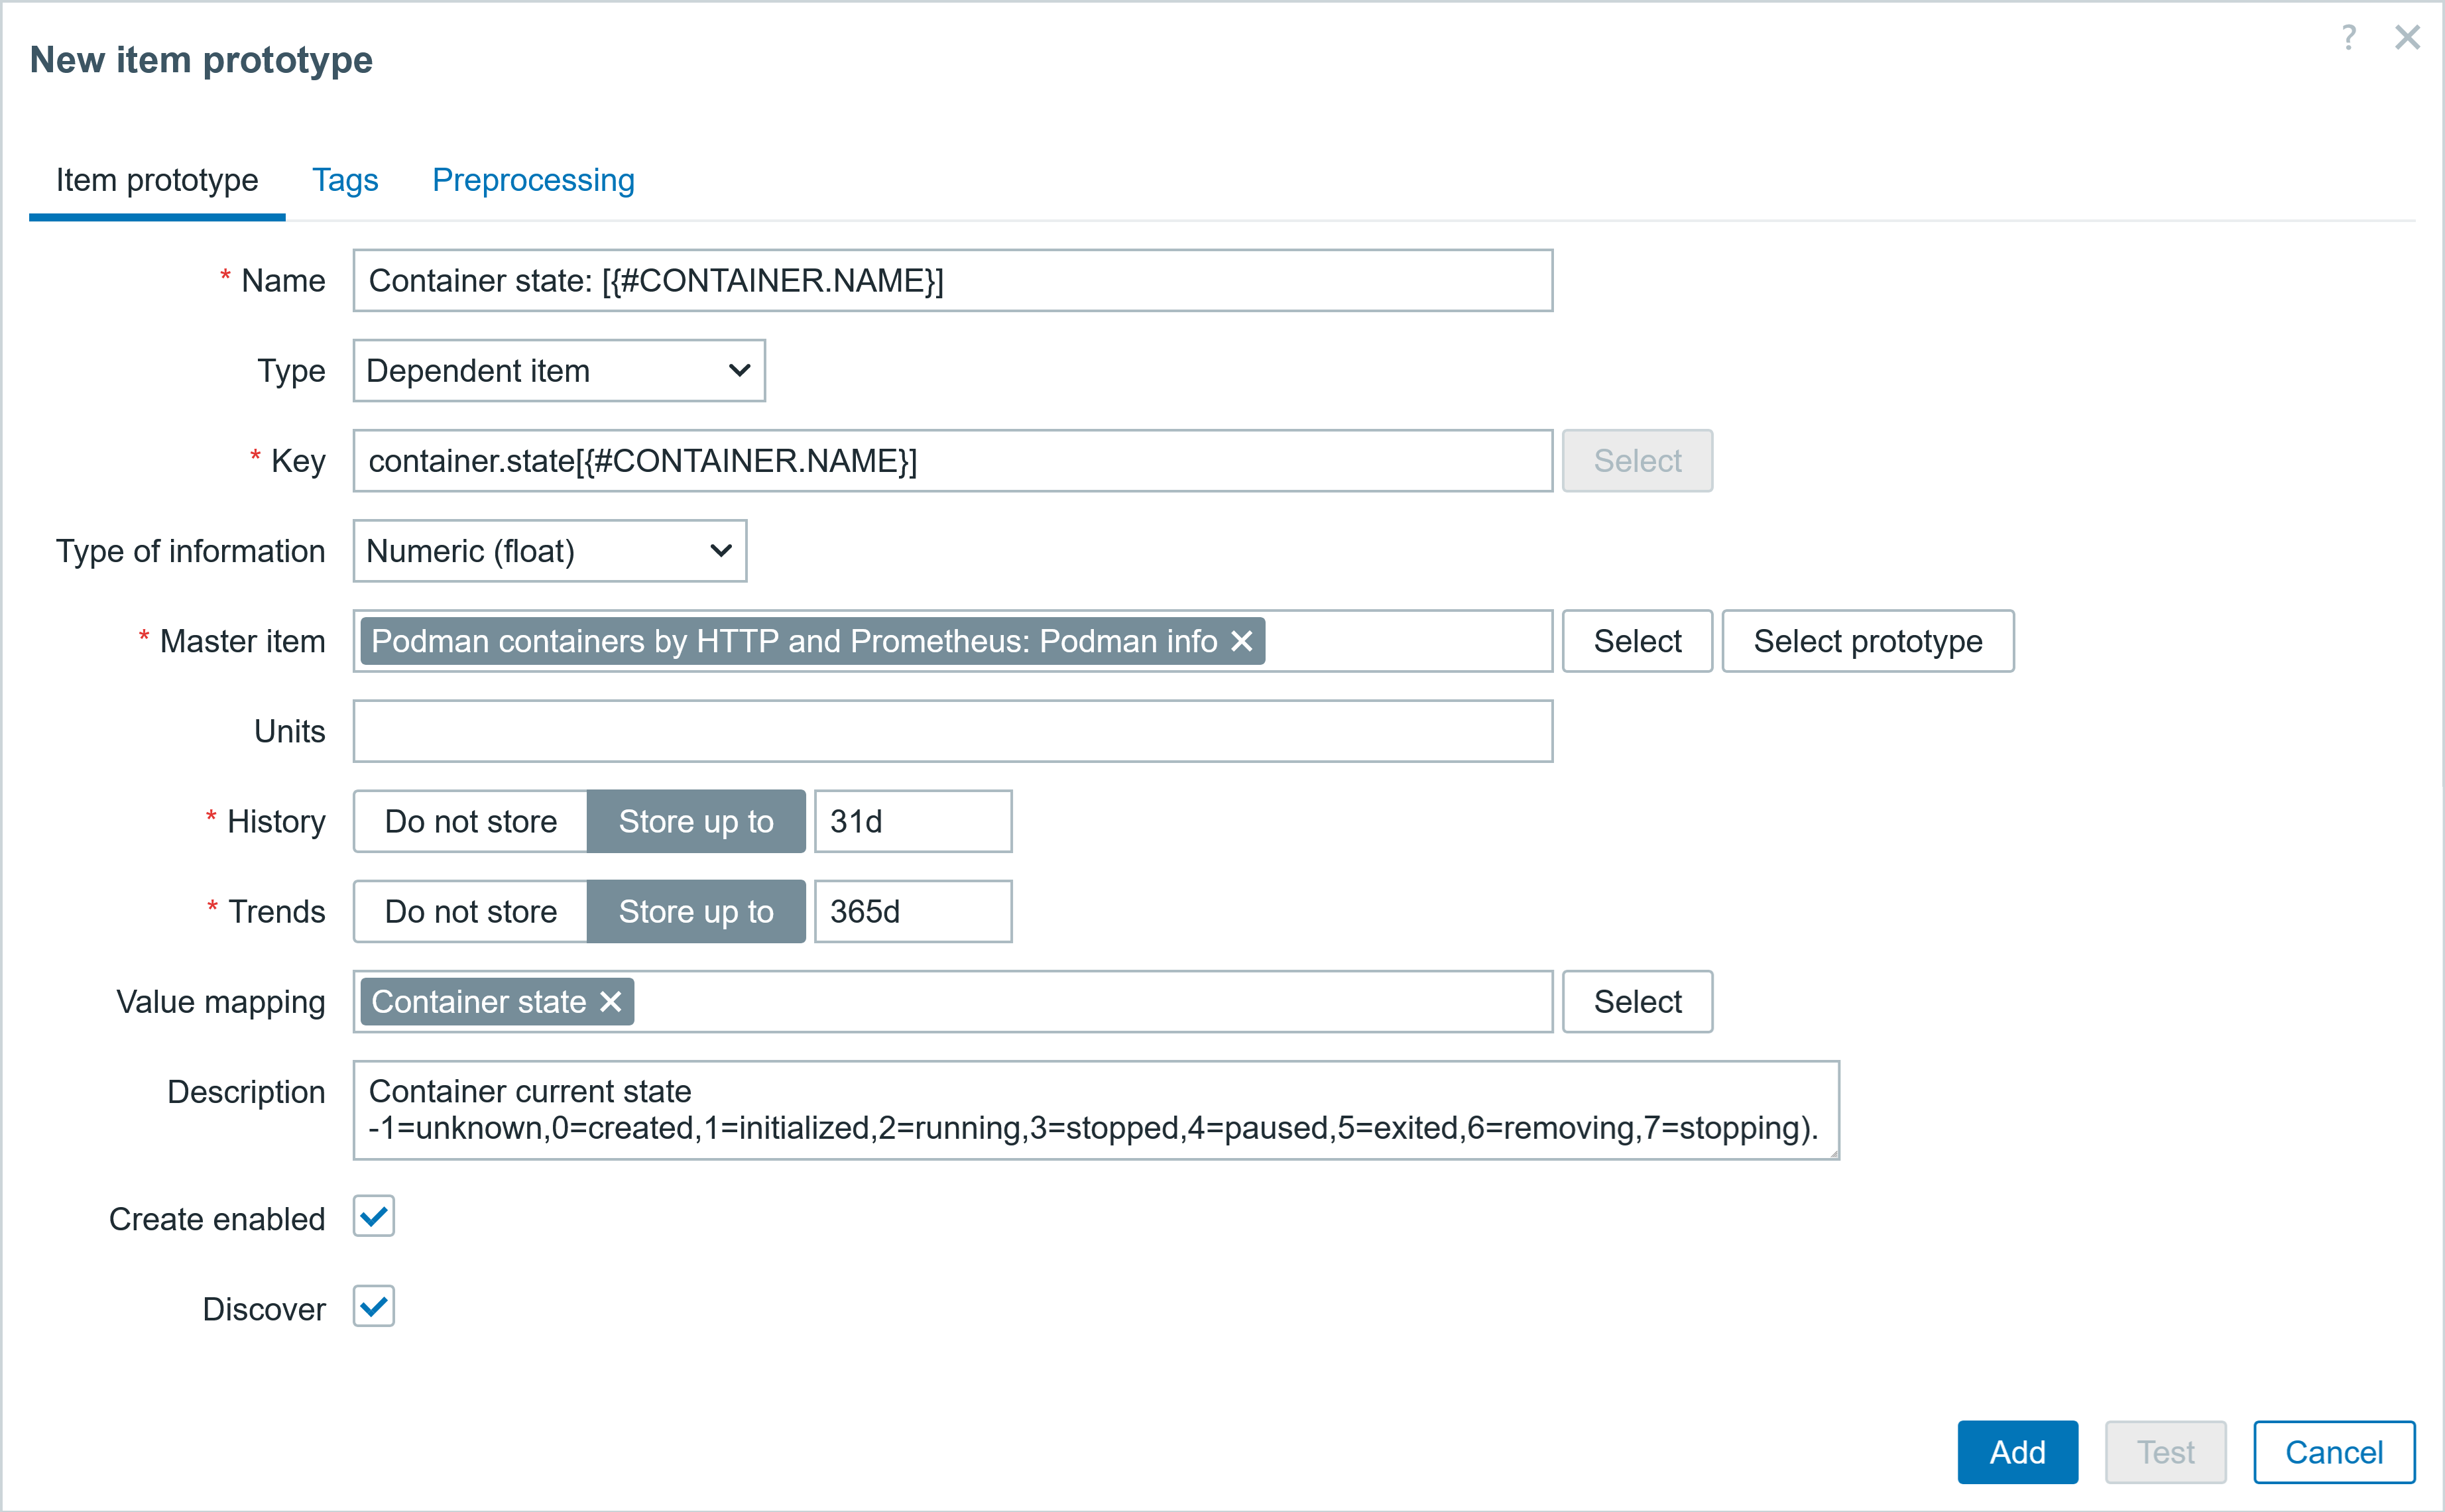
The screenshots of the item prototype is shown below.
Remember, you can also test these item prototypes in the preprocessing step – just copy the Prometheus exporter data and set the relevant macro to value you want to check.
The configuration parameters of the item prototypes are shown below. There are a lot of metrics you can monitor, but remember to monitor what is relevant and necessary for you.
Template: Podman containers by HTTP and Prometheus; Discovery rule: Container discovery
● Item prototype #1
▪ Name: Container health: [{#CONTAINER.NAME}]
▪ Type Dependent item
▪ Key: container.health[{#CONTAINER.NAME}]
▪ Type of inf: Numeric (float)
▪ Master item Podman containers by HTTP and Prometheus: Podman info
▪ Units:
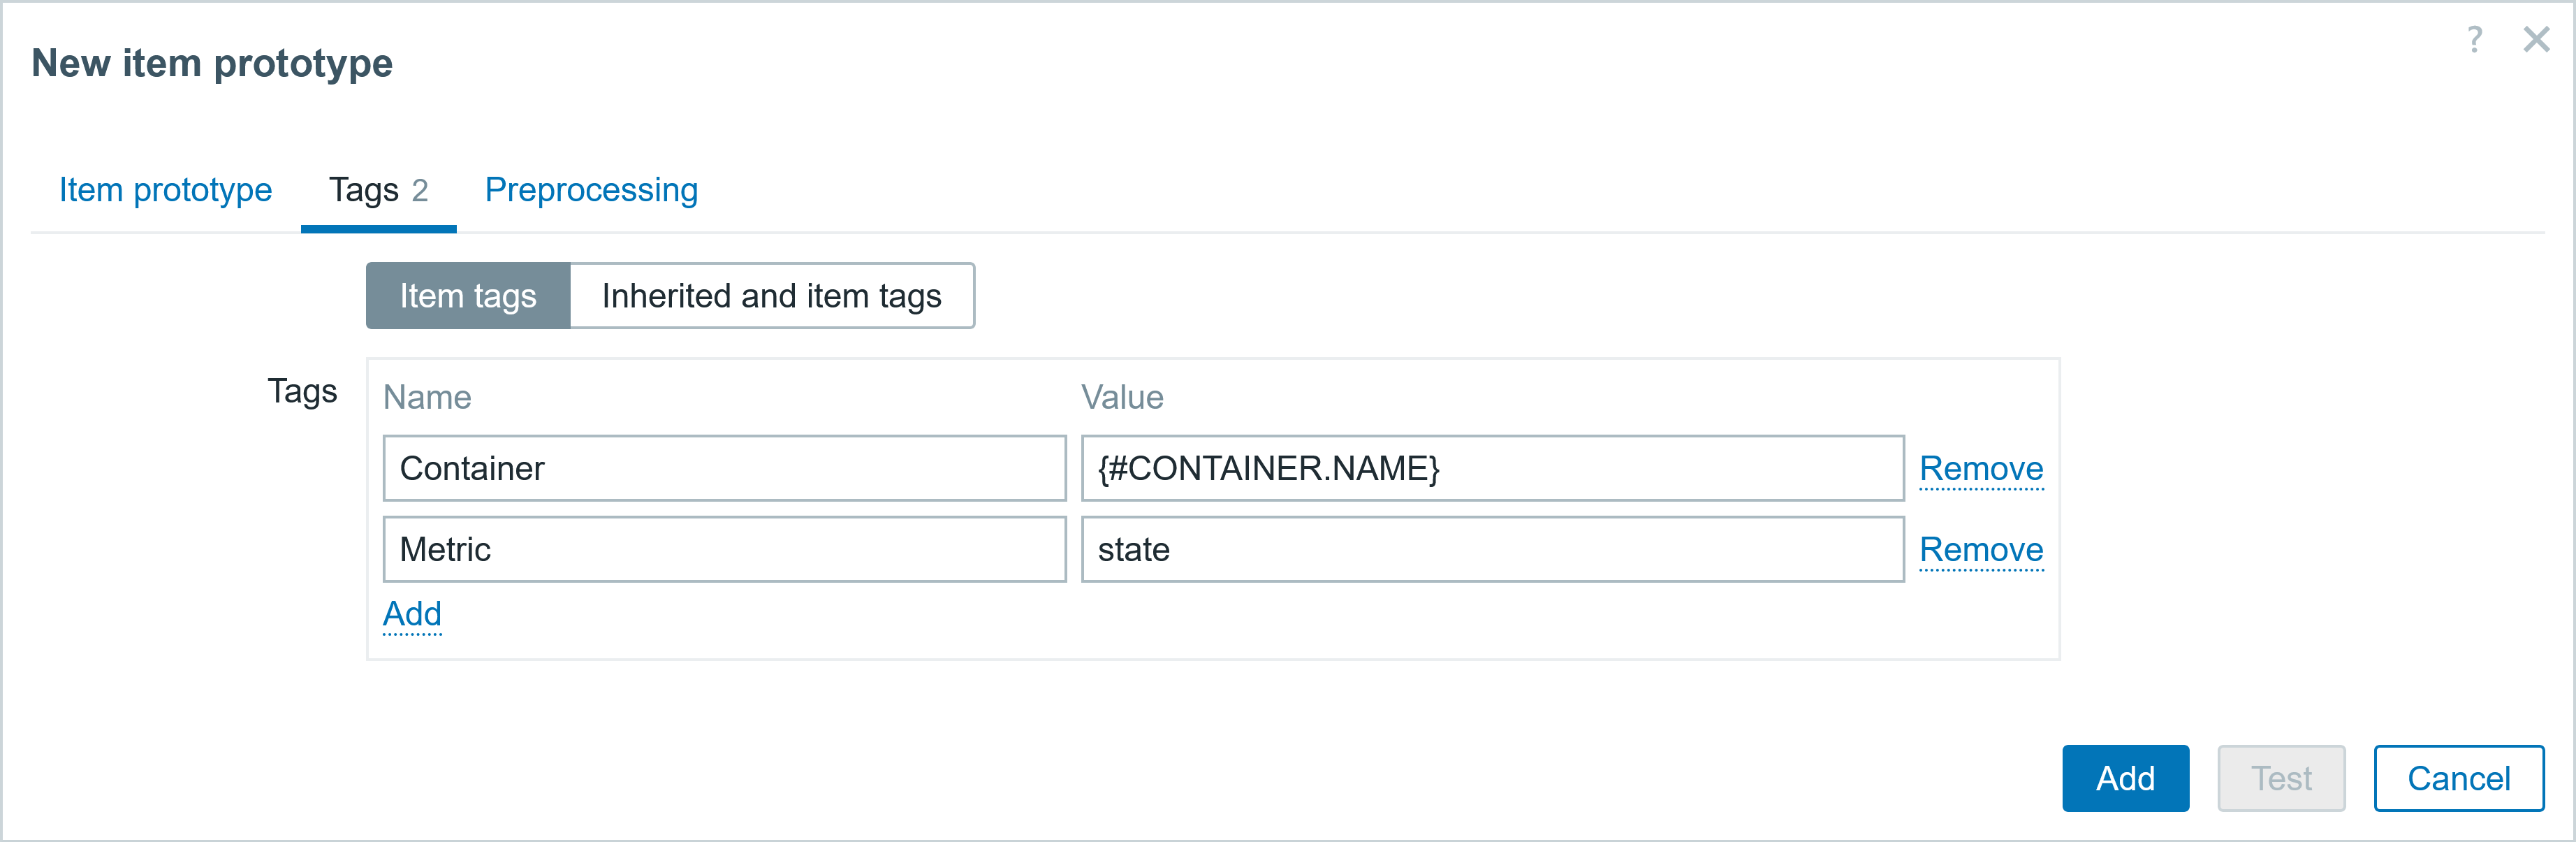
♦ Tags (name:value)
▪ Container:{#CONTAINER.NAME}
▪ Metric:health
♯ Preprocessing
▪ Prometheus pattern podman_container_health{id="{#CONTAINER.ID}",pod_id=~".*",pod_name=~".*"} value
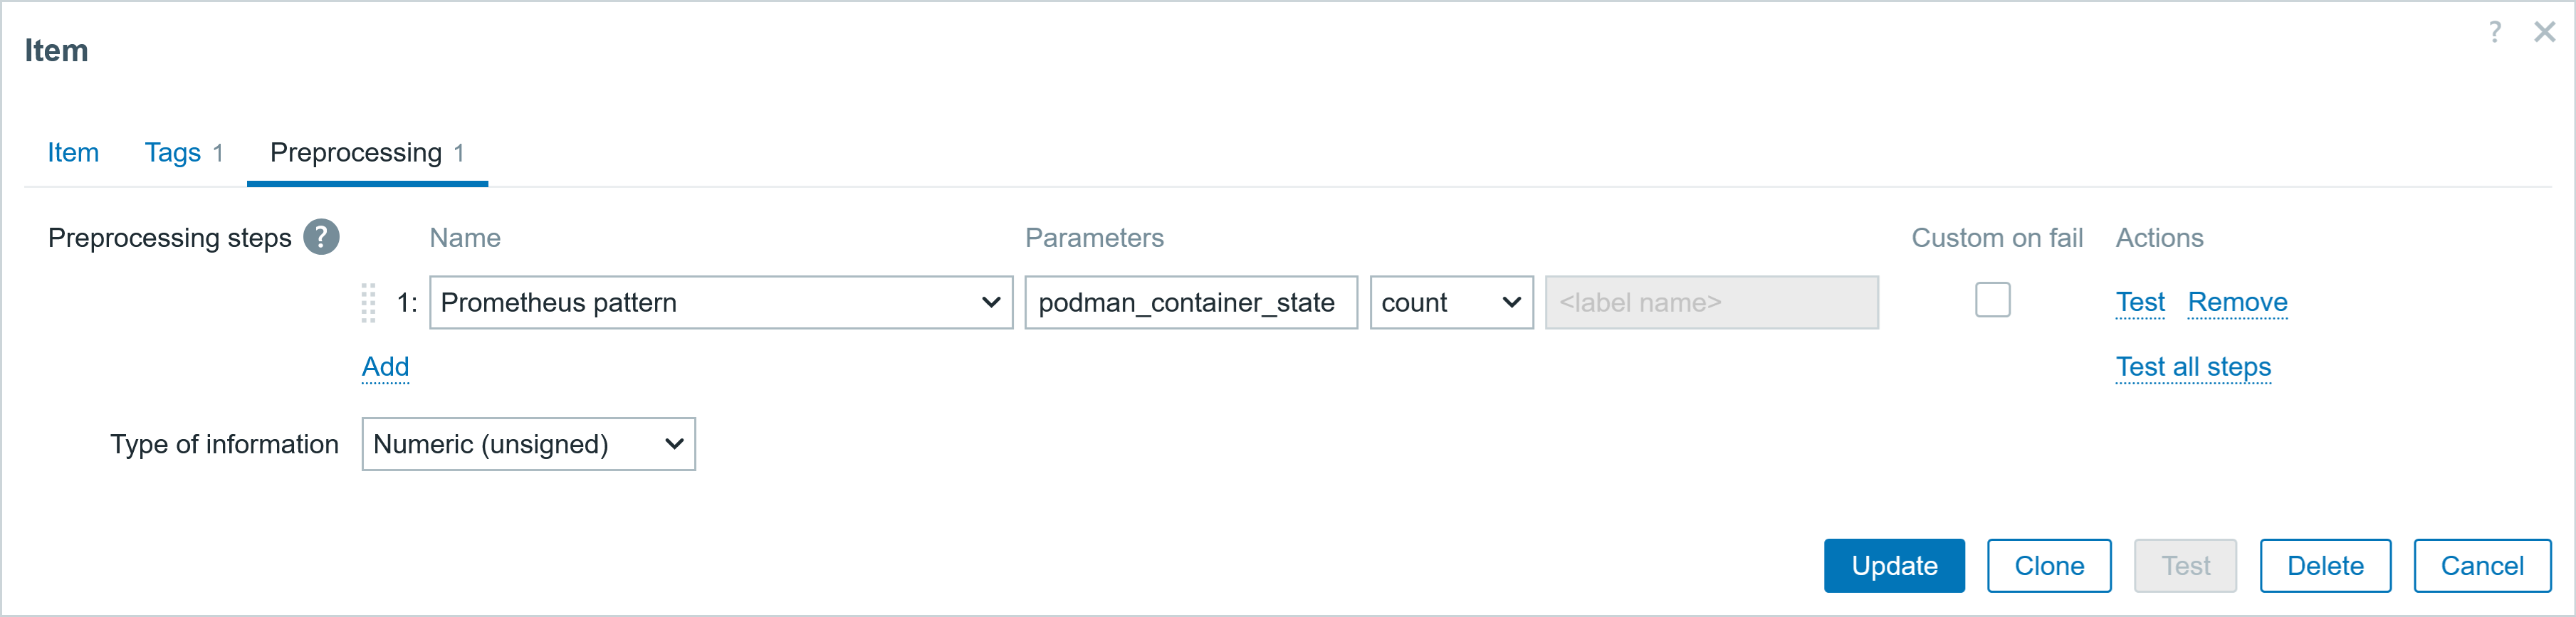
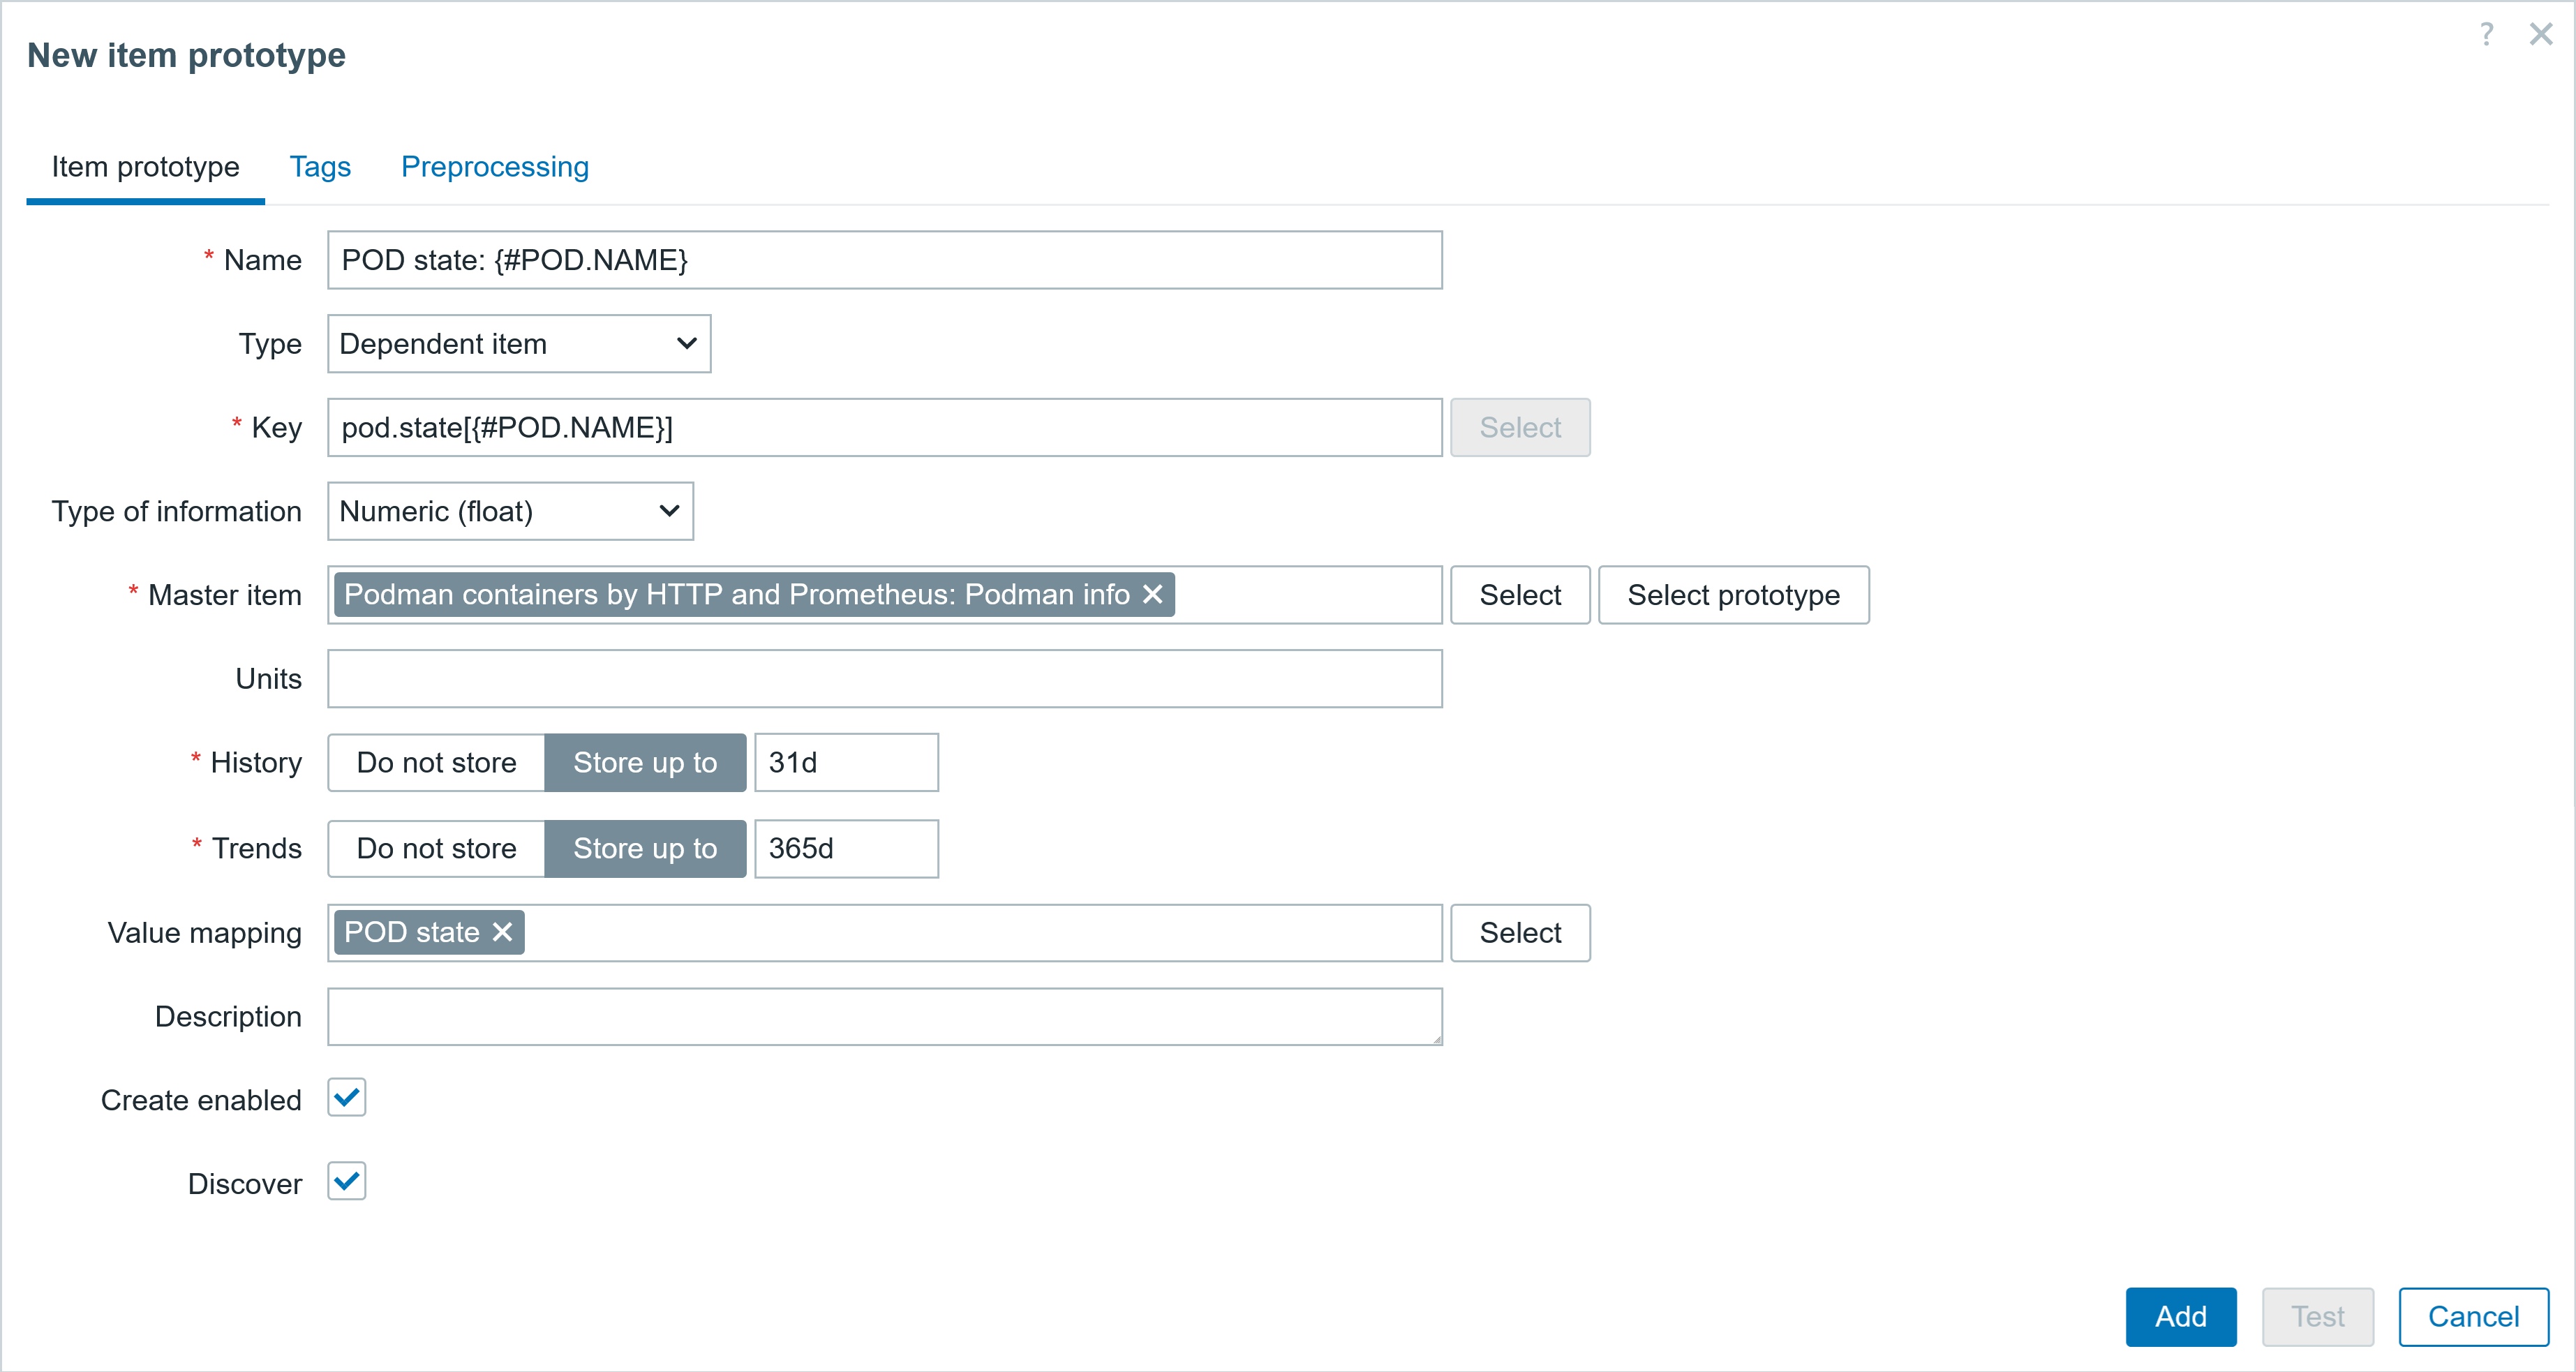
● Item prototype #2
▪ Name: Container state: [{#CONTAINER.NAME}]
▪ Type Dependent item
▪ Key: container.state[{#CONTAINER.NAME}]
▪ Type of inf: Numeric (float)
▪ Master item Podman containers by HTTP and Prometheus: Podman info
▪ Units:
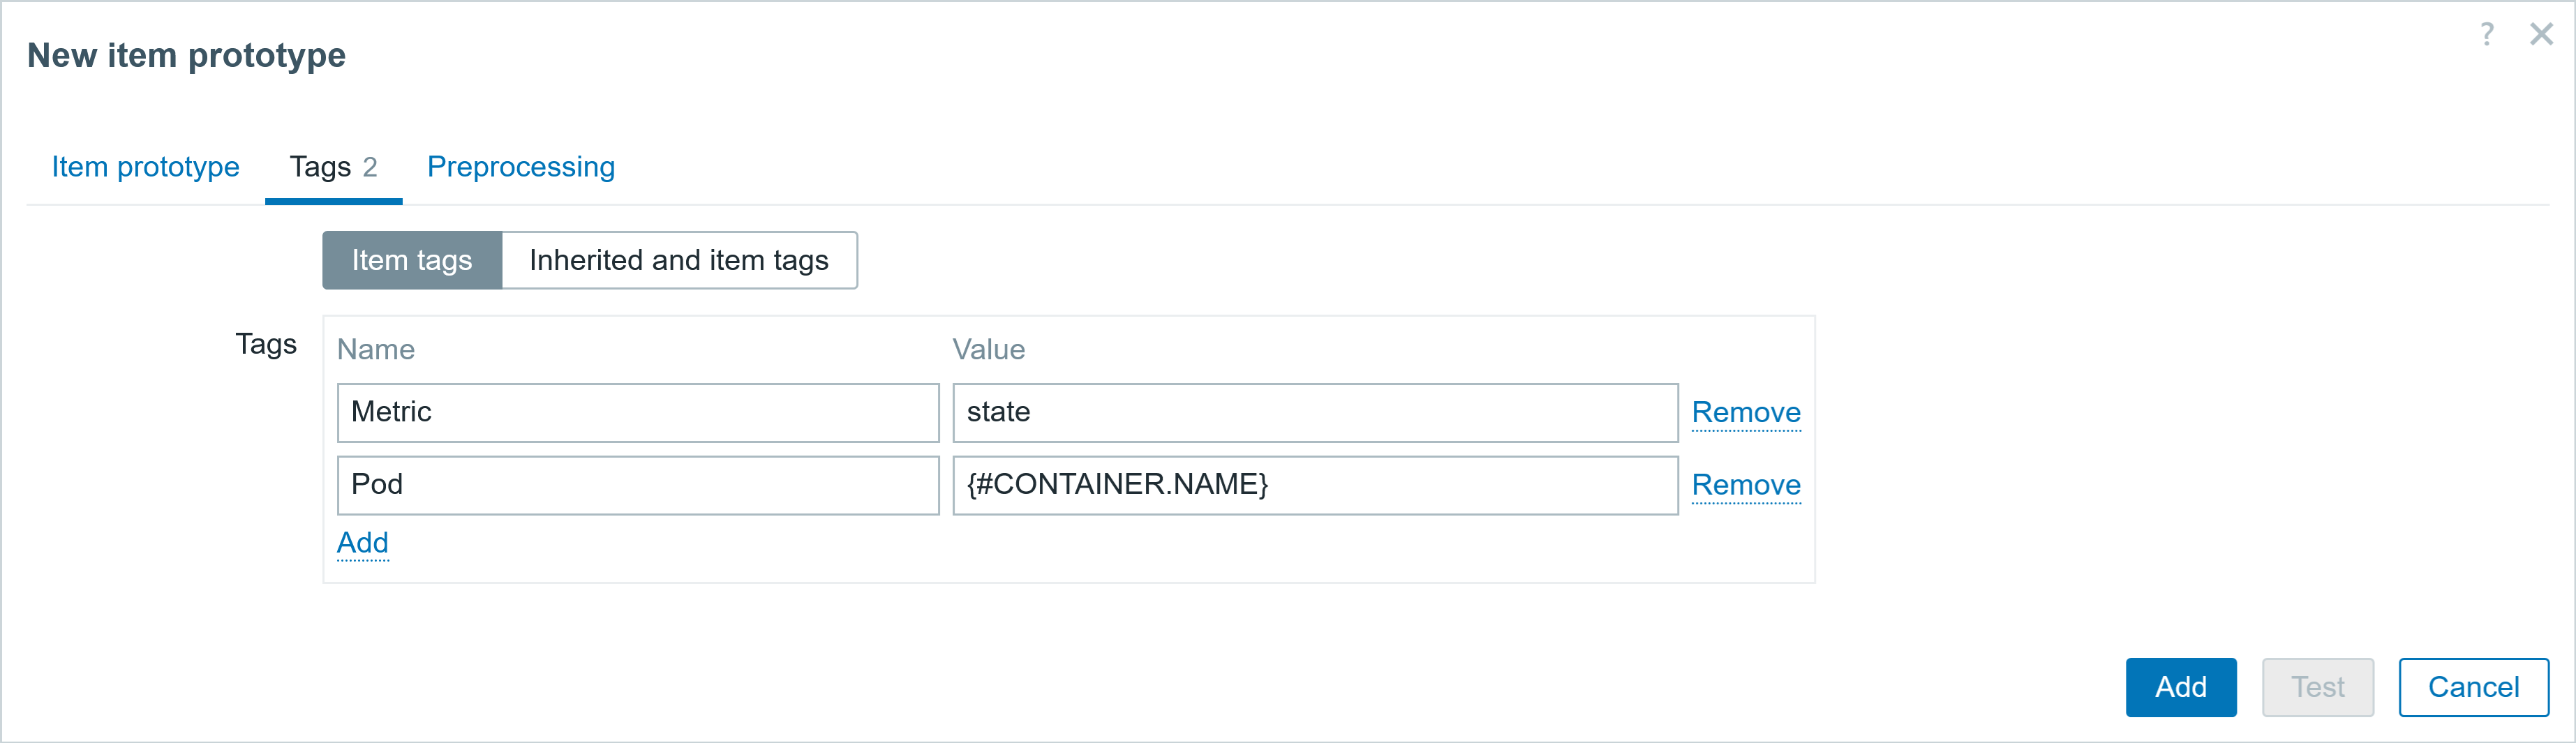
♦ Tags (name:value)
▪ Container:{#CONTAINER.NAME}
▪ Metric:state
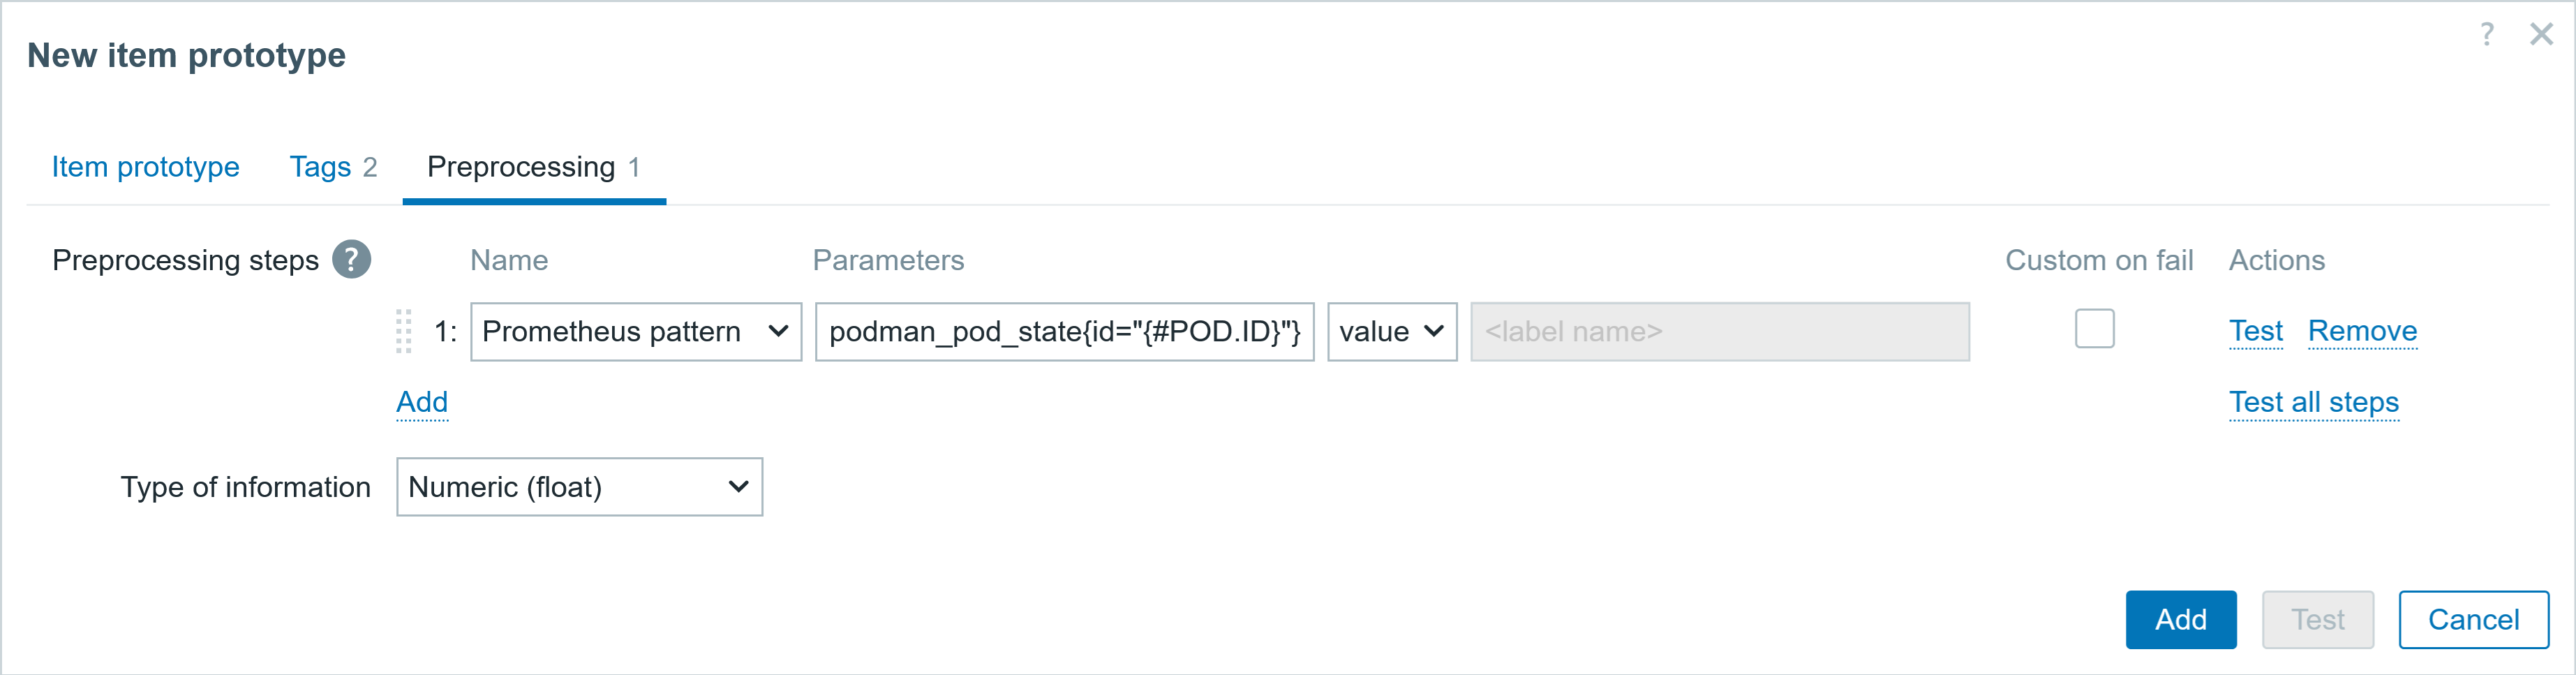
♯ Preprocessing
▪ Prometheus pattern podman_container_state{id="{#CONTAINER.ID}",pod_id=~".*",pod_name=~".*"} value
● Item prototype #3
▪ Name: Created at: [{#CONTAINER.NAME}]
▪ Type Dependent item
▪ Key: container.created[{#CONTAINER.NAME}]
▪ Type of inf: Numeric (unsigned)
▪ Master item Podman containers by HTTP and Prometheus: Podman info
▪ Units: unixtime
♦ Tags (name:value)
▪ Container:{#CONTAINER.NAME}
▪Metric:created
♯ Preprocessing
▪ Prometheus pattern podman_container_created_seconds{id="{#CONTAINER.ID}",pod_id=~".*",pod_name=~".*"} value
● Item prototype #4
▪ Name: Disk read per second: [{#CONTAINER.NAME}]
▪ Type Dependent item
▪ Key: container.disk.read[{#CONTAINER.NAME}]
▪ Type of inf: Numeric (unsigned)
▪ Master item Podman containers by HTTP and Prometheus: Podman info
▪ Units: B
♦ Tags (name:value)
▪ Container:{#CONTAINER.NAME}
▪ Metric:disk_read
♯ Preprocessing
▪ Prometheus pattern podman_container_block_output_total{id="{#CONTAINER.ID}",pod_id=~".*",pod_name=~".*"} value
▪ Change per second
● Item prototype #5
▪ Name: Disk write per second: [{#CONTAINER.NAME}]
▪ Type Dependent item
▪ Key: container.disk.write[{#CONTAINER.NAME}]
▪ Type of inf: Numeric (unsigned)
▪ Master item Podman containers by HTTP and Prometheus: Podman info
▪ Units: B
♦ Tags (name:value)
▪ Container:{#CONTAINER.NAME}
▪ Metric:disk_write
♯ Preprocessing
▪ Prometheus pattern podman_container_block_input_total{id="{#CONTAINER.ID}",pod_id=~".*",pod_name=~".*"} value
▪ Change per second
● Item prototype #6
▪ Name: Exit code: [{#CONTAINER.NAME}]
▪ Type Dependent item
▪ Key: container.exit_code[{#CONTAINER.NAME}]
▪ Type of inf: Numeric (float)
▪ Master item Podman containers by HTTP and Prometheus: Podman info
▪ Units:
♦ Tags
▪ Container:{#CONTAINER.NAME}
▪ Metric:exit_code
♯ Preprocessing
▪ Prometheus pattern podman_container_exit_code{id="{#CONTAINER.ID}",pod_id=~".*",pod_name=~".*"} value
● Item prototype #7
▪ Name: Image tags: [{#CONTAINER.NAME}]
▪ Type Dependent item
▪ Key: container.image.tags[{#CONTAINER.NAME}]
▪ Type of inf: Character
▪ Master item Podman containers by HTTP and Prometheus: Podman info
▪ Units:
♦ Tags
▪ Container:{#CONTAINER.NAME}
▪ Metric:tag
♯ Preprocessing
▪ Prometheus pattern podman_container_info{id="{#CONTAINER.ID}",image=~".*",name=~".*",pod_id=~".*",pod_name=~".*",ports=~".*"} label image
▪ Regular expression \.*(\/.\w.*) \1
● Item prototype #8
▪ Name: Memory usage: [{#CONTAINER.NAME}]
▪ Type Dependent item
▪ Key: container.mem[{#CONTAINER.NAME}]
▪ Type of inf: Numeric (unsigned)
▪ Master item Podman containers by HTTP and Prometheus: Podman info
▪ Units: B
♦ Tags
▪ Container:{#CONTAINER.NAME}
▪ Metric:mem
♯ Preprocessing
▪ Prometheus pattern podman_container_mem_usage_bytes{id="{#CONTAINER.ID}",pod_id=~".*",pod_name=~".*"} value
● Item prototype #9
▪ Name: Network input dropped: [{#CONTAINER.NAME}]
▪ Type Dependent item
▪ Key: container.net.in.drop[{#CONTAINER.NAME}]
▪ Type of inf: Numeric (unsigned)
▪ Master item Podman containers by HTTP and Prometheus: Podman info
▪ Units: packets
♦ Tags
▪ Container:{#CONTAINER.NAME}
▪ Metric:net_in_drop
♯ Preprocessing
▪ Prometheus pattern podman_container_net_input_dropped_total{id="{#CONTAINER.ID}",pod_id=~".*",pod_name=~".*"} value
● Item prototype #10
▪ Name: Network input errors: [{#CONTAINER.NAME}]
▪ Type Dependent item
▪ Key: container.net.in.errors[{#CONTAINER.NAME}]
▪ Type of inf: Numeric (unsigned)
▪ Master item Podman containers by HTTP and Prometheus: Podman info
▪ Units:
♦ Tags
▪ Container:{#CONTAINER.NAME}
▪ Metric:net_in_err
♯ Preprocessing
▪ Prometheus pattern podman_container_net_input_errors_total{id="{#CONTAINER.ID}",pod_id=~".*",pod_name=~".*"} value
● Item prototype #11
▪ Name: Network input total: [{#CONTAINER.NAME}]
▪ Type Dependent item
▪ Key: container.net.in.total[{#CONTAINER.NAME}]
▪ Type of inf: Numeric (unsigned)
▪ Master item Podman containers by HTTP and Prometheus: Podman info
▪ Units: B
♦ Tags
▪ Container:{#CONTAINER.NAME}
▪ Metric:net_in_tot
♯ Preprocessing
▪ Prometheus pattern podman_container_net_input_total{id="{#CONTAINER.ID}",pod_id=~".*",pod_name=~".*"} value
● Item prototype #12
▪ Name: Network input per second: [{#CONTAINER.NAME}]
▪ Type Dependent item
▪ Key: container.net.in.change[{#CONTAINER.NAME}]
▪ Type of inf: Numeric (float)
▪ Master item prototype - Network input total: [{#CONTAINER.NAME}]
▪ Units: Bps
♦ Tags
▪ Container:{#CONTAINER.NAME}
▪ Metric:net_in_change
♯ Preprocessing
▪ Change per second
● Item prototype #13
▪ Name: Network output dropped: [{#CONTAINER.NAME}]
▪ Type Dependent item
▪ Key: container.net.out.drop[{#CONTAINER.NAME}]
▪ Type of inf: Numeric (unsigned)
▪ Master item Podman containers by HTTP and Prometheus: Podman info
▪ Units:
♦ Tags
▪ Container:{#CONTAINER.NAME}
▪ Metric:net_out_drop
♯ Preprocessing
▪ Prometheus pattern podman_container_net_output_dropped_total{id="{#CONTAINER.ID}",pod_id=~".*",pod_name=~".*"} value
● Item prototype #14
▪ Name: Network output errors: [{#CONTAINER.NAME}]
▪ Type Dependent item
▪ Key: container.net.out.errors[{#CONTAINER.NAME}]
▪ Type of inf: Numeric (unsigned)
▪ Master item Podman containers by HTTP and Prometheus: Podman info
▪ Units:
♦ Tags
▪ Container:{#CONTAINER.NAME}
▪ Metric:net_out_err
♯ Preprocessing
▪ Prometheus pattern podman_container_net_output_errors_total{id="{#CONTAINER.ID}",pod_id=~".*",pod_name=~".*"} value
● Item prototype #15
▪ Name: Network output total: [{#CONTAINER.NAME}]
▪ Type Dependent item
▪ Key: container.net.out.total[{#CONTAINER.NAME}]
▪ Type of inf: Numeric (unsigned)
▪ Master item Podman containers by HTTP and Prometheus: Podman info
▪ Units: B
♦ Tags
▪ Container:{#CONTAINER.NAME}
▪ Metric:net_out_tot
♯ Preprocessing
▪ Prometheus pattern podman_container_net_output_total{id="{#CONTAINER.ID}",pod_id=~".*",pod_name=~".*"} value
● Item prototype #16
▪ Name: Network output per second: [{#CONTAINER.NAME}]
▪ Type Dependent item
▪ Key: container.net.out.change[{#CONTAINER.NAME}]
▪ Type of inf: Numeric (float)
▪ Master item prototype - Network output total: [{#CONTAINER.NAME}]
▪ Units: Bps
♦ Tags
▪ Container:{#CONTAINER.NAME}
▪ Metric:net_out_change
♯ Preprocessing
▪ Name Change per second
● Item prototype #17
▪ Name: Rootfs size: [{#CONTAINER.NAME}]
▪ Type Dependent item
▪ Key: container.rootfs.size[{#CONTAINER.NAME}]
▪ Type of inf: Numeric (unsigned)
▪ Master item Podman containers by HTTP and Prometheus: Podman info
▪ Units: B
♦ Tags
▪ Container:{#CONTAINER.NAME}
▪ Metric:rootfs
♯ Preprocessing
▪ Prometheus pattern podman_container_rootfs_size_bytes{id="{#CONTAINER.ID}",pod_id=~".*",pod_name=~".*"} value
● Item prototype #18
▪ Name: Total system CPU time: [{#CONTAINER.NAME}]
▪ Type Dependent item
▪ Key: container.cpu.time
▪ Type of inf: Numeric (float)
▪ Master item Podman containers by HTTP and Prometheus: Podman info
▪ Units: s
♦ Tags
▪ Container:{#CONTAINER.NAME}
▪ Metric:sys_time
♯ Preprocessing
▪ Prometheus pattern: podman_container_cpu_system_seconds_total{id="{#CONTAINER.ID}",pod_id=~".*",pod_name=~".*"} value
Creating a template discovery rule: Trigger prototype
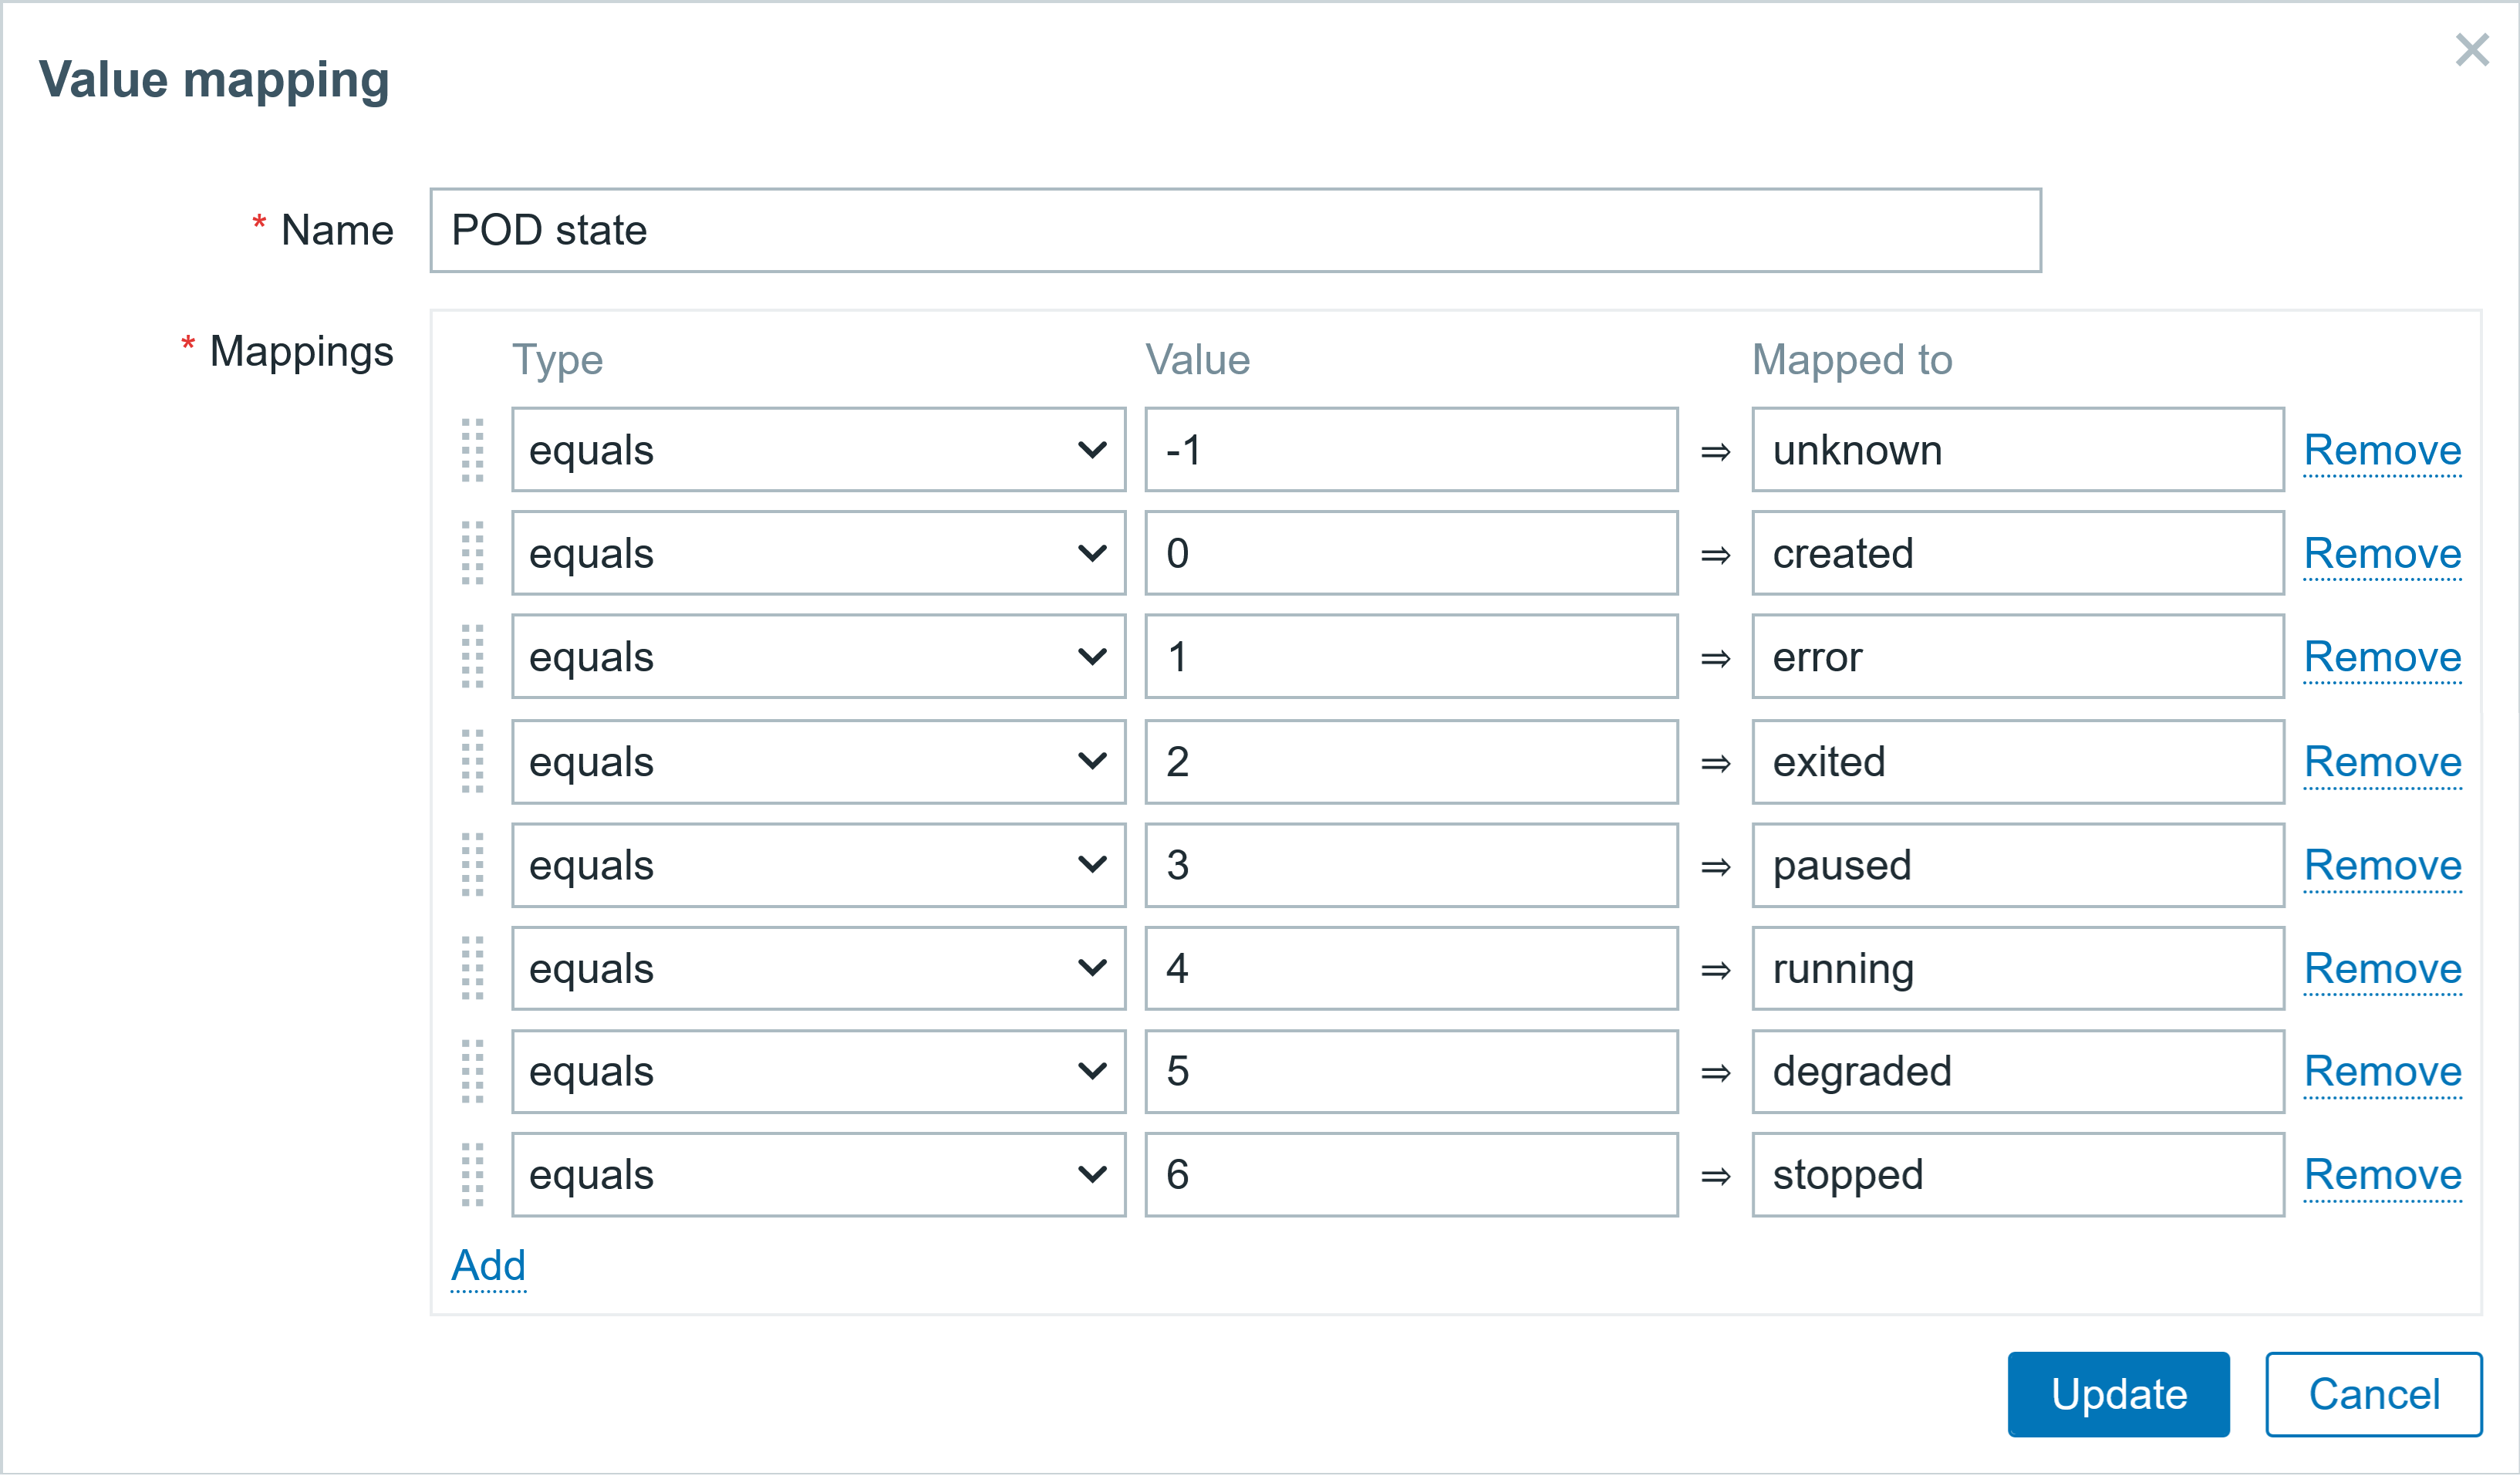
I have created a user macro {$CONTAINER.RUNNING.STATE} on the template with a value of 2, which corresponds to the containers running state. After that, create a trigger prototype to check if the container is in different state other than running.
Template: Podman containers by HTTP and Prometheus; Discovery rule: Container discovery
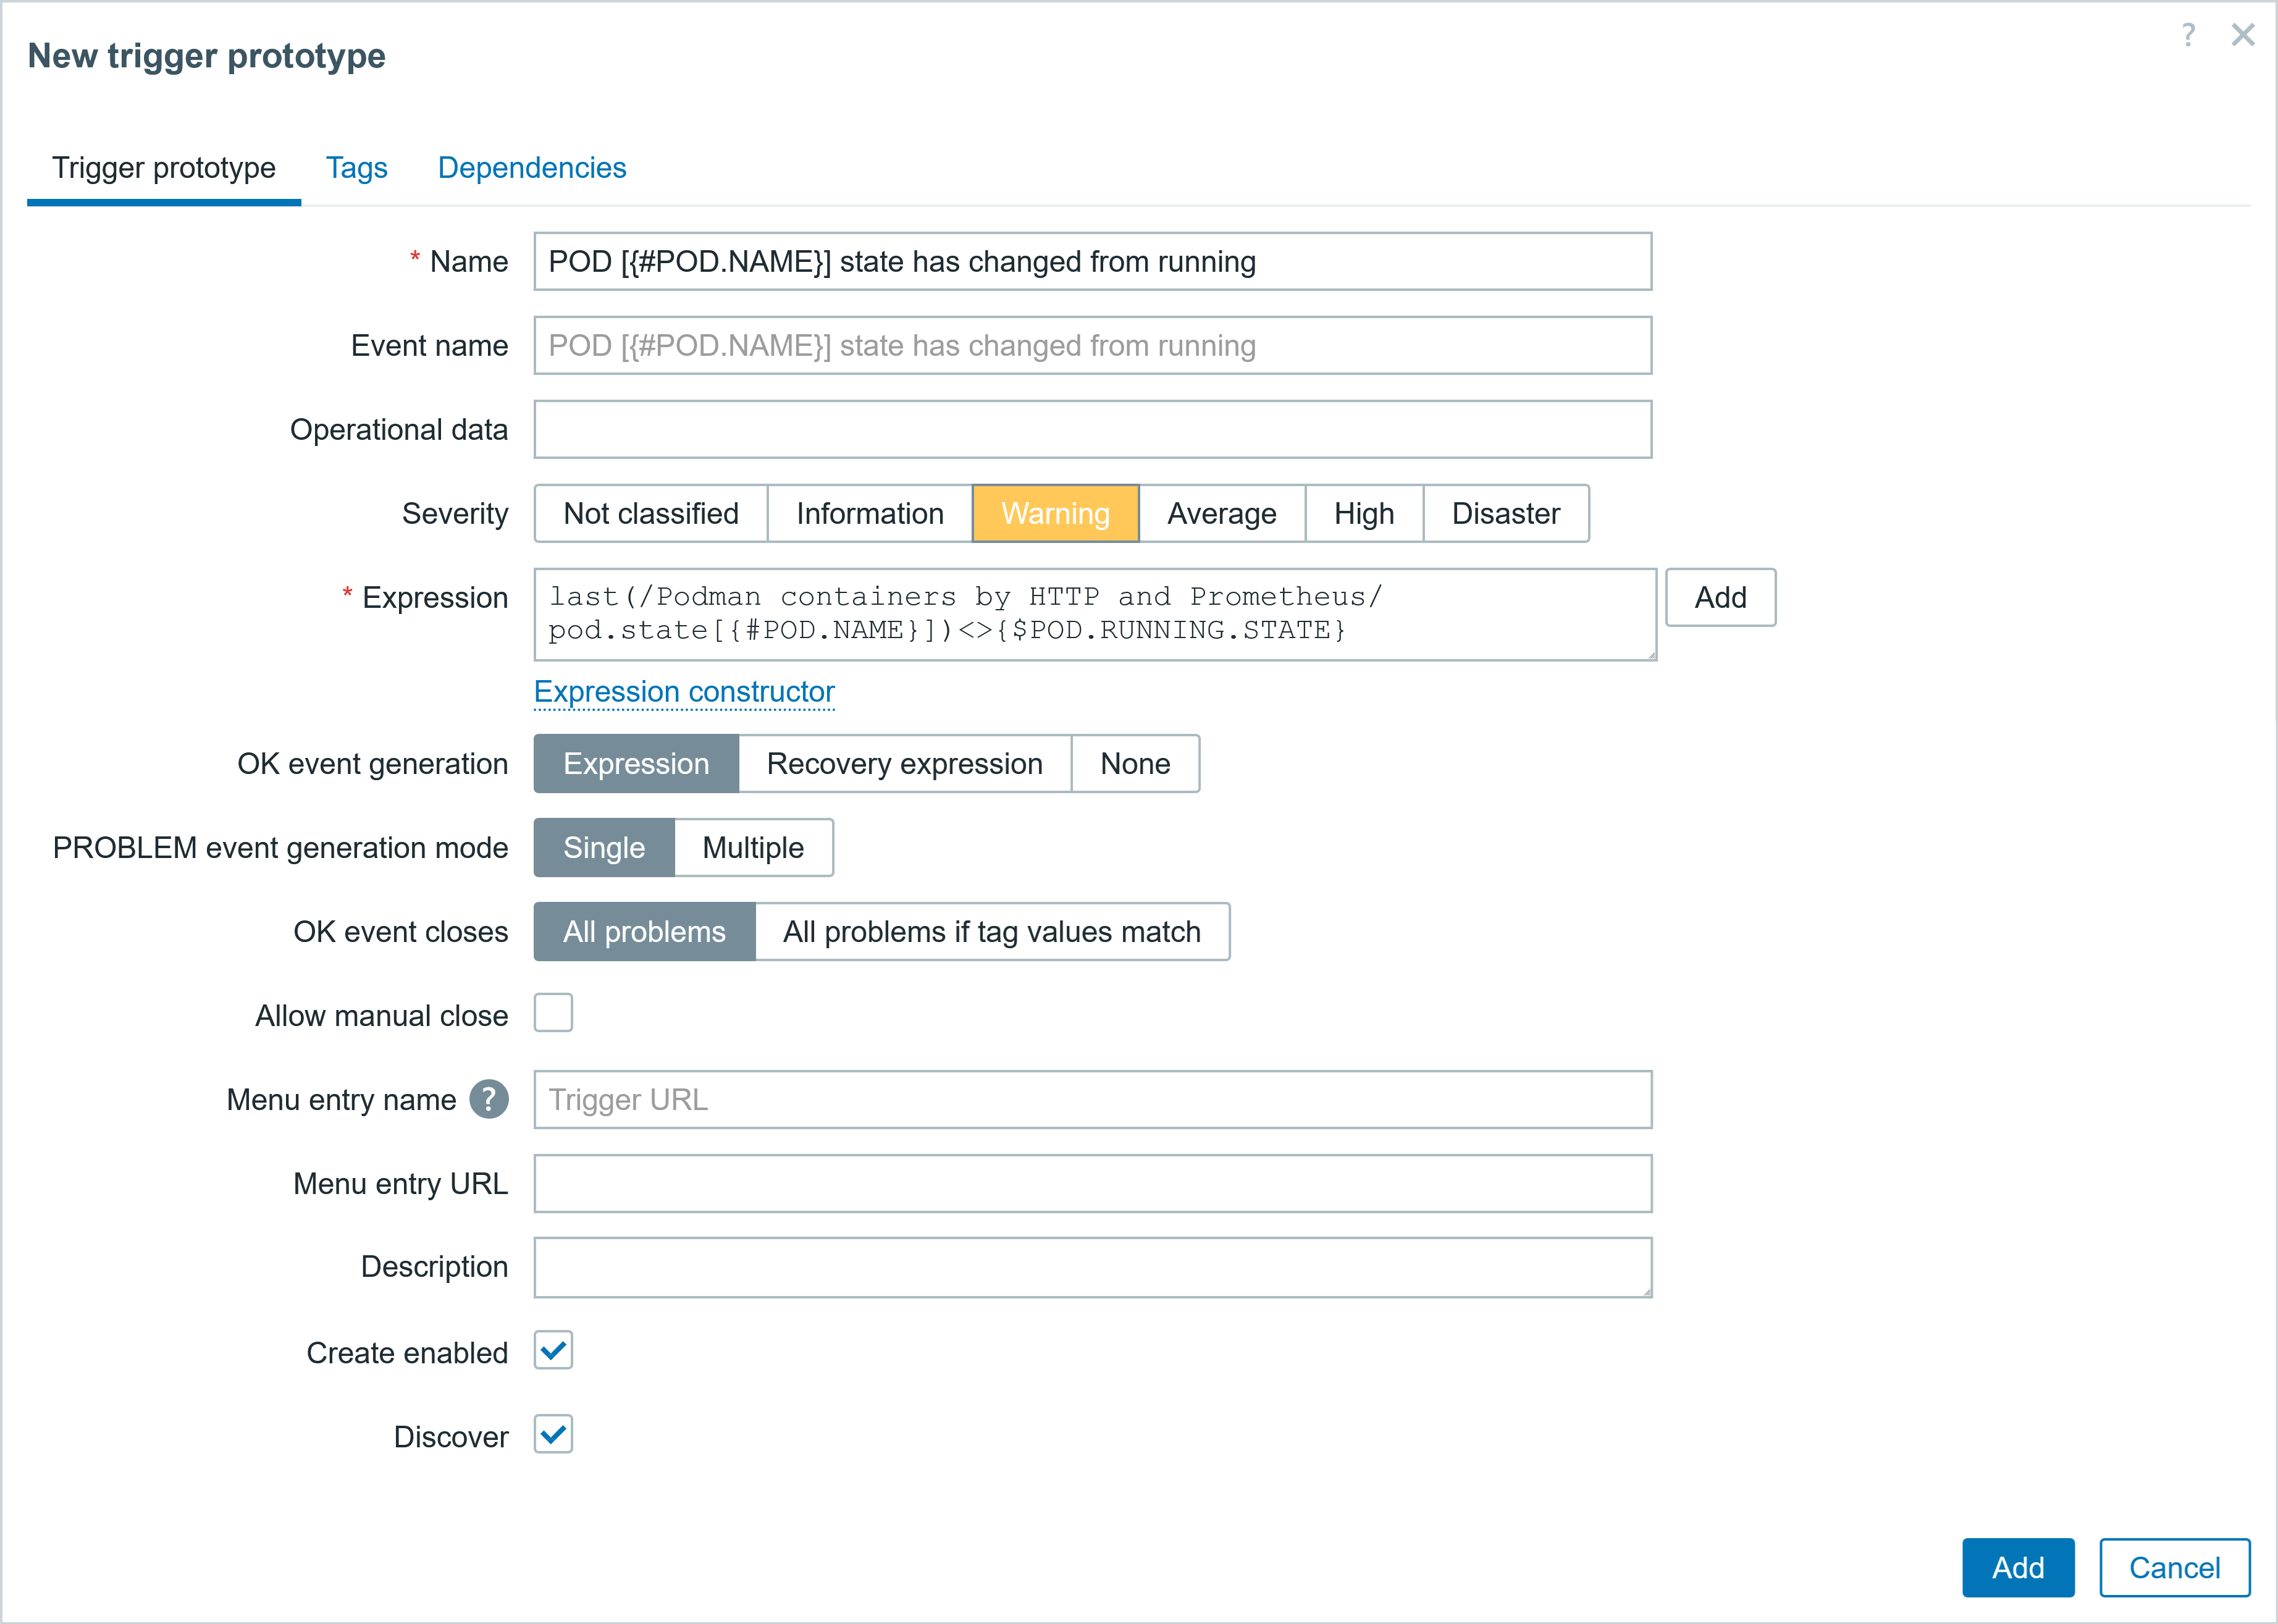
◘ Trigger prototypes
▪ Name: Container [{#CONTAINER.NAME}] state has changed from running
▪ Severity: Warning
▪ Expression: last(/Podman containers by HTTP and Prometheus/container.state[{#CONTAINER.NAME}])<>{$CONTAINER.RUNNING.STATE}
▪ PROBLEM event generation mode: Single
▪ OK event closes: All problems
So, once all of this is done, and some container status changes from running and or pod status also changes from running, you will get a problem event.
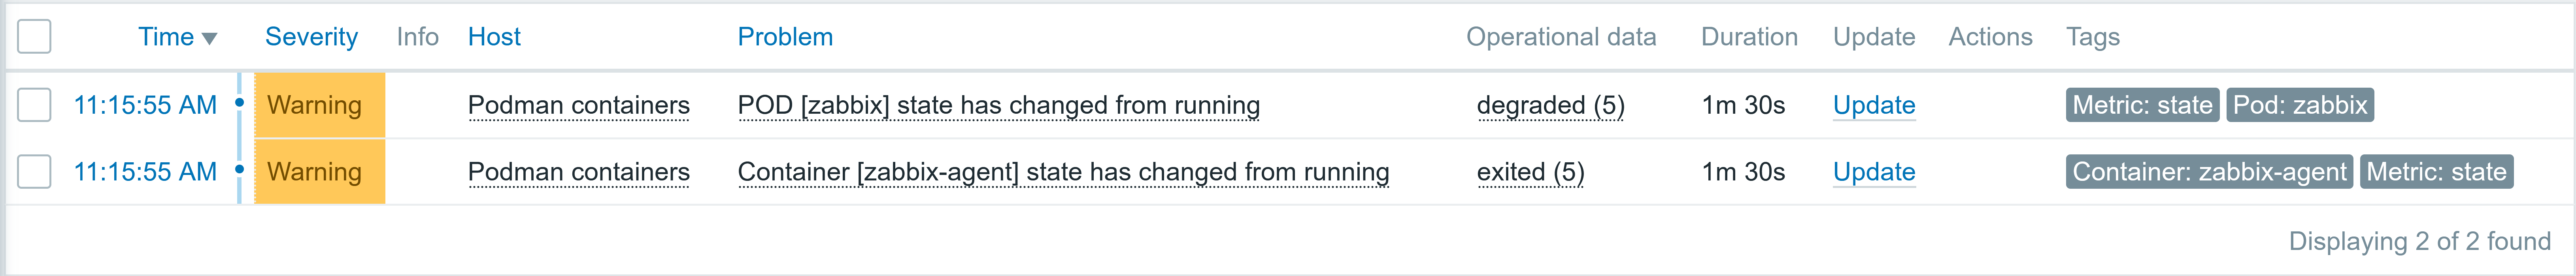
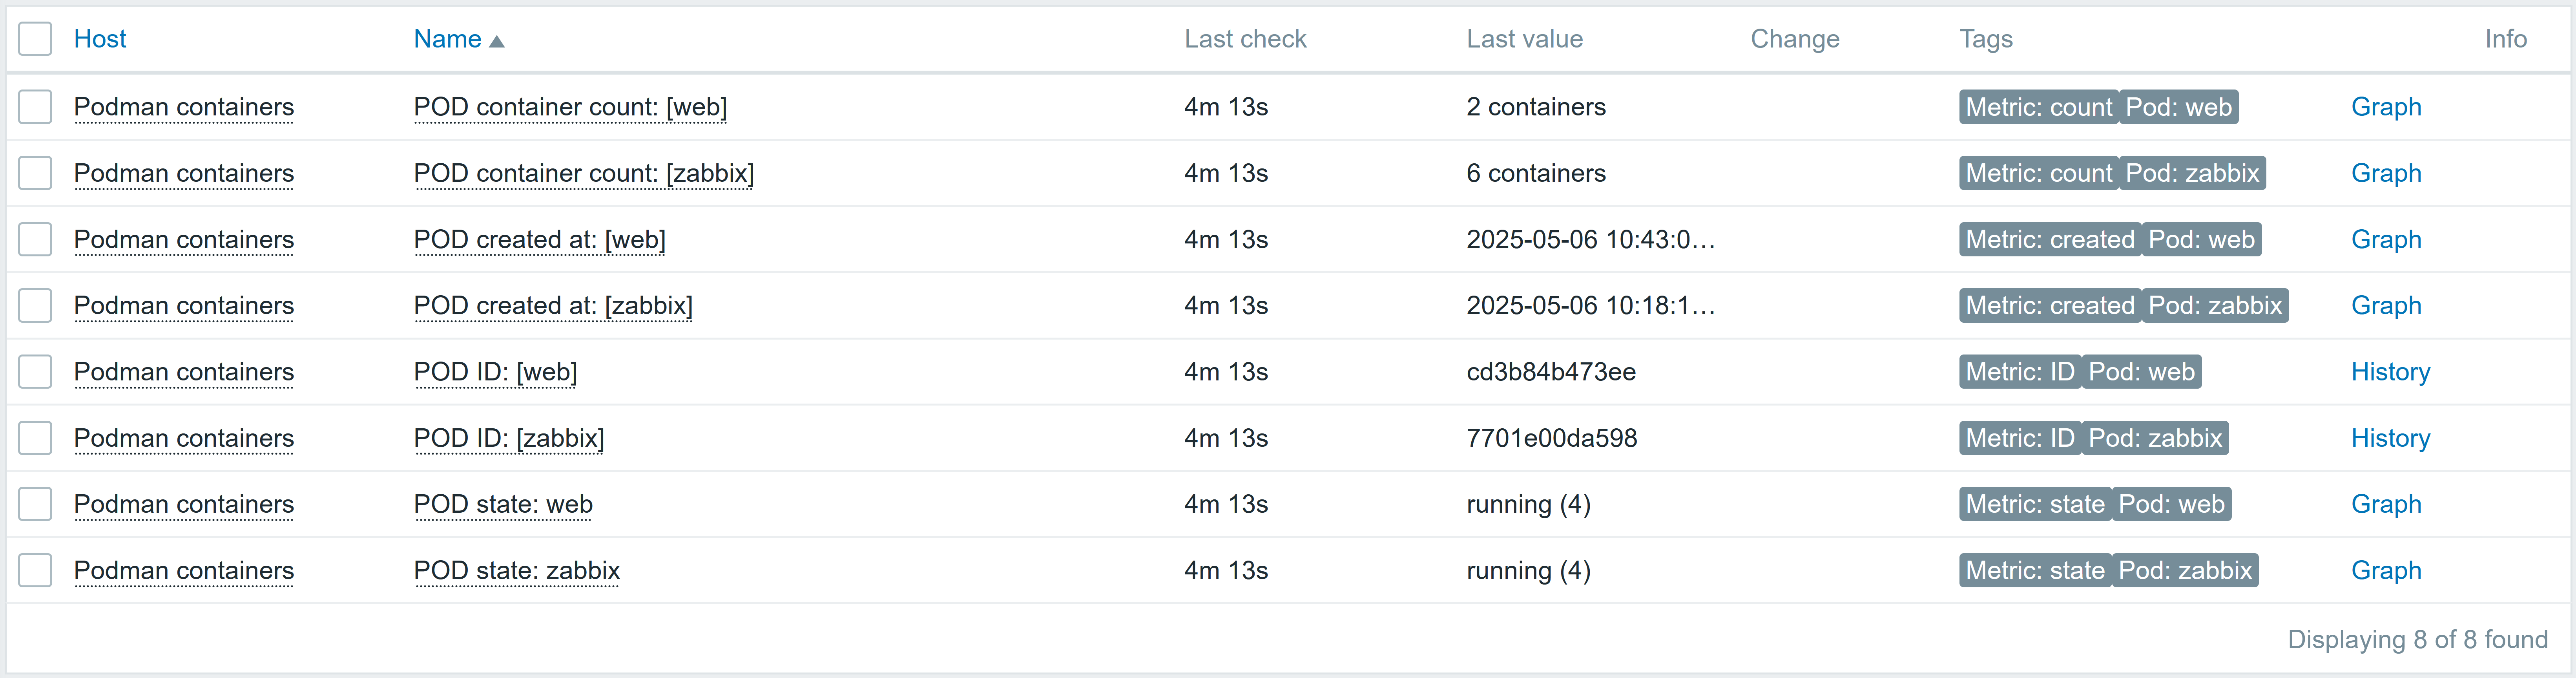
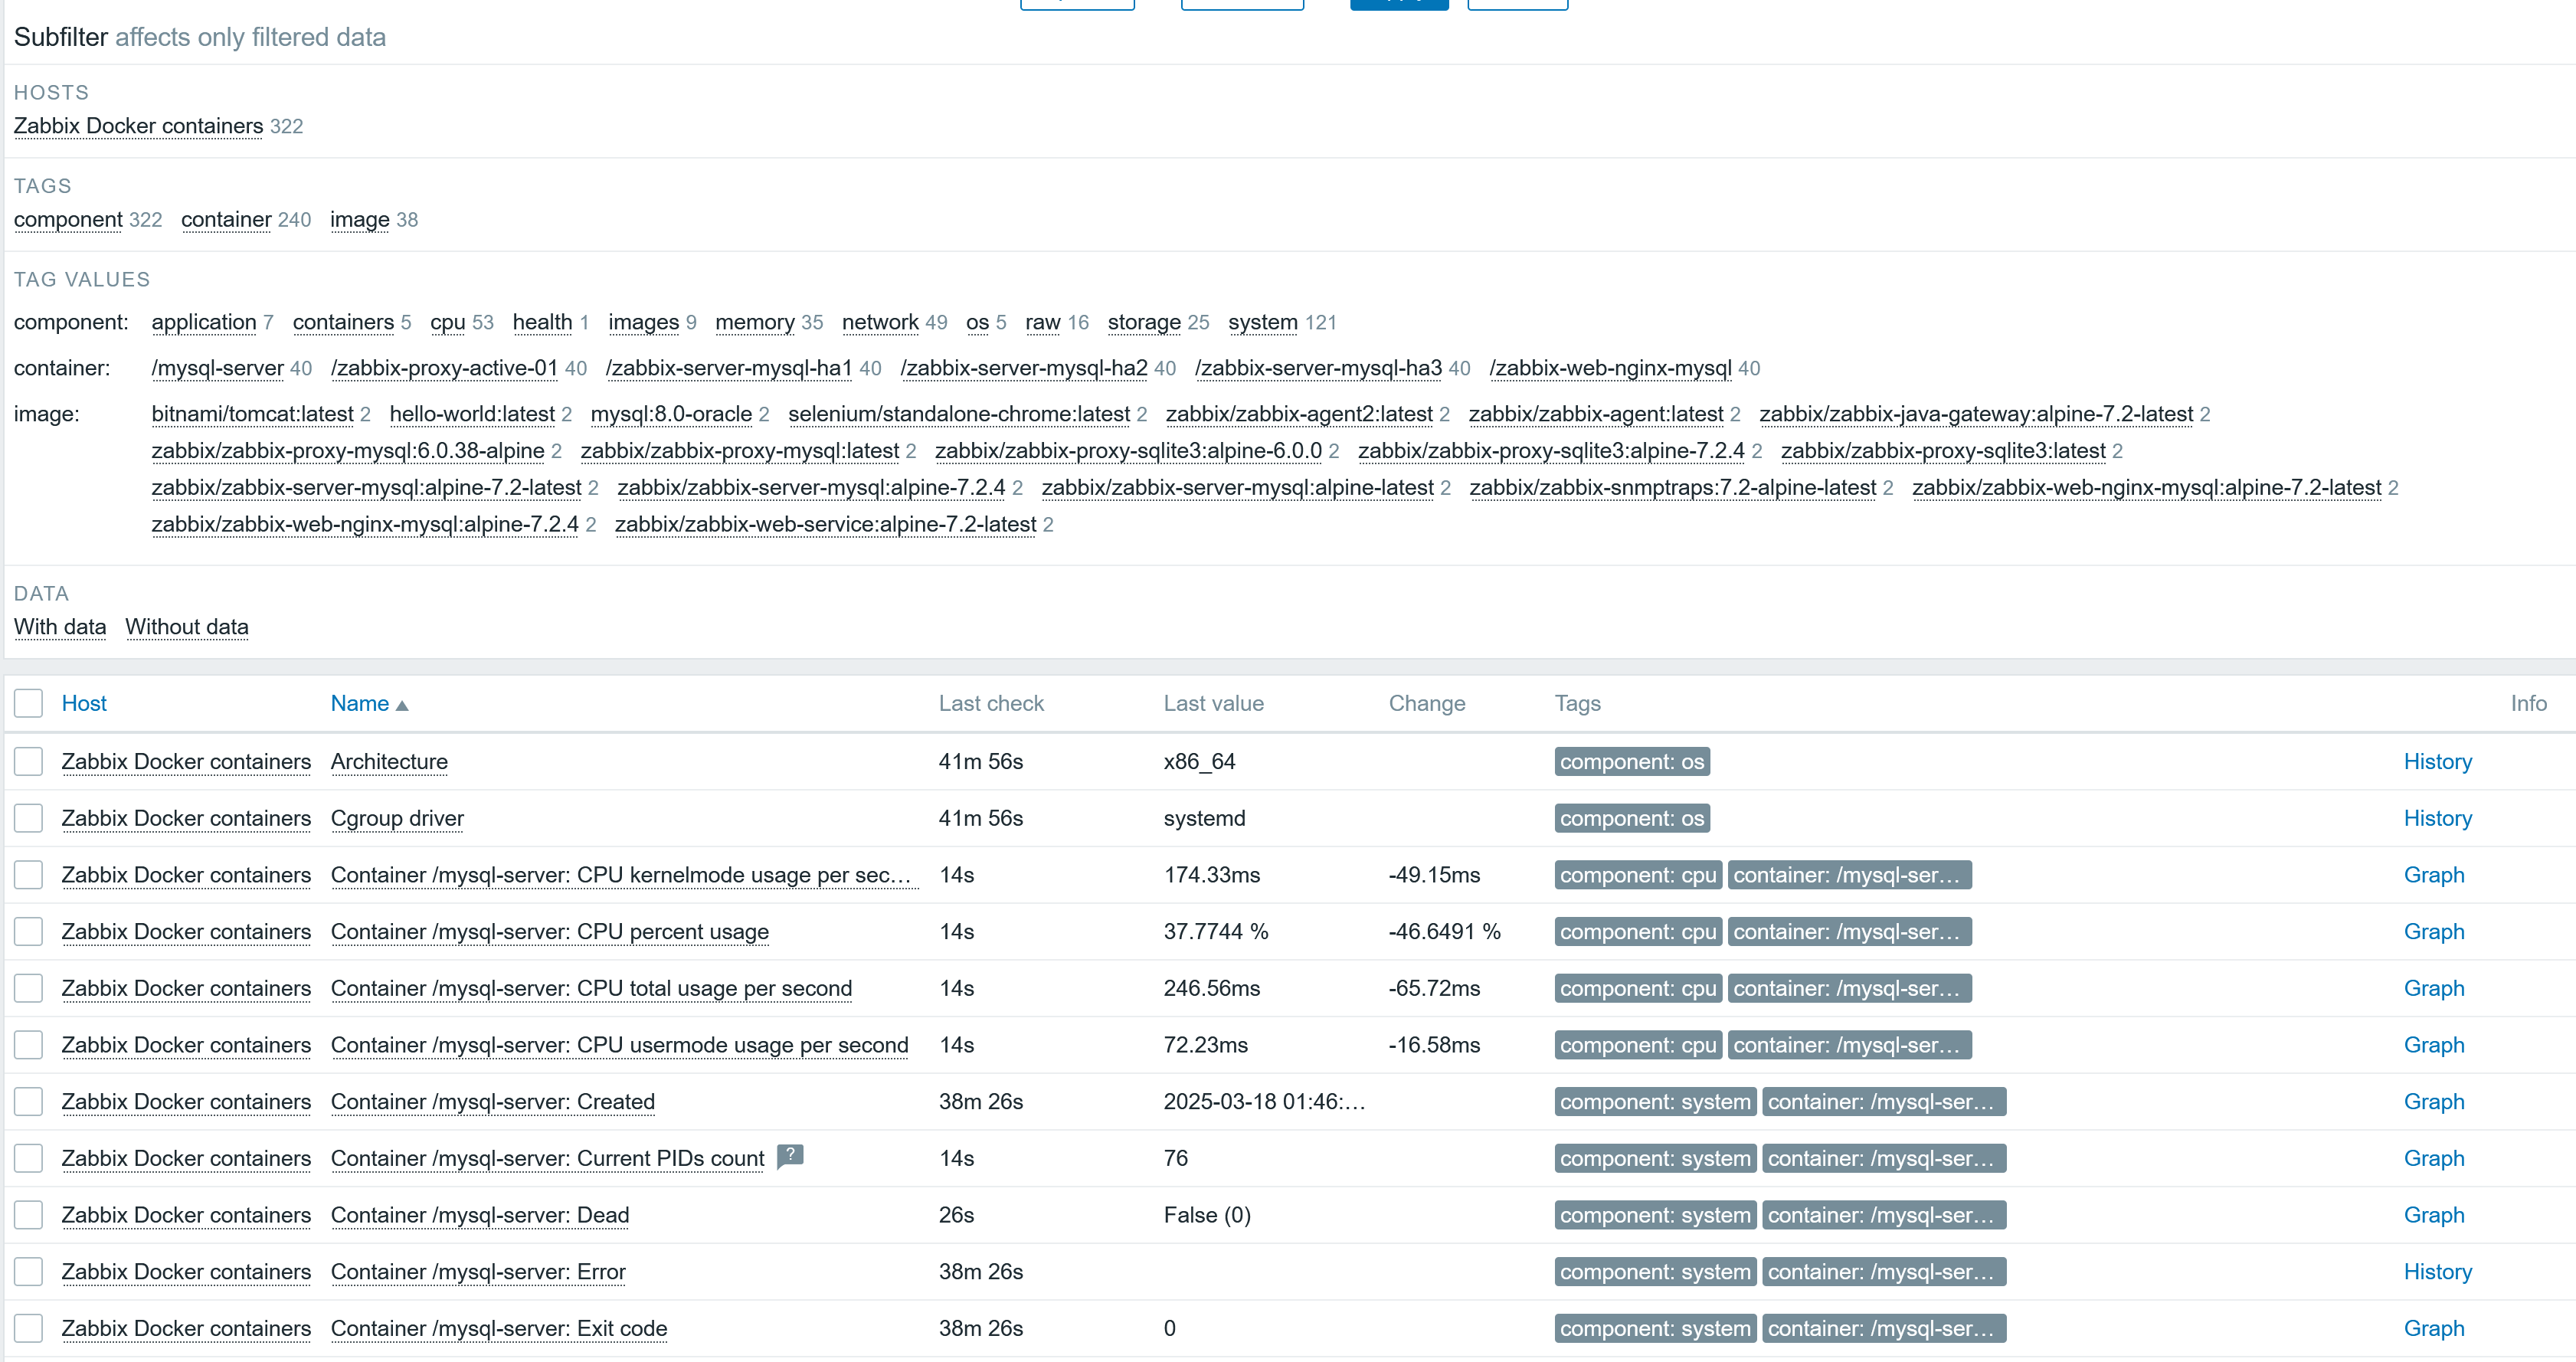
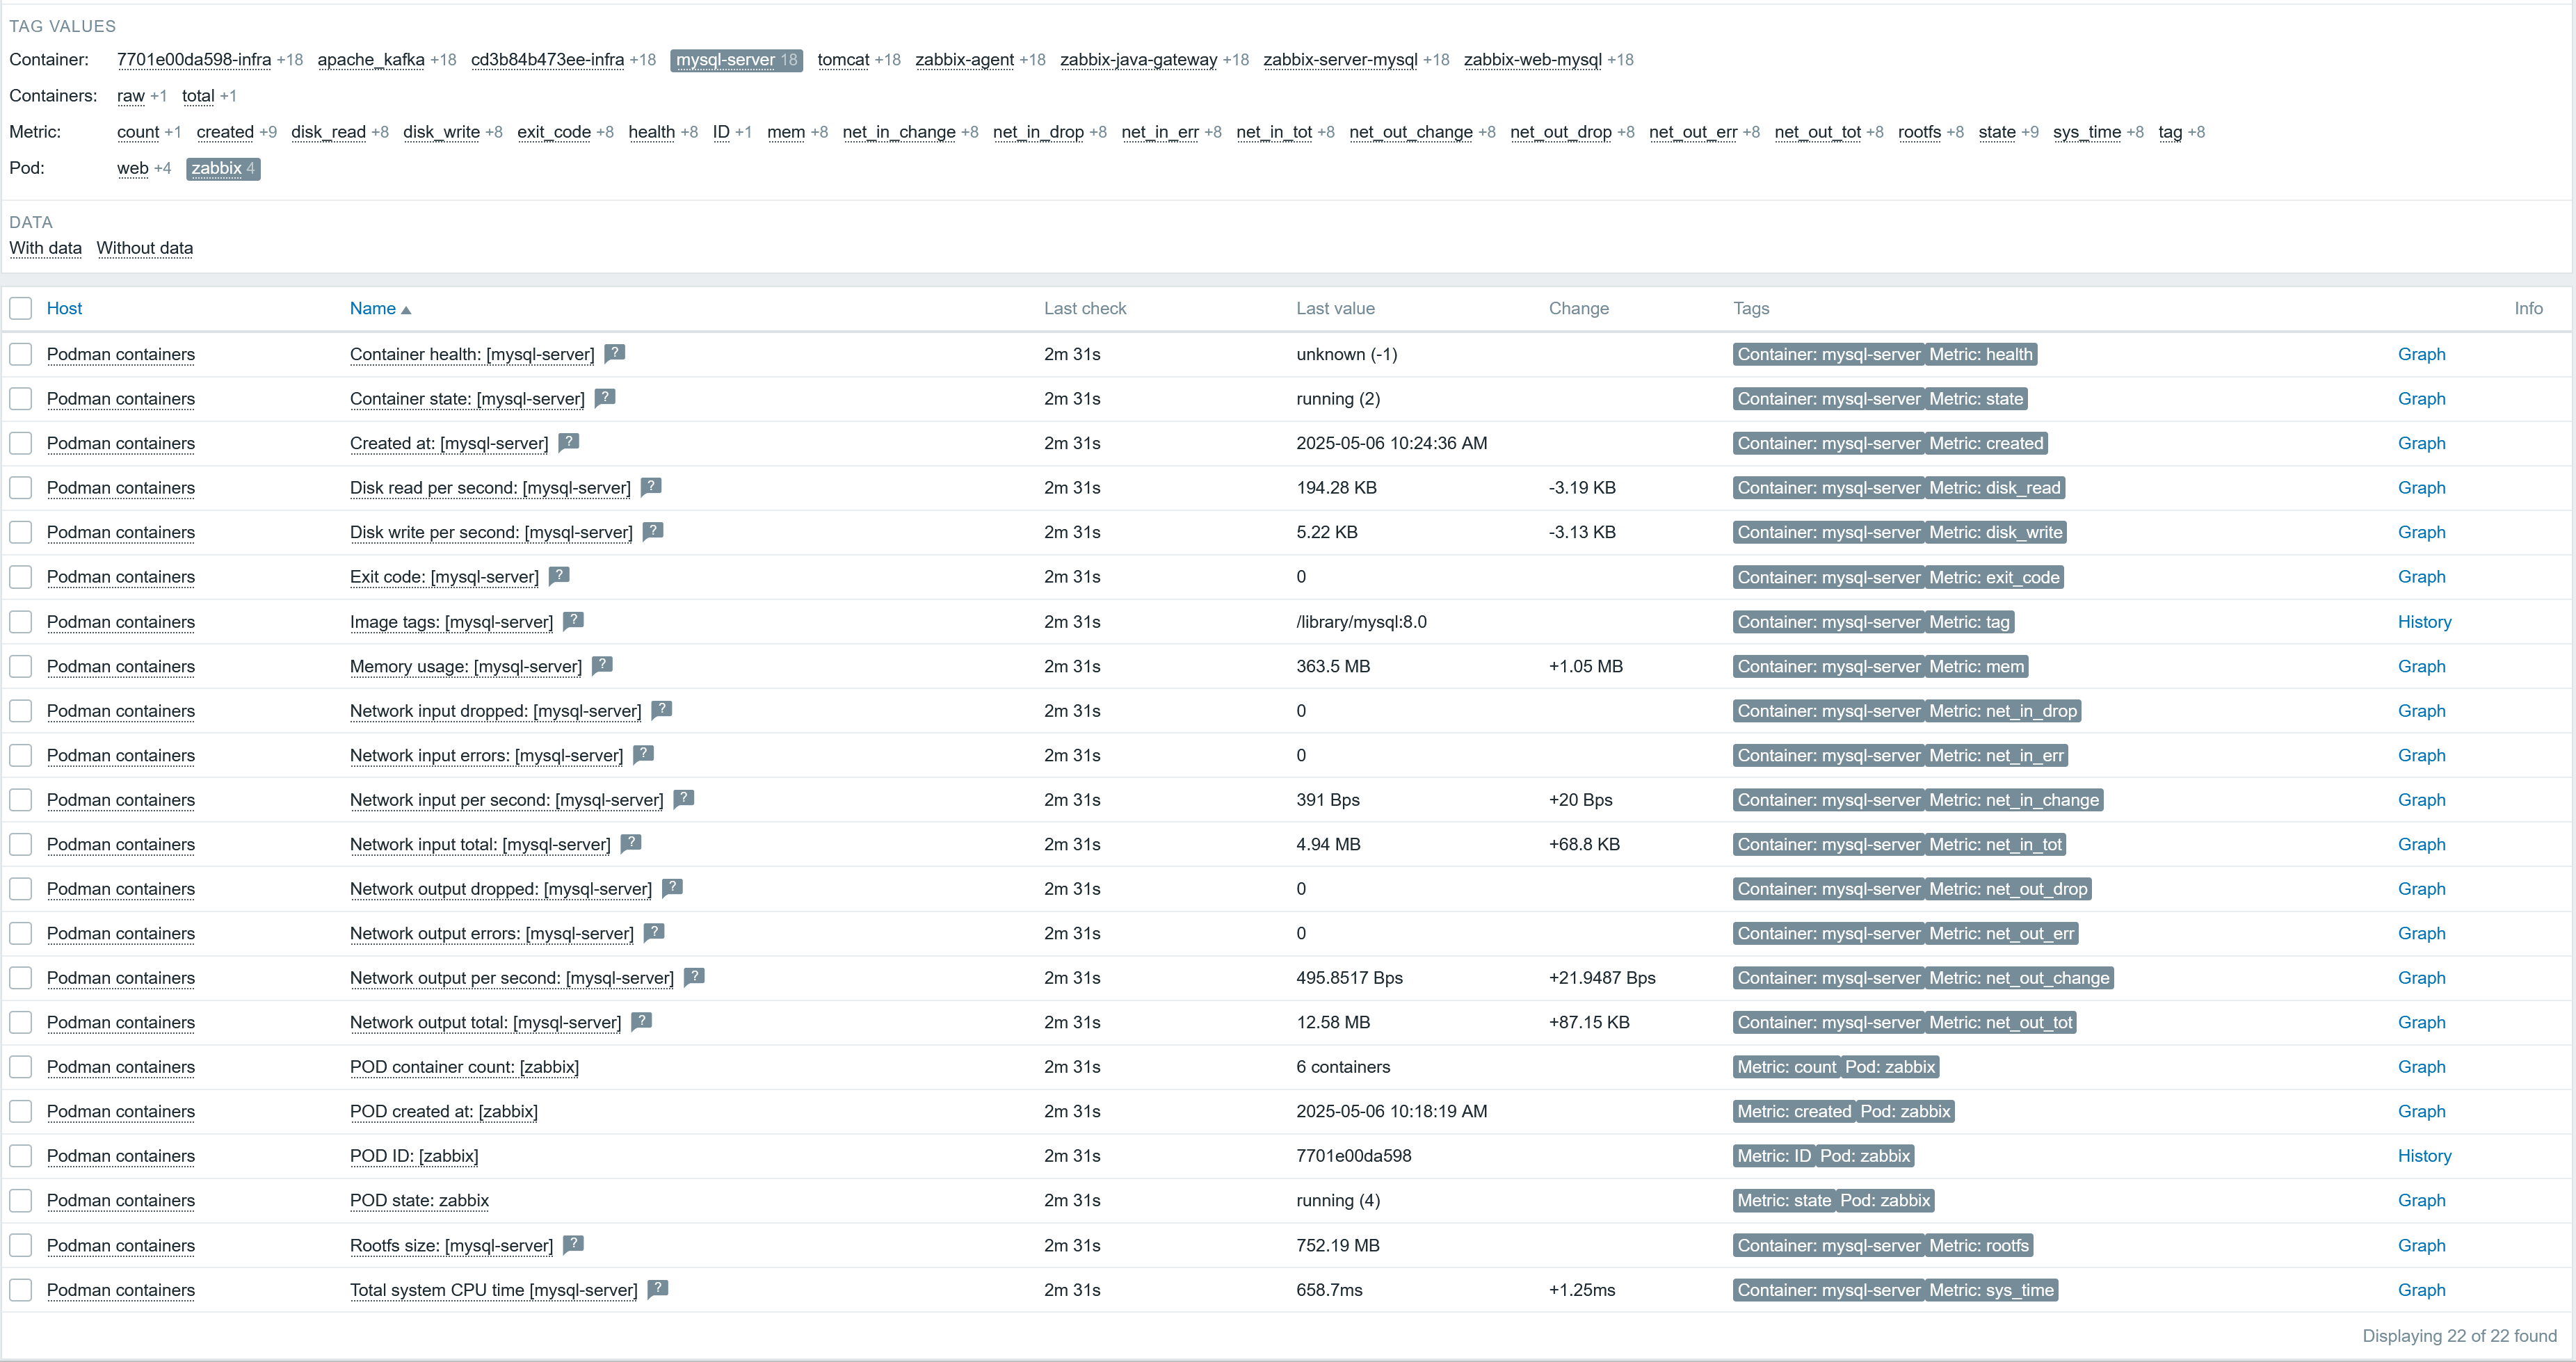
Technically, I could also create a trigger for container health; however, as all of the received container values for me are -1 (meaning unknown) it makes little sense to make a trigger that will fire right away. You can also add additional item/trigger prototypes in the template. If everything is set up as expected, you should see something like the screenshot below after the LLD rule execution.
Summary
Now, you can monitor both Podman pods and containers using both blog posts of this series. We used the same template item for both the container LLD and item prototypes from the first part of this post.
The post Podman Container Monitoring with Prometheus Exporter, part 2 appeared first on Zabbix Blog.