Post Syndicated from Kirubakaran Sundaramoorthy original https://aws.amazon.com/blogs/devops/reduce-docker-image-build-time-on-aws-codebuild-using-amazon-ecr-as-a-remote-cache/
In modern software development, containerization with Docker has revolutionized how we build and deploy applications. While Docker enables packaging applications into portable containers, the continuous need to update these images can be resource intensive. AWS CodeBuild addresses this challenge by providing a managed build service that eliminates infrastructure maintenance overhead. In this blog post, we’ll explore how AWS CodeBuild integration with Amazon Elastic Container Registry (Amazon ECR) as a cache backend can significantly accelerate our Docker image build process, making development more efficient and streamlined.
AWS CodeBuild creates isolated environments for each build, which means build artifacts cannot be permanently stored on the host system. While CodeBuild does offer a native local caching feature, it provides only temporary storage and is most effective for builds that occur in quick succession.
This local caching mechanism, however, is not reliable when builds are triggered at varying intervals, as it operates on a best-effort basis. To address this limitation, we recommend using Amazon Elastic Container Registry as a persistent cache for Docker layers. This solution offers several advantages:
- It provides a reliable, long-term storage solution for build caches
- The cached layers can be reused across multiple builds regardless of timing
- The cache remains valid and accessible at any point in time
This post shows how to implement a simple, effective, and durable Docker layer cache for CodeBuild using Amazon ECR repository as a cache backend to significantly reduce image build runtime.
Solution Overview
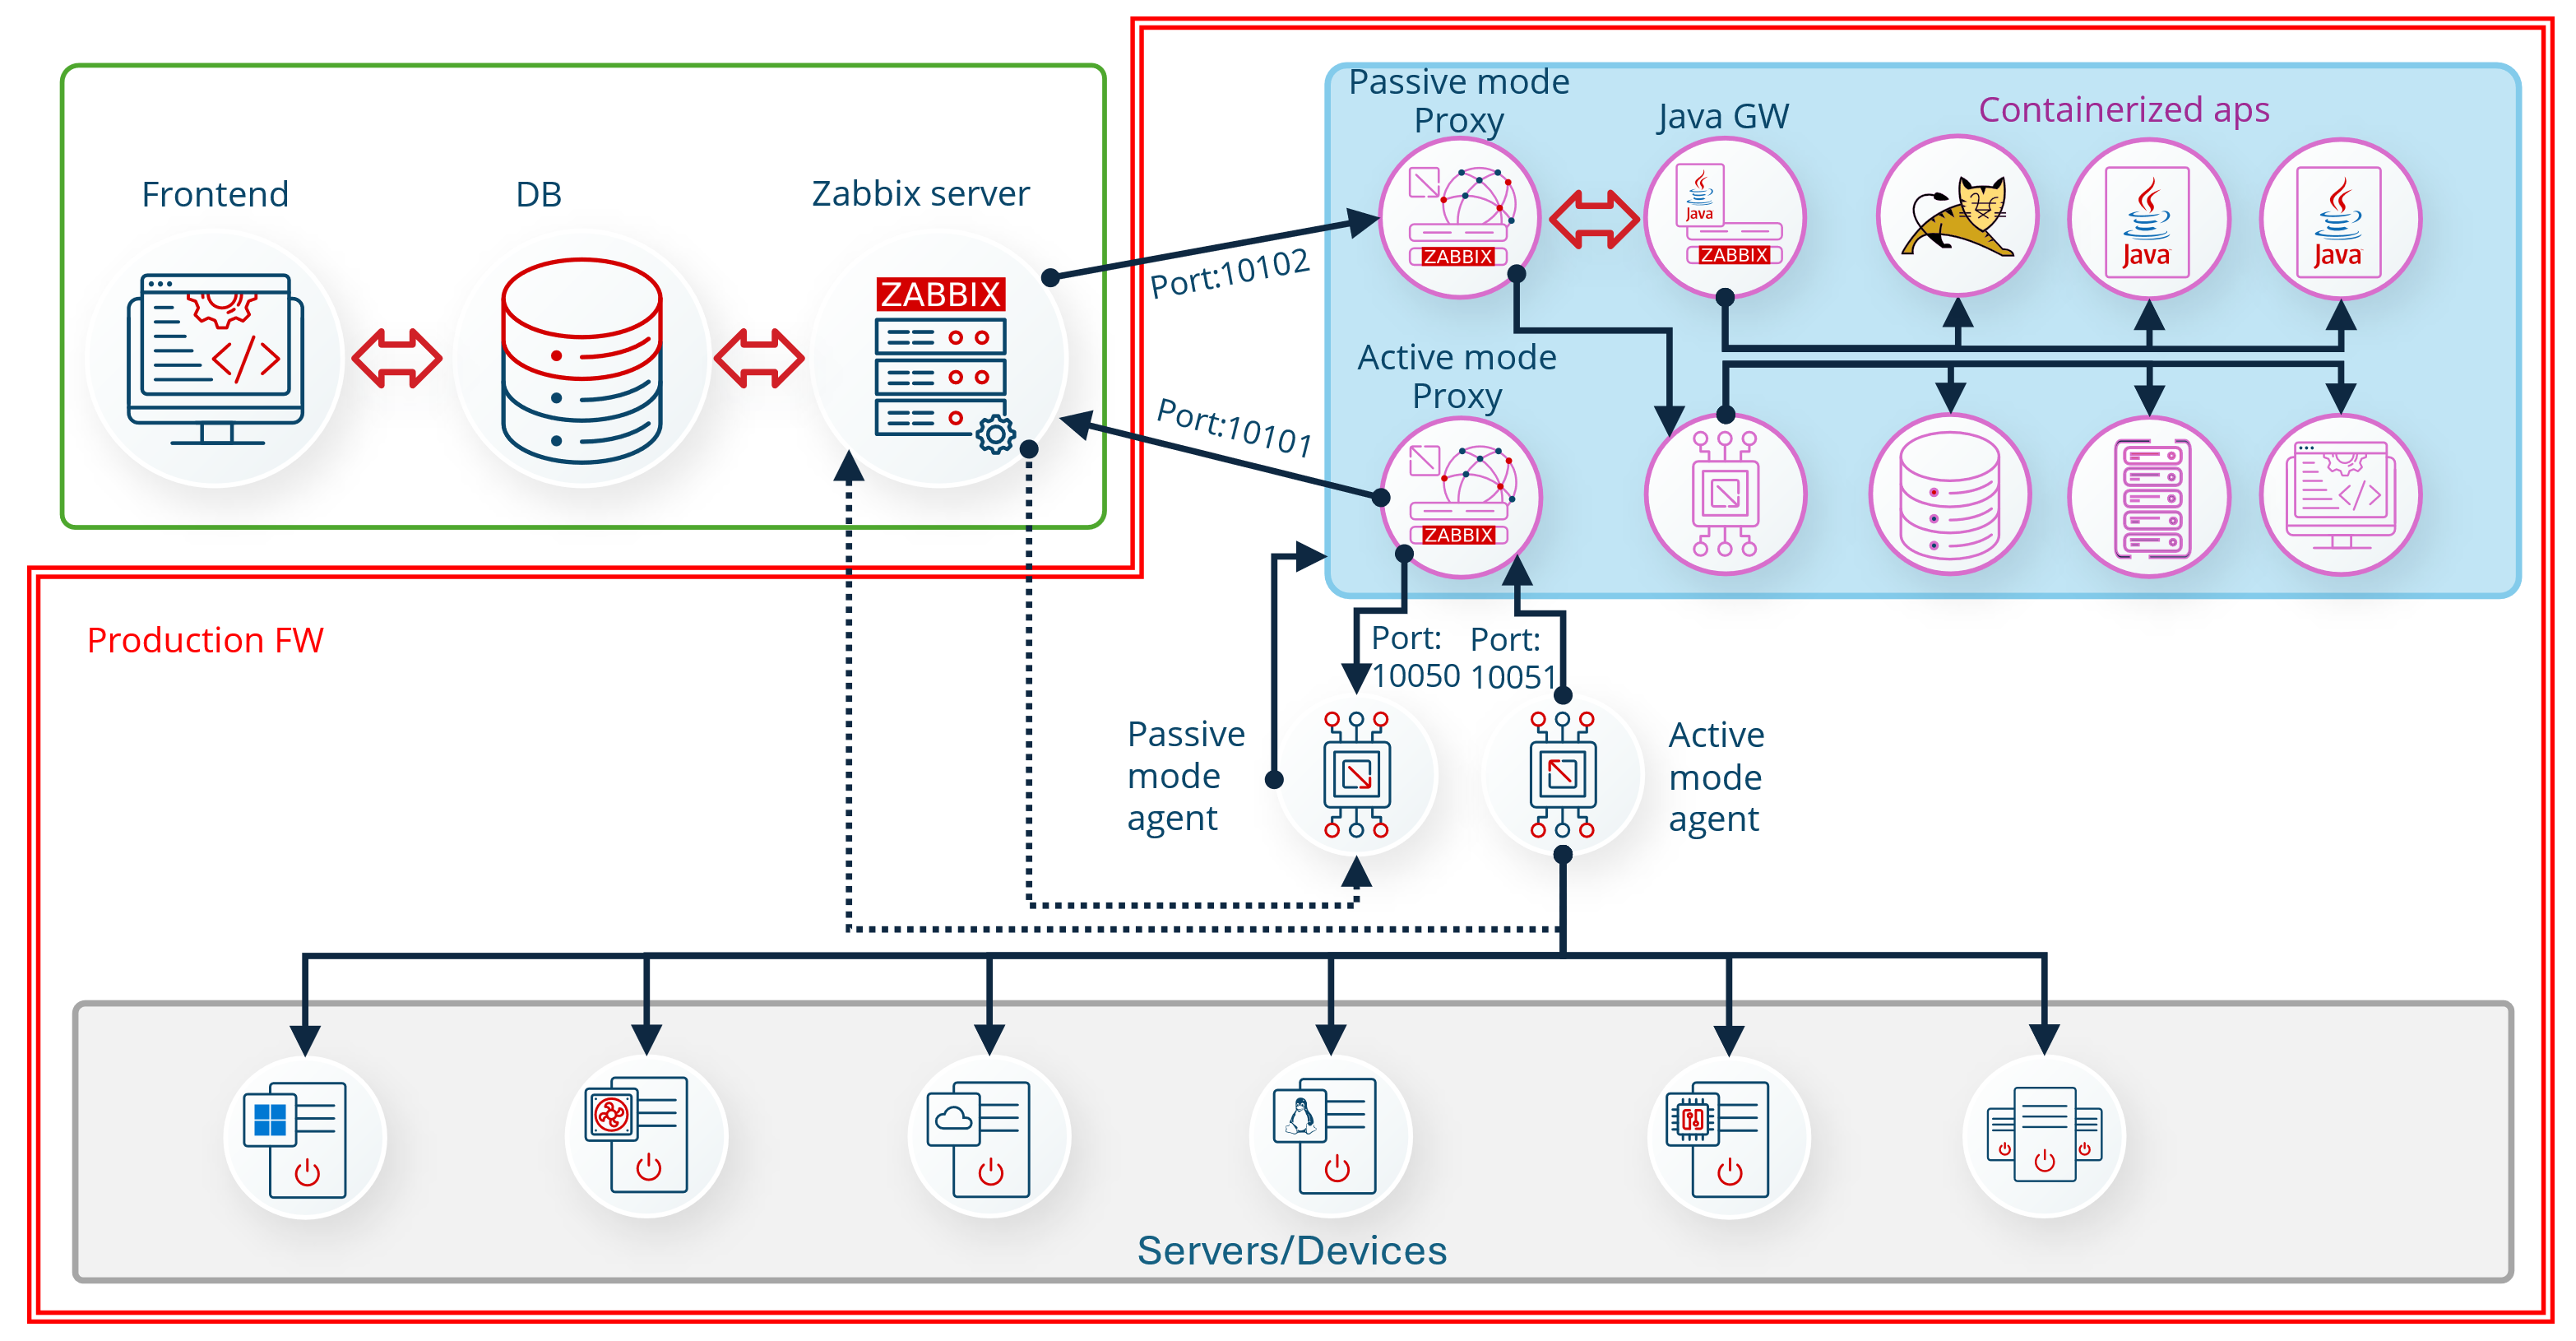
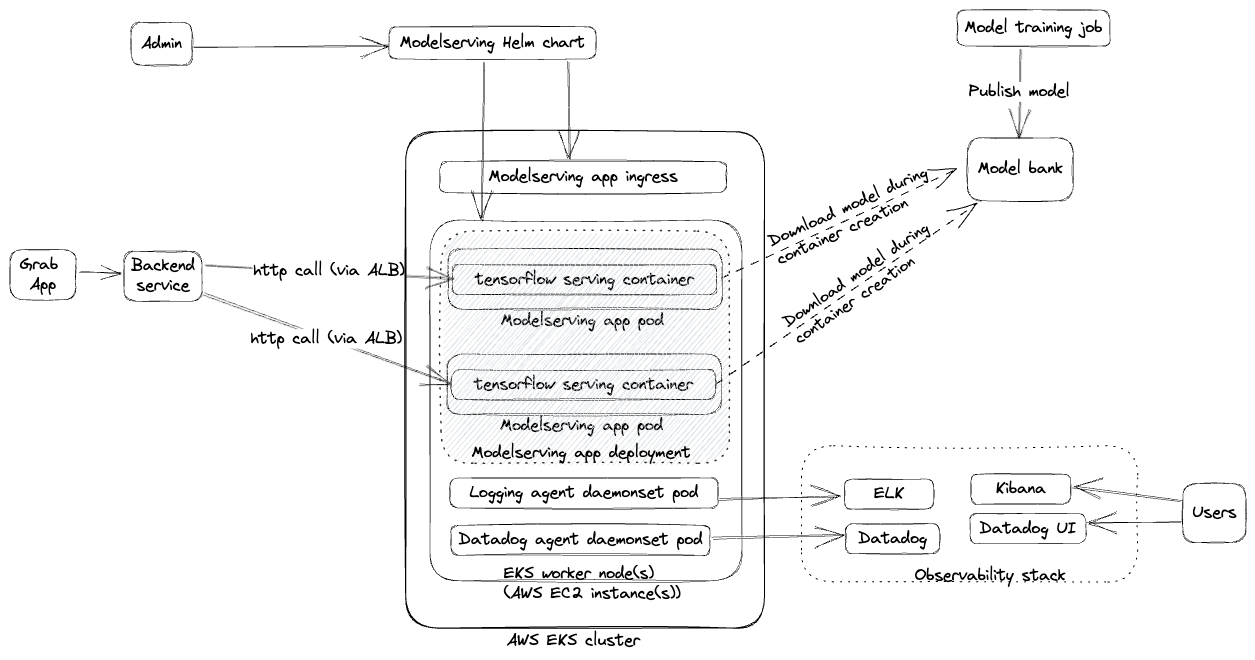
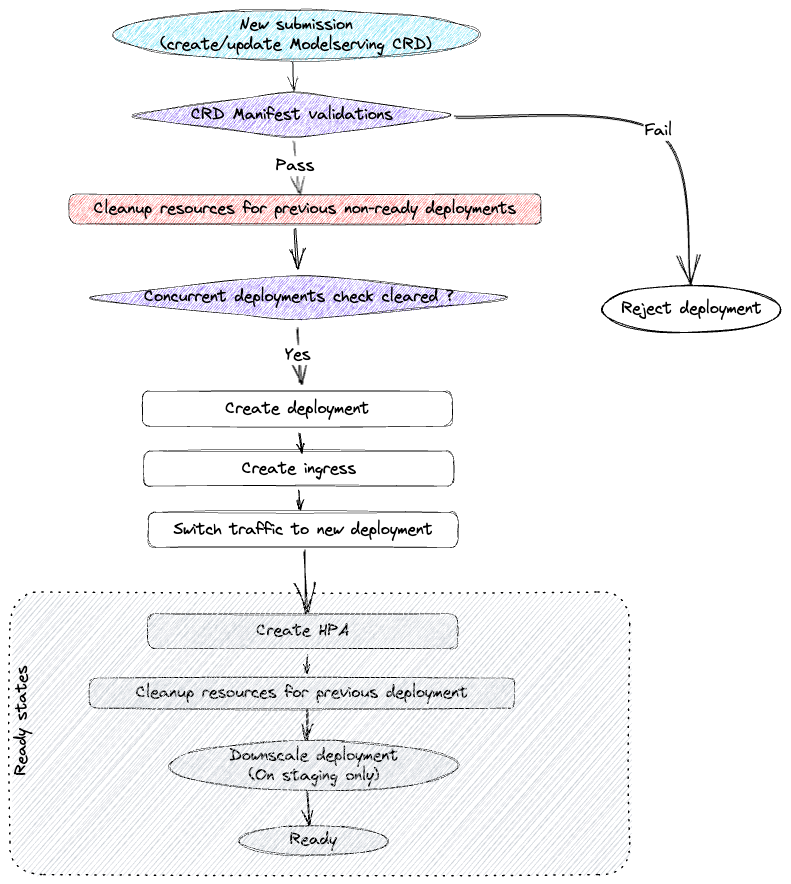
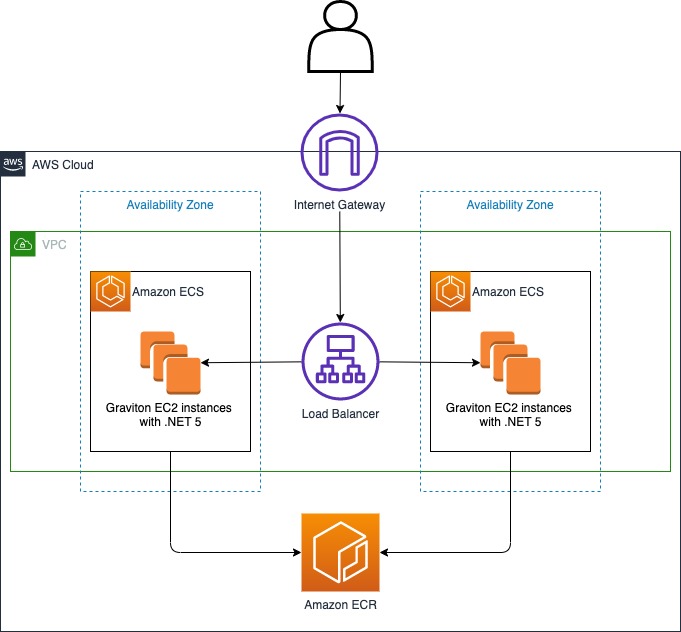
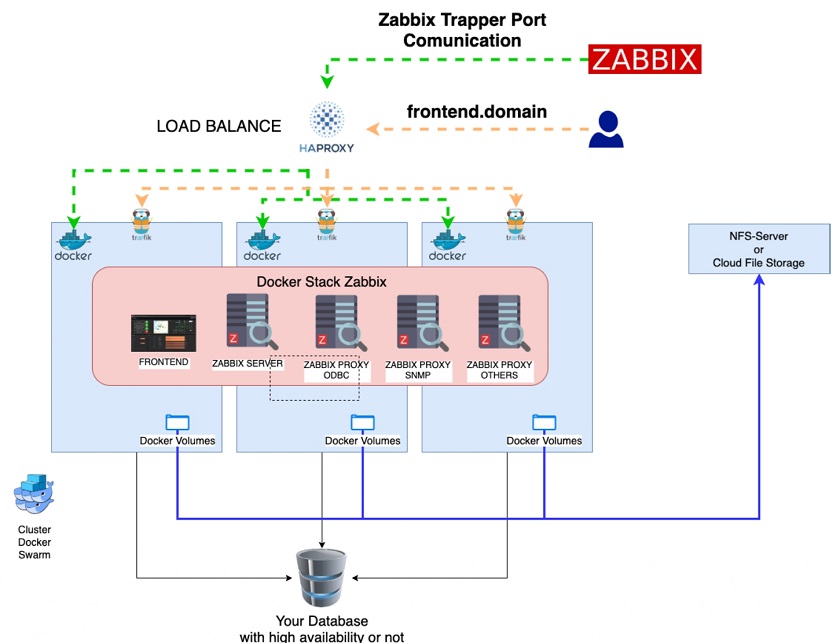
The following diagram illustrates the high-level architecture of this solution. We describe implementing each stage in more detail in the following paragraphs.
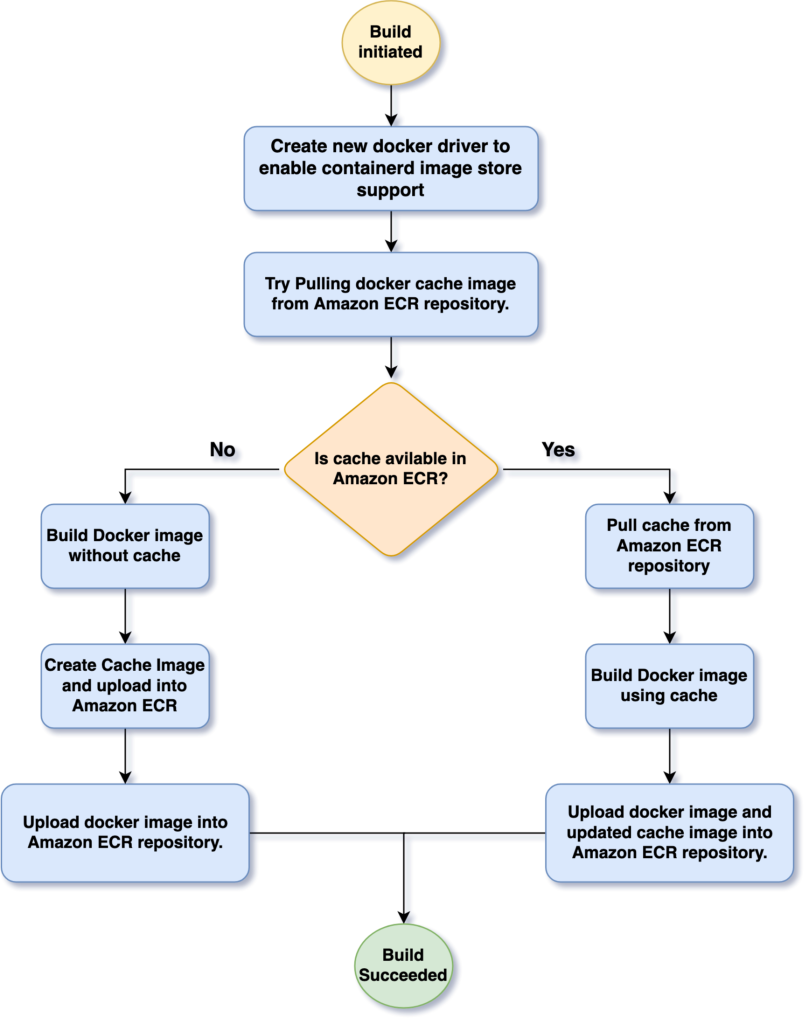
Figure 1: Solution Flow Diagram
To use an Amazon ECR registry as a backend for caching, we must first enable the containerd image store in our Docker driver. This feature is not enabled in the default Docker driver configuration. Therefore, we create a new docker driver using docker buildx command with containerd (docker-container driver) image store enabled.
When CodeBuild runs for the first time, it will attempt to retrieve cache data from the Amazon ECR repository. Since this is the first run, no cache will be available. CodeBuild will then proceed to build the Docker image from scratch, generate cache data during this initial build and export both the newly built image and its associated cache to the Amazon ECR repository.
In each subsequent build, CodeBuild will import the previously stored cache from Amazon ECR. This cached data will be used to speed up the image building process, as only the changed layers will need to be rebuilt. Finally, the updated cache and image will be stored back in Amazon ECR.
Prerequisites
Before we begin the walk-through, we must have an AWS account. If you don’t have one, sign up at https://aws.amazon.com.
Walk-through
Launch the following AWS CloudFormation template to create Amazon ECR repository and AWS CodeBuild project including CodeBuild service role and required permission as a managed policy.
AWSTemplateFormatVersion: "2010-09-09"

Description: 'AWS CloudFormation template to create infrastructure which demo using Amazon ECR as a remote cache for AWS CodeBuild'

Parameters:
  CodeBuildProjectName:
    Type: String
    Default: CBECRCacheDemoProject
    Description: "Enter name for your CodeBuild project"
  CodeBuildServiceRolePolicyName:
    Type: String
    Default: CodeBuildDockerCachePolicy
    Description: "Enter name for the IAM policy"
  ECRRepoName:
    Type: String
    Default: amazon_linux_codebuild_image
    Description: "Enter name for Amazon ECR repository"
  GitHubLocation:
    Type:  String
    Default: "https://github.com/aws/aws-codebuild-docker-images"
    Description: "Enter your source code GitHub URL"
  ImageTag:
    Type: String
    Default: demo
    Description: "Enter Tag name for your application docker image"
  CacheTag:
    Type: String
    Default: demo-cache
    Description: "Enter tag name for the cache image"

Resources:

  CodeBuildServiceRole:
    Type: AWS::IAM::Role
    Properties:
      AssumeRolePolicyDocument: |
        {
          "Version": "2012-10-17",
          "Statement": [
            {
              "Effect": "Allow",
              "Principal": {
                "Service": "codebuild.amazonaws.com"
               },
              "Action": "sts:AssumeRole"
            }
         ]
        }
      Path: /

  CodeBuildServiceRolePolicy:
    Type: AWS::IAM::RolePolicy
    Properties:
      PolicyDocument:
        Version: 2012-10-17
        Statement:
          - Effect: Allow
            Action:
              - ecr:BatchGetImage
              - ecr:BatchCheckLayerAvailability
              - ecr:InitiateLayerUpload
              - ecr:UploadLayerPart
              - ecr:CompleteLayerUpload
              - ecr:PutImage
              - ecr:GetDownloadUrlForLayer
            Resource: !GetAtt ECRRepository.Arn
          - Effect: Allow
            Action:
              - ecr:GetAuthorizationToken
            Resource: '*'
          - Effect: Allow
            Action:
              - codeconnections:UseConnection
              - codeconnections:GetConnectionToken
              - codeconnections:GetConnection
              - codestar-connections:GetConnectionToken
              - codestar-connections:GetConnection
            Resource: '*'
          - Effect: Allow
            Action:
              - logs:CreateLogStream
              - logs:CreateLogGroup
              - logs:PutLogEvents
            Resource:
              - !Sub 'arn:${AWS::Partition}:logs:${AWS::Region}:${AWS::AccountId}:log-group:/aws/codebuild/${CodeBuildProjectName}'
              - !Sub 'arn:${AWS::Partition}:logs:${AWS::Region}:${AWS::AccountId}:log-group:/aws/codebuild/${CodeBuildProjectName}:*'
          - Effect: Allow
            Action:
              - s3:PutObject
              - s3:GetObject
              - s3:GetObjectVersion
              - s3:GetBucketAcl
              - s3:GetBucketLocation
            Resource:
              - !Sub 'arn:${AWS::Partition}:s3:::codepipeline-${AWS::Region}-*'
      PolicyName: !Ref CodeBuildServiceRolePolicyName
      RoleName: !Ref CodeBuildServiceRole

  ECRRepository:
    Type: AWS::ECR::Repository
    Properties:
      RepositoryName: !Ref ECRRepoName
      ImageScanningConfiguration:
        ScanOnPush: true

  CodeBuildProject:
    Type: AWS::CodeBuild::Project
    Properties:
      Name: !Ref CodeBuildProjectName
      Source:
        Type: GITHUB
        Location: !Ref GitHubLocation
        BuildSpec: !Sub |
          version: 0.2

          phases:
            install:
             commands:
               - docker buildx create --name containerd --driver=docker-container --driver-opt default-load=true

            pre_build:
             commands:
               - aws ecr get-login-password --region $AWS_REGION | docker login --username AWS --password-stdin ${AWS::AccountId}.dkr.ecr.$AWS_REGION.amazonaws.com

            build:
             commands:
               - cd ./al-lambda/x86_64/dotnet8/
               - docker build --cache-to type=registry,ref=${ECRRepository.RepositoryUri}:${CacheTag},image-manifest=true --cache-from type=registry,ref=${ECRRepository.RepositoryUri}:${CacheTag} --tag ${ECRRepository.RepositoryUri}:${ImageTag} --builder=containerd .

            post_build:
             commands:
               - docker push ${ECRRepository.RepositoryUri}:${ImageTag}
      ServiceRole: !GetAtt CodeBuildServiceRole.Arn
      Artifacts:
        Type: NO_ARTIFACTS
      Environment:
        Type: LINUX_CONTAINER
        Image: aws/codebuild/amazonlinux-x86_64-standard:5.0
        ComputeType: BUILD_GENERAL1_SMALL
        PrivilegedMode: true
      Cache:
        Type: LOCAL
        Modes:
          - LOCAL_DOCKER_LAYER_CACHE
Specify the following parameters while creating the CloudFormation stack (see Figure 2):
- Set the cache image tag (CacheTag) to “demo-cache“.
- Name the CodeBuild project (CodeBuildProjectName) as “CBECRCacheDemoProject“.
- Specify the IAM policy name (CodeBuildServiceRolePolicyName) as “CodeBuildDockerCachePolicy“.
- Define the ECR repository name (ECRRepoName) as “amazon_al_lambda_codebuild_image“.
- Enter the GitHub repository URL (GitHubLocation) as “https://github.com/aws/aws-codebuild-docker-images“.
- Set the Docker image tag (ImageTag) to “demo“
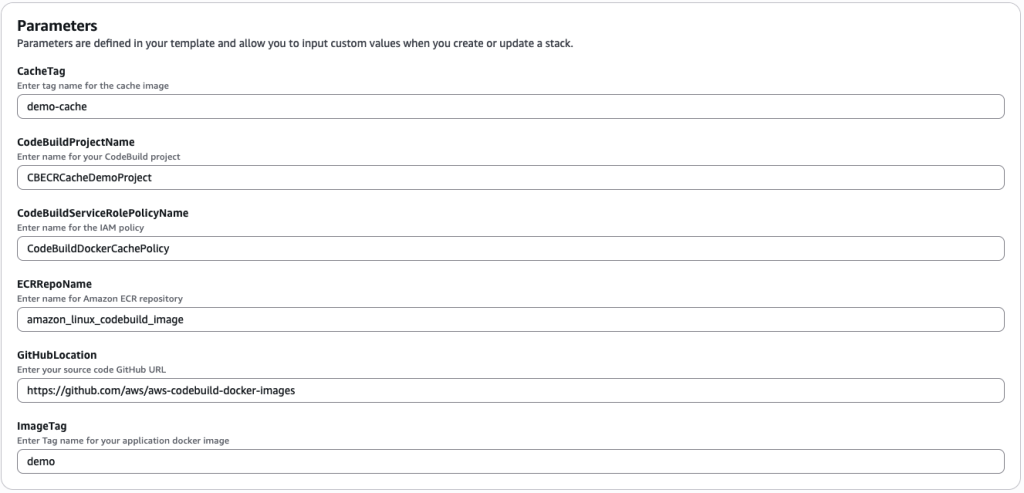
Figure 2: CloudFormation Stack parameter
The CloudFormation stack will set up a comprehensive development environment for our project. It will create a CodeBuild project equipped with all necessary IAM roles and permissions, ensuring smooth and secure build processes. Additionally, the stack will create an Amazon ECR repository. This repository is configured to automatically scan Docker images for vulnerabilities upon upload. The ECR will serve as a secure storage location for both our Docker images and cache images.
The CodeBuild project will be created with a buildspec file which will instruct CodeBuild to do the following:
- Creates a new driver called “containerd” using buildx since the default Docker driver supports registry cache backend only when the containerd image store is enabled.
- To pull and push both Docker images and cache, authentication with the Amazon ECR repository is required.
- During the image build process:
- We use the
--cache-fromparameter to force Docker to check for and use any existing cache from the repository. - The
image-manifestoption is set to true to enable cache storage in the Amazon ECR repository. - The
--cache-toparameter is used to push or update the cache to the Amazon ECR repository.
- We use the
- After the build is complete, in the post-build phase, the image is pushed to Amazon ECR. The cache is automatically uploaded to the Amazon ECR repository as part of the Docker build command execution.
Testing the solution
After having successfully created the CloudFormation stack, we can proceed to test and evaluate how it performs.
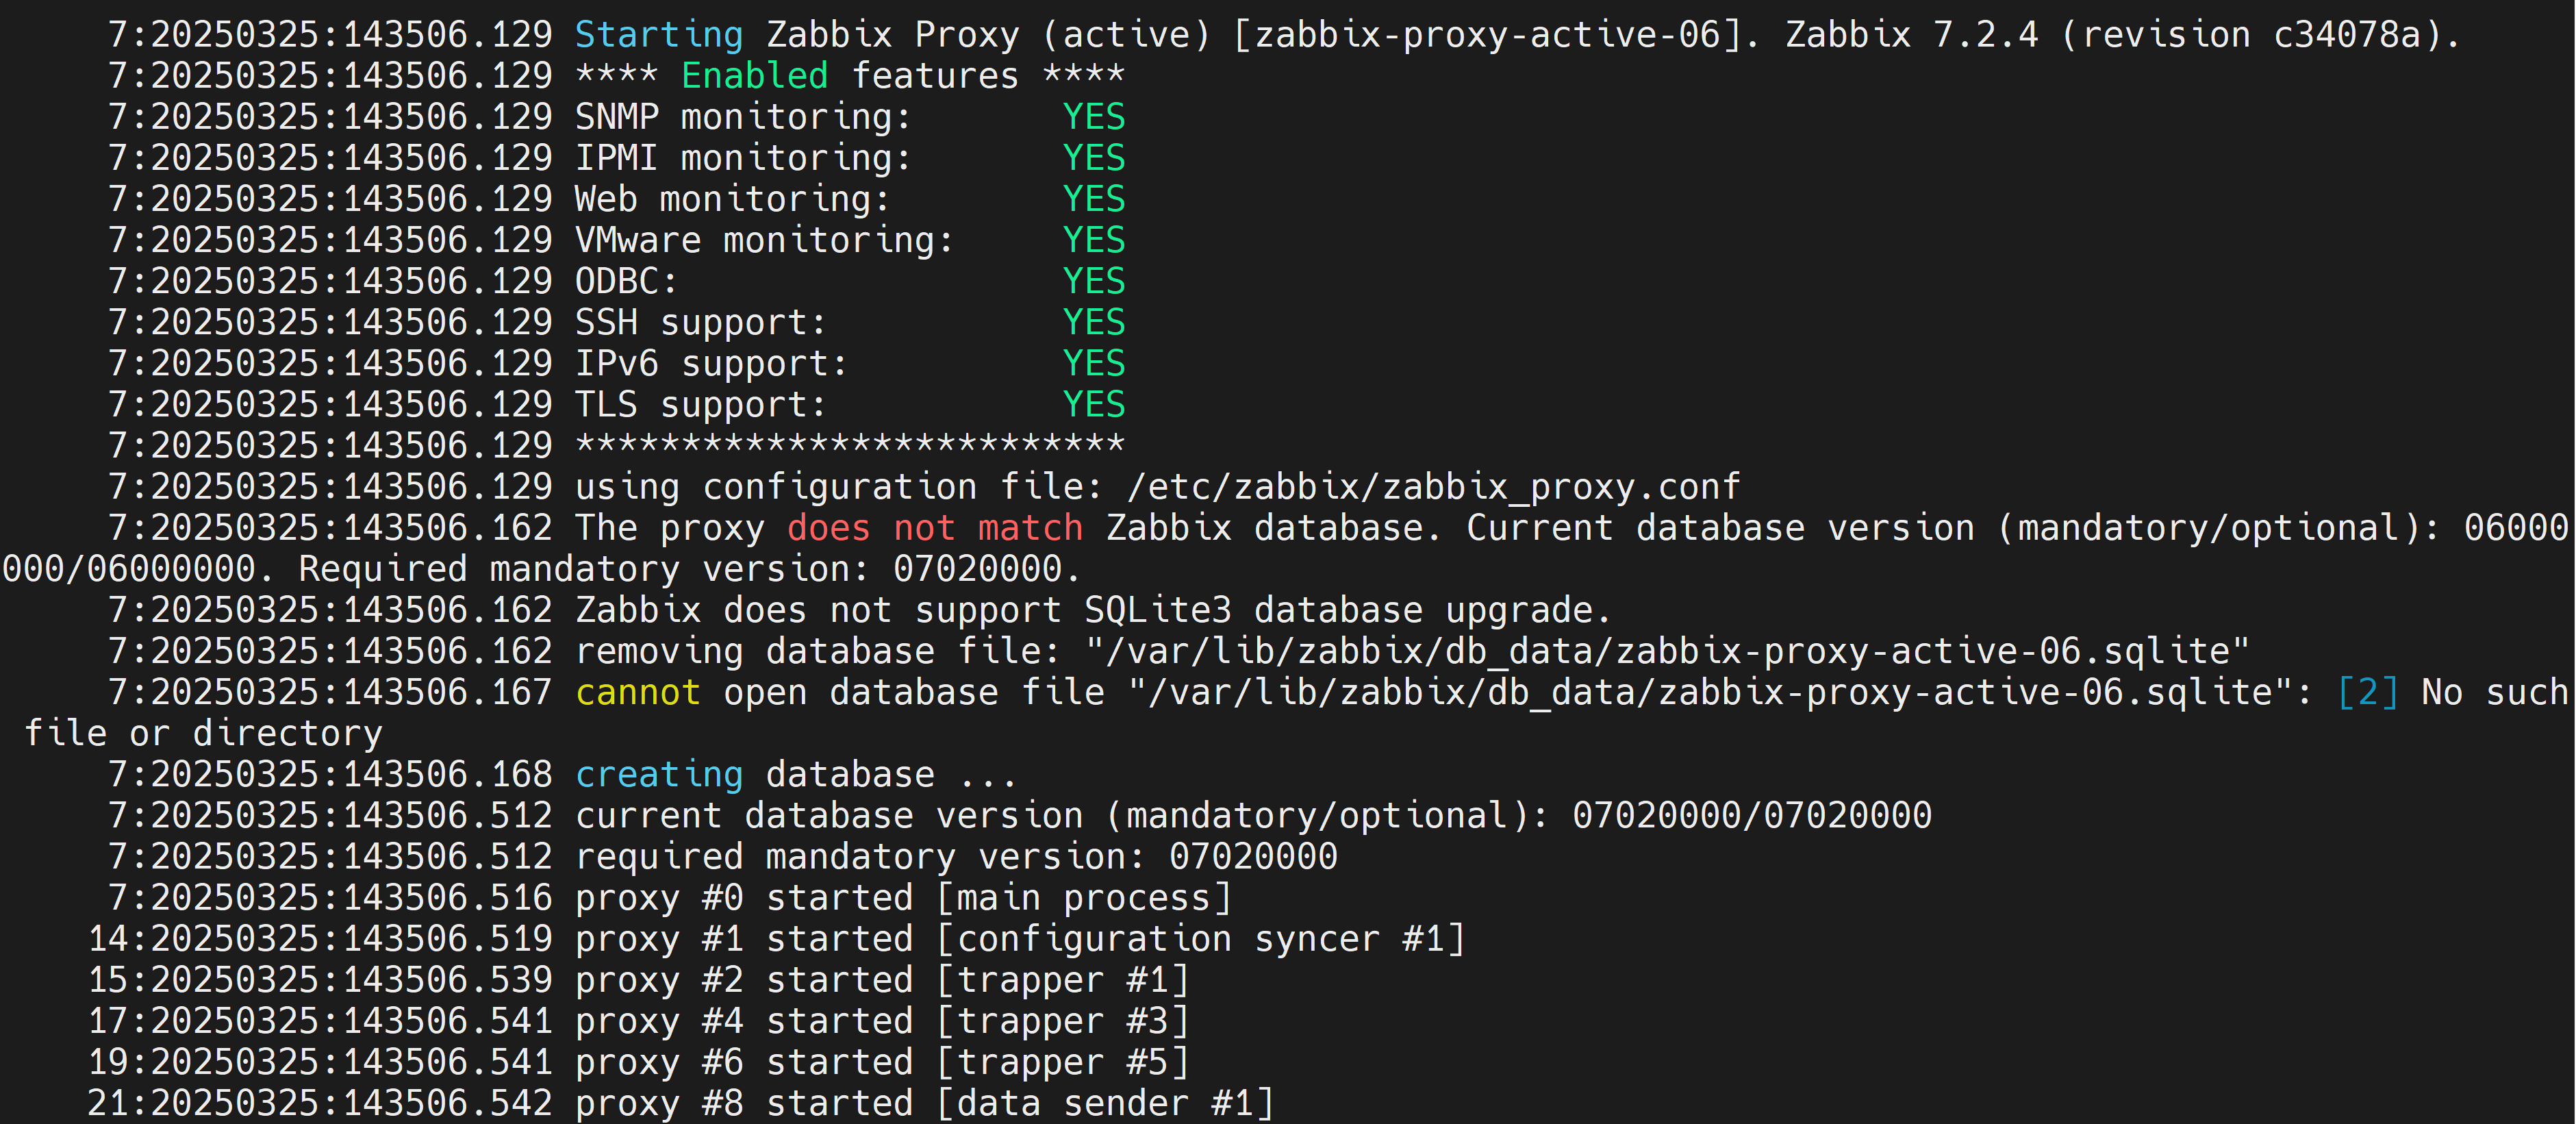
The initial build process took approximately 10 minutes to complete. Since this was the first execution, no cache was available in Amazon ECR, requiring the system to build the image entirely from scratch. Although the cache import operation failed as expected during this initial run, the system continued with the build process without any cached layers. This first build served a dual purpose: it not only created the application image but also generated a cache, which was then exported to Amazon ECR as a separate image. This cached data would become available for future builds, setting the foundation for more efficient subsequent builds.
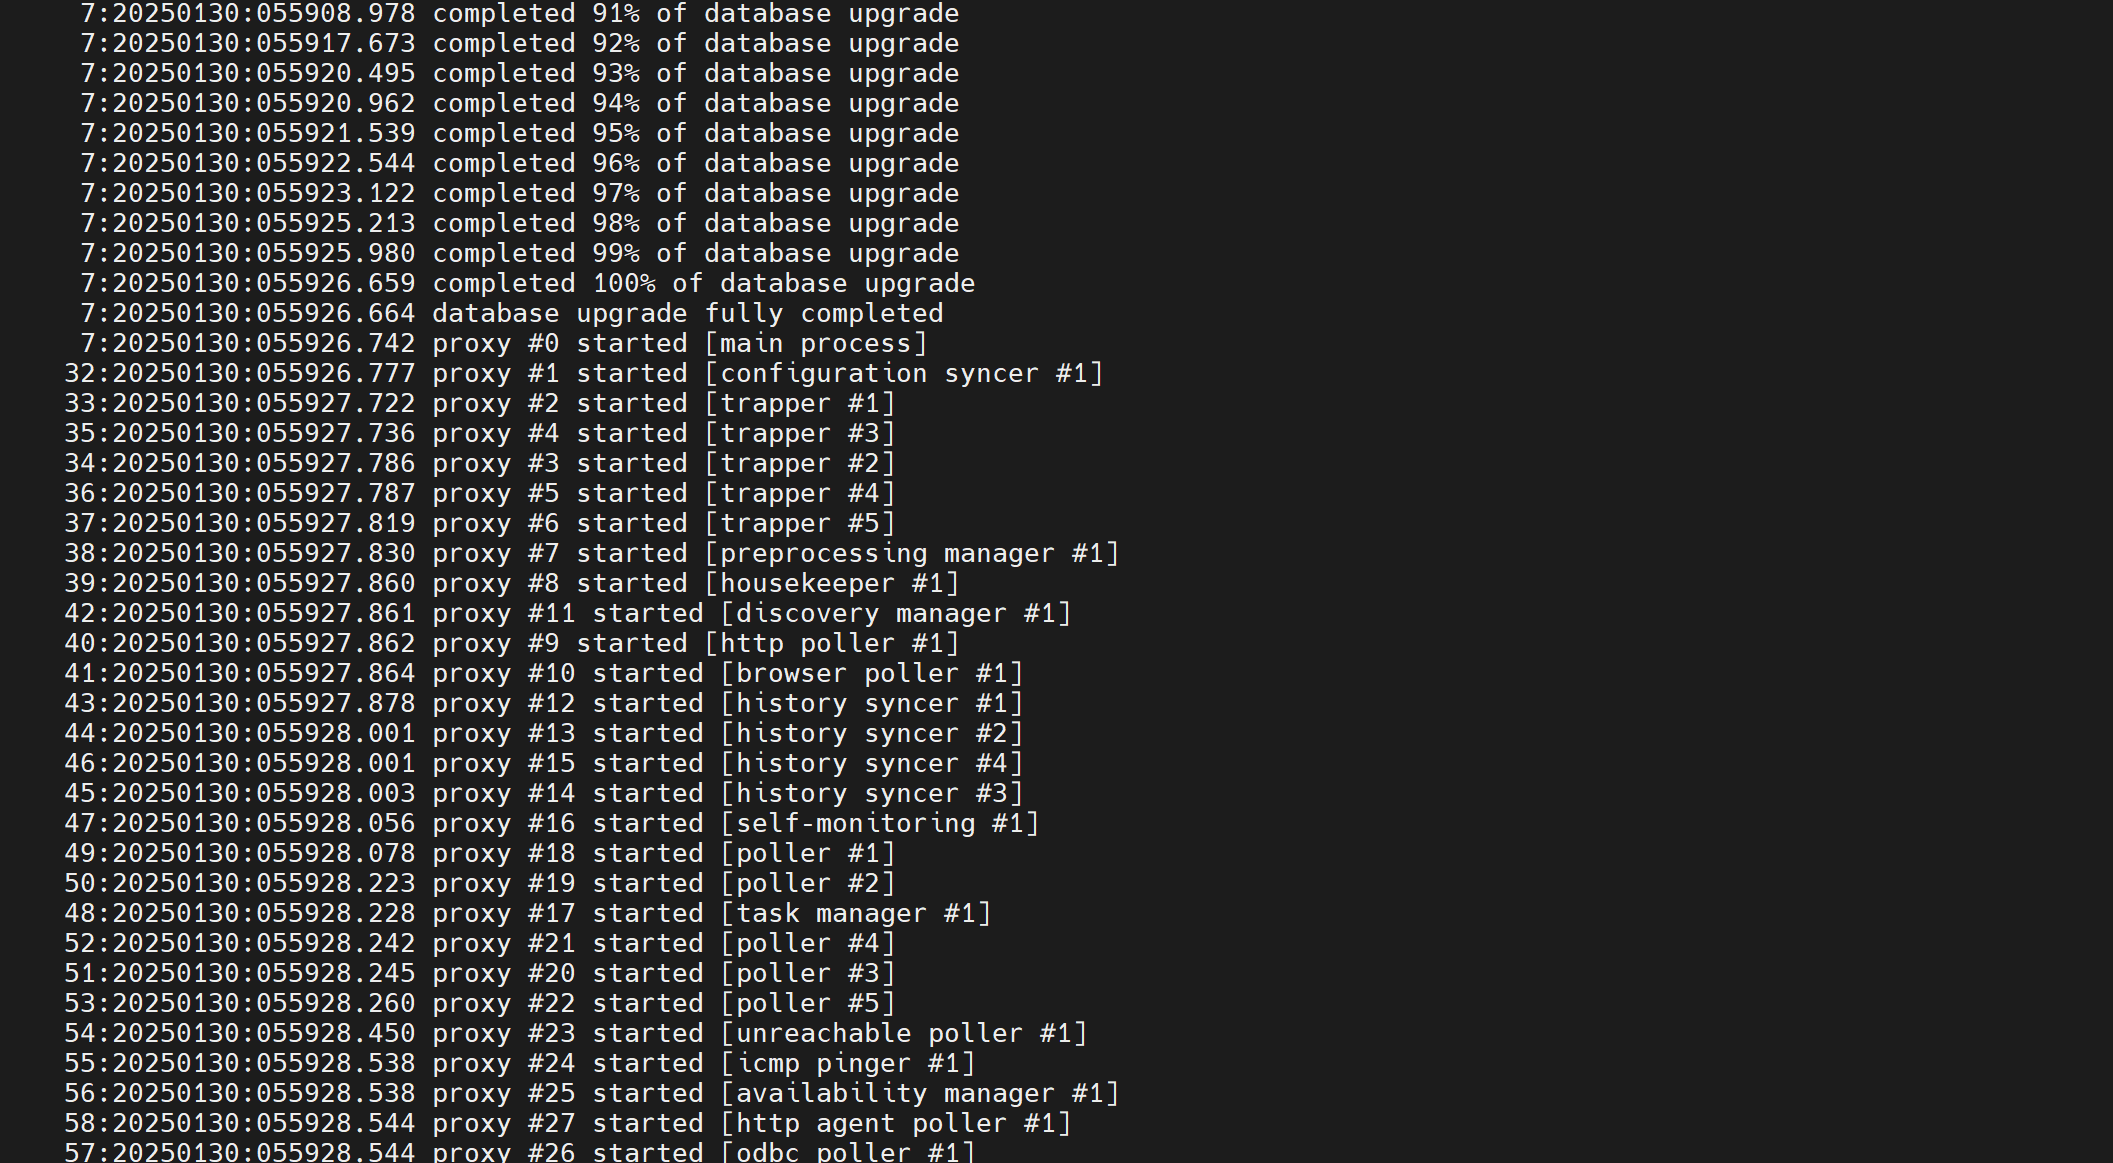
To verify the effectiveness of the solution, we triggered a second build after introducing a minor modification – adding an echo command in the middle of the Dockerfile’s active commands (excluding commented line). During this subsequent build, Docker intelligently utilized the cached layers up until the point of modification, after which it rebuilt only the necessary layers. This smart caching strategy resulted in a build time of approximately 6 minutes, clearly demonstrating how the caching system optimizes the build process even when changes are introduced. Further validation across multiple large-scale projects confirmed the effectiveness of this approach, consistently achieving build time reductions of up to 25%.
We enabled CodeBuild’s built-in Docker layer caching feature on a best-effort basis. This approach is recommended as it uses cached layers in the local when available instead of downloading them from the repository, which will further improve the overall build speed.
Cleaning up
When we finished testing, we should de-provision the following resources to avoid incurring further charges and keep the account clean from unused resources:
- Delete the docker images from the Amazon ECR repository
amazon_al_lambda_codebuild_image. - Delete the CloudFormation stack which has been created in the “Launch the AWS CloudFormation template” section.
Conclusion
In this discussion, we explored an efficient and straightforward solution for implementing external Docker caching in CodeBuild using Amazon ECR as a backend storage system. This approach offers several key benefits:
The solution reduces Docker build times in CodeBuild up to 25% and is versatile enough to handle most scenarios, including complex multi-stage builds. A particularly valuable advantage is that Amazon ECR stores the cache separately in its repository, making it reusable across different projects.
The business impact is substantial: shorter build times lead directly to reduced compute costs. More importantly, this optimization results in a more streamlined development lifecycle, enabling faster feature releases at lower operational costs.
In essence, this caching solution not only improves technical efficiency but also delivers tangible business value through reduced costs and accelerated development cycles.