When managing large-scale infrastructure, the process of installing monitoring agents is often repetitive and time-consuming. Administrators must log into each server, manually run installation commands, and configure the agent to connect to the Zabbix server. To address this issue, the Zabbix Agent Deployer custom module was created. This module enables the direct installation of Zabbix agents on multiple hosts from the Zabbix Web interface.
The features of the Zabbix Agent Deployer module include:
Bulk host list input using a CSV file.
The ability to automatically add hosts to Zabbix and remotely install the Zabbix Agent on the
associated hosts.
The ability to display installation log results directly within the module.
With this approach, administrators can add new hosts to the monitoring system faster and more efficiently.
Key use cases for the Zabbix Agent installer
The Zabbix Agent Deployer module enables several practical scenarios, including:
1. Faster provisioning for new servers – When adding a large number of servers, agents can be installed simultaneously without requiring a login to each machine.
2. Standardized installation – All agents are installed in the same way using a centralized script, reducing the risk of misconfiguration.
3. Easier additional provisioning – Provisioning new servers is easier for users because they don’t need to configure them directly on the server.
Getting started with the Zabbix Agent Deployer module
Solution overview architecture
To use this module, the main steps are:
1. Upload the custom module to the Zabbix frontend in the /usr/share/zabbix/modules/ directory.
2. Enable the module from the Administration → General → Modules page, and click the Scan Directory button. Locate the Zabbix agent deployer module and click Enabled.
3. Once activated, the Zabbix agent deployer module can be accessed in the Data Collection menu. Here’s a screenshot of the Zabbix agent deployer module.
4. Prepare a CSV file like the format below, or download a sample CSV from the module page.
With this CSV file, we will add two hosts to Zabbix to be monitored and automatically install the Zabbix agent on them.
5. Upload the CSV file to the Zabbix agent deployer module page and click Apply.
6. The Zabbix agent deployer module will handle the process of adding hosts to Zabbix and installing the Zabbix agent. The status can be seen as follows:
From the image above, server1 and server2 were successfully added to Zabbix, and the Zabbix agent installation was successful!
7. Check out the Zabbix hosts list page. Hosts will appear according to the uploaded CSV file.
Conclusion
The implementation of this custom Zabbix Agent installer extends Zabbix’s capabilities beyond its built-in functionality. The Zabbix Agent Deployer module enables a more efficient bulk host addition process, as all steps from adding hosts to Zabbix to installing the Zabbix agent can be integrated through a single page.
If you’re interested in implementing this, please contact us. Bangunindo is a premium Zabbix partner in Indonesia. We’re ready to help you design, implement, and optimize your Zabbix solution to suit your needs.
Aruba Central is a SaaS solution that allows you to manage your Enterprise Aruba network environment. Due to the increasing number of cloud migrations, we can expect that more and more Aruba customers will move their on-premise environment to it, which will also mean a change in their monitoring environment. In this article, I will show you how to switch to API- based monitoring using Aruba Central and Zabbix. All custom resources mentioned can be found in my repository.
Aruba Central’s API
Oauth 2.0 is used, so you can forget the simple token management. At the end it is great, but for monitoring purposes it is overkill. There is pretty good documentation (referred to later) regarding how you can generate your access token, but after two hours it expires so you need to continually refresh it. To do this, you must use a refresh token, which can help you to get a new access token AND a new refresh token.
Within two hours, use the latest refresh token to repeat this action again. At this point you can imagine that this is not something you can implement easily by using the Zabbix GUI only. Well, maybe with some javascript magic, but otherwise there is no native support for this logic at this point of time. So how can we do this? In short:
Generate your client credentials
Generate your first token
Schedule the token refresh for every two hours
Update your host macro via Zabbix API
Use the token in Zabbix HTTP agent checks
Monitor your environment based on JSONPath pre-processing
Initial steps within Aruba Central
To manage your API access, you need to launch your “HPE Aruba Networking Central” application, so do NOT look into your workspace modules – the “Personal API clients” menu is NOT what we are looking for. Turn off the “New Central” view – at this point the early access version is not so useful (hopefully it will change soon).
The first time you get there, you will not see any items, but under the “My Apps & Tokens” tab you can click the “Add Apps & Tokens” button and generate it. Technically, this is already enough to start to monitoring your network infrastructure, but within two hours it would stop. So the relevant data for us are the “Client ID” and “Client Secret.” Feel free to revoke the recently created token at the bottom area as we do not need it.
Record your credentials
For this article, I am using a simple file to store all the credentials, which will be sourced into a bash script. Please keep in mind that storing your sensitive credentials in a single file is a BAD practice! Your SECO/CISO would probably have a few words with you about it, so please consider a better approach. A more secure way would be to use some Key Vault solution (like Azure, AWS, Google, or Hashicorp). Anyway, let’s continue with this unsecure example:
#!/bin/bash

### ZABBIX VARS ###

# URL of your zabbix instance (assuming you do not use the "/zabbix" ending, if yes, then add it to the end)
zabbix_url="https://your.zabbix.instance.net"
# Your Zabbix API token. If you do not know how to get it, check the documentation.
zabbix_api_token="1234_your_zabbix_api_key_5678"
# Create a host with a macro, remain at the "Macros" tab, turn on debug mode, look for "[hostmacroid] =>"
zabbix_macro_id="12345"

### ARUBA VARS ###
# To find yours, go here and check "Table: Domain URLs for API Gateway Access"
base_url="YOUR_ARUBA_CENTRAL_BASE_URL"
# Click on your profile in the Central app and you will find it there: 32 char long hexa string
client_id="YOUR_CLIENT_ID"
# provided in the previous step
client_secret="YOUR_CLIENT_ID"
# provided in the previous step
customer_id="YOUR_CUSTOMER_ID"
# your login credential
account_username="YOUR_CENTRAL_LOGIN_USERNAME"
# your login credential
account_password="YOUR_CENTRAL_LOGIN_PASSWORD"
# to be populated later
csrftoken=""
session=""
auth_code=""
Get or refresh your token and update the Zabbix host macro
The next steps are based on the official Aruba documentation, which you can find here. Please remember that there are many ways to achieve our target – this is just one example and probably not the most optimal one. Feel free to change / improve it with your code in your preferred scripting language.
The below script assumes that the file containing the credentials (previous step) is named as “variables” and located in the folder named “central.”
Filename: aruba_central_token_new.sh
Purpose: To be used for first time token generation. Later, you only have to refresh your token with the script after this one.
Remarks: Aruba is limiting this API query set, so you can run it only ONCE every 30 minutes! If you made a typo somewhere, wait 30 minutes before your next attempt or tweak the result files.
Purpose: To refresh your existing token. It is expecting an existing refresh token in the “token_refresh.latest” file, so better to run the previous script one time before this.
Remarks: You can run this script as many times you want, but it will result in new tokens only once per every two hours (when the current one expires). Therefore, refreshing too frequently is pointless.
In my case, both the scripts and variables files are in the same “central” folder, which is in a git repository. Each time I call one of the scripts, it will record the new tokens in files, which are committed and pushed to the repo. In my own implementation, this is how I call the refresh script and sync the result with my repo:
You must run your refresh script at least once per every two hours. To make this happen you have many options, including:
cron (old-school, outdated way)
systemctl timer (a better way, but only if it is monitored)
Jenkins / Github Actions/etc.
Zabbix itself, by calling your bash script
In my case, Jenkins does the scheduling and execution and the job is monitored via Zabbix.
Monitor your network infrastructure
When everything is in place, then the monitoring part is pretty simple. The usual JSONPath based logic can be used. API call documentation can be found here. The template contains only the wireless components, since I do not have my switches in Central. Implementing the switching part should not be difficult – just have a look at the “Switch” section, then clone and adjust one of your “get” items.
Screenshots
Latest data – tag based filtering:
Latest data – Site health
Latest data – Gateway info
Latest data – AP info
Triggers:
Some triggers are intentionally disabled, because they are a bit redundant. However, I wanted to cover all options. Sometimes less alerting is better if you have a ticketing system integration, otherwise your monitoring system will turn into a ticket factory.
Known issues and limitations
Since we are not querying the devices directly, some delay can be expected. Based on my recent testing, the delay compared to real time is between 3-10 minutes. In my test I disconnected my test environment and then started to do manual updates frequently. Some items got the real state earlier, some only later.
If your refresh script will malfunction for whatever reason (normally it should not), then you may have to run the other script once to generate a new token, or you can go to the GUI and check the last refresh token, with which you can override the content of the “token_refresh.latest” file.
Aruba is limiting the number of API queries to 5,000 per day. This could seem annoying, but it is way more than what you need (you should expect less than 1,000 in normal conditions, depending on your update frequency).
Zabbix API will not authorize your call unless you insert a line into your apache vhost configuration. This is a more generic Zabbix API issue that is not related to Aruba Central.
If Aruba Central has a maintenance activity, then the token refreshing way could break. Running the token request script once should address the issue.
Summary
Aruba Central’s API is pretty decent, but if you start from zero it could take a while to get to the end of it. With this guide, my intention was to speed you up, but please do not consider my scripts and the shown example as the only or best possible way – I’m just hoping it can give you a good base for your own solution. Have fun!
In most organizations, printing is an essential but often invisible service. When it works, nobody notices. When it fails, productivity stalls. That’s why monitoring your print environment is just as important as monitoring servers, databases, or network devices.
At Opensource ICT Solutions, we specialize in turning complex systems into observable services. One recent example is our integration of PaperCut NG with Zabbix. This allows IT teams to track the health of their print infrastructure in real-time — everything from server resources to individual printers and devices.
Why monitoring PaperCut matters
PaperCut NG does much more than queue print jobs. It enforces quotas, integrates with authentication systems, and manages fleets of devices. If the database runs out of connections, the disk fills up, or the license expires, users feel the impact instantly.
By integrating PaperCut with Zabbix, we make these risks visible long before they become business problems. The result is:
Proactive detection of printer errors, low toner, or license issues.
Capacity planning through trend analysis of disk usage, memory, and DB connections.
Unified visibility — PaperCut health checks appear right alongside servers, networks, and applications in Zabbix dashboards.
How the integration works
The magic happens through the PaperCut System Health API and Zabbix’s flexible data collection methods.
HTTP agent items
Zabbix fetches raw JSON data directly from PaperCut using an HTTP agent item, such as:
This single call provides a full snapshot of server health.
Dependent items + JSONPATH
Instead of hammering the API with multiple requests, we extract the needed fields using dependent items with JSONPATH preprocessing.
For example:
This design means one request can populate dozens of metrics, keeping monitoring both efficient and lightweight.
Calculated items
Some values aren’t directly available from PaperCut. In those cases, we create calculated items inside Zabbix.
For example, the percentage of active DB connections is derived as:
This allows us to set intelligent triggers like “DB connections > 90%” without requiring PaperCut to calculate it for us.
Low-level discovery (LLD) for devices and printers
Perhaps the most powerful part of this integration is automatic discovery.
Printer LLD → Queries /api/health/printers and creates items and triggers per printer. If a printer goes into Paper Jam or No Toner, Zabbix knows immediately.
Device LLD → Queries /api/health/devices and builds items dynamically for each discovered device, tracking states like OK, WARNING, or ERROR.
This ensures that new printers and devices are monitored automatically — no manual configuration required!
Why this matters
Bringing all of this together, the integration turns PaperCut NG into a fully observable service inside Zabbix.
Efficiency → One API call, dozens of metrics.
Scalability → Automatic discovery of printers and devices.
Robustness → Alerts and dashboards for licenses, resources, and print queues.
For IT teams, this means fewer surprises, faster troubleshooting, and more confidence in a service that often goes unnoticed until it fails.
Our expertise
This PaperCut integration is just one example of how we at Opensource ICT Solutions help organizations unlock the full potential of Zabbix. We don’t just install monitoring – we design intelligent, scalable integrations that make hidden systems visible. Whether it’s print management, databases, custom applications, or network devices, we know how to extend Zabbix to fit your environment and give you the insights that matter most.
In today’s digital era, information is an asset and most of it is obtained from websites. The ability to automatically monitor website content changes has become a crucial competitive advantage, as even small changes on a website can affect business strategies, security postures, and data-driven decision-making. Accordingly, Zabbix 7.0 saw the introduction of a new feature called Browser Item, which allowed users to perform advanced website monitoring using a browser.
The Browser Item feature includes the ability to:
● Capture screenshots of the current website state
● Measure website performance and availability metrics
● Extract and analyze data from web pages
● Generate automatic alerts based on detected changes or errors
This means Zabbix is no longer limited to traditional IT infrastructure monitoring. It can now also serve as a tool for monitoring strategic external information.
Key use cases for website change monitoring with Zabbix
The Zabbix Browser Item opens up many valuable use cases for organizations that want to proactively track website changes. Below are some key examples:
Monitoring release notes
Tracking vendor release notes is essential for IT teams. With Zabbix, we can automatically detect new releases, extract relevant information, and notify the appropriate team members so they can respond faster.
Tracking security advisories
Security advisories are critical for maintaining a strong security posture. By monitoring websites that publish vulnerability information using Zabbix, security teams can be promptly alerted about new threats and take timely actions to reduce risks.
Monitoring competitor websites
In a competitive market, staying informed about competitor activities is vital. Zabbix allows users to monitor competitor websites for pricing updates, new product offerings, marketing campaigns, or news announcements, while providing valuable business intelligence to support strategic decisions.
Monitoring tender announcements
Zabbix can also monitor websites for new tender announcements from government portals or business partners, ensuring our organization stays aware of the latest business opportunities.
Ensuring internal website integrity
Beyond external sites, we can also use the Browser Item to ensure the integrity and availability of our own websites. It helps detect unexpected content changes, broken links, or performance degradation that may affect the user experience or signal potential issues. Proactive monitoring helps maintain a high-quality user experience and protect our brand reputation.
Getting started with website change monitoring in Zabbix
Solution overview architecture
This diagram shows how Zabbix uses a WebDriver to capture and analyze website content.
The collected data is stored in Zabbix for visualization and alerts when changes are
detected.
Step-by-step configuration
In this example, we’ll monitor changes on the Nginx Security Advisories webpage.
Step 1: Prepare the Web Driver
Zabbix requires a Web Driver to perform browser-based monitoring. One commonly used option is Selenium, which can be deployed using the following Docker image:
Step 2: Configure WebDriverURL on Zabbix server or proxy
Update the WebDriverURL parameter in your Zabbix Server or Zabbix Proxy configuration to point to the Selenium service you deployed.
Step 3: Create a Browser Item in Zabbix
1. Create a host if it doesn’t already exist.
2. Add a new item with the following settings:
Type: Browser
Type of information: Text
The key part is the script section. Below is the example script.
The script uses two methods:
browser.navigate method defines the URL to be monitored
browser.findElements method specifies the page section where changes should be detected
Note: The StartBrowserPollers parameter must be enabled on the Zabbix server or proxy configuration for browser items to work. It is enabled by default with the value StartBrowserPollers=1.
Step 4: Create dependent items
The Browser Item produces a JSON result containing website data. This item serves as the master item for dependent items such as:
Extracting the latest security advisories
Capturing a website screenshot
Step 5: Create a trigger for change alerts
Create a trigger that compares the current and previous values of the “latest security advisories” item. If any change is detected, Zabbix will automatically send an alert notifying your team of the update.
Step 6: Display data on the dashboard
To visualize the monitored data, we can use the Item History widget on a Zabbix dashboard to show both the latest security advisories and the corresponding screenshot, for example.
Conclusion
The Browser Item feature in Zabbix 7.0 elevates website monitoring beyond simple availability checks. It enables comprehensive monitoring of website changes, unlocking a variety of use cases such as tracking release notes, security advisories, competitor activity, and more.
If you’re interested in implementing this capability, feel free to contact us. Bangunindo is a Zabbix Premium Partner in Indonesia, ready to help you design, implement, and optimize your Zabbix monitoring solution to fit your specific needs.
No matter what business you’re in, there is one universal truth – your success or failure depends on customer satisfaction and trust. And when your IT systems fail, it’s your customers who pay the price. Being unable to place an order due to unexpected downtime (which can cost a large organization as much as $9,000 per minute) or having their credit card data compromised in a preventable security breach (which costs the average organization nearly $5 million) will force even your most loyal customers to go somewhere else.
Monitoring with Zabbix doesn’t just keep your infrastructure safe, it keeps your reputation safe and makes sure that your customers continue to be your customers. It does this by guaranteeing the performance, reliability, and security of your digital services – while also supporting better customer service and continuous improvement. Keep reading to see how it’s possible.
Table of Contents
Say goodbye to downtime
Your customers are looking to meet their needs quickly and effectively. Unexpected service disruptions cause them to feel neglected and force them to look elsewhere for solutions.
Monitoring your infrastructure with Zabbix can effectively eliminate downtime through proactive issue detection, which locates anomalies and performance issues like high CPU usage, packet loss, and latency in real time – before they have a chance to make life harder for customers.
If an issue does occur, Zabbix’s predictive alerting capabilities let your tech teams know about anything that could potentially impact an application or service, which lets them meet SLAs and provide a better, more reliable customer experience with fewer service disruptions, which in turns leads to higher levels of trust and satisfaction.
Outperform your competitors
No matter how good your products or services happen to be, you still need to provide smooth and fast online user experience if you want repeat use and positive reviews. Monitoring with Zabbix optimizes network traffic by helping you to identify bandwidth bottlenecks or misconfigured devices with a single glance at a dashboard, allowing better traffic management and a better online experience for customers.
It also improves response times, which allows you to be confident that your applications and services remain responsive. This is especially important for real-time services like video conferencing, e-commerce, or customer support.
Turn good customer service into outstanding customer service
What turns a casual, one-time user into a repeat customer? In most cases, it all comes down to making that user feel seen, informed, and supported. Zabbix helps you maintain consistent system performance, and nothing builds trust like stability.
With a bit of configuration and the help of IT service management tools like ServiceNow, Zabbix can provide clear, easy-to-access logs and metrics that help your customer service reps better understand your customers and the process of serving them, including:
• Customer satisfaction (CSAT)
• Preferred communication channel
• Average ticket count
• Average response time
• Average ticket resolution time
• Ticket resolution rate
• Ticket backlog
• Interactions per ticket
With this information, your team will be able to communicate proactively when issues happen, giving customers accurate information about the issue and the expected resolution time.
Keep your customers safe from cyber threats
The consequences of a data breach are deep and far-reaching, and they include financial losses, reputational damage, legal troubles, regulatory fines, and a loss of customer trust. Despite a greater emphasis on data security, hackers are constantly finding new ways to gain access to valuable corporate data and credentials by combining next-generation AI technologies with long-established tools.
Monitoring with Zabbix gives IT and security teams the visibility and early warning systems they need to spot and react to potential threats. Zabbix continuously monitors systems, networks, and applications for predefined thresholds and anomalies, identifying possible network intrusions or misconfigurations and notifying the relevant security stakeholders.
On top of that, Zabbix can monitor any existing security tools your team runs, tracking antivirus software, firewalls, IDS/IPS tools, and endpoint protection solutions to make sure they are functioning properly and running the latest versions. It can also integrate with SIEM systems (like Splunk, ELK, or Wazuh) as well as custom scripts in order to provide extended security analytics.
Meet (and exceed) your SLAs
Service Level Agreements (SLAs) are a framework for managing the expectations of both customers and businesses. They define agreed-on standards of service, but tracking them is more than just a way to measure compliance – it’s a tool that you can use to improve your overall service delivery and operations.
With Zabbix, you can monitor any quantifiable metric that’s relevant to your SLAs, such as system uptime/downtime, response time, the availability of web services, databases, or network devices, transaction success and failure rates, and much more. In addition, Zabbix can use real-time data and built-in SLA calculation to automatically calculate current SLA compliance and send an alert if an SLA is at risk of being breached, by using triggers based on thresholds.
If you’d rather track the metrics on your own, no problem – by using Zabbix dashboards, you can visualize SLA compliance in real-time, with the dashboards showing availability percentages, event timelines, and breach summaries, while giving you easy-to-understand views of service health. The result is better products and services that are aligned with customer expectations.
Build a continuous improvement culture
When it’s time to roll out a new feature or upgrade, you naturally want to have ALL the necessary data at your fingertips. Monitoring usage patterns and performance metrics with Zabbix not only gives you advanced visualizations (forecasting, capacity planning insights, etc.) but can also highlight cases where data analysis led to tangible improvements.
Want more input from customers and users? Zabbix can make sure that the improvements to your product are community-driven by giving you the data you need to run regular user surveys and forums to gather product feedback. It can even help you publish a public roadmap with transparent prioritization based on community input.
Conclusion
Customer satisfaction is about a lot more than just good service – it’s also about consistency, reliability, and transparency. Zabbix empowers businesses to deliver all three by providing a comprehensive, proactive, and scalable monitoring solution.
That’s why customers in verticals as diverse as aerospace and education turn to Zabbix to keep them informed about what’s working – and what isn’t. By integrating Zabbix into your IT operations, you’re not just improving system performance – you’re actively investing in customer satisfaction and loyalty.
Find out more about what Zabbix can do for you and your customers by taking a look at real-world case studies from companies like yours.
At the recent Zabbix Summit community meeting, participants gathered to discuss an exciting initiative – the creation of the first-ever community-driven Zabbix book. While several books about Zabbix have been published in the past (often written by individual authors over a decade ago), this project marks a new milestone. For the first time, Zabbix community members from around the world are coming together to co-author a book, share their expertise, and tell the Zabbix story from many perspectives.
What is the Zabbix Book?
The project, hosted at thezabbixbook.com, is an open, collaborative effort led by Nathan Liefting and Patrik Uytterhoeven from Opensource ICT Solutions B.V. The goal is to create a community-built guide to Zabbix, written by users, for users. As Zabbix trainers, Patrik and Nathan have both been long-time (don’t want to say old) contributors to the Zabbix community, authoring multiple books and blog posts.
The Zabbix Book will cover topics ranging from cloud templates and infrastructure monitoring to host triggers, Zabbix internals, SNMP, low-level discovery, multi-factor authentication, and much more. Each contributor can choose a specific chapter or topic that matches their expertise, making it a truly collective and flexible effort.
The content is managed on GitHub, written in Markdown, and follows open contribution principles. The aim is to complete the main foundation of the book alongside the release of Zabbix 8.0 LTS (expected in 2026, Q1/Q2), with an update to include new 8.0 features approximately a month later.
Why write a Zabbix Book when documentation exists?
While the official Zabbix documentation remains the primary source for technical accuracy, the Zabbix Book serves as an alternative and more narrative approach to learning, created by everyday Zabbix users. It’s designed to introduce new users to Zabbix through practical examples, real-world use cases, and community wisdom – making it easier for newcomers to connect the dots.
How the community works together
During the Summit breakout session, the group discussed:
• The current project status and foundational setup
• How contributions are managed — commits, rules, and legal aspects
• Missing topics and a call for more writers, editors, and translators
• Ideas for practical information and real-world examples (like JMX, SNMP, etc.)
• Donations and funding goals, including ideas for supporting open-source projects, good causes, or new Zabbix community features
The project embraces an open, democratic spirit – anyone can contribute, vote, or help improve the book’s structure, content, and readability. The Zabbix Book is created by the Monitoring Penmasters Foundation, which was created in order to make it a real community project – all the intellectual rights belong to the foundation itself, and when revenue is created there will be a vote on where to donate the money.
Currently, the Monitoring Penmasters foundation consists of Patrik, Nathan, and Zabbix CEO and Founder Alexei Vladishev, who is involved in the book’s review and has agreed to contribute to some parts of the book while allocating design resources from Zabbix itself.
The project has also gotten a big assist from Brian van Baekel of Opensource ICT Solutions, a dedicated community member and certified Zabbix trainer who has given his fair share of presentations and written extensively about Zabbix and its capabilities.
Get involved
If you’d like to contribute, share your expertise, or simply follow the book’s progress, visit thezabbixbook.com to explore the current chapters and learn how to join the project. The project’s digital chapters are available to everyone, and while the writing and printing are still in progress, we hope to see finalized online and printed versions in spring 2026.
It’s also worth remembering that even though the book is free to download and use, the creators do have costs and financial contributions are welcome – you can chip in here.
Together, we’re not just writing a book — we’re writing a piece of Zabbix community history!
Lab9 Pro is the B2B division of Lab9, Belgium’s leading Apple Premium Partner. With over 30 years of experience, Lab9 Pro specializes in integrating and supporting Apple systems within businesses, educational institutions, and public organizations. Beyond Apple expertise, Lab9 Pro also designs, implements, and maintains complete IT infrastructures, including networks, servers, storage, and security solutions.
The challenge
It’s impossible to manage devices at organizations without the use of a good MDM (Mobile Device Management) system such as Jamf. As the leading provider of Apple device management solutions, Jamf empowers organizations to deploy, manage, and secure Apple devices at scale.
Even in smaller organizations Jamf is the right solution, as small and medium-sized enterprises (SMEs) often lack the resources to manage their MDM systems. Offering an MSP model solves a lot of problems for these customers.
For Apple device management, the typical customer has a few certificates issued by Apple, which require approval of the user agreement by the Apple business or school manager. Without getting too technical about Apple Device management, depending on the customer the certificates need to be renewed on different dates. If the user agreement is not approved, automated device enrollment will stop working.
Lab9 Pro found themselves needing to check all certificates and user agreements for MSP customers manually, which involved an unacceptably high error rate that often caused discontinuity of the MDM system.
The solution
Lab9 Pro were already using Zabbix to monitor customer environments and their own infrastructure, including storage, firewalls, switches, and more. Because Zabbix offers a wide variety of options that make it possible to monitor almost anything, it was only logical to explore whether Zabbix could also be used to monitor the MDM certificates.
The research phase
Step one was to check the availability of certificate information. Unfortunately, Apple Business Manager’s API did not help much, as it does not provide certificate details. Instead, the team at Lab9 Pro investigated the Jamf API.
Although it doesn’t directly return certificate information either, they found something even more useful – Jamf’s API provides customer instance notifications. These include alerts when certificates (VPP, PUSH, DEP, etc.) are about to expire (typically 10 days in advance) as well as when the Device Enrollment Program (user agreement) is not approved.
Zabbix implementation
Since Lab9 Pro manages multiple MSP tenants, they created a dedicated Zabbix template. This template includes both pre-filled and empty macros:
Pre-filled macros:
• {$JAMF.AUTH.INTERVAL}: Interval for retrieving the bearer token
• {$JAMF.NOTIF.INTERVAL}: Interval for retrieving Jamf notifications
• {$JAMF.PATH.AUTH}: API path for retrieving the bearer token
• {$JAMF.PATH.NOTIFICATIONS}: API path for retrieving Jamf notifications
Empty macros:
• {$JAMF.URL}: Jamf URL
• {$JAMF.API.USER}: Jamf user account for authentication
• {$JAMF.API.PASSWORD}: Jamf password (stored as a secret value)
The team configured an item to perform an API call to retrieve the bearer token. A preprocessing rule in JavaScript stores this token in a variable. Discovery rules proved very useful for executing API calls to retrieve Jamf notifications using the bearer token. This was achieved by configuring preprocessing steps and Low-Level Discovery (LLD) macros to pass the Jamf URL and bearer token. Trigger prototypes for each certificate were also added within the same discovery rule.
The results
Whenever a certificate is nearing expiration, a problem is automatically displayed on Lab9 Pro’s Zabbix dashboard, which is visible on TV screens placed throughout their office in order to make sure the entire team is aware of upcoming certificate renewals.
Since Lab9 Pro began monitoring MDM certificates through the Jamf API, they have experienced zero expired certificates, which in turn has allowed them to avoid situations where devices become unmanaged and require a full setup again.
Zabbix makes it possible for Lab9 Pro to keep their clients’ MDM systems operational, while allowing them to either proactively inform them when certificates need to be renewed or handle the renewal process on their behalf.
Zabbix Summit 2025 is officially in the history books, so now is the perfect time for a casual, behind‑the‑scenes run‑through of what went down. If you were there, this should ring a few bells (or spark some “oh hey, I forgot about that” moments). If you couldn’t make it, consider this your own personal highlight reel!
Featuring approximately 550 attendees from 42 countries, the Summit took place from October 8-10 at the Radisson Blu Hotel Latvija in the heart of downtown Riga. The 13th in-person version of our premier yearly event was in many ways our biggest and boldest yet, and it included keynote sessions, two parallel tracks (including a developer track), workshops, hands-on sessions, training and certification exams, and a variety of evening social and networking events.
Open source, open house
On October 8, we welcomed nearly 100 guests to our brand-new headquarters for Zabbix Summit 2025’s Open House Day. The new facility gave us plenty of space to host everyone, and visitors got to explore our new HQ, take part in a fun quiz with Zabbix facts, and catch up with longtime colleagues while meeting new ones from the community and the Zabbix team.
Day 1: Looking ahead
The Summit officially kicked off with Zabbix Founder and CEO Alexei Vladishev’s keynote address, entitled “Zabbix 8.0: A New Chapter in Monitoring.” The address laid out in detail what’s around the corner for Zabbix, including:
Zabbix Academy – a new learning hub with self-paced, expert-built courses to boost Zabbix skills anytime and from anywhere.
Zabbix France – Zabbix is acquiring IZI-IT and opening a new office in France to provide localized support and closer collaboration with French clients and partners.
Zabbix Cloud – a host of new features, including automatic upgrades and backups, plus predictable pricing and simplified user management.
Zabbix 8.0 LTS (coming in 2026) – a major leap forward with APM and OpenTelemetry for end-to-end visibility, Complex Event Processing (CEP) and AI-based correlation, plus new UI & visualizations for a smoother experience.
Zabbix Mobile App – coming with 8.0 LTS for iOS & Android, the app will offer instant push notifications, issue management, collaboration, seamless connection with Zabbix Cloud, and multi-server views in your pocket.
Zabbix Marketplace (2026) – A new global space to connect Zabbix users with vendor and partner solutions, Zabbix Marketplace will extend the power of Zabbix beyond our core product.
Next up was initMAX Founder and CEO Tomáš Heřmánek, who showed how to turn physical sensor data from analog inputs into Zabbix metrics with budget hardware and integrations, complete with templates and triggers.
Another crowd-pleasing session reached the audience thanks to Richard Germanus of CANCOM, who shared the story of how CANCOM consolidated six monitoring systems into one, managing approximately 30,000 hosts, deploying 162 Zabbix proxies, standardizing templates, integrating Power BI for dashboards, automating with APIs, and offering monitoring-as-a-service.
Shortly thereafter, a lightning talk by SEB Bank’s Giedrius Stasiulionis explored “Monitoring Sounds with Zabbix” – in other words, converting audio and sound waves into meaningful metrics, a fresh and inventive notion.
The day’s other lightning talk, “Monitor Your Nearby Areas and Events with Zabbix” by longtime Summit fixture and Zabbix superfan Janne Pikkarainen, showed how anyone can use Zabbix to centralize event data like train timetables, traffic patterns, or cinema showtimes.
Developer track: Something for everyone
Meanwhile, the Summit Developer track was full of special sessions for builders and extension authors, such as “Extend Zabbix Agent 2 with Your Plugin”, which saw Senior Golang Developer Eriks Sneiders show an appreciative audience how Zabbix agent 2’s plugin architecture works, how to use existing plugins, and how to build brand-new custom ones.
Other topics in the Developer track included template design, advanced scripting, API tips, and internal tooling, giving Zabbix techies some food for thought and hopefully sparking a batch of fresh ideas!
Day 2: Showing the big picture
After a long first day and night, Zabbix Summit 2025’s special guest Dylan Beattie made some noise and woke everyone up with a talk entitled “Open Source, Open Mind: The Cost of Free Software.”
Dylan took the Summit audience on a journey through the history and philosophy of free and open source software, touching on questions about licensing issues, looking at the motivations of developers, discussing edge cases and challenges, and asking whether truly sustainable open-source ecosystems can exist.
Later, Inqbeo Founder Christian Anton shared a system in which a central Zabbix instance serves multiple tenants, with the architecture leveraging Kafka to stream metric data partitioned per tenant, storing results in S3 (in Prometheus format), and visualizing via Grafana. This enables isolation and the creation of custom dashboards.
Other main-stage sessions tackled topics like scaling Zabbix, managing large datasets, tag and template strategies, and AI/automation in monitoring.
Connecting people with the Community track
Zabbix Summit 2025 also introduced a Community track, a dedicated space at Zabbix where users, enthusiasts, and contributors could share ideas and shape the future of Zabbix. Instead of deeply technical or development-level presentations, this track focused on community-driven topics like integrations, templates, connectors, media types, and open resources.
A key highlight was the “Zabbix Book Breakout Room”, led by Alexei Vladishev himself along with longtime community members Patrik Uytterhoeven, Brian van Baekel, and Nathan Liefting. Zabbix users were able to brainstorm ideas for new chapters, missing topics, translations, and community contributions to the online Zabbix Book.
Turning ideas into action
Day 2 was also full of hands-on workshops, including a fascinating one from the team at initMAX that was based on their day 1 presentation. Participants got kits with an ESP32 board, a camera, a 3D-printed counter mount, and a few other odds and ends. They were then guided step-by-step as they integrated the device into Zabbix, built monitoring scenarios, and used AI models to interpret camera images.
One of the things that makes the Zabbix Summit experience so special is the depth of the networking experience – there’s no awkward small talk or simple business card exchanges here, but rather a series of real connections made, deals closed, and new partnerships cemented.
Accordingly, a lot of the magic at Zabbix Summit 2025 happened after hours, with everyone gathering at Riga’s famed Monkey Club for the Summit Welcome Event on October 8 to enjoy a lively atmosphere, a wide selection of cocktails, and plenty of opportunities to connect with fellow monitoring and observability enthusiasts.
October 9’s Main Event took place in the Tallinn Quarter Angārs, which blended concert hall energy with an open-plan street food kitchen and bar that gave everyone plenty of room to mingle.
A special treat was provided in the form of an original Zabbix-related song by Zabbix PHP Developer and part-time rock star Vladimirs Maksimovs, which got the entire crowd on its feet and set the tone for an unforgettable evening.
In what has become a bit of a tradition within a tradition, the Summit officially wrapped up on October 10 at Riga’s Burzma Food Hall, with its relaxed atmosphere, multiple cuisines, and communal tables. It’s proven to be the perfect place for reflecting on Summit highlights, swapping contact info, or plotting collaborations.
Thank you to our sponsors!
We want to extend our heartfelt thanks to all the sponsors of Zabbix Summit 2025, whose commitment not only helped us bring everyone together under one roof but also contributed to the growth of both Zabbix and the entire global monitoring ecosystem. We value your partnership and look forward to working with you for many years to come!
Thanks again to our sponsors and everyone else who helped make Zabbix Summit 2025 possible!
In case you couldn’t make it…
If you didn’t manage to make the trip, you can still enjoy the Summit atmosphere in the privacy of your own home! Recordings of both days are available on Zabbix’s YouTube channel:
The slides and texts of the presentations are also available here.
And that’s a wrap on Zabbix Summit 2025! From mind-blowing tech talks to caffeinated hallway chats and everything in between, this year’s Summit experience delivered. Whether you came for the deep dives or just the cool merch (no shame in that), we hope you went away inspired, connected, and maybe just a little more obsessed with monitoring and observability than before. See you in 2026!
If you are running Zabbix, you know that it can be a tedious job to add hosts, link templates, and (even harder) make sure it is consistent with your CMDB. What if you already have a CMDB? In that case, it means you need to synchronize the CMDB with Zabbix…manually? Of course not!
Before we continue – this blog post and plugin both belong to Opensource ICT Solutions. We specialize in Zabbix (it’s our core business!) and as such try to make a living out of this open-source product. The plugin we will discuss is open source, and as such we do not have a commercial benefit from it – it’s brought to you by us, as a way to give back to the community (and maybe score some consultancy opportunities).
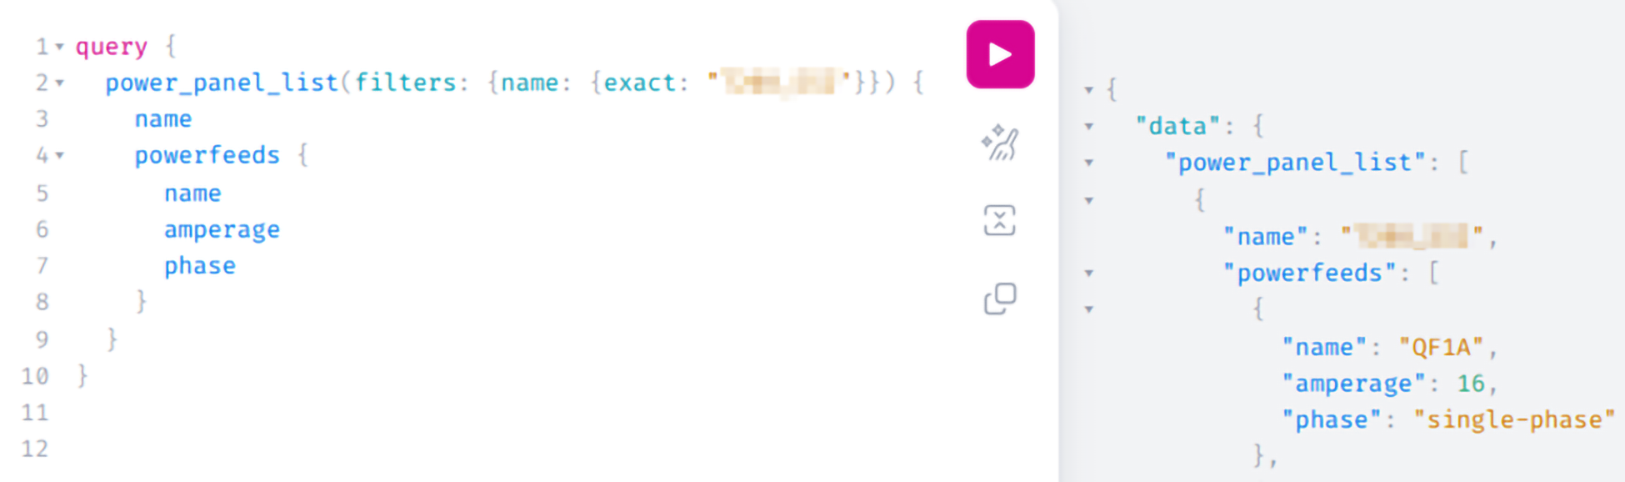
If you are familiar with NetBox already, it’s time to get excited. If you are not familiar with it, NetBox provides a powerful “single source of truth” for managing everything in your network: IP address management (IPAM), data center infrastructure management (DCIM), device inventory, rack layouts, cabling, virtual assets, and more. It’s built under the Apache 2.0 license, so the core software is fully open source, with an active community contributing plugins, integrations, and custom extensions. The platform is highly flexible – you can add custom fields, enforce custom validation and protection rules, integrate via REST and GraphQL APIs, and run multiple automations.
How cool would it be if you could use that in combination with Zabbix, so that if you create a new entity in your CMDB (your single source of truth) and sync that with Zabbix, you could just focus on one product and always can be assured your monitoring is complete?
What are we solving?
Many of our customers use NetBox as their CMDB and Zabbix as their monitoring solution. The challenge they run into is keeping NetBox and Zabbix in sync — a task engineers don’t usually enjoy.
For customers who don’t use a CMDB (or at least not NetBox), there’s always the uncertainty of whether a host in Zabbix has the right templates and macros applied. While Zabbix does allow bulk updates, you still need detailed knowledge of each device’s role to keep things consistent.
NetBox, on the other hand, already stores much richer context about configuration items. A device or virtual machine can have a role, device type, tenant, and even its site or location defined. All that’s missing is a way to leverage this information to make sure those devices are monitored correctly in Zabbix.
On top of that, this approach makes it simple – if a device is registered in the CMDB (and therefore something you’re responsible for), it’s also monitored in the right way. From a project delivery perspective, documentation only needs to be done once, and it ensures that it’s actually done. In short: if it’s not in the CMDB, it’s not monitored — and therefore not our responsibility.
It also means the project delivery engineer(s) don’t necessarily need to know in depth how Zabbix works: as long as they can populate the CMDB – the monitoring will be taken care of automatically.
What did we develop?
In short, a native plugin for NetBox that communicates with the Zabbix API. From there, it will gather information like templates and macros that exist in your Zabbix environment. This is completely API based, so in NetBox you just add an new Zabbix Server and let it synchronize:
Screenshot about a new Zabbix server in NetBox
At this point, nothing fancy happens. It is just establishing the connection and synchronizing templates, macros, etc. The rest of the configuration is done in your NetBox instance.
How does it look?
We’ve got the normal/native menu list items from NetBox, and for those familiar with it already the list below shows nothing new except for the “Zabbix” option:
Organization – Define sites, locations, and tenants to structure your infrastructure
Racks – Manage physical racks and their layout in data centers
Devices – Inventory of physical and virtual devices like servers, routers, and switches
Connections – Model physical cabling and logical connections between devices
Wireless – Manage wireless LANs, SSIDs, and related equipment
IPAM – IP Address Management: subnets, prefixes, IPs, and VRFs
VPN – Configure tunnels, peers, and VPN terminations
Virtualization – Track clusters, virtual machines, and virtual interfaces
Circuits – Manage provider circuits, WAN links, and related contracts
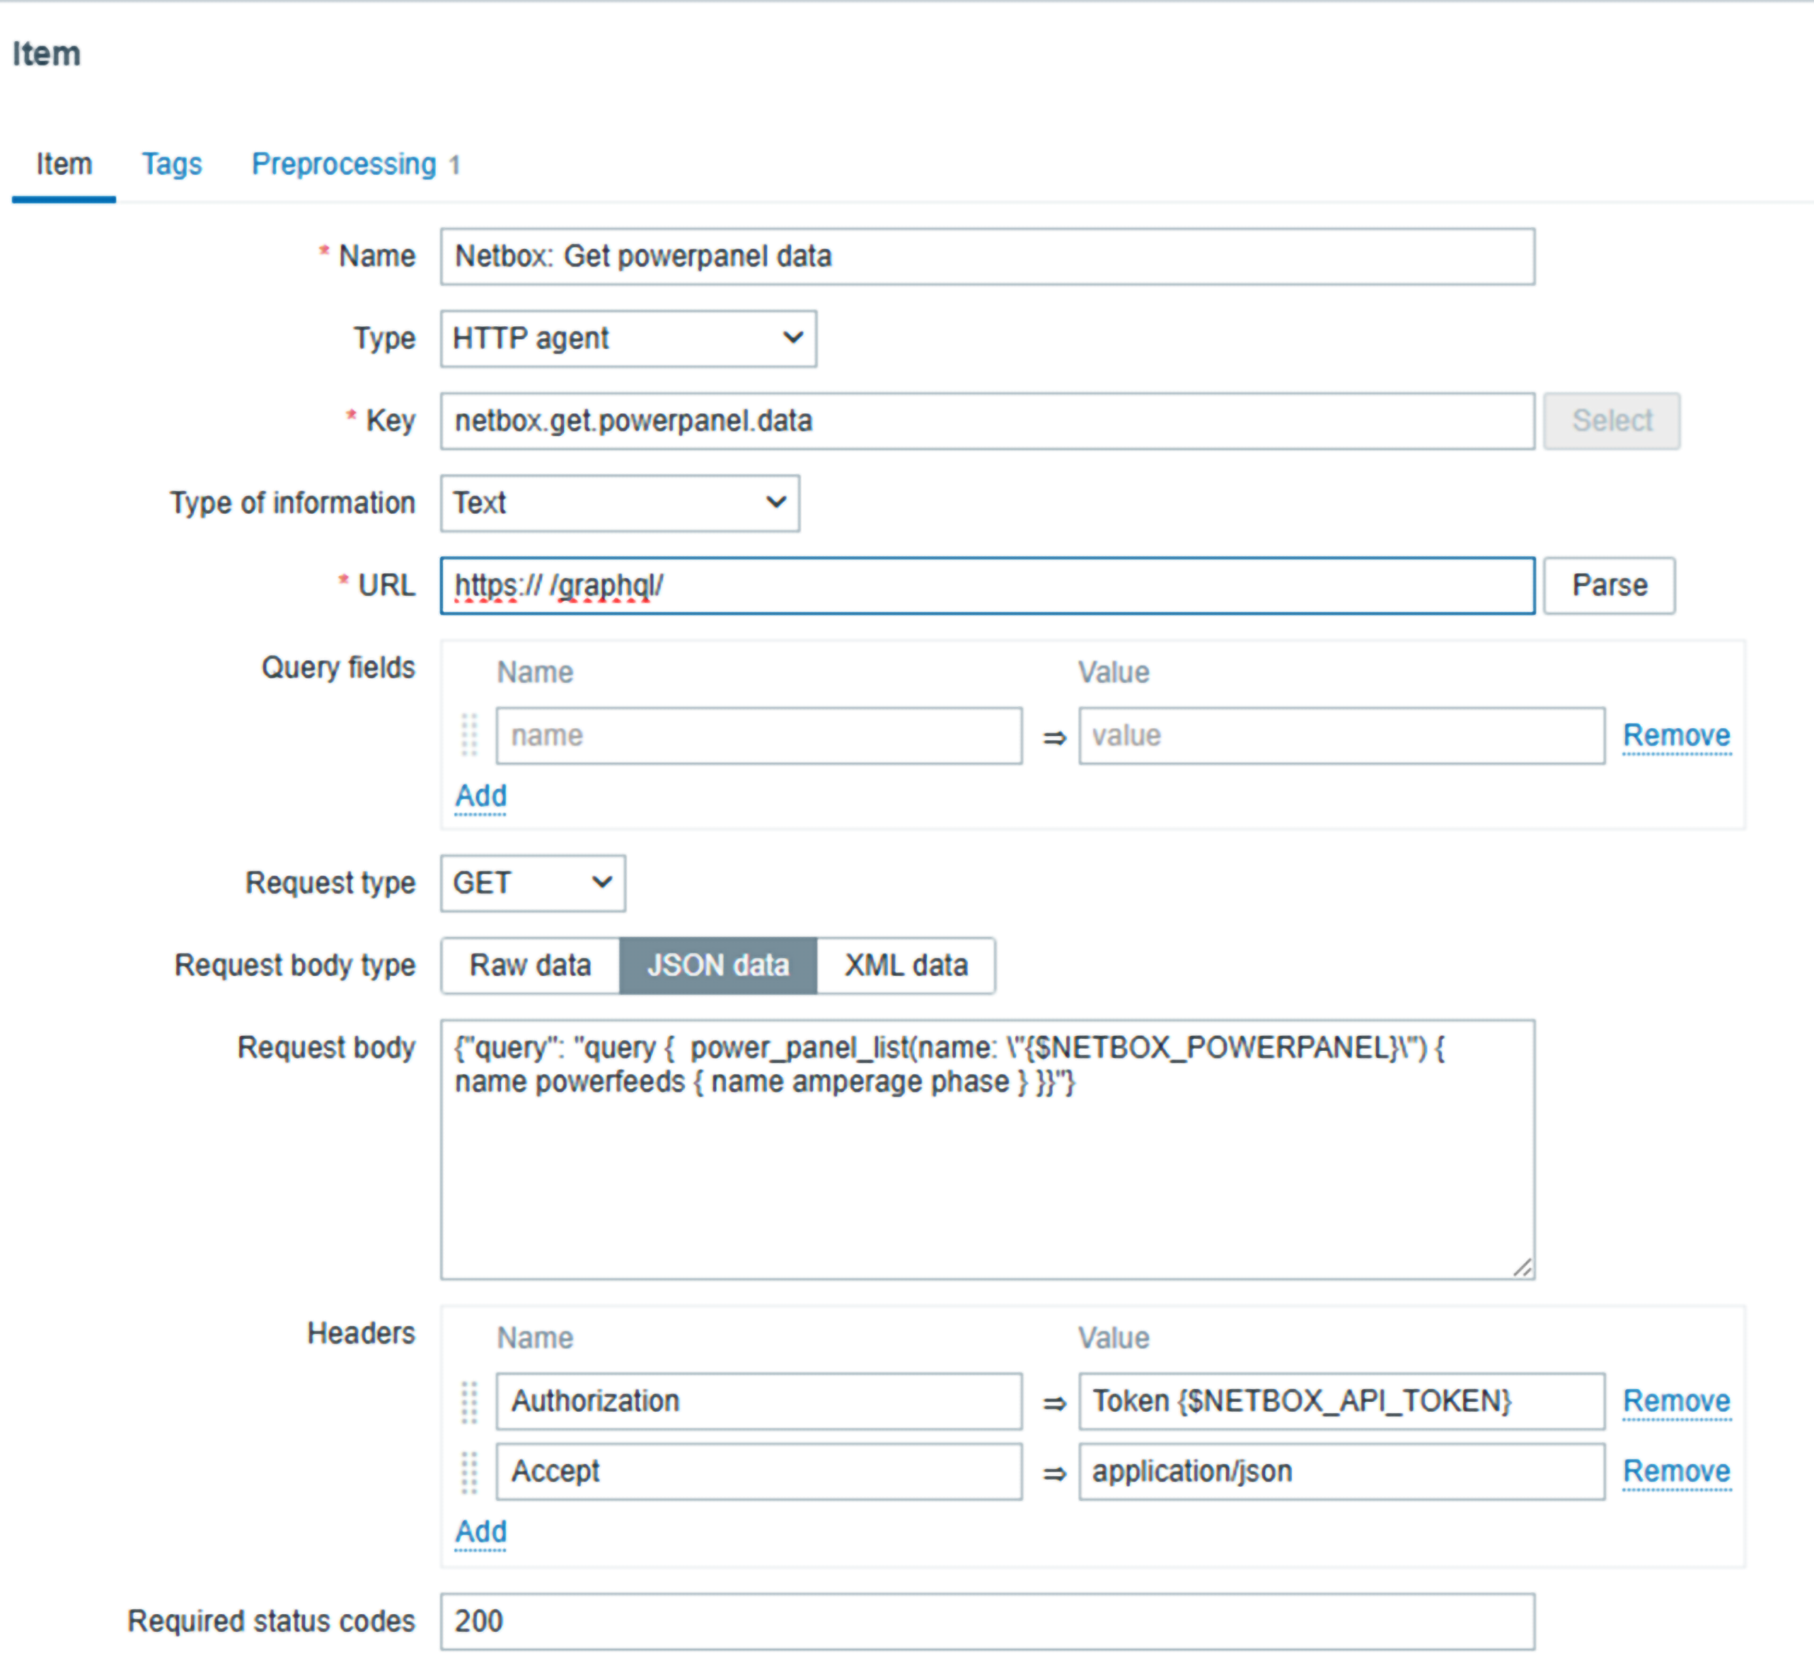
Power – Define power feeds, panels, and outlet connections.
Provisioning – Support for building and automating device/service onboarding
Customization – Extend NetBox with custom fields, rules, and UI tweaks
Operations – Tools for workflows, jobs, and operational tasks
Admin – Administrative settings for users, groups, and global configuration
The Zabbix menu is new here and actually gives us control over what is present in Zabbix. The objects here should look familiar if you know Zabbix:
Servers
Proxies
Proxy Groups
Templates
Macros
Tags
Hostgroups
Maintenance
NetBox menu including Zabbix plugin
In the various NetBox native objects, there will be information regarding the Zabbix setup.
Is it available already?
Of course it is, otherwise this blog post would’ve been completely useless! Installation can be done via https://pypi.org/project/nbxsync.
We released our NetBox plugin under the GNU Affero General Public License v3 (AGPL-3.0) because it best protects both our work and the community. Unlike permissive licenses, AGPL ensures that anyone who modifies or extends the plugin must share their changes under the same license, even if the software is only offered as a service. This prevents closed forks, guarantees improvements flow back into the community, and aligns with the collaborative spirit of NetBox and Zabbix.
While AGPL still allows use in commercial environments, it prevents organizations from profiting off private modifications without contributing back. In short, AGPL-3.0 keeps the plugin fair, transparent, and truly open source. This is also the license Zabbix uses, so the community is already familiar with it.
We think documentation is important, as we’ve often been in a situation where we had to discover ourselves how something works due to lack of documentation. We really try to keep you out of that situation and therefor created extensive documentation for this project. Obviously, we can help you when you are lost, but as that costs us time as well it won’t be a free service. The documentation is available here: https://nbxsync.com.
As we think it’s great to work on a project together, we welcome community contributions. However, in order to accept any pull requests, please create an issue on our Github repo first. Please do read our development guidelines and understand that we are more than happy to incorporate suggestions/pull requests if they benefit the wider community.
As it’s a native plugin, the installation is straightforward and well documented by NetBox: https://netboxlabs.com/docs/netbox/plugins/installation/. In our documentation, we provide the plugin-specific configuration. If this feels daunting, we’re more than happy to assist you with it as part of our consultancy offering.
So, with NetBox in place and the plugin installed, let’s actually walk through the NetBox configuration to give you a feeling of how it works. We will have to configure quite a bit in NetBox as a foundation, which hopefully is done already if you’ve got NetBox implemented in your organization.
In any case, we need to add one or multiple new Zabbix servers. We open the Zabbix menu and click on “Servers” where we add this server:
NetBox Zabbix Server configuration
Once added, NetBox will automatically synchronize with the Zabbix server and get the templates out of it, ready to be used! The macros will also get synchronized along with the templates,, so they are also available in NetBox.
NetBox dictates that devices should be in a site, so we start with that. In Organization → Sites we create a new site. A few fields are mandatory and populated in the screenshot below:
NetBox Sites Configuration
Name, Slug, and Status are mandatory. In a production setup, you probably want to populate some other fields as well, such as Tenant, Region, etc. But we are not writing a NetBox tutorial and as such we will completely ignore that. Once you are done, click on “Create” at the bottom of the configuration.
After the site has been created, it is time to add a Manufacturer under the menu “Devices.”
Once done, click on “Create” at the bottom of the configuration. Of course you can (or should) add multiple vendors – all that you actually use!
The next step is device type. In the end, we need to know the vendor, but it is equally important to know what type of device we are monitoring. As such, the next step is to add a device type, again under the main menu “Devices.” As we add in the example, we are going to add a CBS220 switch:
NetBox device type configuration
Once again, click on “create” when you are done.
Last but not least, we need to add a device role. The device role is an important attribute because it helps us clearly define the function of the device within the network. By categorizing devices based on their role (such as router, switch, firewall, server, or access point) we create a structured overview that makes it much easier to manage, monitor, and troubleshoot the environment. Assigning roles also ensures consistency, improves documentation quality, and allows us to quickly identify the purpose of each device in larger infrastructures.
We go to “Devices” → Device roles and from there:
NetBox Device Role
Now we can finally add the device itself! This is what it all is about – the work we’ve done before is really just laying the foundation for this moment. We add a device which will eventually become a Host in Zabbix, with all related properties pushed from NetBox its configuration.
So we navigate to Devices → Devices and from there add it:
NetBox Device configuration (truncated some fields)
After we save the device by clicking “Create,” NetBox immediately takes us to the newly created device’s detail page. Here we can see an overview of all the information we have just entered, such as the device name, role, site, rack position, and other attributes. This page acts as the central point for managing and extending the device configuration.
From here, we can add interfaces, assign IP addresses, connect cables, or link the device to virtual resources. In other words, once created the device record becomes the foundation for documenting its place and function in the network.
NetBox device overview with Zabbix options
In this screenshot, we can see already that there is a new tab “Zabbix” (just under the device name) and we’ve also got a new button “Sync Zabbix.”
In the tab “Zabbix” we should assign this device to a Zabbix server, as by default it will not get assigned to any. You might think this is a bit strange, especially if you’ve got one Zabbix server. However, the mindset during development is that NetBox typically is used by MSPs, which have multiple Zabbix servers and even might have the need to assign multiple Zabbix servers to this device for operational reasons.
We open the tab “Zabbix” and click on “Add” next to the Zabbix Servers. A new configuration page opens and we select the server we just added:
NetBox Zabbix server assignment
When you click on “create” the server is assigned. We can of course add an template to it, but as we know the vendor and type already, there should be some inheritance!
Let’s go back to Device → Manufacturers and click on the vendor(Cisco) we just added. Click on the name and you will see that this object also got a new “Zabbix” tab. In this tab you can configure that for this vendor, always these templates, hostgroups, tags and macros should be used. Here we will just add the template to this vendor, to show inheritance:
Netbox template inheritance
Once you’ve clicked on Create, navigate back to the device we made and observe how the template is inherited. As Zabbix also requires a host group and an interface, we are going to configure that now.
We will start with the host group, so click on Zabbix -> Hostgroups. There we create a new one as per the screenshot below. There is something strange with our configuration, as we use Jinja2 templates instead of static names.
The object name is “Device site” but the actual value will resolve to the site name we created (OICTS HQ) earlier. The power here lies in the variables – if we create a new device for another site and link this hostgroup, it will automatically resolve to the correct site name with no need for static configurations anymore!
Of course, the host group should be assigned to a Zabbix server again:
NetBox Zabbix hostgroups
The next step is to create a Zabbix host interface, which is essential for monitoring and communication between Zabbix and the device. To do this, we leverage the IPAM (IP Address Management) functionality within NetBox.
IPAM provides a structured way to manage and allocate addresses across the network, ensuring consistency and avoiding conflicts. In this case, we navigate to IPAM → IP Addresses and add a new IP address that will serve as the management interface for the device. This IP address will later be linked to the Zabbix host configuration, allowing monitoring data to flow seamlessly.
NetBox IPAM config – IP address
If we now go back to Devices -> the device we want to configure → tab “Zabbix” we should add an Host interface and Host group. Click on Add for the respective config and populate the minimum fields. For the Host interfaces that looks like this:
NetBox Zabbix host Interface
For the host group, there are fewer fields to fill in compared to other objects. All you need to do is select the appropriate group from the available options. This keeps the process straightforward and avoids unnecessary configuration.
Once saved, the host group will be correctly linked and ready for use in Zabbix:
NetBox Zabbix hostgroups
So the final result looks like this. At this point, all of the required elements have been configured in NetBox and properly linked to the Zabbix environment. The device now has its host group, host interface, and templates assigned, giving us a complete picture of how it will appear in monitoring.
What we see here is essentially the end-to-end outcome of the earlier configuration steps, where NetBox acts as the single source of truth and Zabbix automatically inherits the correct setup.
NetBox Zabbix device overview
Now it’s time to actually synchronize the device with Zabbix. At the top of the device detail page, right next to the device name, there is a button labeled “Sync Zabbix.” By clicking this button, NetBox will push all the information we’ve configured—such as interfaces, templates, and host groups—directly into Zabbix.
Within a few seconds, the host is created and fully ready for monitoring, without any manual setup inside Zabbix. With the heavy lifting automated, you can sit back and relax knowing that the device has been synchronized correctly.
Actually, let’s head over to Zabbix and confirm the synchronization:
Zabbix host overview from NetBox
Brilliant! The host is there, the template is linked, the host group automatically was set to “OICTS HQ” and the interface also looks correct. Monitoring will start and we did not touch Zabbix itself!
Want to see it in action?
Can do! We’ve created a YouTube video for you to actually see how it works. On top of that, we plan to host webinars regarding this plugin as well. You can register for all our webinars for free via the Zabbix website.
Is this it?
No! Actually there is a lot more we can do with this NetBox plugin, but it’s just that this blog post is not the correct place to show it all. Just to give you an idea, we can set maintenance from NetBox, which automatically will sync it to Zabbix. This way we again have a single source of truth and make sure we can see from a helicopter view where the impact is.
Furthermore, automatic synchronization can be set up so that any changes in Zabbix are overridden by the NetBox configuration. This way, we make sure there is no drift between NetBox and Zabbix. It also guarantees that if engineers forget to manually synchronize, no harm is done. However, the manual sync button will always be there, as nobody wants to wait to fix the monitoring when changes are made!
In addition, the plugin fully supports proxies and proxy groups – just as you know them from Zabbix. We’ve just haven’t shown it here to keep it somewhat short.
Roadmap
Although this project is just a side gig (we still dedicate our resources to Zabbix) we of course have a vision and roadmap that we would like to chase.
One major feature that’s on the roadmap is to show host problems in NetBox. By retrieving the current problems for a given host and showing them in NetBox, we should be able to limit the time spent in Zabbix even further. Our goal is to realize a “Single Pane of Glass” (just as NetBox is the “Single Source of Truth.”
Banco do Estado do Pará (Banpará) is the main public financial institution in the Brazilian state of Pará. It is a mixed-capital company, organized as a multiple bank with the mission of generating value for the state of Pará. It currently has approximately 198 physical customer service units and is present in all 144 municipalities in the state.
The challenge
Until 2016, Banpará used a monitoring environment installed on a single physical server. This environment was centralized, not very scalable, and vulnerable due to the lack of updates to recent versions of the software used. Centralization created a critical dependency – if there was a server failure, the entire monitoring system would be compromised.
There was no integration with the tool that orchestrates the company’s routine activities (which also generated an alert and a need for proper support of the bank’s infrastructure) and there was also the issue of including the routines of the internal demand generation tool in the monitoring panel, which was done manually.
With each new routine created, it was necessary to open calls with the technical teams for inclusion in the monitoring plan, which were then entered into a list of tasks. This process, in addition to being time-consuming, was subject to human error and delays, which compromised real-time visibility of critical operations.
The lack of proactive and integrated monitoring in Banpará’s structure resulted in operational gaps that created real risks to the continuous functioning of banking operations.
The solution
Given the challenges posed, the project developed with Zabbix had as its main objective to recreate the monitoring environment in a virtualized, scalable and resilient way, without dependence on a physical server. From rebuilding the infrastructure to integrating it with critical banking systems, the primary requirements included the following:
Integration with existing systems
Intelligent data processing and analysis
Reduction of manual processes and operational dependency
Development of customized solutions
Reorganization of the technological infrastructure
After implementing and structuring Zabbix at the bank (with the help of Master Support, an official Zabbix Certified Partner in Brazil), the structure became modular, scalable, and resilient, aligned with best practices, and able to expand monitoring without compromising system performance as the bank integrated new routines and services.
The results
The modernization of monitoring environment with Zabbix brought immediate benefits for Banpará’s IT monitoring scenario, especially with regard to operational efficiency, reliability and process automation:
More than 2,000 monitored devices
Around 100,000 metrics collected
More than 26,000 active alerts in Zabbix
Automated coverage of around 2,300 routines
An estimated gain of 2,300 operational hours
The adoption of Zabbix as a monitoring tool at Banpará was a practical response to the need to modernize the bank’s IT infrastructure. The project contributed to the elimination of manual processes, reduction of operational time, and increased visibility over critical routines. It also enabled the monitoring of a greater number of services, with greater agility in identifying failures and supporting decision-making.
In conclusion
With the current structure, Banpará now has a more integrated monitoring system, adjusted to operational demands and with the capacity to monitor the evolution of the bank’s activities in an organized and secure manner.
To learn more about what Zabbix can do for customers in banking and finance, visit our website.
Running a monitoring platform like Zabbix in a production environment demands reliability and resilience. When your monitoring solution is down, you’re flying blind – and for many organizations, that simply isn’t acceptable. This post introduces a robust high-availability (HA) architecture for Zabbix, using PostgreSQL, Patroni, etcd, HAProxy, keepalived and PgBackRest. Built on RHEL 9 or derrivates, this solution combines modern open-source tools to provide automatic failover, load balancing, and seamless monitoring, all while maintaining consistency and performance.
Architecture overview
The HA design consists of multiple layers working in tandem to maintain continuity even during node or service failures:
Database Cluster Layer
2 or more nodes form the PostgreSQL cluster, managed by Patroni and coordinated using etcd. At any given time, one node is the primary (read/write), and the others are hot standbys ready to take over automatically.
Consensus layer
etcd runs on the same nodes and acts as the distributed configuration store and coordination layer for Patroni. It ensures a consistent cluster state and enables safe failover decisions.
Load balancing layer
Two HAProxy nodes provide a single point of entry for all clients (including Zabbix), routing requests to the current PostgreSQL primary. These nodes are monitored and coordinated via Keepalived to maintain a floating Virtual IP (VIP), ensuring seamless failover at the connection layer.
Backup layer
A separate backup server is responsible for running PgBackRest, which handles full and incremental backups, WAL archiving, and Point-In-Time Recovery (PITR). This server communicates securely with all database nodes over SSH.
Monitoring layer
Two Zabbix servers, running in active-passive mode, continuously monitor all layers of this stack including the HAProxy health, Patroni cluster role, and etcd status by accessing the PostgreSQL VIP for backend connectivity.
This multi-tiered setup ensures that no single failure be it a database, load balancer, or monitoring server brings down the monitoring platform.
Why HA matters for Zabbix
Zabbix depends heavily on its PostgreSQL database backend. Every metric, trigger, event, and alert is stored there. If PostgreSQL becomes unavailable, even briefly, data loss or monitoring blind spots can occur. That’s why introducing HA at the database layer is a crucial step when scaling Zabbix for enterprise environments.
While Zabbix itself supports HA at the application level, this architecture ensures that the database backend is also fully fault-tolerant, using modern consensus-based clustering with automatic failover.
Component overview
To achieve HA, we bring together several specialized components, each fulfilling a critical role in the system:
PostgreSQL
The relational database engine used by Zabbix. In this example setup, it runs on three nodes, forming a cluster managed by Patroni.
Patroni
Patroni is the orchestrator for the PostgreSQL cluster. It monitors node health, manages replication, promotes standbys when needed, and ensures only one writable leader exists at any time. Patroni leverages a distributed consensus store in this case, etcd but other DCS’s are possible to coordinate decisions across the cluster.
etcd
etcd is a lightweight and highly available key-value store used by Patroni to maintain the cluster’s state. It stores leader election data, health statuses, and locks. We deploy it as a three-node cluster, co-located with the PostgreSQL nodes for convenience, though this setup can be scaled independently if needed as etcd is very latency prone.
HAProxy
To simplify application connectivity, HAProxy acts as a load balancer in front of the database cluster. It monitors the role of each node using Patroni’s REST API and routes connections to the active primary server. If the leader fails, HAProxy automatically reroutes traffic to the new primary.
Keepalived
Keepalived provides a floating virtual IP address (VIP) across the HAProxy nodes. This VIP allows client systems, such as the Zabbix frontend, to connect to a single stable IP even if one HAProxy node fails.
PgBackRest
To protect the data itself, we use PgBackRest for full and incremental backups, as well as Point-In-Time Recovery (PITR). A dedicated backup server is included to pull and store archive logs and backups securely via SSH.
Zabbix server
Finally, we run two Zabbix servers in active-passive mode. Both are configured to connect to the PostgreSQL cluster through the VIP exposed by HAProxy. The Zabbix frontend is deployed on both nodes as well, ensuring continued accessibility through the load-balanced setup.
Topology at a glance
Here’s a simplified view of the architecture:
2 or more database nodes (PostgreSQL + Patroni + etcd)
Two HAProxy nodes, each configured with Keepalived to manage a floating virtual IP
One backup node for PgBackRest
Two Zabbix servers pointing to the PostgreSQL VIP
All systems are tied together with consistent hostname mappings, time synchronization (Chrony), and service monitoring.
Notes:
PgBackRest is directly connected to all three PostgreSQL nodes, allowing it to archive WAL segments and pull backups regardless of which node is primary.
This design enables full standby backups and supports Point-In-Time Recovery (PITR).
HAProxy ensures Zabbix always talks to the current primary node, while Patroni and etcd handle automatic failover and cluster state management.
Design rationale
This setup prioritizes resilience and self-healing. If any single component fails a database node, a load balancer, or even a monitoring server the system continues to function.
Using Patroni with etcd ensures that failovers are handled automatically, without human intervention. HAProxy ensures client traffic is always routed to the current primary, while Keepalived ensures that this routing layer itself is highly available.
We opted for PgBackRest over simple scripts or base backups because it provides not just efficient incremental backups, but also full WAL archiving and point-in-time recovery, which are invaluable for both disaster recovery and debugging.
Lastly, we chose to integrate Zabbix itself into this HA design, treating it not just as a application but as a fully resilient service able to monitor itself, so to speak.
Real-world considerations
Resource planning: While our nodes run comfortably, scaling this setup to heavy workloads requires careful tuning of memory, I/O, and PostgreSQL parameters.
etcd placement: Although we run etcd co-located with the database nodes in this example, separating etcd onto dedicated infrastructure is ideal for large-scale environments. This avoids resource contention and preserves quorum in extreme failure scenarios.
Monitoring the monitors: Zabbix itself must be monitored. In our setup, each component including etcd, Patroni, and PostgreSQL exposes health endpoints that can be used by Zabbix agents or scripts to generate alerts on replication lag, cluster health, and failover events.
Conclusion
This architecture provides a solid foundation for running Zabbix in a fault-tolerant, production-ready environment. It not only ensures high availability for the database layer but also offers flexibility, observability, and operational safety.
Whether you’re running internal infrastructure monitoring or offering Zabbix as a managed service, adopting this type of HA setup removes single points of failure and gives you peace of mind — all using open-source technologies that are battle-tested and widely supported.
If you need assistance with the migration or want to ensure best practices for scaling and optimizing Zabbix, don’t hesitate to reach out to OICTS. We are a Zabbix Premium Partner operating globally, with offices in the USA, UK, Netherlands, and Belgium, and we’re ready to help you every step of the way.
Can you imagine being able to schedule maintenance in Zabbix by simply telling a program: “I need to put the web server in maintenance tomorrow from 8 to 10 with ticket 100-178306”? That’s exactly what the Artificial Intelligence (AI) Scheduler Zabbix project I’ve developed does!
What problem does it solve?
Anyone who has worked with Zabbix knows that scheduling maintenance can sometimes be tedious, especially when you need to:
Configure complex routine maintenance
Handle Zabbix API bitmasks for specific days of the week or month
Search for specific hosts or groups
Document associated tickets
This project eliminates that friction by allowing the use of natural language to create both one-time and routine maintenance.
The magic behind the code
Conversational artificial intelligence
The system integrates both OpenAI GPT-4 and Google Gemini to interpret natural language requests. The AI doesn’t just understand what you want to do, but automatically:
Detects servers, groups, and dates
Identifies ticket numbers (XXX-XXXXXX format)
Automatically calculates complex Zabbix bitmasks
Generates contextual responses with examples
Fig. 1. Adding the AI Scheduler widget to your Zabbix dashboard
Advanced routine maintenance
What really stands out is its ability to handle complex patterns. Here are some practical examples that work:
“Daily backup for srv-backup from 2 to 4 AM with ticket 200-8341 until February 2027”
“Thursday and Friday maintenance from 5 to 7 AM until January 2027”
“Cleanup on the first Sunday of each month with ticket 100-178306 until December 2026”
Fig. 2. AI-generated maintenance summary with all calculated parameters
Elegant architecture
The project uses a three-layer architecture:
Frontend: Custom widget for Zabbix
Backend: Flask API with AI integration
Zabbix: Native API to create maintenance
Fig. 3. Maintenance successfully created and visible in Zabbix interface
Super-simple installation
One of the best features is how easy it is to get it running:
cp .env.example .env
You only need to configure your Zabbix URL and AI API key:
docker compose up -d --build
And that’s it! You have an AI assistant working.
Multi-instance support
For organizations with multiple Zabbix servers, the project includes configuration for up to 5 simultaneous instances, each with its own configuration.
What impresses me most
Intelligent date detection
The system understands natural expressions like:
“Tomorrow from 8 to 10” → Next date with specific schedule
“Sunday from 2 to 4 AM” → Next Sunday at those hours
“24/08/25 10:00am” → Automatically converts the format
Automatic Bitmask management
Zabbix API bitmasks can be notoriously complicated. This system calculates them automatically:
Thursday and Friday = 8 + 16 = 24
Sundays only = 64
First week of the month with specific configuration
Fig. 4. Complex weekly maintenance scheduling with automatic bitmask calculation
Why is it important?
This project represents a natural evolution in systems administration. Instead of memorizing complex syntax or navigating multiple menus, you simply describe what you need in natural language. It’s especially valuable for:
Operations teams handling multiple maintenance tasks
Companies that need to document associated tickets
Organizations with complex maintenance patterns
The future is here
Projects like this demonstrate how artificial intelligence can make complex technical tools more accessible without sacrificing functionality. It’s not just automation – it’s intelligence applied to real infrastructure problems. If you work with Zabbix and are tired of manually configuring maintenance, this project is definitely worth checking out. It’s open source, well documented, and solves a real problem that many of us face every day. You can find the complete project on GitHub.
There are plenty of good reasons to attend Zabbix Summit 2025, but one of the most important is the fact that this year’s Summit will feature Dylan Beattie as a special guest speaker. A Software Development Consultant and Founder of Ursatile, Dylan is an international keynote speaker, and a long-time contributor to the open-source community. He’s also a Microsoft MVP and has created Rockstar, an esoteric programming language that started as an inside joke and ended up being featured in Classic Rock magazine.
At the Summit, Dylan will give a talk titled “Open Source, Open Minds. The Cost of Free Software.” We asked him about his beginnings in the tech industry, what drove the creation of Rockstar, and why communication is the key to successful software development.
Can you tell us a bit about your journey into software development? How did you get started, and was there any particular moment when you realized that you were on the right path?
Like a lot of folks in tech, I got started on the 8-bit home computers of the 1980s – mine was an Amstrad 6128, which came with a couple of fairly mediocre games, but it also had a BASIC and a LOGO interpreter, and I pretty quickly found out that writing little programs and trying to create my own games was way more fun than playing the games which were included with it. I graduated from that to a 286 PC with MS—DOS 5, Windows 3.1 – but I really wasn’t thinking about it as a career.
The turning point was when I was sixteen years old, and I was supposed to be going to university to study mathematics. Dad brought home a new 486 PC a couple of weeks before my final exams, I spent my study leave messing around on the computer instead of studying, and when I didn’t get the grades I needed for my university course I figured maybe that was a sign I should be studying computer science instead. I went to Southampton and got a bachelor’s degree in computer science, learned C, C++, Lisp, SQL, and HTML. I graduated right as the dot-com bubble was bursting but still managed to get a job building data-driven web applications, and I’ve never really looked back.
You talk a lot about the human side of software. Why do you think communication is such a critical skill in development?
One of the perennial challenges facing the craft of programming is that it can be a profoundly solitary activity. One person working on their own can create an app or a game, put it online, and share their creation with literally millions of people – no meetings, no emails, just one person cranking out code. But then you try to translate those coding skills into domains like banking, healthcare, aviation, domains where software quality can have a real, material effect on people’s lives, and you realize that the code is actually the easy part.
The ability to talk to people, figure out what they need, help them understand your own ideas; to create consensus and avoid misunderstanding? It’s way more important than being able to crank out code. The most expensive problems I’ve had to deal with in my career haven’t been bugs in the code, they’ve been misunderstandings about what the team is doing and why it matters.
How did you end up creating a programming language (Rockstar) that can do double-duty as rock lyrics?
Good question! So, there’s always been this trope of the “rockstar programmer” – these mythical, high-powered, hyper-productive developers who can crank out millions of lines of fast, flawless code – and about a decade ago there was a massive spike in recruiters putting out adverts for “rockstar programmers.” When somebody suggested on Twitter that somebody should create a programming language called Rockstar to really confuse recruiters, that gave me an idea.
Initially it was just a piece of comedy writing – a parody of a programming language specification. I wanted to see if it was possible to extract enough clichés from rock music to create a formal grammar for a Turing-complete programming language that read exactly like song lyrics. It turns out that the answer is yes! I published the parody spec on GitHub, it got shared on Reddit and Hacker News, and the whole thing snowballed from there. Eventually I had no choice but to actually build a Rockstar interpreter, which turned out to be way more difficult than I thought, but also a lot of fun. The latest version is online here – it’s built in C#, compiles to native binaries for WIndows, Linux, and macOS, plus there’s a web assembly version on the website so curious folks can run Rockstar right in their browser without having to download anything!
Before taking on a speaking slot at this year’s Summit, how familiar were you with Zabbix? What has your experience of using it been like?
I’ve got to be honest – I’m not sure I’d ever heard of Zabbix before I was invited to speak at Zabbix Summit 2025, but that’s not unusual. I get invited to a lot of events that are focused around a particular technology or platform, and it’s a constant reminder of just how vast our industry is that somebody will organize a conference around a product I’ve never even heard of and attract literally hundreds of smart, curious people who want to share their own experiences and learn from each other. One thing about Zabbix which was particularly interesting to me when I started researching it was the licensing model. I think it’s a relatively unusual example of a commercially sustainable product or software that’s published under the Affero GPL license, so I’m really looking forward to chatting with other attendees about that and how that’s influenced their decision to use it.
You’re famous for your detailed and theatrical presentations – what makes a technical talk memorable to you?
A great talk is one that really connects with an audience, and the best way I’ve found to do that is to look for the little things that we all do every day that we’ve all learned just accept at face value, even when we have no idea why they work that way. Why is a capital “A” ASCII code 65 but a lowercase “a” is code 97? Why is validating email addresses difficult? Why is vertically aligning something in CSS such a big deal? There’s a good chance that a lot of folks in the audience have asked themselves that same question at some point, so the curiosity is already there. Tapping into that curiosity gets their attention, and then you can tell them the good stuff: the history, the stories, the personalities, the decisions.
There’s a lot of stuff in tech which feels kinda stupid, but none of it was designed to be stupid (well, except Rockstar!) Once you understand the context and the history, everything makes a lot more sense – and then at some point, maybe months later, you’ll hit a weird text encoding bug, or a problem with a system that won’t accept certain kinds of email addresses, and you’ll remember the talk. I get email from folks sometimes talking about how something from one of my presentations has helped them fix a weird bug years after they saw the presentation. That’s a great feeling.
Can you drop any hints about your presentation at this year’s Summit? What should audience members expect?
Sure! We’re going to talk about MIT, laser printers, software, Commander Keen, Doom, Quake, Netscape, the origins of the term “open source”, Linksys routers, WordPress, how the xz-utils backdoor nearly ended up compromising about half the computers on the internet – and a really cute story about a squirrel. It’s going to be awesome. I can’t wait!
For companies looking to migrate from PRTG Network Monitor to Zabbix, one of the most critical aspects is making sure a smooth migration of monitored devices and configurations. While there is no official tool to directly migrate between the two platforms, creating a bridge using custom export/import scripts allows for an effective and large migation. This blog post outlines a practical approach to achieving that migration based on the export/import methodology we at Opensource ICT Solutions previously implemented for one of our clients.
Why migrate?
While PRTG offers an intuitive interface and is popular for its ease of use, Zabbix provides:
Greater flexibility and scalability
Full open-source licensing
More powerful automation and templating
A robust API for integrations
Lower costs, especially since Paessler was sold to an investor
These features make Zabbix an attractive choice for teams looking to scale or standardize on open-source infrastructure.
Migration overview
The migration involves two key steps:
Exporting PRTG device information
Importing data into Zabbix
Because the two systems are conceptually and structurally different, we focused our scripts on migrating what is most transferable: device names, IP addresses, and interface types. SNMP versions or PRTG-specific sensor details were excluded or simplified where not applicable to Zabbix. PRTG, for example, will only export probes that have an OID that was not built-in in PRTG but added later, making our export incomplete. This does not mean we did a partial migration, it just means we have not included it in the automated approach.
Step 1: Exporting from PRTG
We developed a Python-based script that interacts with the PRTG API to extract monitored device data and export it to a CSV file. The script filters out irrelevant objects and organizes the output for easy Zabbix processing.
This creates a clean CSV, like this:
Device Name, IP Address, Interface Type
zabbix-server,10.0.0.10,agent
ServerA,192.168.0.2,SNMP
ServerA,192.168.0.2,agent
core-switch,192.168.0.1,SNMP
This file serves as a clean, structured inventory of monitored devices.
Note: SNMP version fields were excluded in the final export, as Zabbix does not currently display or rely on an SNMP version in the same way PRTG does.
Step 2: Importing into Zabbix
Using Zabbix’s API, we created an import script that reads the CSV and:
Creates host entries
Assigns them to the appropriate host group
Adds relevant interfaces (e.g., Agent,ILO,SNMP or a combination of …)
Each host is configured based on its detected interface type in PRTG.
On the Zabbix side, we used the Zabbix API to automate the creation of hosts, interfaces, and template assignment. The import script reads the CSV line-by-line and takes action based on the interface type.
Considerations and “gotchas”
Templates: We didn’t add templates, as there is no 1:1 solution – PRTG has a different concept and adding a standard template would be possible but probably not the best solution.
Host Groups: For ease of use and the limited time we had, we added all hosts in a temporary host group made for the migration. Although we do have scripts that take it out from PRTG and create it in Zabbix, in this particular migration it was not needed.
Permissions: The API token used in the import script must have sufficient privileges to create hosts.
What is NOTmigrated
Because of fundamental differences between the platforms, the following are not directly migrated:
Historical data or sensor readings: Mainly because the customer had no hard requirement for it.
Custom PRTG notifications or dependencies: It was easier to manually re-create them.
Maps or dashboards: The Zabbix approach is so different that it was easier to recreate it manually (and improve).
Sensors: Zabbix is working with a different concept.
Post-migration tips
Validation: After the import, verify that each host is reachable and monitored correctly in Zabbix.
Discovery: Consider using Zabbix’s LLD (Low-Level Discovery) to dynamically find interfaces, disks, or other entities.
Housekeeping: Disable PRTG monitoring only after confirming Zabbix is fully operational.
Conclusion
Migrating from PRTG to Zabbix is not a one click operation, but with some scripting, planning, and experience from a partner like us, it can be done efficiently and with minimal disruption. The custom export/import scripts act as a reliable bridge between the two systems, allowing for a clean transfer of your monitoring inventory. From there, Zabbix’s automation and scalability features can help take your monitoring to the next level.
If you need assistance with the migration or want to ensure best practices for scaling and optimizing Zabbix, don’t hesitate to reach out to OICTS. We are a Zabbix Premium Partner operating globally, with offices in the USA, UK, Netherlands, and Belgium ready to help you every step of the way.
Zhongnan University of Economics and Law (ZUEL), located in Wuhan City, Hubei Province, China, is a key university with two campuses – Nanhu and Shouyi. The school boasts over 20,000 full-time undergraduate students, more than 8,800 graduate students, and over 2,500 faculty and staff members. ZUEL enjoys an outstanding reputation in the fields of law and economics, with four national key disciplines. Its law discipline, meanwhile, has been included in the list of national “Double First-Class” disciplines.
The challenge
As the information infrastructure at ZUEL continues to expand, the scale of the university’s IT infrastructure has rapidly grown to encompass power systems, dynamic environmental systems, servers, network devices, security appliances, storage systems, virtualization platforms, operating systems, databases, data lakes, and campus application systems.
At the same time, the daily academic and administrative activities of faculty and students increasingly demand higher levels of stability and reliability from information systems. To ensure the efficient operation of these systems, the Information Management department needed a monitoring and management system that could cover the entire university’s IT resources and address the growing complexities of operational maintenance.
The university found that traditional monitoring and management systems often fall short when faced with such large-scale and diverse monitoring demands, revealing problems like insufficient monitoring points, poor real-time capabilities, and limited scalability. To address these challenges, the university decided to adopt Zabbix 7.0 and develop a custom IP Radar platform to further meet its refined operational maintenance needs.
The solution
When combined with Zabbix 7.0, the IP Radar system can achieve comprehensive monitoring and management of the university’s entire IT infrastructure through the integrated application of multiple monitoring protocols and technologies. Specifically, the system collects data and performs monitoring with the help of the following core technologies:
Zabbix 7.0. As an enterprise-level open-source monitoring platform renowned for its robust data collection and analysis capabilities, Zabbix enhances the system’s high availability, supporting large-scale concurrent processing to make sure that the monitoring system remains stable and delivers uninterrupted service even under heavy loads.
Parallel monitoring with multiple protocols. The system collects data through a variety of protocols, including Agent, SNMP, IPMI, MODBUS, MQTT, and more, enabling the real-time monitoring of a wide variety of IT hardware.
High-availability design. To accommodate the monitoring demands of massive devices and thousands of users, the Zabbix 7.0 platform supports multi-node deployment and redundancy design, enabling load balancing and failover among proxy servers. Even in the event of a node failure, the system maintains uninterrupted monitoring services, and it’s also equipped with an automated fault alerting and repair mechanism.
The self-developed IP Radar platform. To meet a demanding set of operation and maintenance management needs, ZUEL has developed the IP Radar system based on the Zabbix 7.0 platform, further customizing its business monitoring capabilities. IP Radar not only conducts real-time monitoring of the IT infrastructure, but it also provides detailed performance analysis reports and trend predictions, while integrating behavior monitoring capabilities to enhance the school’s network security management.
The IP Radar platform itself contains a variety of unique and innovative features, including:
Comprehensive monitoring coverage. The IP Radar system monitors over a million items – everything from hardware devices to application systems, affecting everything from network performance to user experience. This extensive coverage gives the Information Management department to a comprehensive understanding of the operational status of the school’s IT resources while providing sufficient data support for troubleshooting and performance optimization.
Customized monitoring strategies. Compared to traditional monitoring systems, IP Radar offers highly customized monitoring strategies. ZUEL can tailor different business dashboards for networks, computing resources, user experience, data center environments, and more, based on its own needs and the permissions granted to operation and maintenance personnel. Depending on different monitoring thresholds and alerting strategies, the system can automatically generate alerts and notify relevant personnel through enterprise WeChat, SMS, and other channels.
Intelligent alerting and automated handling. The intelligent alerting system of the IP Radar platform leverages machine learning algorithms to analyze historical monitoring data, enabling it to predict potential fault risks and issue early warnings. At the same time, the system integrates automated operation and maintenance capabilities, which allow it to automatically execute predetermined repair operations when certain common faults occur, reducing the time and cost of manual intervention.
Network security monitoring. In terms of network security, the IP Radar system is capable of identifying abnormal traffic patterns and promptly detecting potential security threats through real-time analysis of the school’s entire network traffic. The system also supports the monitoring of online behavior to ensure that network access activities comply with the school’s security policies.
The results
After implementing the Zabbix-based system, ZUEL was able to measure a wide range of monitoring performance improvements, including:
Improved operational and maintenance efficiency. Through the IP Radar system, the school’s Information Management department has been able to monitor the operational status of over 28,000 hosts in real-time, significantly enhancing operational efficiency. The system’s automated fault handling capabilities reduce the complexity of manual operations, allowing operations and maintenance personnel to focus on addressing only the complex issues that the system is unable to resolve automatically. At the same time, the system’s intelligent alerting feature enables the early detection of potential problems, preventing sudden failures.
Enhancing system stability and reliability. The high availability design of Zabbix 7.0 ensures that the system remains stable even under heavy loads. Its redundant design and automatic failover mechanisms guarantee the reliability of the system, and the trend analysis functionality provided by IP Radar helps administrators to identify factors that may affect system stability in advance and making corresponding adjustments, enhancing the overall reliability of the IT system in the process.
Advancing detailed information management. The IP Radar platform lets schools manage multiple IT resources with greater precision. The system not only monitors the operational status of hardware devices, but it also analyzes the performance of business systems, helping administrators to optimize system configurations and enhancing user experiences. During project development, historical data from the monitoring platform serves as an essential basis for decision-making. In the acceptance phase, the monitoring platform provides evaluation reference data for operational efficiency and stability.
The IP Radar monitoring and management system developed by ZUEL and based on Zabbix 7.0 has become the largest, most widely used, and most effective (in terms of the volume of monitored data) in the Chinese education sector. The successful implementation of this system not only provides strong support for the school’s information management, but it also offers valuable references for information operation and maintenance at other universities.
In conclusion
Looking ahead, the IP Radar system is poised to expand its functionalities further by integrating more intelligent operation and maintenance management tools. Through the introduction of emerging technologies such as big data analysis and artificial intelligence, the system will achieve more breakthroughs in areas like automated operation and maintenance as well as intelligent fault prediction, providing even more comprehensive technical support for the university’s information management.
To learn more about what Zabbix can do for educational institutions, visit our website.
Running a monitoring platform like Zabbix in a production environment requires bulletproof availability at the database layer. Any downtime in PostgreSQL, even for seconds, can disrupt monitoring visibility, triggering blind spots in alerts and data collection.
This post introduces a streamlined High-Availability (HA) architecture for Zabbix using PostgreSQL, pg_auto_failover, HAProxy, and PgBackRest. Built on RHEL 9 or derivatives, this architecture removes single points of failure and automates failover using minimal external dependencies, making it a strong candidate for modern observability backends.
Architecture overview
This HA design simplifies deployment by using a dedicated monitor node to orchestrate automatic failover between two PostgreSQL database nodes. With pg_auto_failover, we avoid the need for complex consensus layers like etcd or Consul while still achieving fast, reliable failover and recovery.
Database layer
Two PostgreSQL nodes are deployed in a primary/secondary configuration. These nodes are registered with a dedicated pg_auto_failover monitor, which continuously checks node health and replication status. In the event of a failure, the monitor promotes the secondary to primary with no manual intervention.
Each node is securely configured using scram-sha-256 authentication and self-signed / or owned SSL certificates to ensure encrypted communication within the cluster.
Monitor node (Arbiter)
The monitor node is a lightweight PostgreSQL instance that runs the pgautofailover extension. It holds state information about all participating nodes and acts as the arbiter during failover events. It requires only one node, reducing complexity compared to consensus-based DCS (Distributed Configuration Store) systems like etcd or ZooKeeper.
Load balancing layer
Two HAProxy nodes route all client (Zabbix) connections to the current PostgreSQL primary. A lightweight HTTP service on each DB node reports its current role (primary or not) and allows HAProxy to determine which node is writable. These proxies are kept highly available using Keepalived, which manages a shared Virtual IP (VIP) across both proxy servers.
This way, applications like Zabbix always connect to a stable endpoint, even during failover events.
Backup layer
Backups are handled using PgBackRest, deployed on a dedicated backup server. This server connects to both PostgreSQL nodes over SSH and performs the following:
Full and incremental backups
WAL archiving
Point-In-Time Recovery (PITR)
Passwordless SSH and proper pgbackrest.conf mappings are set up to support seamless interaction regardless of which node is currently primary.
Component overview
Component
Role
PostgreSQL
Relational backend storing all Zabbix metrics, alerts, events
pg_auto_failover
Ensures continuous availability by promoting replicas automatically
Monitor Node
Decides failover based on health checks and cluster state
HAProxy
Routes client traffic to the current primary
Keepalived
Provides VIP failover between HAProxy nodes
PgBackRest
Performs PITR-capable backups from any node
Zabbix Server
Connects to PostgreSQL via VIP to ensure continuity
Topology at a glance
Design
Unlike Patroni, which requires a distributed configuration store like etcd, pg_auto_failover uses a dedicated monitor node that simplifies orchestration. This setup reduces the operational burden while still delivering robust failover, automatic reconfiguration, and synchronization safeguards, including:
Synchronous_standby_names to enforce replication integrity
Service integration with systemd for reliable restarts
Failover detection with minimal latency
This design also ensures SSL-enabled encrypted communication, self-healing role changes, and full observability using Zabbix itself, which can be configured to monitor the PostgreSQL cluster through exposed health endpoints.
Real-world considerations
Upgrade Planning: The pg_auto_failover version in RPM repos may lag behind the latest upstream features like set_monitor_setting. Pin the package version if consistency is required.
Network Security: Only HAProxy nodes are allowed to query the internal role-check API on the DB nodes using custom firewall rules.
Cluster Hygiene: Always clean up config folders (~postgres/.config/pg_autoctl/…) if a node is misconfigured or needs to rejoin.
SELinux: Configure SELinux, use semanage and audit2allow to fix custom ports (e.g., 9877 for health checks).
Hybrid Logging: Setup PostgreSQL to log to both journald and traditional log files via stderr + logging_collector.
Conclusion
This architecture strikes a balance between simplicity and resilience. While Patroni is great for large-scale, multi-region setups requiring distributed consensus, pg_auto_failover offers a lighter-weight solution that covers most enterprise needs without complex dependencies.
By layering the following…
PostgreSQL 17
Pg_auto_failover with a single monitor
HAProxy + Keepalived for VIP failover
PgBackRest for backups
…you can then confidently run Zabbix in a highly available and secure fashion with minimal operational overhead.
If you’re considering implementing this setup or migrating from a single-node database backend, reach out to Opensource ICT Solutions, a Zabbix Premium Partner with global presence in the USA, the UK, the Netherlands, and Belgium. We can help you architect, deploy, and monitor Zabbix environments that scale with your needs.
Zabbix has been the backbone of my infrastructure for over ten years, a journey I’ve been on from version 3.2 to 7.4. It’s a robust and reliable tool. However, in the age of intelligent assistants, I posed a question to myself: Why can’t I interact with my monitoring system as naturally as I talk with Maria, my generative AI assistant?
Table of Contents
What is MCP?
MCP (Model Context Protocol) is a universal protocol that helps generative AI systems interact with global data securely, reliably, and at scale.
Imagine this: It’s 3 AM, and you receive a critical alert on your phone. Instead of opening multiple dashboards and manually correlating data, you simply type: “What’s happening with the production server?”
You get a response like this:
“The web-prod-01 server is experiencing high memory usage (94%). This started 15 minutes ago, coinciding with a traffic spike. I recommend checking the database connection pool and considering a restart of the Apache service. Would you like me to show you the related logs?”
This is no longer science fiction!
Design principle
The main objective is to enhance Zabbix without altering its core. The solution is based on an architecture that adheres to the following principles:
Zabbix intact: The original installation remains unchanged.
API-first: All communication is done through Zabbix’s robust JSON-RPC API.
Intelligent bridge: An intermediary service is created to translate between human language and Zabbix metrics.
Scalability: The design is prepared to grow alongside the infrastructure.
AI server (MCP): Rocky Linux 9, Gemini AI, Express.js, Winston (Logging), Gemini CLI, Redis, Nginx, PM2
Webhooks
We process Zabbix alerts through a webhook that sends the data to our generative AI service.
#!/usr/bin/env python3
# -*- coding: utf-8 -*-
import json
import requests
import sys
from datetime import datetime

def send_to_mcp(args):
""" Sends alerts to MCP server"""
# SETTINGS - EDIT ACCORDING TO YOUR ENVIRONMENT
mcp_endpoint = "http://TU_IP_MCP_SERVER:3001/alerts" # Change to the MCP server IP
mcp_token = "TU_MCP_AUTH_TOKEN" # Exchange for your MCP authentication token
zabbix_server_ip = "TU_IP_ZABBIX_SERVER" # Change to the Zabbix server IP

headers = {
'Content-Type': 'application/json',
'Authorization': f'Bearer {mcp_token}'
}

# Extracting arguments from the Zabbix webhook
eventid = args[0] if len(args) > 0 else "unknown"
severity = args[1] if len(args) > 1 else "0"
message = args[2] if len(args) > 2 else "No message"
host = args[3] if len(args) > 3 else "unknown"
value = args[4] if len(args) > 4 else ""

payload = {
"timestamp": datetime.now().isoformat(),
"source": "zabbix",
"eventid": eventid,
"severity": severity,
"message": message,
"host": host,
"value": value,
"zabbix_server": zabbix_server_ip
}

try:
print(f"Sending alert to MCP: {mcp_endpoint}")
print(f"Payload: {json.dumps(payload, indent=2)}")

response = requests.post(mcp_endpoint, json=payload, headers=headers, timeout=15)
response.raise_for_status()

print(f"Alert sent successfully: HTTP {response.status_code}")
print(f"Response: {response.text}")
return True

except requests.exceptions.Timeout:
print("? Error: Timeout connecting to MCP server", file=sys.stderr)
return False
except requests.exceptions.ConnectionError:
print("? Error: Cannot connect to MCP server", file=sys.stderr)
return False
except requests.exceptions.HTTPError as e:
print(f"? HTTP Error: {e}", file=sys.stderr)
print(f"Response: {response.text}", file=sys.stderr)
return False
except Exception as e:
print(f"? Unexpected error: {e}", file=sys.stderr)
return False

if __name__ == "__main__":
# The arguments come from Zabbix
args = sys.argv[1:]
print(f"Script called with args: {args}")

success = send_to_mcp(args)
sys.exit(0 if success else 1)
Use cases
Scenario 1: Monday morning
Cesar: Good morning, how is the infrastructure looking?
Gemini CLI: Good morning! Everything is calm. 14 active hosts, 0 critical problems. There was a scheduled reboot on ‘proxmox-desarrollo’ over the weekend which completed successfully. The average CPU usage is at 23%. Do you need details on any specific system?
Scenario 2: Proactive planning
Cesar: What worrying trends are you seeing this week?
Gemini CLI: I’ve noticed three patterns that require attention:
1. storage-01: Growth of 2GB/day in /var/log.
Projection: 90% capacity in 12 days.
Recommendation: Configure a more aggressive log rotate.
2. mikrotik: Gradually increasing temperature (+3°C over the last 7 days).
Recommendation: Check ventilation.
3. base-datos-01: Slow queries increasing by 15%.
Recommendation: Review indexes and optimize frequent queries.
MCP implementation
Server (Rocky Linux 9)
bash
#create the project
mkdir /opt/mcp-zabbix
cd /opt/mcp-zabbix

#Install dependencies
sudo dnf install -y nodejs npm redis nginx
sudo npm install -g pm2

#Set up the project
npm init -y
npm install express axios @google/generative-ai winston helmet cors dotenv
Complete installation: Scripts for Rocky Linux and Debian
Zabbix configuration: Media types and actions
API reference: Endpoints and examples
Use cases
Basic monitoring: Hosts, items, triggers
Intelligent alerts: Automatic analysis
Ad-hoc queries: Quick investigation
Automated reports: Periodic summaries
Future integrations
The goal is to develop an application that allows natural interaction with an AI assistant called “Maria.” The idea is that based on what’s happening, Maria suggests actions and executes them proactively.
To achieve this, the assistant will integrate with Gemini’s command-line interface (CLI) and establish an additional secure communication channel. The recommended architecture will consist of several servers capable of understanding each other, including a Zabbix Server, the MCP (Model Context Protocol), and the personal assistant.You can follow the development of the base integration in this repository.
Conclusion
Zabbix will continue to be the reliable engine we all know. The difference is that it now becomes more intuitive and conversational. The goal is not to replace human experience, but to empower it. AI will allow us to create solutions that were previously unthinkable.
To fully leverage this potential, it is essential that we, as experts, continue to train and deepen our knowledge of the tool. This way, we will not only depend on what the AI suggests, but we will be able to validate and authorize its actions with our own judgment.
Headquartered in Shanghai, the China Pacific Insurance (Group) Co., Ltd. (CPI) is a Chinese insurance company that was established on the basis of the former China Pacific Insurance Corporation. CPI Group is the second largest property insurance company and the third largest life insurance company in Mainland China. It provides integrated insurance services (including life insurance, property insurance, and reinsurance) through its subsidiaries.
The challenge:
The overall data center operation structure of the company works along financial industry lines, with a two-site, three-center operation model. The total scale of China Pacific Insurance’s on-premises hosts is over 6,000, and the three centers add up to nearly 40,000 host devices in the production environment.
It’s an enormous amount of information to monitor, so any monitoring solution needs to significantly reduce the difficulty of overall alert analysis. The alert information provided by the mixture of cloud product components that CPI were using caused a serious case of alert fatigue for their operations and maintenance personnel, with some alerts taking as long as 4 months to process.
The solution:
The bank’s cloud platforms all had their own monitoring and alerting functions, but the configuration of value threshold and notification policies was not flexible enough. Zabbix’s ability to uniformly collect data while configuring triggers and alerting proved to be a game-changer.
In addition, when compared to cloud vendors whose solutions require adjustments to thresholds in each product component, Zabbix proved to be a much simpler and more cost-effective way to notify operators of only the most essential alerts.
The results:
In practice, CPI found that the Zabbix multi-index combined alert function eliminates 30% of invalid alerts. Thanks to this success, CPI now plans to transfer the Zabbix Data Transmission Service to their digital twin data center, so that the inspection of physical facilities and the impact analysis of the application system can be quickly displayed to their operations and maintenance personnel.
Conclusion
The team at China Pacific Insurance successfully built an intelligent operation and maintenance system covering a number of key modules such as automated operation and maintenance, intelligent monitoring, logging platforms, and container platforms – all with Zabbix at the core. They are currently exploring the cutting-edge integration of monitoring systems with LLMs, further advancing intelligent monitoring and observability solutions in the process.
To learn more about what Zabbix can do for customers in banking and finance, visit our website.
Authorization in Amazon Web Services (AWS) determines what actions a user, service, or system can perform on resources. It answers the question: “Does this identity have permission to do this action on that resource?”
In AWS, authorization is primarily handled through:
IAM (Identity and Access Management) policies
Resource-based policies (like S3 bucket policies)
Session-based permissions (like STS AssumeRole)
What authorization types are available in Zabbix AWS templates?
Access key authorization
Role-based authorization
Assume role authorization
Let’s look briefly at each of them.
Table of Contents
Before using the template, you need to create an IAM policy that grants the necessary permissions for the AWS services the template will interact with.
This policy defines what actions are allowed, on which resources, and optionally, under which conditions. Once created, the policy should be attached to the IAM role or user that will run the template.
IAM policy for Zabbix
Add the following required permissions to your Zabbix IAM policy in order to collect metrics. The policy can change when new metrics and services are added in Zabbix templates.
An error occurred (AccessDenied) when calling the DescribeInstances operation: User: arn:aws:iam::123456789010:user/zabbix_user is not authorized to perform: ec2:DescribeInstances on resource: arn:aws:ec2:eu-central-1:123456789010:instance/*
…you need to check the following permission to the role you are using (IAM Policy for Zabbix).
5. Set the following macros in Zabbix:
{$AWS.AUTH_TYPE} – set to access_key
{$AWS.ACCESS.KEY.ID} – set to your access key ID
{$AWS.SECRET.ACCESS.KEY} – set to your secret access key
Security tips
Never hardcode access keys in scripts or code.
Store them in ~/.aws/credentials, which is protected by file system permissions.
Apply least privilege with IAM policies.
Role-based authorization
1. Add the appropriate permission to the role you are using:
LMT is a mobile GSM/UMTS/LTE operator in Latvia. Founded on January 2, 1992, it was the first mobile network operator in the country. In addition to providing mobile network and ISP services, LMT uses innovative technologies and solutions to develop and maintain a variety of IT solutions for public and private organizations. Currently, LMT is the largest telecommunications service provider in the country, with over 1,660 base stations and over 1.5 million users as of 2024.
The challenge
LMT utilizes a variety of monitoring solutions for a variety of purposes – from tools performing and monitoring ping responses to vendor-specific solutions and all-in-one tools such as Zabbix. LMT has 2 data centers, and since the vast majority of services delivered by LMT can be considered critical, most of the relevant infrastructure is duplicated across them.
Multiple Zabbix instances are used in the environment, including Zabbix 5.0 with MySQL database backend, Zabbix 7.0 with PostgreSQL, and TimescaleDB. Over 3,000 hosts with approximately 500,000 items are monitored by Zabbix.
The solution
Here is one example of how Zabbix is used to monitor switch cabinets in LMT data centers. Switch cabinets contain devices to measure the electric current, which support Modbus protocol and which can in turn be used to collect data.
Modbus monitoring was achieved by using Zabbix agent2 with the official Modbus plugin. This was combined with NetBox and GraphQL. NetBox was used as the source of truth, providing information about power feed and various electrical characteristics, such as voltage, amperage, utilization, phase, and more. The data was collected from NetBox via HTTP agent checks and GraphQL, and a JSON result was created by utilizing Zabbix preprocessing features.
The information collected from NetBox is combined with Modbus data collection utilizing Zabbix agent2. The data collected by Zabbix agent2 is preprocessed after the collection. The collected data is normalized and used by Zabbix low-level discovery features to automatically create Zabbix items and triggers for the available resources. Finally, the resulting data is visualized on Zabbix dashboards.
The results
Monitoring with Zabbix has made reacting to changes in the monitored power feed (detecting spikes, observing gradual power feed changes, etc.) a much simpler proposition for LMT, which in turn improves service for its millions of users.
In conclusion
Zabbix has proven itself to be an ideal solution for telecommunications clients, making it easier than ever to keep track of network health and performance, driving a more positive customer experience and greater revenue growth in the process.
To learn more about what Zabbix can do for customers in telecommunications, get in touch with us.
To provide the best experiences, we use technologies like cookies to store and/or access device information. Consenting to these technologies will allow us to process data such as browsing behavior or unique IDs on this site. Not consenting or withdrawing consent, may adversely affect certain features and functions.
Functional
Always active
The technical storage or access is strictly necessary for the legitimate purpose of enabling the use of a specific service explicitly requested by the subscriber or user, or for the sole purpose of carrying out the transmission of a communication over an electronic communications network.
Preferences
The technical storage or access is necessary for the legitimate purpose of storing preferences that are not requested by the subscriber or user.
Statistics
The technical storage or access that is used exclusively for statistical purposes.The technical storage or access that is used exclusively for anonymous statistical purposes. Without a subpoena, voluntary compliance on the part of your Internet Service Provider, or additional records from a third party, information stored or retrieved for this purpose alone cannot usually be used to identify you.
Marketing
The technical storage or access is required to create user profiles to send advertising, or to track the user on a website or across several websites for similar marketing purposes.

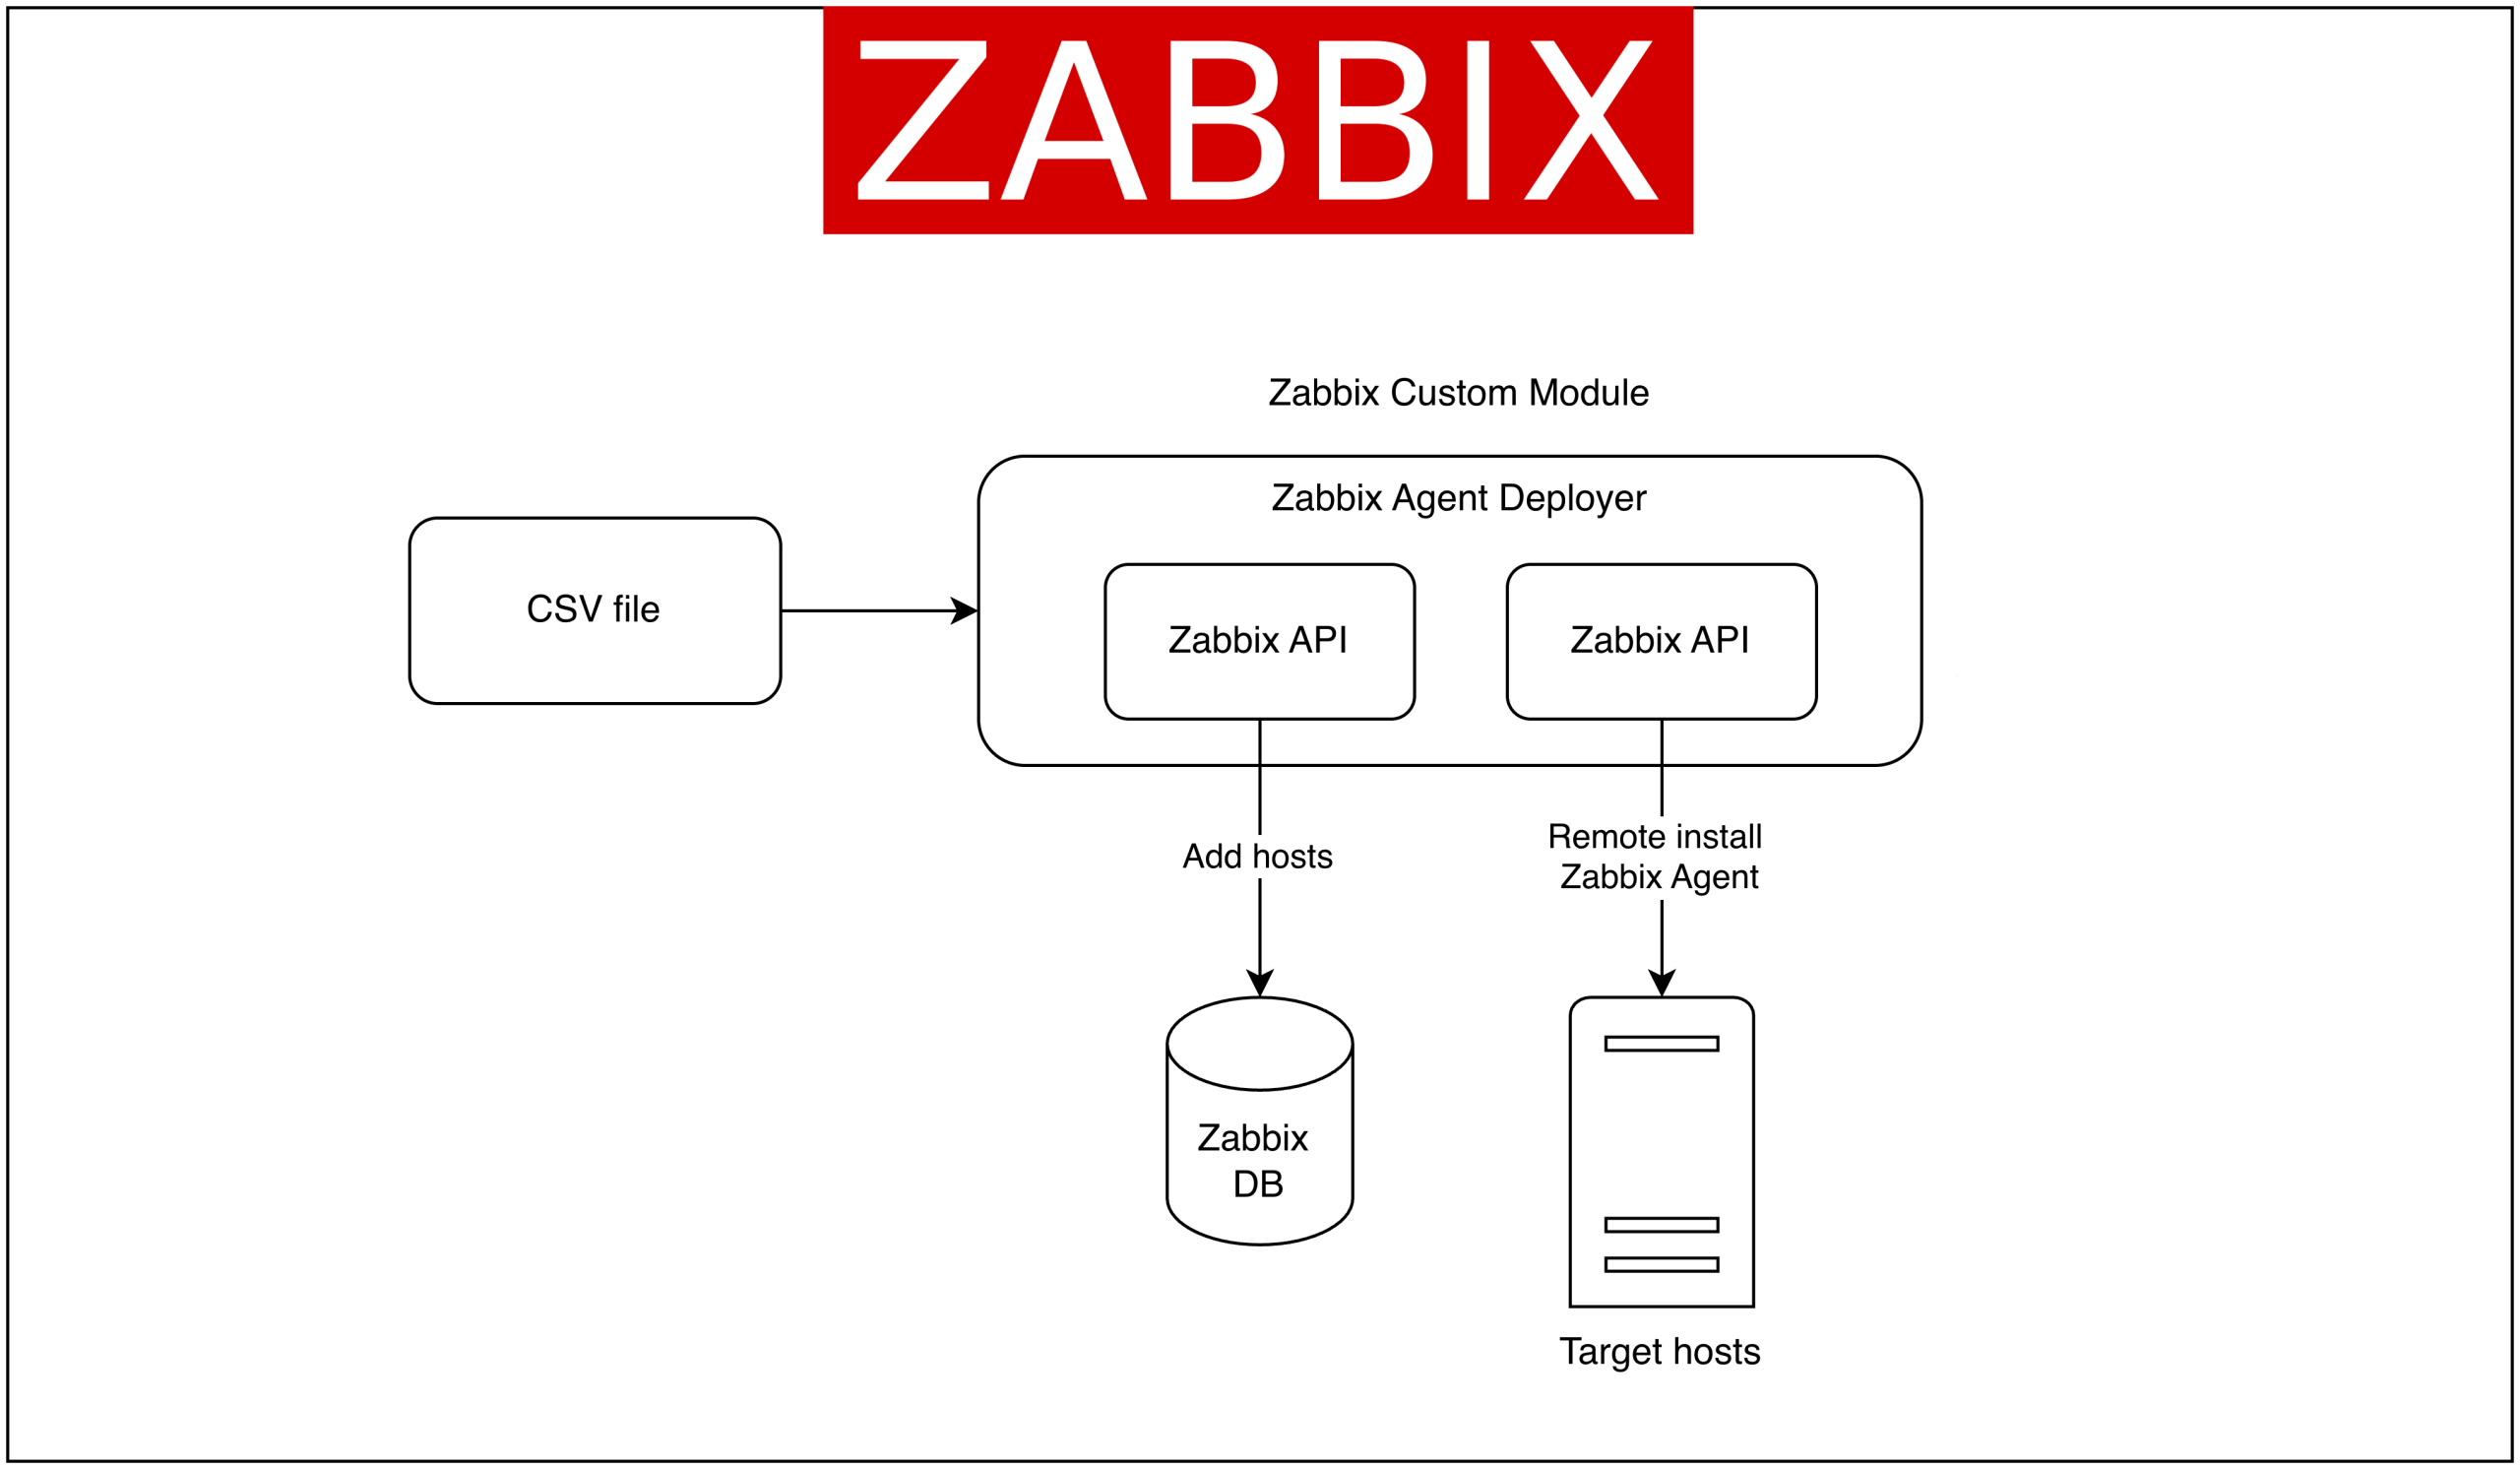
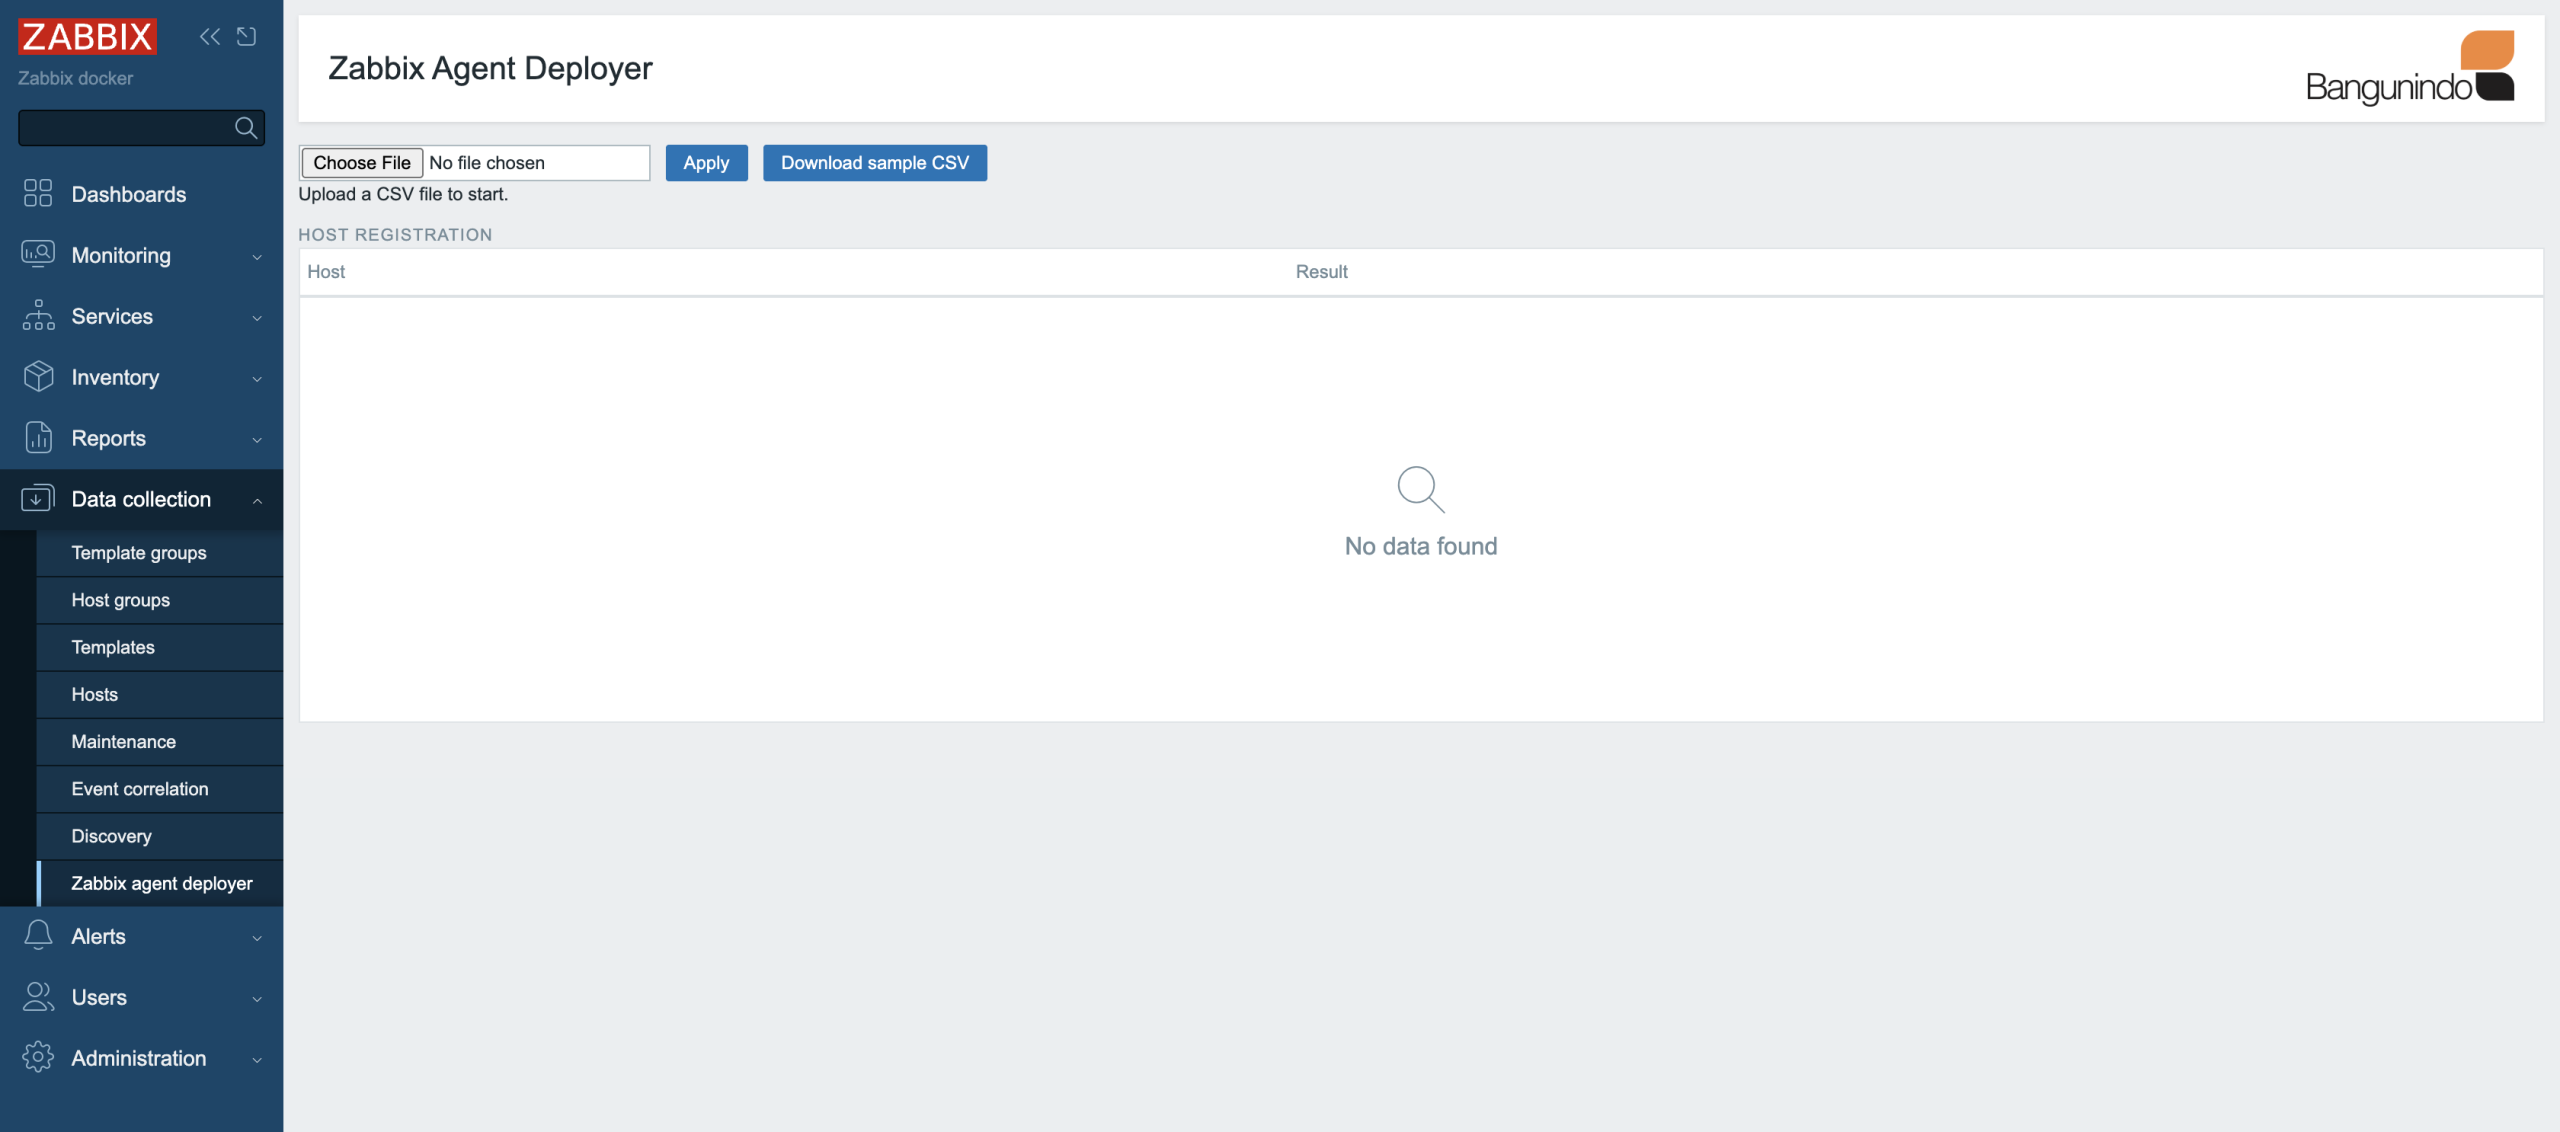
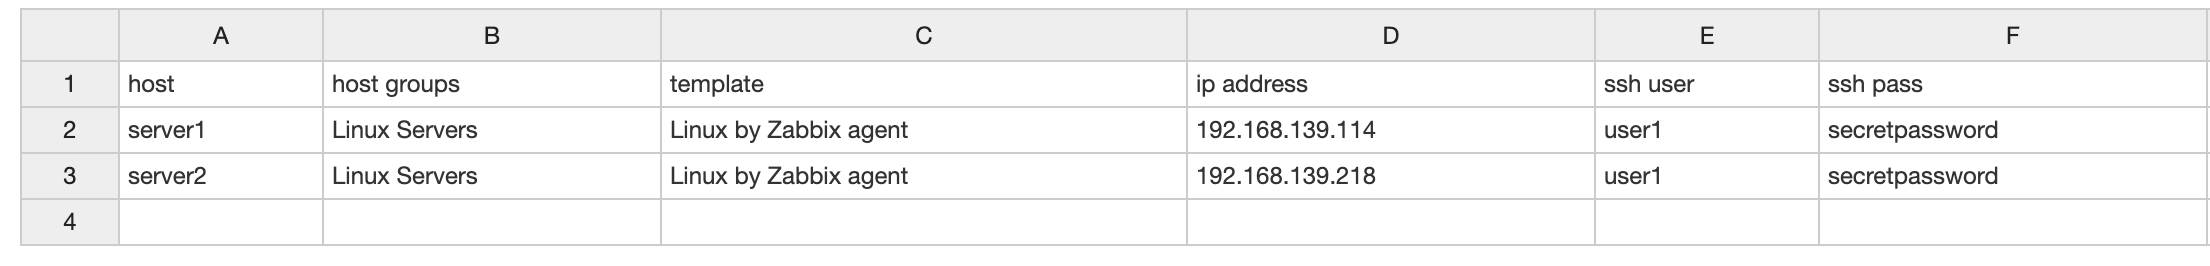
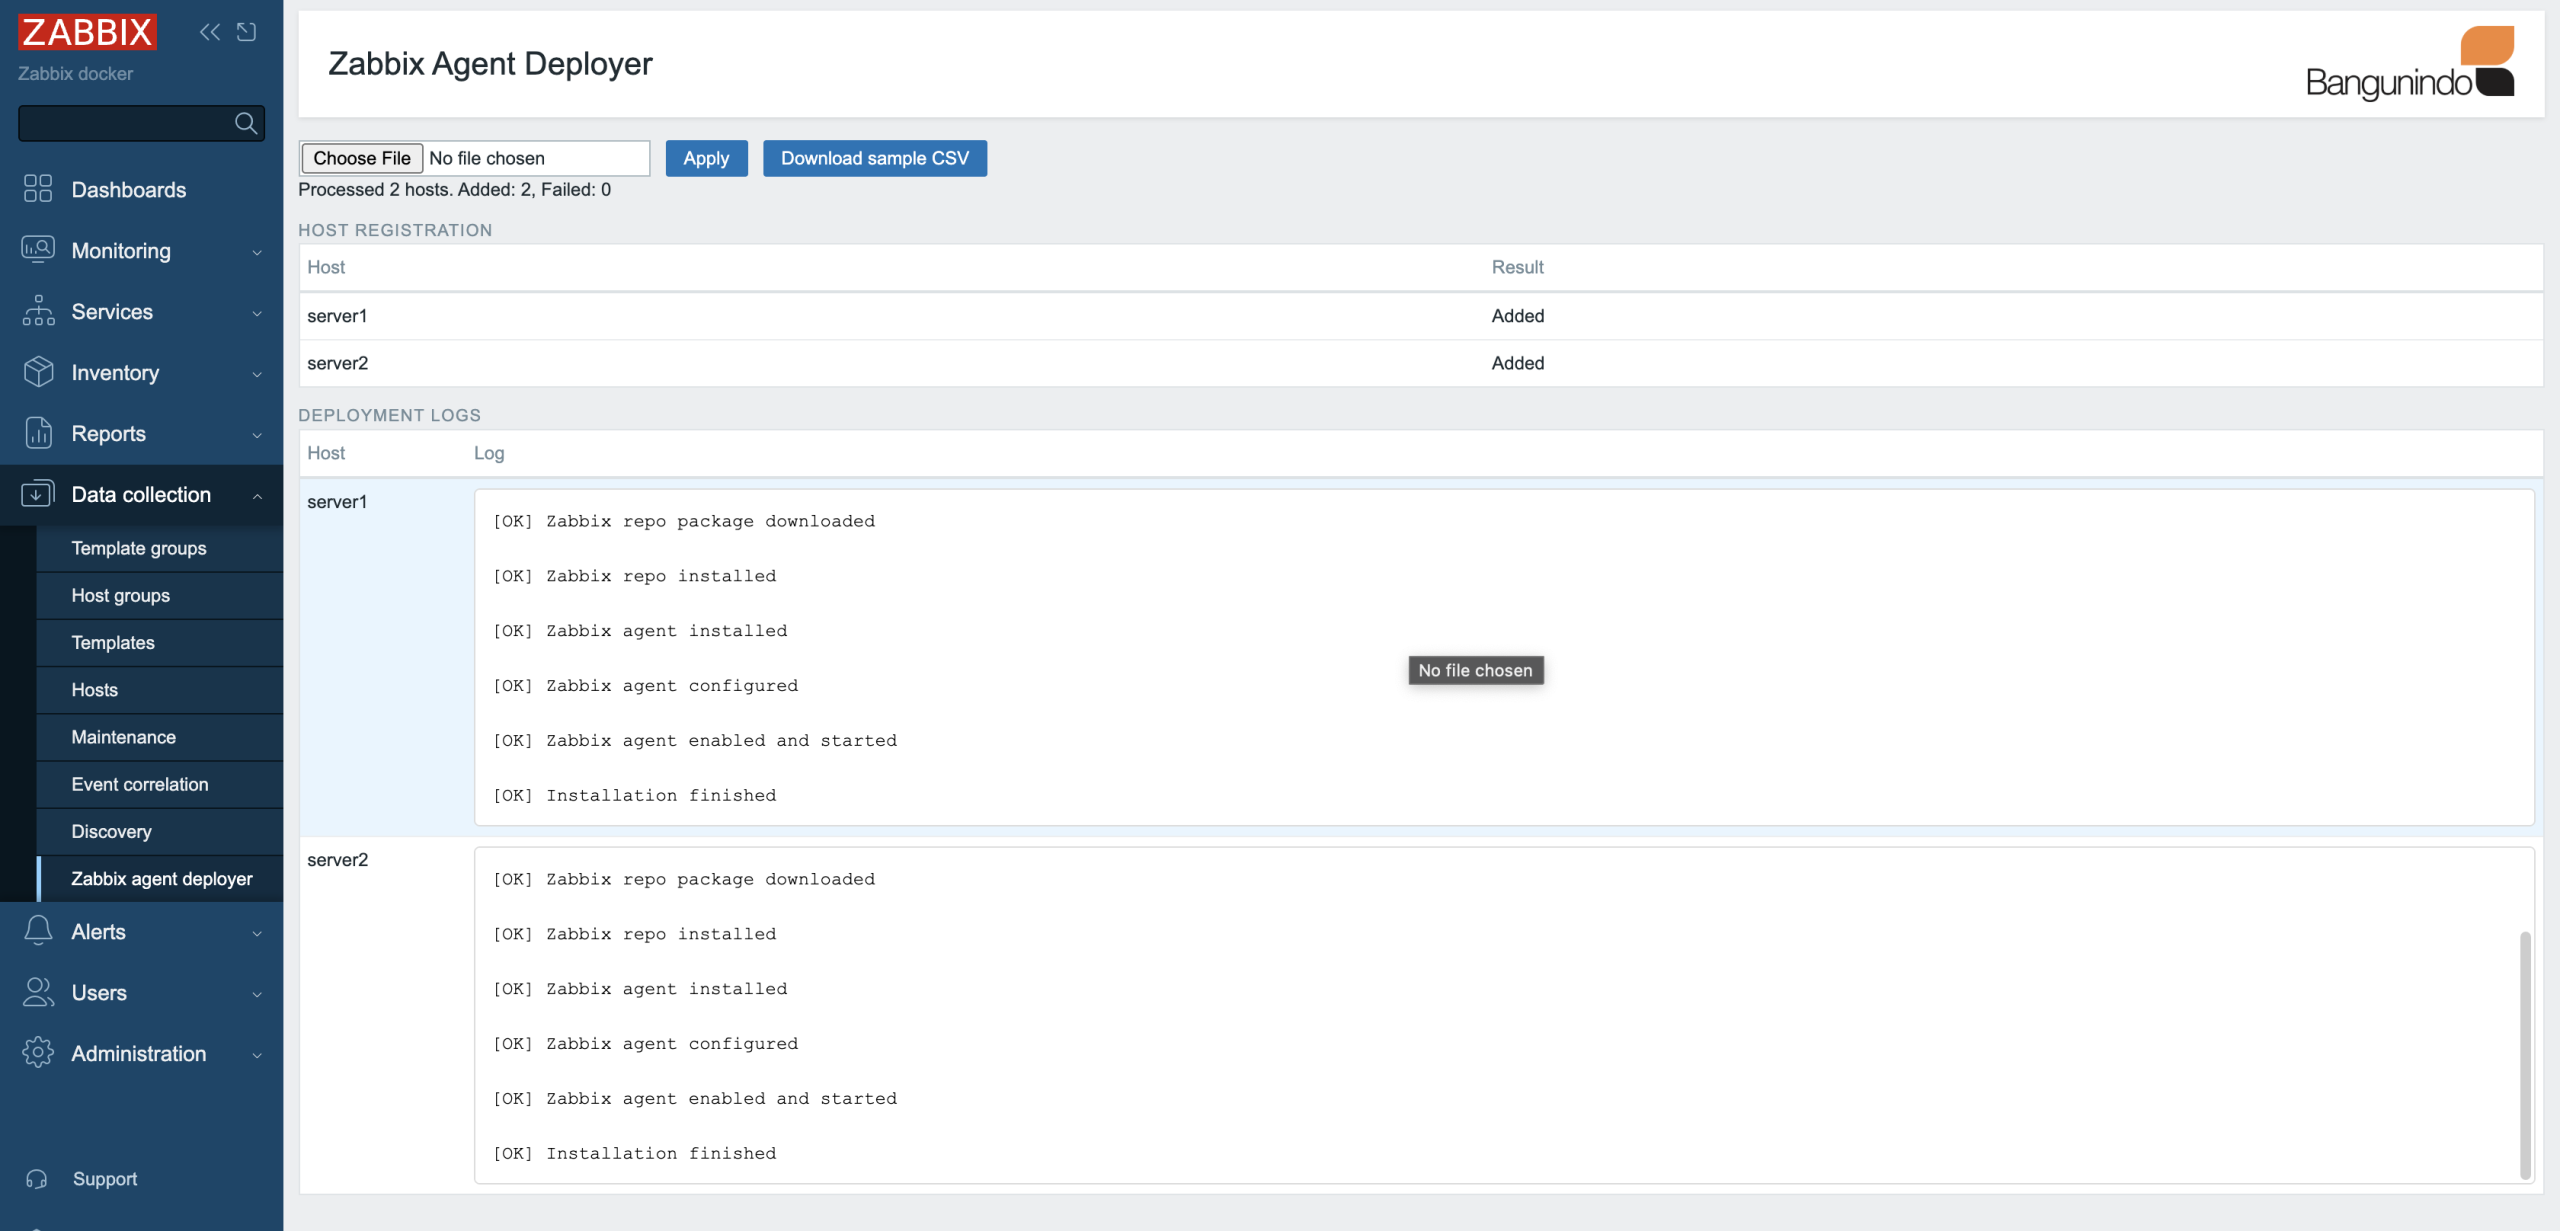
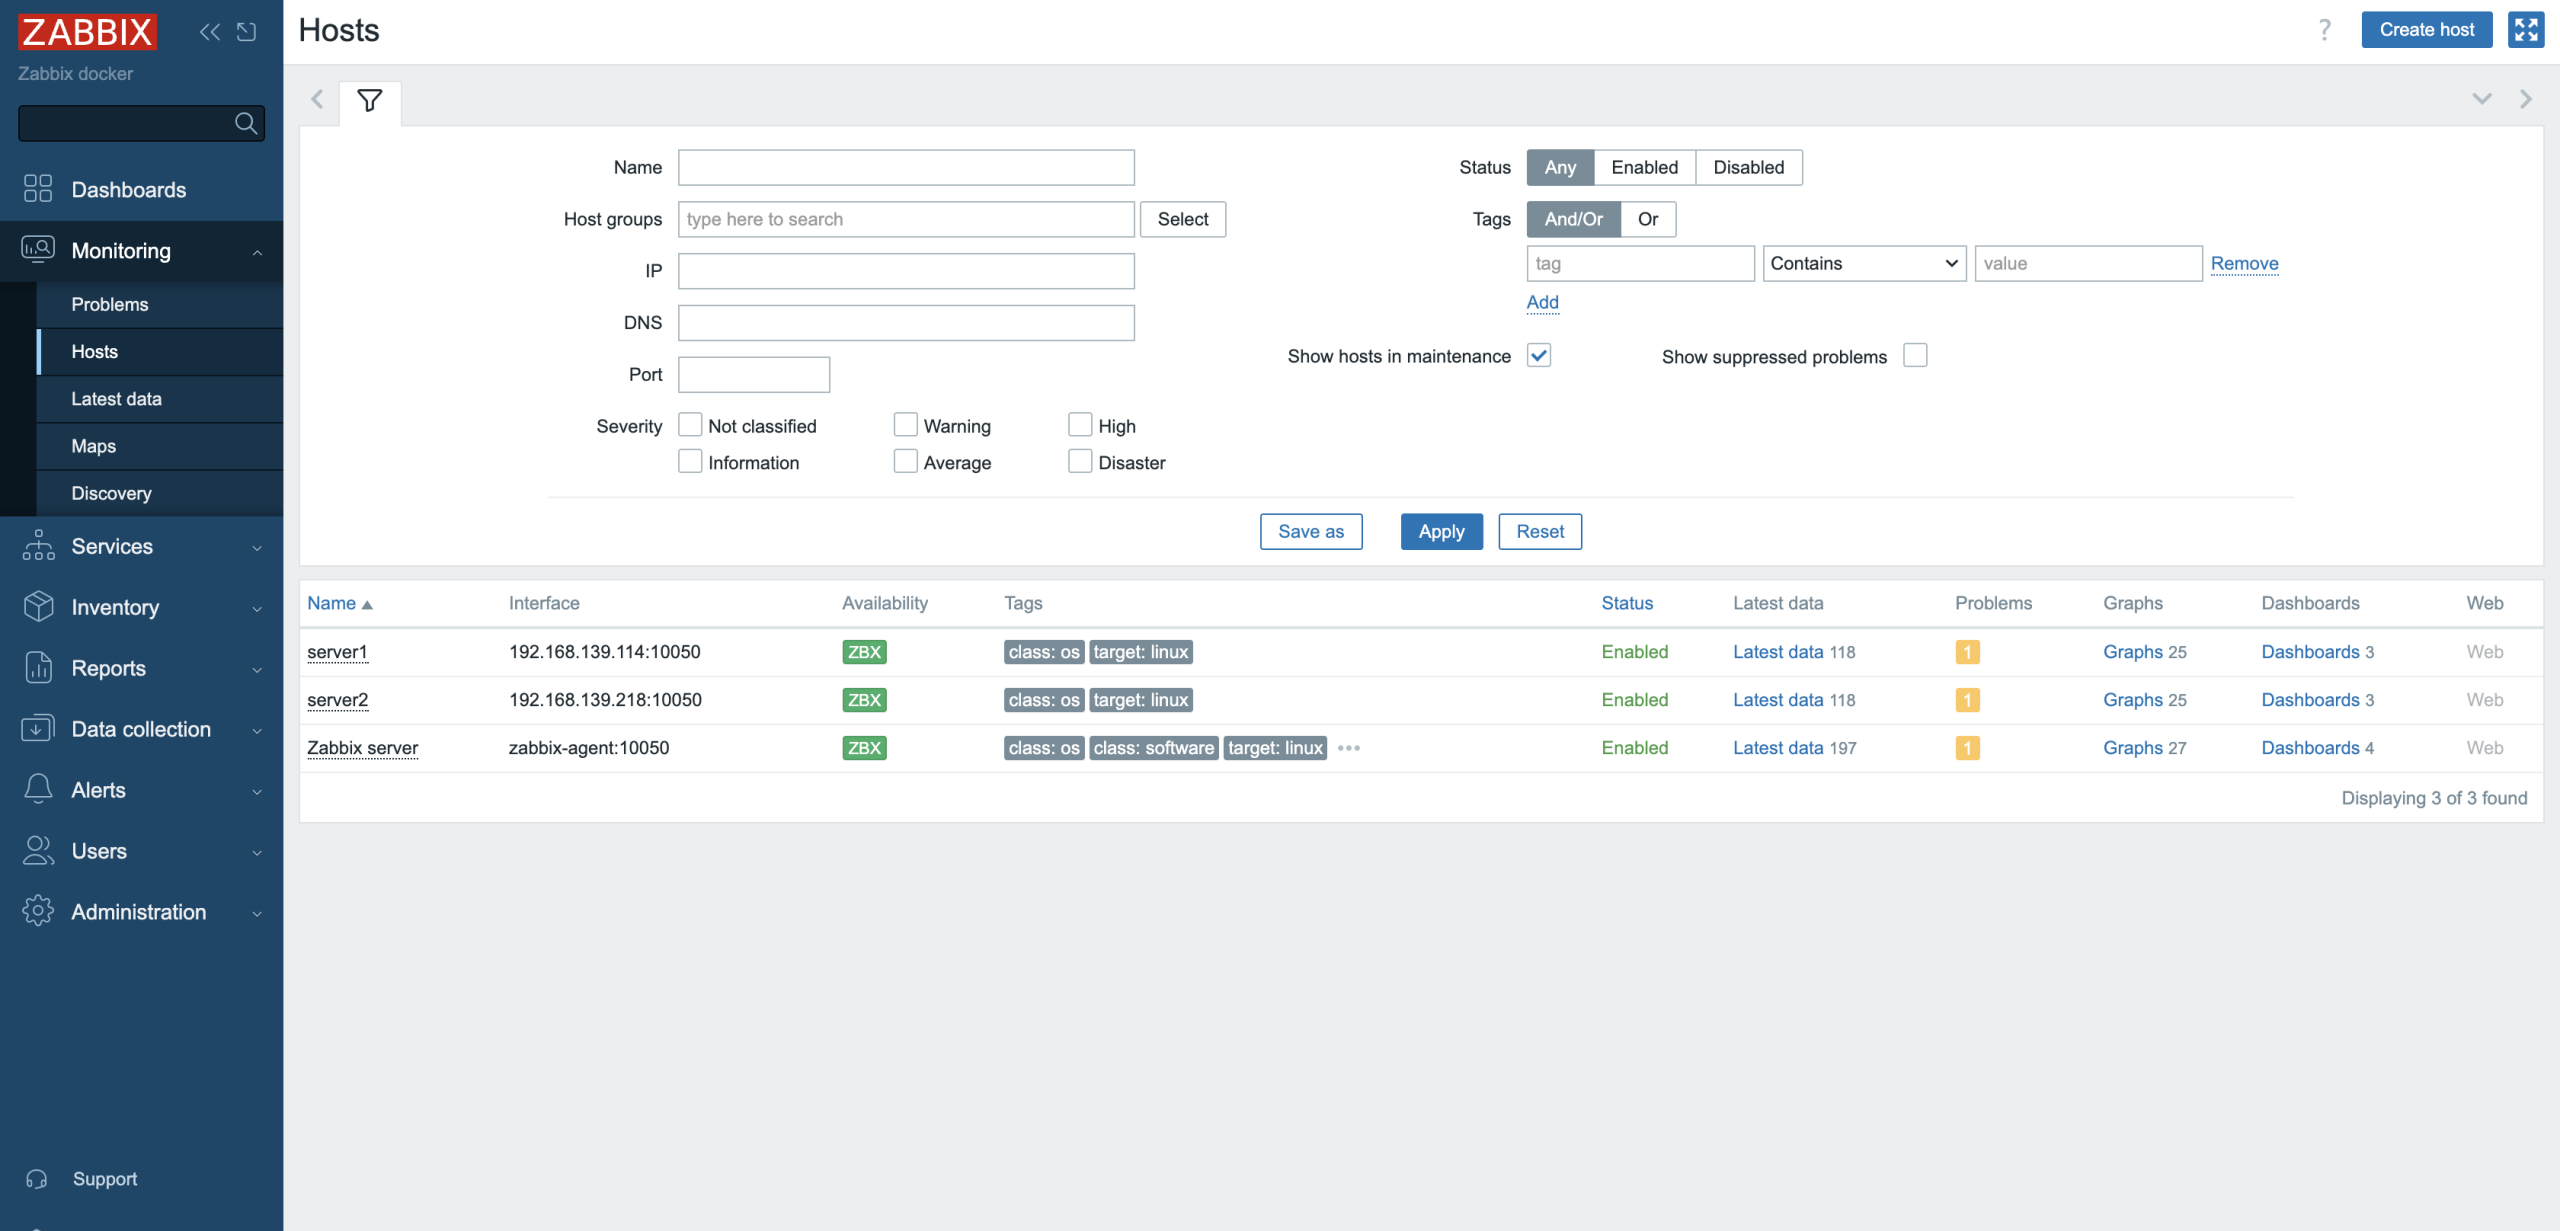

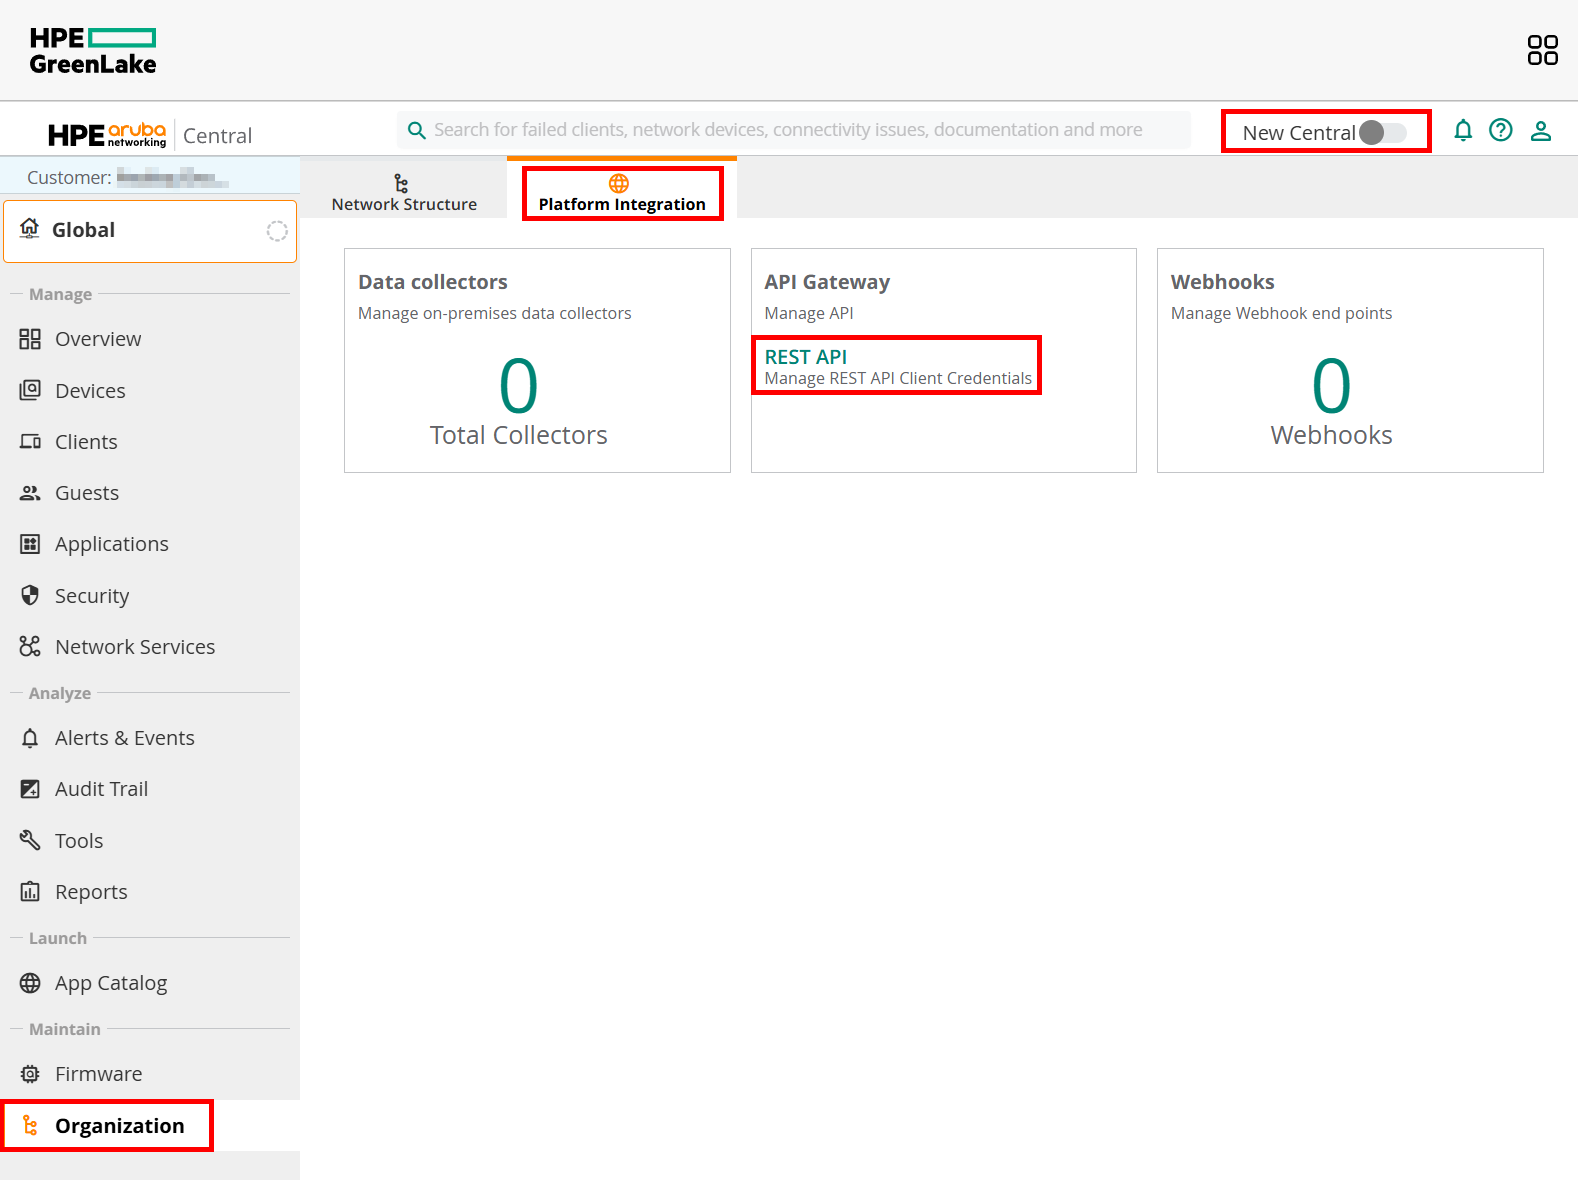
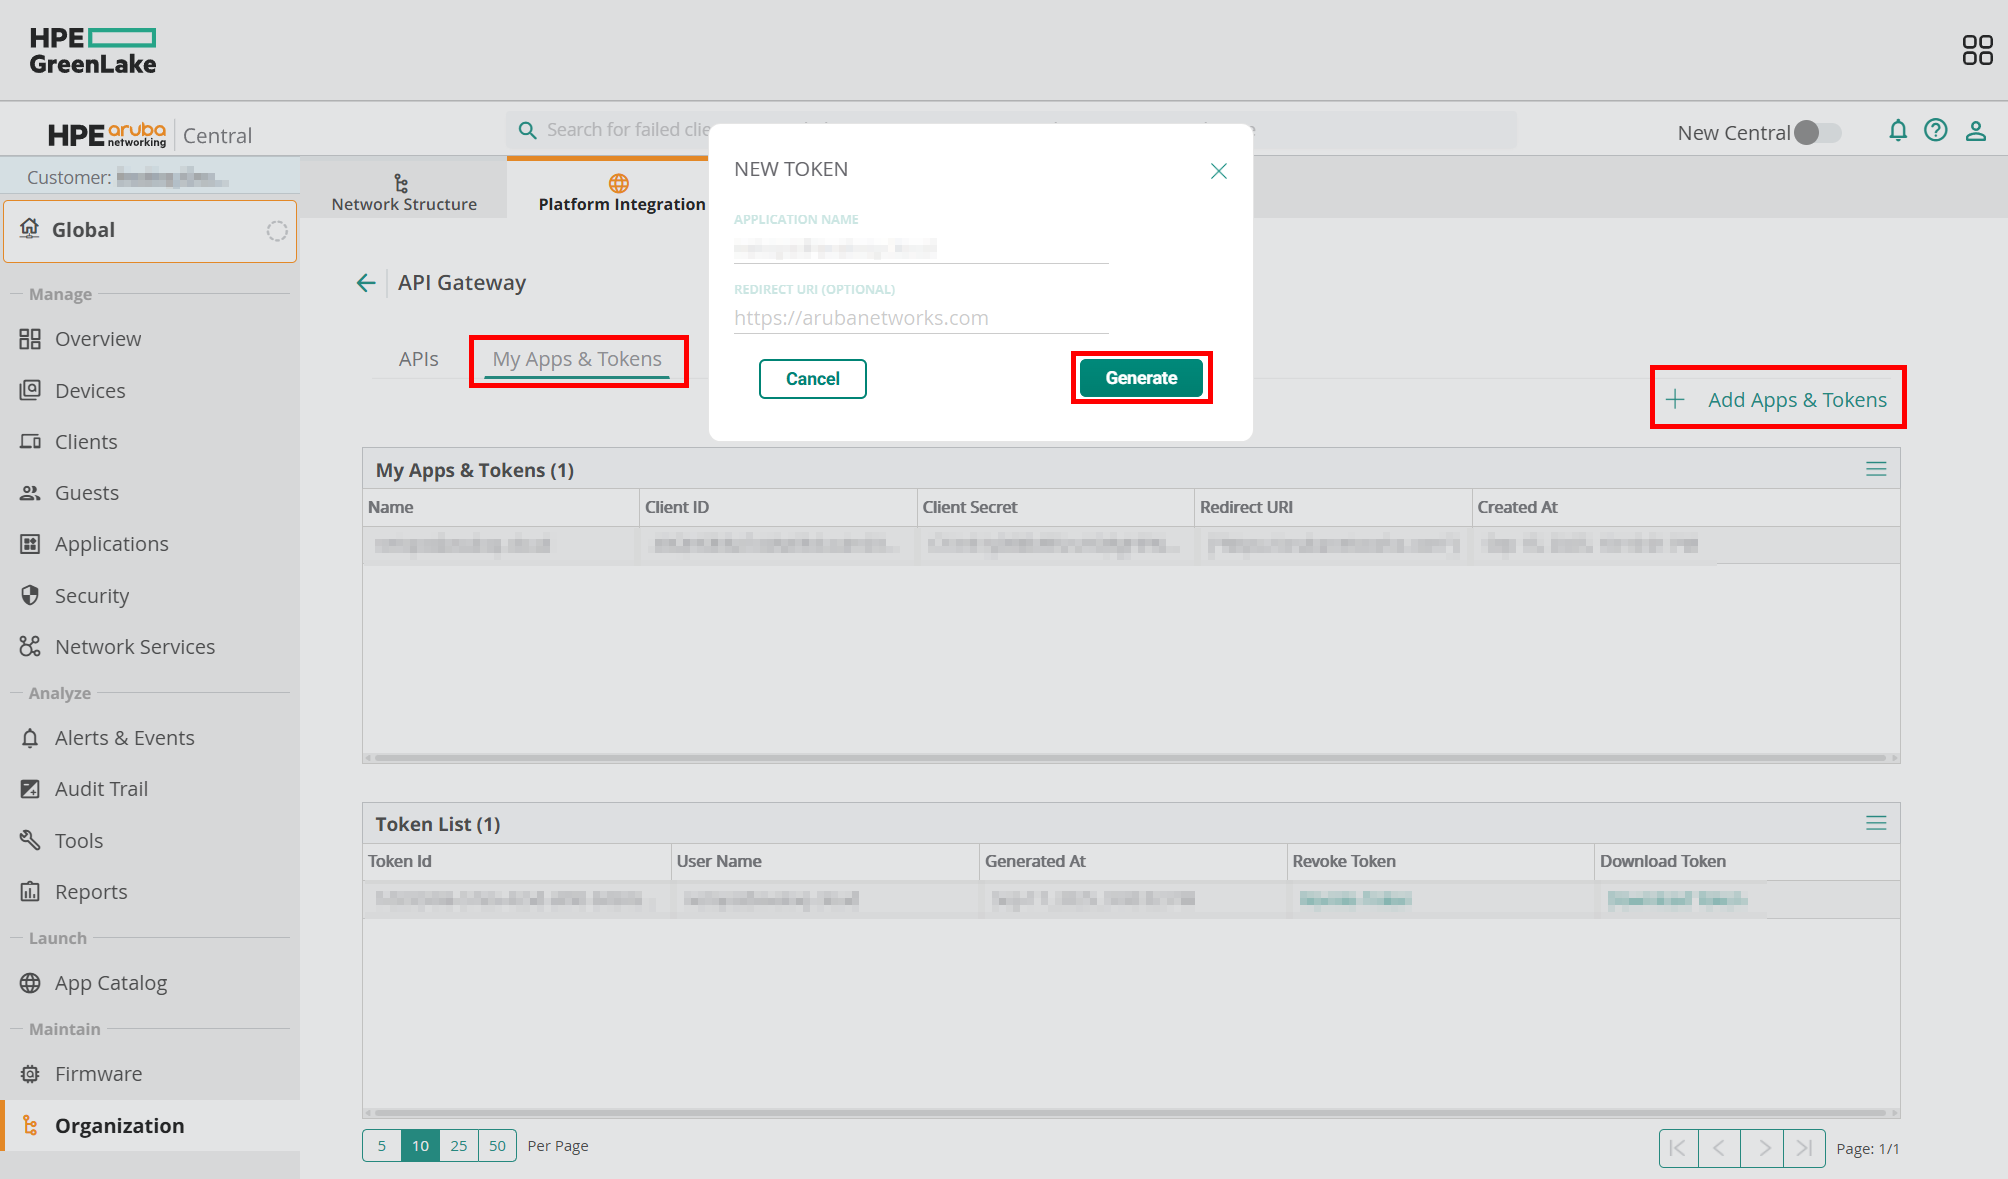
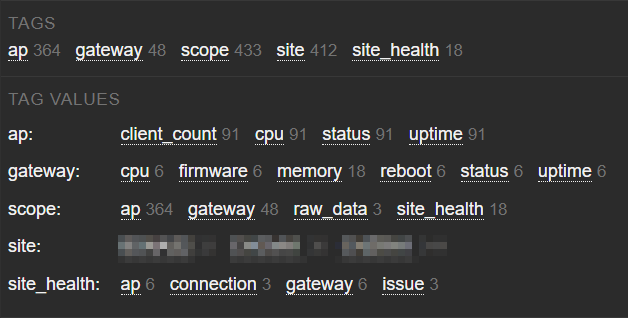
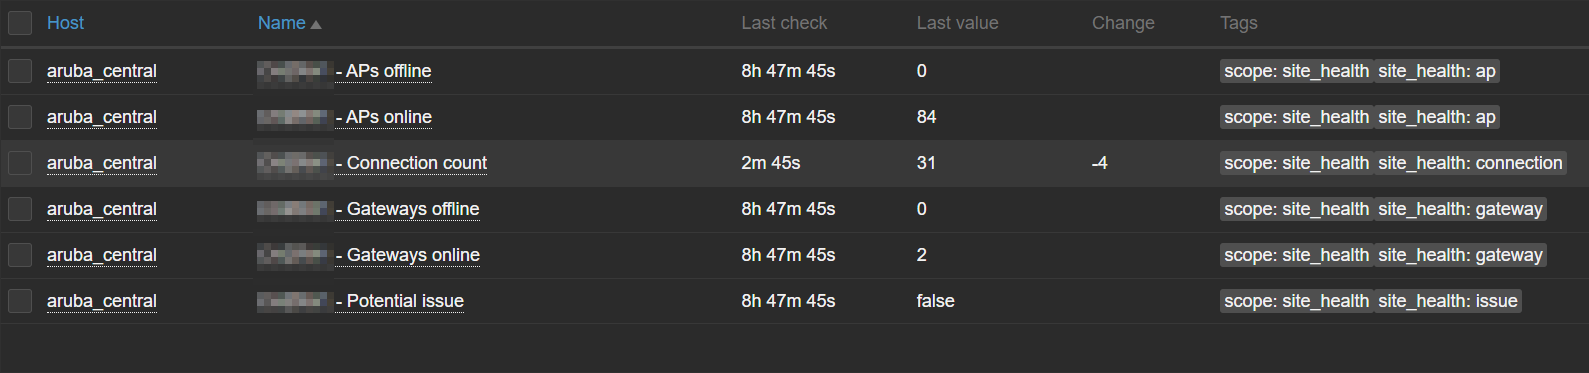
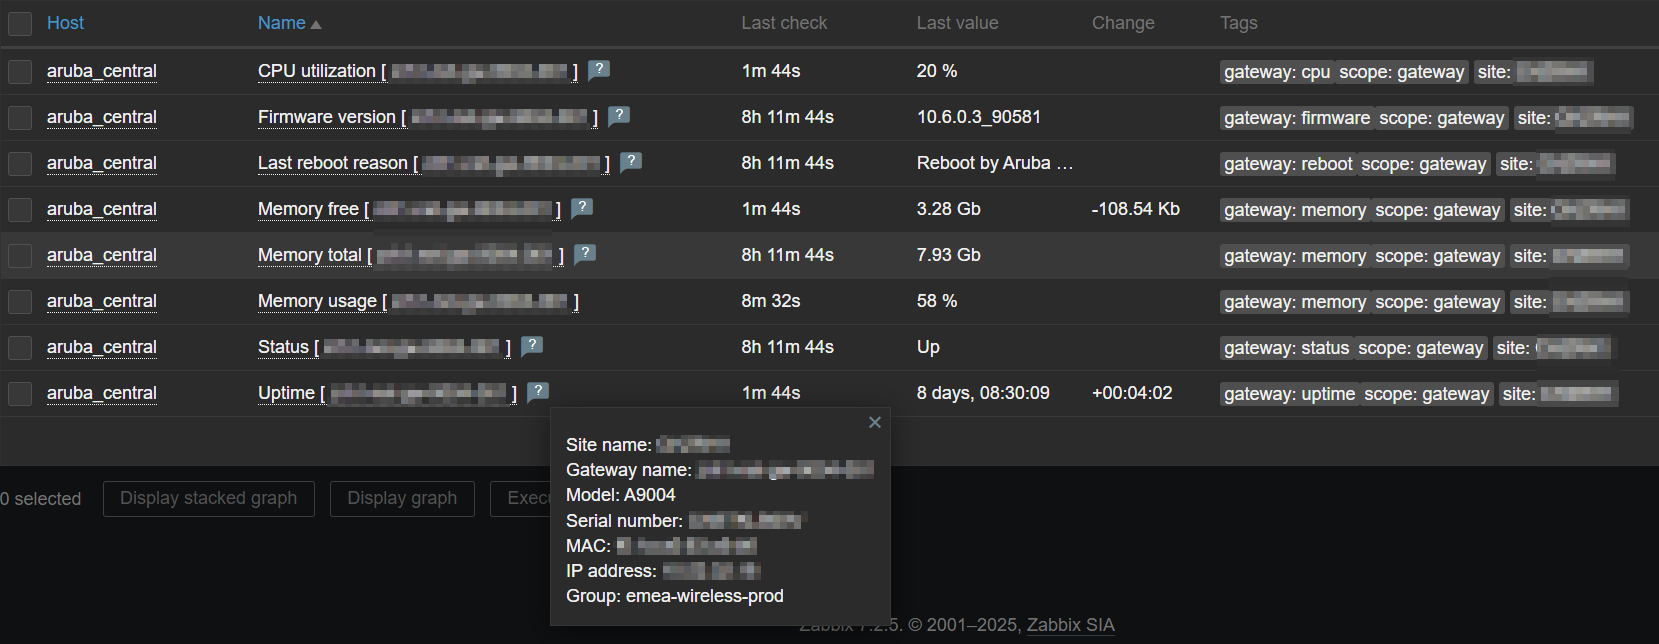
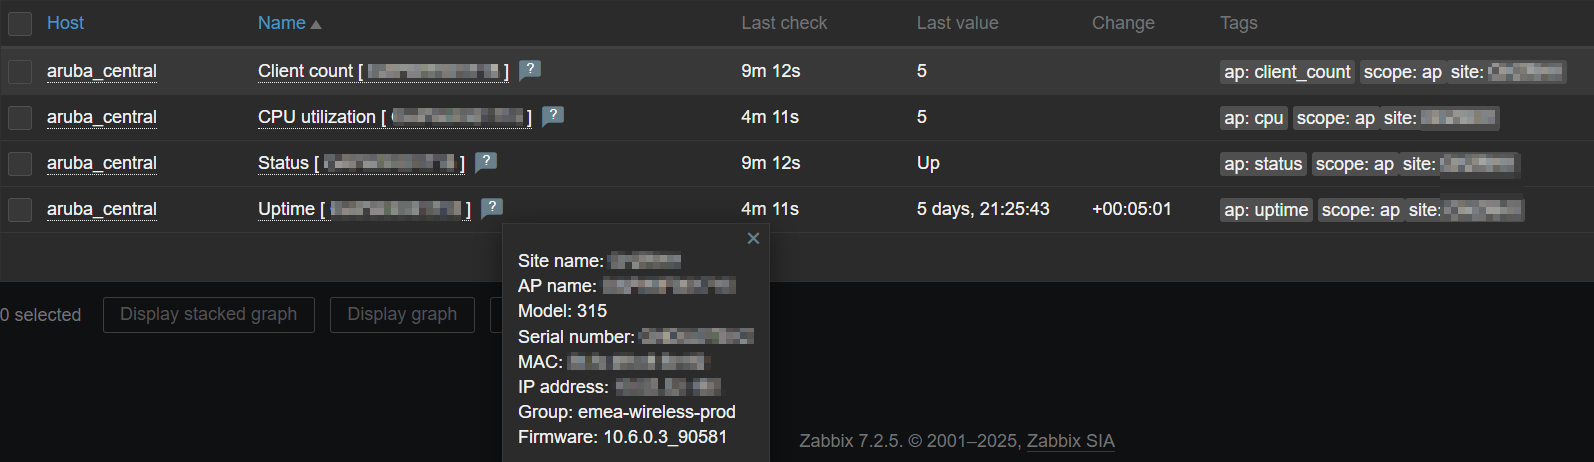
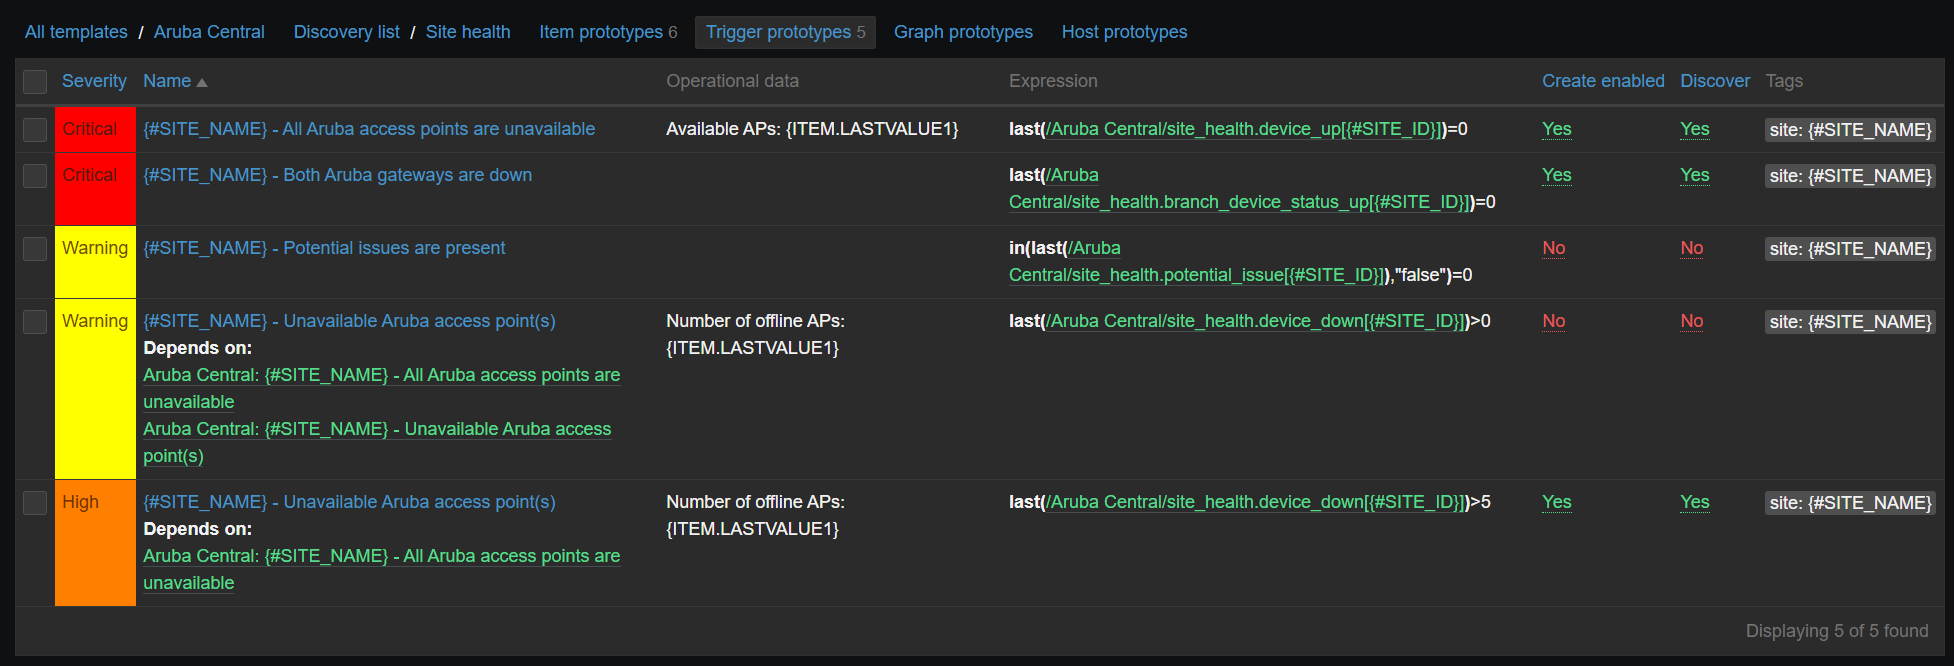
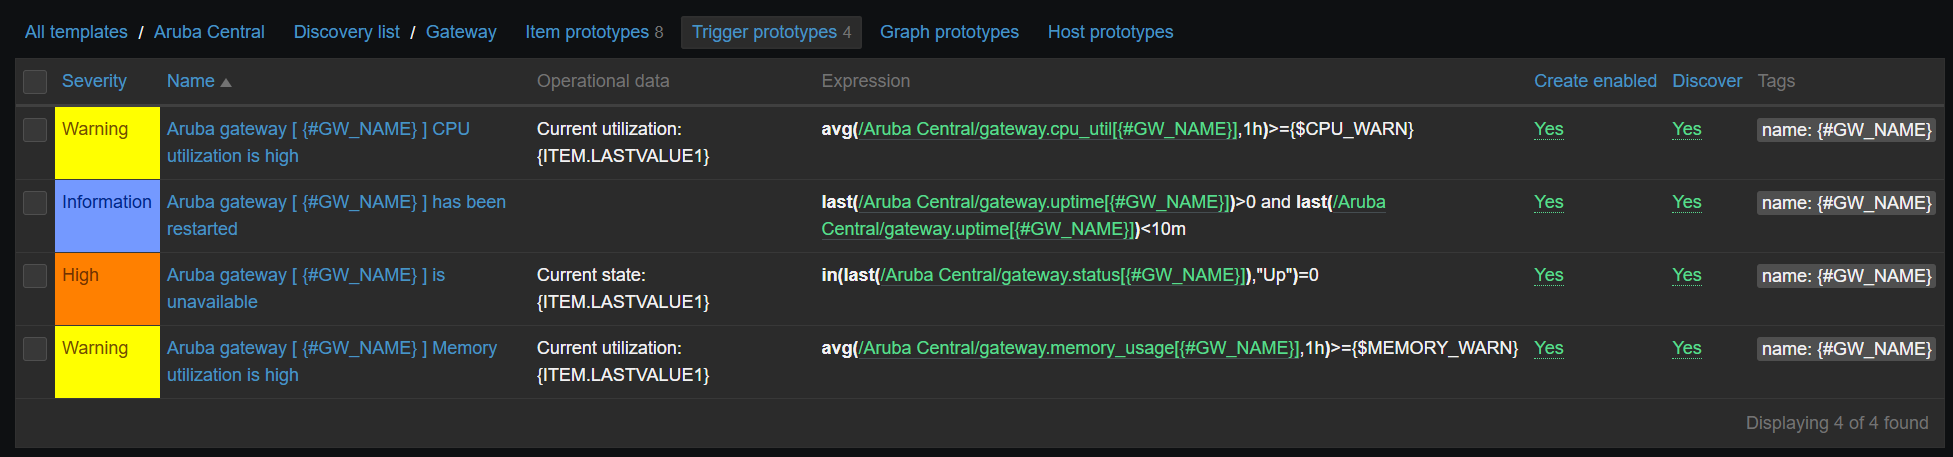
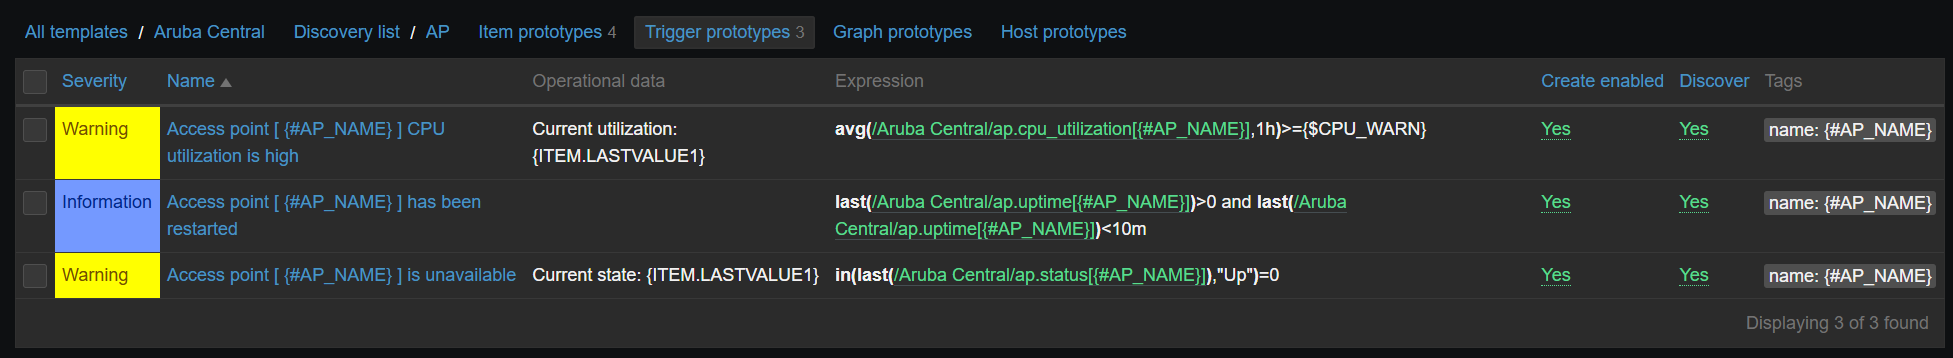

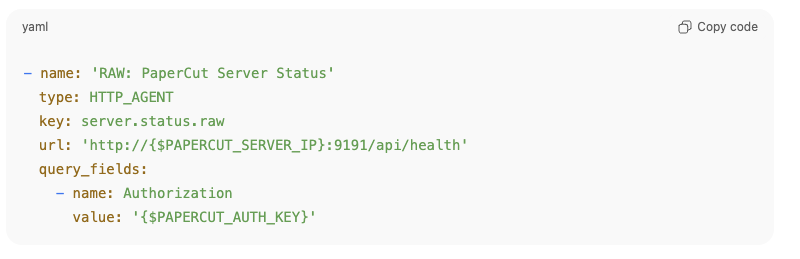
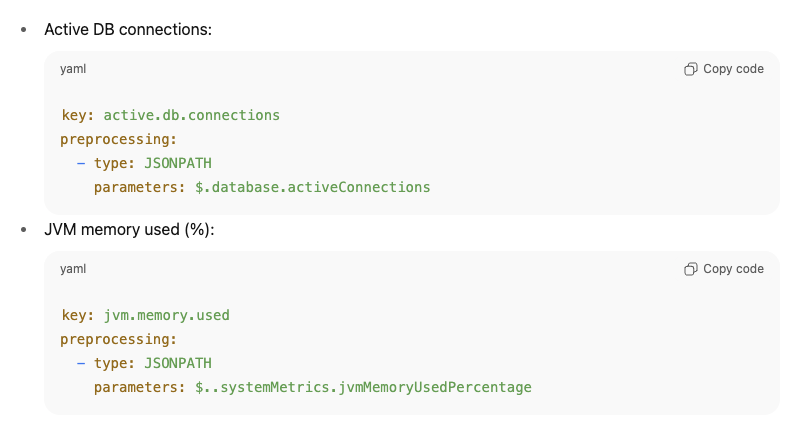
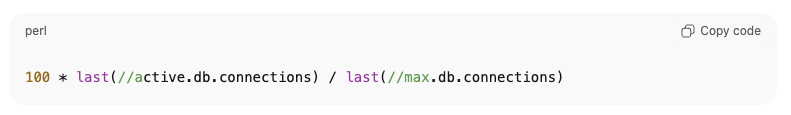

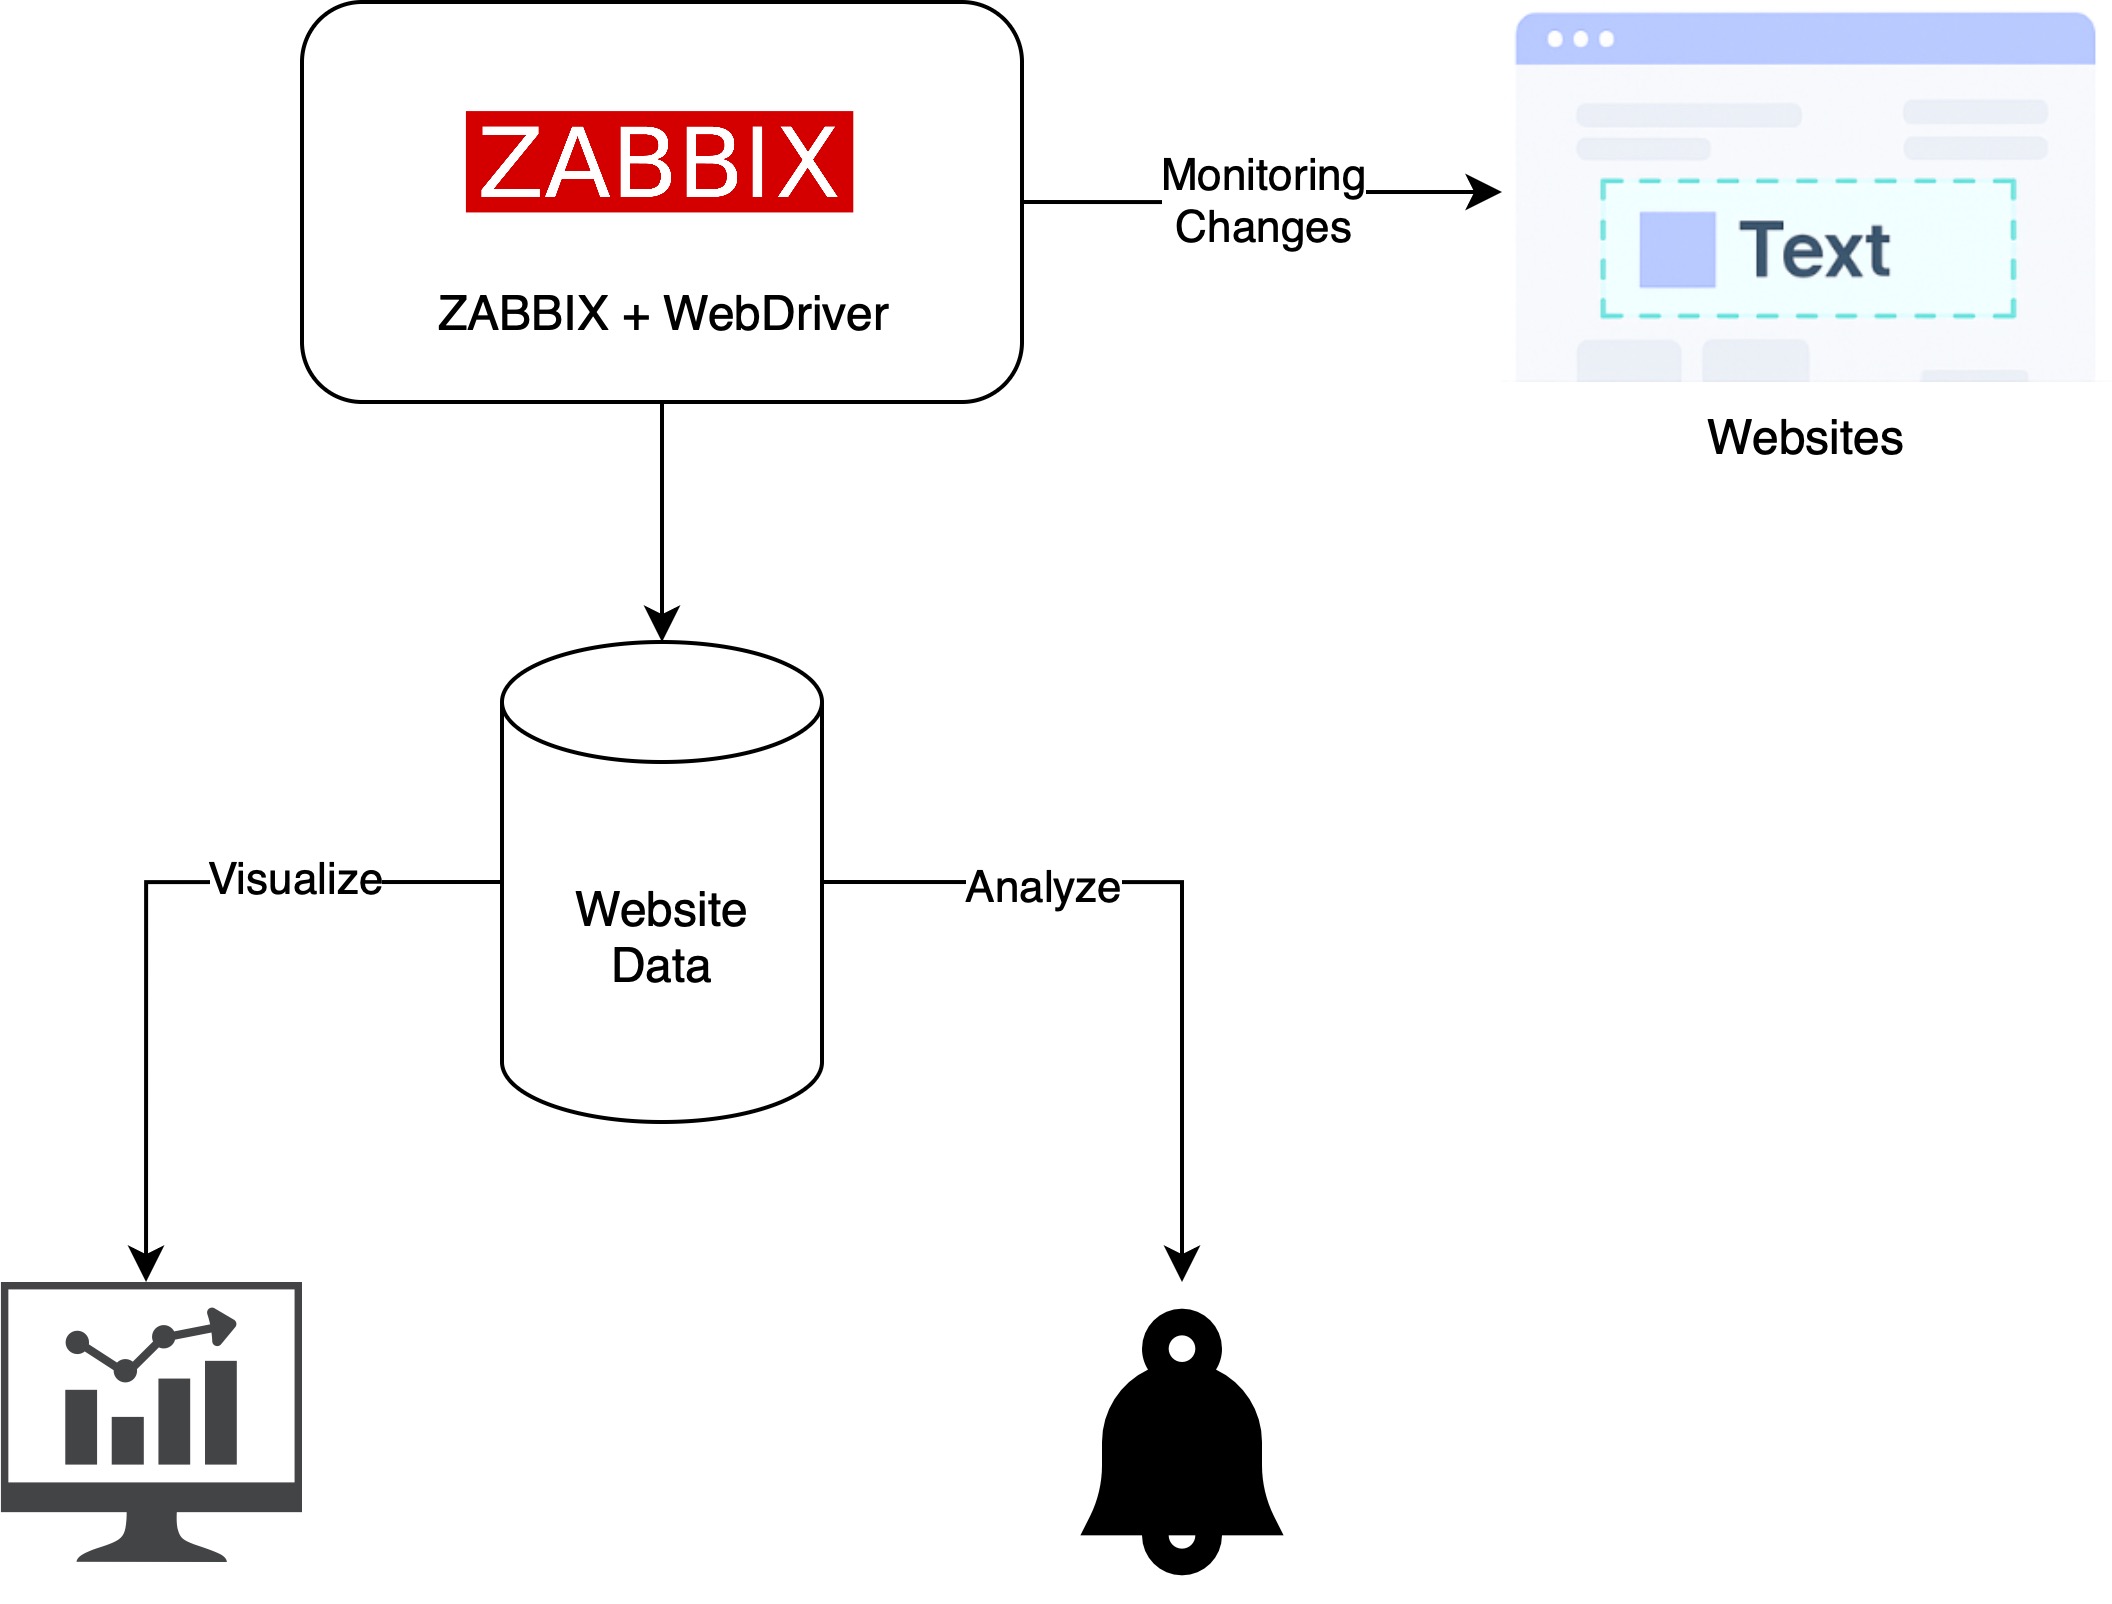
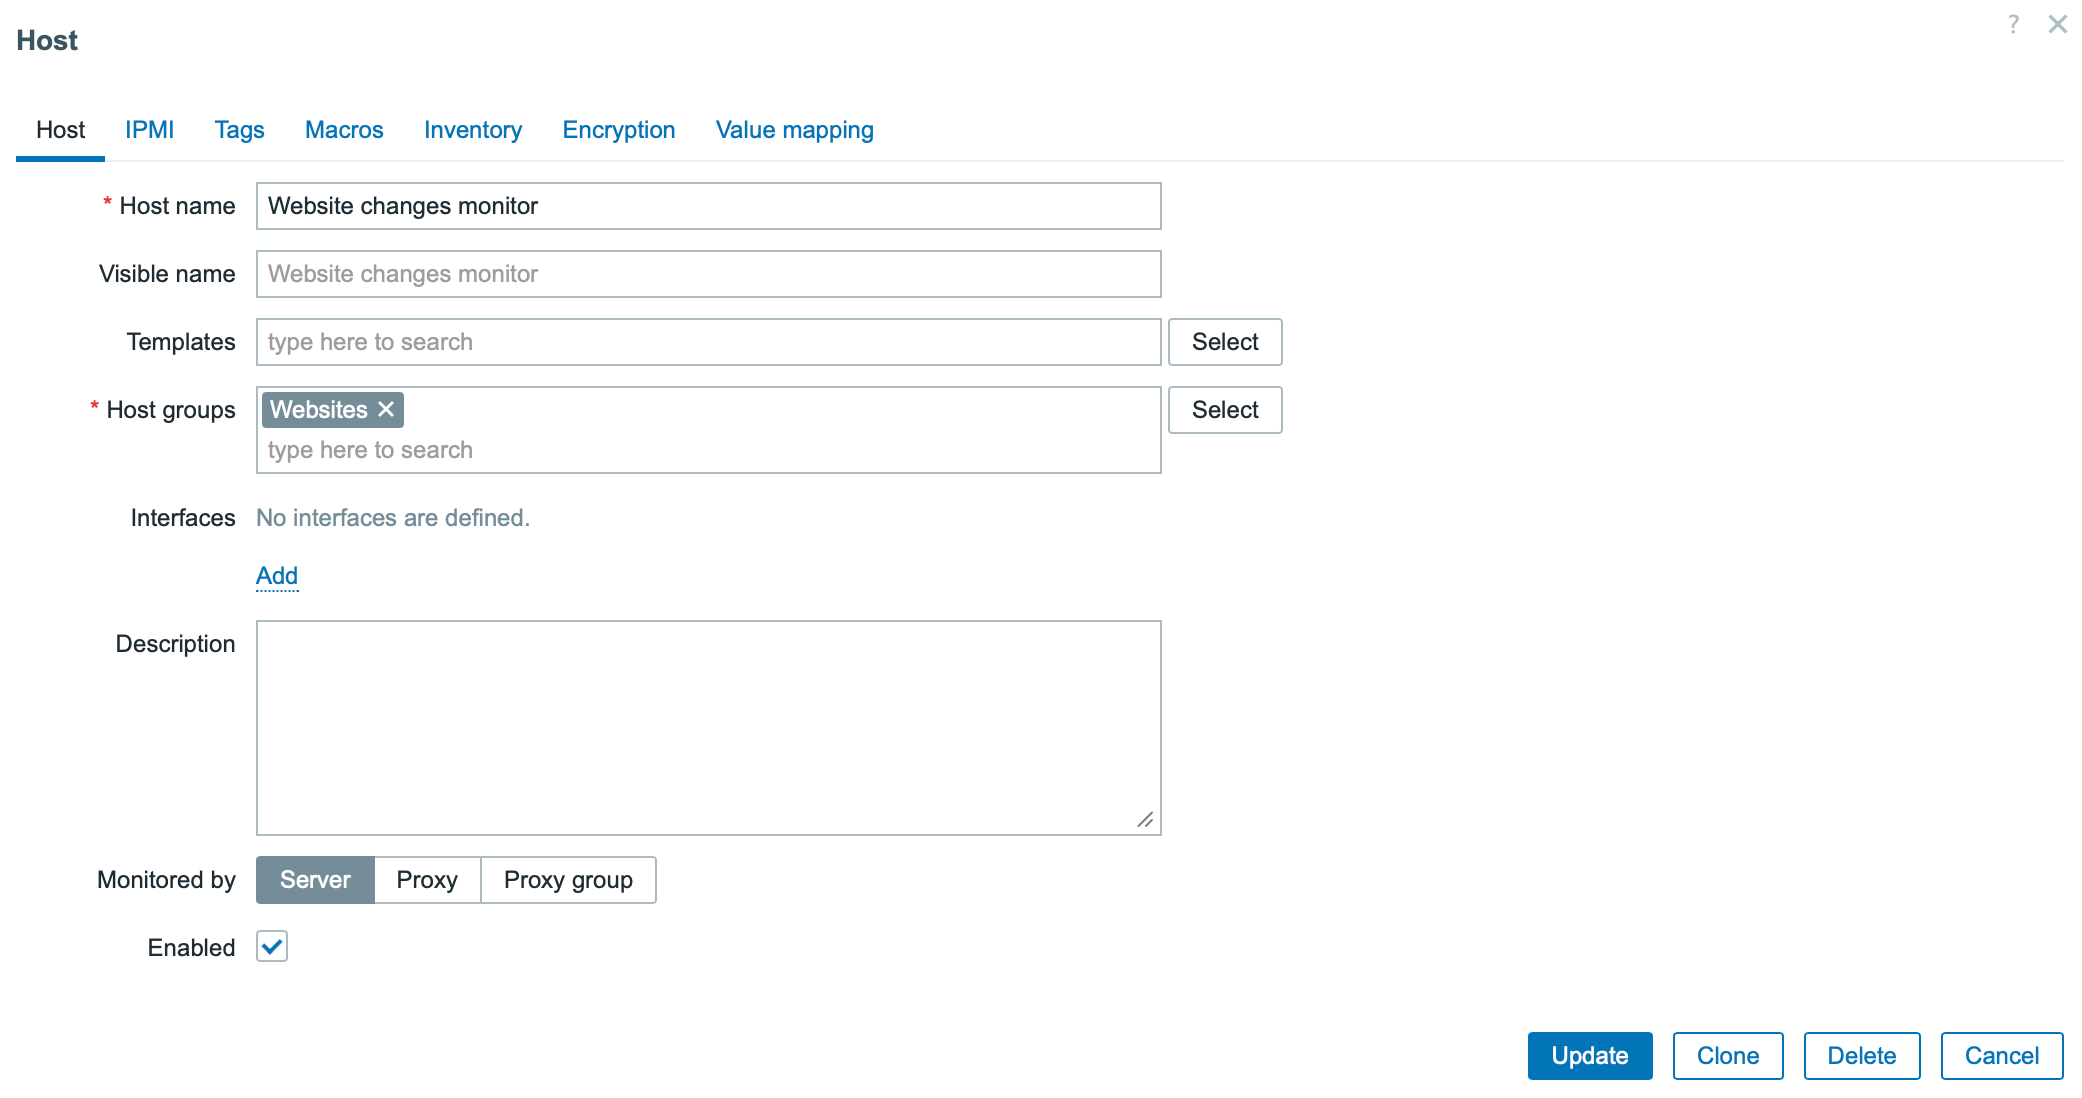
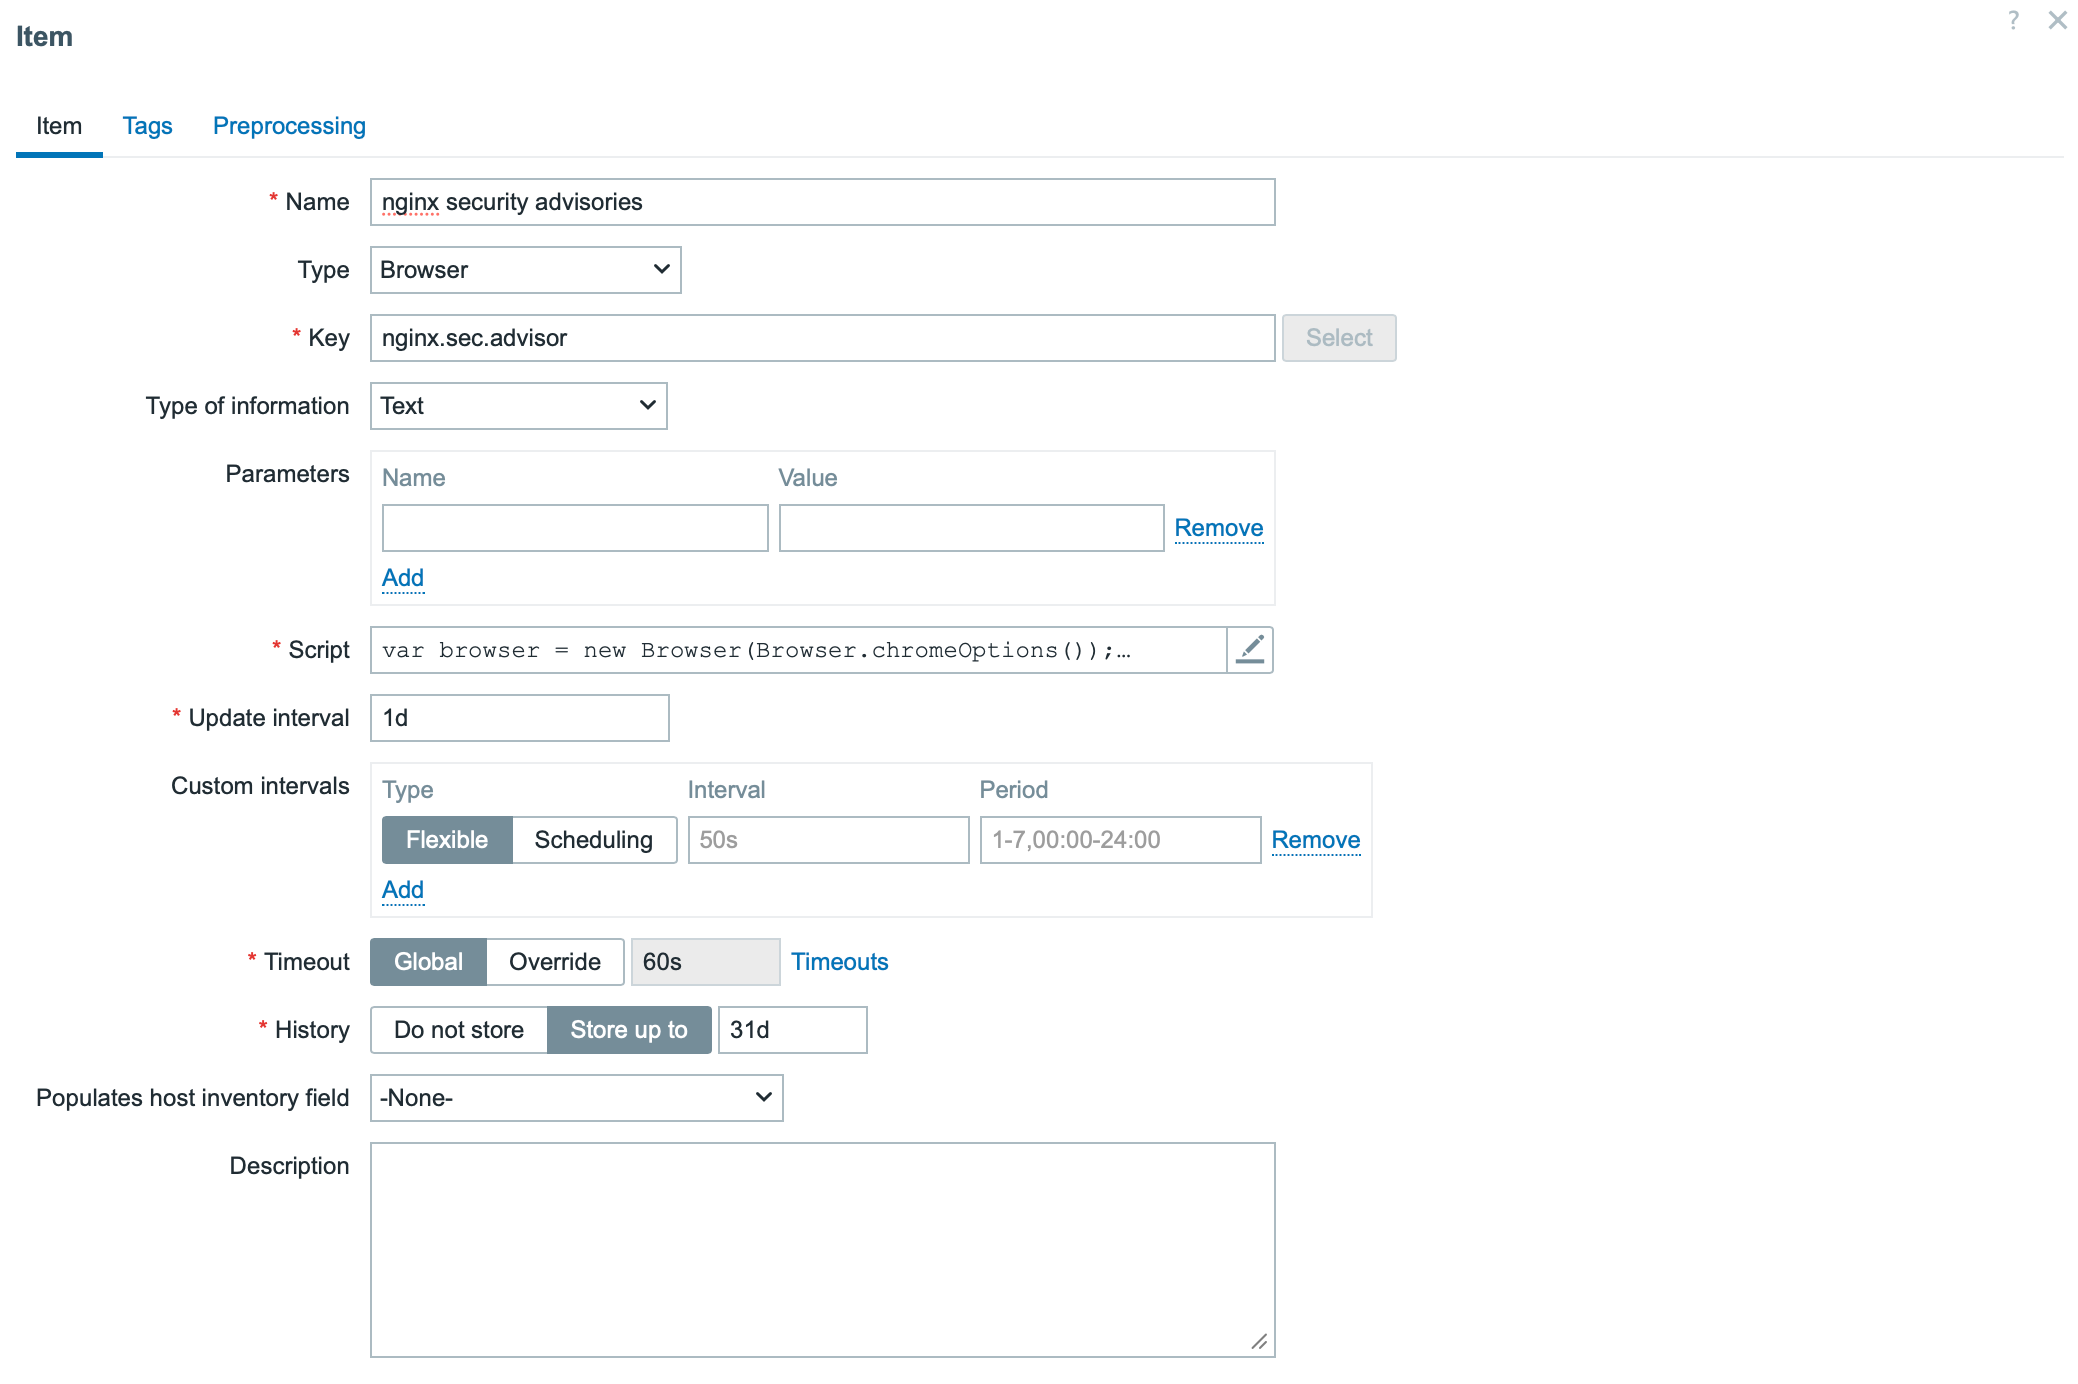


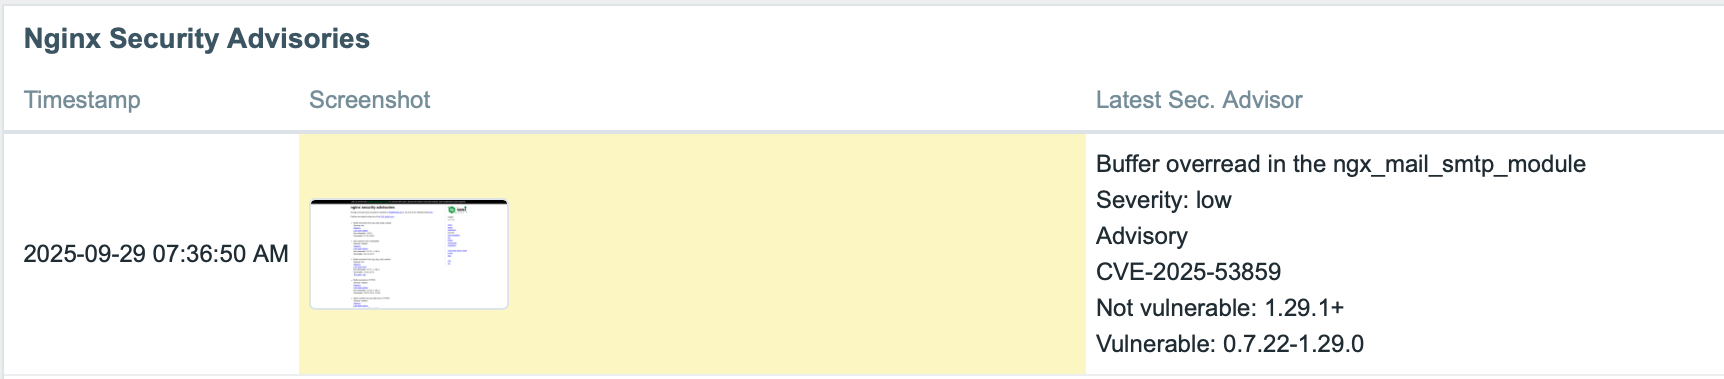


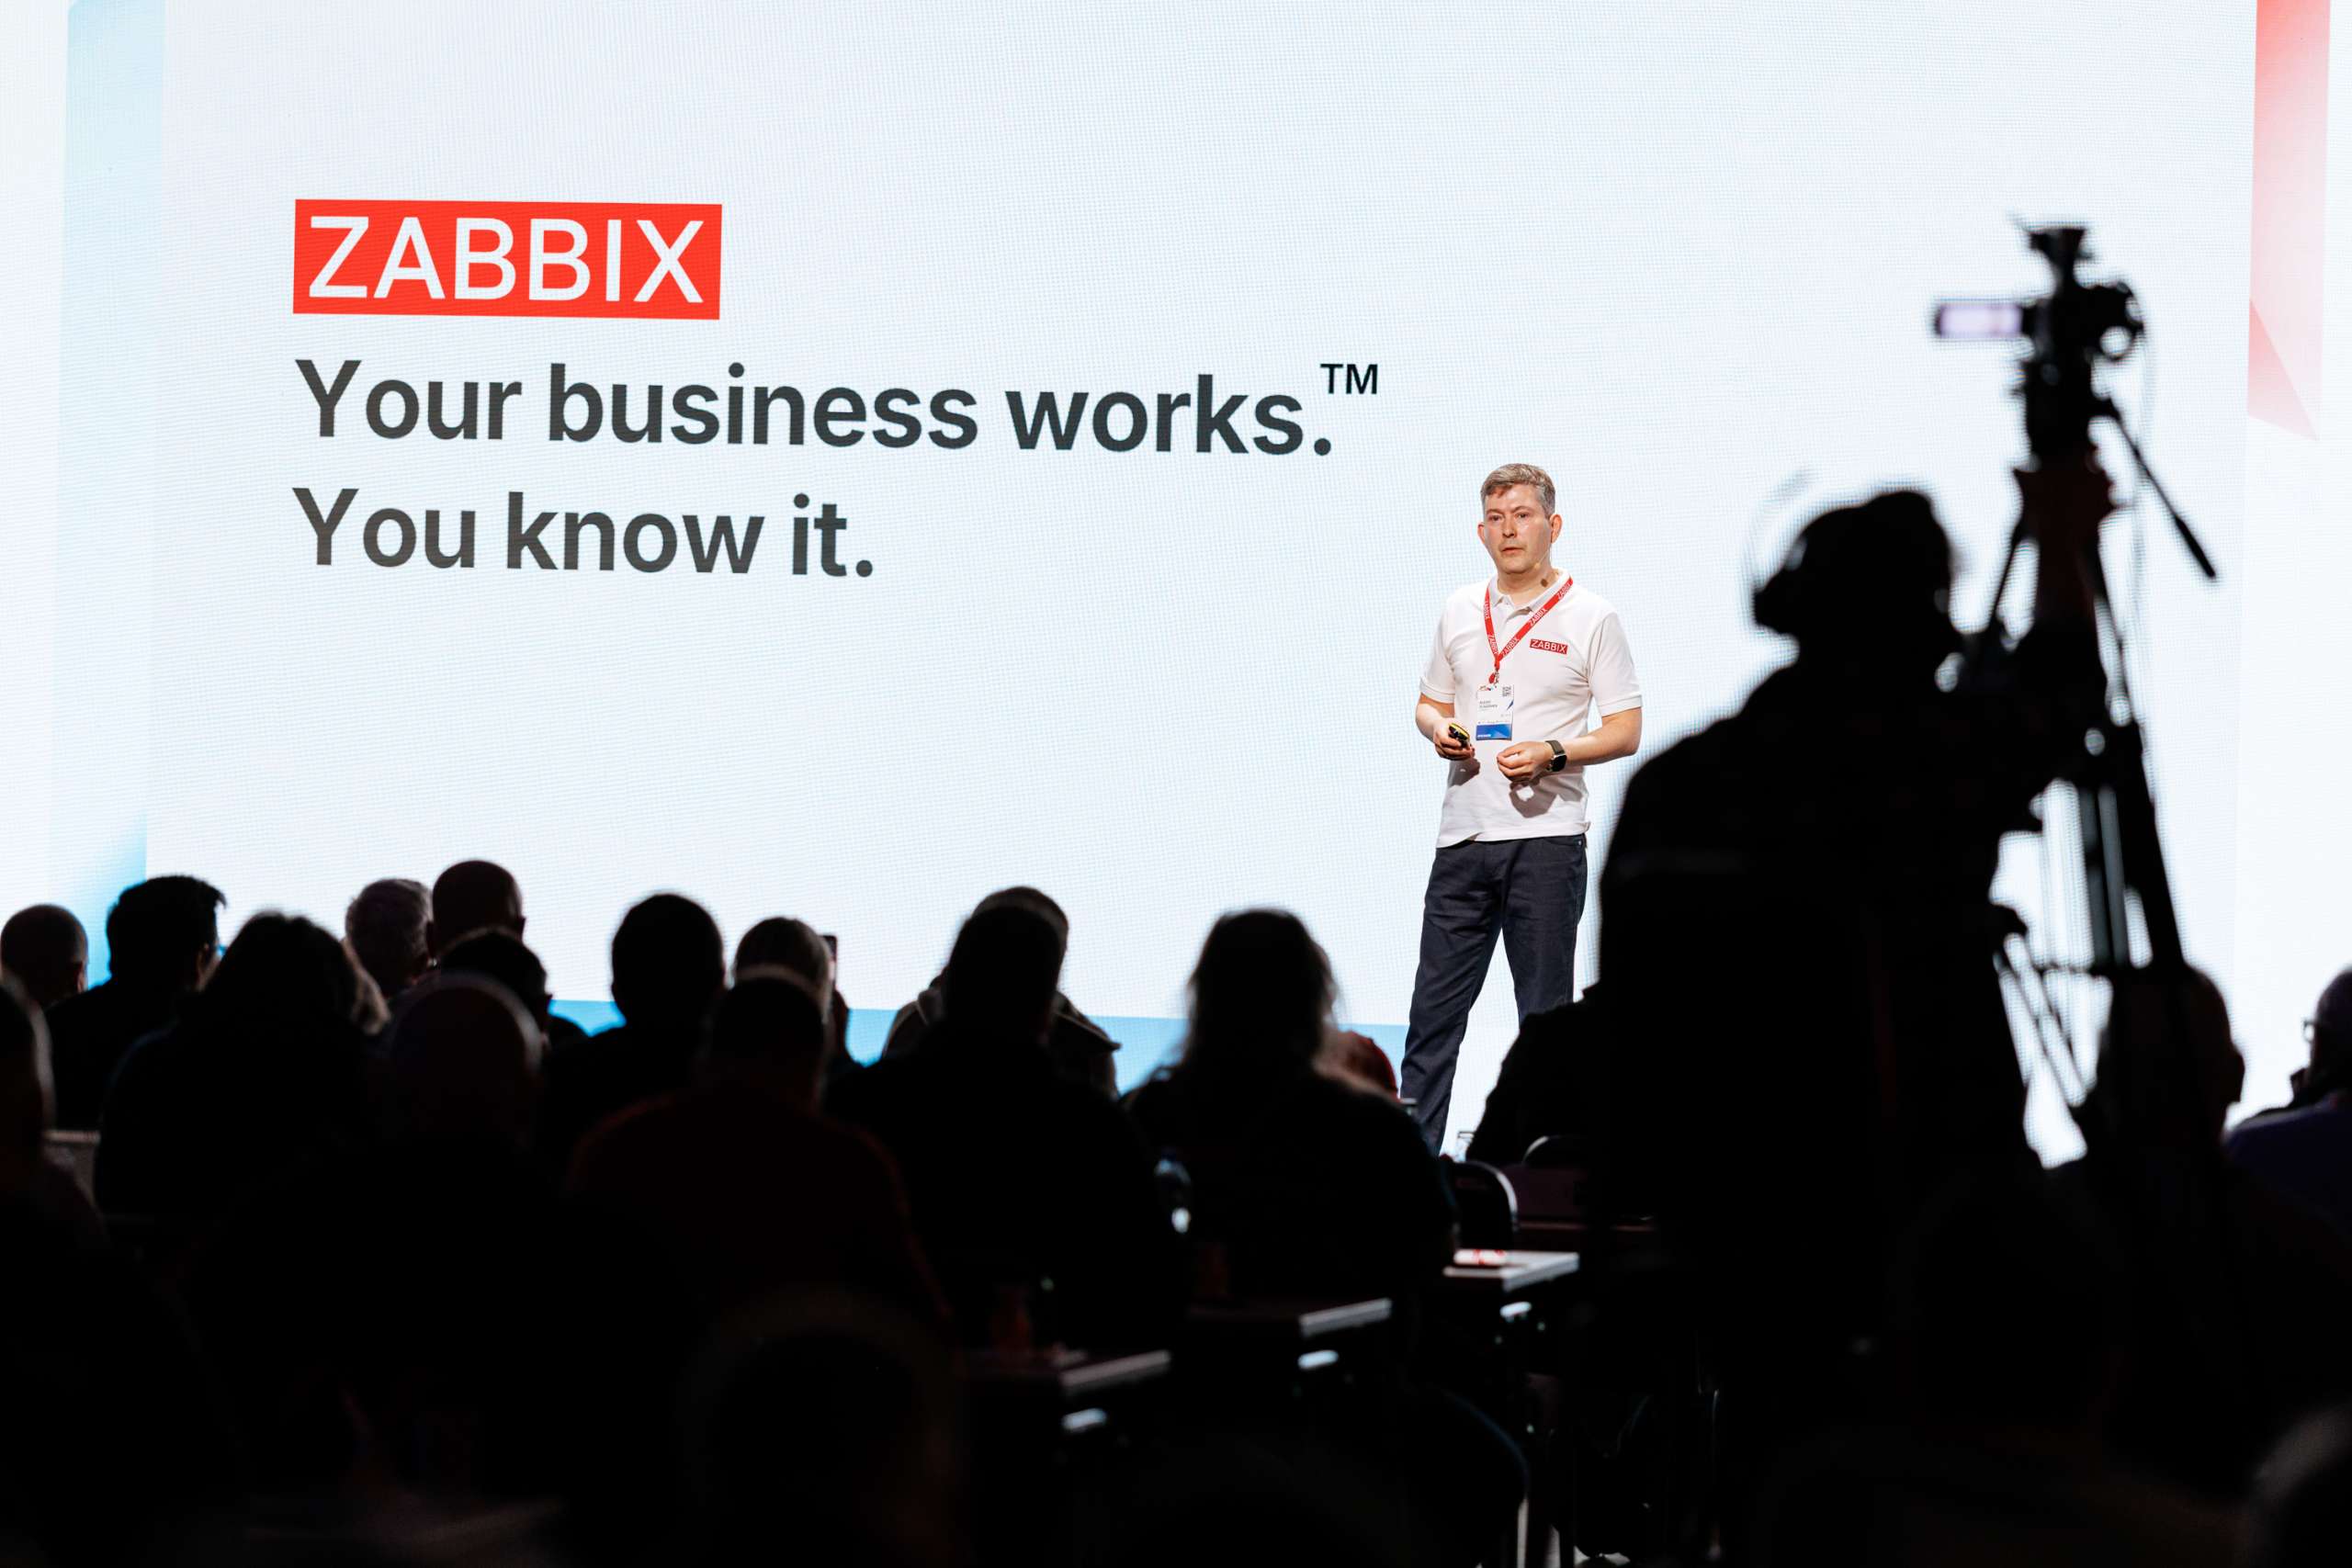

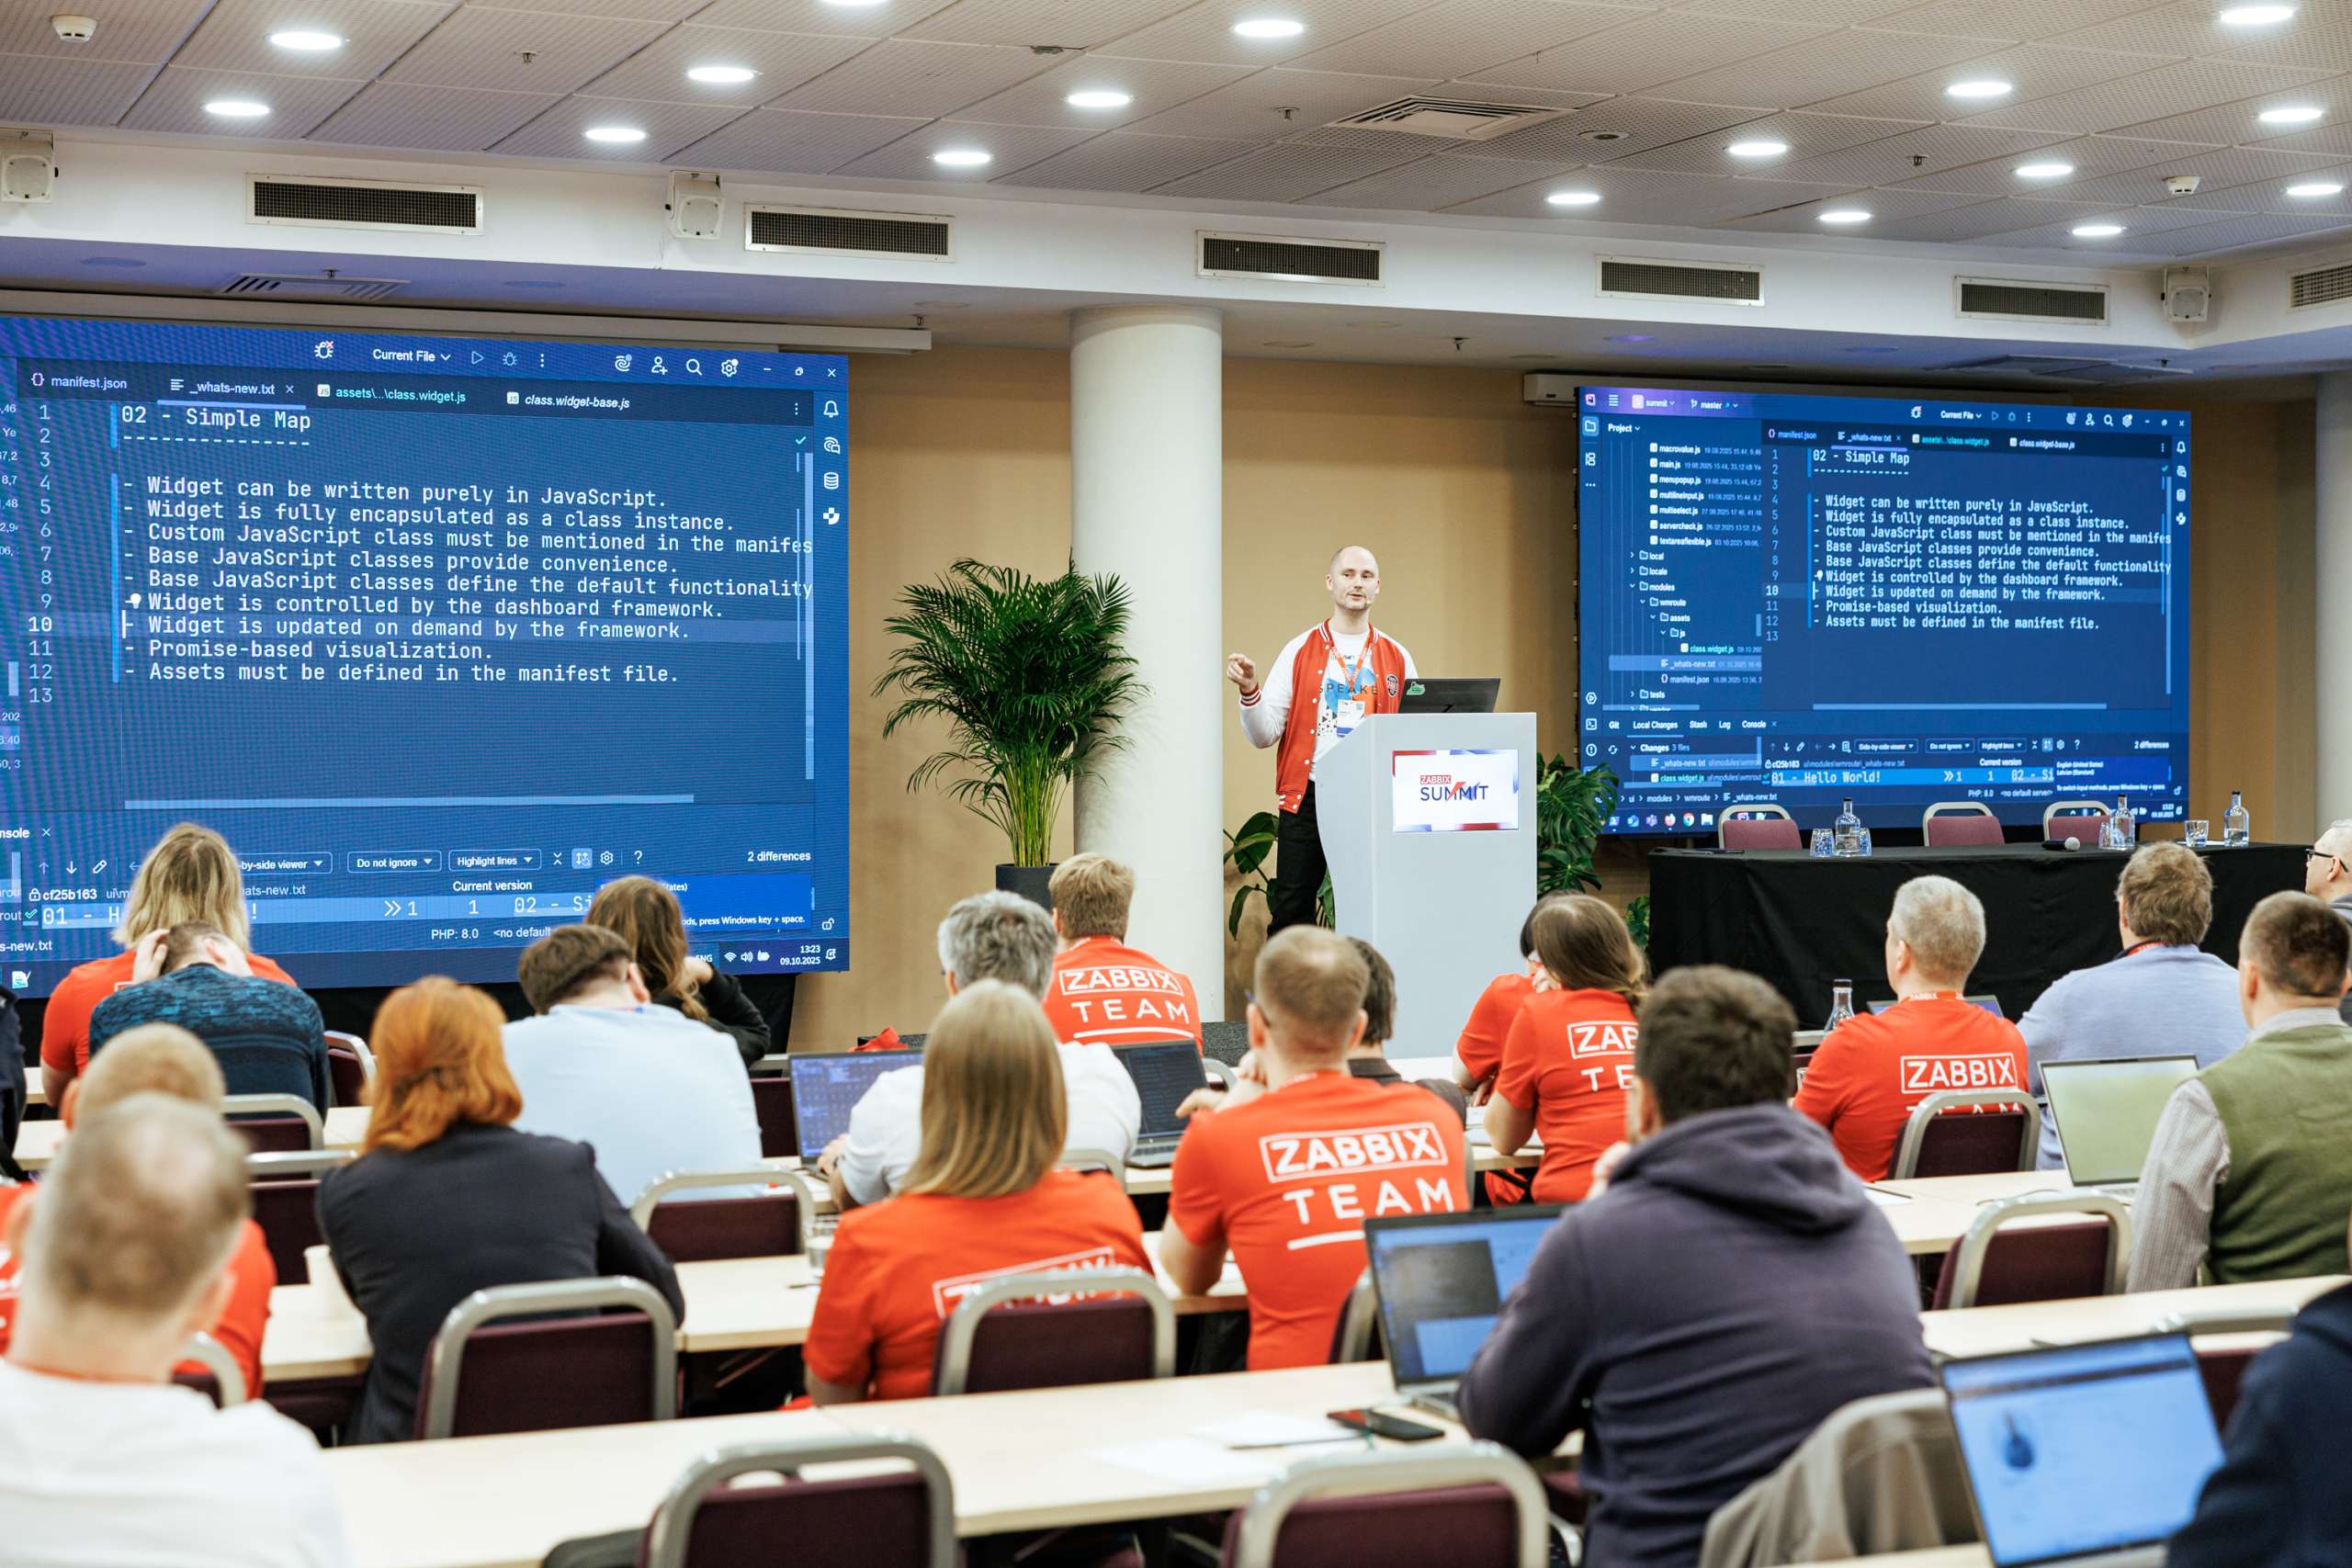

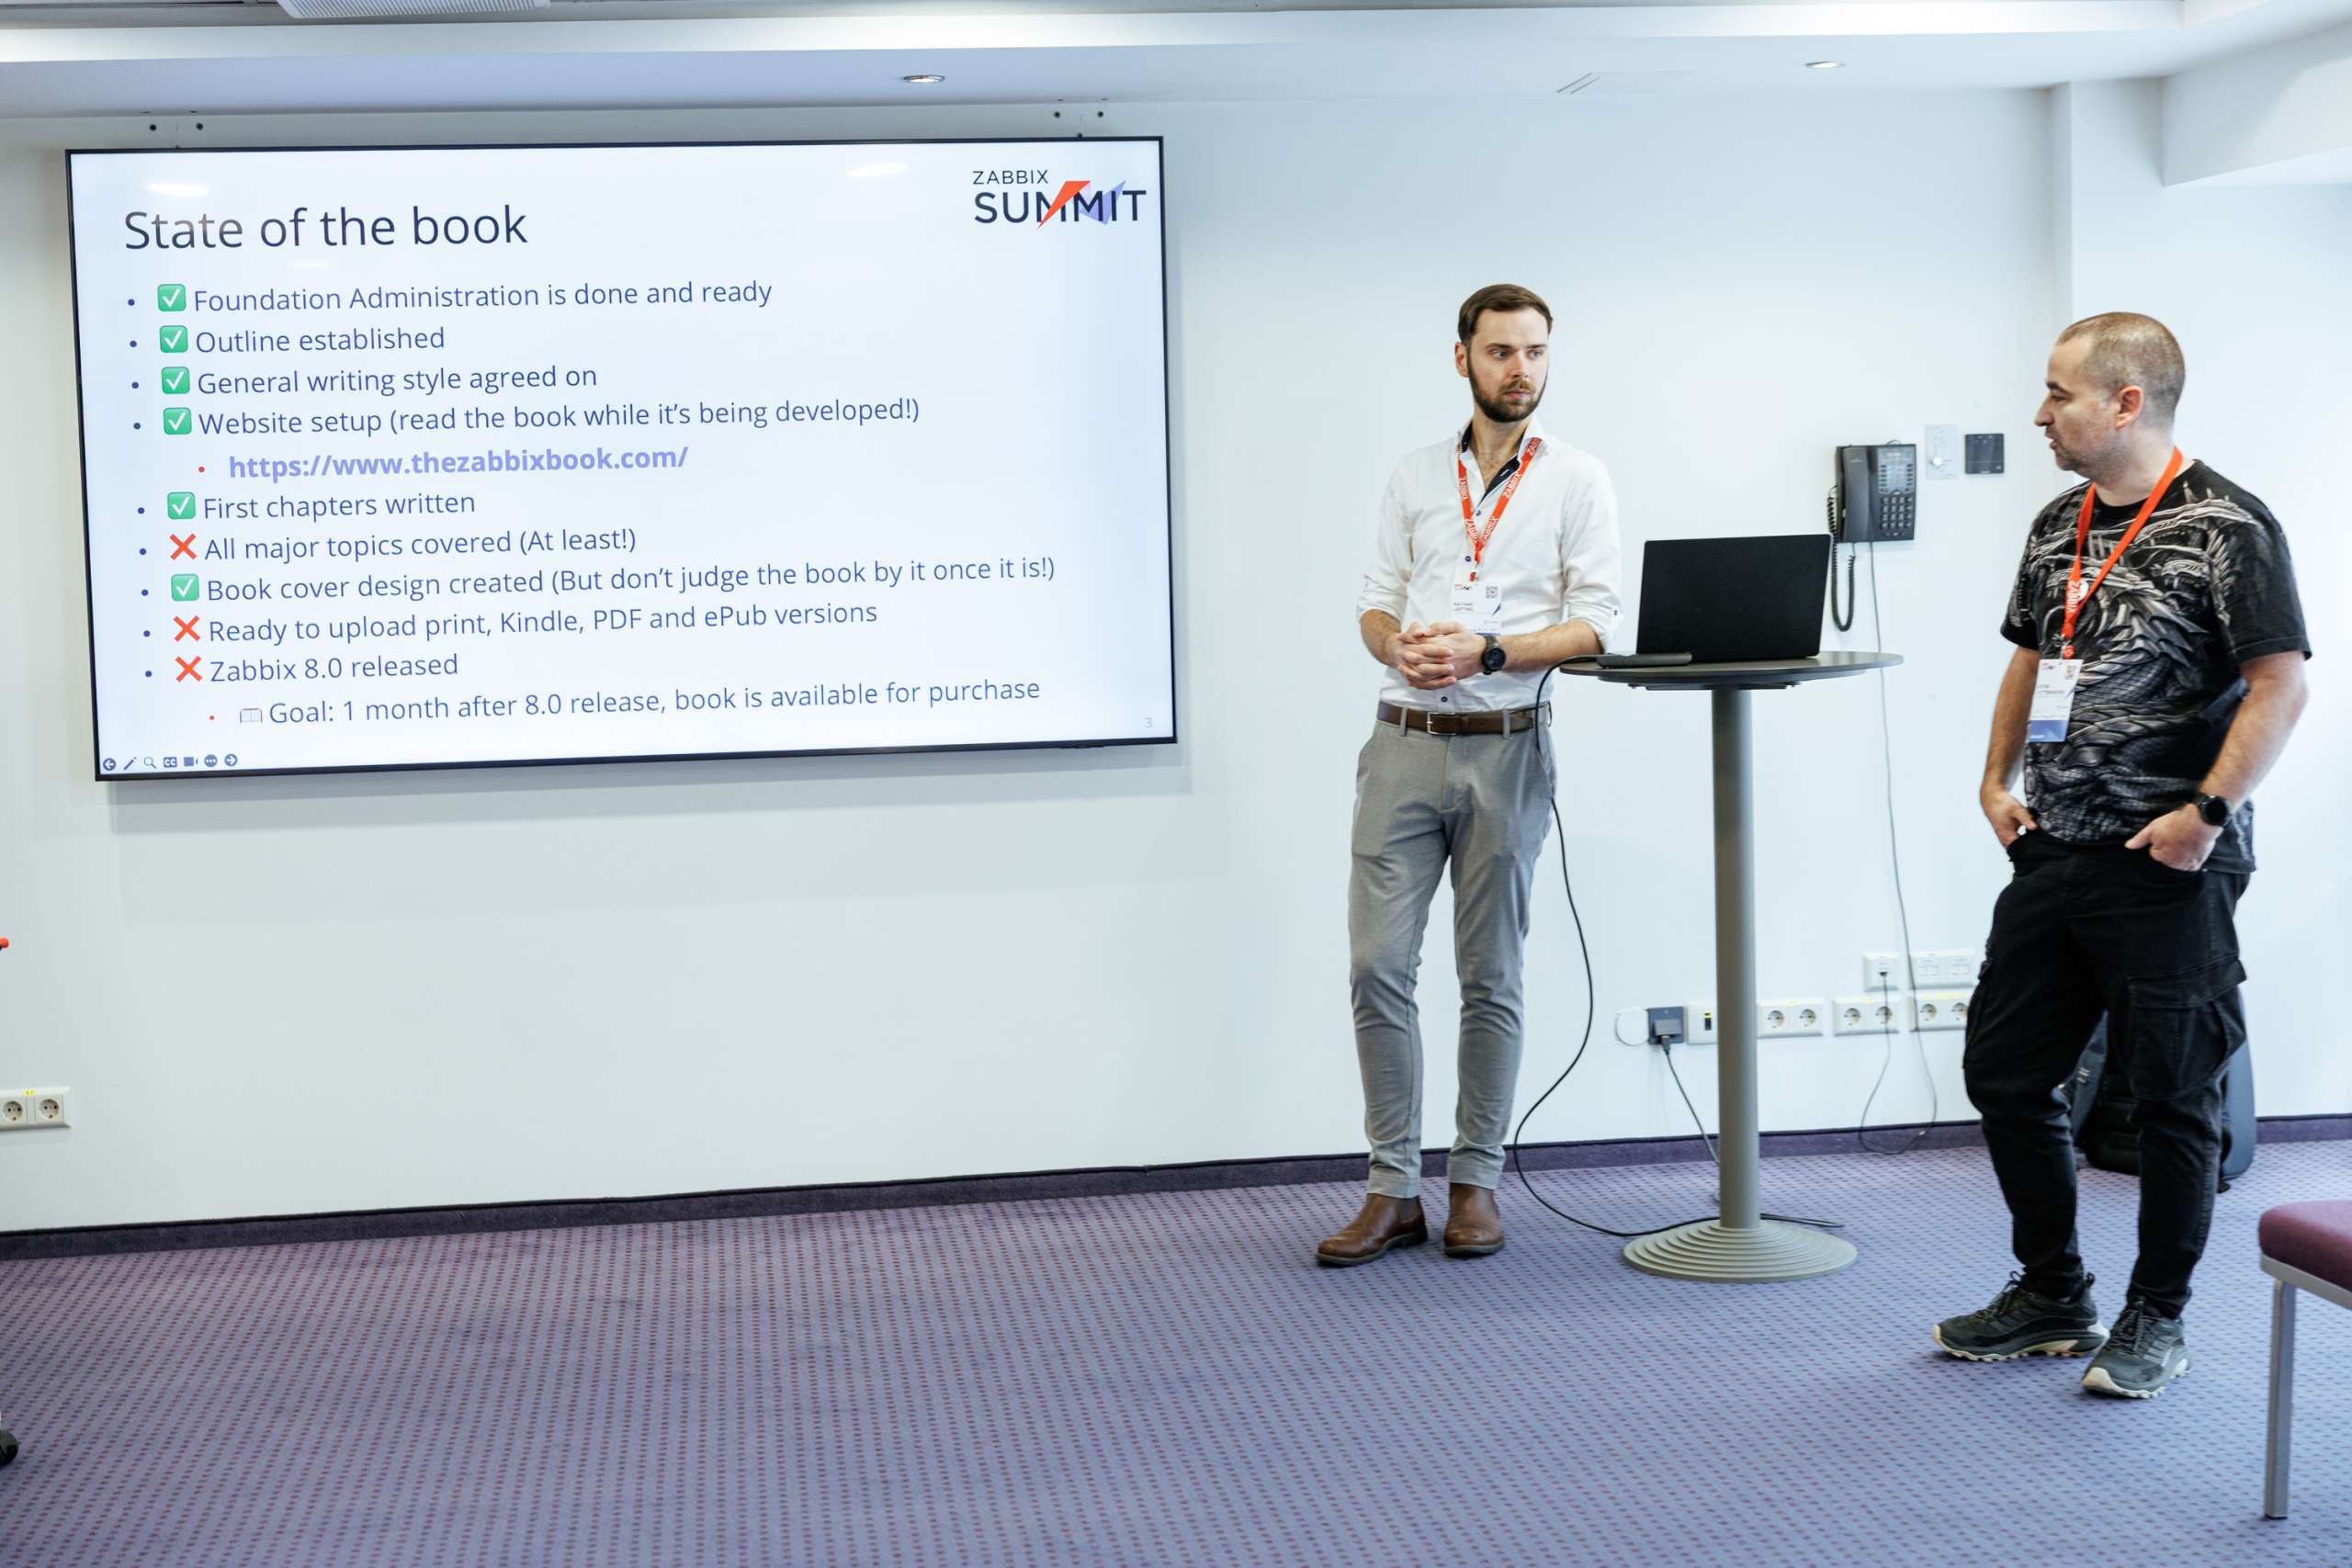


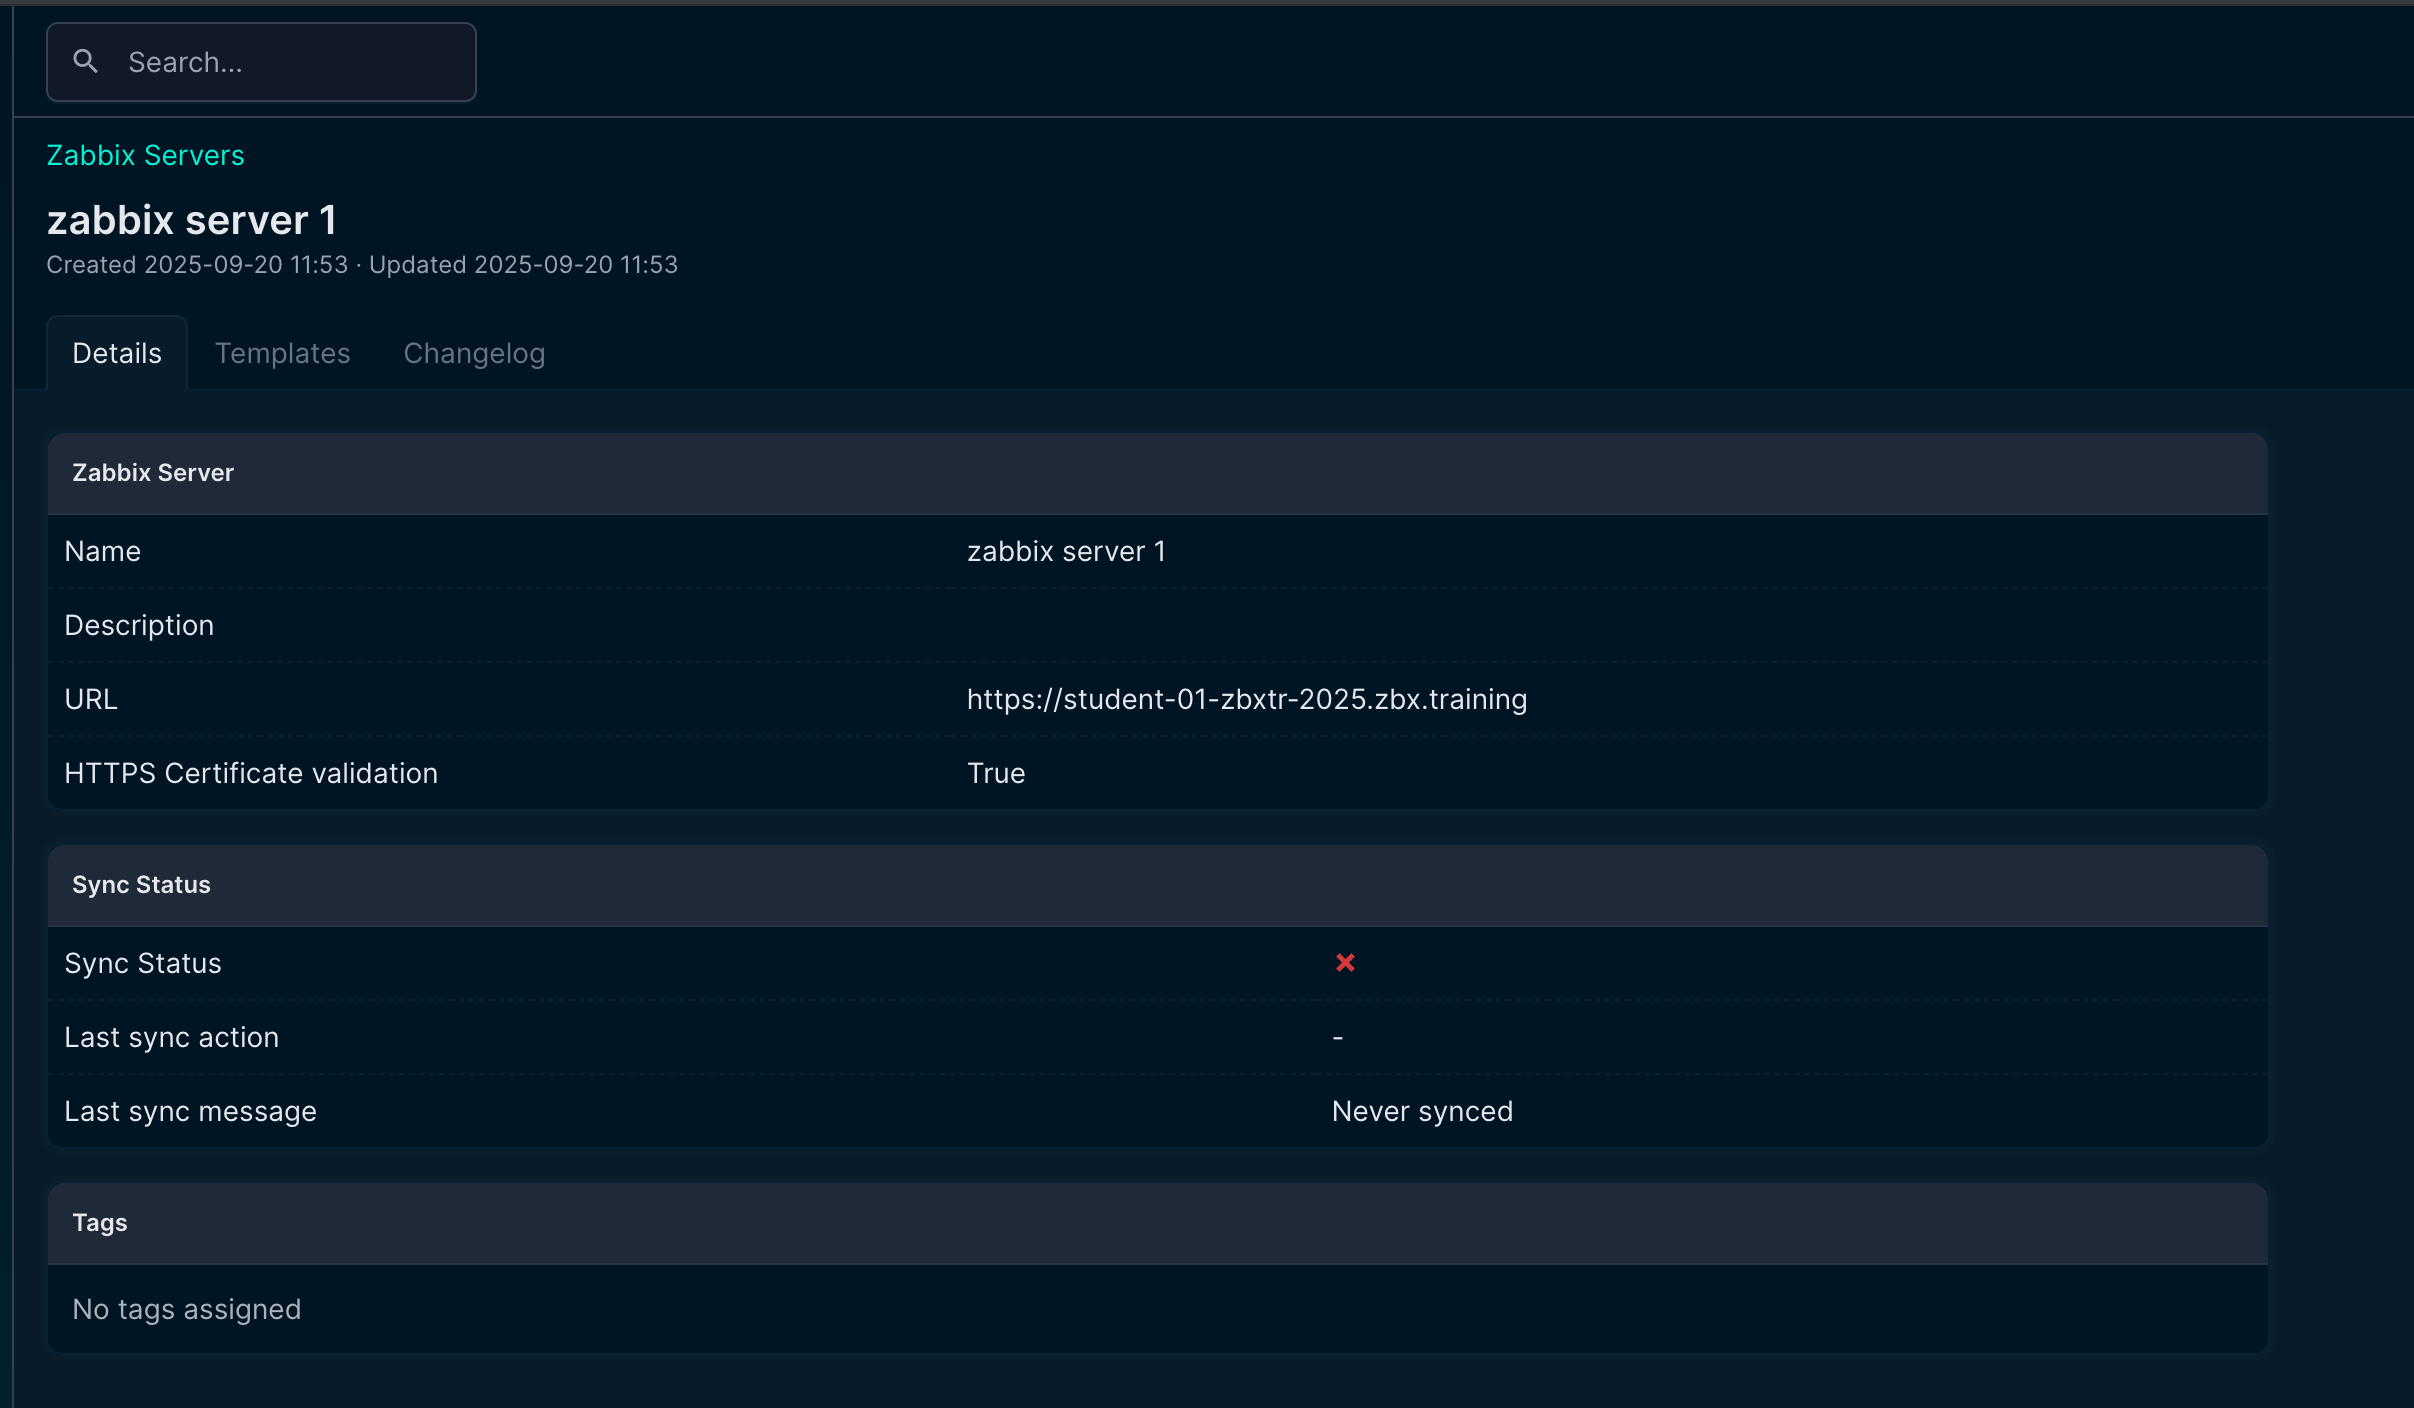
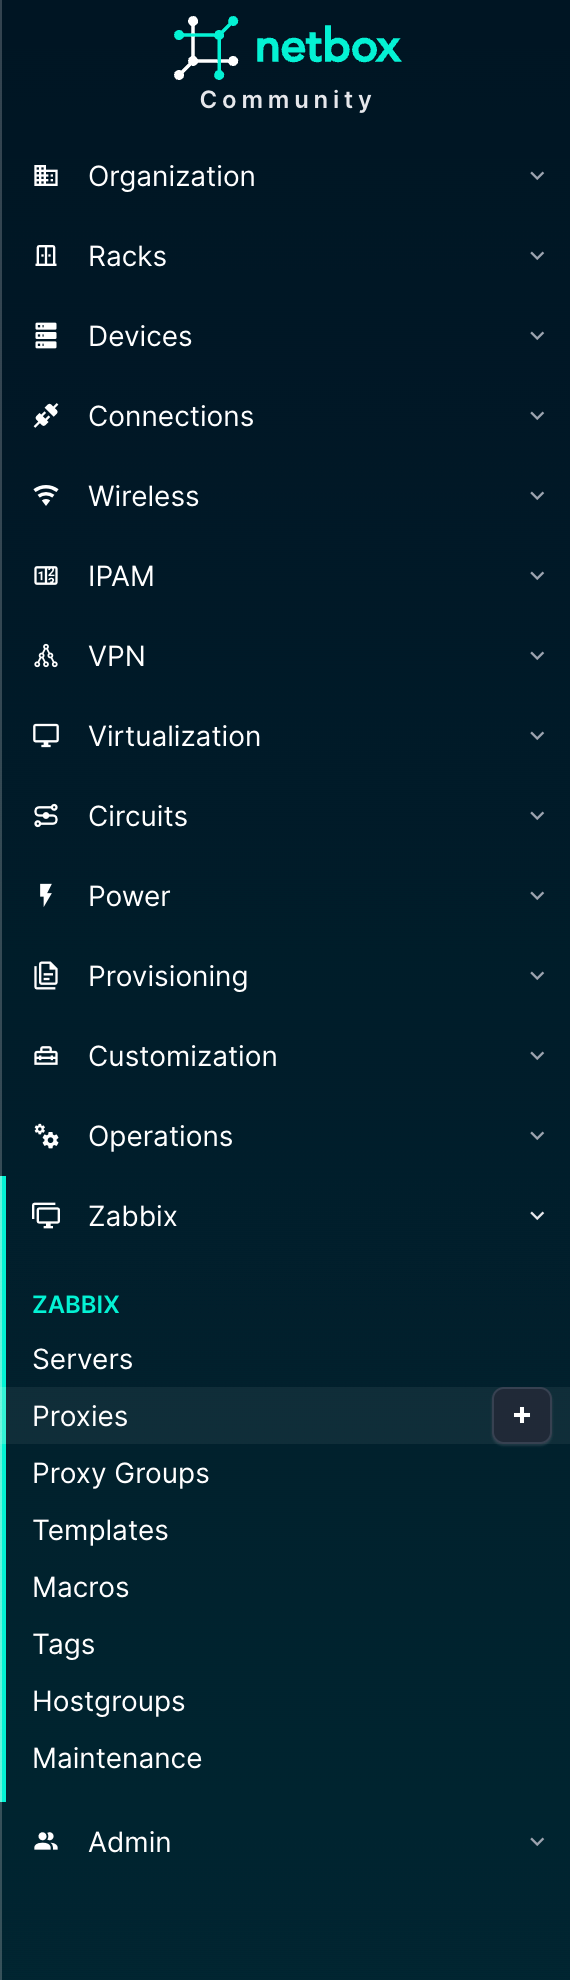
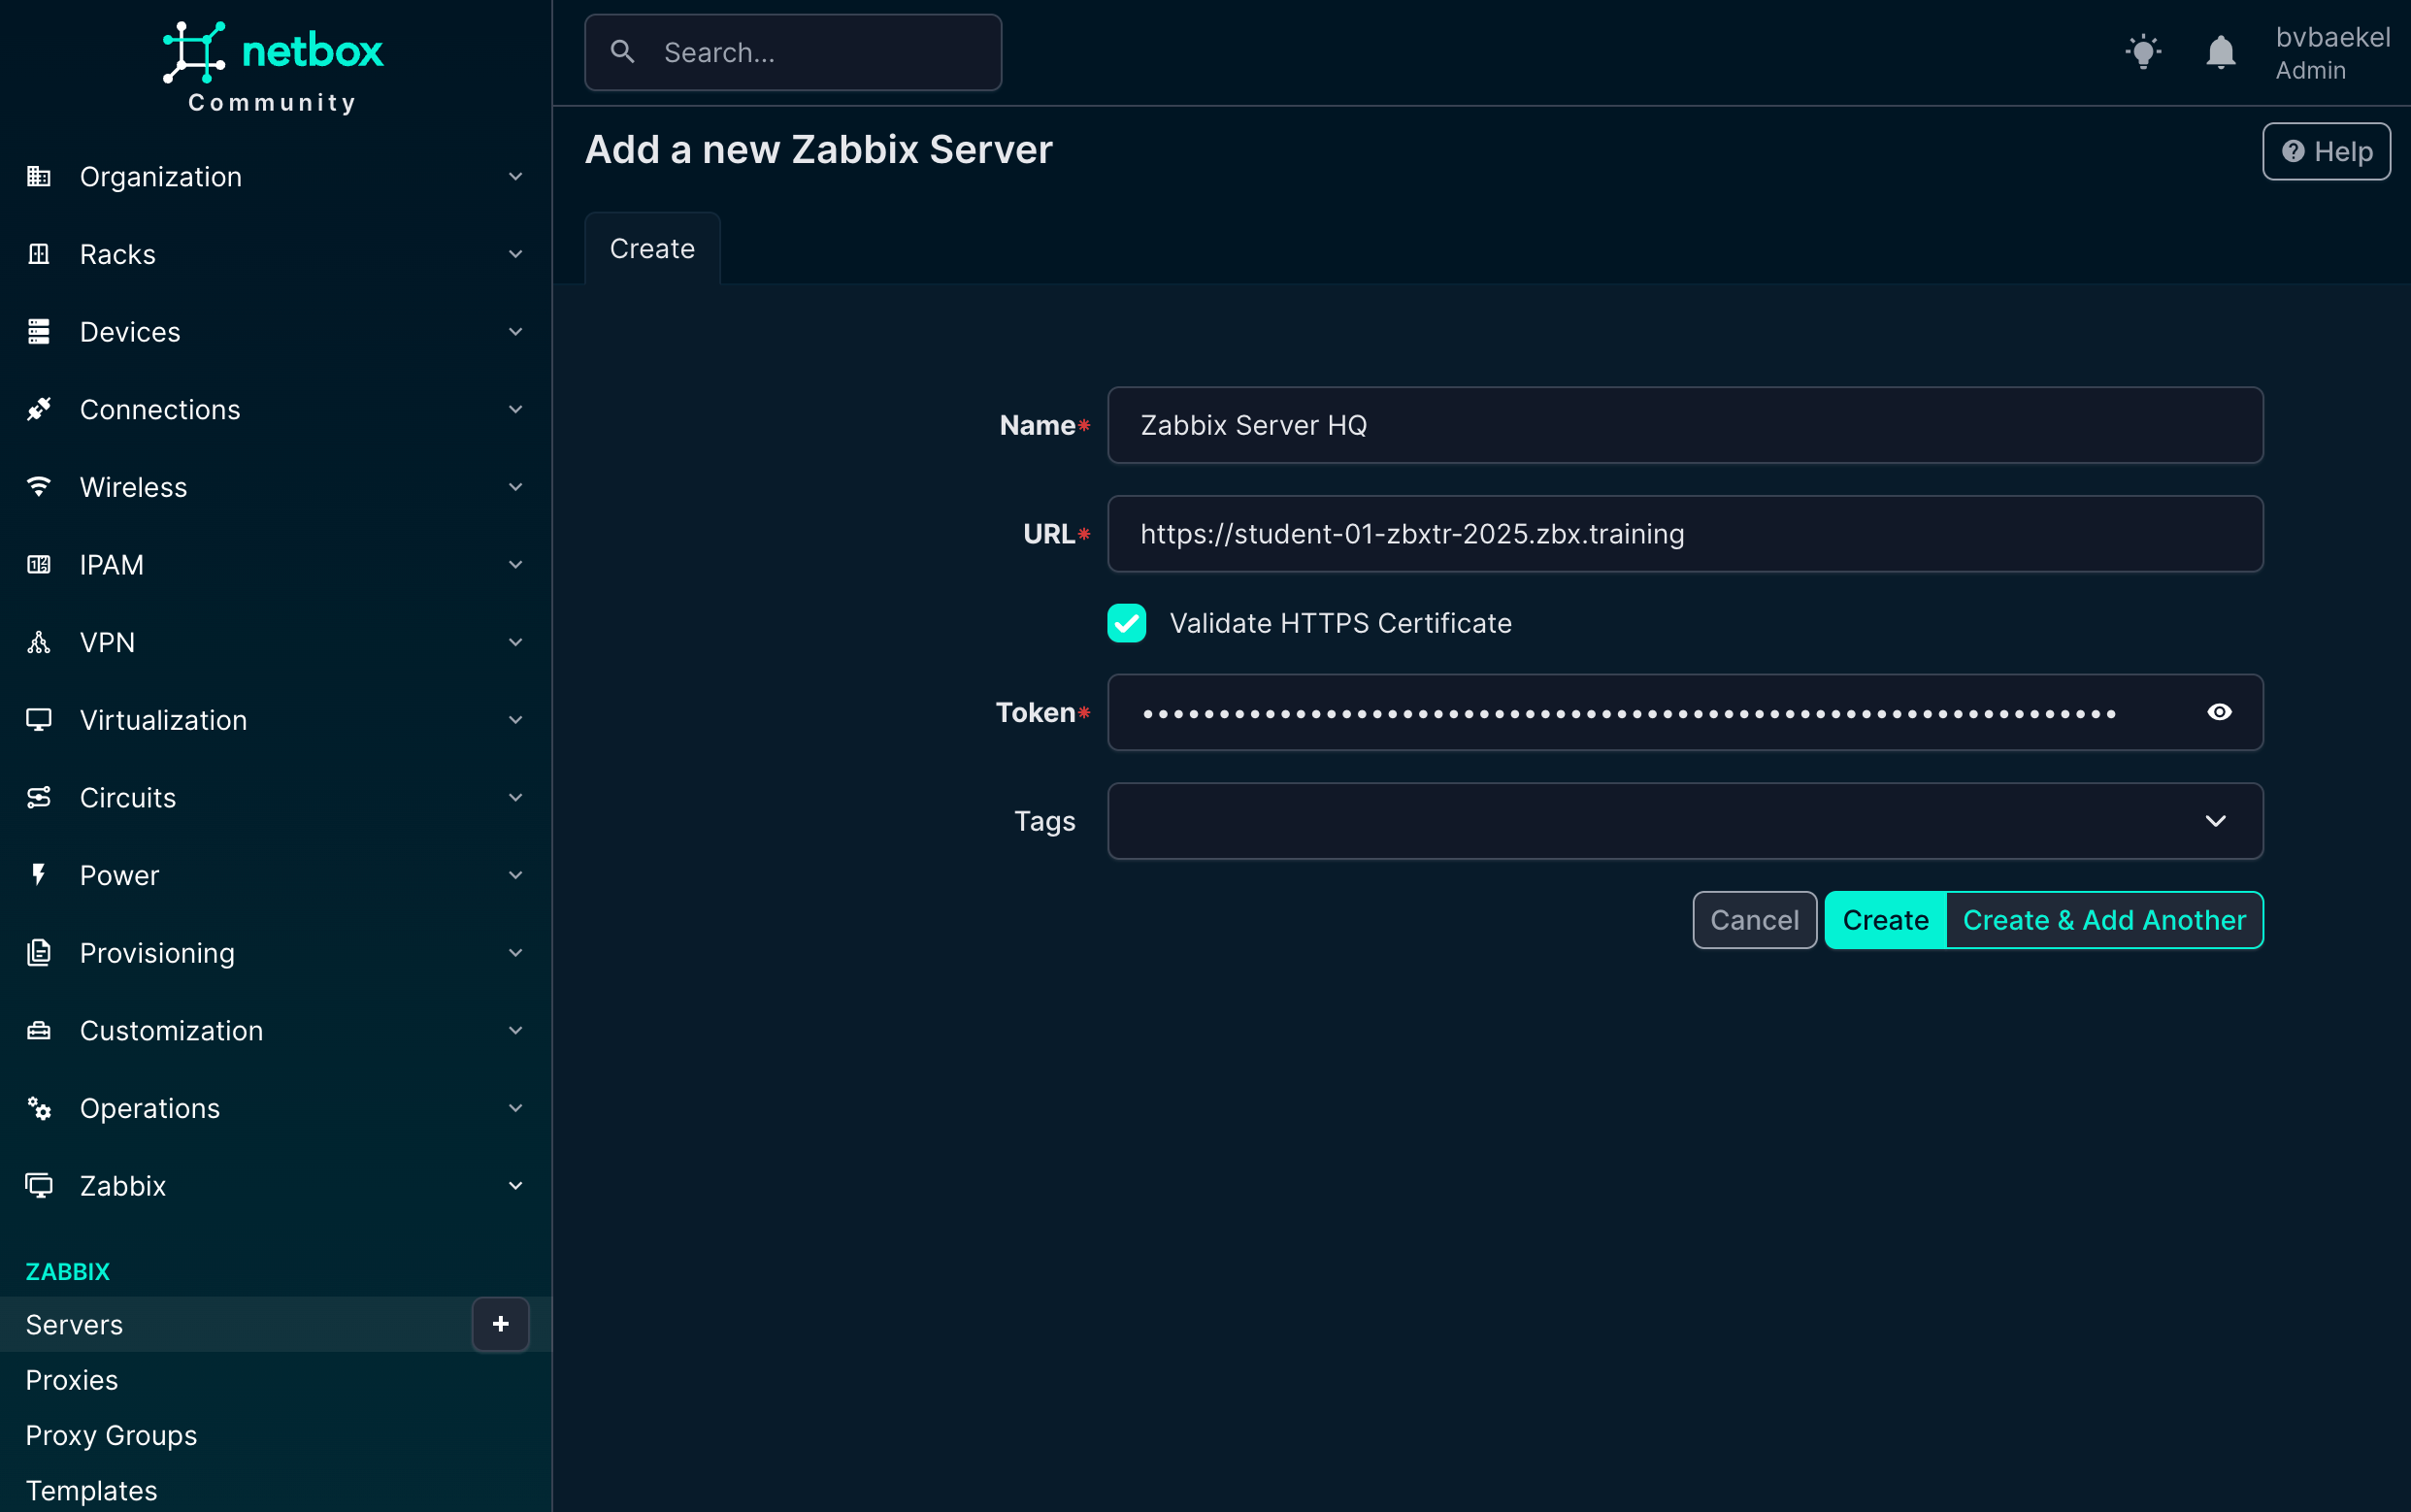
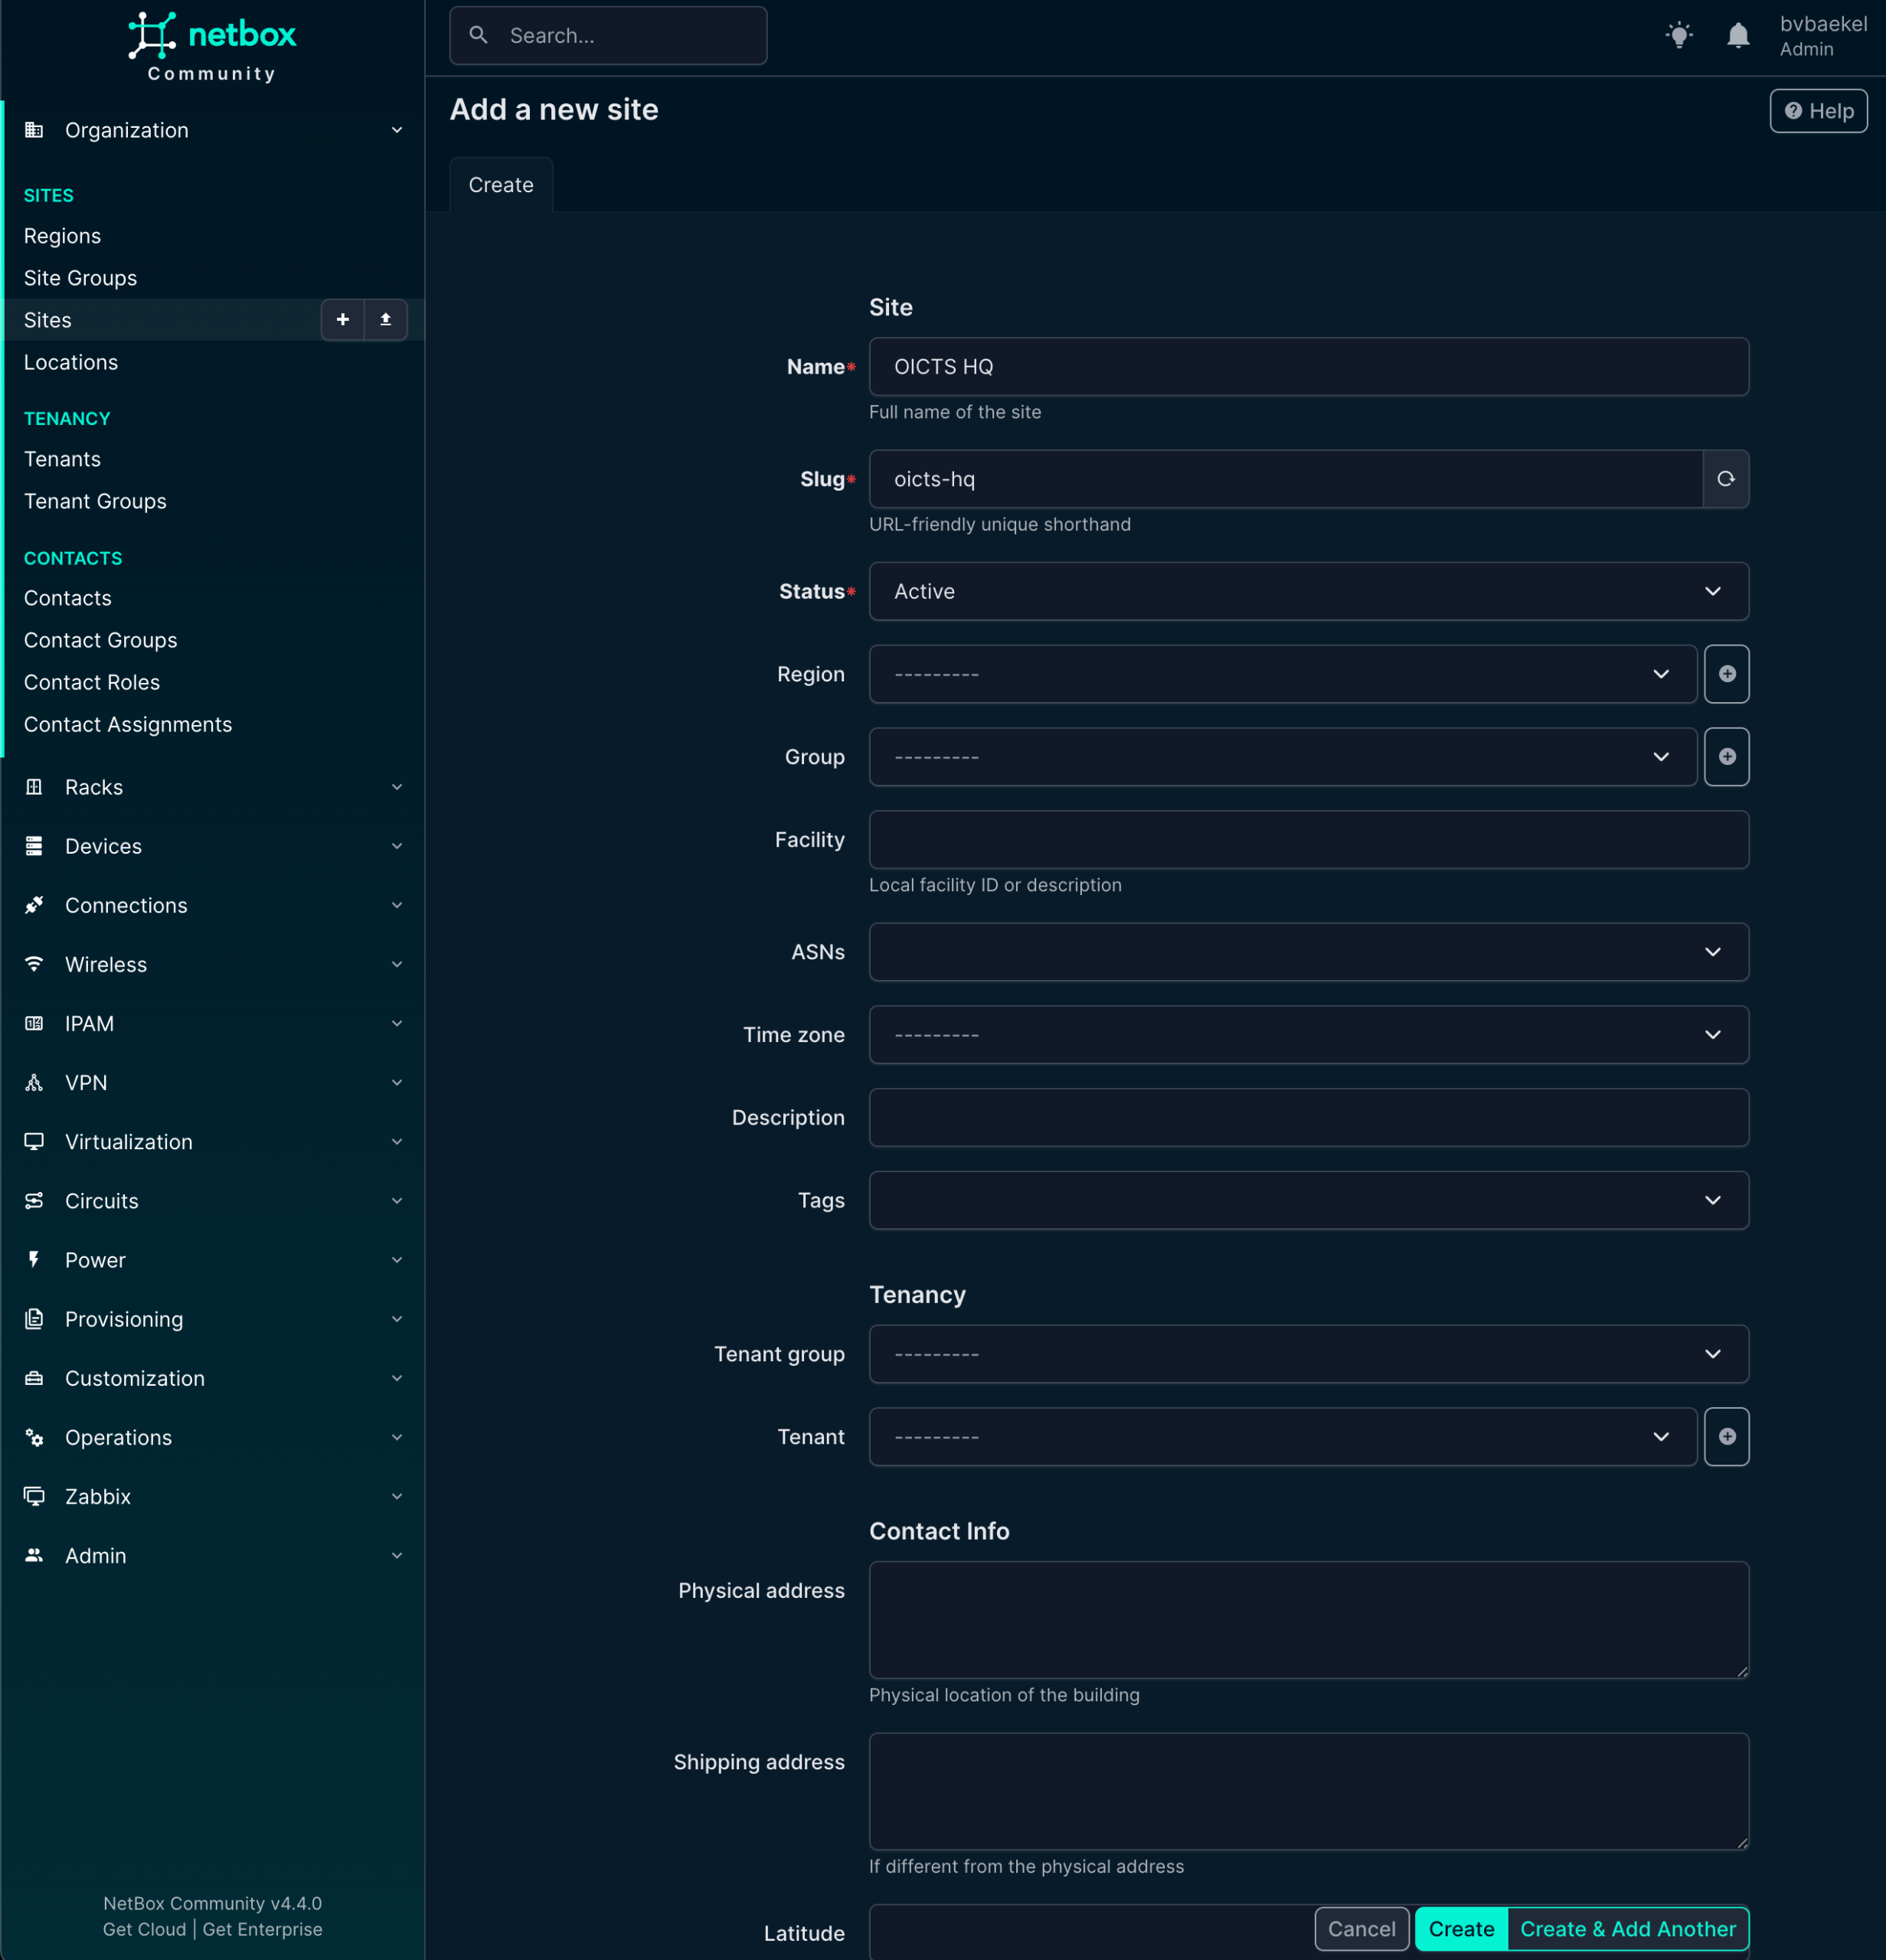
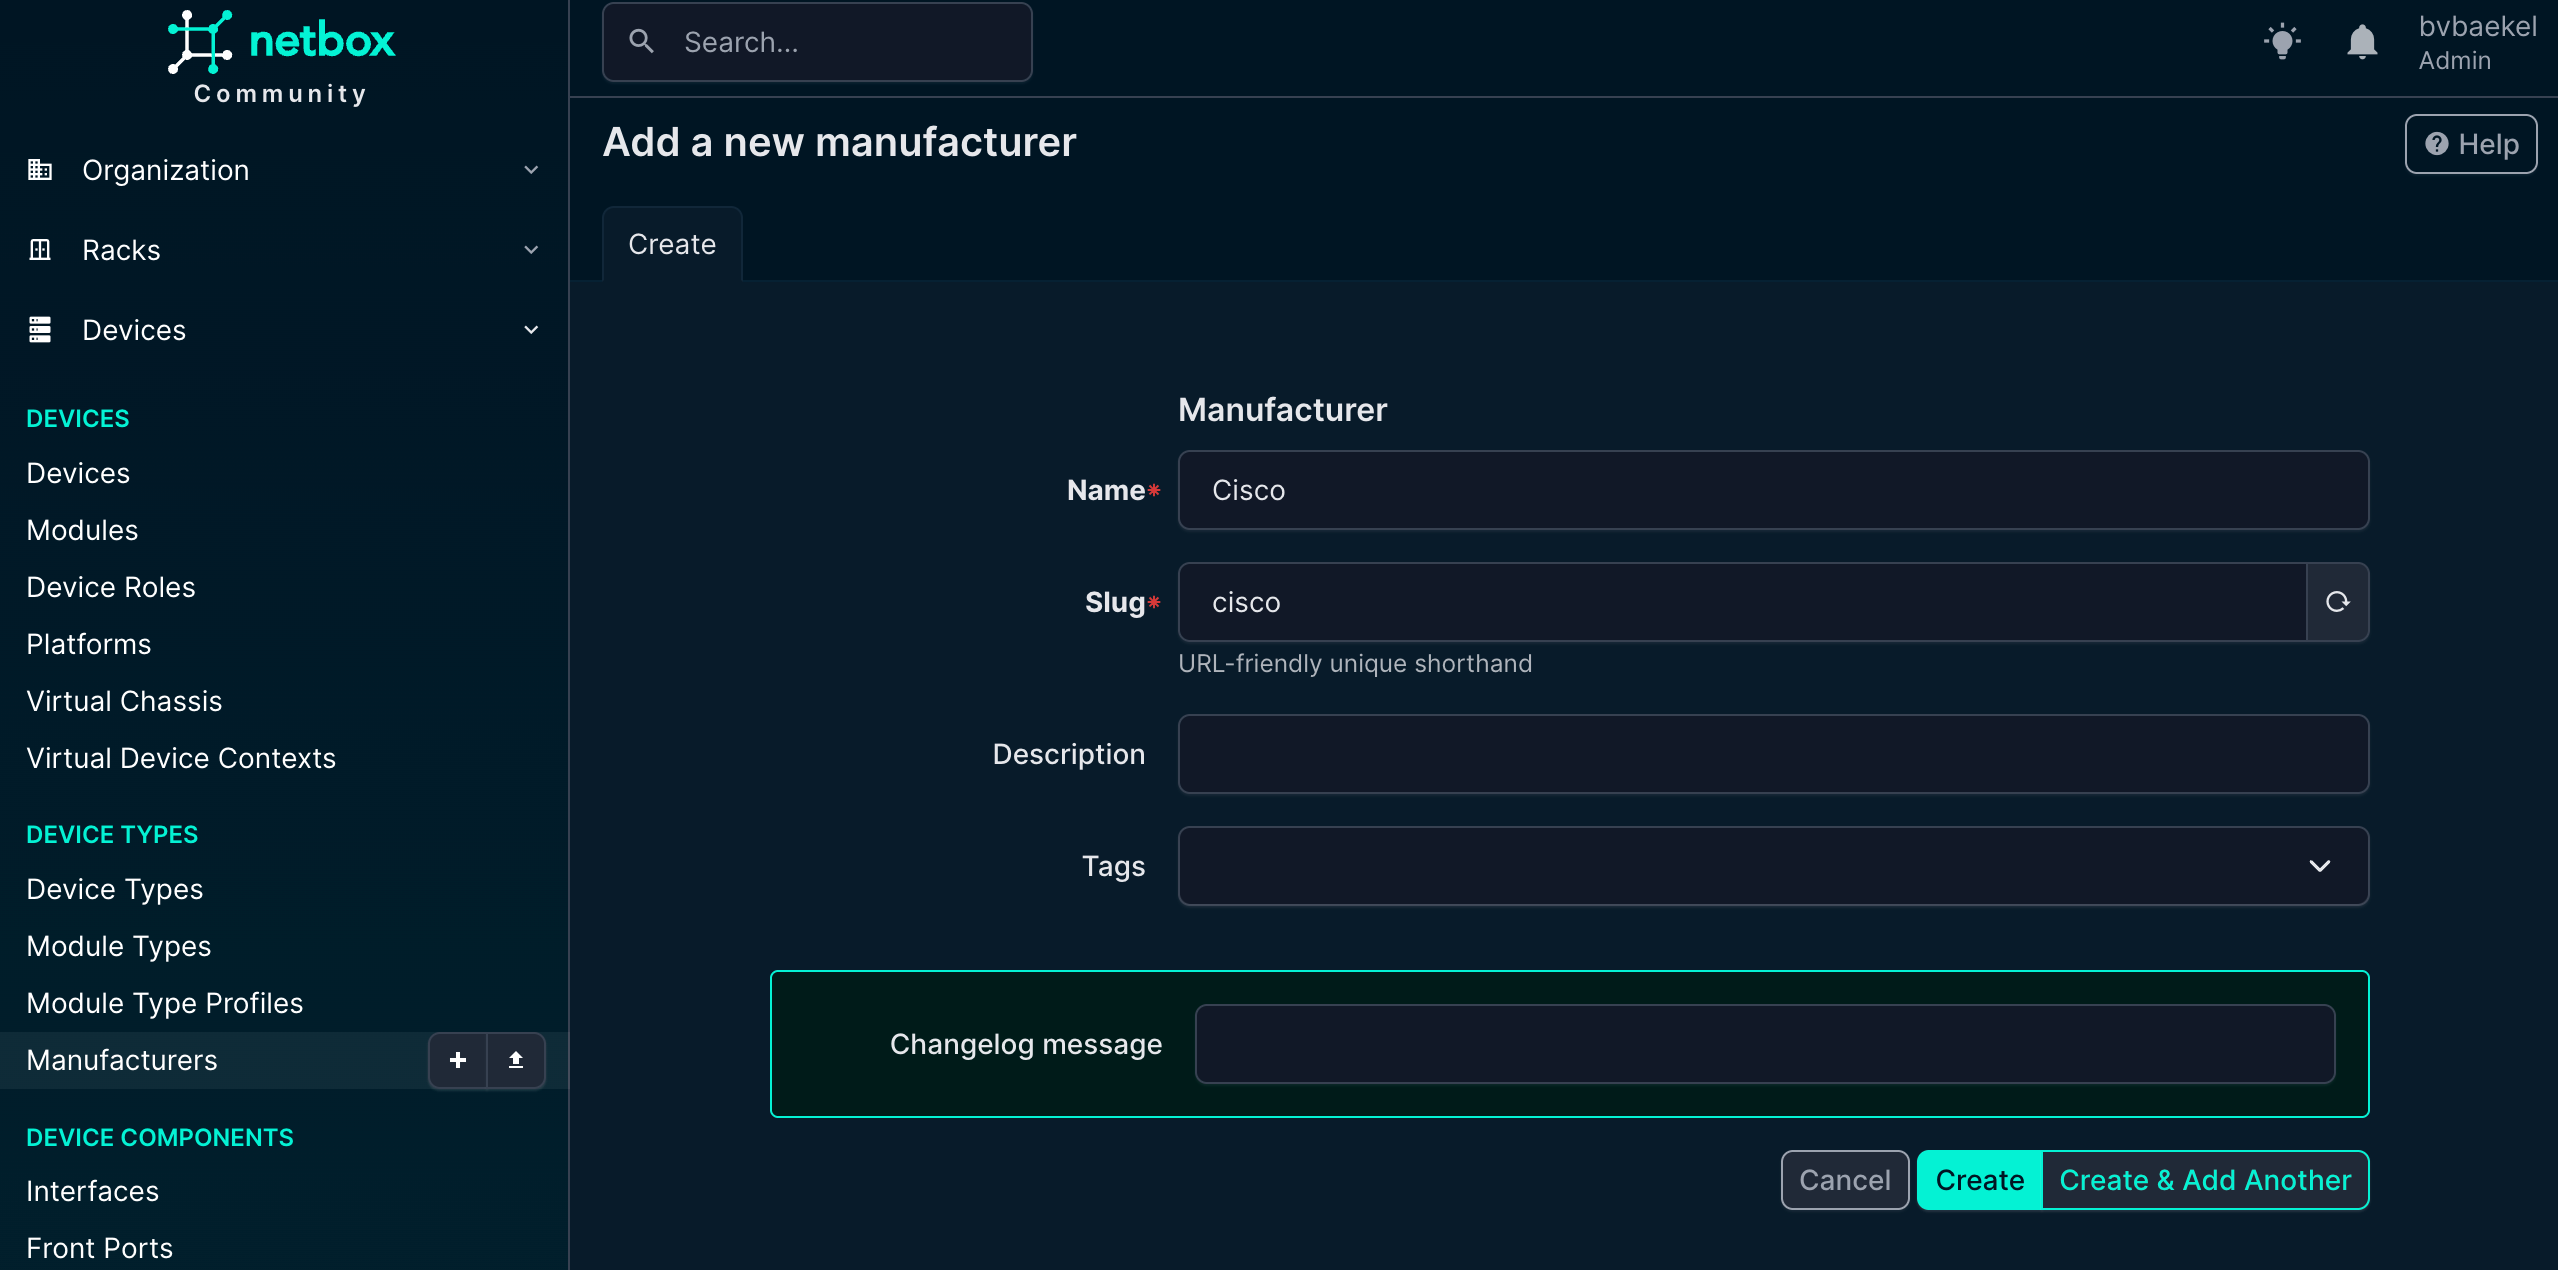
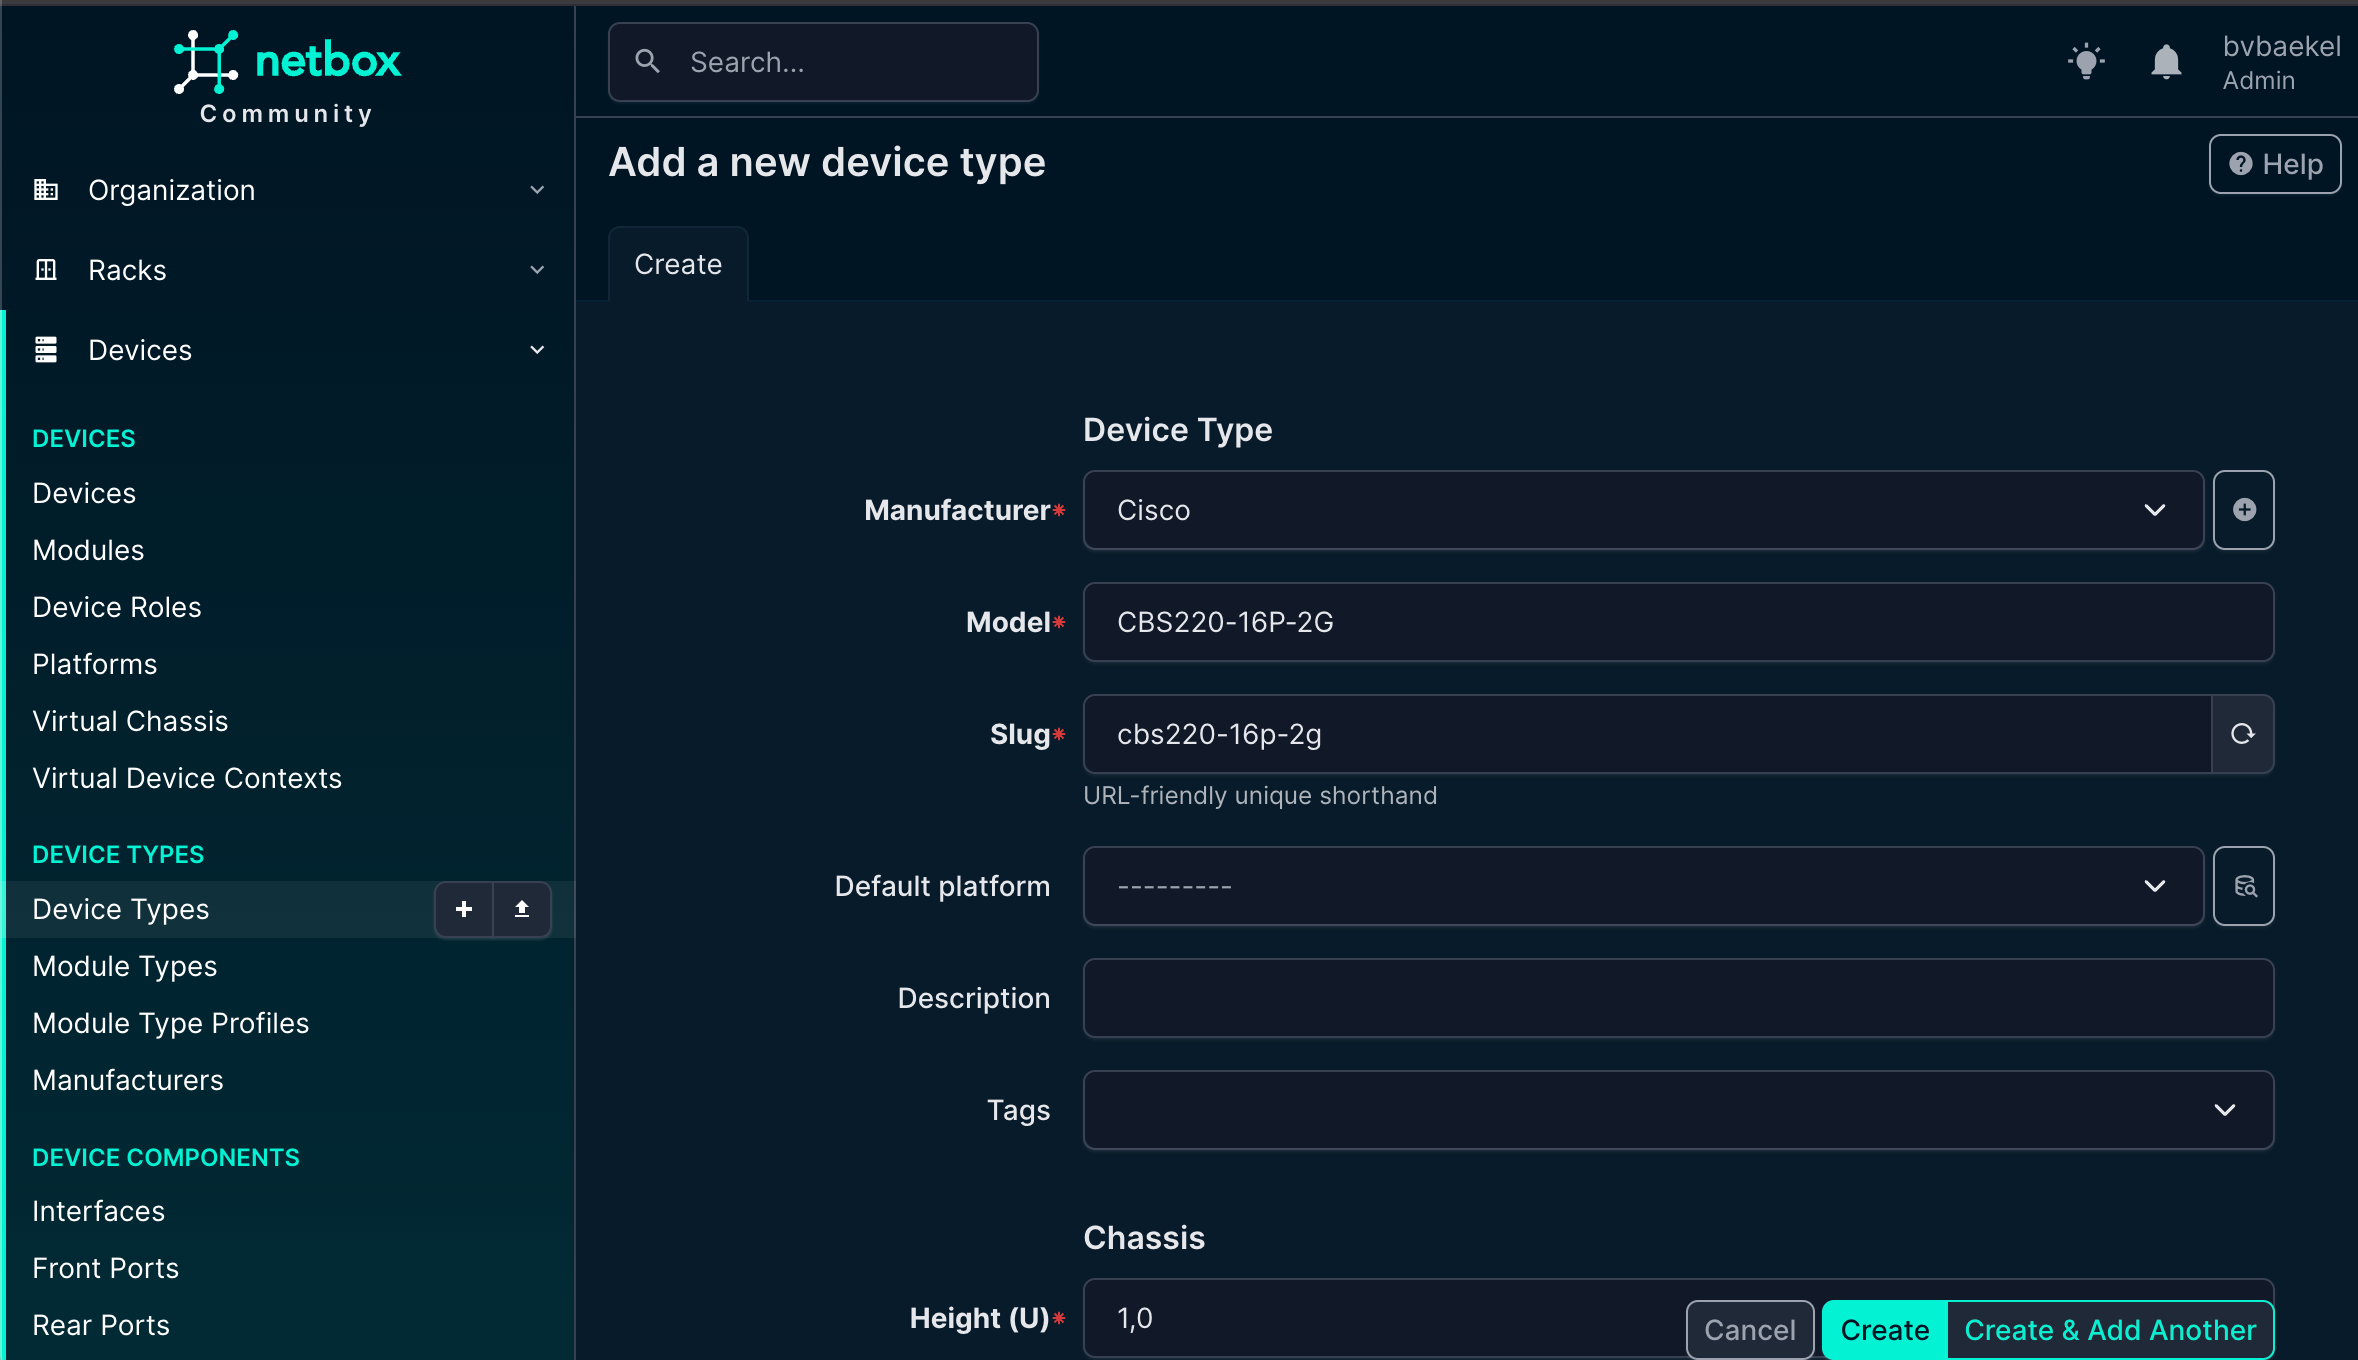
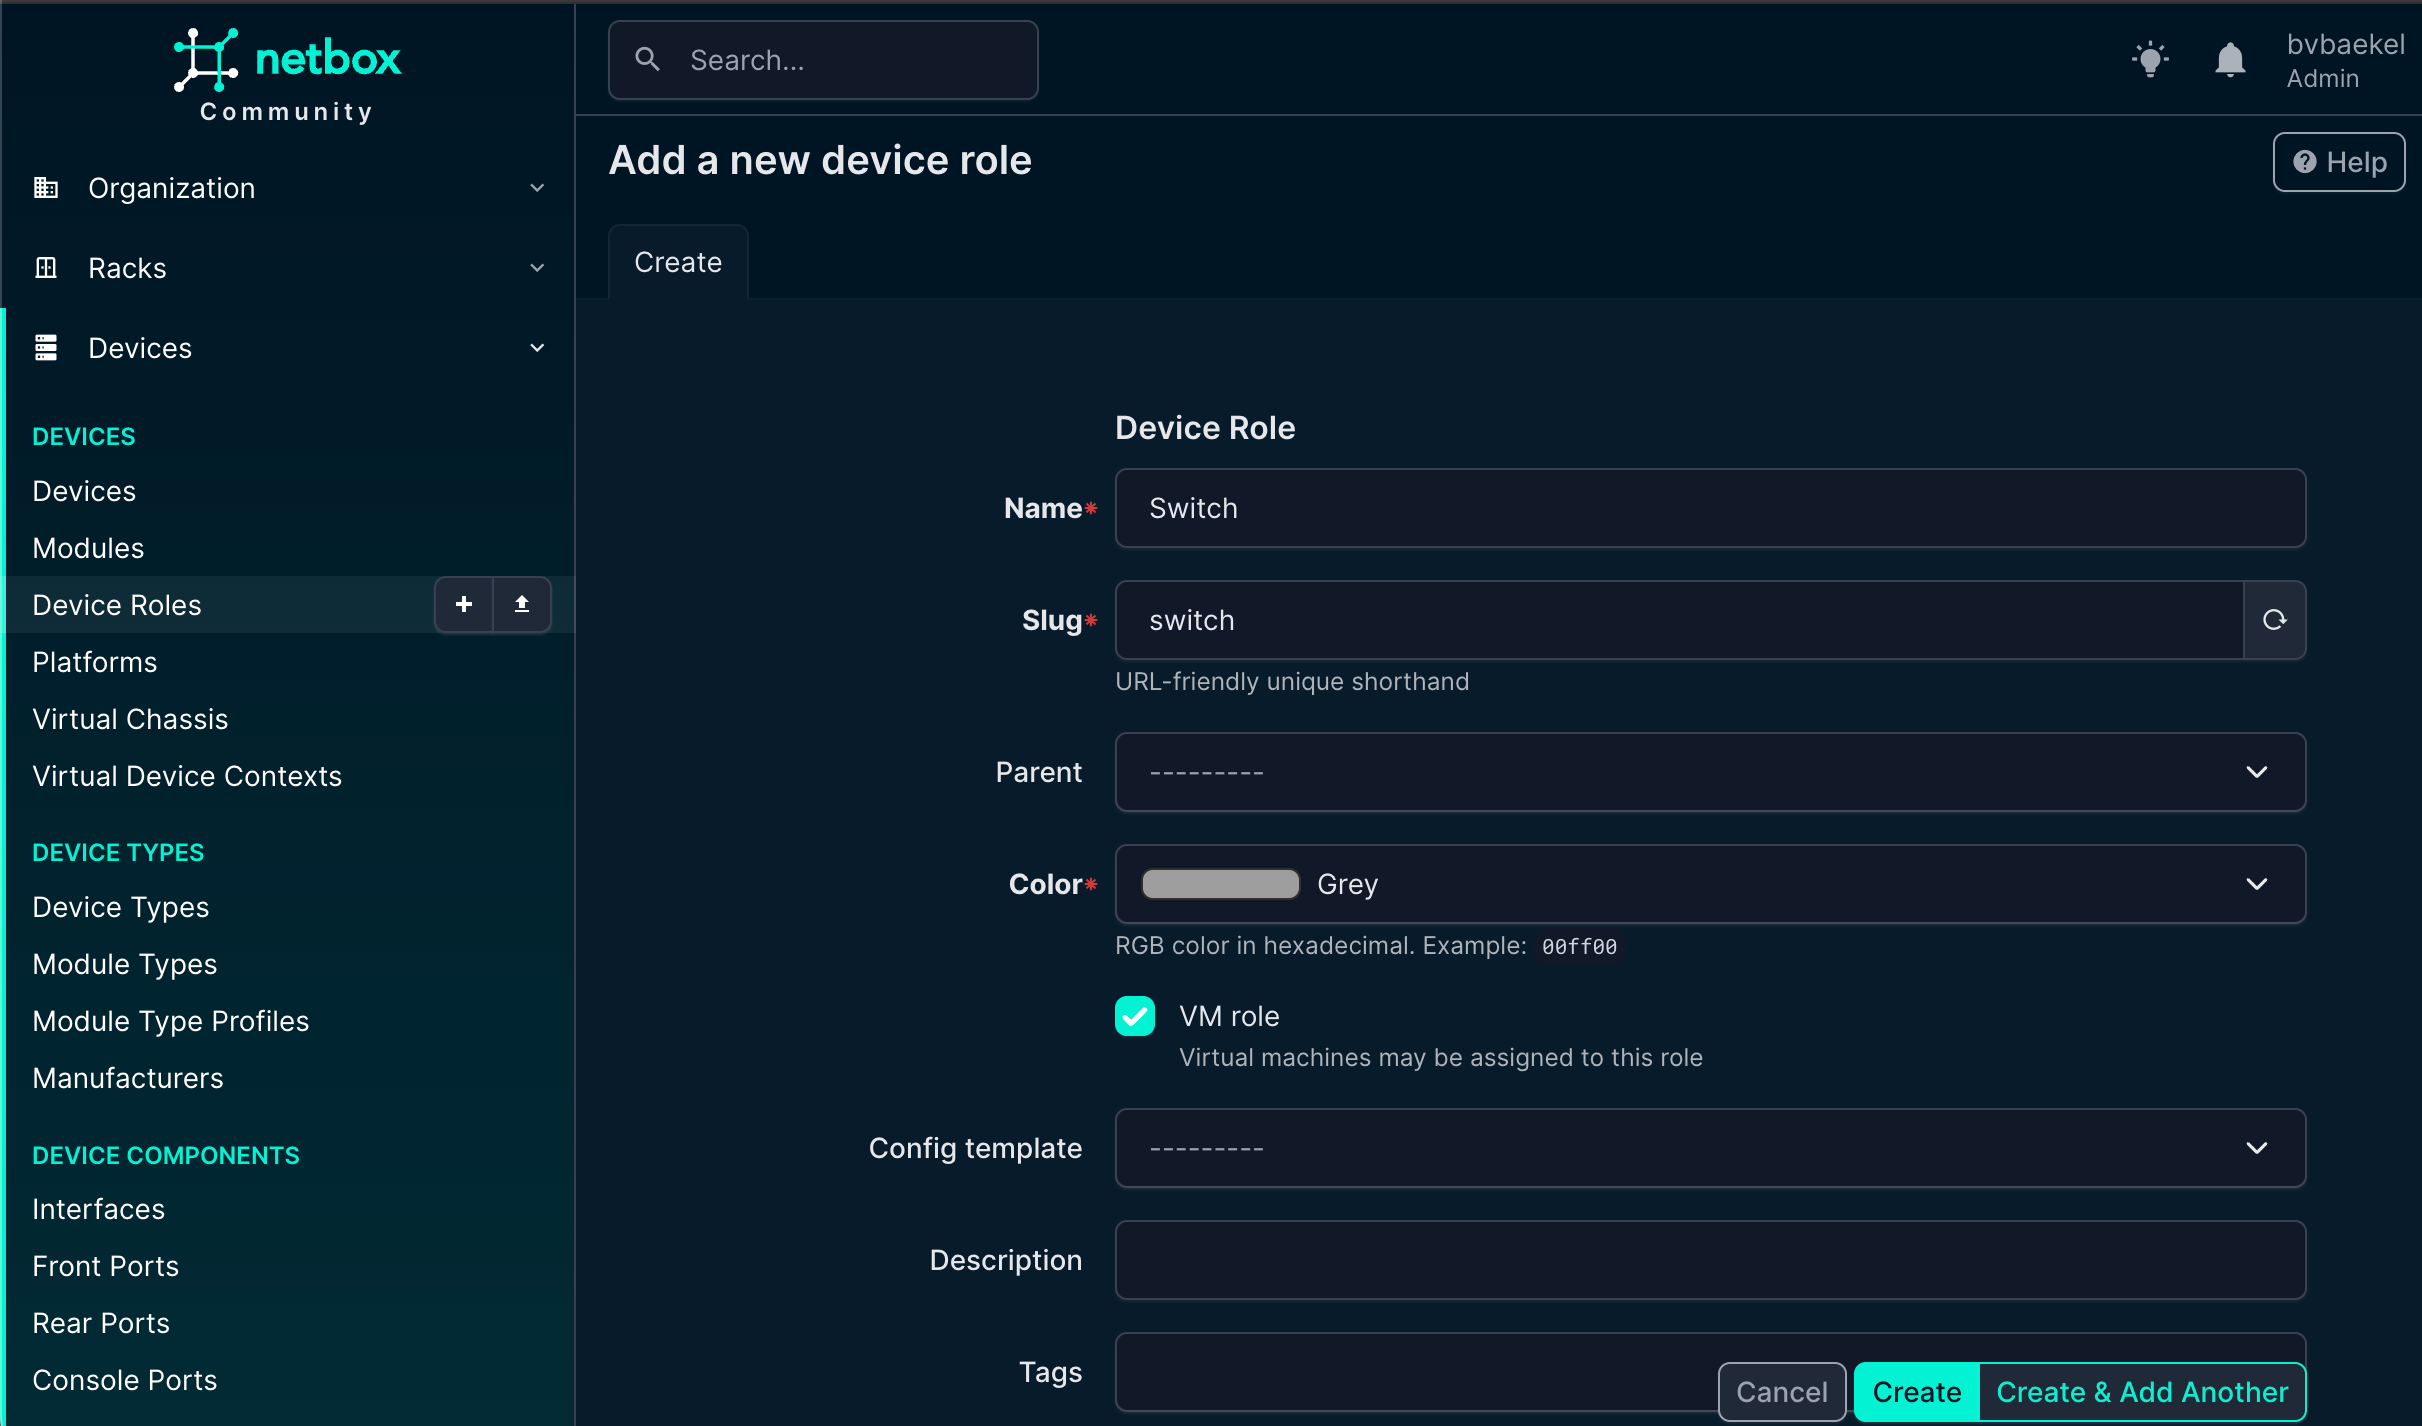
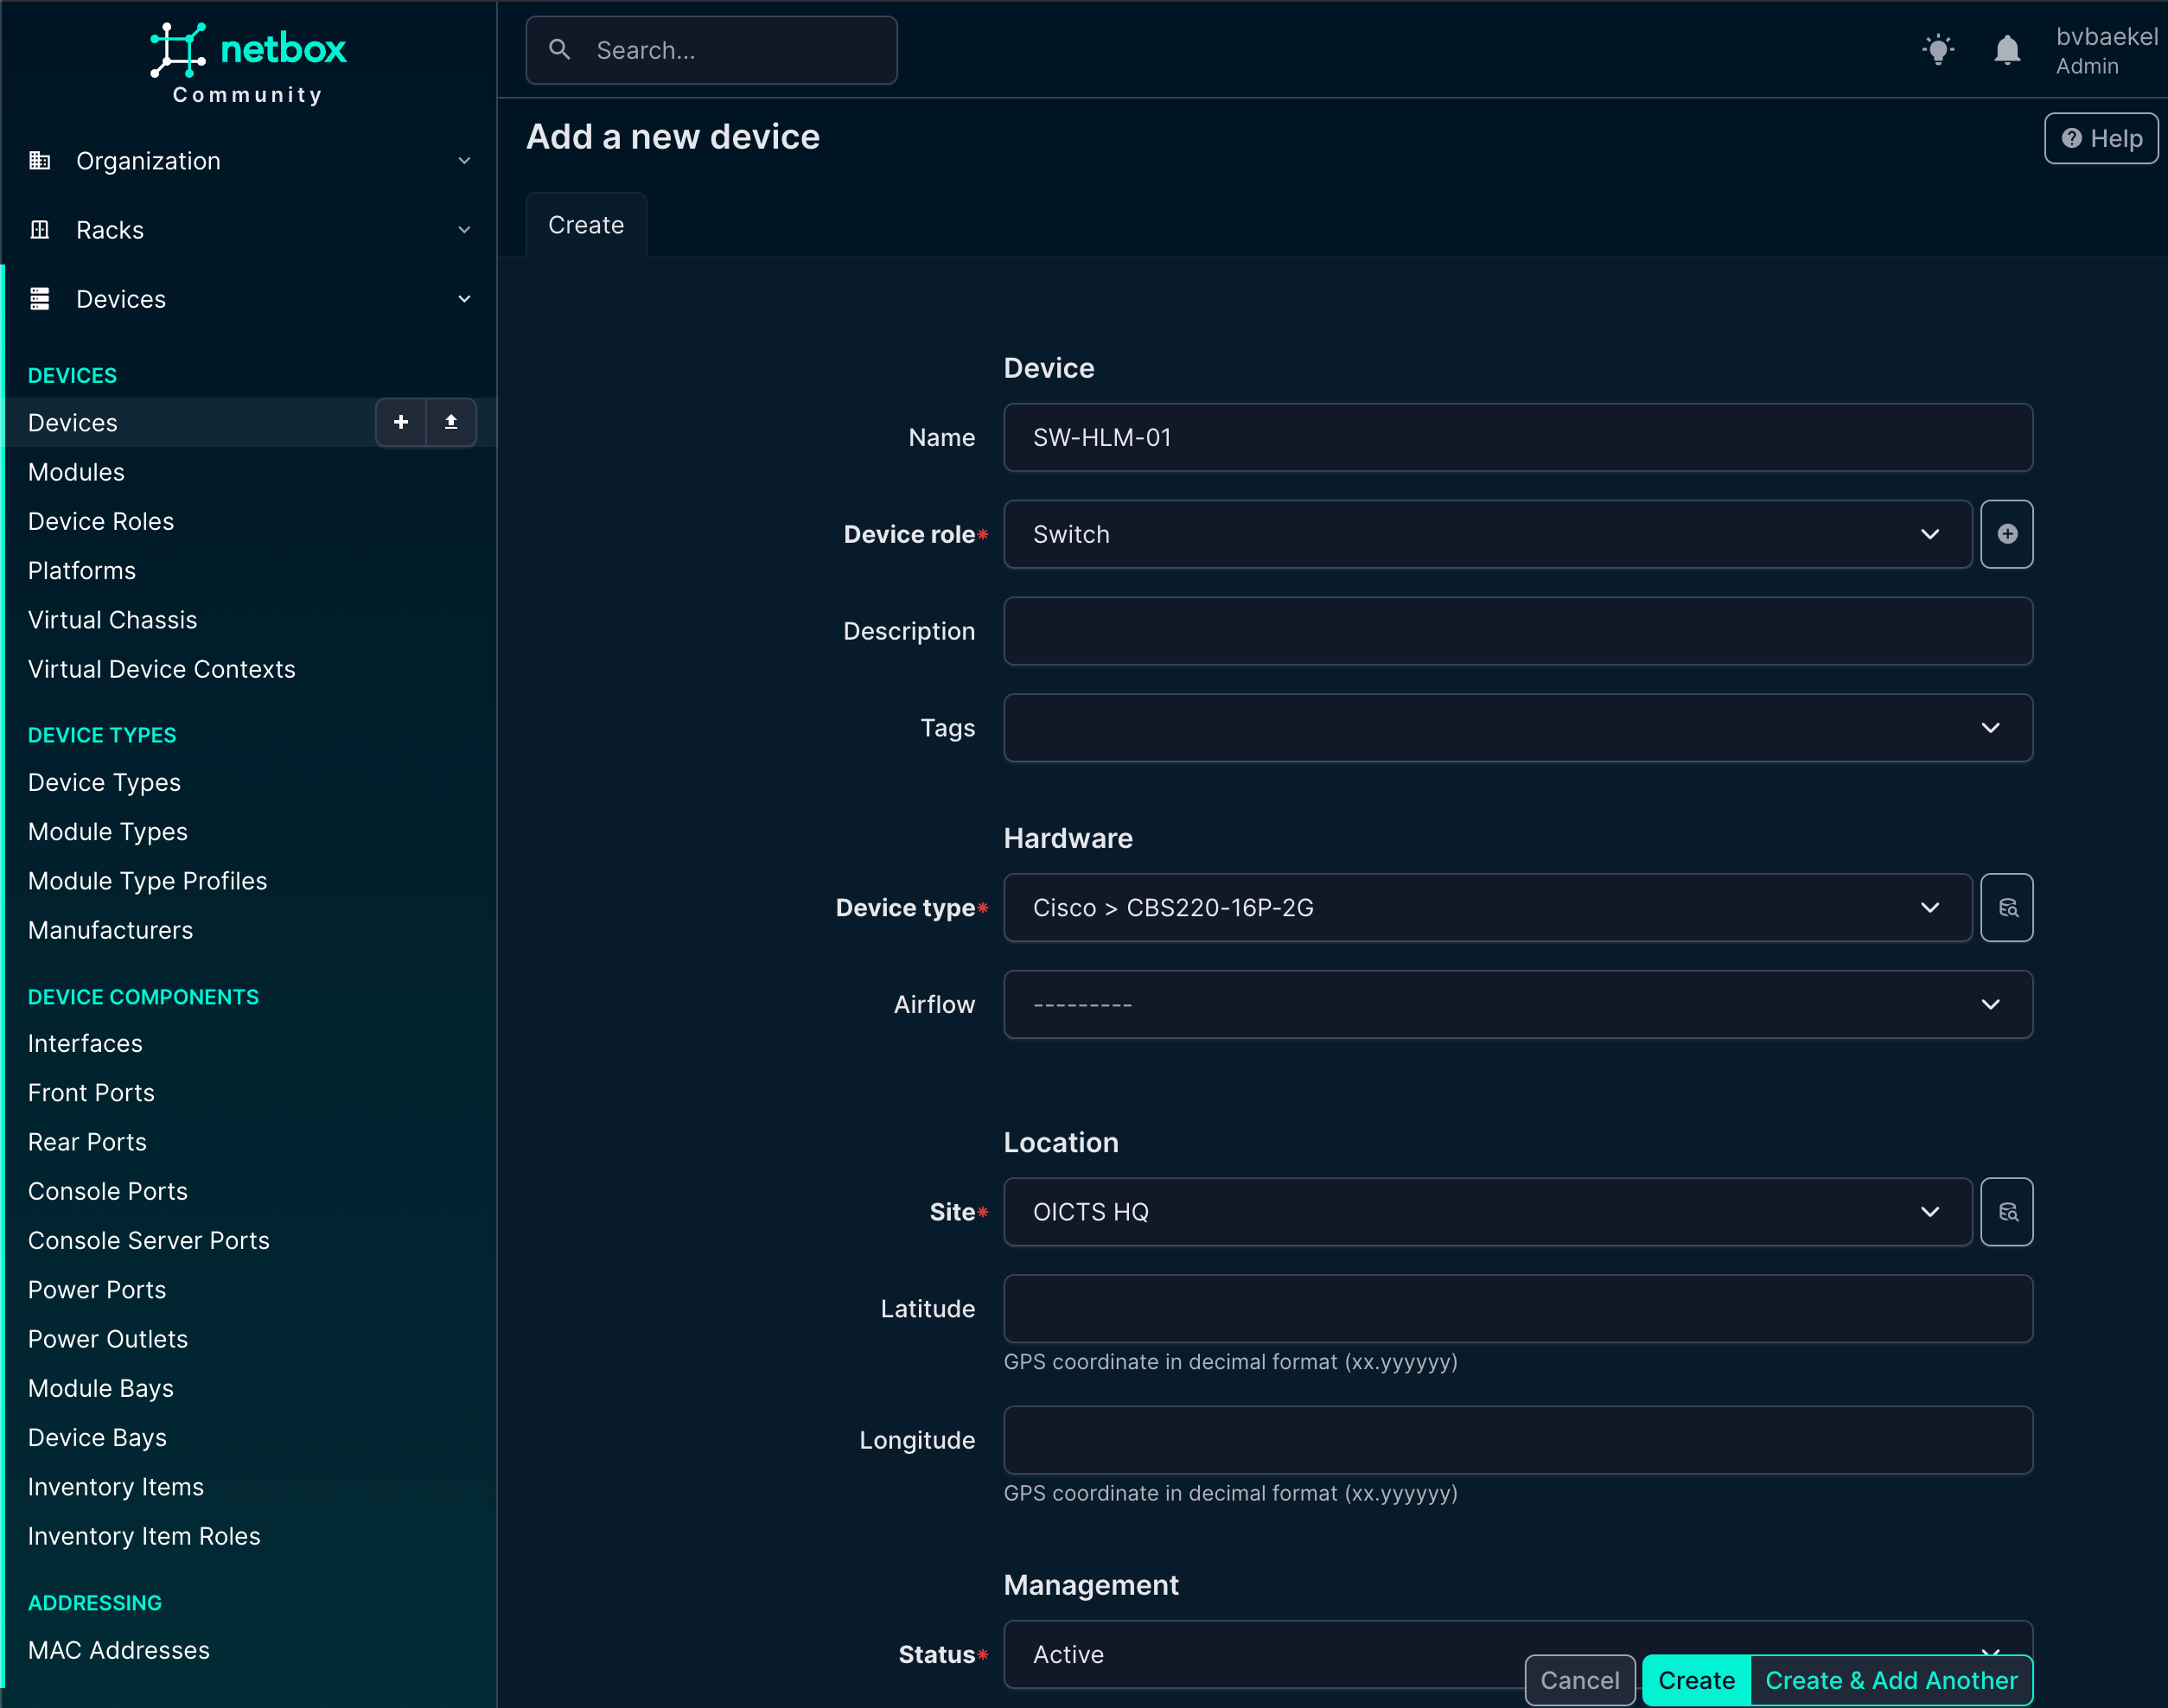
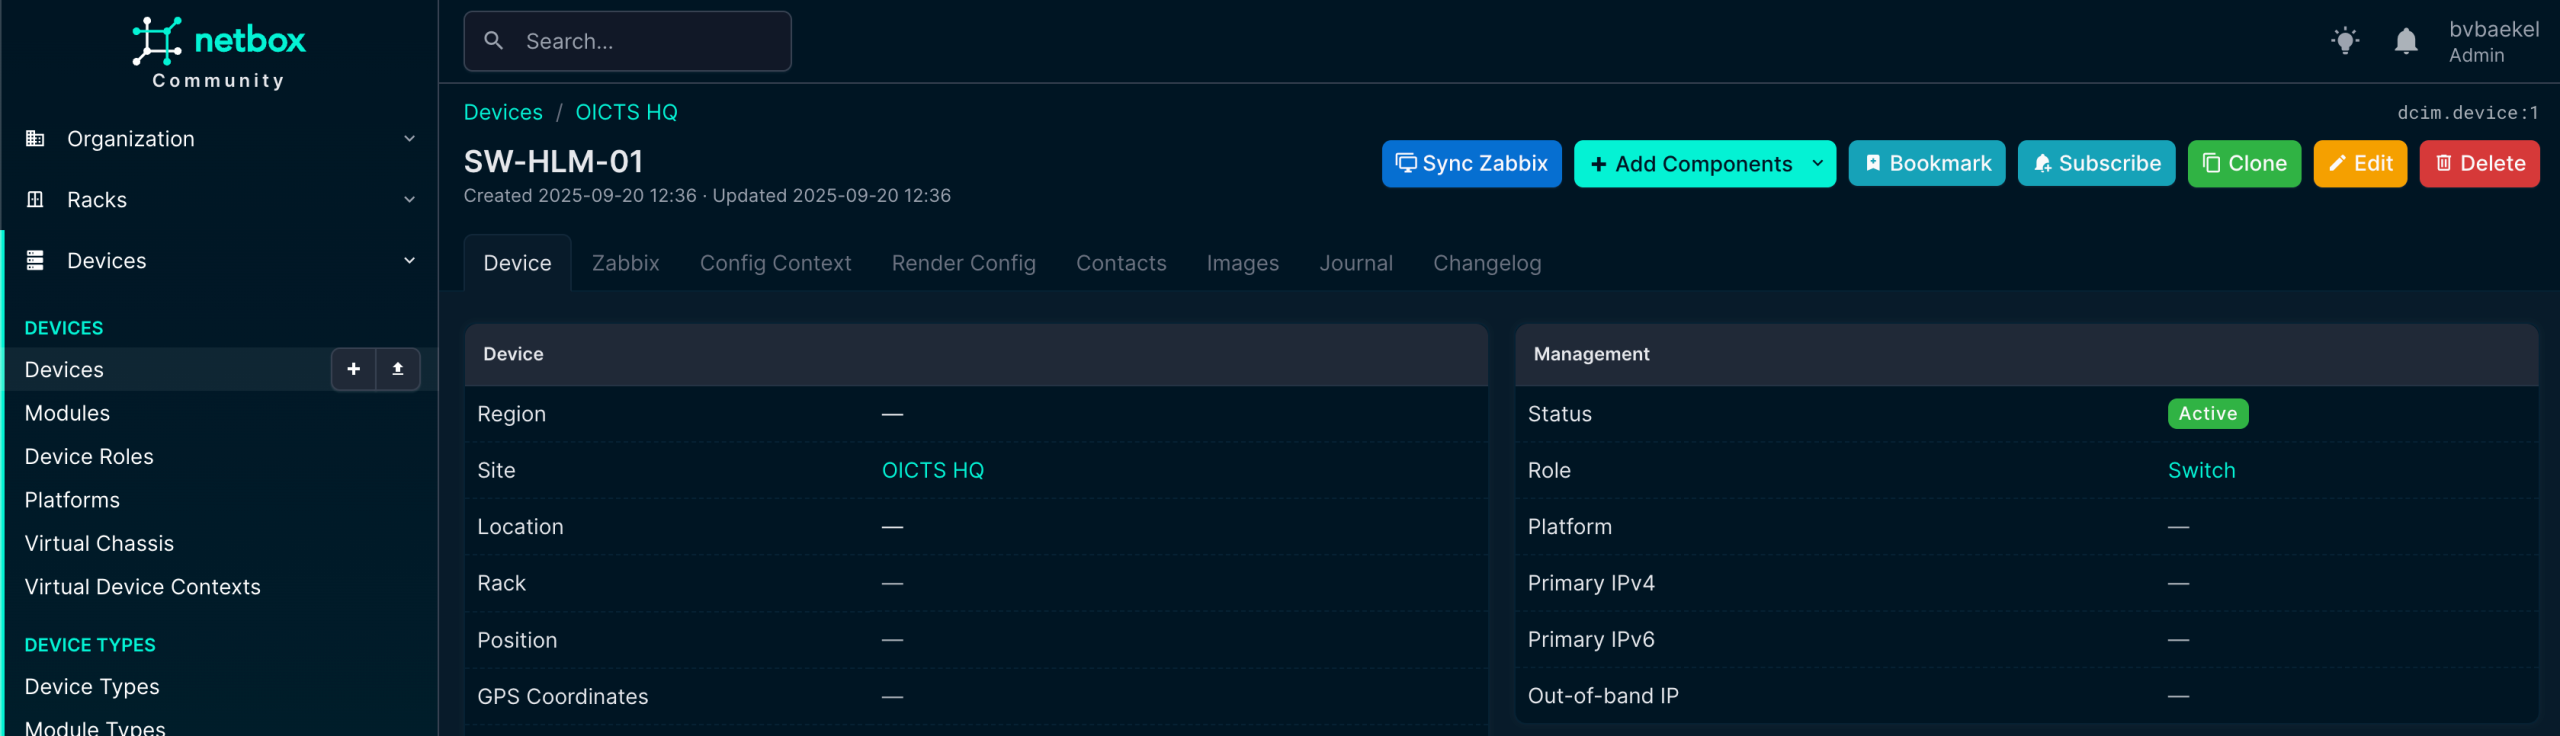
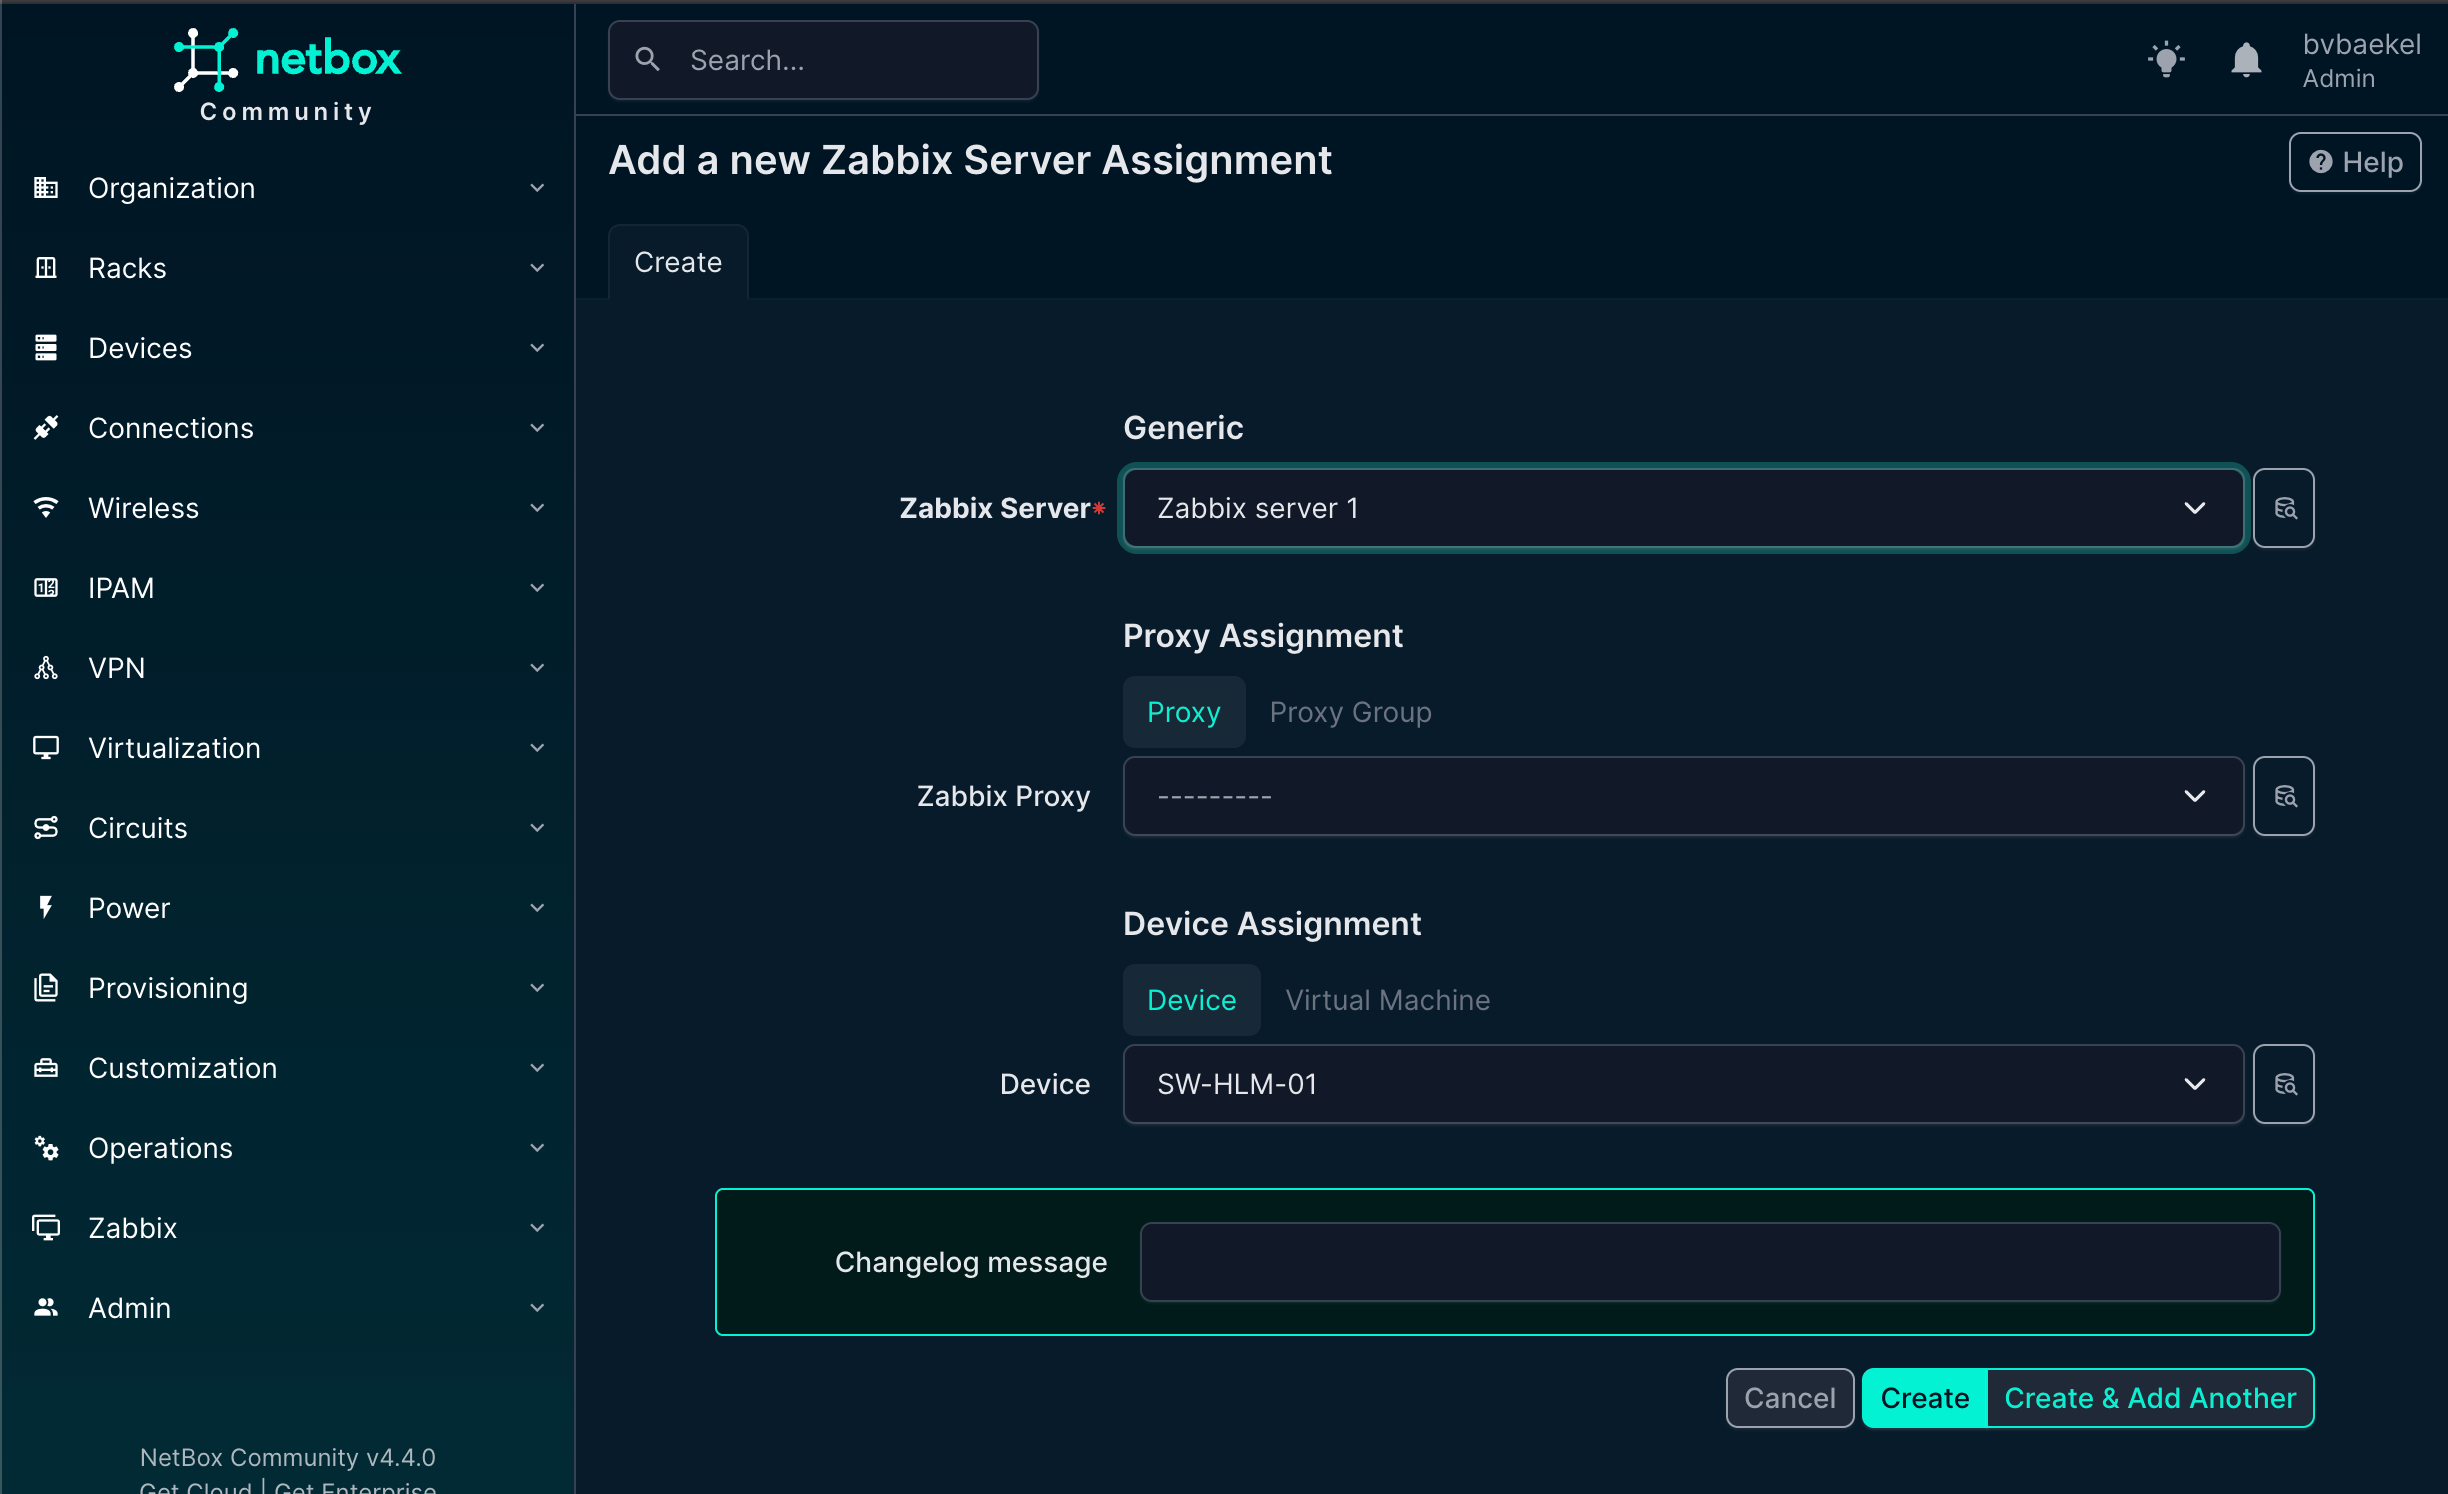
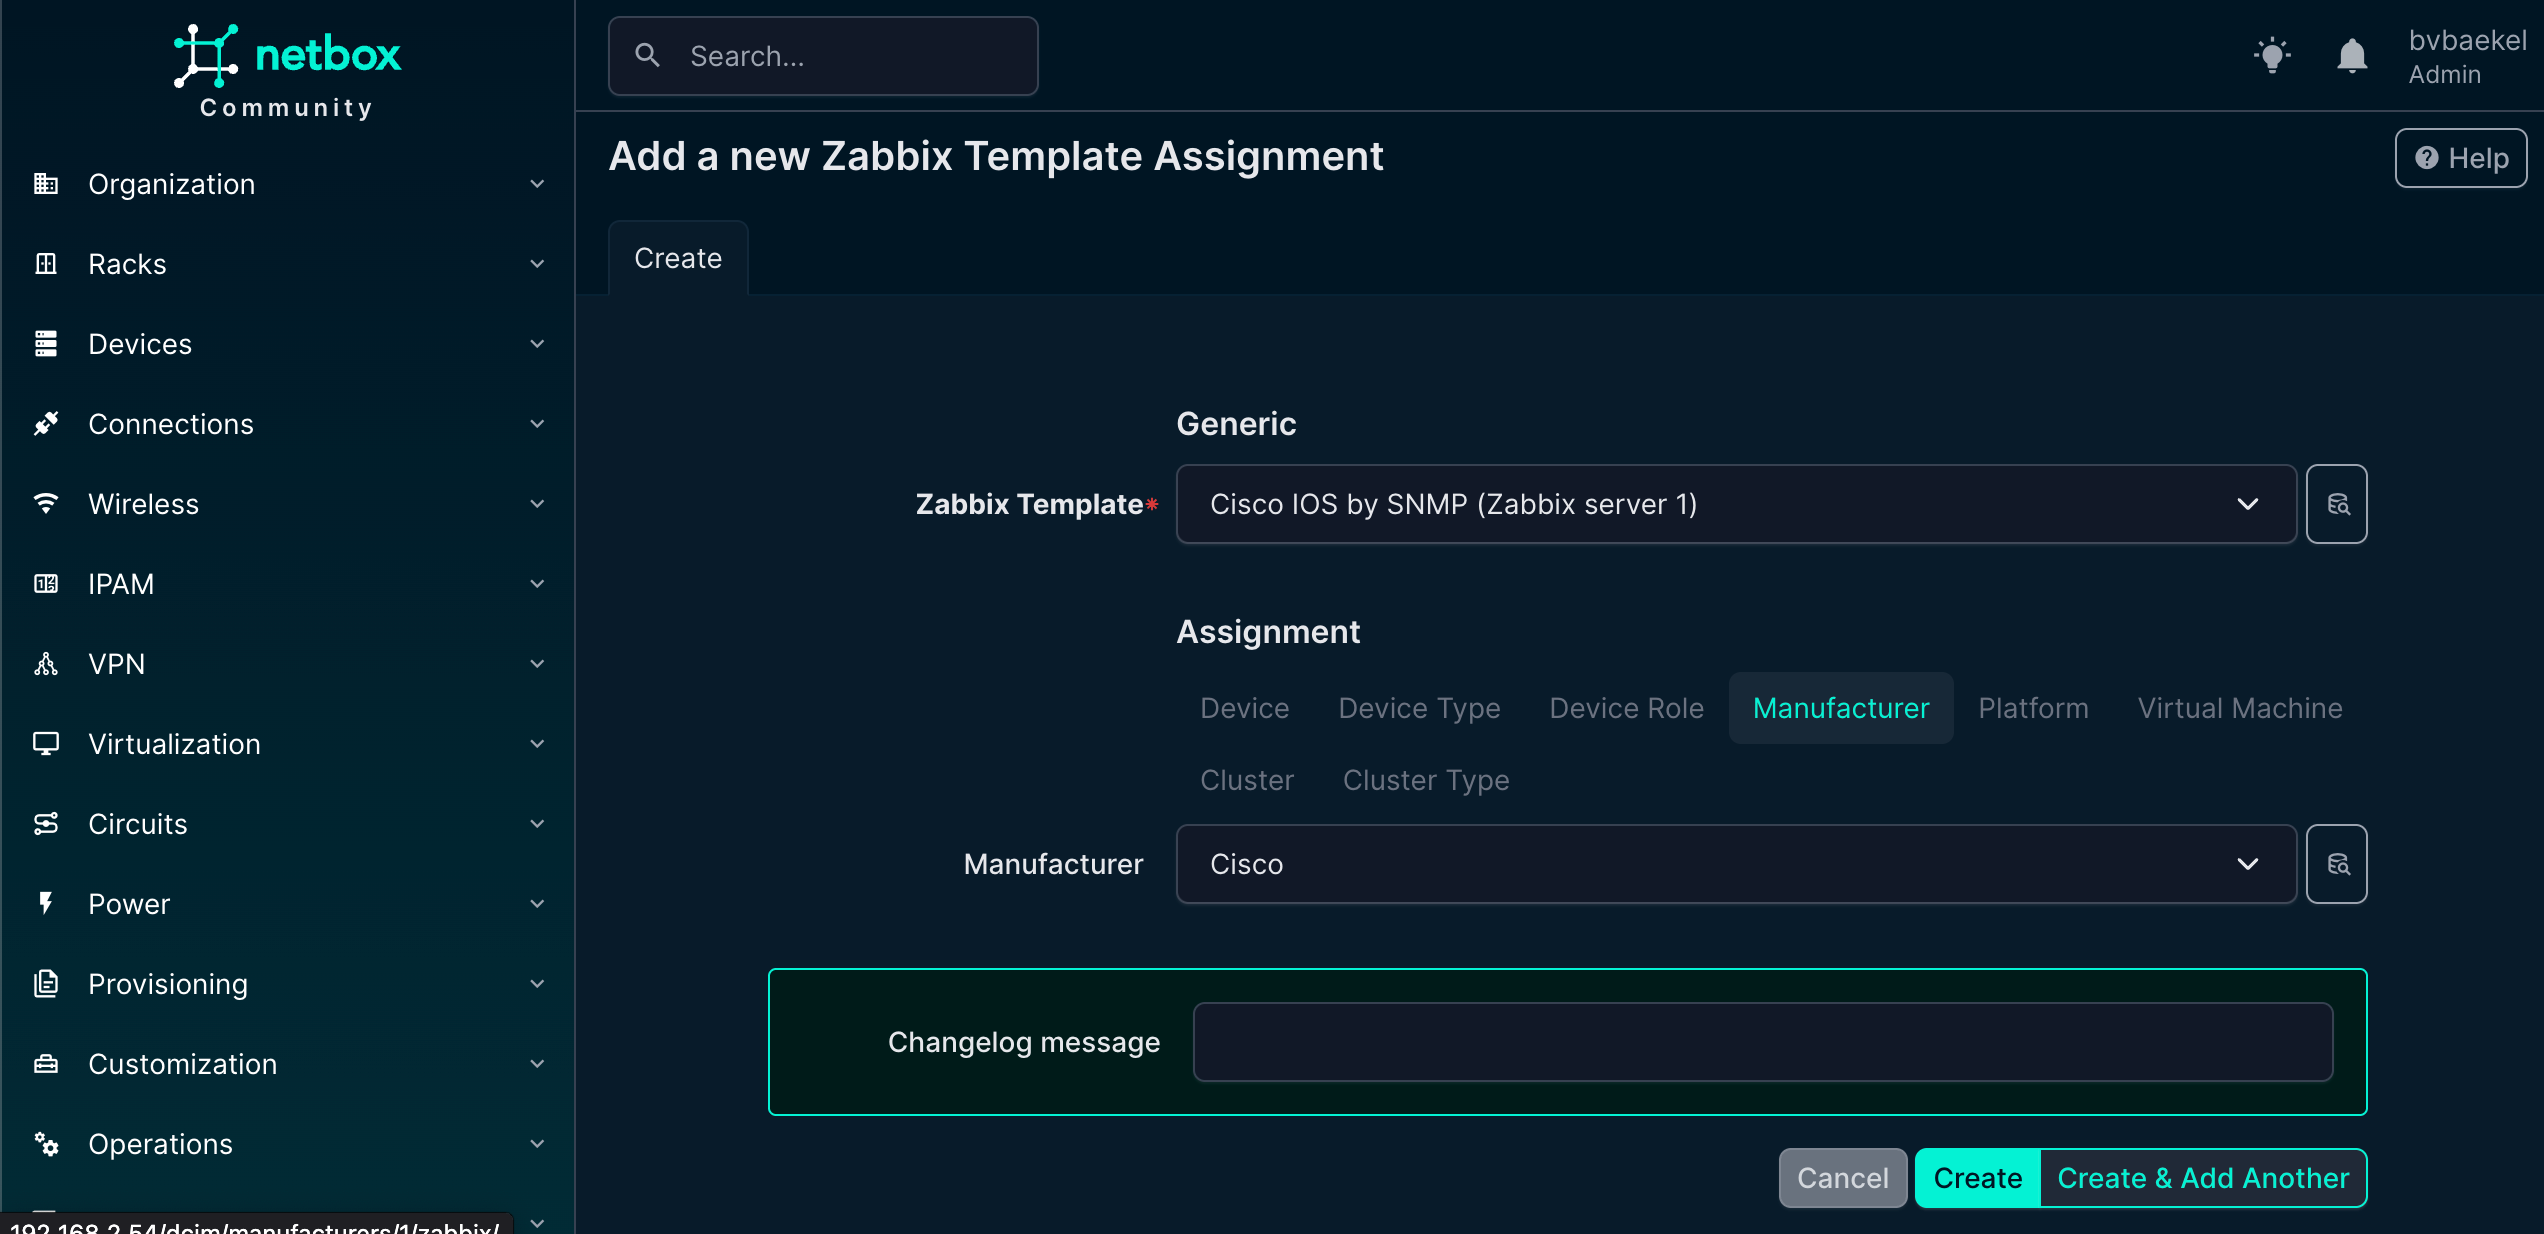
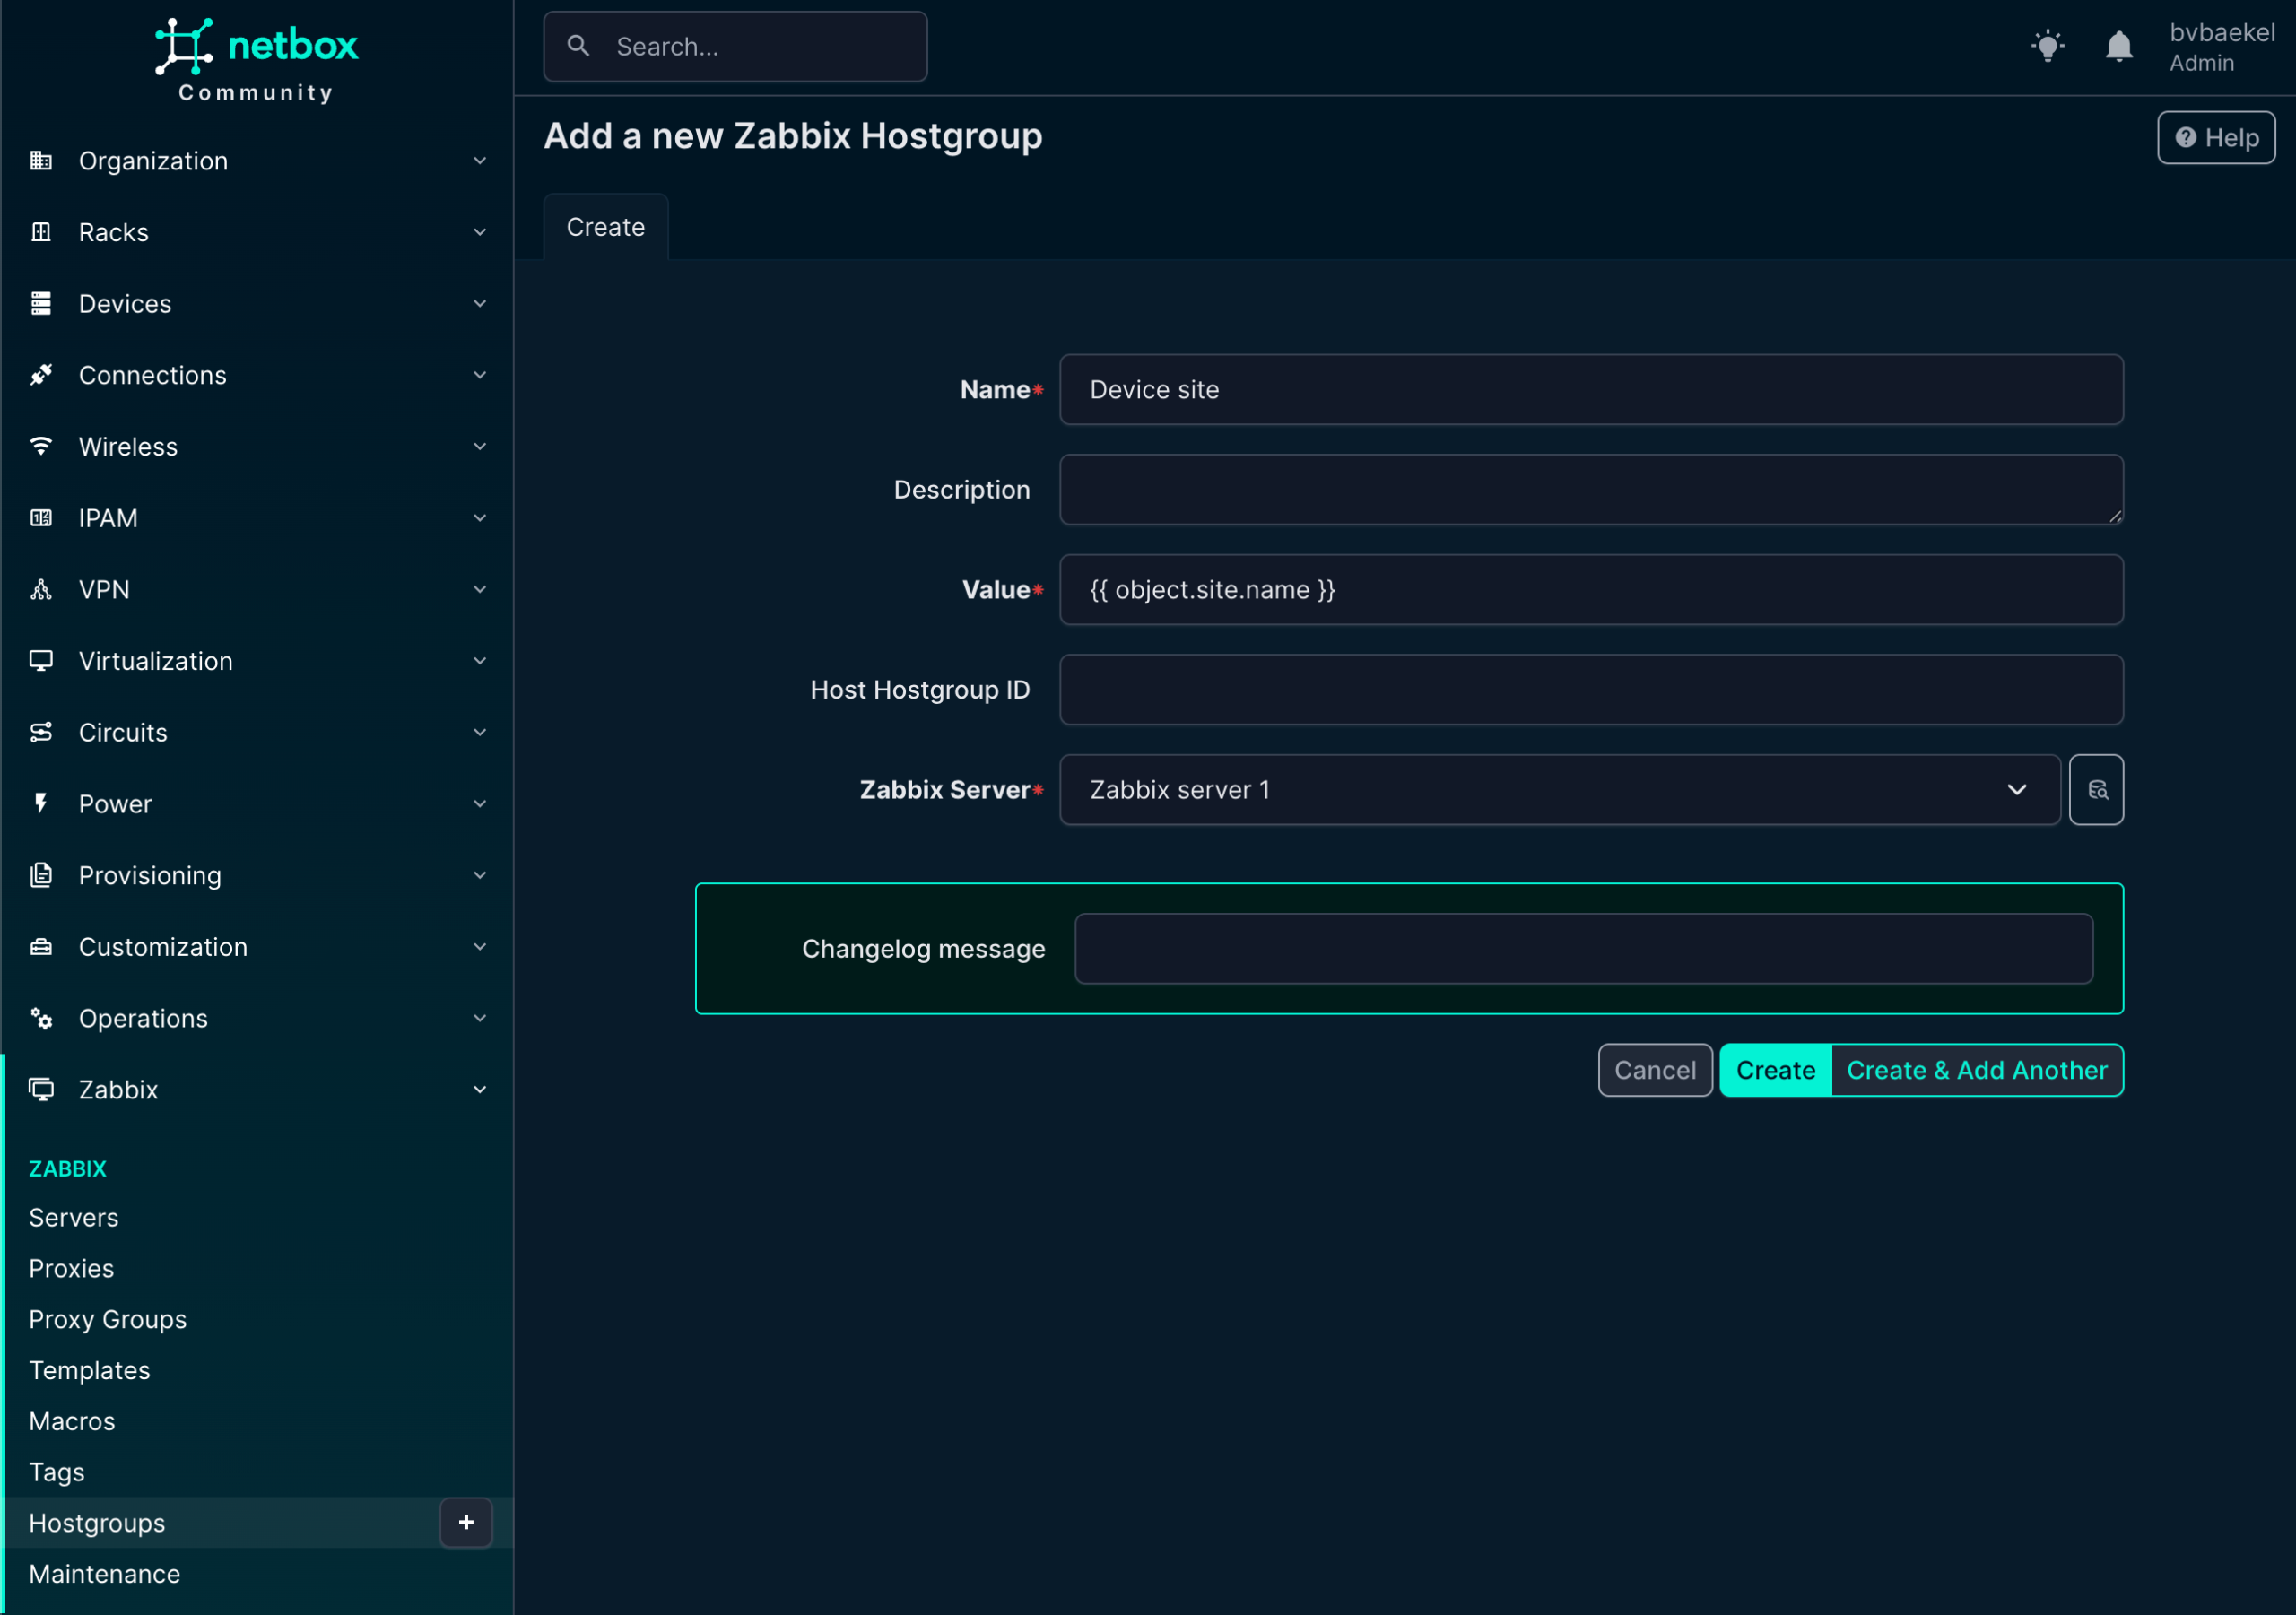
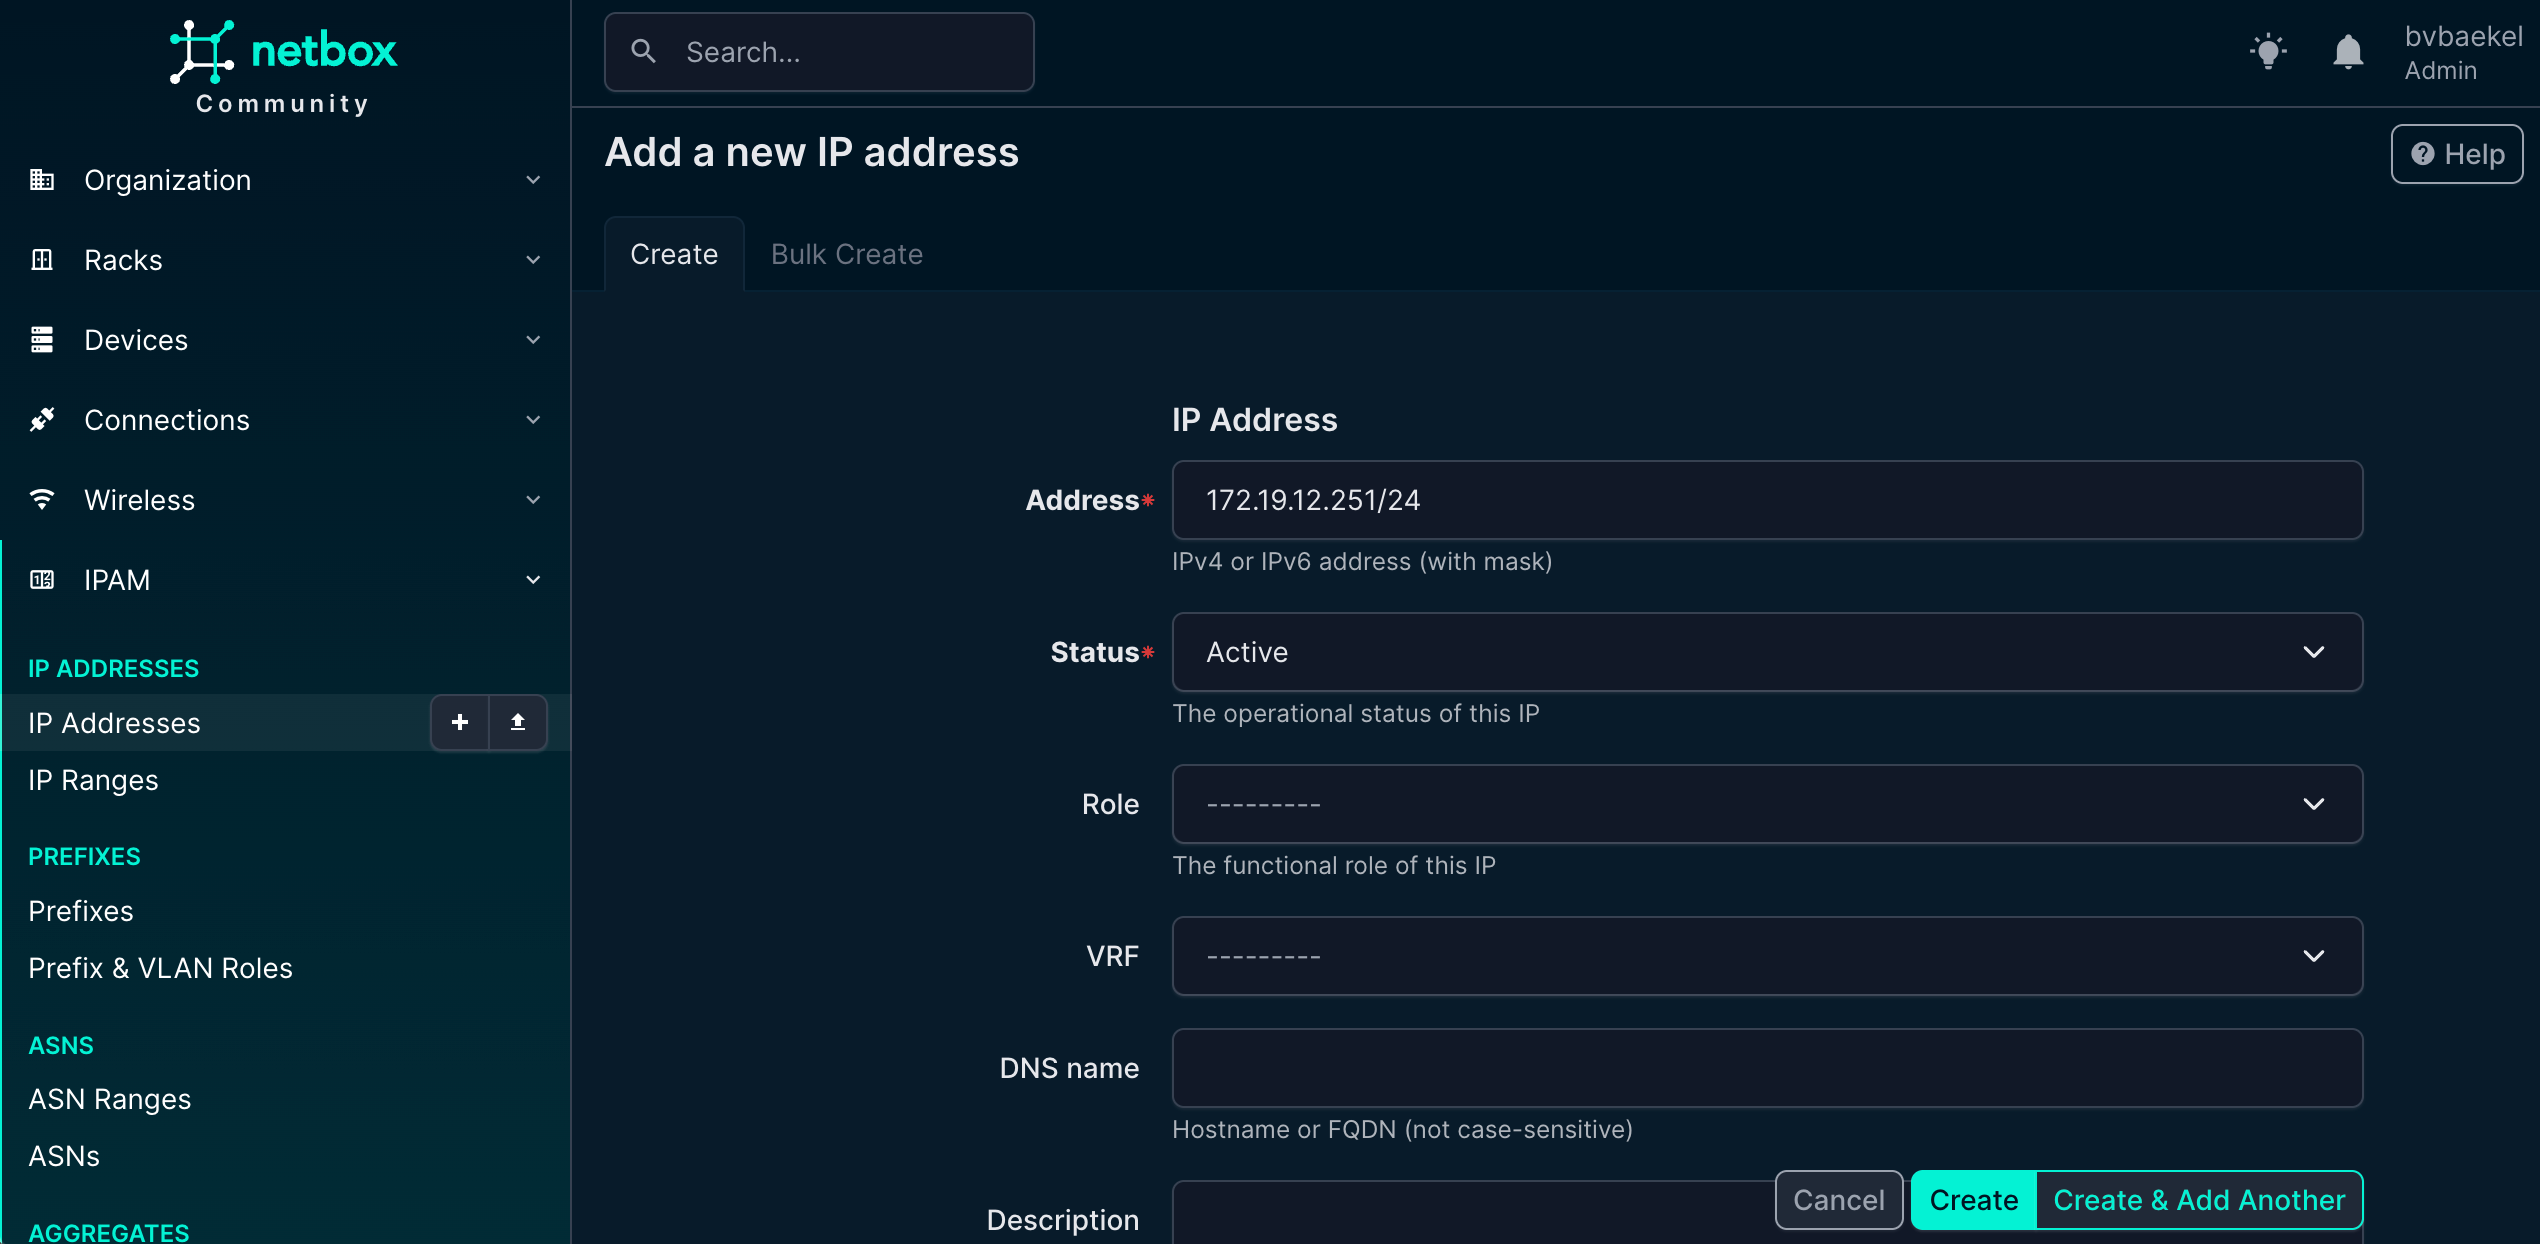
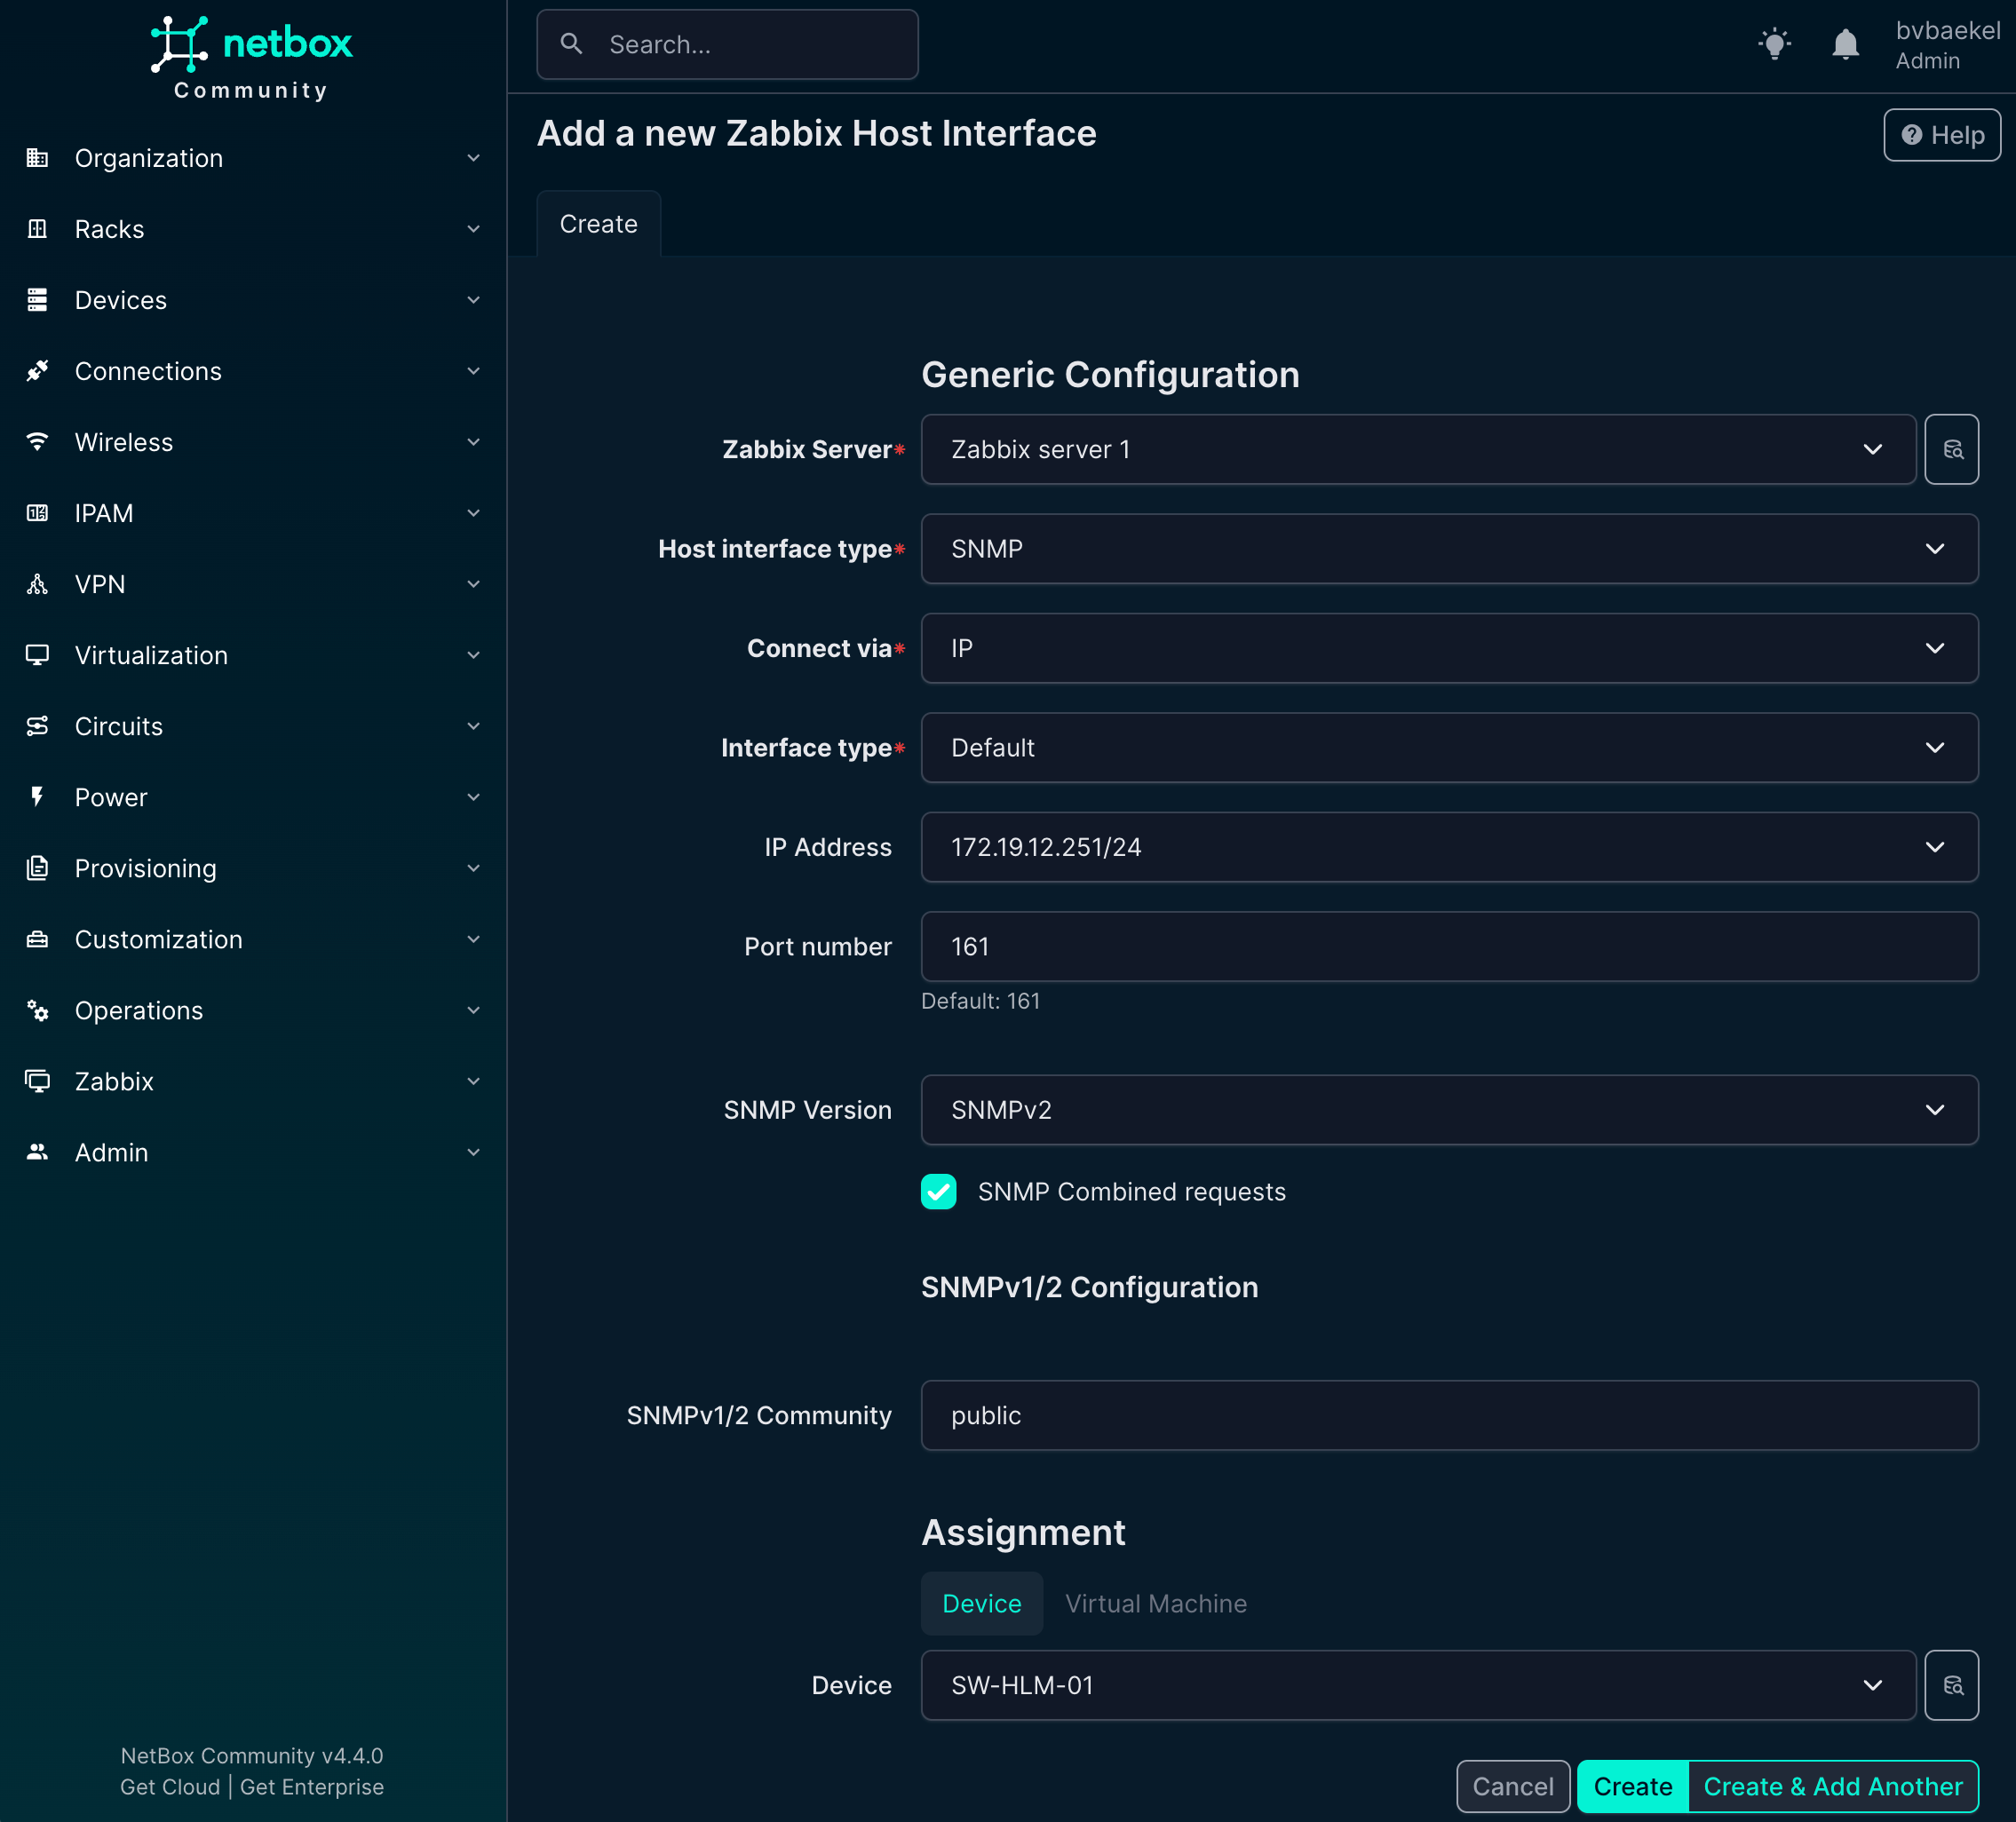
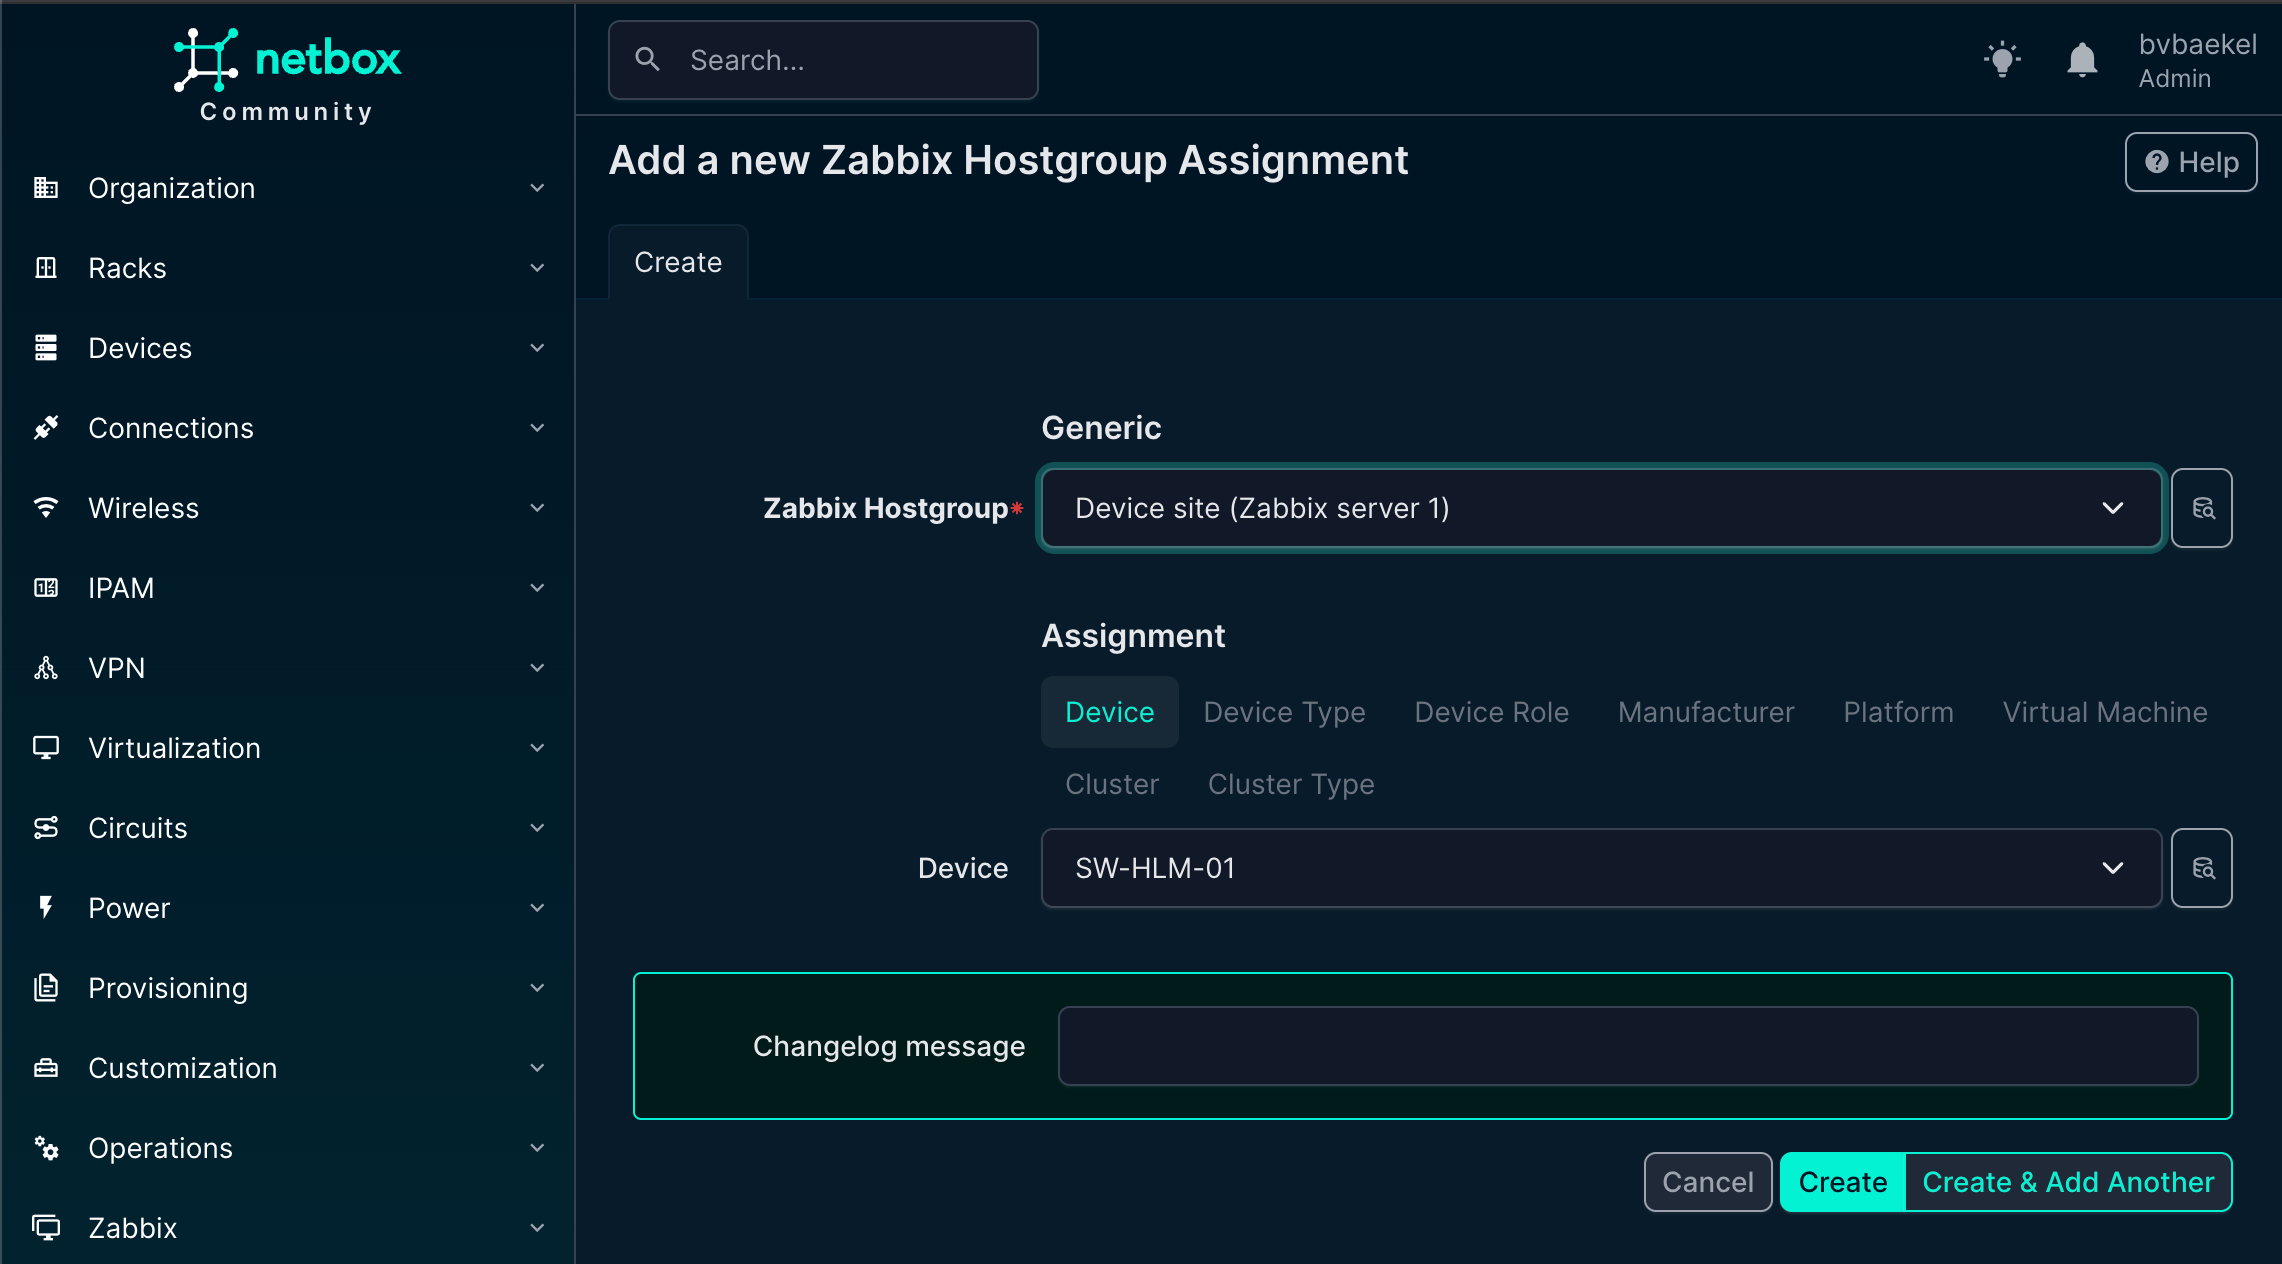
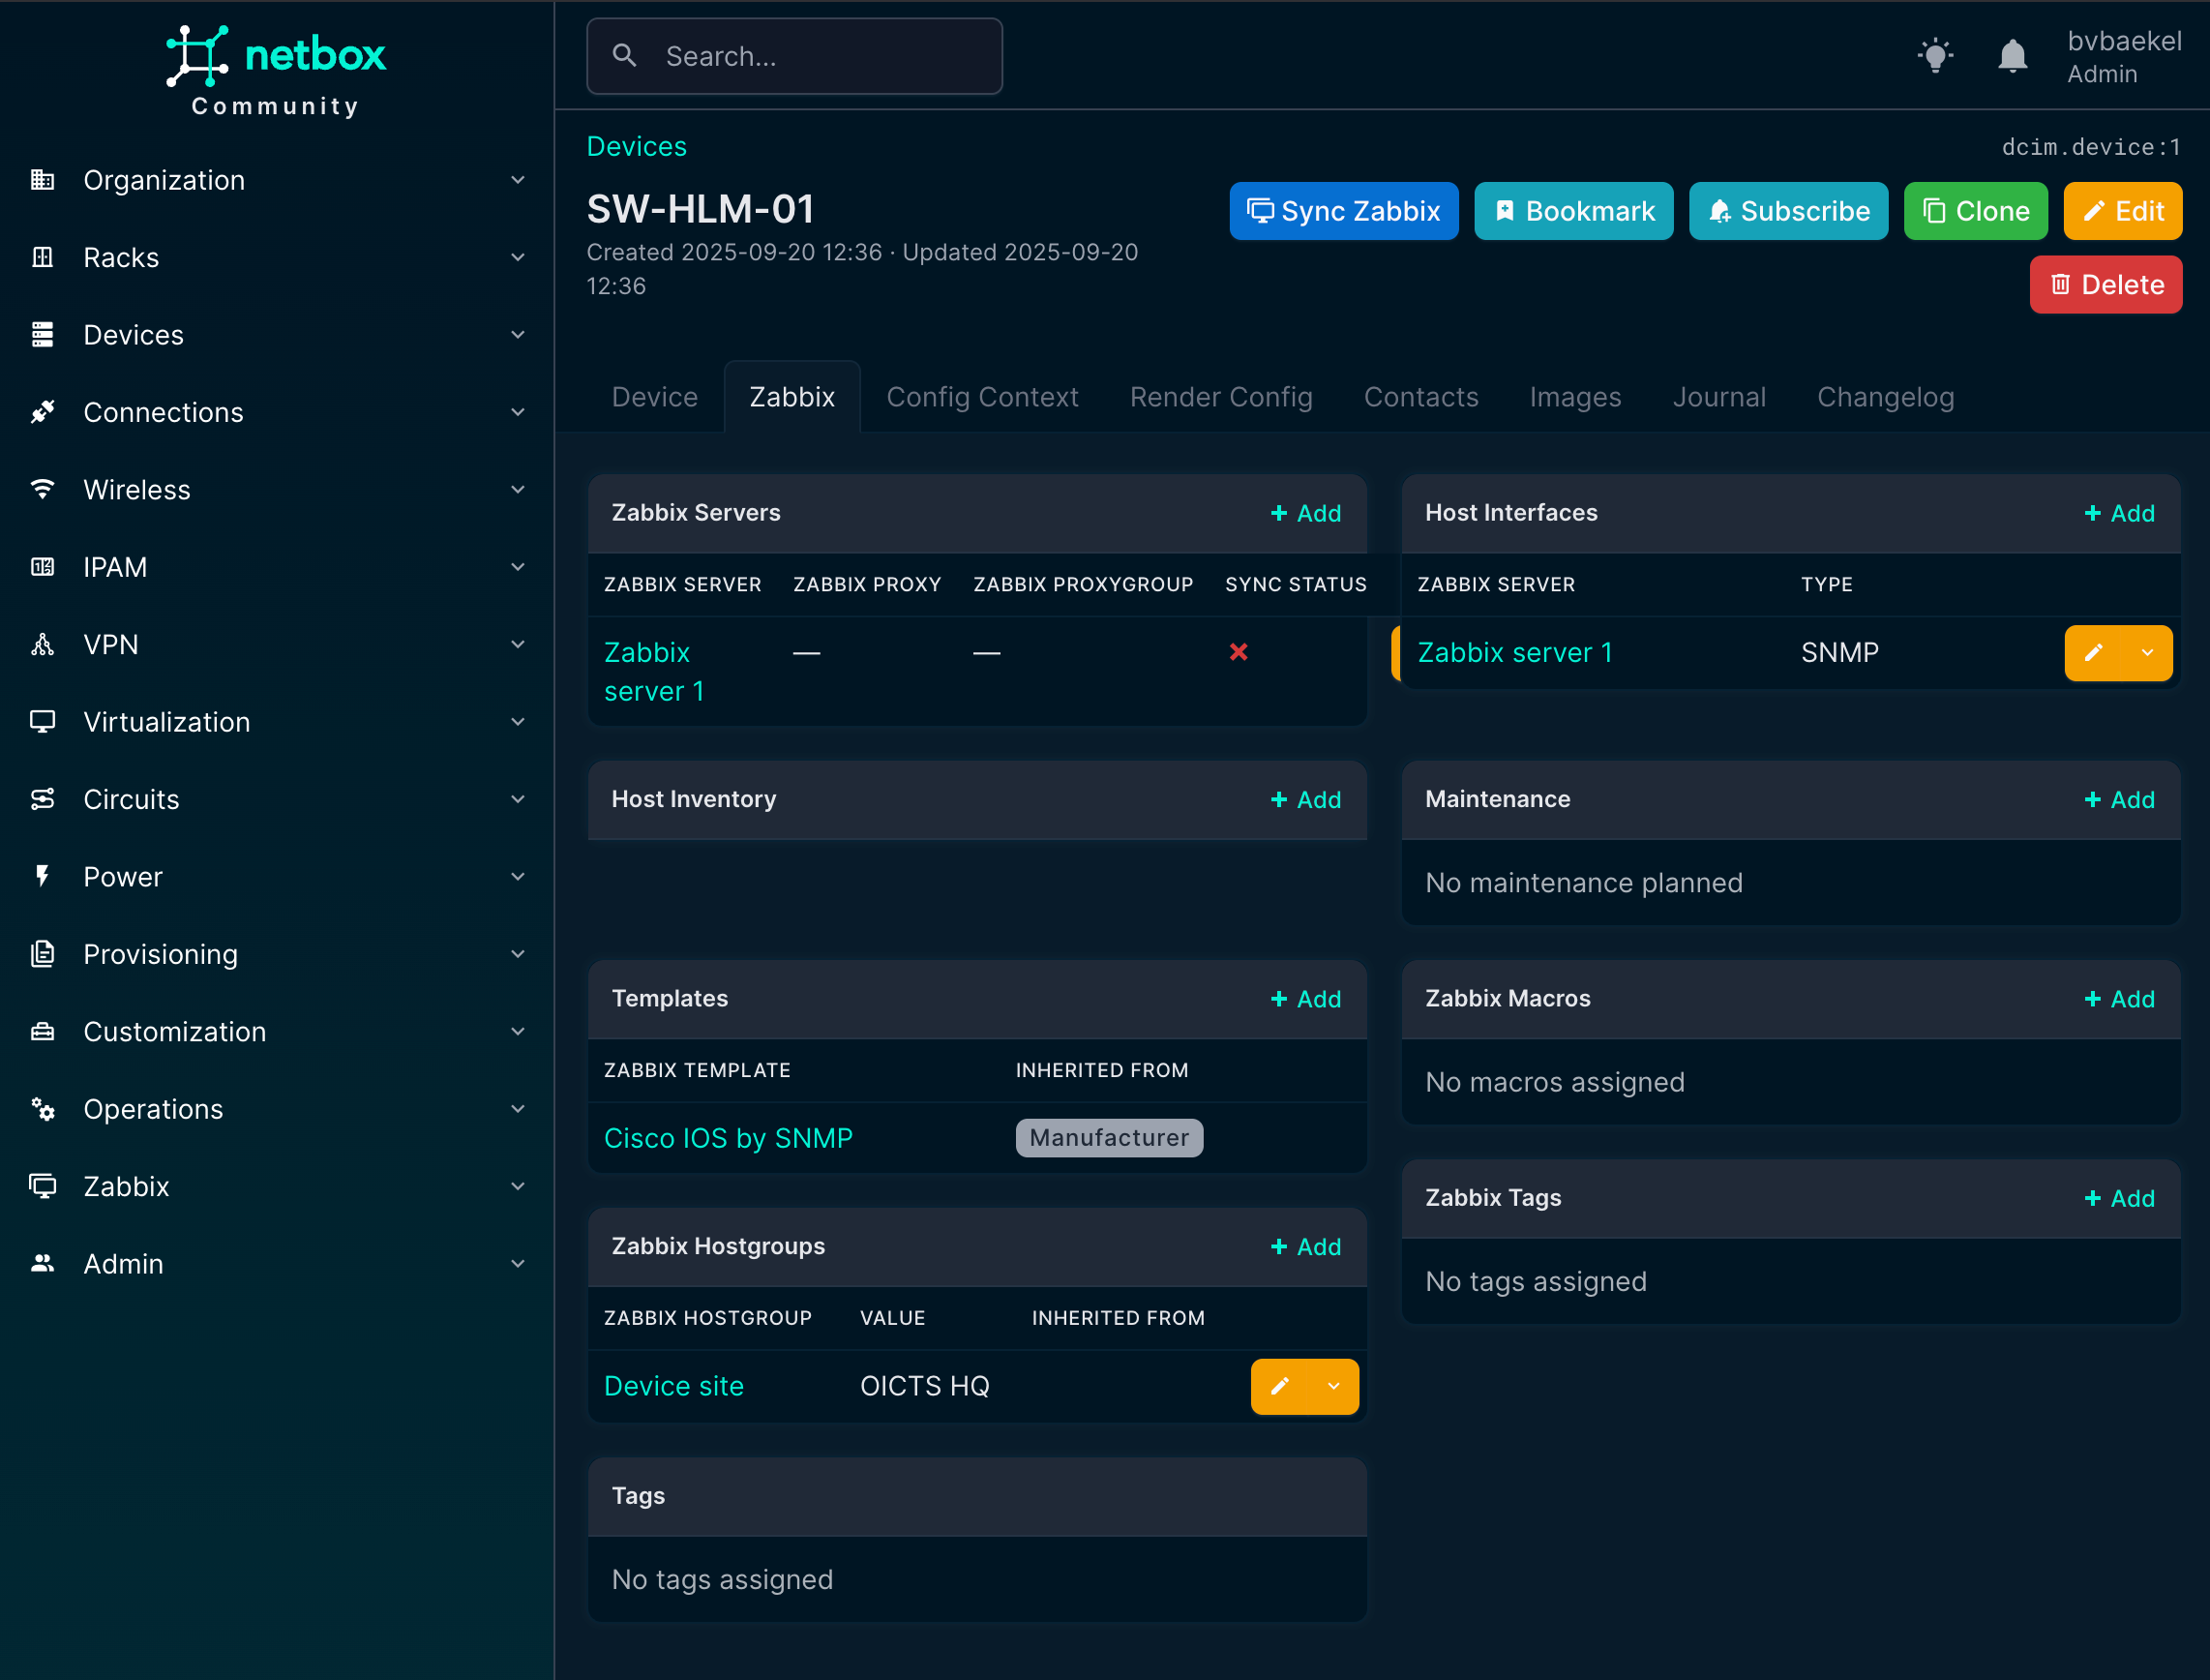
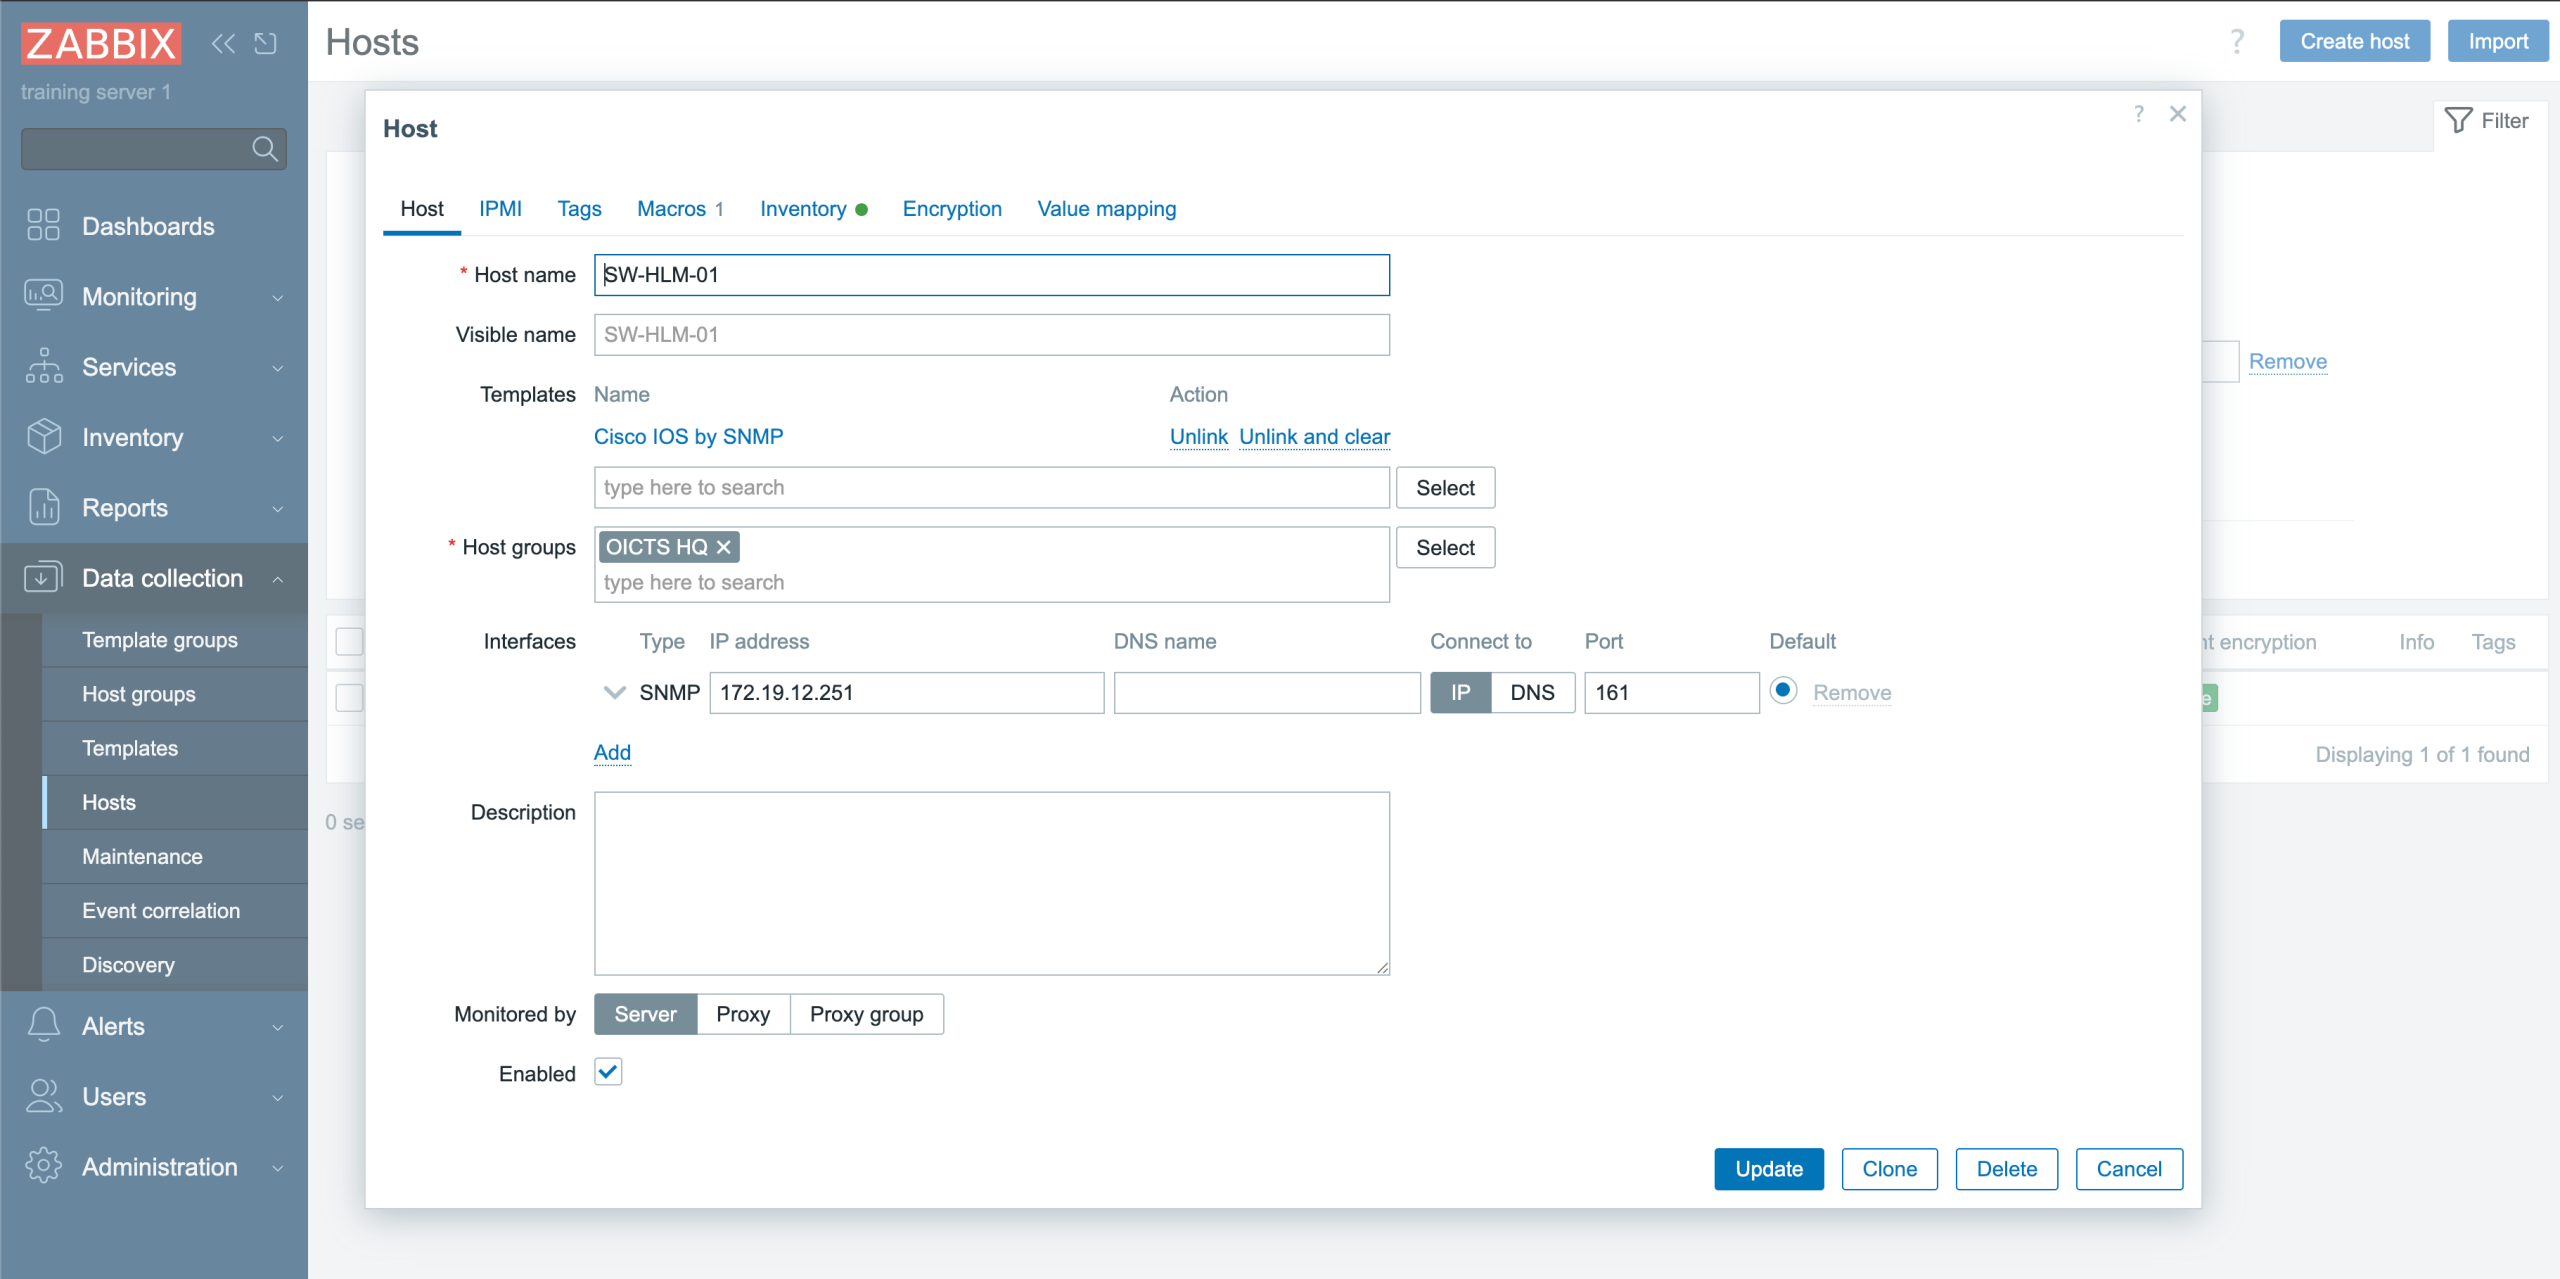


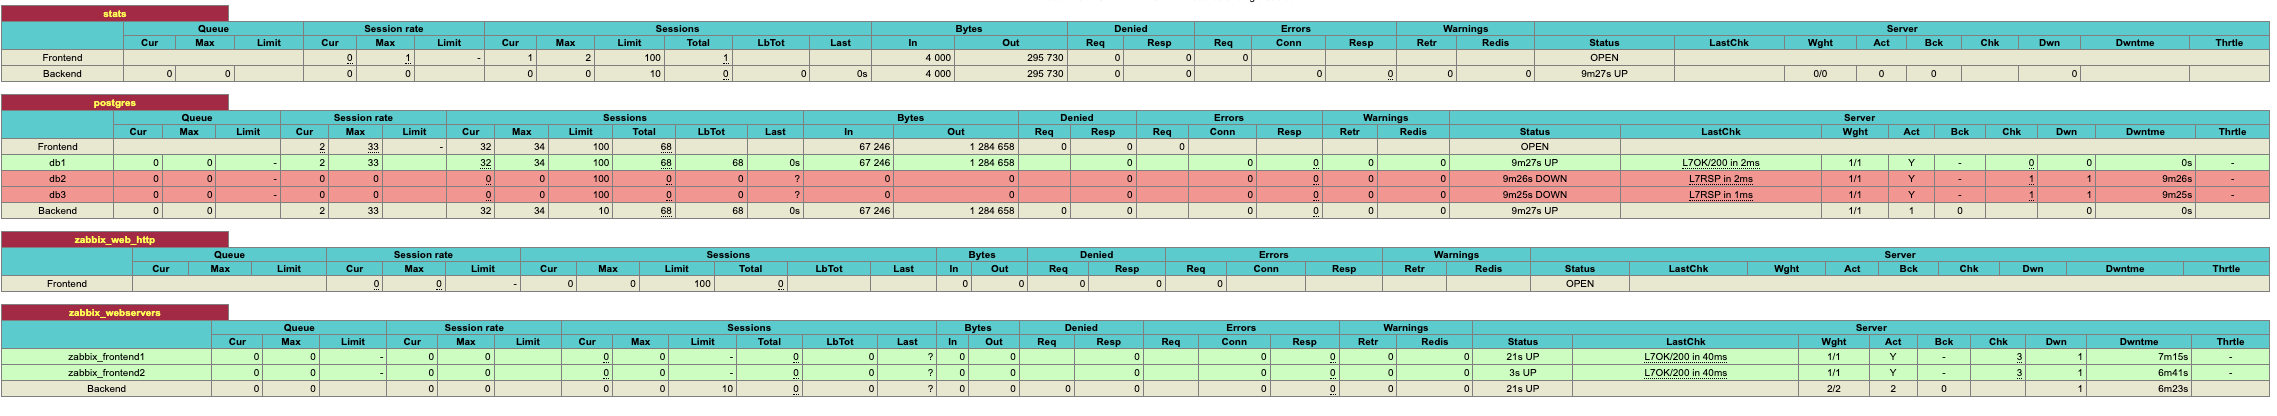
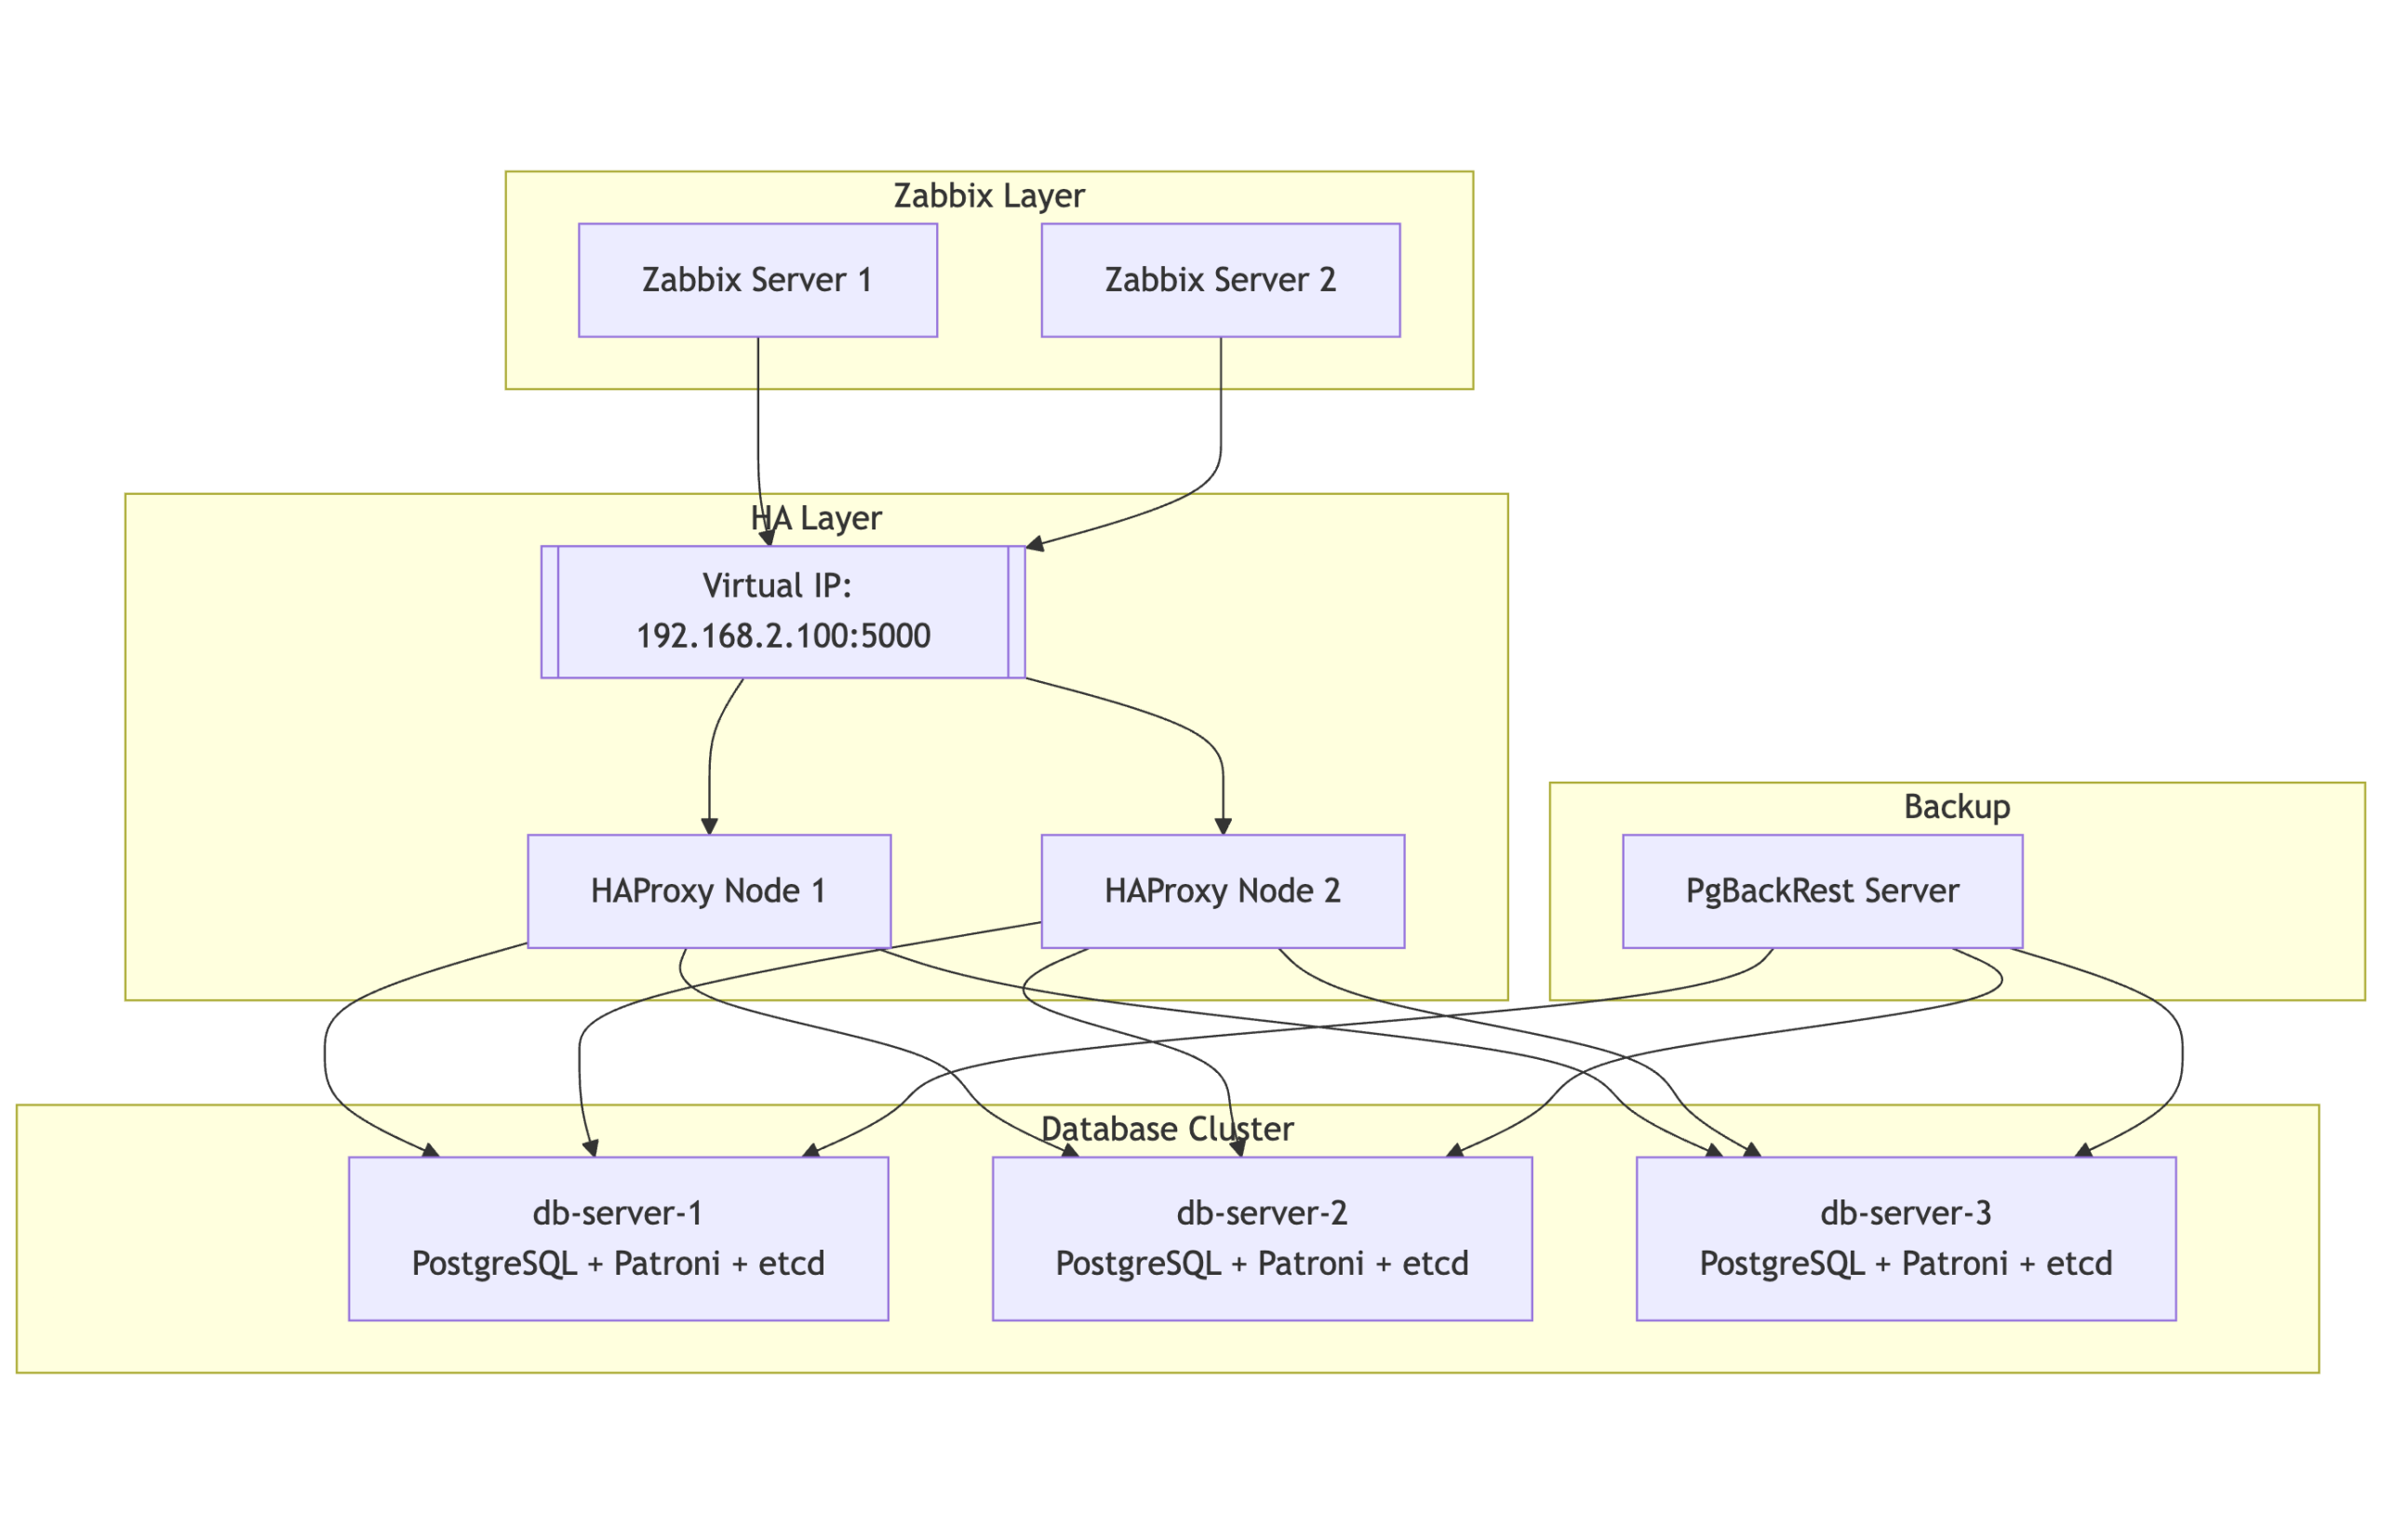

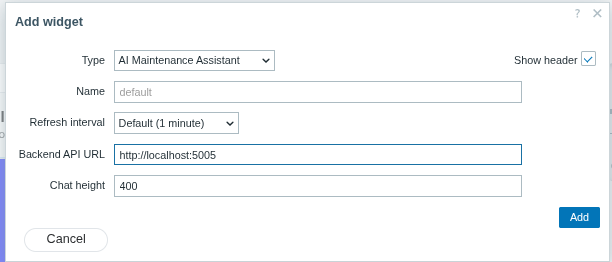
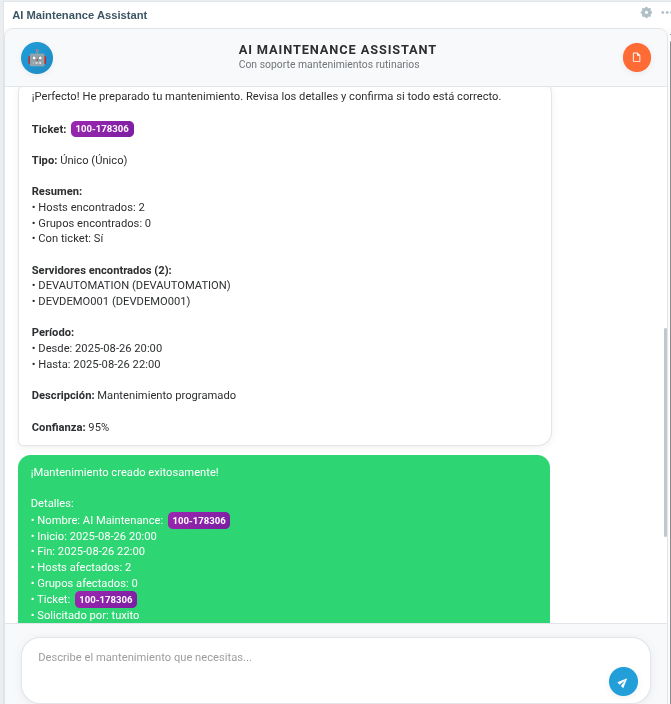
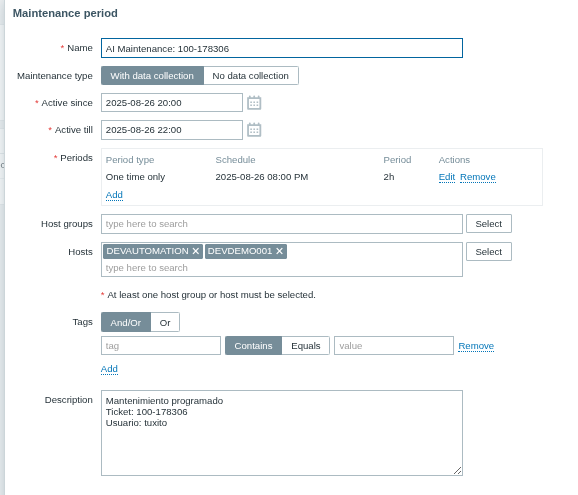
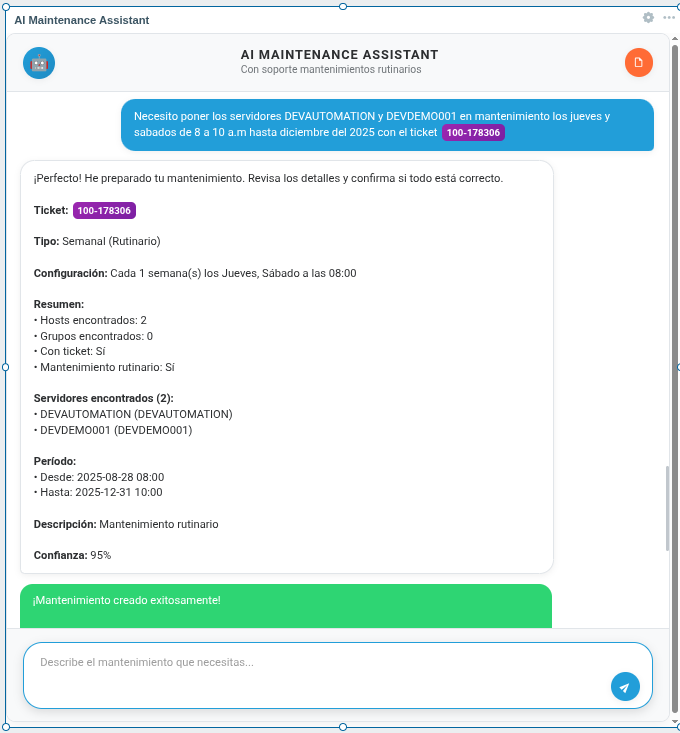

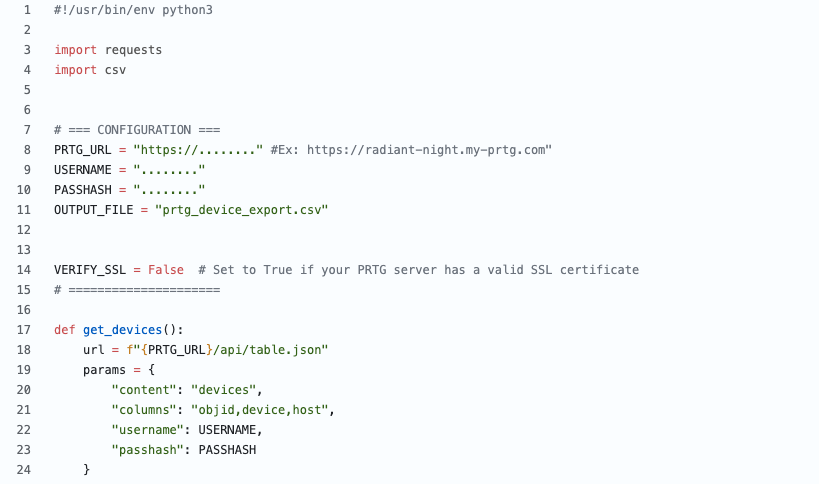
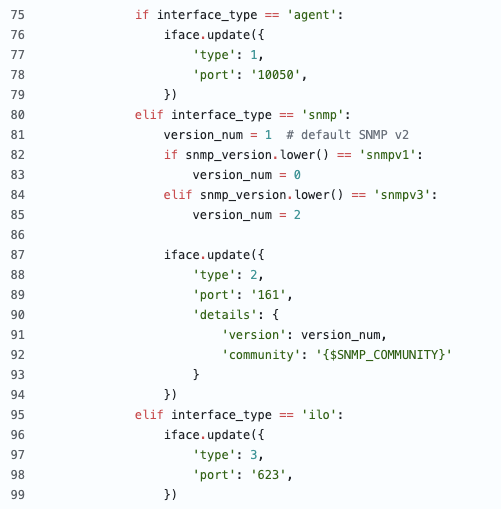
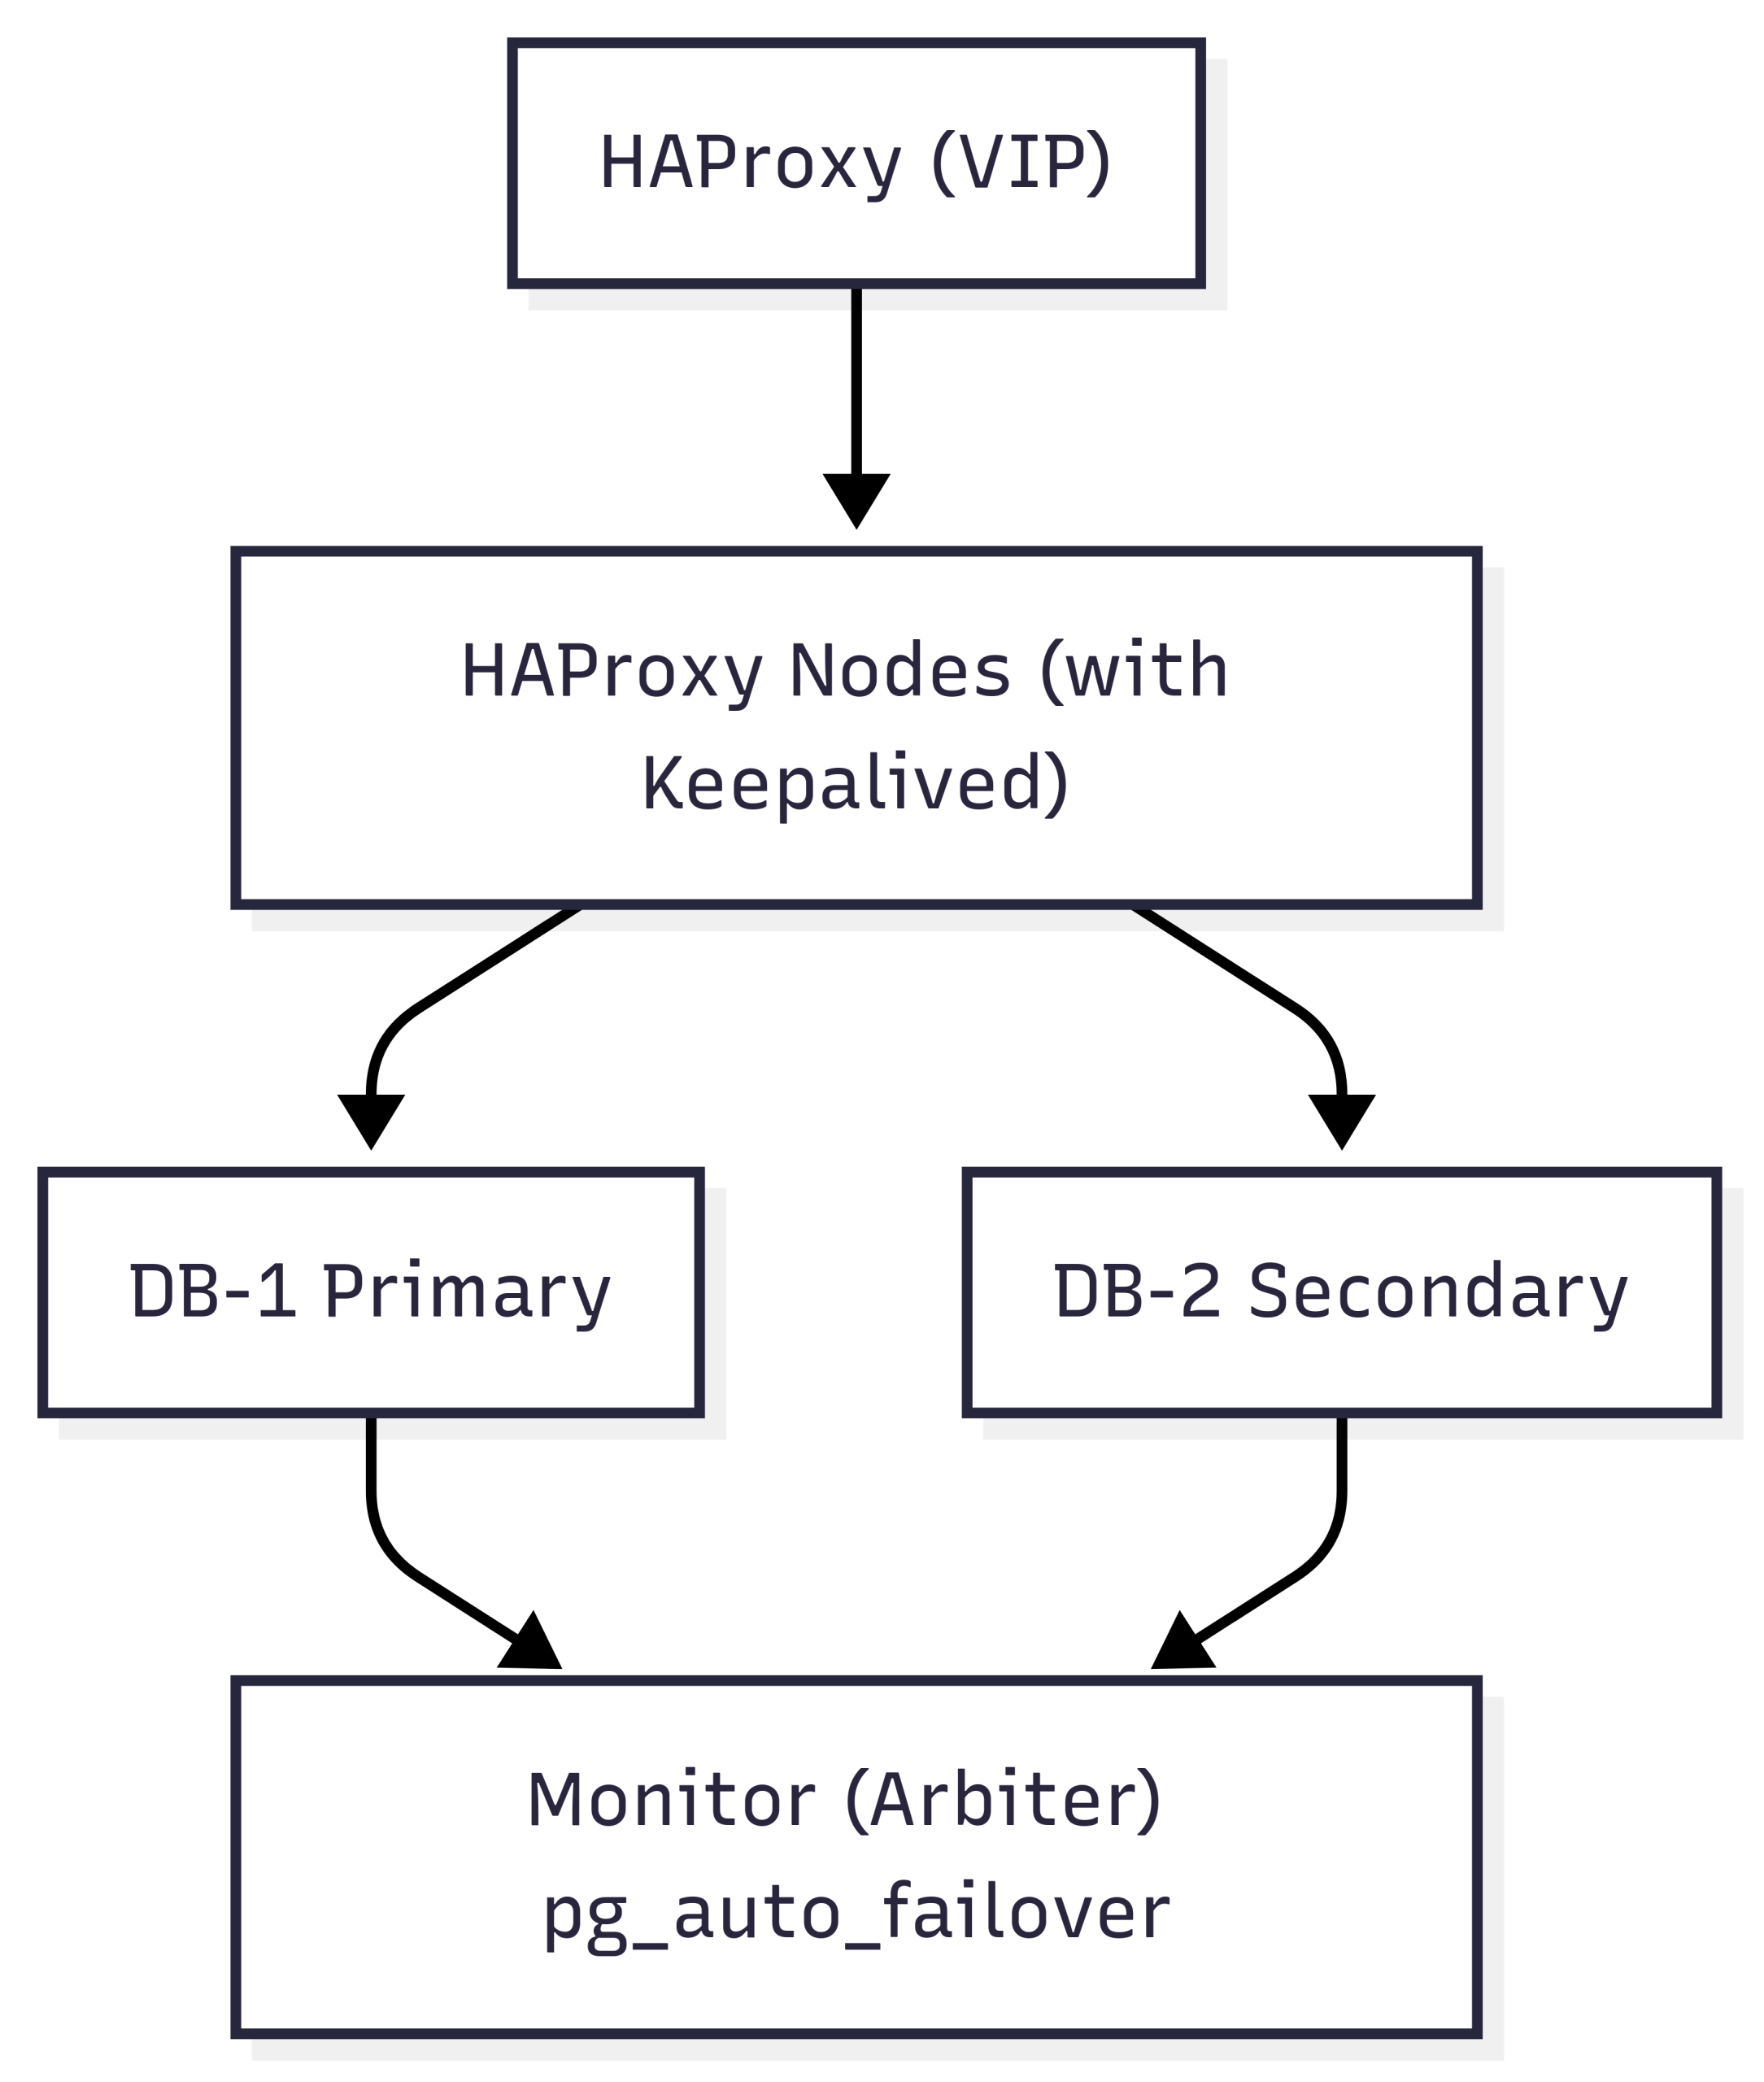
 Never expose your keys publicly!