All posts by Luis Morales

Implement Apache Flink near-online data enrichment patterns

Post Syndicated from Luis Morales original https://aws.amazon.com/blogs/big-data/implement-apache-flink-near-online-data-enrichment-patterns/

Stream data processing allows you to act on data in real time. Real-time data analytics can help you have on-time and optimized responses while improving the overall customer experience.

Data streaming workloads often require data in the stream to be enriched via external sources (such as databases or other data streams). Pre-loading of reference data provides low latency and high throughput. However, this pattern may not be suitable for certain types of workloads:

  • Reference data updates with high frequency
  • The streaming application needs to make an external call to compute the business logic
  • Accuracy of the output is important and the application shouldn’t use stale data
  • Cardinality of reference data is very high, and the reference dataset is too big to be held in the state of the streaming application

For example, if you’re receiving temperature data from a sensor network and need to get additional metadata of the sensors to analyze how these sensors map to physical geographic locations, you need to enrich it with sensor metadata data.

Apache Flink is a distributed computation framework that allows for stateful real-time data processing. It provides a single set of APIs for building batch and streaming jobs, making it easy for developers to work with bounded and unbounded data. Amazon Managed Service for Apache Flink (successor to Amazon Kinesis Data Analytics) is an AWS service that provides a serverless, fully managed infrastructure for running Apache Flink applications. Developers can build highly available, fault tolerant, and scalable Apache Flink applications with ease and without needing to become an expert in building, configuring, and maintaining Apache Flink clusters on AWS.

You can use several approaches to enrich your real-time data in Amazon Managed Service for Apache Flink depending on your use case and Apache Flink abstraction level. Each method has different effects on the throughput, network traffic, and CPU (or memory) utilization. For a general overview of data enrichment patterns, refer to Common streaming data enrichment patterns in Amazon Managed Service for Apache Flink.

This post covers how you can implement data enrichment for near-online streaming events with Apache Flink and how you can optimize performance. To compare the performance of the enrichment patterns, we ran performance testing based on synthetic data. The result of this test is useful as a general reference. It’s important to note that the actual performance for your Flink workload will depend on various and different factors, such as API latency, throughput, size of the event, and cache hit ratio.

We discuss three enrichment patterns, detailed in the following table.

. Synchronous Enrichment Asynchronous Enrichment Synchronous Cached Enrichment
Enrichment approach Synchronous, blocking per-record requests to the external endpoint Non-blocking parallel requests to the external endpoint, using asynchronous I/O Frequently accessed information is cached in the Flink application state, with a fixed TTL
Data freshness Always up-to-date enrichment data Always up-to-date enrichment data Enrichment data may be stale, up to the TTL
Development complexity Simple model Harder to debug, due to multi-threading Harder to debug, due to relying on Flink state
Error handling Straightforward More complex, using callbacks Straightforward
Impact on enrichment API Max: one request per message Max: one request per message Reduce I/O to enrichment API (depends on cache TTL)
Application latency Sensitive to enrichment API latency Less sensitive to enrichment API latency Reduce application latency (depends on cache hit ratio)
Other considerations none none

Customizable TTL.

Only synchronous implementation as of Flink 1.17

Result of the comparative test (Throughput) ~350 events per second ~2,000 events per second ~28,000 events per second

Solution overview

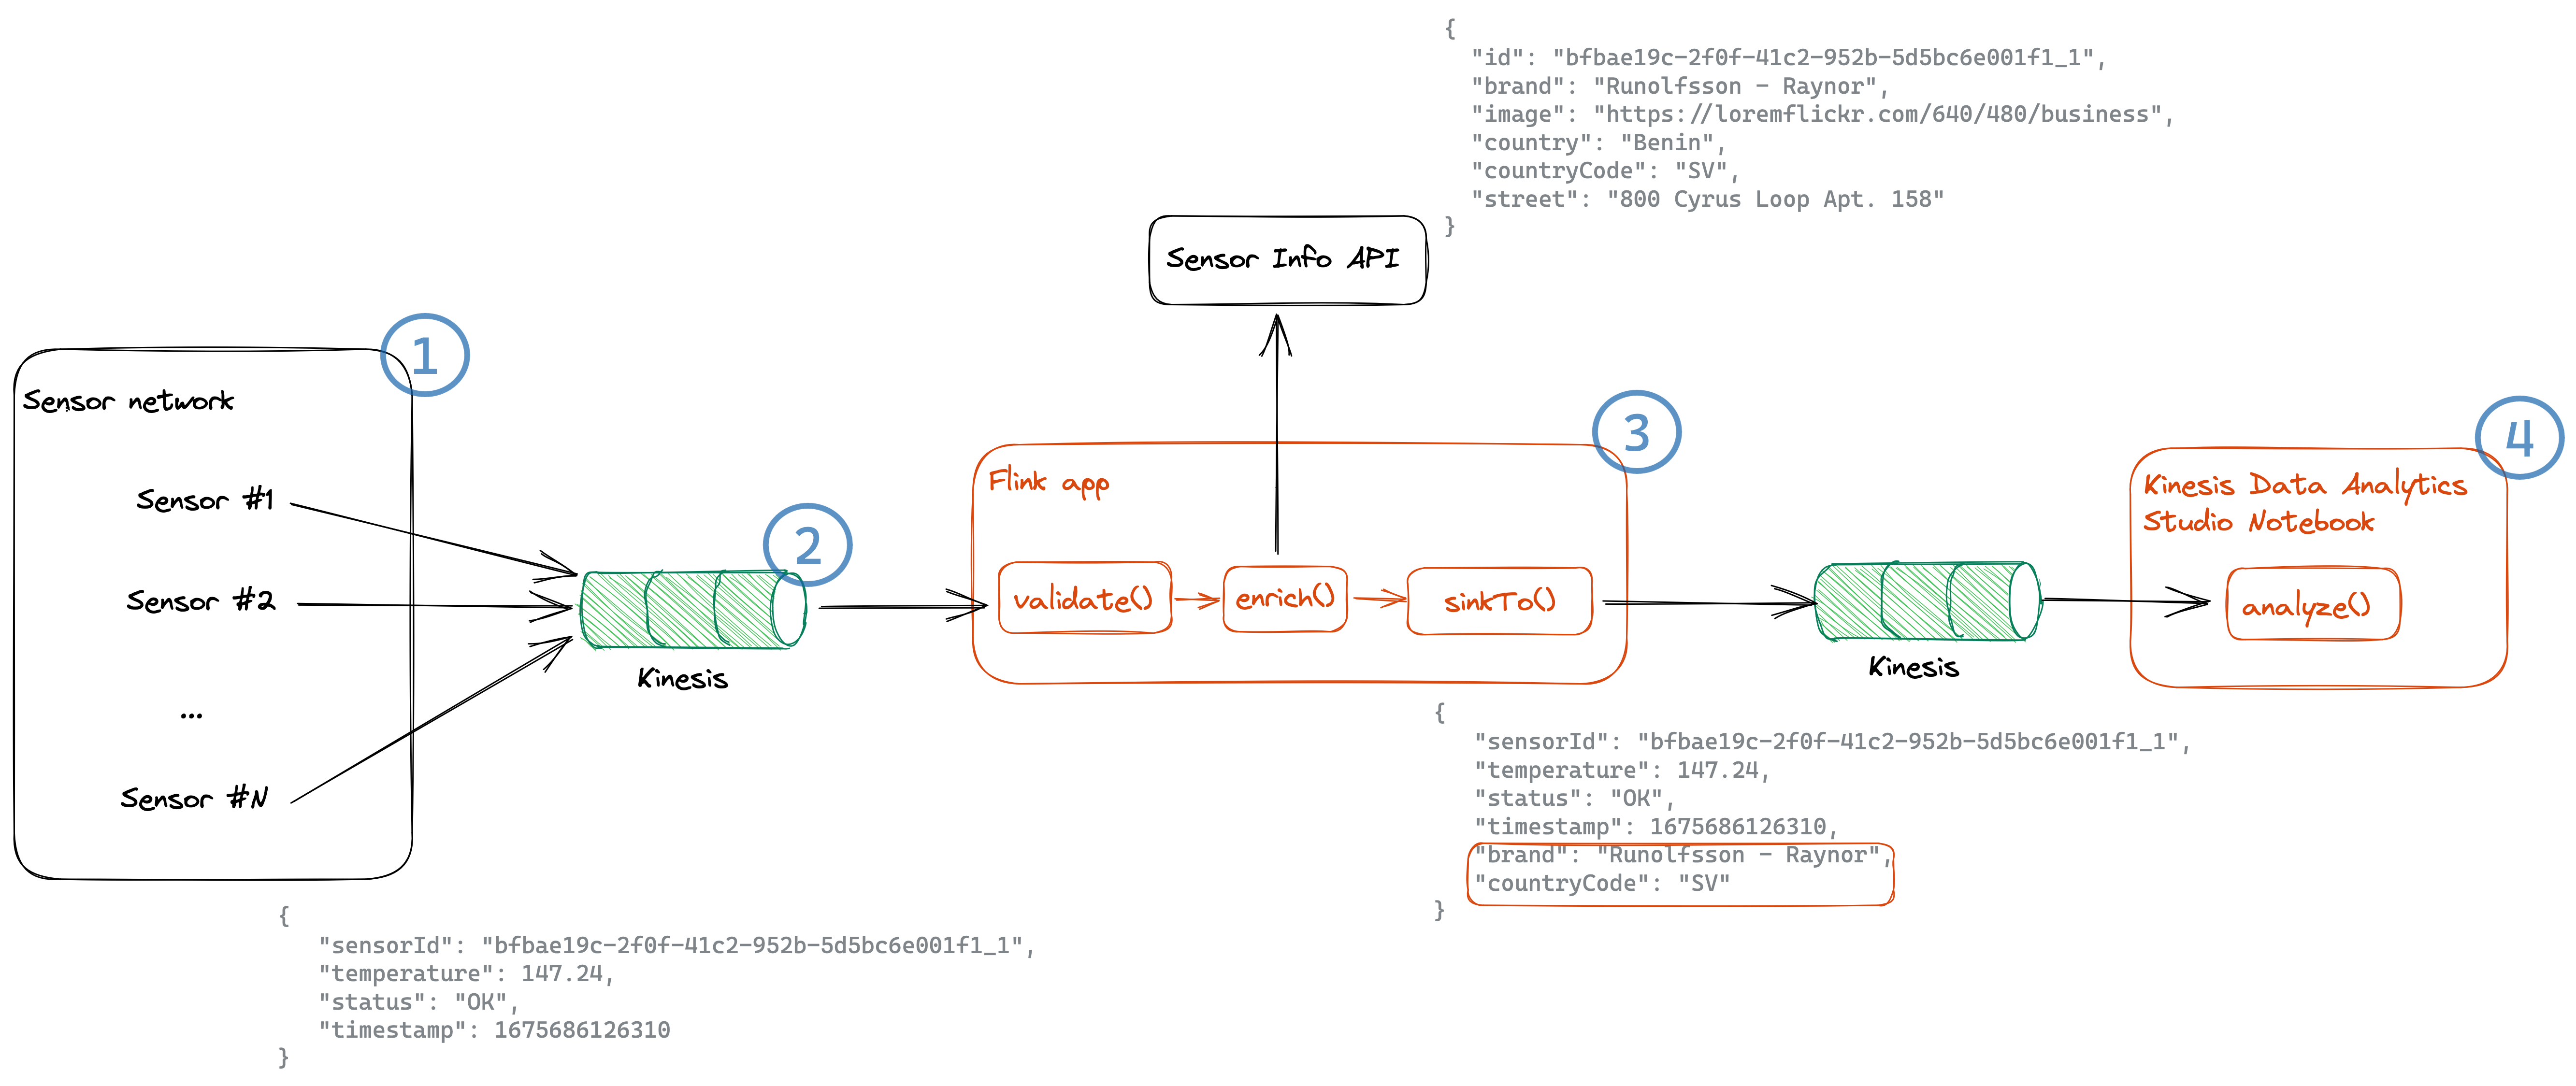
For this post, we use an example of a temperature sensor network (component 1 in the following architecture diagram) that emits sensor information, such as temperature, sensor ID, status, and the timestamp this event was produced. These temperature events get ingested into Amazon Kinesis Data Streams (2). Downstream systems also require the brand and country code information of the sensors, in order to analyze, for example, the reliability per brand and temperature per plant side.

Based on the sensor ID, we enrich this sensor information from the Sensor Info API (3), which provide us with information of the brand, location, and an image. The resulting enriched stream is sent to another Kinesis data stream and can then be analyzed in an Amazon Managed Service for Apache Flink Studio notebook (4).

Solution overview

Prerequisites

To get started with implementing near-online data enrichment patterns, you can clone or download the code from the GitHub repository. This repository implements the Flink streaming application we described. You can find the instructions on how to set up Flink in either Amazon Managed Service for Apache Flink or other available Flink deployment options in the README.md file.

If you want to learn how these patterns are implemented and how to optimize performance for your Flink application, you can simply follow along with this post without deploying the samples.

Project overview

The project is structured as follows:

docs/                               -- Contains project documentation
src/
├── main/java/...                   -- Contains all the Flink application code
│   ├── ProcessTemperatureStream    -- Main class that decides on the enrichment strategy
│   ├── enrichment.                 -- Contains the different enrichment strategies (sync, async and cached)
│   ├── event.                      -- Event POJOs
│   ├── serialize.                  -- Utils for serialization
│   └── utils.                      -- Utils for Parameter parsing
└── test/                           -- Contains all the Flink testing code

The main method in the ProcessTemperatureStream class sets up the run environment and either takes the parameters from the command line, if it’s is a local environment, or uses the application properties from Amazon Managed Service for Apache Flink. Based on the parameter EnrichmentStrategy, it decides which implementation to pick: synchronous enrichment (default), asynchronous enrichment, or cached enrichment based on the Flink concept of KeyedState.

public static void main(String[] args) throws Exception {
    StreamExecutionEnvironment env = StreamExecutionEnvironment.getExecutionEnvironment();
     ParameterTool parameter = ParameterToolUtils.getParameters(args, env);

    String strategy = parameter.get("EnrichmentStrategy", "SYNC");
     switch (strategy) {
         case "SYNC":
             new SyncProcessTemperatureStreamStrategy().run(env, parameter);
             break;
         case "ASYNC":
             new AsyncProcessTemperatureStreamStrategy().run(env, parameter);
             break;
        case "CACHED":
             new CachedProcessTemperatureStreamStrategy().run(env, parameter);
             break;
         default:
             throw new InvalidParameterException("Please choose one of the existing enrichment strategies (SYNC|ASYNC|CACHED)");
     }
}

We go over the three approaches in the following sections.

Synchronous data enrichment

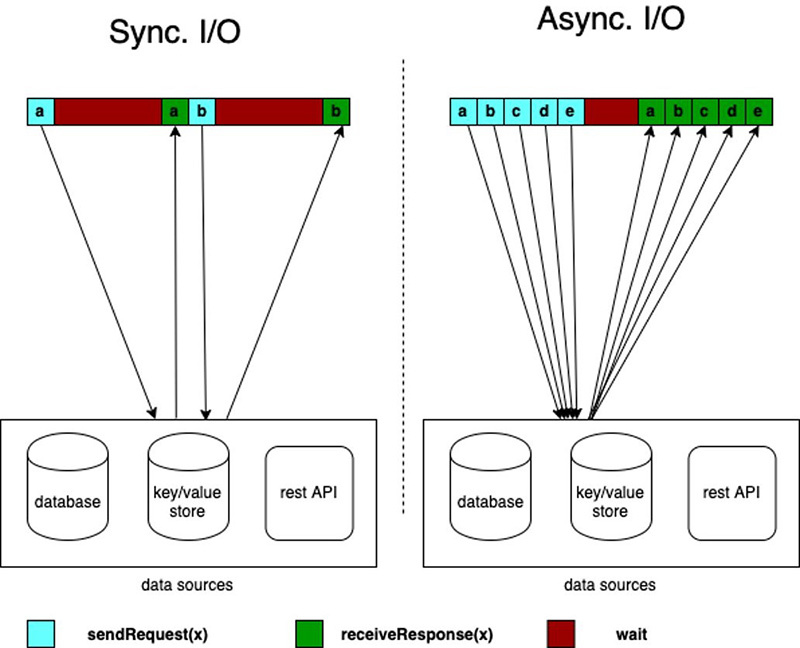
When you want to enrich your data from an external provider, you can use synchronous per-record lookup. When your Flink application processes an incoming event, it makes an external HTTP call and after sending every request, it has to wait until it receives the response.

As Flink processes events synchronously, the thread that is running the enrichment is blocked until it receives the HTTP response. This results in the processor staying idle for a significant period of processing time. On the other hand, the synchronous model is easier to design, debug, and trace. It also allows you to always have the latest data.

It can be integrated into your streaming application as such:

DataStream<EnrichedTemperature> enrichedTemperatureDataStream =
        temperatureDataStream
                .map(new SyncEnrichmentFunction(parameter.get("SensorApiUrl", DEFAULT_API_URL)));

The implementation of the enrichment function looks like the following code:

public class SyncEnrichmentFunction extends RichMapFunction<Temperature, EnrichedTemperature> {

    // Setup of HTTP client and ObjectMapper

    @Override
    public EnrichedTemperature map(Temperature temperature) throws Exception {
        String url = this.getRequestUrl + temperature.getSensorId();

        // Retrieve response from sensor info API
        Response response = client
                .prepareGet(url)
                .execute()
                .toCompletableFuture()
                .get();

        // Parse the sensor info
        SensorInfo sensorInfo = parseSensorInfo(response.getResponseBody());

        // Merge the temperature sensor data and sensor info data
        return getEnrichedTemperature(temperature, sensorInfo);
    }

    // ...
}

To optimize the performance for synchronous enrichment, you can use the KeepAlive flag because the HTTP client will be reused for multiple events.

For applications with I/O-bound operators (such as external data enrichment), it can also make sense to increase the application parallelism without increasing the resources dedicated to the application. You can do this by increasing the ParallelismPerKPU setting of the Amazon Managed Service for Apache Flink application. This configuration describes the number of parallel subtasks an application can perform per Kinesis Processing Unit (KPU), and a higher value of ParallelismPerKPU can lead to full utilization of KPU resources. But keep in mind that increasing the parallelism doesn’t work in all cases, such as when you are consuming from sources with few shards or partitions.

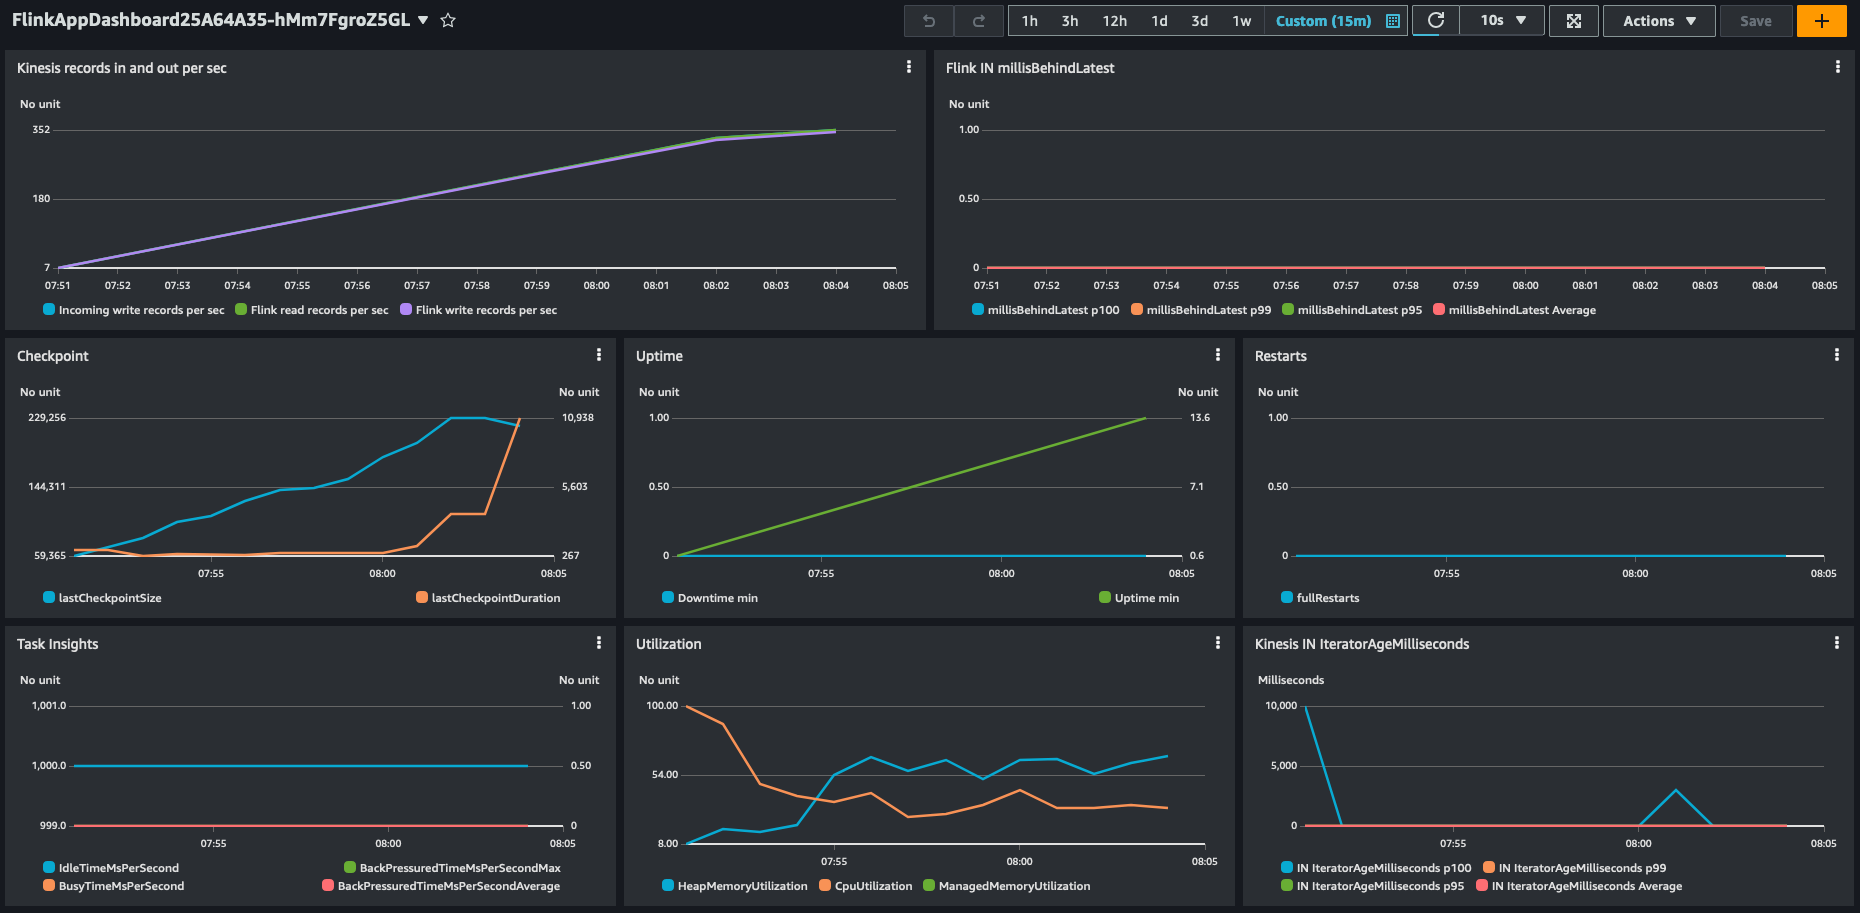
In our synthetic testing with Amazon Managed Service for Apache Flink, we saw a throughput of approximately 350 events per second on a single KPU with 4 parallelism per KPU and the default settings.

Synchronous enrichment performance

Asynchronous data enrichment

Synchronous enrichment doesn’t take full advantage of computing resources. That’s because Fink waits for HTTP responses. But Flink offers asynchronous I/O for external data access. This allows you to enrich the stream events asynchronously, so it can send a request for other elements in the stream while it waits for the response for the first element and requests can be batched for greater efficiency.

Sync I/O vs Async I/O

While using this pattern, you have to decide between unorderedWait (where it emits the result to the next operator as soon as the response is received, disregarding the order of the elements on the stream) and orderedWait (where it waits until all inflight I/O operations complete, then sends the results to the next operator in the same order as the original elements were placed on the stream). When your use case doesn’t require event ordering, unorderedWait provides better throughput and less idle time. Refer to Enrich your data stream asynchronously using Amazon Managed Service for Apache Flink to learn more about this pattern.

The asynchronous enrichment can be added as follows:

SingleOutputStreamOperator<EnrichedTemperature> asyncEnrichedTemperatureSingleOutputStream =
        AsyncDataStream
                .unorderedWait(
                        temperatureDataStream,
                        new AsyncEnrichmentFunction(parameter.get("SensorApiUrl", DEFAULT_API_URL)),
                        ASYNC_OPERATOR_TIMEOUT,
                        TimeUnit.MILLISECONDS,
                        ASYNC_OPERATOR_CAPACITY);

The enrichment function works similar as the synchronous implementation. It first retrieves the sensor info as a Java Future, which represents the result of an asynchronous computation. As soon as it’s available, it parses the information and then merges both objects into an EnrichedTemperature:

public class AsyncEnrichmentFunction extends RichAsyncFunction<Temperature, EnrichedTemperature> {

    // Setup of HTTP client and ObjectMapper

    @Override
    public void asyncInvoke(final Temperature temperature, final ResultFuture<EnrichedTemperature> resultFuture) {
        String url = this.getRequestUrl + temperature.getSensorId();

        // Retrieve response from sensor info API
        Future<Response> future = client
                .prepareGet(url)
                .execute();
        CompletableFuture
                .supplyAsync(() -> {
                    try {
                        Response response = future.get();

                        // Parse the sensor info as soon as it is available
                        return parseSensorInfo(response.getResponseBody());
                    } catch (Exception e) {
                        return null;
                    }
                })
                .thenAccept((SensorInfo sensorInfo) ->

                    // Merge the temperature sensor data and sensor info data
                    resultFuture.complete(getEnrichedTemperature(temperature, sensorInfo)));
    }

    // ...
}

In our testing with Amazon Managed Service for Apache Flink, we saw a throughput of 2,000 events per second on a single KPU with 2 parallelism per KPU and the default settings.

Async enrichment performance

Synchronous cached data enrichment

Although numerous operations in a data flow focus on individual events independently, such as event parsing, there are certain operations that retain information across multiple events. These operations, such as window operators, are referred to as stateful due to their ability to maintain state.

The keyed state is stored within an embedded key-value store, conceptualized as a part of Flink’s architecture. This state is partitioned and distributed in conjunction with the streams that are consumed by the stateful operators. As a result, access to the key-value state is limited to keyed streams, meaning it can only be accessed after a keyed or partitioned data exchange, and is restricted to the values associated with the current event’s key. For more information about the concepts, refer to Stateful Stream Processing.

You can use the keyed state for frequently accessed information that doesn’t change often, such as the sensor information. This will not only allow you to reduce the load on downstream resources, but also increase the efficiency of your data enrichment because no round-trip to an external resource for already fetched keys is necessary and there’s also no need to recompute the information. But keep in mind that Amazon Managed Service for Apache Flink stores transient data in a RocksDB backend, which adds a latency to retrieving the information. But because RocksDB is local to the node processing the data, this is faster than reaching out to external resources, as you can see in the following example.

To use keyed streams, you have to partition your stream using the .keyBy(...) method, which assures that events for the same key, in this case sensor ID, will be routed to the same worker. You can implement it as follows:

SingleOutputStreamOperator<EnrichedTemperature> cachedEnrichedTemperatureSingleOutputStream = temperatureDataStream
        .keyBy(Temperature::getSensorId)
        .process(new CachedEnrichmentFunction(
                parameter.get("SensorApiUrl", DEFAULT_API_URL),
                parameter.get("CachedItemsTTL", String.valueOf(CACHED_ITEMS_TTL))));

We are using the sensor ID as the key to partition the stream and later enrich it. This way, we can then cache the sensor information as part of the keyed state. When picking a partition key for your use case, choose one that has a high cardinality. This leads to an even distribution of events across different workers.

To store the sensor information, we use the ValueState. To configure the state management, we have to describe the state type by using the TypeHint. Additionally, we can configure how long a certain state will be cached by specifying the time-to-live (TTL) before the state will be cleaned up and has to retrieved or recomputed again.

public class CachedEnrichmentFunction extends KeyedProcessFunction<String, Temperature, EnrichedTemperature> {

    // Setup of HTTP client and ObjectMapper...

    private transient ValueState<SensorInfo> cachedSensorInfoLight;
    
    @Override
    public void open(Configuration configuration) throws Exception {
        // Initialize HTTP client
    
        ValueStateDescriptor<SensorInfo> descriptor =
                new ValueStateDescriptor<>("sensorInfo", TypeInformation.of(new TypeHint<>()}));
    
        StateTtlConfig ttlConfig = StateTtlConfig
                .newBuilder(Time.seconds(this.ttl))
                .setUpdateType(StateTtlConfig.UpdateType.OnCreateAndWrite)
                .setStateVisibility(StateTtlConfig.StateVisibility.ReturnExpiredIfNotCleanedUp)
                .build();
        descriptor.enableTimeToLive(ttlConfig);
    
        cachedSensorInfoLight = getRuntimeContext().getState(descriptor);
    }
    
    // ...
}

As of Flink 1.17, access to the state is not possible in asynchronous functions, so the implementation must be synchronous.

It first checks if the sensor information for this particular key exists; if so, it gets enriched. Otherwise, it retrieves the sensor information, parses it, and then merges both objects into an EnrichedTemperature:

public class CachedEnrichmentFunction extends KeyedProcessFunction<String, Temperature, EnrichedTemperature> {

    // Setup of HTTP client, ObjectMapper and ValueState

    @Override
    public void processElement(Temperature temperature, KeyedProcessFunction<String, Temperature, EnrichedTemperature>.Context ctx, Collector<EnrichedTemperature> out) throws Exception {
        SensorInfo sensorInfoCachedEntry = cachedSensorInfoLight.value();

        // Check if sensor info is cached
        if (sensorInfoCachedEntry != null) {
            out.collect(getEnrichedTemperature(temperature, sensorInfoCachedEntry));
        } else {
            String url = this.getRequestUrl + temperature.getSensorId();

            // Retrieve response from sensor info API
            Response response = client
                    .prepareGet(url)
                    .execute()
                    .toCompletableFuture()
                    .get();

            // Parse the sensor info
            SensorInfo sensorInfo = parseSensorInfo(response.getResponseBody());

            // Cache the sensor info
            cachedSensorInfoLight.update(sensorInfo);

            // Merge the temperature sensor data and sensor info data
            out.collect(getEnrichedTemperature(temperature, sensorInfo));
        }
    }

    // ...
}

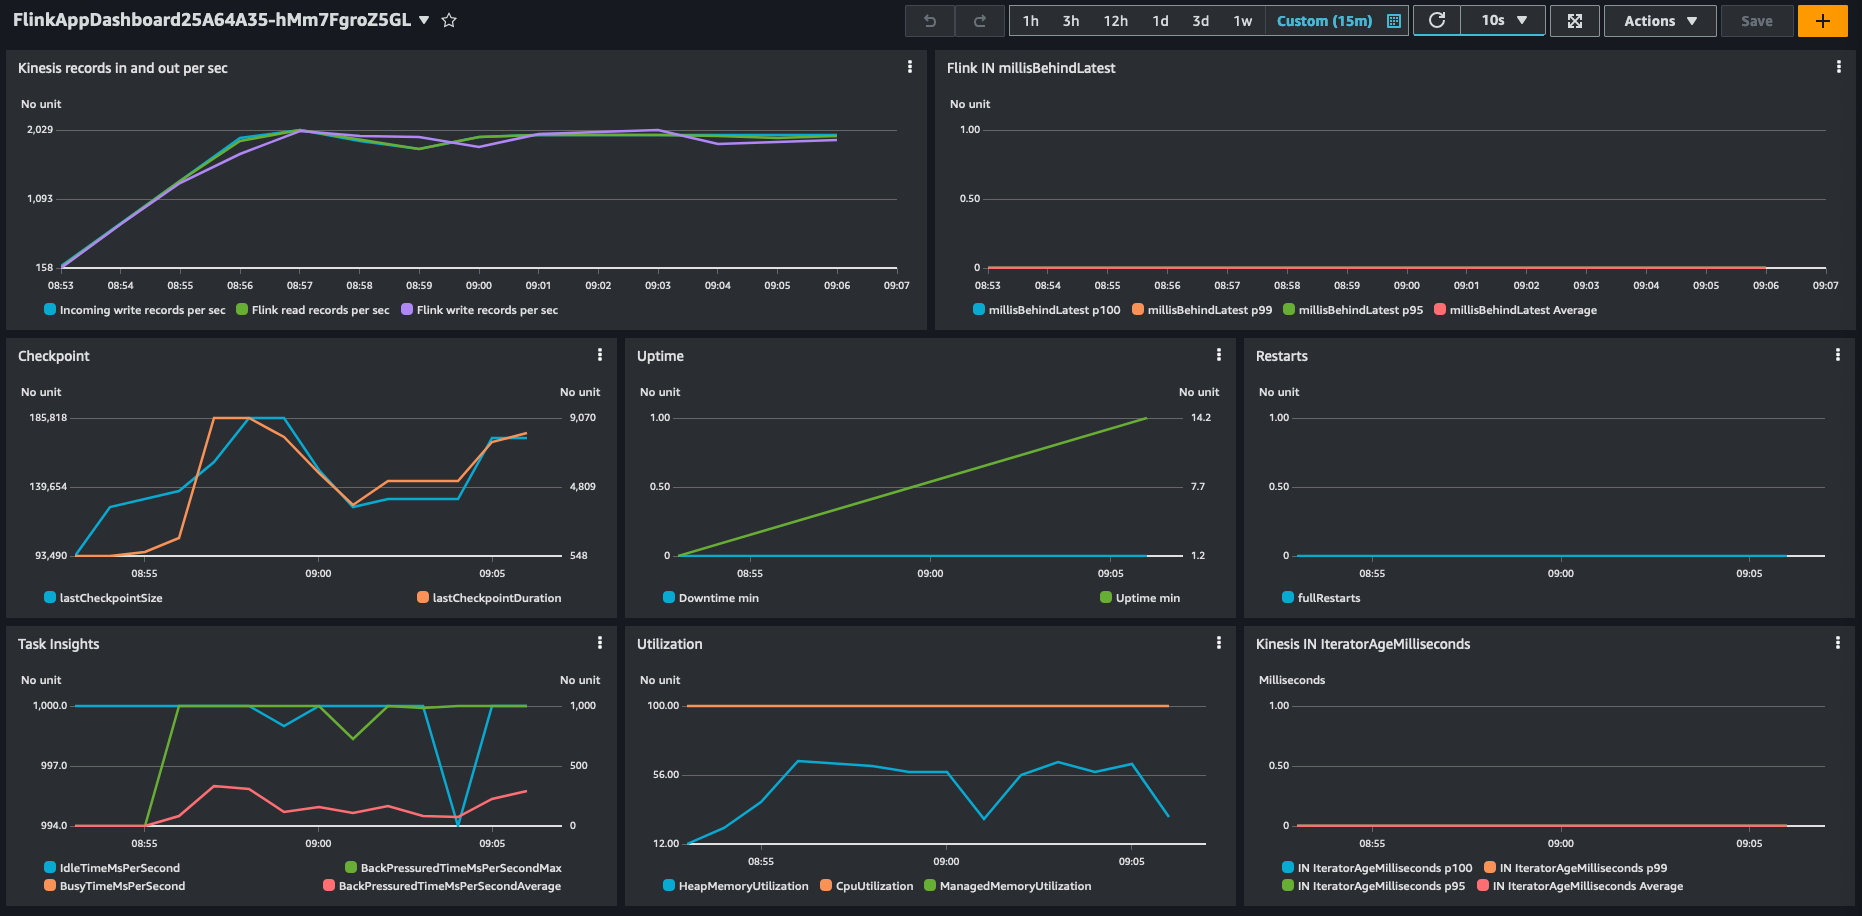
In our synthetic testing with Amazon Managed Service for Apache Flink, we saw a throughput of 28,000 events per second on a single KPU with 4 parallelism per KPU and the default settings.

Sync+Cached enrichment performance

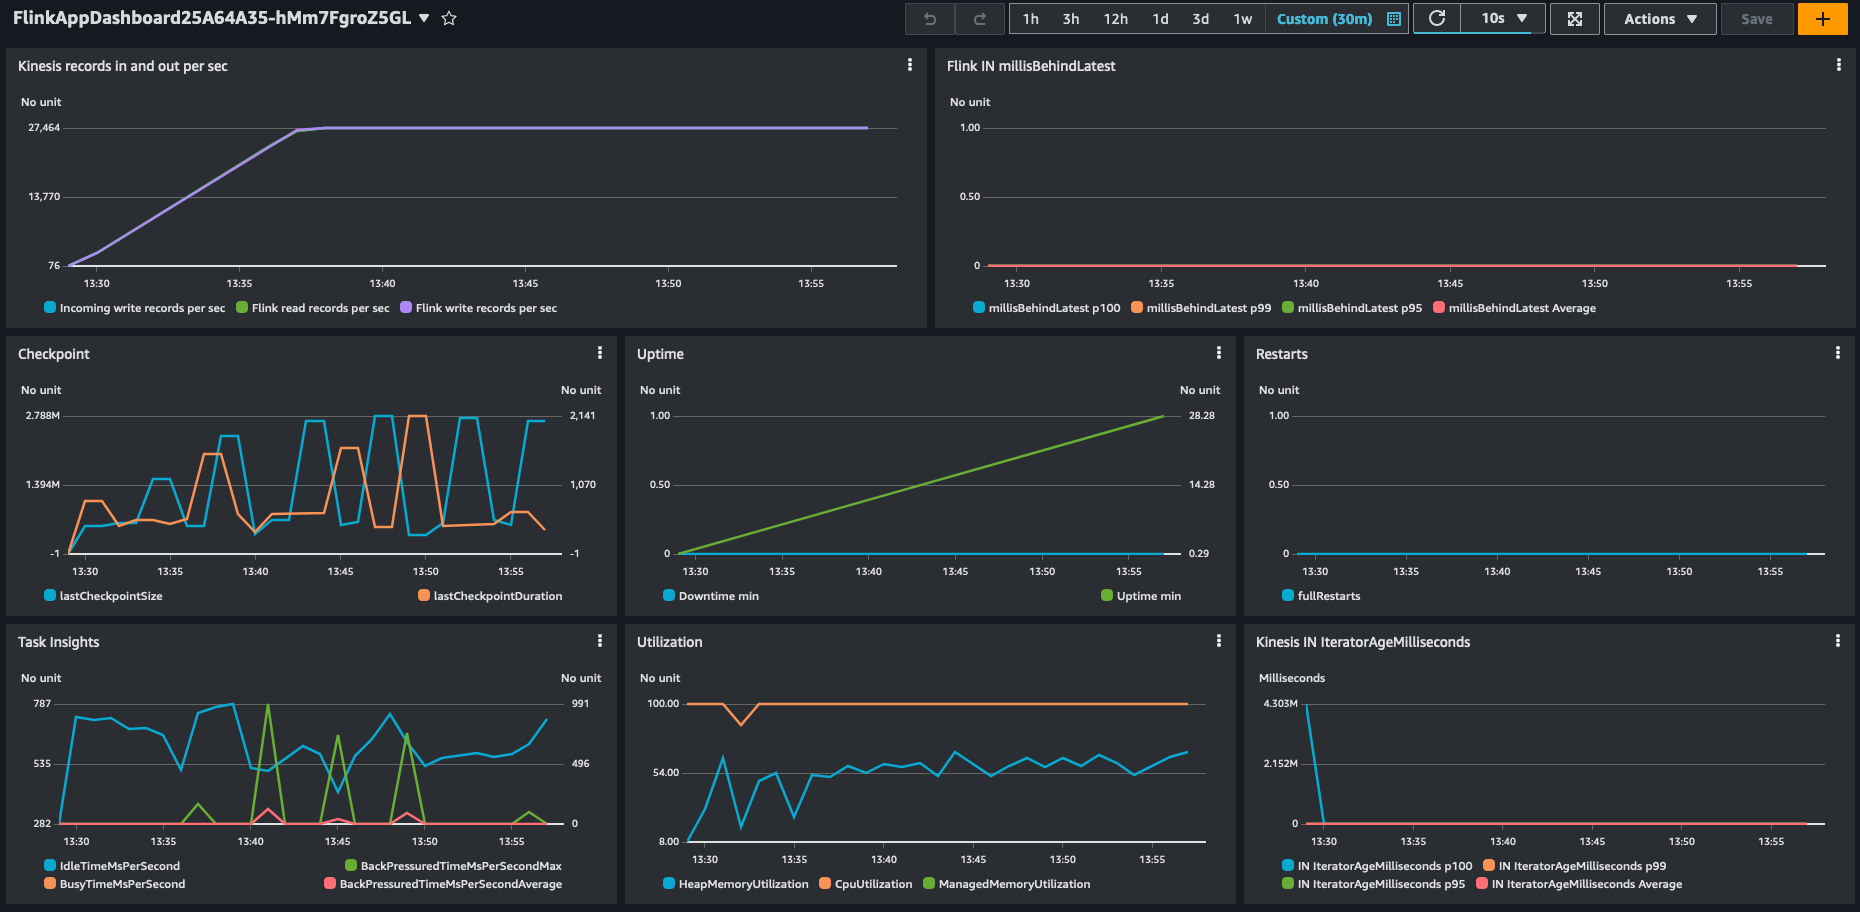
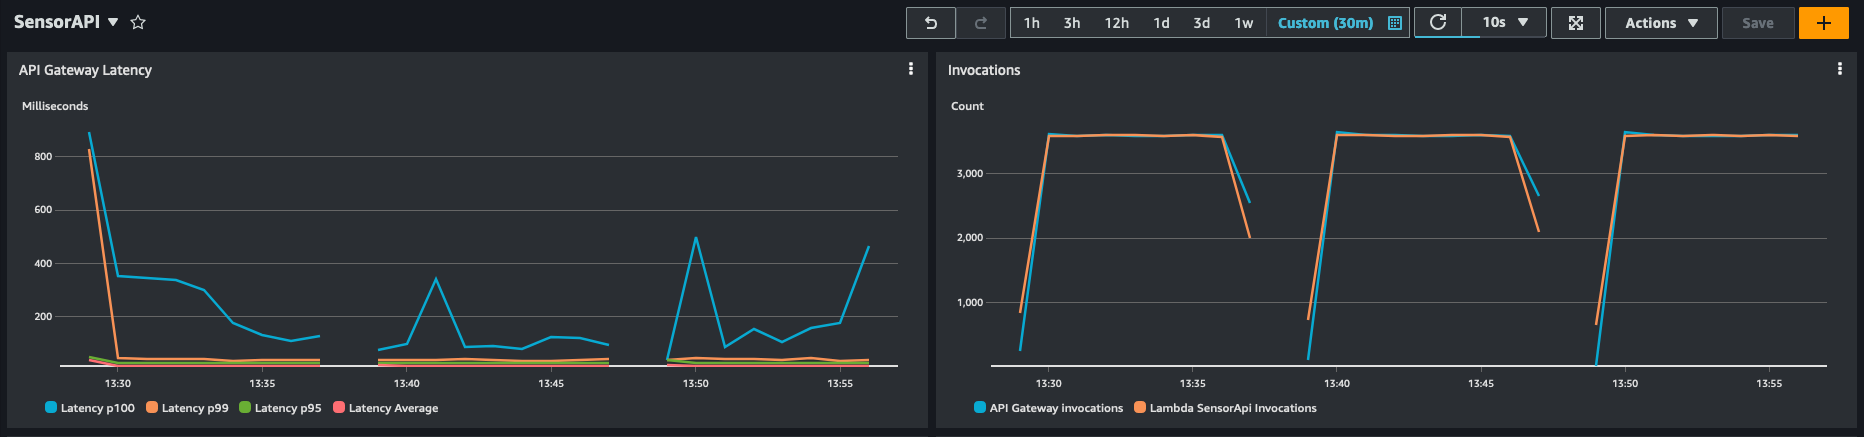
You can also see the impact and reduced load on the downstream sensor API.

Impact on Enrichment API

Test your workload on Amazon Managed Service for Apache Flink

This post compared different approaches to run an application on Amazon Managed Service for Apache Flink with 1 KPU. Testing with a single KPU gives a good performance baseline that allows you to compare the enrichment patterns without generating a full-scale production workload.

It’s important to understand that the actual performance of the enrichment patterns depends on the actual workload and other external systems the Flink application interacts with. For example, performance of cached enrichment may vary with the cache hit ratio. Synchronous enrichment may behave differently depending on the response latency of the enrichment endpoint.

To evaluate which approach best suits your workload, you should first perform scaled-down tests with 1 KPU and a limited throughput of realistic data, possibly experimenting with different values of Parallelism per KPU. After you identify the best approach, it’s important to test the implementation at full scale, with real data and integrating with real external systems, before moving to production.

Summary

This post explored different approaches to implement near-online data enrichment using Flink, focusing on three communication patterns: synchronous enrichment, asynchronous enrichment, and caching with Flink KeyedState.

We compared the throughput achieved by each approach, with caching using Flink KeyedState being up to 14 times faster than using asynchronous I/O, in this particular experiment with synthetic data. Furthermore, we delved into optimizing the performance of Apache Flink, specifically on Amazon Managed Service for Apache Flink. We discussed strategies and best practices to maximize the performance of Flink applications in a managed environment, enabling you to fully take advantage of the capabilities of Flink for your near-online data enrichment needs.

Overall, this overview offers insights into different data enrichment patterns, their performance characteristics, and optimization techniques when using Apache Flink, particularly in the context of near-online data enrichment scenarios and on Amazon Managed Service for Apache Flink.

We welcome your feedback. Please leave your thoughts and questions in the comments section.


About the authors

Luis MoralesLuis Morales works as Senior Solutions Architect with digital-native businesses to support them in constantly reinventing themselves in the cloud. He is passionate about software engineering, cloud-native distributed systems, test-driven development, and all things code and security.

Lorenzo NicoraLorenzo Nicora works as Senior Streaming Solution Architect helping customers across EMEA. He has been building cloud-native, data-intensive systems for several years, working in the finance industry both through consultancies and for fin-tech product companies. He leveraged open source technologies extensively and contributed to several projects, including Apache Flink.

Perform Amazon Kinesis load testing with Locust

Post Syndicated from Luis Morales original https://aws.amazon.com/blogs/big-data/perform-amazon-kinesis-load-testing-with-locust/

Building a streaming data solution requires thorough testing at the scale it will operate in a production environment. Streaming applications operating at scale often handle large volumes of up to GBs per second, and it’s challenging for developers to simulate high-traffic Amazon Kinesis-based applications to generate such load easily.

Amazon Kinesis Data Streams and Amazon Kinesis Data Firehose are capable of capturing and storing terabytes of data per hour from numerous sources. Creating Kinesis data streams or Firehose delivery streams is straightforward through the AWS Management Console, AWS Command Line Interface (AWS CLI), or Kinesis API. However, generating a continuous stream of test data requires a custom process or script to run continuously. Although the Amazon Kinesis Data Generator (KDG) provides a user-friendly UI for this purpose, it has some limitations, such as bandwidth constraints and increased round trip latency. (For more information on the KDG, refer to Test Your Streaming Data Solution with the New Amazon Kinesis Data Generator.)

To overcome these limitations, this post describes how to use Locust, a modern load testing framework, to conduct large-scale load testing for a more comprehensive evaluation of the streaming data solution.

Overview

This project emits temperature sensor readings via Locust to Kinesis. We set up the Amazon Elastic Compute Cloud (Amazon EC2) Locust instance via the AWS Cloud Development Kit (AWS CDK) to load test Kinesis-based applications. You can access the Locust dashboard to perform and observe the load test and connect via Session Manager, a capability of AWS Systems Manager, for configuration changes. The following diagram illustrates this architecture.

Architecture overview

In our testing with the largest recommended instance (c7g.16xlarge), the setup was capable of emitting over 1 million events per second to Kinesis data streams in on-demand capacity mode, with a batch size (simulated users per Locust user) of 500. You can find more details on what this means and how to configure the load test later in this post.

Locust overview

Locust is an open-source, scriptable, and scalable performance testing tool that allows you to define user behavior using Python code. It offers an easy-to-use interface, making it developer-friendly and highly expandable. With its distributed and scalable design, Locust can simulate millions of simultaneous users to mimic real user behavior during a performance test.

Each Locust user represents a scenario or a specific set of actions that a real user might perform on your system. When you run a performance test with Locust, you can specify the number of concurrent Locust users you want to simulate, and Locust will create an instance for each user, allowing you to assess the performance and behavior of your system under different user loads.

For more information on Locust, refer to the Locust documentation.

Prerequisites

To get started, clone or download the code from the GitHub repository.

Test locally

To test Locust out locally first before deploying it to the cloud, you have to install the necessary Python dependencies. If you’re new to Python, refer the README for more information on getting started.

Navigate to the load-test directory and run the following code:

pip install -r requirements.txt

To send events to a Kinesis data stream from your local machine, you will need to have AWS credentials. For more information, refer to Configuration and credential file settings.

To perform the test locally, stay in the load-test directory and run the following code:

locust -f locust-load-test.py

You can now access the Locust dashboard via http://0.0.0.0:8089/. Enter the number of Locust users, the spawn rate (users added per second), and the target Amazon Kinesis data stream name for Host. By default, it deploys the Kinesis data stream DemoStream that you can use for testing.

Locust Dashboard - Enter details

To see the generated events logged, run the following command, which filters only Locust and root logs (for example, no Botocore logs):

locust -f locust-load-test.py --loglevel DEBUG 2&gt;&amp;1 | grep -E "(locust|root)"

Set up resources with the AWS CDK

The GitHub repository contains the AWS CDK code to create all the necessary resources for the load test. This removes opportunities for manual error, increases efficiency, and ensures consistent configurations over time. To deploy the resources, complete the following steps:

  1. If not already downloaded, clone the GitHub repository to your local computer using the following command:
git clone https://github.com/aws-samples/amazon-kinesis-load-testing-with-locust
  1. Download and install the latest Node.js.
  2. Navigate to the root folder of the project and run the following command to install the latest version of AWS CDK:
npm install -g aws-cdk
  1. Install the necessary dependencies:
npm install
  1. Run cdk bootstrap to initialize the AWS CDK environment in your AWS account. Replace your AWS account ID and Region before running the following command:
cdk bootstrap

To learn more about the bootstrapping process, refer to Bootstrapping.

  1. After the dependencies are installed, you can run the following command to deploy the stack of the AWS CDK template, which sets up the infrastructure within 5 minutes:
cdk deploy

The template sets up the Locust EC2 test instance, which is by default a c7g.xlarge instance, which at the time of publishing costs approximately $0.145 per hour in us-east-1. To find the most accurate pricing information, see Amazon EC2 On-Demand Pricing. You can find more details on how to change your instance size according to your scale of load testing later in this post.

It’s crucial to consider that the expenses incurred during load testing are not solely attributed to EC2 instance costs, but also heavily influenced by data transfer costs.

Accessing the Locust dashboard

You can access the dashboard by using the AWS CDK output KinesisLocustLoadTestingStack.locustdashboardurl to open the dashboard, for example http://1.2.3.4:8089.

The Locust dashboard is password protected. By default, it’s set to user name locust-user and password locust-dashboard-pwd.

With the default configuration, you can achieve up to 15,000 emitted events per second. Enter the number of Locust users (times the batch size), the spawn rate (users added per second), and the target Kinesis data stream name for Host.

Locust Dashboard - Enter details

After you have started the load test, you can look at the load test on the Charts tab.

Locust Dashboard - Charts

You can also monitor the load test on the Kinesis Data Streams console by navigating to the stream that you are load testing. If you used the default settings, navigate to DemoStream. On the detail page, choose the Monitoring tab to see the ingested load.

Kinesis Data Streams - Monitoring

Adapt workloads

By default, this project generates random temperature sensor readings for every sensor with the following format:

{
    "sensorId": "bfbae19c-2f0f-41c2-952b-5d5bc6e001f1_1",
    "temperature": 147.24,
    "status": "OK",
    "timestamp": 1675686126310
}

The project comes packaged with Faker, which you can use to adapt the payload to your needs. You just have to update the generate_sensor_reading function in the locust-load-test.py file:

class SensorAPIUser(KinesisBotoUser):
    # ...

    def generate_sensor_reading(self, sensor_id, sensor_reading):
        current_temperature = round(10 + random.random() * 170, 2)

        if current_temperature > 160:
            status = "ERROR"
        elif current_temperature > 140 or random.randrange(1, 100) > 80:
            status = random.choice(["WARNING", "ERROR"])
        else:
            status = "OK"

        return {
            'sensorId': f"{sensor_id}_{sensor_reading}",
            'temperature': current_temperature,
            'status': status,
            'timestamp': round(time.time()*1000)
        }

    # ...

Change configurations

After the initial deployment of the load testing tool, you can change configuration in two ways:

  1. Connect to the EC2 instance, make any configuration and code changes, and restart the Locust process
  2. Change the configuration and load testing code locally and redeploy it via cdk deploy

The first option helps you iterate more quickly on the remote instance without a need to redeploy. The latter uses the infrastructure as code (IaC) approach and makes sure that your configuration changes can be committed to your source control system. For a fast development cycle, it’s recommended to test your load test configuration locally first, connect to your instance to apply the changes, and after successful implementation, codify it as part of your IaC repository and then redeploy.

Locust is created on the EC2 instance as a systemd service and can therefore be controlled with systemctl. If you want to change the configuration of Locust as needed without redeploying the stack, you can connect to the instance via Systems Manager, navigate to the project directory on /usr/local/load-test, change the locust.env file, and restart the service by running sudo systemctl restart locust.

Large-scale load testing

This setup is capable of emitting over 1 million events per second to Kinesis data stream, with a batch size of 500 and 64 secondaries on a c7g.16xlarge.

To achieve peak performance with Locust and Kinesis, keep the following in mind:

  • Instance size – Your performance is bound by the underlying EC2 instance, so refer to EC2 instance type for more information about scaling. To set the correct instance size, you can configure the instance size in the file kinesis-locust-load-testing.ts.
  • Number of secondaries – Locust benefits from a distributed setup. Therefore, the setup spins up a primary, which does the coordination, and multiple secondaries, which do the actual work. To fully take advantage of the cores, you should specify one secondary per core. You can configure the number in the locust.env file.
  • Batch size – The amount of Kinesis data stream events you can send per Locust user is limited due to the resource overhead of switching Locust users and threads. To overcome this, you can configure a batch size to define how much users are simulated per Locust user. These are sent as a Kinesis data stream put_records call. You can configure the number in the locust.env file.

This setup is capable of emitting over 1 million events per second to the Kinesis data stream, with a batch size of 500 and 64 secondaries on a c7g.16xlarge instance.

Locust Dashboard - Large Scale Load Test Charts

You can observe this on the Monitoring tab for the Kinesis data stream as well.

Kinesis Data Stream - Large Scale Load Test Monitoring

Clean up

In order to not incur any unnecessary costs, delete the stack by running the following code:

cdk destroy

Summary

Kinesis is already popular for its ease of use among users building streaming applications. With this load testing capability using Locust, you can now test your workloads in a more straightforward and faster way. Visit the GitHub repo to embark on your testing journey.

The project is licensed under the Apache 2.0 license, providing the freedom to clone and modify it according to your needs. Furthermore, you can contribute to the project by submitting issues or pull requests via GitHub, fostering collaboration and improvement in the testing ecosystem.


About the author

Luis Morales works as Senior Solutions Architect with digital native businesses to support them in constantly reinventing themselves in the cloud. He is passionate about software engineering, cloud-native distributed systems, test-driven development, and all things code and security