All posts by Matt Boyle

Using Apache Kafka to process 1 trillion messages

Post Syndicated from Matt Boyle original https://blog.cloudflare.com/using-apache-kafka-to-process-1-trillion-messages/

Using Apache Kafka to process 1 trillion messages

Using Apache Kafka to process 1 trillion messages

Cloudflare has been using Kafka in production since 2014. We have come a long way since then, and currently run 14 distinct Kafka clusters, across multiple data centers, with roughly 330 nodes. Between them, over a trillion messages have been processed over the last eight years.

Cloudflare uses Kafka to decouple microservices and communicate the creation, change or deletion of various resources via a common data format in a fault-tolerant manner. This decoupling is one of many factors that enables Cloudflare engineering teams to work on multiple features and products concurrently.

We learnt a lot about Kafka on the way to one trillion messages, and built some interesting internal tools to ease adoption that will be explored in this blog post. The focus in this blog post is on inter-application communication use cases alone and not logging (we have other Kafka clusters that power the dashboards where customers view statistics that handle more than one trillion messages each day). I am an engineer on the Application Services team and our team has a charter to provide tools/services to product teams, so they can focus on their core competency which is delivering value to our customers.

In this blog I’d like to recount some of our experiences in the hope that it helps other engineering teams who are on a similar journey of adopting Kafka widely.

Tooling

One of our Kafka clusters is creatively named Messagebus. It is the most general purpose cluster we run, and was created to:

  • Prevent data silos;
  • Enable services to communicate more clearly with basically zero integration cost (more on how we achieved this below);
  • Encourage the use of a self-documenting communication format and therefore removing the problem of out of date documentation.

To make it as easy to use as possible and to encourage adoption, the Application Services team created two internal projects. The first is unimaginatively named Messagebus-Client. Messagebus-Client is a Go library that wraps the fantastic Shopify Sarama library with an opinionated set of configuration options and the ability to manage the rotation of mTLS certificates.

Using Apache Kafka to process 1 trillion messages

The success of this project is also somewhat its downfall. By providing a ready-to-go Kafka client, we ensured teams got up and running quickly, but we also abstracted some core concepts of Kafka a little too much, meaning that small unassuming configuration changes could have a big impact.

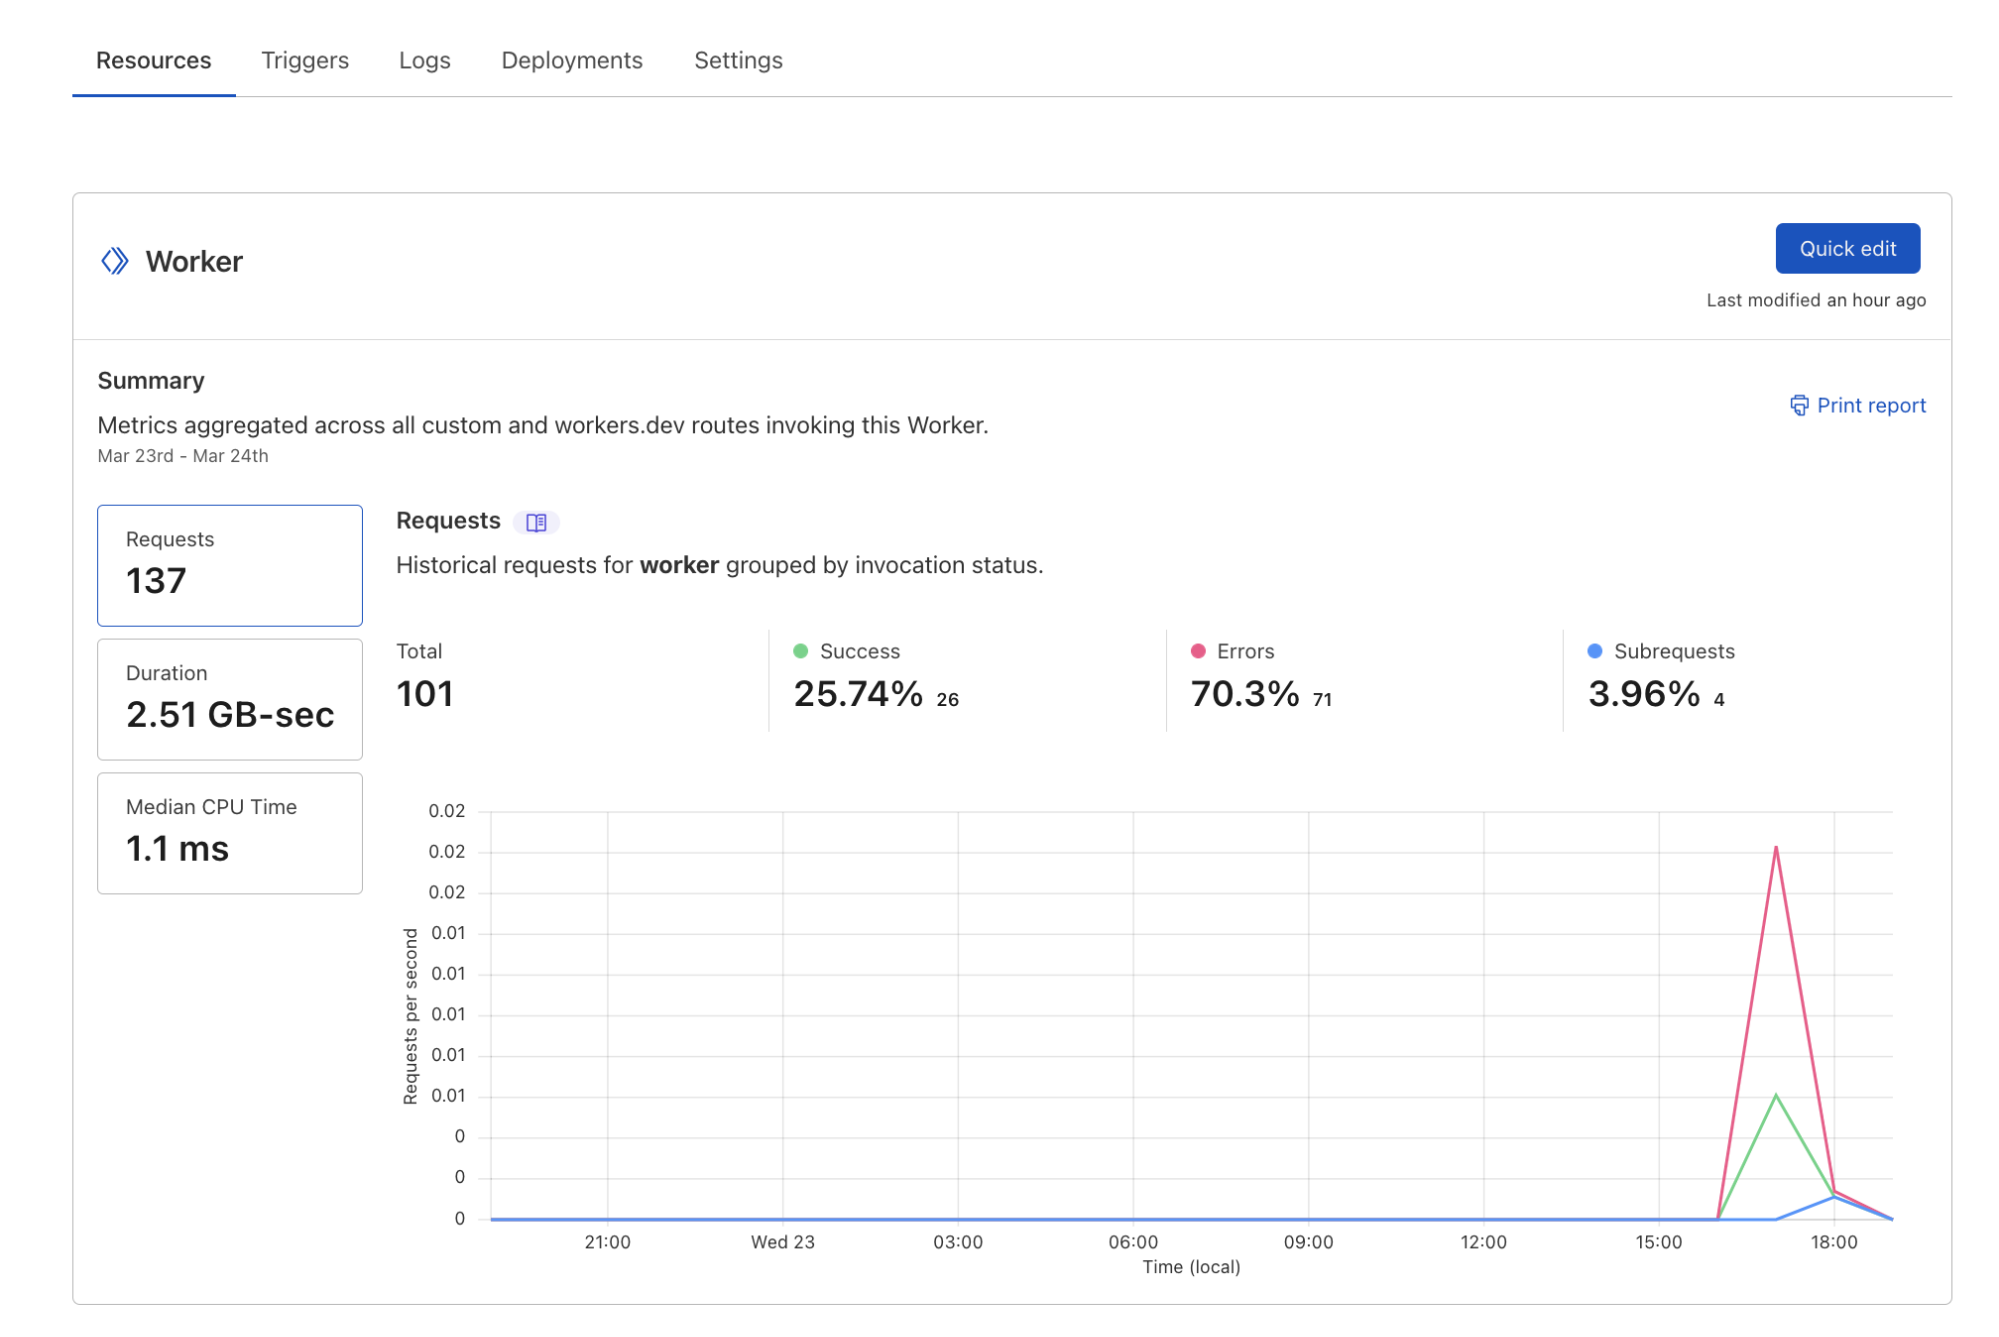
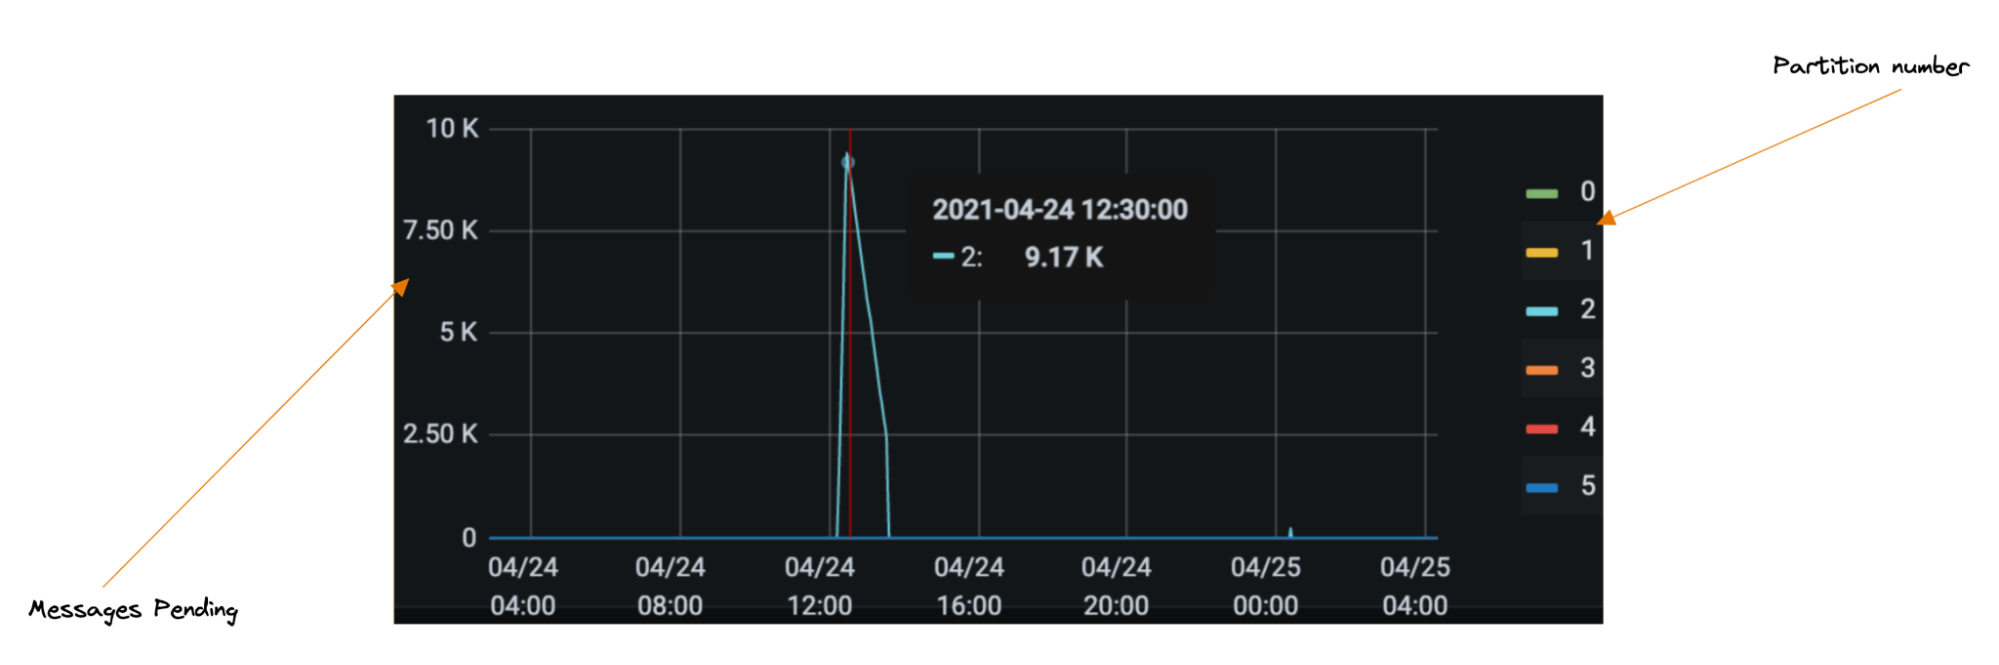
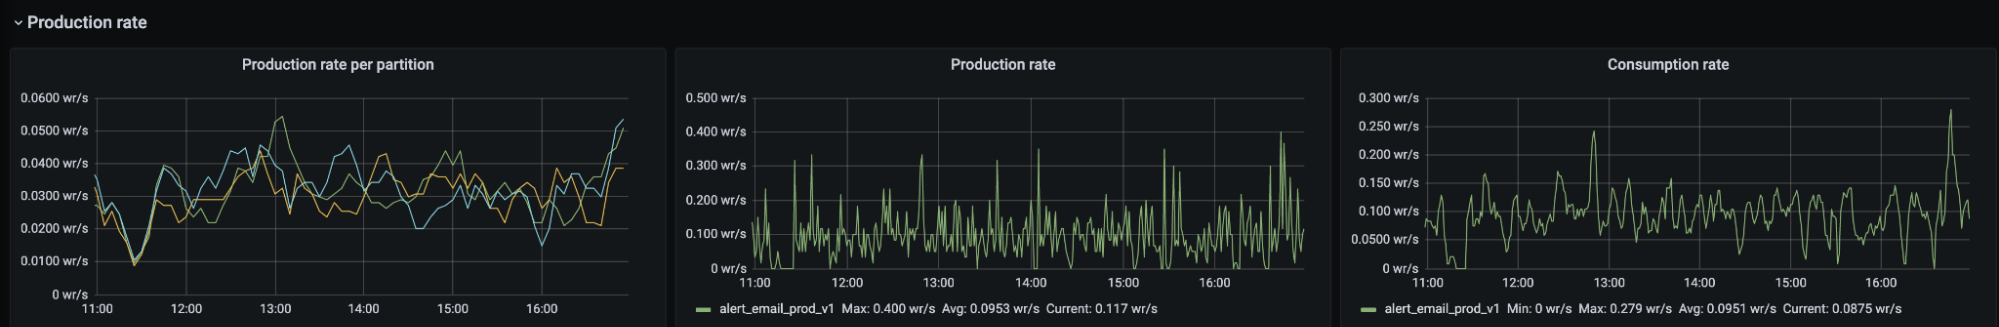
One such example led to partition skew (a large portion of messages being directed towards a single partition, meaning we were not processing messages in real time; see the chart below). One drawback of Kafka is you can only have one consumer per partition, so when incidents do occur, you can’t trivially scale your way to faster throughput.

That also means before your service hits production it is wise to do some back of the napkin math to figure out what throughput might look like, otherwise you will need to add partitions later. We have since amended our library to make events like the below less likely.

Using Apache Kafka to process 1 trillion messages

The reception for the Messagebus-Client has been largely positive. We spent time as a team to understand what the predominant use cases were, and took the concept one step further to build out what we call the connector framework.

Connectors

The connector framework is based on Kafka-connectors and allows our engineers to easily spin up a service that can read from a system of record and push it somewhere else (such as Kafka, or even Cloudflare’s own Quicksilver). To make this as easy as possible, we use Cookiecutter templating to allow engineers to enter a few parameters into a CLI and in return receive a ready to deploy service.

Using Apache Kafka to process 1 trillion messages

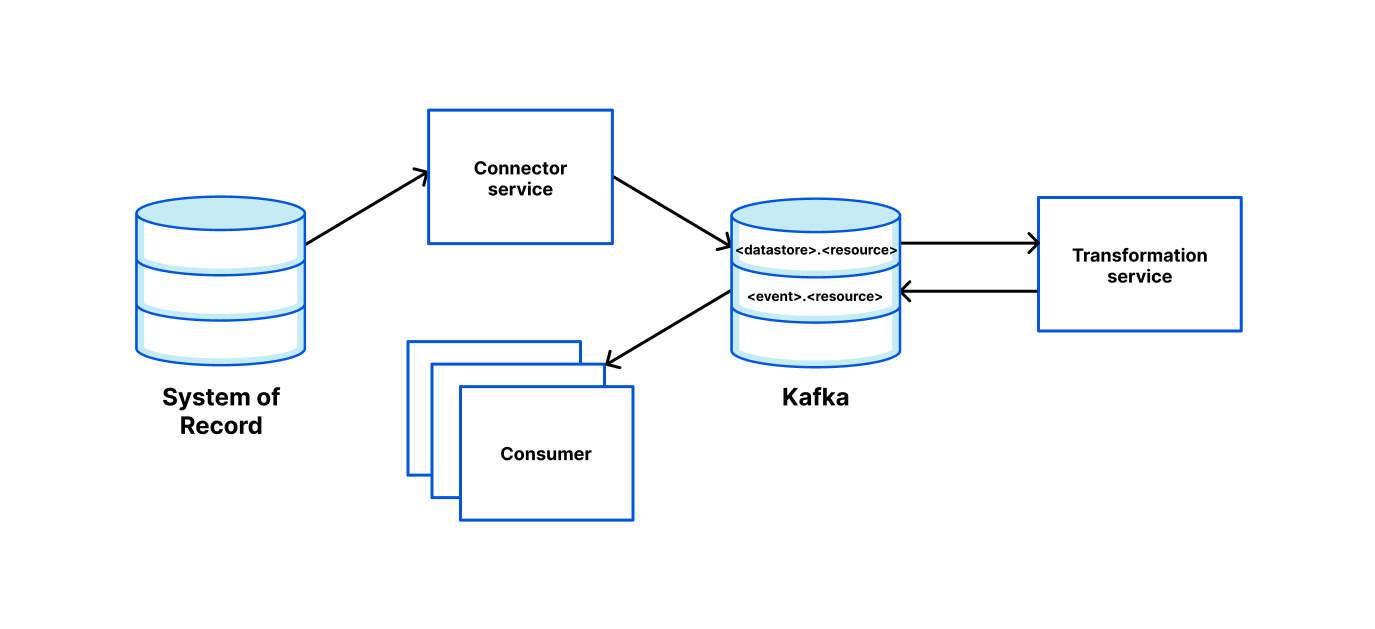
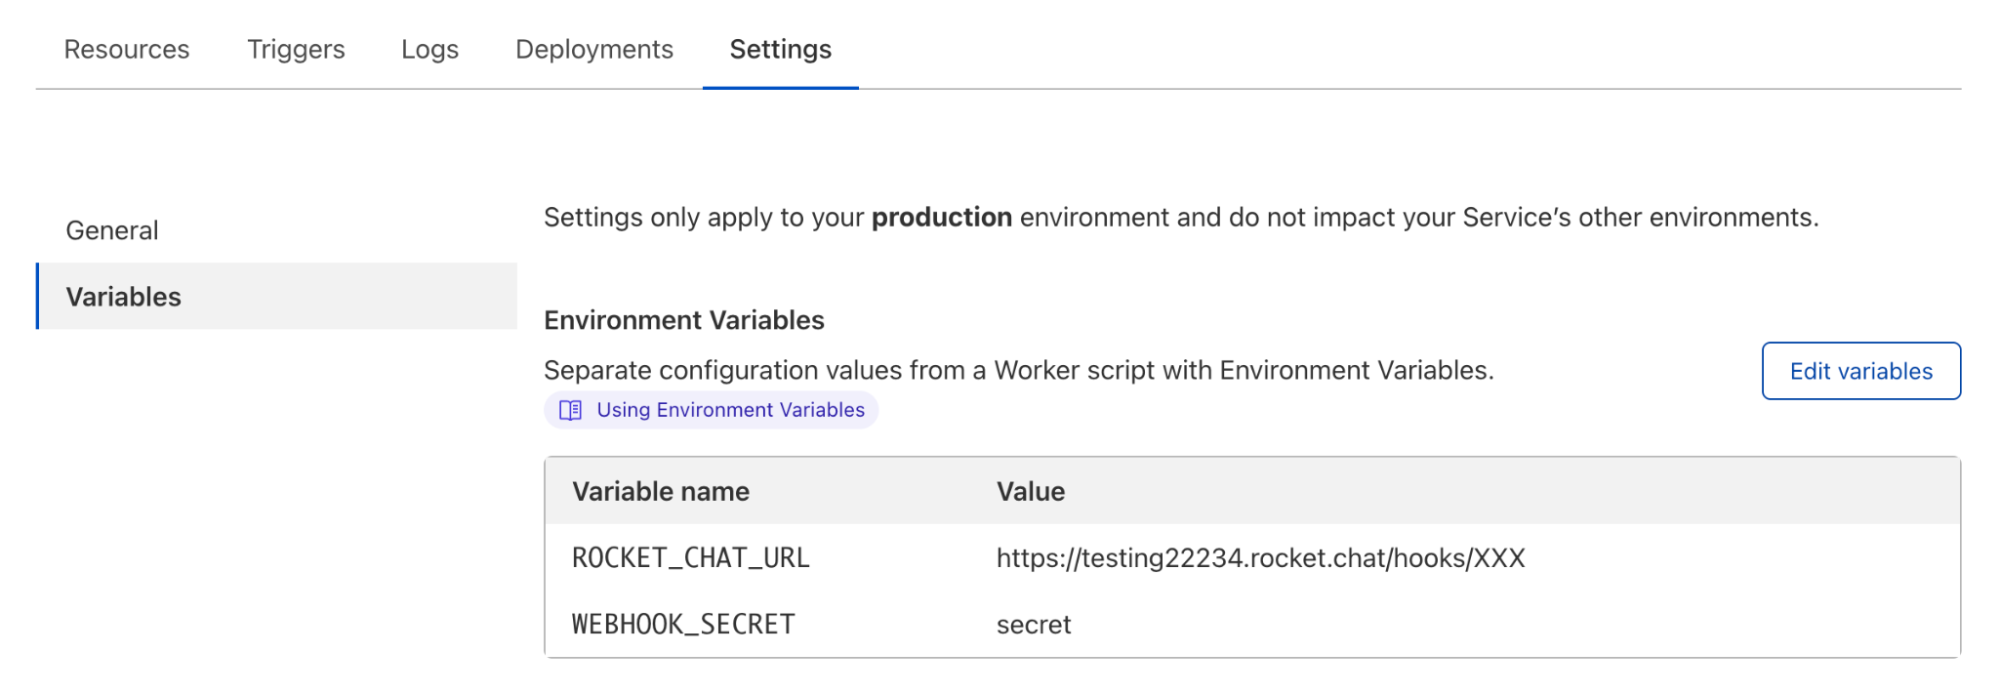
We provide the ability to configure data pipelines via environment variables. For simple use cases, we provide the functionality out of the box. However, extending the readers, writers and transformations is as simple as satisfying an interface and “registering” the new entry.

For example, adding the environment variables:

READER=kafka
TRANSFORMATIONS=topic_router:topic1,topic2|pf_edge
WRITER=quicksilver

will:

  • Read messages from Kafka topic “topic1” and “topic2”;
  • Transform the message using a transformation function called “pf_edge” which maps the request from a Kafka protobuf to a Quicksilver request;
  • Write the result to Quicksilver.

Connectors come readily baked with basic metrics and alerts, so teams know they can move to production quickly but with confidence.

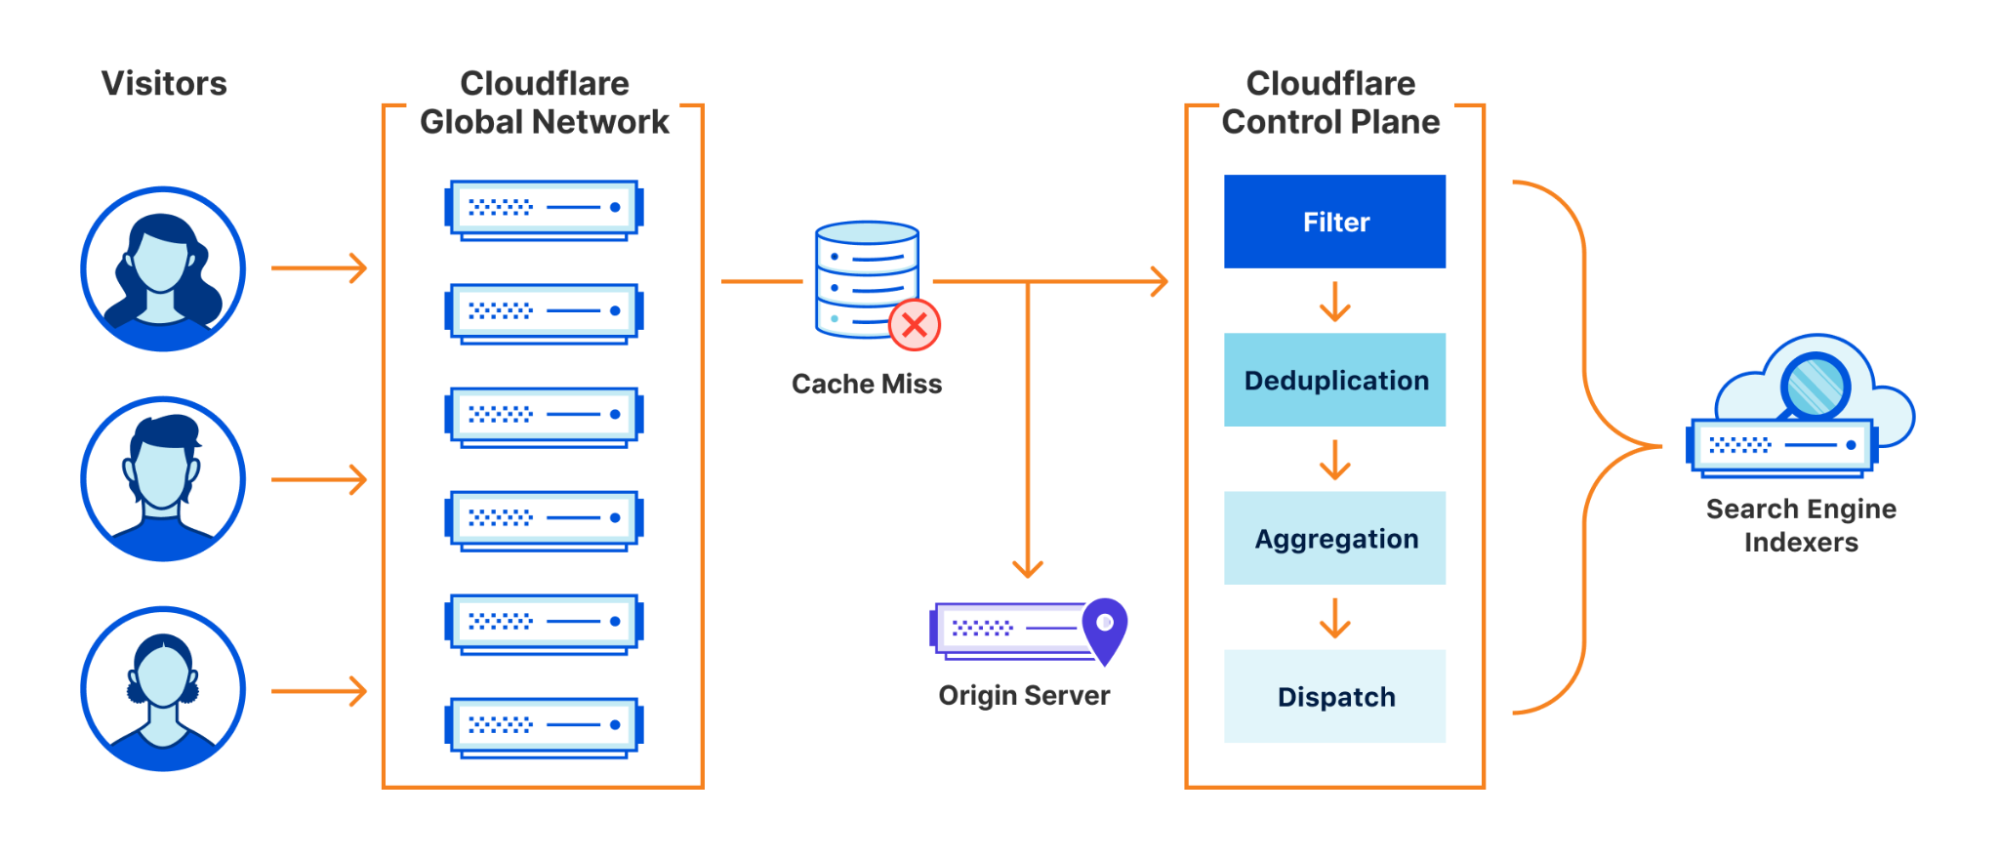
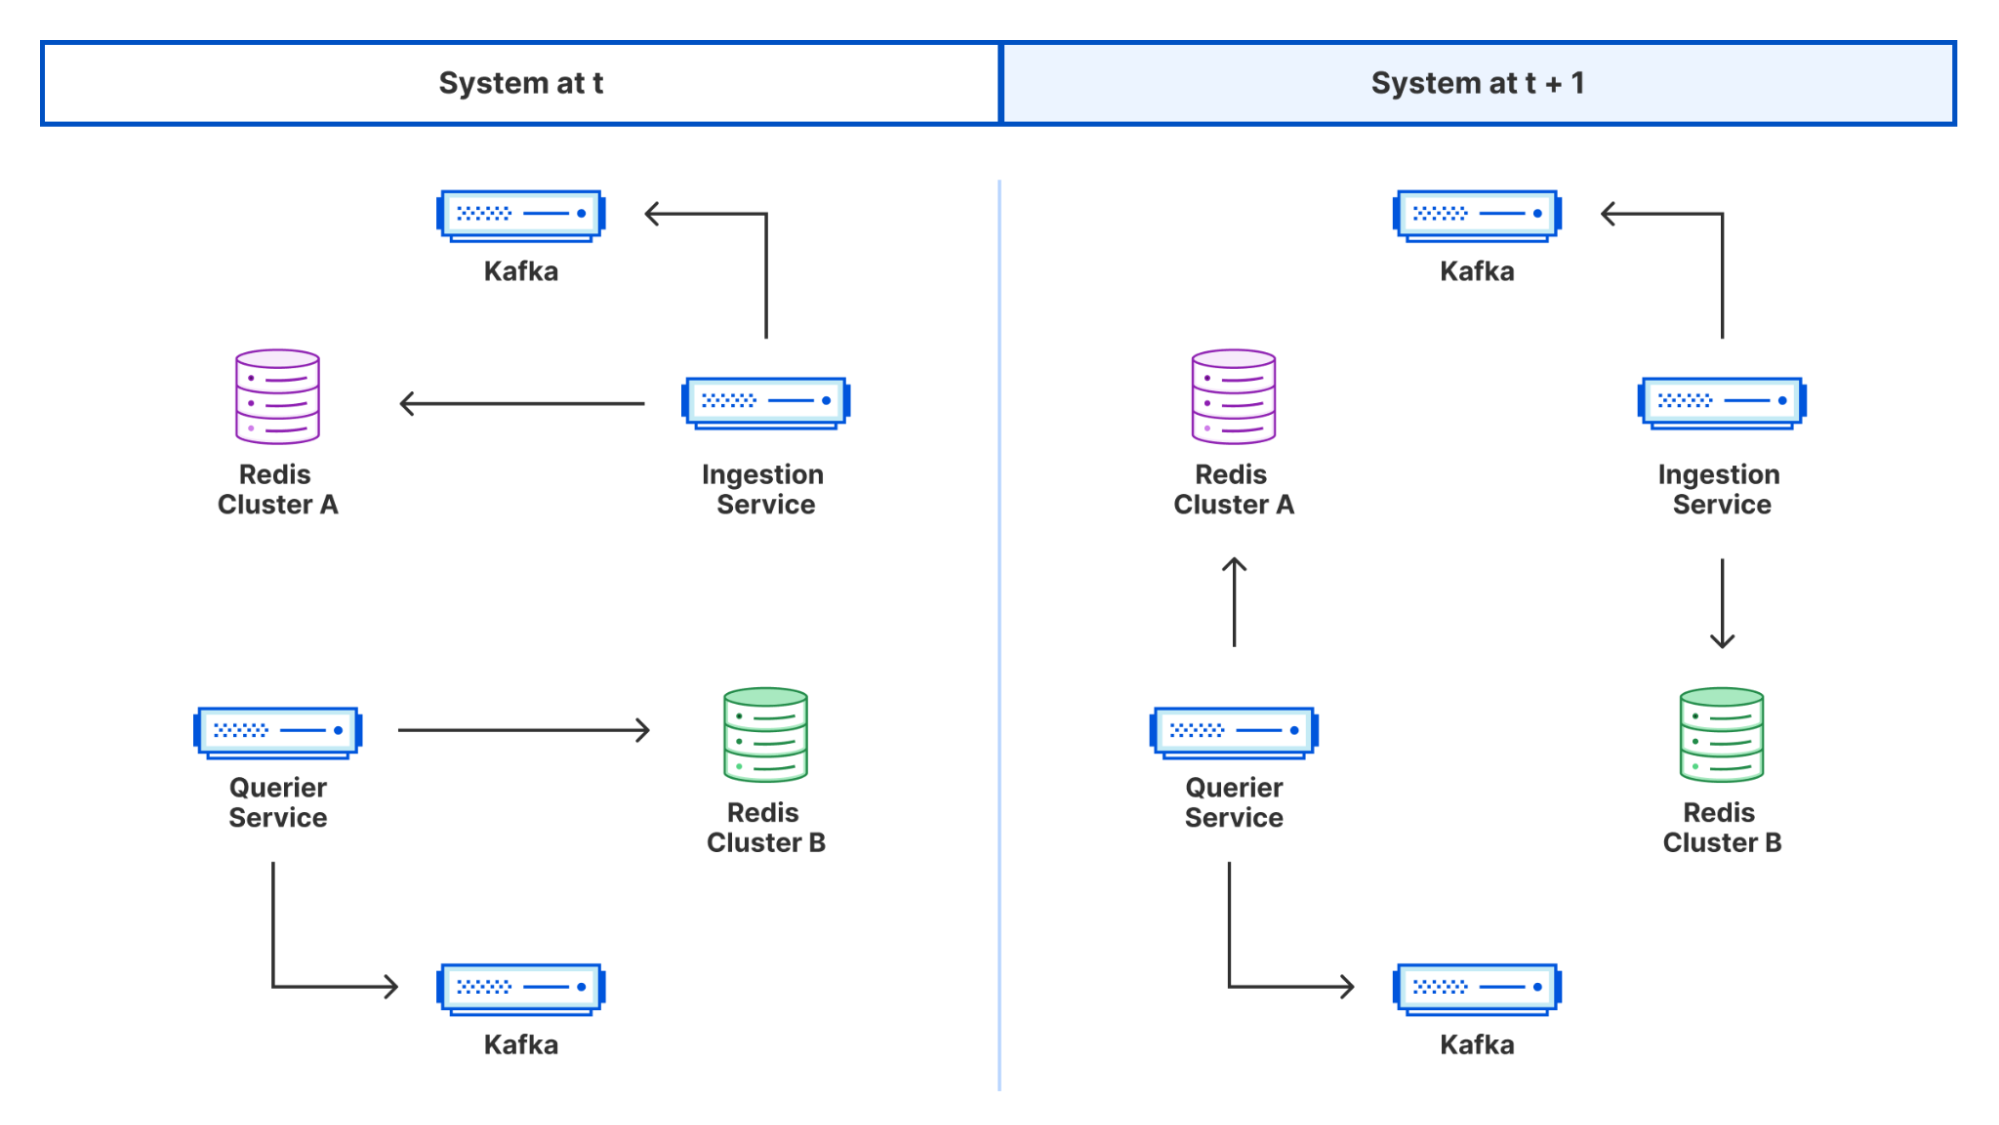
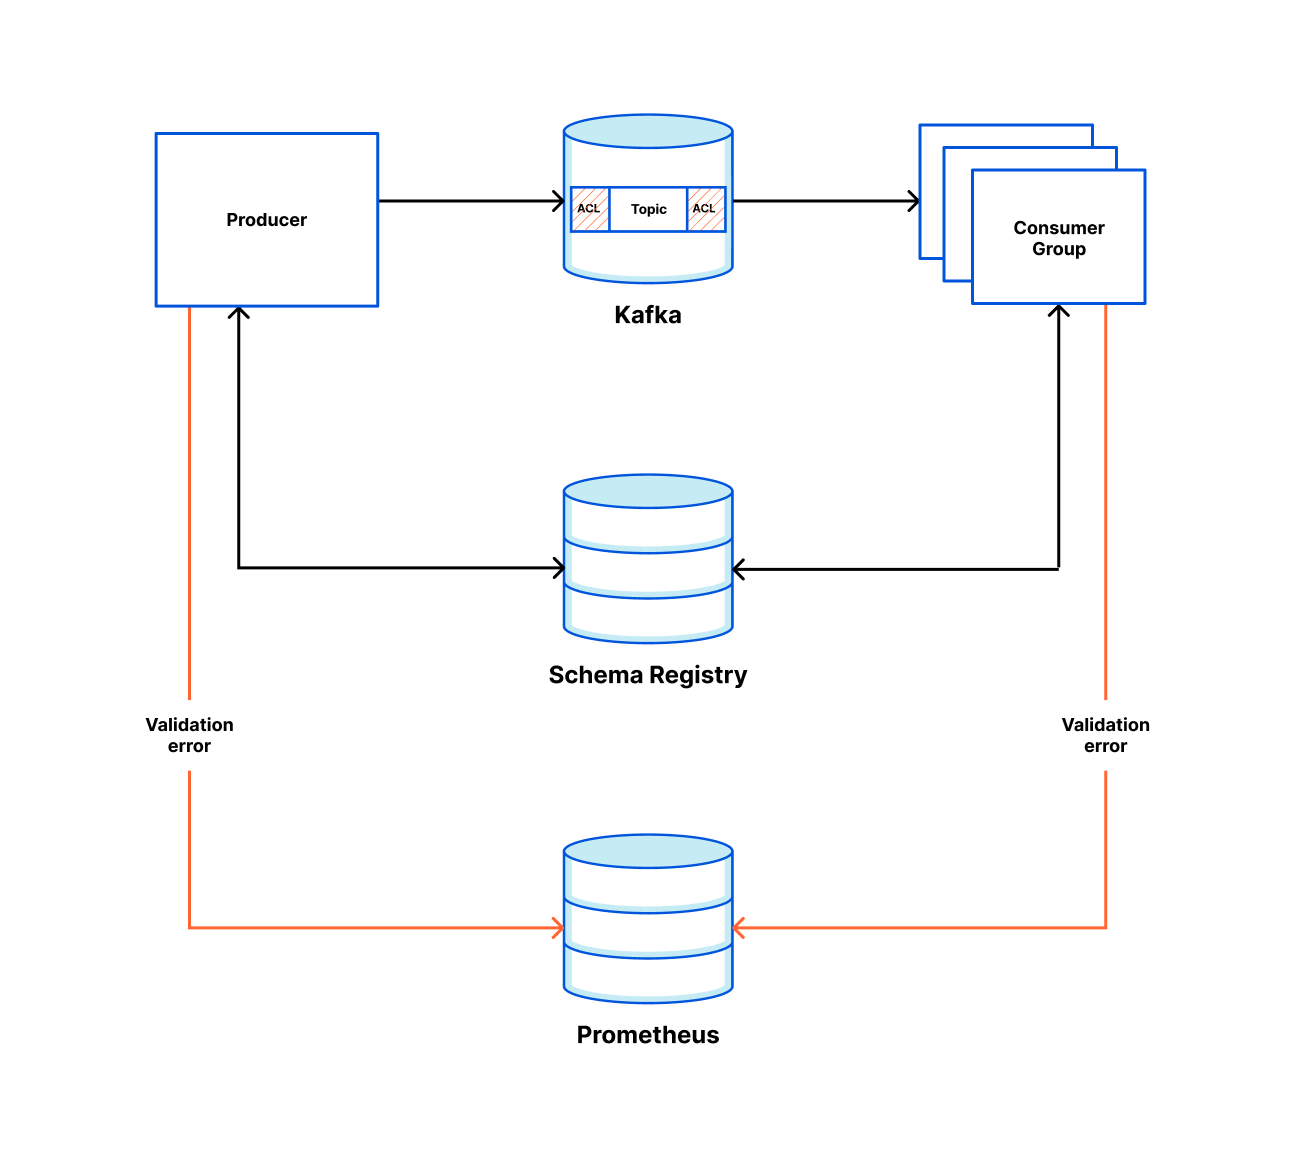
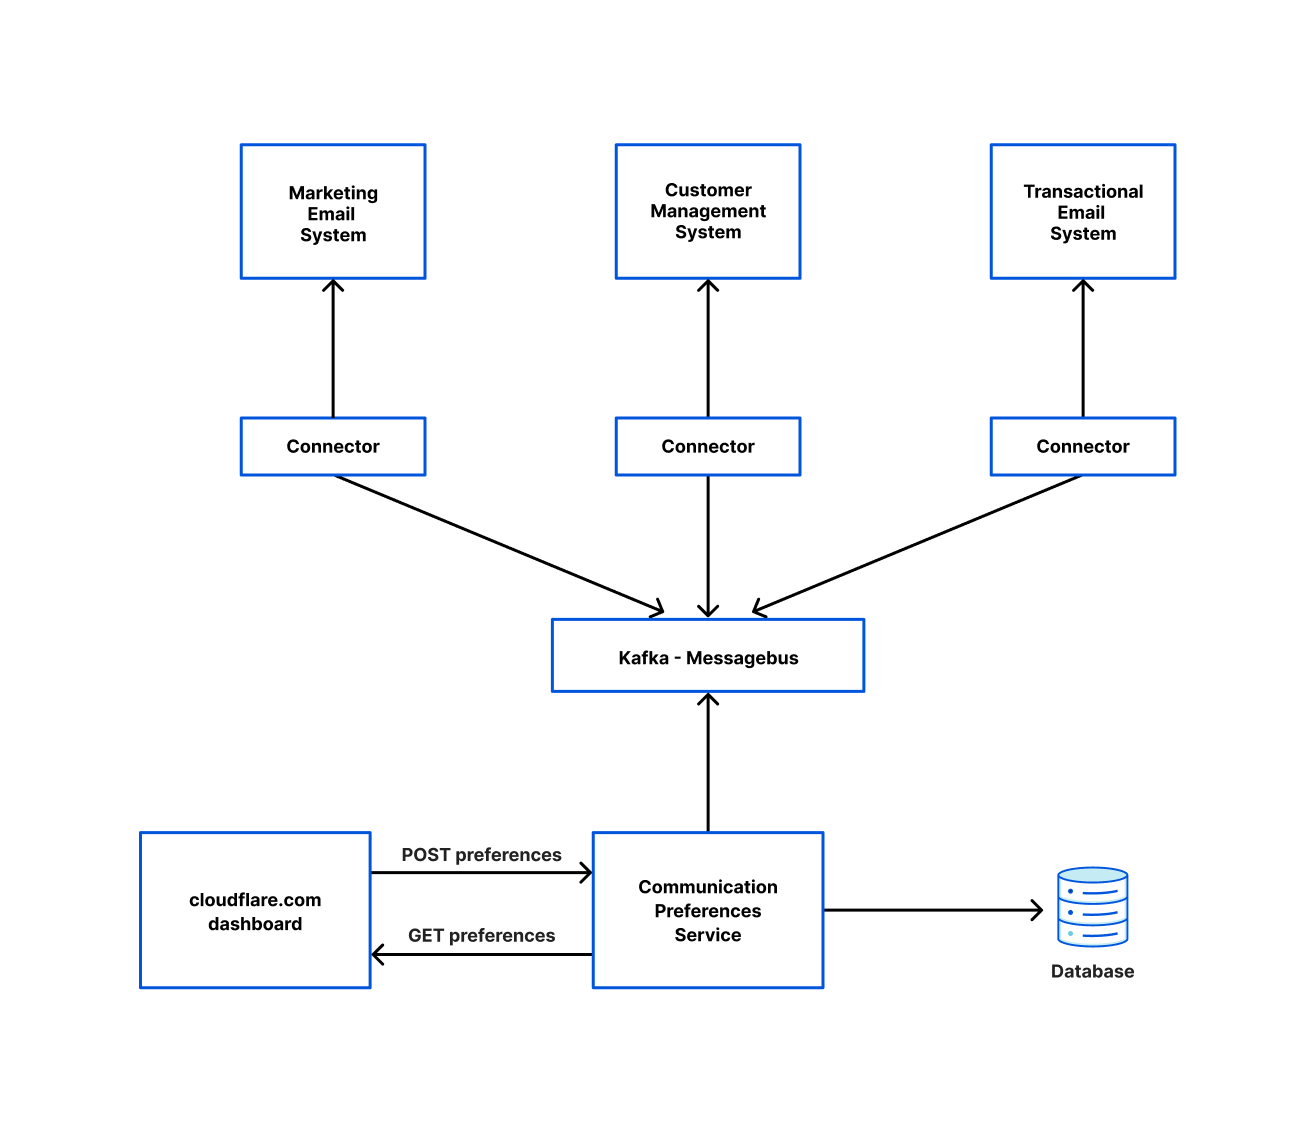
Below is a diagram of how one team used our connector framework to read from the Messagebus cluster and write to various other systems. This is orchestrated by a system the Application Service team runs called Communication Preferences Service (CPS). Whenever a user opts in/out of marketing emails or changes their language preferences on cloudflare.com, they are calling CPS which ensures those settings are reflected in all the relevant systems.
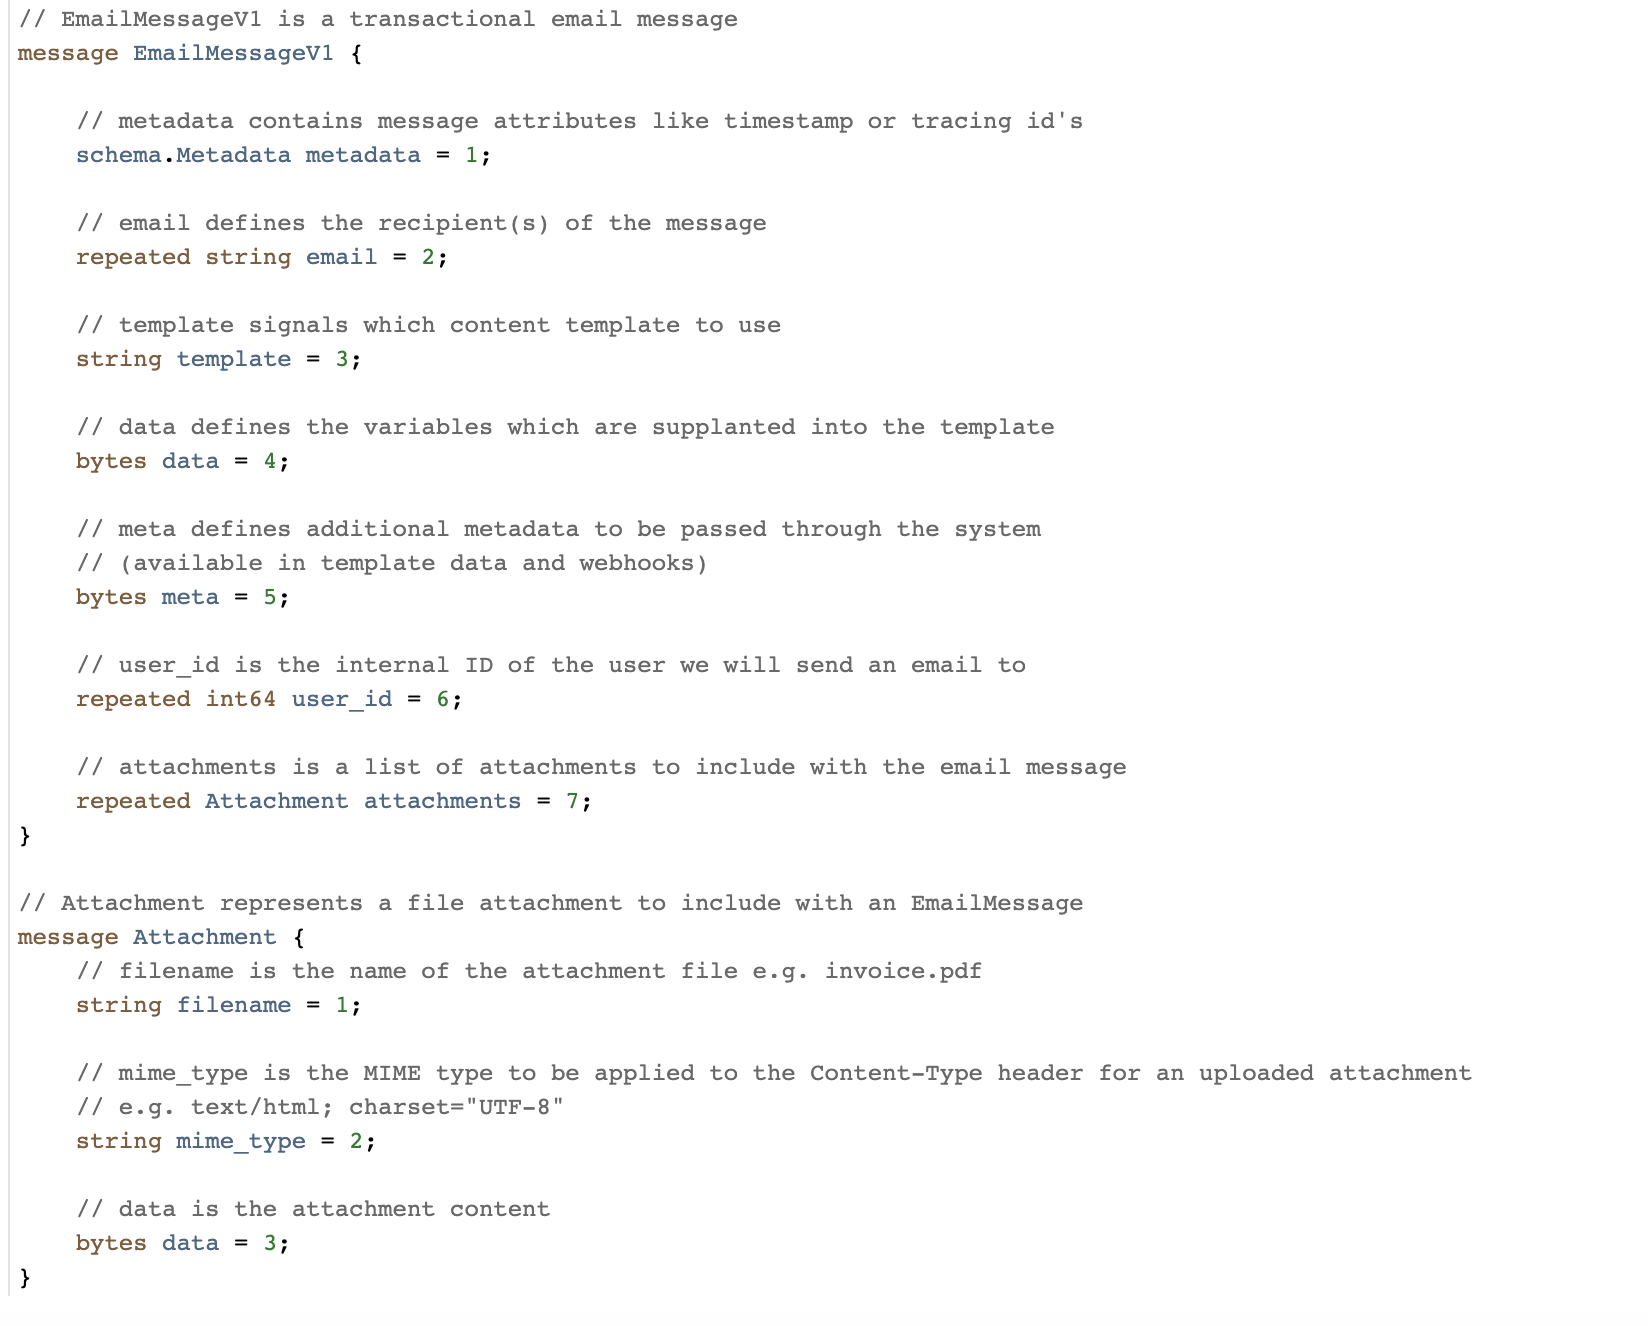
Using Apache Kafka to process 1 trillion messages

Strict Schemas

Alongside the Messagebus-Client library, we also provide a repo called Messagebus Schema. This is a schema registry for all message types that will be sent over our Messagebus cluster. For message format, we use protobuf and have been very happy with that decision. Previously, our team had used JSON for some of our kafka schemas, but we found it much harder to enforce forward and backwards compatibility, as well as message sizes being substantially larger than the protobuf equivalent. Protobuf provides strict message schemas (including type safety), the forward and backwards compatibility we desired, the ability to generate code in multiple languages as well as the files being very human-readable.

We encourage heavy commentary before approving a merge. Once merged, we use prototool to do breaking change detection, enforce some stylistic rules and to generate code for various languages (at time of writing it’s just Go and Rust, but it is trivial to add more).

Using Apache Kafka to process 1 trillion messages
An example Protobuf message in our schema

Furthermore, in Messagebus Schema we store a mapping of proto messages to a team, alongside that team’s chat room in our internal communication tool. This allows us to escalate issues to the correct team easily when necessary.

One important decision we made for the Messagebus cluster is to only allow one proto message per topic. This is configured in Messagebus Schema and enforced by the Messagebus-Client. This was a good decision to enable easy adoption, but it has led to numerous topics existing. When you consider that for each topic we create, we add numerous partitions and replicate them with a replication factor of at least three for resilience, there is a lot of potential to optimize compute for our lower throughput topics.

Observability

Making it easy for teams to observe Kafka is essential for our decoupled engineering model to be successful. We therefore have automated metrics and alert creation wherever we can to ensure that all the engineering teams have a wealth of information available to them to respond to any issues that arise in a timely manner.

We use Salt to manage our infrastructure configuration and follow a Gitops style model, where our repo holds the source of truth for the state of our infrastructure. To add a new Kafka topic, our engineers make a pull request into this repo and add a couple of lines of YAML. Upon merge, the topic and an alert for high lag (where lag is defined as the difference in time between the last committed offset being read and the last produced offset being produced) will be created. Other alerts can (and should) be created, but this is left to the discretion of application teams. The reason we automatically generate alerts for high lag is that this simple alert is a great proxy for catching a high amount of issues including:

  • Your consumer isn’t running.
  • Your consumer cannot keep up with the amount of throughput or there is an anomalous amount of messages being produced to your topic at this time.
  • Your consumer is misbehaving and not acknowledging messages.

For metrics, we use Prometheus and display them with Grafana. For each new topic created, we automatically provide a view into production rate, consumption rate and partition skew by producer/consumer. If an engineering team is called out, within the alert message is a link to this Grafana view.

Using Apache Kafka to process 1 trillion messages

In our Messagebus-Client, we expose some metrics automatically and users get the ability to extend them further. The metrics we expose by default are:

For producers:

  • Messages successfully delivered.
  • Message failed to deliver.

For consumer:

  • Messages successfully consumed.
  • Message consumption errors.

Some teams use these for alerting on a significant change in throughput, others use them to alert if no messages are produced/consumed in a given time frame.

A Practical Example

As well as providing the Messagebus framework, the Application Services team looks for common concerns within Engineering and looks to solve them in a scalable, extensible way which means other engineering teams can utilize the system and not have to build their own (thus meaning we are not building lots of disparate systems that are only slightly different).

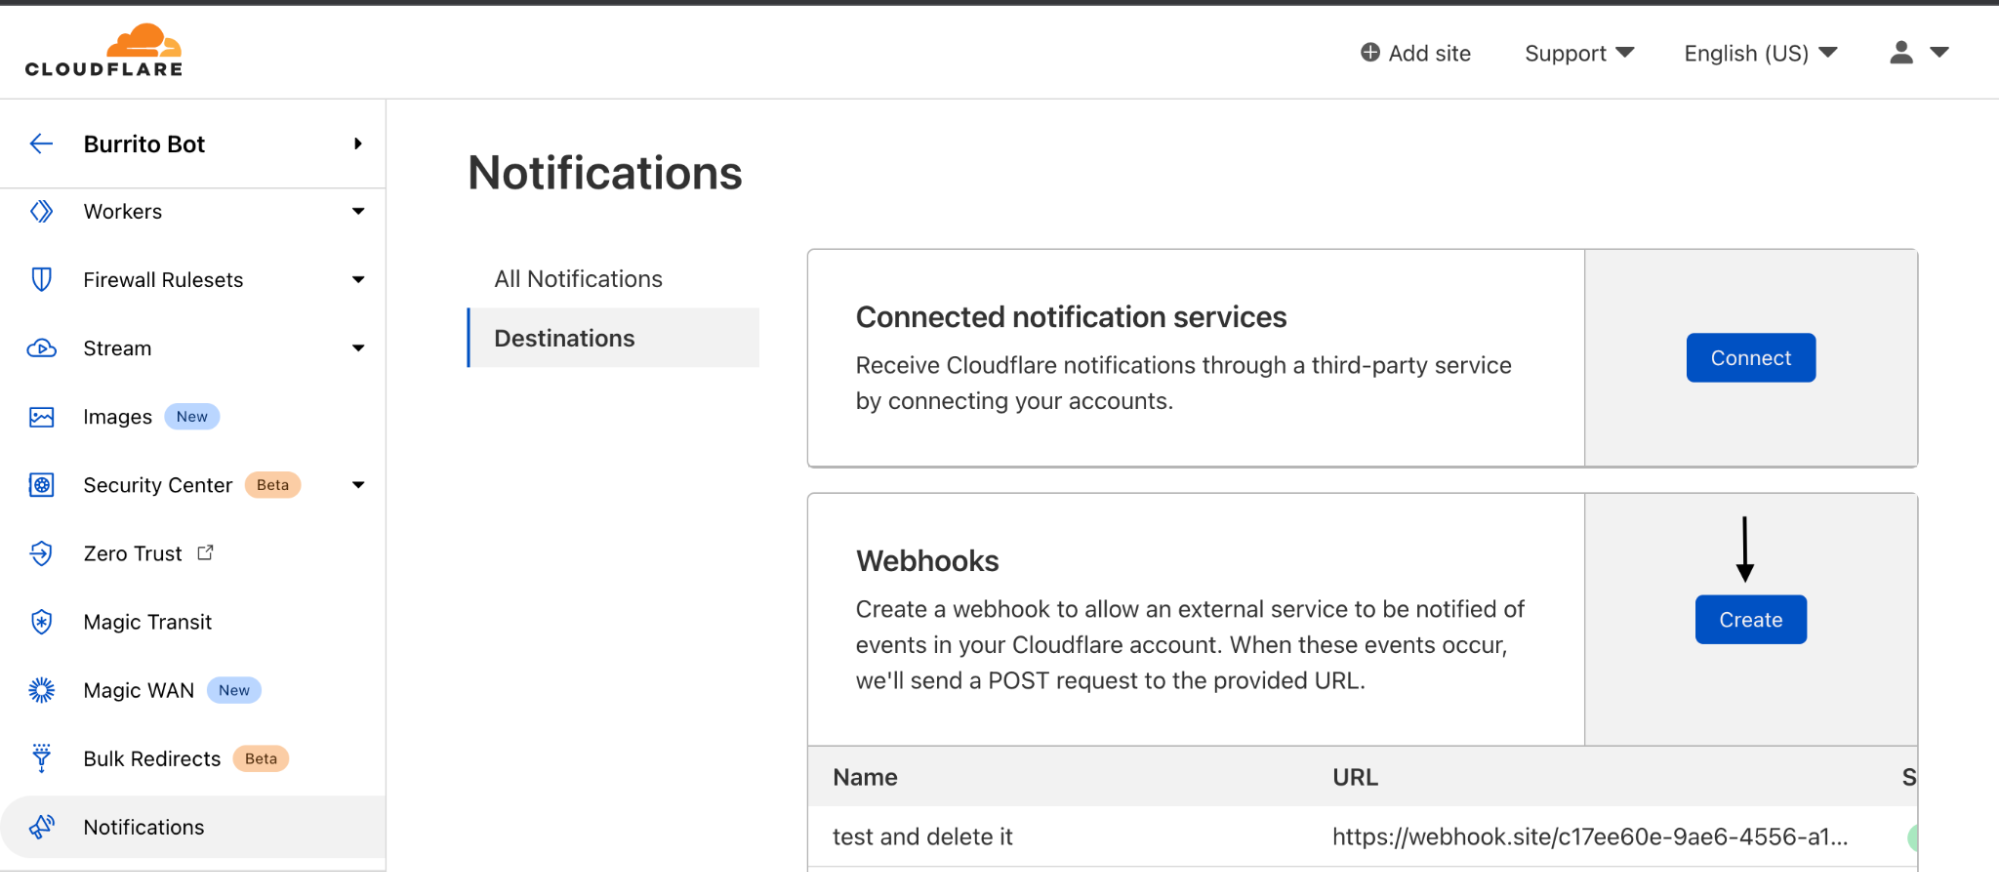
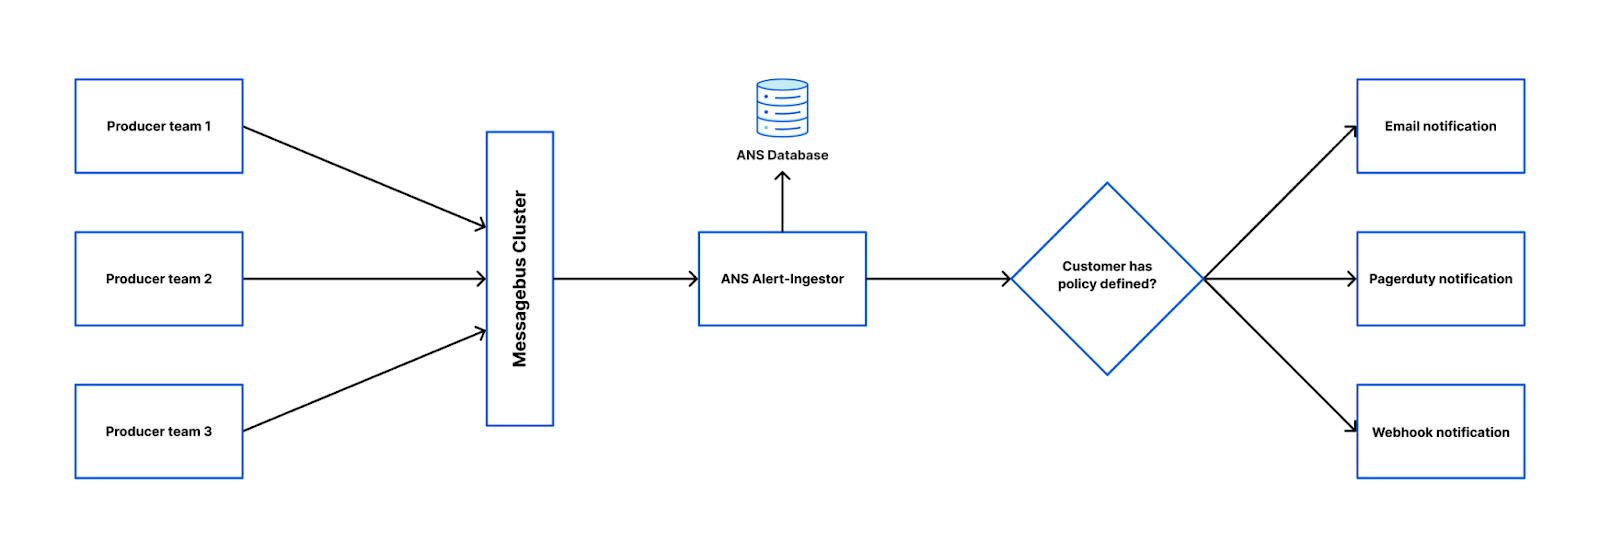
One example is the Alert Notification System (ANS). ANS is the backend service for the “Notifications” tab in the Cloudflare dashboard. You may have noticed over the past 12 months that new alert and policy types have been made available to customers very regularly. This is because we have made it very easy for other teams to do this. The approach is:

  • Create a new entry into ANS’s configuration YAML (We use CUE lang to validate the configuration as part of our continuous integration process);
  • Import our Messagebus-Client into your code base;
  • Emit a message to our alert topic when an event of interest takes place.

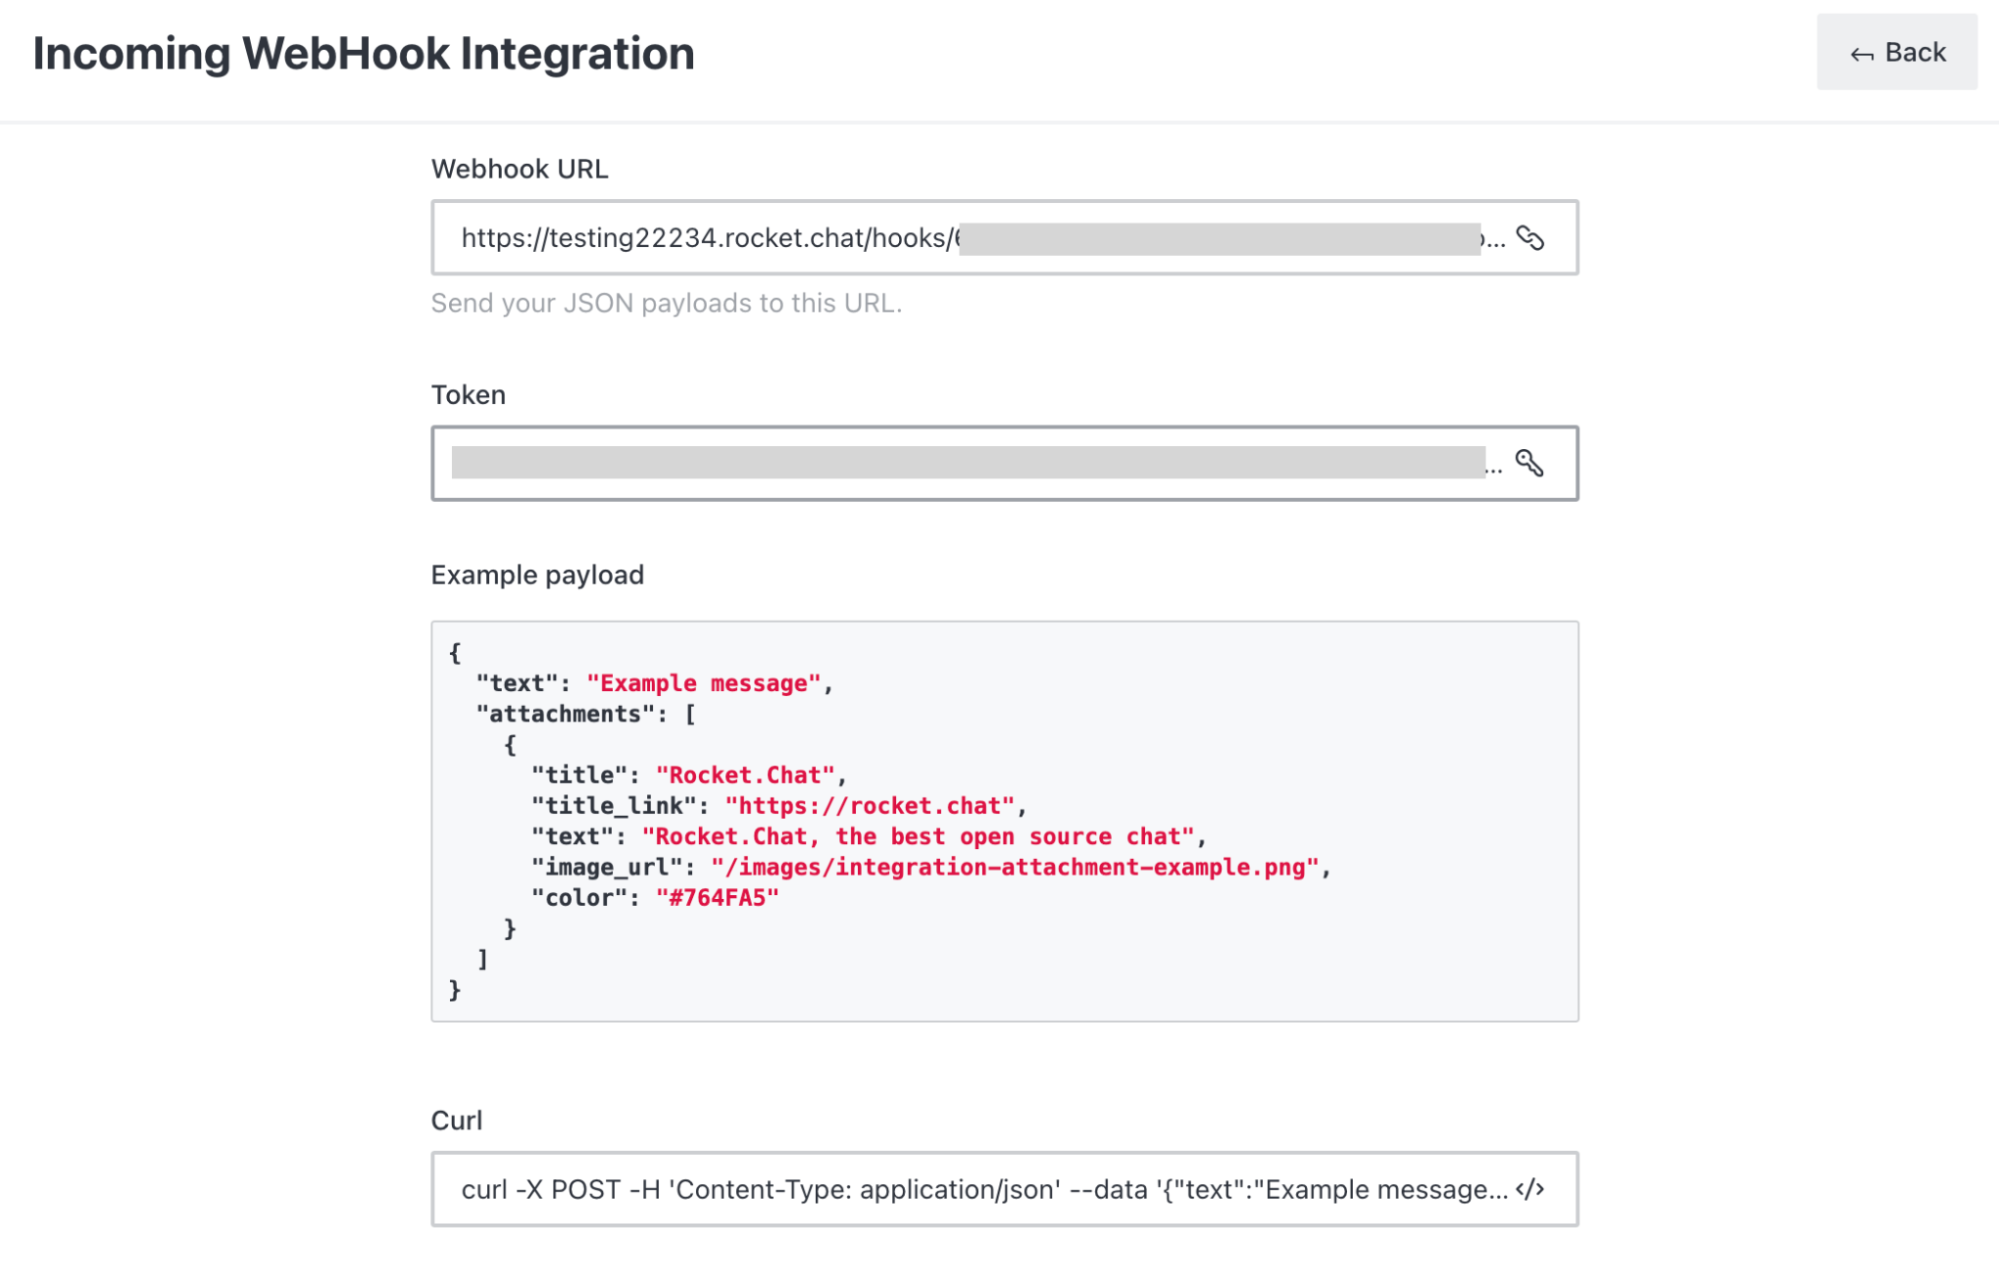
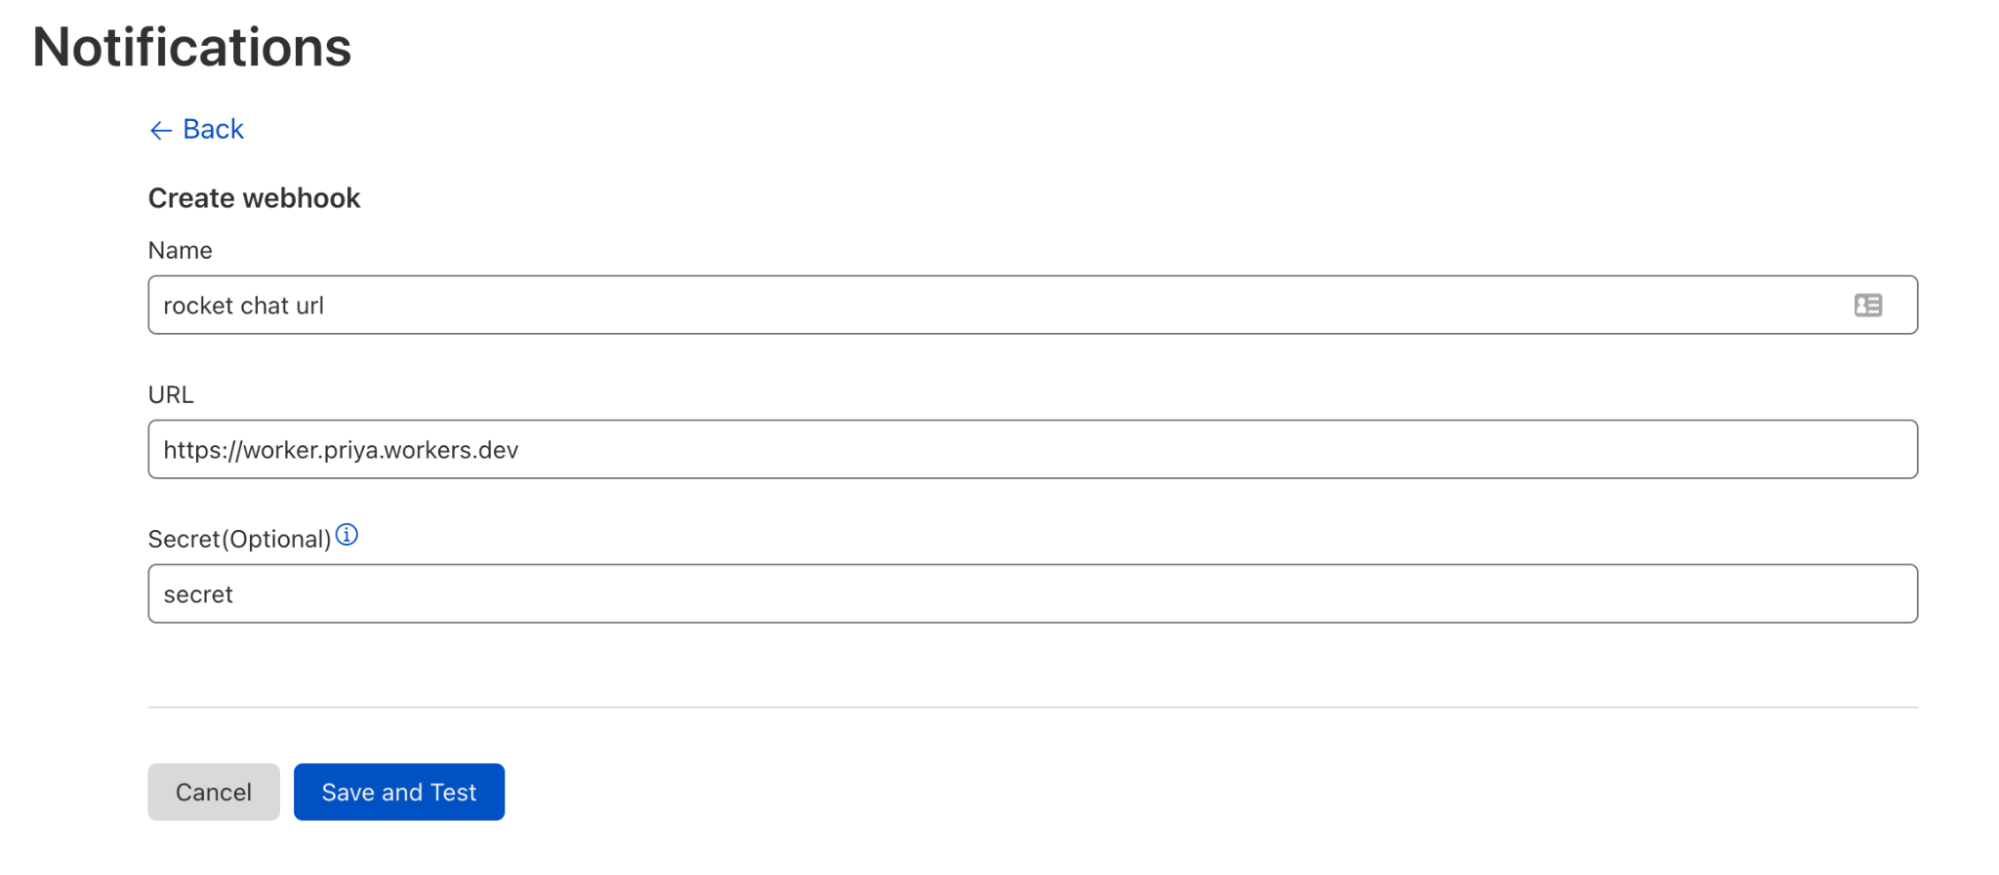
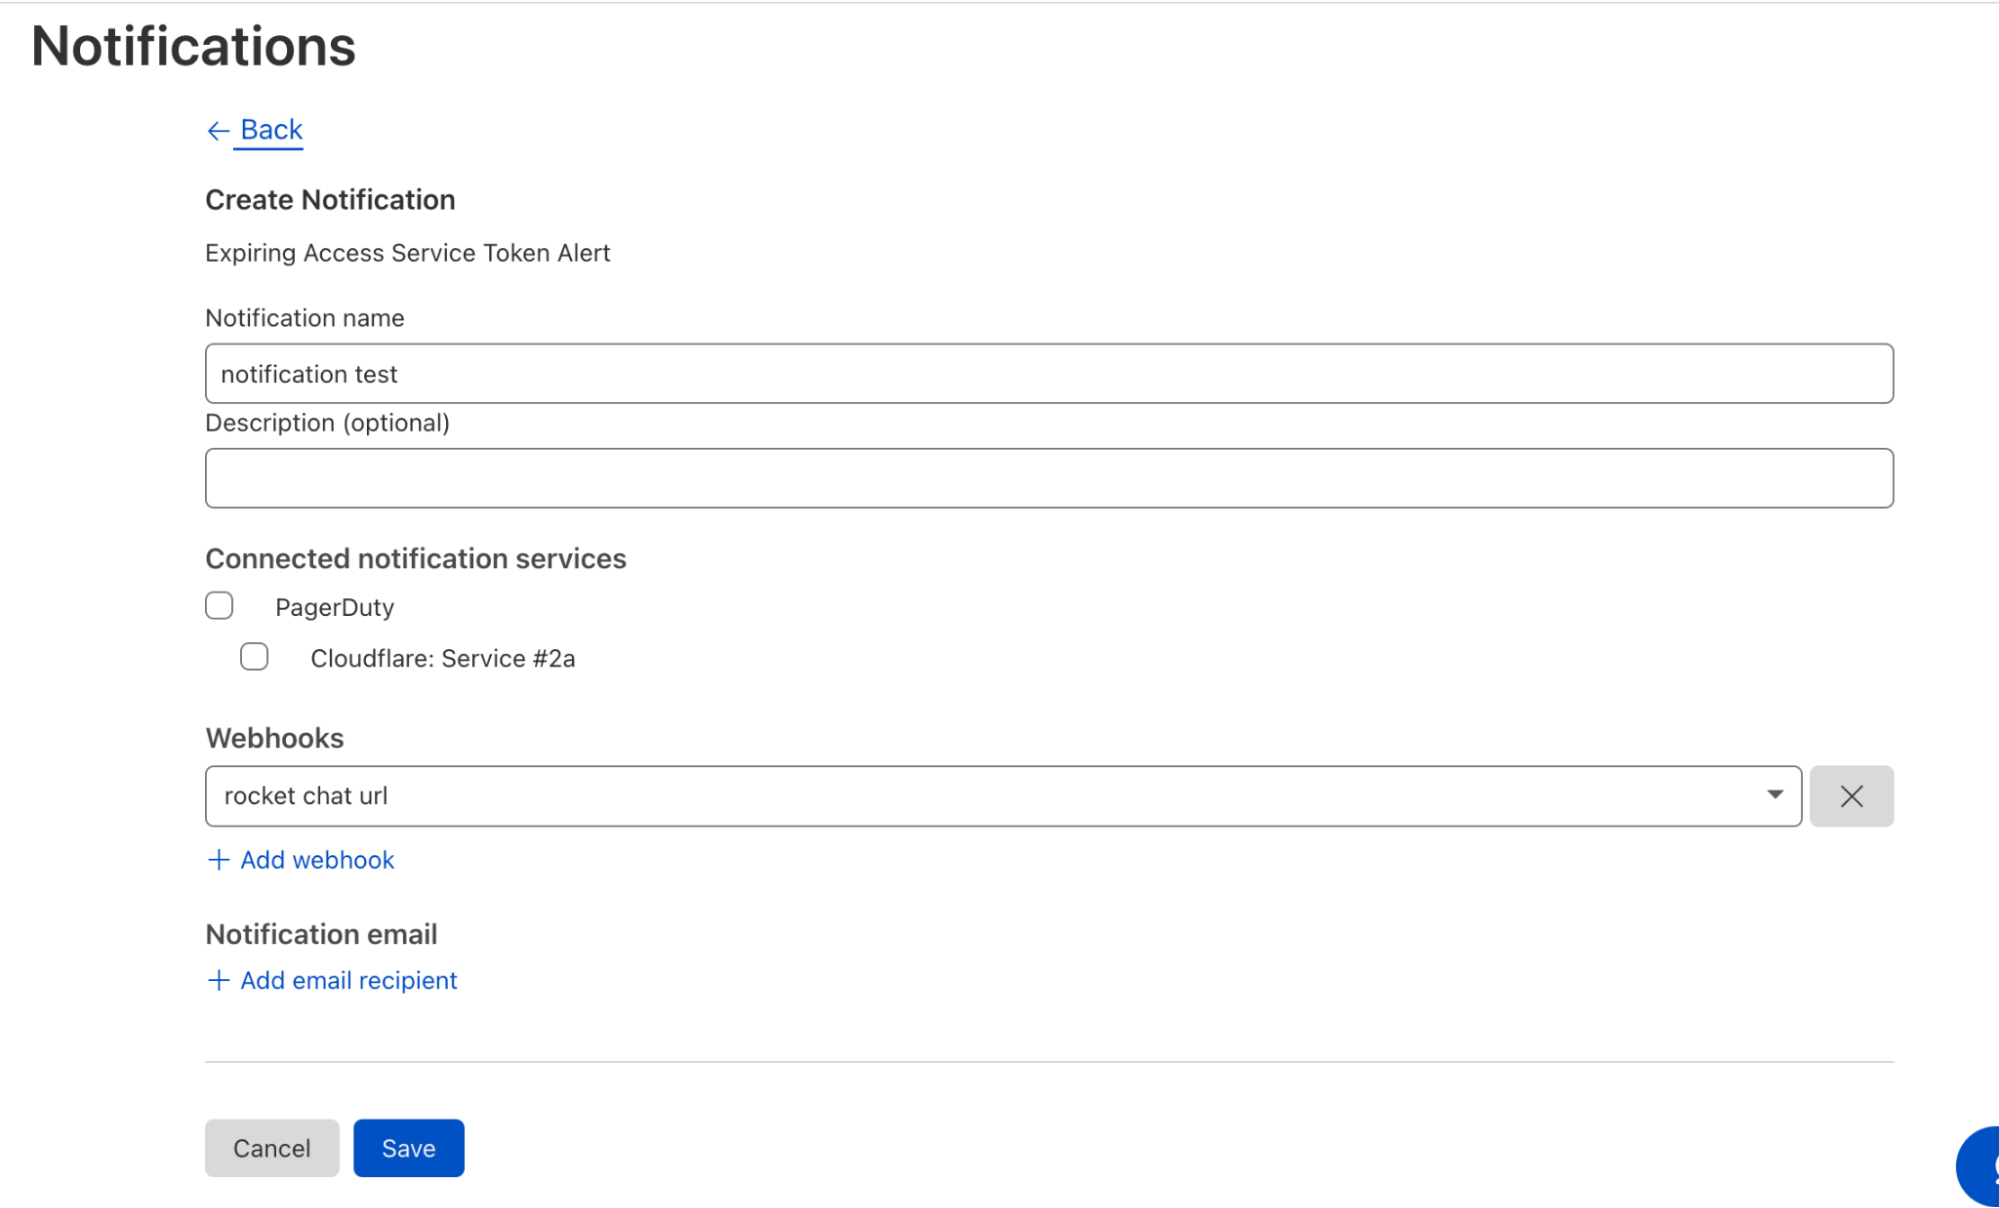
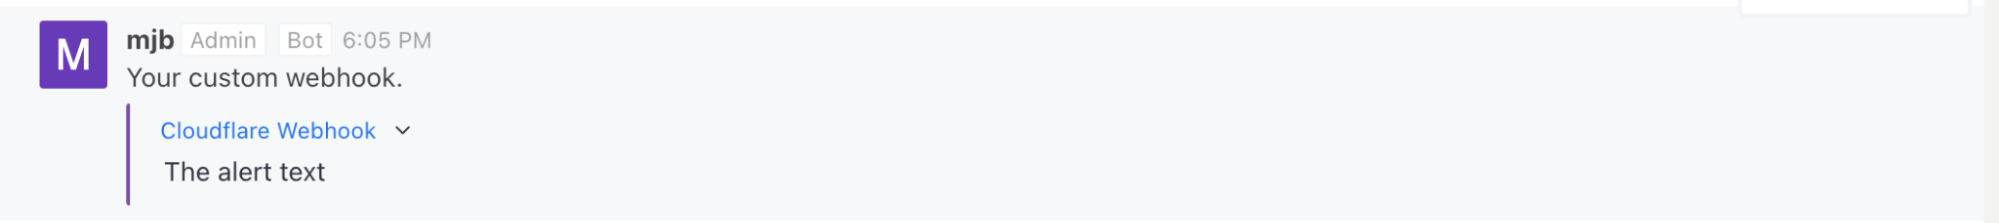
That’s it! The producer team now has a means for customers to configure granular alerting policies for their new alert that includes being able to dispatch them via Slack, Google Chat or a custom webhook, PagerDuty or email (by both API and dashboard). Retrying and dead letter messages are managed for them, and a whole host of metrics are made available, all by making some very small changes.

Using Apache Kafka to process 1 trillion messages

What’s Next?

Usage of Kafka (and our Messagebus tools) is only going to increase at Cloudflare as we continue to grow, and as a team we are committed to making the tooling around Messagebus easy to use, customizable where necessary and (perhaps most importantly) easy to observe. We regularly take feedback from other engineers to help improve the Messagebus-Client (we are on the fifth version now) and are currently experimenting with abstracting the intricacies of Kafka away completely and allowing teams to use gRPC to stream messages to Kafka. Blog post on the success/failure of this to follow!

If you’re interested in building scalable services and solving interesting technical problems, we are hiring engineers on our team in Austin, and Remote US.

Cloudflare Relay Worker

Post Syndicated from Matt Boyle original https://blog.cloudflare.com/cloudflare-relay-worker/

Cloudflare Relay Worker

Cloudflare Relay Worker

Our Notification Center offers first class support for a variety of popular services (a list of which are available here). However, even with such extensive support, you may use a tool that isn’t on that list. In that case, it is possible to leverage Cloudflare Workers in combination with a generic webhook to deliver notifications to any service that accepts webhooks.

Today, we are excited to announce that we are open sourcing a Cloudflare Worker that will make it as easy as possible for you to transform our generic webhook response into any format you require. Here’s how to do it.

For this example, we are going to write a Cloudflare Worker that takes a generic webhook response, transforms it into the correct format and delivers it to Rocket Chat, a popular customer service messaging platform.  When Cloudflare sends you a generic webhook, it will have the following schema, where “text” and “data” will vary depending on the alert that has fired:

{
   "name": "Your custom webhook",
   "text": "The alert text",
   "data": {
       "some": "further",
       "info": [
           "about",
           "your",
           "alert",
           "in"
       ],
       "json": "format"
   },
   "ts": 123456789
}

Whereas Rocket Chat is looking for this format:

{
   "text": "Example message",
   "attachments": [
       {
           "title": "Rocket Chat",
           "title_link": "https://rocket.chat",
           "text": "Rocket.Chat, the best open source chat",
           "image_url": "/images/integration-attachment-example.png",
           "color": "#764FA5"
       }
   ]
}

Getting Started

Firstly, you’ll need to ensure you are ready to develop on the Cloudflare Workers platform. You can find more information on how to do that here. For the purpose of this example, we will assume you have a Cloudflare account and Wrangler, the Workers CLI, setup.

Next, let us see the steps to extend the notifications system in detail.

Step 1
Clone the webhook relay worker GitHub repository: git clone [email protected]:cloudflare/cf-webhook-relay.git

Step 2
Check the webhook payload format required by your communication tool. In this specific case, it would look like the Rocket Chat example payload shared above.

Step 3
Sign up for Rocket Chat and add a webhook integration to accept incoming webhook notifications.

Cloudflare Relay Worker

Step 4
Configure an encrypted wrangler secret for request authentication and the Rocket Chat URL for sending requests in your Worker: Environment variables · Cloudflare Workers docs (for this example, the secret is not encrypted.)

Cloudflare Relay Worker

Step 5
Modify your worker to accept POST webhook requests with the secret configured as a query param for authentication.

if (headers.get("cf-webhook-auth") !== WEBHOOK_SECRET) {
    return new Response(":(", {
        headers: {'content-type': 'text/plain'},
            status: 401
    })
}

Step 6
Convert the incoming request payload from the notification system (like in the example shared above) to the Rocket Chat format in the worker.

let incReq = await request.json()
let msg = incReq.text
let webhookName = incReq.name
let rocketBody = {
    "text": webhookName,
    "attachments": [
        {
            "title": "Cloudflare Webhook",
            "text": msg,
            "title_link": "https://cloudflare.com",
            "color": "#764FA5"
        }
    ]
}

Step 7
Configure the Worker to send POST requests to the Rocket Chat webhook with the converted payload.

const rocketReq = {
    headers: {
        'content-type': 'application/json',
    },
    method: 'POST',
    body: JSON.stringify(rocketBody),
}
const response = await fetch(
    ROCKET_CHAT_URL,
    rocketReq,
)
const res = await response.json()
console.log(res)
return new Response(":)", {
    headers: {'content-type': 'text/plain'},
})

Step 8
Set up deployment configuration in your wrangler.toml file and publish your Worker. You can now see the Worker in the Cloudflare dashboard.

Cloudflare Relay Worker

Step 9
You can manage and monitor the Worker with a variety of available tools.

Cloudflare Relay Worker

Step 10
Add the Worker URL as a generic webhook to the notification destinations in the Cloudflare dashboard: Configure webhooks · Cloudflare Fundamentals docs.

Cloudflare Relay Worker

Step 11
Create a notification with the destination as the configured generic webhook: Create a Notification · Cloudflare Fundamentals docs.

Cloudflare Relay Worker

Step 12
Tada! With your Cloudflare Worker running, you can now receive all notifications to Rocket Chat. We can configure in the same way for any communication tool.

Cloudflare Relay Worker

We know that a notification system is essential to proactively monitor any issues that may arise within a project. We are excited with this announcement to make notifications available to any communication service without having to worry too much about the system’s compatibility to them. We have lots of updates planned, like adding more alertable events to choose from and extending our support to a wide range of webhook services to receive them.

If you’re interested in building scalable services and solving interesting technical problems, we are hiring engineers on our team in Austin & Lisbon.

From 0 to 20 billion – How We Built Crawler Hints

Post Syndicated from Matt Boyle original https://blog.cloudflare.com/from-0-to-20-billion-how-we-built-crawler-hints/

From 0 to 20 billion - How We Built Crawler Hints

From 0 to 20 billion - How We Built Crawler Hints

In July 2021, as part of Impact Innovation Week, we announced our intention to launch Crawler Hints as a means to reduce the environmental impact of web searches. We spent the weeks following the announcement hard at work, and in October 2021, we announced General Availability for the first iteration of the product. This post explains how we built it, some of the interesting engineering problems we had to solve, and shares some metrics on how it’s going so far.

Before We Begin…

Search indexers crawl sites periodically to check for new content. Algorithms vary by search provider, but are often based on either a regular interval or cadence of past updates, and these crawls are often not aligned with real world content changes. This naive crawling approach may harm customer page rank and also works to the detriment of search engines with respect to their operational costs and environmental impact. To make the Internet greener and more energy efficient, the goal of Crawler Hints is to help search indexers make more informed decisions on when content has changed, saving valuable compute cycles/bandwidth and having a net positive environmental impact.

Cloudflare is in an advantageous position to help inform crawlers of content changes, as we are often the “front line” of the interface between site visitors and the origin server where the content updates take place. This grants us knowledge of some key data points like headers, content hashes, and site purges among others. For customers who have opted in to Crawler Hints, we leverage this data to generate a “content freshness score” using an ensemble of active and passive signals from our customer base and request flow. To help with efficiency, Crawler Hints helps to improve SEO for websites behind Cloudflare, improves relevance for search engine users, and improves origin responsiveness by reducing bot traffic to our customers’ origin servers.

A high level design of the system we built looks as follows:

From 0 to 20 billion - How We Built Crawler Hints

In this blog we will dig into each aspect of it in more detail.

Keeping Things Fresh

Cloudflare has a large global network spanning 250 cities.  A popular use case for Cloudflare is to use our CDN product to cache your website’s assets so that users accessing your site can benefit from lightning fast response times. You can read more about how Cloudflare manages our cache here. The important thing to call out for the purpose of this post is that the cache is Data Center local. A cache hit in London might be a cache miss in San Francisco unless you have opted-in to tiered-caching, but that is beyond the scope of this post.

For Crawler Hints to work, we make use of a number of signals available at request time to make an informed decision on the “freshness” of content. For our first iteration of Crawler Hints, we used a cache miss from Cloudflare’s cache as a starting basis. Although a naive signal on its own, getting the data pipelines in place to forward cache miss data from our global network to our control plane meant we would have everything in place to iterate on and improve the signal processing quickly going forward. To do this, we leveraged some existing services from our data team that takes request data , marshalls it into Cap’n Proto format, and forwards it to a message bus (we use apache Kafka). These messages include the URLs of the resources that have met the signal criteria, along with some additional metadata for analytics/future improvement.

From 0 to 20 billion - How We Built Crawler Hints

The amount of traffic our global network receives is substantial. We serve over 28 million HTTP requests per second on average, with more than 35 million HTTP requests per second at peak. Typically, Cloudflare teams sample this data to enable products such as being alerted when you are under attack. For Crawler Hints, every cache miss is important. Therefore, 100% of all cache misses for opted-in sites were sent for further processing, and we’ll discuss more on opt-in later.

Redis as a Distributed Buffer

With messages buffered in Kafka, we can now begin the work of aggregation and deduplication. We wrote a consumer service that we call an ingestor. The ingestor reads the data from Kafka. The ingestor performs validation to ensure proper sanitization and data integrity and passes this data onto the next stage of the system. We run the ingestor as part of a Kafka consumer group, allowing us to scale our consumer count up to the partition size as throughput increases.

We ultimately want to deliver a set of “fresh” content to our search partners on a dynamic interval. For example, we might want to send a batch of 10,000 URLs every two minutes. There are, however, a couple of important things to call out though:

  • There should be no duplicate resources in each batch.
  • We should strike a balance in our size and frequency such that overall request size isn’t too large, but big enough to remove some pressure on the receiving API by not sending too many requests at once.

For the deduplication, the simplest thing to do would be to have an in-memory map in our service to track resources between a pre-specified interval. A naive implementation in Go might look something like this.

From 0 to 20 billion - How We Built Crawler Hints

The problem with this approach is we have little resilience. If the service was to crash, we would lose all the data for our current batch. Furthermore, if we were to run multiple instances of our services, they would all have a different “view” of which resources they had seen before and therefore we would not be deduplicating.To mitigate this issue, we decided to use a specialist caching service. There are a number of distributed caches that would fit the bill, but we chose Redis given our team’s familiarity with operating it at scale.

Redis is well known as a Key Value(KV) store often used for caching things,optionally with a specified Time To Live(TTL). Perhaps slightly less obvious is its value as a distributed buffer, housing ephemeral data with periodic flush/tear-downs. For Crawler Hints, we leveraged both these traits via a multi-generational, multi-cluster setup to achieve a highly available rolling aggregation service.

Two standalone Redis clusters were spun up. For each generation of request data, one cluster would be designated as the active primary. The validated records would be inserted as keys on the primary, serving the dual purpose of buffering while also deduplicating since Redis keys are unique. Separately, a downstream service (more on this later!) would periodically issue the command for these inserters to switch from the active primary (cluster A) to the inactive cluster (cluster B). Cluster A could then be flushed with records being batch read in a size of our choosing.

From 0 to 20 billion - How We Built Crawler Hints

Buffering for Dispatch

At this point, we have clean, batched data. Things are looking good! However, there’s one small hiccup in the plan: we’re reading these batches from Redis at some set interval. What if it takes longer to dispatch than the interval itself? What if the search partner API is having issues?

We need a way to ensure the durability of the batch URLs and reduce the impact of any dispatch issues. To do this, we revisit an old friend from earlier: Kafka. The batches that get read from Redis are then fed into a Kafka topic. We wrote a Kafka consumer that we call the “dispatcher service” which runs within a consumer group to enable us to scale it if necessary just like the ingestor. The dispatcher reads from the Kafka topic and sends a batch of resources to each of our API partners.

Launching in tandem with Cloudflare, Crawler Hints was a joint venture between a few early adopters in the search engine space to provide a means for sites to inform indexers of content changes called IndexNow. You can read more about this launch here. IndexNow is a large part of what makes Crawler Hints possible. As part of its manifest, it provides a common API spec to publish resources that should be re-indexed. The standardized API makes abstracting the communication layer quite simple for the partners that support it. “Pushing” these signals to our search engine partners is a big step away from the inefficient “Pull” based model that is used today (you can read more about that here). We launched with Yandex and Bing as Search Engine Partners.

To ensure we can add more partners in the future, we defined an interface which we call a “Hinter”.

From 0 to 20 billion - How We Built Crawler Hints

We then satisfy this interface for each partner that we work with. We return a custom error from the Hinter service that is of type *indexers.Error. The definition of which is:

From 0 to 20 billion - How We Built Crawler Hints

This allows us to “bubble up” information about which indexer has failed and increment metrics and retry only those calls to indexers which have failed.

This all culminates together with the following in our service layer:

From 0 to 20 billion - How We Built Crawler Hints

Simple, performant, maintainable, AND easy to add more partners in the future.

Rolling out Crawler Hints

At Cloudflare, we often release things that haven’t been done before at scale. This project is a great example of that. Trying to gauge how many users would be interested in this product and what the uptake might be like on day one, day ten, and day one thousand is close to impossible. As engineers responsible for running this system, it is essential we build in checks and balances so that the system does not become overwhelmed and responds appropriately. For this particular project, there are three different types of “protection” we put in place. These are:

  • Customer opt-in
  • Monitoring & Alerts
  • System resilience via “self-healing”

Customer opt-in

Cloudflare takes any changes that can impact customer traffic flow seriously. Considering Crawler Hints has the potential to change how sites are seen externally (even if in this instance the site’s viewers are robots!) and can impact things like SEO and bandwidth usage, asking customers to opt-in is a sensible default. By asking customers to opt-in to the service, we can start to get an understanding of our system’s capacity and look for bottle necks and how to remove them. To do this, we make extensive use of Prometheus, Grafana, and Kibana.

Monitoring & Alerting

We do our best to make our systems as “self-healing” and easy to run as possible, but as they say, “By failing to prepare, you are preparing to fail.” We therefore invest a lot of time creating ways to track the health and performance of our system and creating automated alerts when things fall outside of expected bounds.

Below is a small sample of the Grafana dashboard we created for this project. As you can see, we can track customer enablement and the rate of hint dispatch in real time. The bottom two panels show the throughput of our Kafka clusters by partition. Even just these four metrics give us a lot of insight into how things are going, but we also track (as well as other things):

  • Lag on Kafka by partition (how far behind real time we are)
  • Bad messages received from Kafka
  • Amount of URLs processed per “run”
  • Response code per index partner over time
  • Response time of partner API over time
  • Health of the Redis clusters (how much memory is used, frequency of commands we are using received by the cluster)
  • Memory, CPU usage, and pods available against configured limits/requests
From 0 to 20 billion - How We Built Crawler Hints

It seems a lot to track, but this information is invaluable to us, and we use it to generate alerts that notify the on-call engineer if a threshold is breached. For example, we have an alert that would escalate to an engineer if our Redis cluster approached 80% capacity. For some thresholds we specify, we may want the system to “self-heal.” In this instance, we would want an engineer to investigate as this is outside the bounds of “normal,” and it might be that something is not working as expected. An alternative reason that we might receive alerts is that our product has increased in popularity beyond our expectations, and we simply need to increase the memory limit. This requires context and is therefore best left to a human to make this decision.

System Resilience via “self-healing”

We do everything we can to not disturb on-call engineers, and therefore, we try to make the system as “self-healing” as possible. We also don’t want to have too much extra resource running as it can be expensive and use limited capacity that another  Cloudflare service might need more – it’s a trade off.  To do this, we make use of a few patterns and tools common in every distributed engineer’s toolbelt. Firstly, we deploy on Kubernetes. This enables us to make use of great features like Horizontal Pod Autoscaling. When any of our pods reach ~80% memory usage, a new pod is created which will pick up some of the slack up to a predefined limit.

Secondly, by using a message bus, we get a lot of control over the amount of “work” our services have to do in a given time frame. In general, a message bus is “pull” based. If we want more work, we ask for it. If we want less work, we pull less. This holds for the most part, but with a system where being close to real time is important, it is essential that we monitor the “lag” of the topic, or how far we are behind real time. If we are too far behind, we may want to introduce more partitions or consumers.

Finally, networks fail. We therefore add retry policies to all HTTP calls we make before reporting them a failure. For example, if we were to receive a 500 (Internal Server Error) from one of our partner APIs, we would retry up to five times using an exponential backoff strategy before reporting a failure.

Data from the first couple of months

Since the release of Crawler Hints on October 18, 2021 until December 15, 2021, Crawler Hints has processed over twenty five billion crawl signals, has been opted-in to by more than 81,000 customers, and has handled roughly 18,000 requests per second. It’s been an exciting project to be a part of, and we are just getting started.

What’s Next?

We will continue to work with our partners to improve the standard even further and continue to improve the signaling on our side to ensure the most valuable information is being pushed on behalf of our customers in a timely manner.

If you’re interested in building scalable services and solving interesting technical problems, we are hiring engineers on our team in Austin, Lisbon, and London.