Tag Archives: productivity

Bringing npm registry services to GitHub Codespaces

Post Syndicated from Di Hei original https://github.blog/2024-02-13-bringing-npm-registry-services-to-github-codespaces/

The npm engineering team recently transitioned to using GitHub Codespaces for local development for npm registry services. This shift to Codespaces has substantially reduced the friction of our inner development loop and boosted developer productivity. In this post, we would like to share our experiences and learnings from this transition, hoping this information may be useful to you.

What are npm registry services

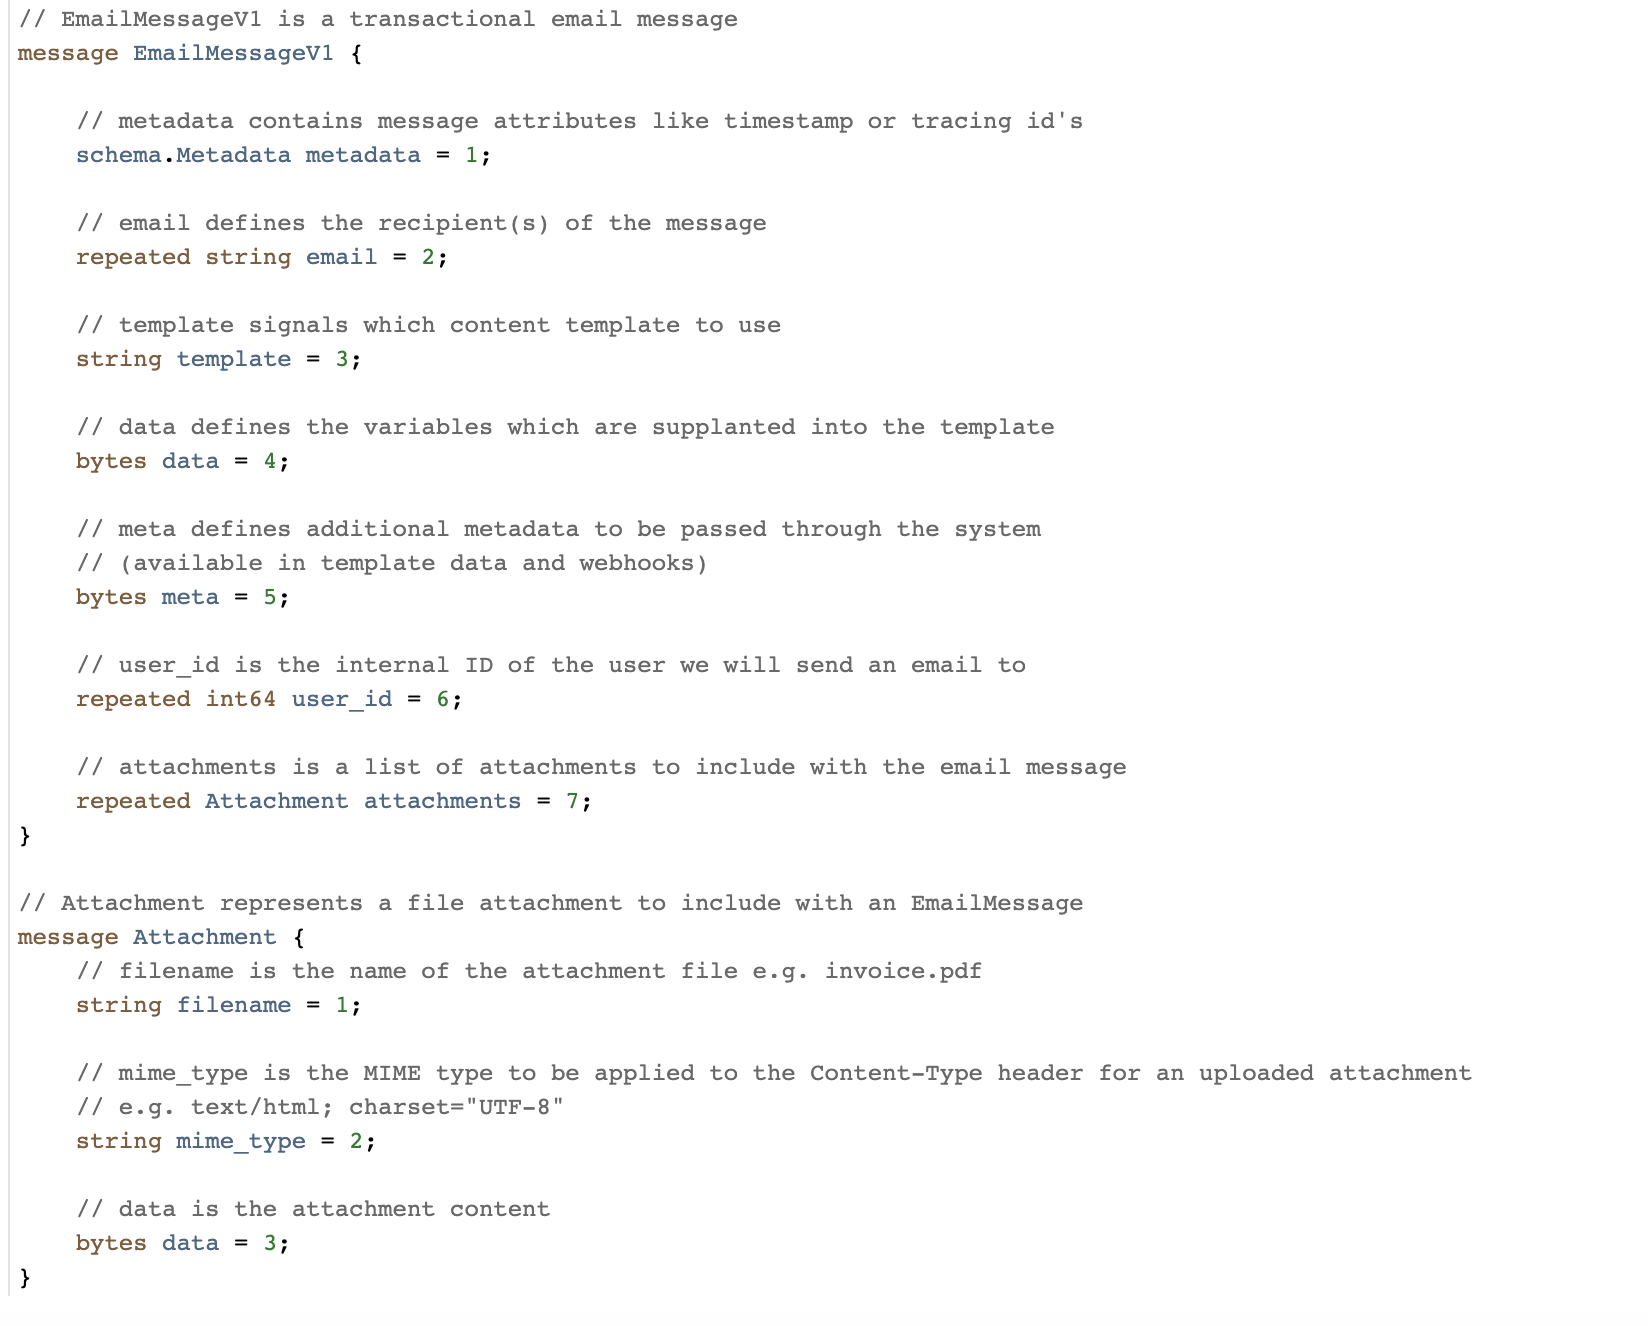
npm registry services, the Node.js microservices that power the npm registry, are distributed across 30+ different repositories. Each microservice has its own repository and is containerized using Docker. With Codespaces, we develop npm registry services using Docker on Codespaces with Visual Studio Code.

Codespaces reduces the friction of inner dev loop

Prior to Codespaces, a significant hurdle in npm local development was the difficulty in testing code across multiple services. We lacked a straightforward way to run multiple registry services locally, instead relying on our staging environment for testing. For example, to verify a code change in one service that affected a user workflow involving five other services, we could only run that service locally and connect to the remaining five in the staging environment. Due to security reasons, access to our staging environment is only possible via a VPN, adding another layer of complexity to the code testing process.

Codespaces addressed this issue by simplifying the process of running multiple registry services locally. When working in a codespace we no longer need a VPN connection for the inner dev loop. This change spares the team from potential issues related to VPN connectivity, and significantly simplifies the process of getting started.

As developers, we often rely on breakpoints for debugging. Now, with all registry services running within a single workspace, we can debug code and hit breakpoints across multiple services in Visual Studio Code as if they were one service. This is a significant improvement over previous developer experience, where hitting breakpoints in the services within the staging environment was not possible.

Codespaces boosts developer productivity

Codespaces has made it easier for outside contributors to participate. For example, if a GitHub engineer outside of the npm team wishes to contribute, they can get started within minutes with Codespaces, as the development environment is pre-configured and ready to go. Previously, setting up the development environment and granting permissions to access the staging resources would take days and often resulted in partners from other teams like design simply not contributing.

Port forwarding gives us access to TCP ports running within a codespace. Automatic port forwarding in Codespaces allows us to access services from a browser on our local machine for testing and debugging.

The in browser Codespaces experience, powered by Visual Studio Code for the Web, offers the flexibility to work from any computer. This is particularly helpful when you are away from your primary work computer, but need to test a quick change. The Web-based Codespaces experience provides a zero-install experience running entirely in your browser.

Remember those times when you were bogged down with a local environment issue that was not only time-consuming to troubleshoot but also difficult to reproduce on other machines? With Codespaces, you can quickly spin up a new Codespaces instance within minutes for a fresh start. The best part? There’s no need to fix the issue; you can simply discard the old codespace.

Things we learned from our use of Codespaces

Codespaces has tons of features to save you time and automate processes. Here are a few tips we learned from our use of Codespaces.

The prebuild feature of Codespaces is an excellent way to speed up the creation of a new codespace by creating a snapshot of your devcontainer and caching all the cloned repositories that can be used at startup time for the codespace. Codespaces prebuilds enable you to select branches and leverage GitHub Actions for automatic updates of these prebuilds.

You can store account-specific development secrets, such as access tokens, in Codespaces on a per-repository basis, ensuring secure usage within Codespaces. Those secrets are available as environment variables in your environment.

Another tip is specific to the Visual Studio Code Dev Container. Consider utilizing the Dev Container’s lifecycle events (such as postCreateCommand in devcontainer.json) to automate the Codespaces setup as much as possible. Ultimately, it’s a balance between time saved through automation and time invested in building and maintaining it. However, automation typically results in greater time savings because everyone who uses the configuration benefits.

Another trick is to use GitHub dotfiles to personalize your Codespaces. Dotfiles are files and folders on Unix-like systems starting with . that control the configuration of applications and shells on your system. You can use GitHub dotfiles to set up your personalized settings in Codespaces.

Conclusion

The adoption of GitHub Codespaces has substantially improved the developer experience of working on npm registry services. It has not only reduced the development environment setup time from hours to minutes but also facilitated better debugging experiences. Furthermore, it provides time-saving features like prebuilds. We hope this blog post offers valuable insights into our use of Codespaces. For more information, please refer to Codespaces documentation.

Harness the power of Codespaces. Learn more or get started now.

The post Bringing npm registry services to GitHub Codespaces appeared first on The GitHub Blog.

How to get in the flow while coding (and why it’s important)

Post Syndicated from Gwen Davis original https://github.blog/2024-01-22-how-to-get-in-the-flow-while-coding-and-why-its-important/


It’s the dream: your ideas are flowing, time and space fade away, the path ahead of you is clear, you’re moving at the speed of thought, and every click you make is gold.

This is called being in the flow or flow state. When you’re in the flow, you block out the world, are fully immersed in what you’re doing, and enjoy increased creativity, innovation, and happiness.

“Being in the flow is magical,” says Jonathan Carter, technical advisor of the CEO at GitHub. “You tell your teammates they can go to lunch and you’ll catch them later—not because you’re a workaholic, but because there’s truly nothing else you’d rather be doing right now.”

In this blog, we’ll explore what flow state entails, its benefits, and three tips for reaching it the next time you sit down to code. Let’s go.

What exactly is the flow state?

The concept of flow state came from positive psychologist Mihaly Csikszentmihalyi and his 1990 book, Flow: The Psychology of Optimal Experience. In it, Csikszentmihalyi describes nine dimensions of flow:

  1. Challenge-skills balance
  2. Total concentration
  3. Clear goals
  4. Immediate feedback
  5. Transformation of time
  6. Feeling intrinsically rewarded
  7. Effortlessness
  8. Loss of self-consciousness
  9. Feeling of total control

Csikszentmihalyi discovered these dimensions by conducting research to understand how people achieve productivity and happiness. He found that in people’s favorite, most absorbed moments, their thoughts and actions “flowed,” and brought unrivaled motivation, meaning, and creativity.

“Software has historically been viewed as mathematical or scientific in nature, but I would argue that writing code has more in common with other creative acts,” says Idan Gazit, senior director of research at GitHub. “Whether you’re writing an essay or writing a program, the challenge is getting into the headspace where you can untangle the thing you want to express.”

What are the benefits of flow state for developers?

When developers reach that coveted frame of mind, their productivity soars. According to our recent developer productivity research, developers produce higher quality work when they can easily collaborate—a hallmark of flow state—through comments, pull requests, issues, etc. According to the study, developers reported that effective collaboration provides a host of benefits:

  • Improved test coverage
  • Faster, cleaner, more secure code writing
  • Novel, creative solutions
  • Speedier deployments

On the flip side, when developers can’t freely collaborate, their work suffers (it takes 23 minutes, on average, to get back into the task at hand after an interruption, according to a study from the University of California, Irvine).

And flow state isn’t important just for individual developers—it helps businesses, too.

“When it comes to business success, flow state is everything,” says Chris Reddington, senior manager of developer advocacy at GitHub. This is because today’s environments use dozens of languages and often leverage multiple cloud providers, creating pressure, complexity, and distractions. He adds, “The more we can help engineering teams stay in the flow, where they are just focused on solving those bigger problems, the better.”

Quick tips for developers who want to get and stay in the flow state

So, how can you achieve flow state during your day-to-day tasks? The following tips should help you reach the flow state and stay there—regardless of industry or where you are in your developer career.

Tip #1: Optimize your environment

Creating a distraction-free environment that’s conducive to work can pay huge dividends. Here are some ideas:

  • Block time. Create personal focus events on your calendar where no one can schedule meetings with you.
  • Schedule breaks. Use a timer to give yourself 15-30 minute breaks throughout the workday.
  • Snooze Slack and phone notifications. Be antisocial and make yourself unavailable to the world.
  • Eliminate or reduce multitasking. Being able to do more than one task at a time is a myth, anyway.
  • Invest in headphones. Noise-canceling headphones, in particular, can keep your stress down and your focus high.
  • Get comfortable. Invest in ergonomic office equipment, wear comfortable clothes, and ensure you’ve had enough to eat.
  • Hold on scheduling meetings. If you’re a team leader, be mindful of meeting frequency.
  • Create a pre-flow ritual. Routines like grabbing coffee, checking your messages, and then putting your phone on silent can cue your brain that it’s time to get to work.

Of course, even with our best attempts, distractions happen. If you need to step away from the task at hand, that’s okay. Gazit also suggests pair programming or solution design to help overcome mental hurdles.

“It’s a great magic trick,” he says. “Stepping back and talking through the problem with a teammate is often the fastest route to getting unstuck.”

He also adds that GitHub Copilot can be helpful for this.

“GitHub Copilot is never busy,” he says. “I’m not distracting it when I put it to work. Debugging with a rubber duck is fantastic, but GitHub Copilot is the rubber duck that talks back. It helps me reason about the solution space and suggests approaches I wouldn’t have considered.”

A banner advertising GitHub's developer email newsletter.

Tip #2: Map out your work

You can also achieve flow state by ensuring you have a clear path for accomplishing your goal.

Gazit describes how he can get into the flow state when he correctly nails the balance of architectural work. This is especially important when it comes to complex tasks like designing an API, where you first have to build an architecture while considering how it will be used and what kind of load it’ll put on your database.

“If I do the architectural work well, I can then do the bricklaying with a feeling that I’m super clear on what I’m doing,” he says. “I know exactly where I’m going.”

Reddington notes that mapping your work and the practice of blocking time, as mentioned above, often go hand in hand.

“When I block out chunks of time, I can figure out how I’m going to solve the problems I’m tackling appropriately,” he says.

However, he warns that you’re not always going to fix the things you’re trying to do in the allotted blocked time. But at least you can start mentally organizing.

Finding the optimal mix of challenge and skill is also important to achieve flow. If something is too easy, you’ll be bored and unsatisfied. If it’s too challenging on the other hand, you’ll be stressed about not not getting it done, which will also keep flow elusive.

“A good mix can make all the difference,” Reddington says.

Tip #3: Find joy in the work you’re doing

You won’t be able to hit flow state if you’re not enjoying yourself.

“It’s only when you’re not worrying about meetings, or your email, or what you’re going to have for dinner, that you can hit the flow state,” Carter says.

It’s a similar experience to being entertained.

“It’s like when you’re reading a book and you just have to finish the next chapter or you’re binging Netflix and you need to see the next episode,” he says. “It’s that same energy.”

Enjoyable work pertains to teams, too.

Carter notes that office work enjoyment can be increased by clearly articulating the outcomes you’re trying to accomplish. When a product manager writes a well-articulated issue that clarifies the end result, there’s a higher likelihood that the team will be more motivated to take that work on and do it quickly.

“They’re not focused on the complexity anymore but on the desire to get there,” he says.

Similarly, if you’re involved in a project you don’t enjoy, it can be useful to rethink why you’re doing that work in the first place.

“I find that if I can recreate the mindset of why we should solve the problem, I can bootstrap curiosity and get back into the flow state,” he says.

The bottom line

Achieving flow state can significantly enhance norepinephrine, dopamine, anandamide, serotonin, and endorphins—increasing feelings of motivation and intrinsic reward, as well as pattern recognition and lateral thinking ability. It’s a win for productivity, well-being, and keeping the intrinsic developer fire strong.

“With flow state, you’re never at a point where you’re performing the same mechanics twice,” Carter says. “You’re learning in response to what you’re doing. You’re naturally interested, building up an unconscious muscle of curiosity. The learning potential is endless.”

To learn more about how businesses are incorporating flow state into their processes, read Developer experience: What is it and why should you care? and explore how GitHub can help.

The post How to get in the flow while coding (and why it’s important) appeared first on The GitHub Blog.

Using Apache Kafka to process 1 trillion messages

Post Syndicated from Matt Boyle original https://blog.cloudflare.com/using-apache-kafka-to-process-1-trillion-messages/

Using Apache Kafka to process 1 trillion messages

Using Apache Kafka to process 1 trillion messages

Cloudflare has been using Kafka in production since 2014. We have come a long way since then, and currently run 14 distinct Kafka clusters, across multiple data centers, with roughly 330 nodes. Between them, over a trillion messages have been processed over the last eight years.

Cloudflare uses Kafka to decouple microservices and communicate the creation, change or deletion of various resources via a common data format in a fault-tolerant manner. This decoupling is one of many factors that enables Cloudflare engineering teams to work on multiple features and products concurrently.

We learnt a lot about Kafka on the way to one trillion messages, and built some interesting internal tools to ease adoption that will be explored in this blog post. The focus in this blog post is on inter-application communication use cases alone and not logging (we have other Kafka clusters that power the dashboards where customers view statistics that handle more than one trillion messages each day). I am an engineer on the Application Services team and our team has a charter to provide tools/services to product teams, so they can focus on their core competency which is delivering value to our customers.

In this blog I’d like to recount some of our experiences in the hope that it helps other engineering teams who are on a similar journey of adopting Kafka widely.

Tooling

One of our Kafka clusters is creatively named Messagebus. It is the most general purpose cluster we run, and was created to:

  • Prevent data silos;
  • Enable services to communicate more clearly with basically zero integration cost (more on how we achieved this below);
  • Encourage the use of a self-documenting communication format and therefore removing the problem of out of date documentation.

To make it as easy to use as possible and to encourage adoption, the Application Services team created two internal projects. The first is unimaginatively named Messagebus-Client. Messagebus-Client is a Go library that wraps the fantastic Shopify Sarama library with an opinionated set of configuration options and the ability to manage the rotation of mTLS certificates.

Using Apache Kafka to process 1 trillion messages

The success of this project is also somewhat its downfall. By providing a ready-to-go Kafka client, we ensured teams got up and running quickly, but we also abstracted some core concepts of Kafka a little too much, meaning that small unassuming configuration changes could have a big impact.

One such example led to partition skew (a large portion of messages being directed towards a single partition, meaning we were not processing messages in real time; see the chart below). One drawback of Kafka is you can only have one consumer per partition, so when incidents do occur, you can’t trivially scale your way to faster throughput.

That also means before your service hits production it is wise to do some back of the napkin math to figure out what throughput might look like, otherwise you will need to add partitions later. We have since amended our library to make events like the below less likely.

Using Apache Kafka to process 1 trillion messages

The reception for the Messagebus-Client has been largely positive. We spent time as a team to understand what the predominant use cases were, and took the concept one step further to build out what we call the connector framework.

Connectors

The connector framework is based on Kafka-connectors and allows our engineers to easily spin up a service that can read from a system of record and push it somewhere else (such as Kafka, or even Cloudflare’s own Quicksilver). To make this as easy as possible, we use Cookiecutter templating to allow engineers to enter a few parameters into a CLI and in return receive a ready to deploy service.

Using Apache Kafka to process 1 trillion messages

We provide the ability to configure data pipelines via environment variables. For simple use cases, we provide the functionality out of the box. However, extending the readers, writers and transformations is as simple as satisfying an interface and “registering” the new entry.

For example, adding the environment variables:

READER=kafka
TRANSFORMATIONS=topic_router:topic1,topic2|pf_edge
WRITER=quicksilver

will:

  • Read messages from Kafka topic “topic1” and “topic2”;
  • Transform the message using a transformation function called “pf_edge” which maps the request from a Kafka protobuf to a Quicksilver request;
  • Write the result to Quicksilver.

Connectors come readily baked with basic metrics and alerts, so teams know they can move to production quickly but with confidence.

Below is a diagram of how one team used our connector framework to read from the Messagebus cluster and write to various other systems. This is orchestrated by a system the Application Service team runs called Communication Preferences Service (CPS). Whenever a user opts in/out of marketing emails or changes their language preferences on cloudflare.com, they are calling CPS which ensures those settings are reflected in all the relevant systems.

Using Apache Kafka to process 1 trillion messages

Strict Schemas

Alongside the Messagebus-Client library, we also provide a repo called Messagebus Schema. This is a schema registry for all message types that will be sent over our Messagebus cluster. For message format, we use protobuf and have been very happy with that decision. Previously, our team had used JSON for some of our kafka schemas, but we found it much harder to enforce forward and backwards compatibility, as well as message sizes being substantially larger than the protobuf equivalent. Protobuf provides strict message schemas (including type safety), the forward and backwards compatibility we desired, the ability to generate code in multiple languages as well as the files being very human-readable.

We encourage heavy commentary before approving a merge. Once merged, we use prototool to do breaking change detection, enforce some stylistic rules and to generate code for various languages (at time of writing it’s just Go and Rust, but it is trivial to add more).

Using Apache Kafka to process 1 trillion messages
An example Protobuf message in our schema

Furthermore, in Messagebus Schema we store a mapping of proto messages to a team, alongside that team’s chat room in our internal communication tool. This allows us to escalate issues to the correct team easily when necessary.

One important decision we made for the Messagebus cluster is to only allow one proto message per topic. This is configured in Messagebus Schema and enforced by the Messagebus-Client. This was a good decision to enable easy adoption, but it has led to numerous topics existing. When you consider that for each topic we create, we add numerous partitions and replicate them with a replication factor of at least three for resilience, there is a lot of potential to optimize compute for our lower throughput topics.

Observability

Making it easy for teams to observe Kafka is essential for our decoupled engineering model to be successful. We therefore have automated metrics and alert creation wherever we can to ensure that all the engineering teams have a wealth of information available to them to respond to any issues that arise in a timely manner.

We use Salt to manage our infrastructure configuration and follow a Gitops style model, where our repo holds the source of truth for the state of our infrastructure. To add a new Kafka topic, our engineers make a pull request into this repo and add a couple of lines of YAML. Upon merge, the topic and an alert for high lag (where lag is defined as the difference in time between the last committed offset being read and the last produced offset being produced) will be created. Other alerts can (and should) be created, but this is left to the discretion of application teams. The reason we automatically generate alerts for high lag is that this simple alert is a great proxy for catching a high amount of issues including:

  • Your consumer isn’t running.
  • Your consumer cannot keep up with the amount of throughput or there is an anomalous amount of messages being produced to your topic at this time.
  • Your consumer is misbehaving and not acknowledging messages.

For metrics, we use Prometheus and display them with Grafana. For each new topic created, we automatically provide a view into production rate, consumption rate and partition skew by producer/consumer. If an engineering team is called out, within the alert message is a link to this Grafana view.

Using Apache Kafka to process 1 trillion messages

In our Messagebus-Client, we expose some metrics automatically and users get the ability to extend them further. The metrics we expose by default are:

For producers:

  • Messages successfully delivered.
  • Message failed to deliver.

For consumer:

  • Messages successfully consumed.
  • Message consumption errors.

Some teams use these for alerting on a significant change in throughput, others use them to alert if no messages are produced/consumed in a given time frame.

A Practical Example

As well as providing the Messagebus framework, the Application Services team looks for common concerns within Engineering and looks to solve them in a scalable, extensible way which means other engineering teams can utilize the system and not have to build their own (thus meaning we are not building lots of disparate systems that are only slightly different).

One example is the Alert Notification System (ANS). ANS is the backend service for the “Notifications” tab in the Cloudflare dashboard. You may have noticed over the past 12 months that new alert and policy types have been made available to customers very regularly. This is because we have made it very easy for other teams to do this. The approach is:

  • Create a new entry into ANS’s configuration YAML (We use CUE lang to validate the configuration as part of our continuous integration process);
  • Import our Messagebus-Client into your code base;
  • Emit a message to our alert topic when an event of interest takes place.

That’s it! The producer team now has a means for customers to configure granular alerting policies for their new alert that includes being able to dispatch them via Slack, Google Chat or a custom webhook, PagerDuty or email (by both API and dashboard). Retrying and dead letter messages are managed for them, and a whole host of metrics are made available, all by making some very small changes.

Using Apache Kafka to process 1 trillion messages

What’s Next?

Usage of Kafka (and our Messagebus tools) is only going to increase at Cloudflare as we continue to grow, and as a team we are committed to making the tooling around Messagebus easy to use, customizable where necessary and (perhaps most importantly) easy to observe. We regularly take feedback from other engineers to help improve the Messagebus-Client (we are on the fifth version now) and are currently experimenting with abstracting the intricacies of Kafka away completely and allowing teams to use gRPC to stream messages to Kafka. Blog post on the success/failure of this to follow!

If you’re interested in building scalable services and solving interesting technical problems, we are hiring engineers on our team in Austin, and Remote US.

How we automated FAQ responses at Grab

Post Syndicated from Grab Tech original https://engineering.grab.com/automated-faq

Overview and initial analysis

Knowledge management is often one of the biggest challenges most companies face internally. Teams spend several working hours trying to either inefficiently look for information or constantly asking colleagues about information already documented somewhere. A lot of time is spent on the internal employee communication channels (in our case, Slack) simply trying to figure out answers to repetitive questions. On our journey to automate the responses to these repetitive questions, we needed first to figure out exactly how much time and effort is spent by on-call engineers answering such repetitive questions.

We soon identified that many of the internal engineering tools’ on-call activities involve answering users’ (internal users) questions on various Slack channels. Many of these questions have already been asked or documented on the wiki. These inquiries hinder on-call engineers’ productivity and affect their ability to focus on operational tasks. Once we figured out that on-call employees spend a lot of time answering Slack queries, we decided on a journey to determine the top questions.

We considered smaller groups of teams for this study and found out that:

  • The topmost user queries are “How do I do ABC?” or “Is XYZ broken?”.
  • The second most commonly asked questions revolve around access requests, approvals, or other permissions. The answer to such questions is often URLs to existing documentation.

These findings informed us that we didn’t just need an artificial intelligence (AI) based autoresponder to repetitive questions. We must, in fact, also leverage these channels’ chat histories to identify patterns.

Gathering user votes for shortlisted vendors

In light of saving costs and time and considering the quality of existing solutions already available in the market, we decided not to reinvent the wheel and instead purchase an existing product. And to figure out which product to purchase, we needed to do a comparative analysis. And thus began our vendor comparison journey!

While comparing the feature sets offered by different vendors, we understood that our users need to play a part in this decision-making process. However, sharing our vendor analysis with our users and allowing them to choose the bot of their choice posed several challenges:

  • Users could be biased towards known bots (from previous experiences).
  • Users could be biased towards big brands with a preconceived notion that big brands mean better features and better user support.
  • Users may likely pick the most expensive vendor, assuming that a higher cost means higher efficiency.

To ensure that we receive unbiased feedback, here’s how we opened users up to voting. We highlighted the top features of each vendor’s bot compared to other shortlisted bots. We hid the names of the bots to avoid brand attraction. At a high level, here’s what the categorisation looked like:

Features Vendor 1 (name  hidden) Vendor 2 (name  hidden) Vendor 3 (name  hidden)
Enables crowdsourcing, everyone is incentivised to participate.
Participants/SME names are visible.
Everyone can access the web UI and see how the responses configured on the bot.
Lowers discussions on channels by providing easy ways to raise tickets to the team instead of discussing on Slack.
Only a specific set of admins (or oncall engineers) feed and maintain the bot thus ensuring information authenticity and reliability.
Easy bot feeding mechanism/web UI to update FAQs.
Superior natural language processing capabilities.
Please vote Vendor 1 Vendor 2 Vendor 3

Although none of the options had all the features our users wanted, about 60% chose Vendor 1 (OneBar). From this, we discovered the core features that our users needed while keeping them involved in the decision-making process.

Matching our requirements with available vendors’ feature sets

Although our users made their preferences clear, we still needed to ensure that the feature sets available in the market suited our internal requirements in terms of the setup and the features available in portals that we envisioned replacing. As part of our requirements gathering process, here are some of the critical conditions that became more and more prominent:

  • An ability to crowdsource Slack discussions/conclusions and save them directly from Slack (preferably with a single command).
  • An ability to auto-respond to Slack queries without calling the bot manually.
  • The bot must be able to respond to queries only on the preconfigured Slack channel (not a Slack-wide auto-responder that is already available).
  • Ability to auto-detect frequently asked questions on the channels would mean less work for platform engineers to feed the bot manually and periodically.
  • A trusted and secured data storage setup and a responsive customer support team.

Proof of concept

We considered several tools (including some of the tools used by our HR for auto-answering employee questions). We then decided to do a complete proof of concept (POC) with OneBar to check if it fulfils our internal requirements.

These were the phases in which we conducted the POC for the shortlisted vendor (OneBar):

Phase 1: Study the traffic, see what insights OneBar shows and what it could/should potentially show. Then think about how an ideal oncall or support should behave in such an environment. i.e. we could identify specific messages in history and describe what should’ve happened to each one of them.

Phase 2: Create required records in OneBar and configure it to match the desired behaviour as closely as possible.

Phase 3: Let the tool run for a couple of weeks and then evaluate how well it responds to questions, how often people search directly, how much information they add, etc. Onebar adds all these metrics in the app making it easier to monitor activity.

In addition to the Onebar POC, we investigated other solutions and did a thorough vendor comparison and analysis. After running the POC and investigating other vendors, we decided to use OneBar as its features best meet our needs.

Prioritising Slack channels

While we had multiple Slack channels that we’d love to have enabled the shortlisted bot on, our initial contract limited our use of the bot to only 20 channels. We could not use OneBar to auto-scan more than 20 Slack channels.

Users could still chat directly with the bot to get answers to FAQs based on what was fed to the bot’s knowledge base (KB). They could also access the web login, which displays its KB, other valuable features, and additional features for admins/experts.

Slack channels that we enabled the licensed features on were prioritised based on:

  • Most messages sent on the channel per month, i.e. most active channels.
  • Most members impacted, i.e. channels with a large member count.

To do this, we used Slack analytics reports and identified the channels that fit our prioritisation criteria.

Change is difficult but often essential

Once we’d onboarded the vendor, we began training and educating employees on using this new Knowledge Management system for all their FAQs. It was a challenge as change is always complex but essential for growth.

A series of tech talks and training conducted across the company and at more minor scales also helped guide users about the bot’s features and capabilities.

At the start, we suffered from a lack of data resulting in incorrect responses from the bot. But as the team became increasingly aware of the features and learned more about its capabilities, the bot’s number of KB items grew, resulting in a much more efficient experience. It took us around one quarter to feed the bot consistently to see accurate and frequent responses from it.

Crowdsourcing our internal glossary

With an increasing number of acronyms and company-specific words emerging each year, the number of acronyms and company-specific abbreviations that new joiners face is immense.

We solved this issue by using the bot’s channel-specific KB feature. We created a specific Slack channel dedicated to storing and retrieving definitions of acronyms and other words. This solution turned out to be a big hit with our users.

And who fed the bot with the terms and glossary items? Who better than our onboarding employees to train the bot to help other onboarders. A targeted campaign dedicated to feeding the bot excited many of our onboarders. They began to play around with the bot’s features and provide it with as many glossary items as possible, thus winning swags!

In a matter of weeks, the user base grew from a couple of hundred to around 3000. This effort was also called out in one of our company-wide All Hands meetings, a big win for our team!

Join us

Grab is the leading superapp platform in Southeast Asia, providing everyday services that matter to consumers. More than just a ride-hailing and food delivery app, Grab offers a wide range of on-demand services in the region, including mobility, food, package and grocery delivery services, mobile payments, and financial services across 428 cities in eight countries.

Powered by technology and driven by heart, our mission is to drive Southeast Asia forward by creating economic empowerment for everyone. If this mission speaks to you, join our team today!