All posts by Natasha Wissmann

What’s new with Notifications?

Post Syndicated from Natasha Wissmann original https://blog.cloudflare.com/whats-new-with-notifications/

What’s new with Notifications?

What’s new with Notifications?

Back in 2019, we blogged about our brand new Notification center as a centralized hub for configuring notifications on your account. Since then, we’ve talked a lot about new types of notifications you can set up, but not as much about updates to the notification platform itself. So what’s new with Notifications?

What’s new with Notifications?

Why we care about notifications

We know that notifications are incredibly important to our customers. Cloudflare sits in between your Internet property and the rest of the world. When something goes wrong, you want to know right away because it could have a huge impact on your end users. However, you don’t want to have to sit on the Cloudflare Dashboard all day, pressing refresh on analytics pages over and over just to make sure that you don’t miss anything important. This is where Notifications come in. Instead of requiring you to actively monitor your Internet properties, you want Cloudflare to be able to directly inform you when something might be going wrong.

Cloudflare has many different notification types to ensure that you don’t miss anything important. We have notifications to inform you that you’ve been DDoS’d, or that the Firewall is blocking more requests than normal, or that your origin is seeing high levels of 5xx errors, or even that your Workers script’s CPU usage is above average. We’re constantly adding new notifications, so make sure to check our Cloudflare Development Docs to see what’s new!

Emails are out, webhooks are in

So we have all of these super great notifications, but how do we actually inform you of an event? The classic answer is “we email you.” All of our customers have the ability to configure notifications to send to the email addresses of their choosing.

However, email isn’t always the optimal choice. What happens when an email gets sent to spam, or filtered out into another folder that you rarely check? What if you’re a person who never cleans out their inbox and has four thousand unread emails that can drown out new important emails that come in? You want a way for notifications to go directly to the messaging platform that you check the most, whether that’s Slack or Microsoft Teams or Discord or something else entirely. For customers on our Professional, Business, and Enterprise plans, this is where webhooks come in.

Webhooks are incredibly powerful! They’re a type of API with a simple, standardized behavior. They allow one service (Cloudflare) to send events directly to another service. This destination service can be nearly anything: messaging platforms, data management systems, workflow automation systems, or even your own internal APIs.

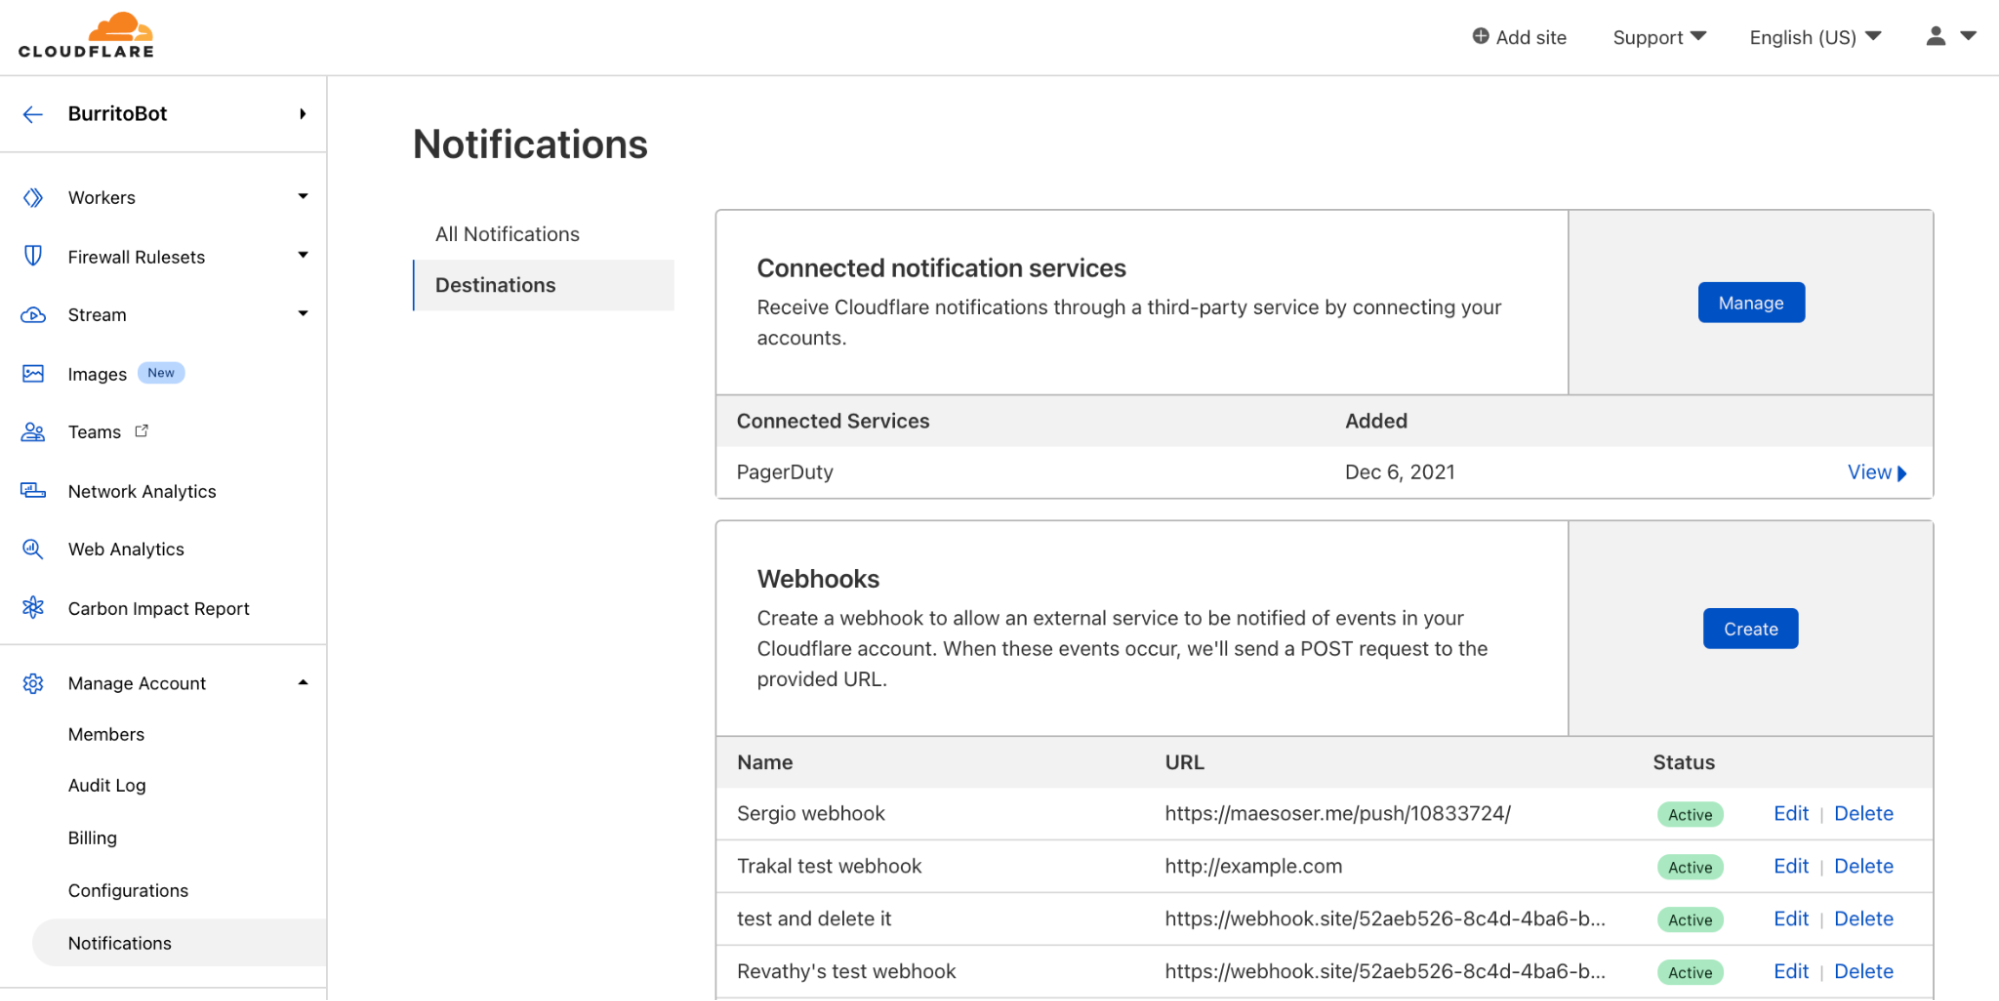
While Cloudflare has had first class support for webhooking into Slack, Microsoft Teams, Google Chat, and customer’s own APIs for a while, we’ve recently added support for DataDog, Discord, OpsGenie, and Splunk as well. You can read about how to set up each of those types of webhooks in our Cloudflare Development Docs.

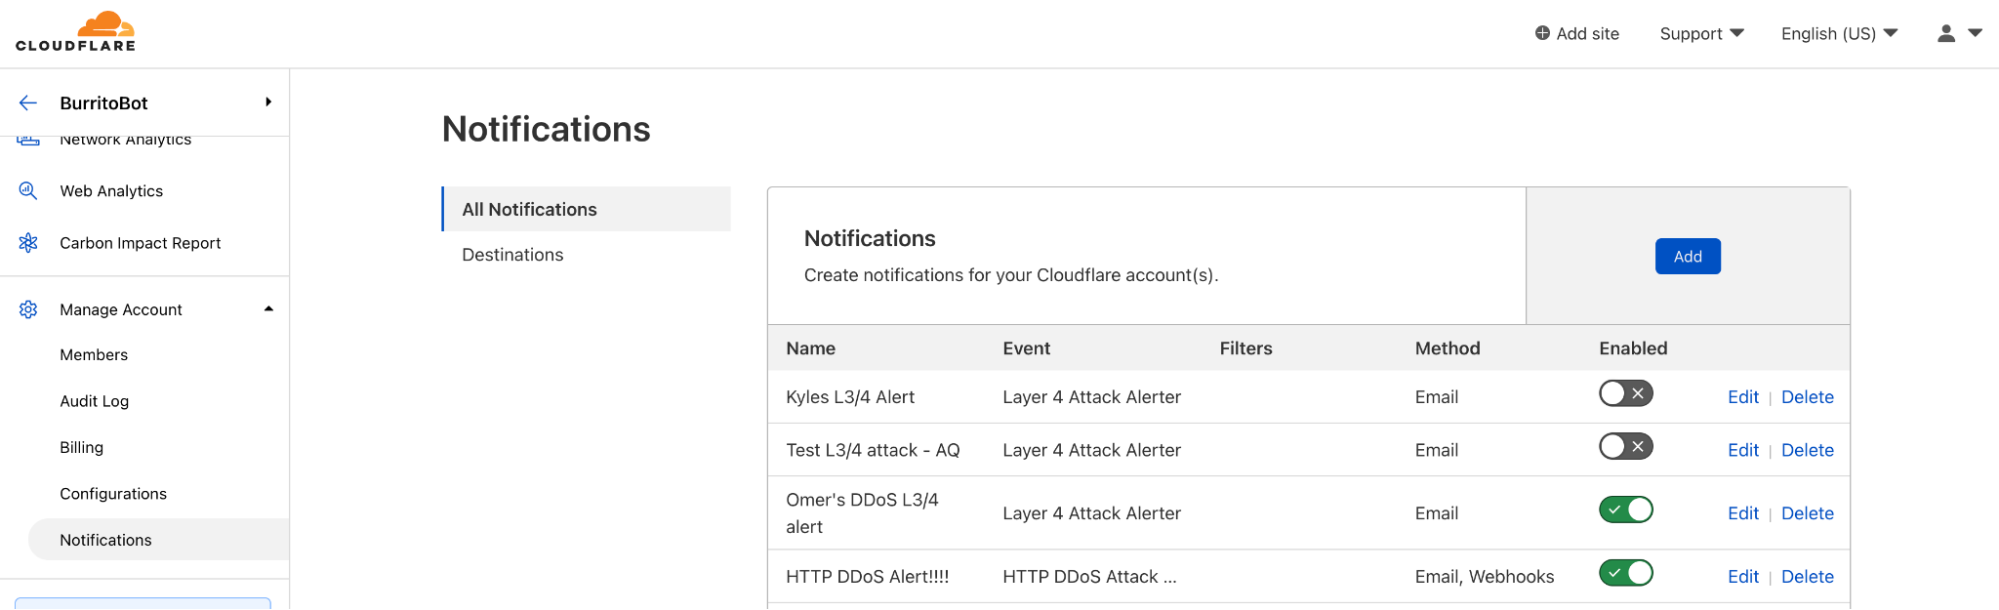
Because webhooks are so versatile, more and more customers are using them! The number of webhooks configured within Cloudflare’s notification system doubles, on average, every three months. Customers can configure webhooks in the Notifications tab in the dashboard.

What’s new with Notifications?

Those who forget history are doomed to repeat it

Webhooks are cool, but they still leave room for error. What happens when you receive a notification but accidentally delete it? Or when someone new starts at your company, but you forget to update the notification settings to send to the new employee?

Before now, Cloudflare notifications were entirely point in time. We sent you a notification via your preferred method, and we no longer had any visibility into that notification. If that notification gets lost on your end, we don’t have any way to help recover the information it contained.

Notification history fixes that exact issue. Users are able to see a log of the notifications that were sent, when they were sent, and who they were sent to. Customers on Free, Professional, or Business plans are able to see notification history for the past 30 days. Customers on Enterprise plans are able to see notification history for the past 90 days.

What’s new with Notifications?

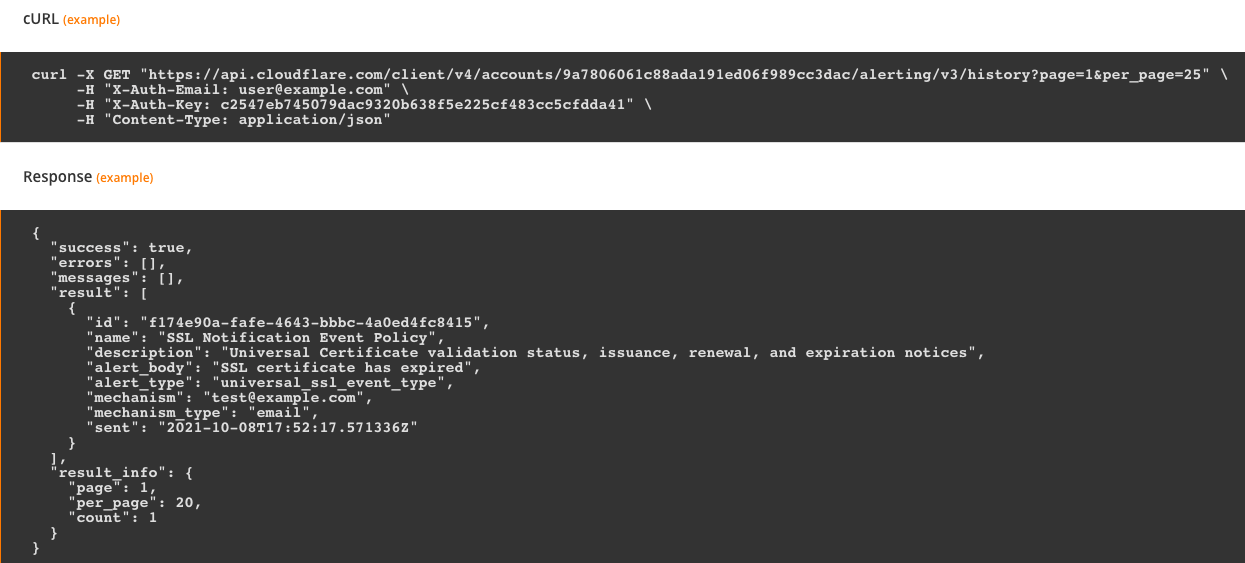
Right now, notification history is only available via API, but stay tuned for updates about viewing directly in the Cloudflare Dashboard!

Understand and reduce your carbon impact with Cloudflare

Post Syndicated from Natasha Wissmann original https://blog.cloudflare.com/understand-and-reduce-your-carbon-impact-with-cloudflare/

Understand and reduce your carbon impact with Cloudflare

Understand and reduce your carbon impact with Cloudflare

Today, as part of Cloudflare’s Impact Week, we’re excited to announce a new tool to help you understand the environmental impact of operating your websites, applications, and networks. Your Carbon Impact Report, available today for all Cloudflare accounts, will outline the carbon savings of operating your Internet properties on Cloudflare’s network.

Everyone has a role to play in reducing carbon impact and reversing climate change. We shared today how we’re approaching this, by committing to power our network with 100% renewable energy. But we’ve also heard from customers that want more visibility into the impact of the tools they use (also referred to as “Scope 3” emissions) — and we want to help!

The impact of running an Internet property

We’ve previously blogged about how Internet infrastructure affects the environment. At a high level, powering hardware (like servers) uses energy. Depending on its source, producing this energy may involve emitting carbon into the atmosphere, which contributes to climate change.

When you use Cloudflare, we use energy to power hardware to deliver content for you. But how does that energy we use compare to the energy it would take to deliver content without Cloudflare? As of today, you can go to the Cloudflare dashboard to see the (approximate) carbon savings from your usage of Cloudflare services versus Internet averages for your usage volume.

Understand and reduce your carbon impact with Cloudflare

Calculating the carbon savings of your Cloudflare use

Most of the energy that Cloudflare uses comes from powering the servers at our edge to serve your content. We’ve outlined how we quantify the carbon impact of this energy in our emissions report. To determine the percentage of this impact derived from your Cloudflare usage specifically, we’ve used the following method:

When you use Cloudflare, data from requests destined to your Internet property goes through our edge. Data transfer for your Internet properties roughly represents a fraction of the energy consumed at Cloudflare’s edge. If we sum up the data transfer for your Internet properties and multiply that number by the energy it takes to power each request (derived from our emissions report and overall usage data), we can approximate the total carbon impact of powering your Internet properties with Cloudflare.

We already knew that delivering content takes some energy and therefore has some carbon impact. So how much energy does Cloudflare actually save you? To determine what your usage would look like without Cloudflare, we’ve used the following method:

Using public information on average data center energy usage and the International Energy Agency’s global average emissions for energy usage, we can calculate the carbon cost of data transfer through average (non-Cloudflare) networks. We can then compare these numbers to arrive at your carbon savings from using Cloudflare.

With our new Carbon Impact Report, available for all plans/users, we’ve given you this value for your account. It represents the carbon dioxide equivalent (CO2e) that you’ve saved as a result of using Cloudflare to serve requests to your Internet properties in 2020.

This raw number is great, but it isn’t the easiest to understand. What does a gram of carbon dioxide equivalent actually mean in practice? It’s not a unit of measurement most of us are used to seeing in our day-to-day lives. To make this number a little easier to digest, we’ve also provided a comparison to light bulbs.

Standard light bulbs are 60 watts, so we know that turning on a light bulb for an hour uses 0.06 kilowatt-hours of energy. According to the EPA, that’s about 42 grams of carbon dioxide equivalent. That means that if your carbon dioxide equivalent saving is 126 grams, that’s approximately the same impact as turning off a light bulb for three hours.

How does using Cloudflare impact the environment?

As explained in more detail here, Cloudflare purchases Renewable Energy Credits to account for the energy used by our network. This means that your use of Cloudflare’s services is powered by renewable energy.

Additionally, using Cloudflare helps you reduce your overall carbon footprint. Using Cloudflare’s cloud security and performance services such as WAF, Network Firewall, and DDoS mitigation allow you to decommission specialized hardware and transfer those functions to software running efficiently at our edge. This reduces your carbon footprint by significantly decreasing the energy used to operate your network stack, and improves your security, performance, and reliability along the way.

Optimizing your website also reduces your carbon footprint by requiring less energy for your end users to load a page. Using Cloudflare’s Image Resizing for visual content on your site to properly resize images reduces the energy it takes each of your end users to load a page, thus reducing downstream carbon emissions.

Lastly, since Cloudflare is a certified green host, any content you host on Pages or Workers KV is hosted green and certified powered by renewable energy.

What’s next

This dashboard is just a first step in giving our customers transparent information on their carbon use, savings, and ideas for improvement with Cloudflare. Right now, you can view data on your carbon savings from 2020 (aligned with our 2020 emissions report). As we continue to iterate on how we measure carbon impact, we’re working toward providing dynamic information on carbon savings at a quarterly or even monthly granularity.

Have other ideas on what we can provide to help you understand and reduce the carbon impact of your Internet properties? Please reach out to us in the comments on this post or on social media!

We hope that this data helps you with your sustainability goals, and we’re excited to keep providing you with transparent information for 2021 and beyond.

Smart(er) Origin Service Level Monitoring

Post Syndicated from Natasha Wissmann original https://blog.cloudflare.com/smarter-origin-service-level-monitoring/

Smart(er) Origin Service Level Monitoring

Smart(er) Origin Service Level Monitoring

Today we’re excited to announce Origin Error Rate notifications: a new, sophisticated way to detect and notify you when Cloudflare sees elevated levels of 5xx errors from your origin.

In 2019, we announced Passive Origin Monitoring alerts to notify you when your origin goes down. Passive Origin Monitoring is great — it tells you if every request to your origin is returning a 521 error (web server down) for a full five minutes. But sometimes that’s not enough. You don’t want to wait for all of your users to have issues; you want to be notified when more users than normal are having issues before it becomes a big problem.

Calculating Anomalies

No service is perfect — we know that a very small percentage of your origin responses are likely to be 5xx errors. Most of the time, these issues are one-offs and nothing actually needs to be done. However, for Internet properties with very high traffic, even a very small percentage could potentially be a large number. If we alerted you for every one of these errors, you would never stop getting useless notifications. When it comes to notifying, the question isn’t whether there are any errors, but how many errors need to exist before it’s a problem.

So how do we actually tell if something is a problem? As humans, it’s relatively easy for us to look at a graph, identify a spike, and think “hmm, that’s not supposed to be there.” For a computer it gets a little more complicated. Unlike humans, who have intuition and can exercise judgement in grey areas, a computer needs an exact set of criteria to tell whether something is out of the ordinary.

The simplest way to detect abnormalities in a time series dataset is to set a single threshold — for example, “notify me whenever more than 5% of the requests to my Internet properties result in errors.” Unfortunately, it’s really hard to pick an effective threshold. Too high and you never actually get notified; too low, and you’re drowning in notifications:

Smart(er) Origin Service Level Monitoring

Even when we find that happy medium, we can still miss issues that burn “low and slow”. This is where there’s no obvious, dramatic spike, but something has been going a little wrong for a long time:

Smart(er) Origin Service Level Monitoring

We can try layering on multiple thresholds. For example: notify you if the error rate is ever over 10%, or if it’s over 5% for more than five minutes, or if it’s over 2% for more than 10 minutes. Not only does this quickly become complicated, but it also doesn’t account for periodic issues, such as kubernetes pods restarting or deployments going out at a regular interval. What if the error rate is over 5% for only four minutes, but it happens every five minutes? We know that a lot of your end users are being affected, but even the long set of rules listed above wouldn’t catch it.

Smart(er) Origin Service Level Monitoring

So thresholds probably aren’t sophisticated enough to detect origin issues. Instead, we turn to the Google SRE Handbook for alerting based on Service Level Objectives (SLOs). An SLO is a part of an agreement between a customer and a service provider. It’s a defined metric and value that both parties agree on. One of the most common types of SLOs is availability, or “the service will be available for a certain percentage of the time”. In this case, the service is your origin and the agreement is between you and your end users. Your end users expect your origin to be available a certain percent of the time.

If we revisit our original concept, we know that you’re comfortable with your origin returning a certain number of errors. We define that number as your SLO. An SLO of 99.9 means that you’re OK with 0.01% of all of your requests over a month being errors. Therefore, 0.01% of all the requests that reach your origin is your total error budget — you can have this many errors in a month and never be notified, because you’ve defined that as acceptable.

What you really want to know is when you’re burning through that error budget too quickly — this probably means that something is actually going wrong (instead of a one-time occurrence). We can measure a burn rate to gauge how quickly you’re burning through your error budget, given the rate of errors that we’re currently seeing. A burn rate of one means that the entirety of the error budget will be used up exactly within the set time period — an ideal scenario. A burn rate of zero is even better since we’re not seeing any errors at all, but ultimately is pretty unrealistic. A burn rate of 10 is most likely a problem — if that rate keeps up for the full month, you’ll have had 10x the number of errors than you originally said was acceptable.

Smart(er) Origin Service Level Monitoring

Even when using burn rates instead of thresholds, we still want to have multiple criteria. We want to measure a short time period with a high burn rate (a short indicator). This covers your need to “alert me quickly when something dramatic is happening.” But we also want to have a longer time period with a lower burn rate (a long indicator), in order to cover your need to “don’t alert me on issues that are over quickly.” This way we can ensure that we alert quickly without sending too many false positives.

Let’s take a look at the life of an incident using this methodology. In our first measurement, the short indicator tells us it looks like something is starting to go wrong. However, the long indicator is still within reasonable bounds. We’re not going to sound the alarm yet.

Smart(er) Origin Service Level Monitoring

When we measure next, we see that the problem is worse. Now we’re at the point where there are enough errors that not only is the short indicator telling us there’s something wrong, but the long indicator has been impacted too. We feel confident that there’s a problem, and it’s time to notify you.

Smart(er) Origin Service Level Monitoring

A couple cycles later, the incident is over. The long indicator is still telling us that something is wrong, because the incident is still within the long time period. However, the short indicator shows that nothing is currently concerning. Since we don’t have both indicators telling us that something is wrong, we won’t notify you. This keeps us from sending notifications for incidents that are already over.

Smart(er) Origin Service Level Monitoring

This methodology is cool because of how well it responds to different incidents. If the original spike had been more dramatic, it would have triggered both the long and short indicators immediately. The more errors we’re seeing, the more confident we are that there’s an issue and the sooner we can notify you.

Even with this methodology, we know that different services behave differently. So for this notification, you can choose the Service Level Objective (SLO) you want to use to monitor your Internet property: 99.9% (high sensitivity), 99.8% (medium sensitivity), or 99.7% (low sensitivity). You can also choose which Internet properties you want to monitor — no need to be notified for test properties or lower priority domains.

Getting started today

HTTP Origin Error Rate notifications can be configured in the Notifications tab of the dashboard. Select Origin Error Rate Alert as your alert type. As with all Cloudflare notifications, you’re able to name and describe your notification, and choose how you want to be notified. From there, you can select which domains you want to monitor, and at what SLO.

Smart(er) Origin Service Level Monitoring

This notification is available to all Enterprise customers. If you’re interested in monitoring your origin, we encourage you to give it a try.

Our team is hiring in Austin, Lisbon and London.