Post Syndicated from Dylan Souvage original https://aws.amazon.com/blogs/security/how-to-receive-alerts-when-your-iam-configuration-changes/
July 27, 2023: This post was originally published February 5, 2015, and received a major update July 31, 2023.
As an Amazon Web Services (AWS) administrator, it’s crucial for you to implement robust protective controls to maintain your security configuration. Employing a detective control mechanism to monitor changes to the configuration serves as an additional safeguard in case the primary protective controls fail. Although some changes are expected, you might want to review unexpected changes or changes made by a privileged user. AWS Identity and Access Management (IAM) is a service that primarily helps manage access to AWS services and resources securely. It does provide detailed logs of its activity, but it doesn’t inherently provide real-time alerts or notifications. Fortunately, you can use a combination of AWS CloudTrail, Amazon EventBridge, and Amazon Simple Notification Service (Amazon SNS) to alert you when changes are made to your IAM configuration. In this blog post, we walk you through how to set up EventBridge to initiate SNS notifications for IAM configuration changes. You can also have SNS push messages directly to ticketing or tracking services, such as Jira, Service Now, or your preferred method of receiving notifications, but that is not discussed here.
In any AWS environment, many activities can take place at every moment. CloudTrail records IAM activities, EventBridge filters and routes event data, and Amazon SNS provides notification functionality. This post will guide you through identifying and setting alerts for IAM changes, modifications in authentication and authorization configurations, and more. The power is in your hands to make sure you’re notified of the events you deem most critical to your environment. Here’s a quick overview of how you can invoke a response, shown in Figure 1.
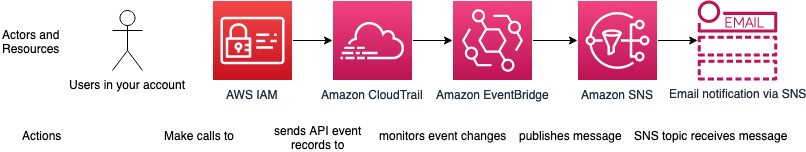
Figure 1: Simple architecture diagram of actors and resources in your account and the process for sending notifications through IAM, CloudTrail, EventBridge, and SNS.
Log IAM changes with CloudTrail
Before we dive into implementation, let’s briefly understand the function of AWS CloudTrail. It records and logs activity within your AWS environment, tracking actions such as IAM role creation, deletion, or modification, thereby offering an audit trail of changes.
With this in mind, we’ll discuss the first step in tracking IAM changes: establishing a log for each modification. In this section, we’ll guide you through using CloudTrail to create these pivotal logs.
For an in-depth understanding of CloudTrail, refer to the AWS CloudTrail User Guide.
In this post, you’re going to start by creating a CloudTrail trail with the Management events type selected, and read and write API activity selected. If you already have a CloudTrail trail set up with those attributes, you can use that CloudTrail trail instead.
To create a CloudTrail log
- Open the AWS Management Console and select CloudTrail, and then choose Dashboard.
- In the CloudTrail dashboard, choose Create Trail.

Figure 2: Use the CloudTrail dashboard to create a trail
- In the Trail name field, enter a display name for your trail and then select Create a new S3 bucket. Leave the default settings for the remaining trail attributes.
Figure 3: Set the trail name and storage location
- Under Event type, select Management events. Under API activity, select Read and Write.
- Choose Next.
Figure 4: Choose which events to log


Set up notifications with Amazon SNS
Amazon SNS is a managed service that provides message delivery from publishers to subscribers. It works by allowing publishers to communicate asynchronously with subscribers by sending messages to a topic, a logical access point, and a communication channel. Subscribers can receive these messages using supported endpoint types, including email, which you will use in the blog example today.
For further reading on Amazon SNS, refer to the Amazon SNS Developer Guide.
Now that you’ve set up CloudTrail to log IAM changes, the next step is to establish a mechanism to notify you about these changes in real time.
To set up notifications
- Open the Amazon SNS console and choose Topics.
- Create a new topic. Under Type, select Standard and enter a name for your topic. Keep the defaults for the rest of the options, and then choose Create topic.
Figure 5: Select Standard as the topic type
- Navigate to your topic in the topic dashboard, choose the Subscriptions tab, and then choose Create subscription.

Figure 6: Choose Create subscription
- For Topic ARN, select the topic you created previously, then under Protocol, select Email and enter the email address you want the alerts to be sent to.
Figure 7: Select the topic ARN and add an endpoint to send notifications to
- After your subscription is created, go to the mailbox you designated to receive notifications and check for a verification email from the service. Open the email and select Confirm subscription to verify the email address and complete setup.


Initiate events with EventBridge
Amazon EventBridge is a serverless service that uses events to connect application components. EventBridge receives an event (an indicator of a change in environment) and applies a rule to route the event to a target. Rules match events to targets based on either the structure of the event, called an event pattern, or on a schedule.
Events that come to EventBridge are associated with an event bus. Rules are tied to a single event bus, so they can only be applied to events on that event bus. Your account has a default event bus that receives events from AWS services, and you can create custom event buses to send or receive events from a different account or AWS Region.
For a more comprehensive understanding of EventBridge, refer to the Amazon EventBridge User Guide.
In this part of our post, you’ll use EventBridge to devise a rule for initiating SNS notifications based on IAM configuration changes.
To create an EventBridge rule
- Go to the EventBridge console and select EventBridge Rule, and then choose Create rule.
Figure 8: Use the EventBridge console to create a rule
- Enter a name for your rule, keep the defaults for the rest of rule details, and then choose Next.
Figure 9: Rule detail screen
- Under Target 1, select AWS service.
- In the dropdown list for Select a target, select SNS topic, select the topic you created previously, and then choose Next.
Figure 10: Target with target type of AWS service and target topic of SNS topic selected
- Under Event source, select AWS events or EventBridge partner events.

Figure 11: Event pattern with AWS events or EventBridge partner events selected
- Under Event pattern, verify that you have the following selected.
- For Event source, select AWS services.
- For AWS service, select IAM.
- For Event type, select AWS API Call via CloudTrail.
- Select the radio button for Any operation.
Figure 12: Event pattern details selected


Now that you’ve set up EventBridge to monitor IAM changes, test it by creating a new user or adding a new policy to an IAM role and see if you receive an email notification.
Centralize EventBridge alerts by using cross-account alerts
If you have multiple accounts, you should be evaluating using AWS Organizations. (For a deep dive into best practices for using AWS Organizations, we recommend reading this AWS blog post.)
By standardizing the implementation to channel alerts from across accounts to a primary AWS notification account, you can use a multi-account EventBridge architecture. This allows aggregation of notifications across your accounts through sender and receiver accounts. Figure 13 shows how this works. Separate member accounts within an AWS organizational unit (OU) have the same mechanism for monitoring changes and sending notifications as discussed earlier, but send notifications through an EventBridge instance in another account.
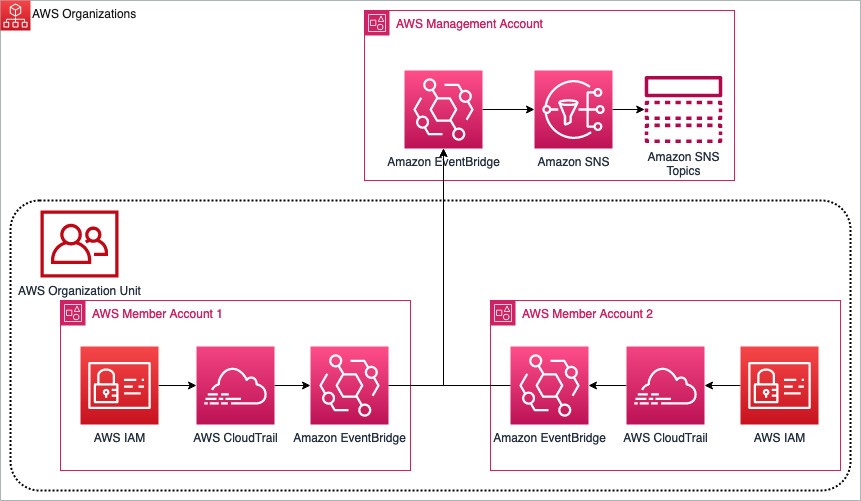
Figure 13: Multi-account EventBridge architecture aggregating notifications between two AWS member accounts to a primary management account
You can read more and see the implementation and deep dive of the multi-account EventBridge solution on the AWS samples GitHub, and you can also read more about sending and receiving Amazon EventBridge notifications between accounts.
Monitor calls to IAM
In this blog post example, you monitor calls to IAM.
The filter pattern you selected while setting up EventBridge matches CloudTrail events for calls to the IAM service. Calls to IAM have a CloudTrail eventSource of iam.amazonaws.com, so IAM API calls will match this pattern. You will find this simple default filter pattern useful if you have minimal IAM activity in your account or to test this example. However, as your account activity grows, you’ll likely receive more notifications than you need. This is when filtering only the relevant events becomes essential to prioritize your responses. Effectively managing your filter preferences allows you to focus on events of significance and maintain control as your AWS environment grows.
Monitor changes to IAM
If you’re interested only in changes to your IAM account, you can modify the event pattern inside EventBridge, the one you used to set up IAM notifications, with an eventName filter pattern, shown following.
This filter pattern will only match events from the IAM service that begin with Add, Change, Create, Deactivate, Delete, Enable, Put, Remove, Update, or Upload. For more information about APIs matching these patterns, see the IAM API Reference.
To edit the filter pattern to monitor only changes to IAM
- Open the EventBridge console, navigate to the Event pattern, and choose Edit pattern.
Figure 14: Modifying the event pattern
- Add the eventName filter pattern from above to your event pattern.
Figure 15: Use the JSON editor to add the eventName filter pattern


Monitor changes to authentication and authorization configuration
Monitoring changes to authentication (security credentials) and authorization (policy) configurations is critical, because it can alert you to potential security vulnerabilities or breaches. For instance, unauthorized changes to security credentials or policies could indicate malicious activity, such as an attempt to gain unauthorized access to your AWS resources. If you’re only interested in these types of changes, use the preceding steps to implement the following filter pattern.
This filter pattern matches calls to IAM that modify policy or create, update, upload, and delete IAM elements.
Conclusion
Monitoring IAM security configuration changes allows you another layer of defense against the unexpected. Balancing productivity and security, you might grant a user broad permissions in order to facilitate their work, such as exploring new AWS services. Although preventive measures are crucial, they can potentially restrict necessary actions. For example, a developer may need to modify an IAM role for their task, an alteration that could pose a security risk. This change, while essential for their work, may be undesirable from a security standpoint. Thus, it’s critical to have monitoring systems alongside preventive measures, allowing necessary actions while maintaining security.
Create an event rule for IAM events that are important to you and have a response plan ready. You can refer to Security best practices in IAM for further reading on this topic.
If you have questions or feedback about this or any other IAM topic, please visit the IAM re:Post forum. You can also read about the multi-account EventBridge solution on the AWS samples GitHub and learn more about sending and receiving Amazon EventBridge notifications between accounts.
If you have feedback about this post, submit comments in the Comments section below. If you have questions about this post, contact AWS Support.
Want more AWS Security news? Follow us on Twitter.