Headquartered in Shanghai, the China Pacific Insurance (Group) Co., Ltd. (CPI) is a Chinese insurance company that was established on the basis of the former China Pacific Insurance Corporation. CPI Group is the second largest property insurance company and the third largest life insurance company in Mainland China. It provides integrated insurance services (including life insurance, property insurance, and reinsurance) through its subsidiaries.
The challenge:
The overall data center operation structure of the company works along financial industry lines, with a two-site, three-center operation model. The total scale of China Pacific Insurance’s on-premises hosts is over 6,000, and the three centers add up to nearly 40,000 host devices in the production environment.
It’s an enormous amount of information to monitor, so any monitoring solution needs to significantly reduce the difficulty of overall alert analysis. The alert information provided by the mixture of cloud product components that CPI were using caused a serious case of alert fatigue for their operations and maintenance personnel, with some alerts taking as long as 4 months to process.
The solution:
The bank’s cloud platforms all had their own monitoring and alerting functions, but the configuration of value threshold and notification policies was not flexible enough. Zabbix’s ability to uniformly collect data while configuring triggers and alerting proved to be a game-changer.
In addition, when compared to cloud vendors whose solutions require adjustments to thresholds in each product component, Zabbix proved to be a much simpler and more cost-effective way to notify operators of only the most essential alerts.
The results:
In practice, CPI found that the Zabbix multi-index combined alert function eliminates 30% of invalid alerts. Thanks to this success, CPI now plans to transfer the Zabbix Data Transmission Service to their digital twin data center, so that the inspection of physical facilities and the impact analysis of the application system can be quickly displayed to their operations and maintenance personnel.
Conclusion
The team at China Pacific Insurance successfully built an intelligent operation and maintenance system covering a number of key modules such as automated operation and maintenance, intelligent monitoring, logging platforms, and container platforms – all with Zabbix at the core. They are currently exploring the cutting-edge integration of monitoring systems with LLMs, further advancing intelligent monitoring and observability solutions in the process.
To learn more about what Zabbix can do for customers in banking and finance, visit our website.
We launched the Cloudflare Radar Outage Center (CROC) during Birthday Week 2022 as a way of keeping the community up to date on Internet disruptions, including outages and shutdowns, visible in Cloudflare’s traffic data. While some of the entries have their genesis in information from social media posts made by local telecommunications providers or civil society organizations, others are based on an internal traffic anomaly detection and alerting tool. Today, we’re adding this alerting feed to Cloudflare Radar, showing country and network-level traffic anomalies on the CROC as they are detected, as well as making the feed available via API.
Building on this new functionality, as well as the route leaks and route hijacks insights that we recently launched on Cloudflare Radar, we are also launching new Radar notification functionality, enabling you to subscribe to notifications about traffic anomalies, confirmed Internet outages, route leaks, or route hijacks. Using the Cloudflare dashboard’s existing notification functionality, users can set up notifications for one or more countries or autonomous systems, and receive notifications when a relevant event occurs. Notifications may be sent via e-mail or webhooks — the available delivery methods vary according to plan level.
Traffic anomalies
Internet traffic generally follows a fairly regular pattern, with daily peaks and troughs at roughly the same volumes of traffic. However, while weekend traffic patterns may look similar to weekday ones, their traffic volumes are generally different. Similarly, holidays or national events can also cause traffic patterns and volumes to differ significantly from “normal”, as people shift their activities and spend more time offline, or as people turn to online sources for information about, or coverage of, the event. These traffic shifts can be newsworthy, and we have covered some of them in past Cloudflare blog posts (King Charles III coronation, Easter/Passover/Ramadan, Brazilian presidential elections).
However, as you also know from reading our blog posts and following Cloudflare Radar on social media, it is the more drastic drops in traffic that are a cause for concern. Some are the result of infrastructure damage from severe weather or a natural disaster like an earthquake and are effectively unavoidable, but getting timely insights into the impact of these events on Internet connectivity is valuable from a communications perspective. Other traffic drops have occurred when an authoritarian government orders mobile Internet connectivity to be shut down, or shuts down all Internet connectivity nationwide. Timely insights into these types of anomalous traffic drops are often critical from a human rights perspective, as Internet shutdowns are often used as a means of controlling communication with the outside world.
Over the last several months, the Cloudflare Radar team has been using an internal tool to identify traffic anomalies and post alerts for followup to a dedicated chat space. The companion blog post Gone Offline: Detecting Internet Outages goes into deeper technical detail about our traffic analysis and anomaly detection methodologies that power this internal tool.
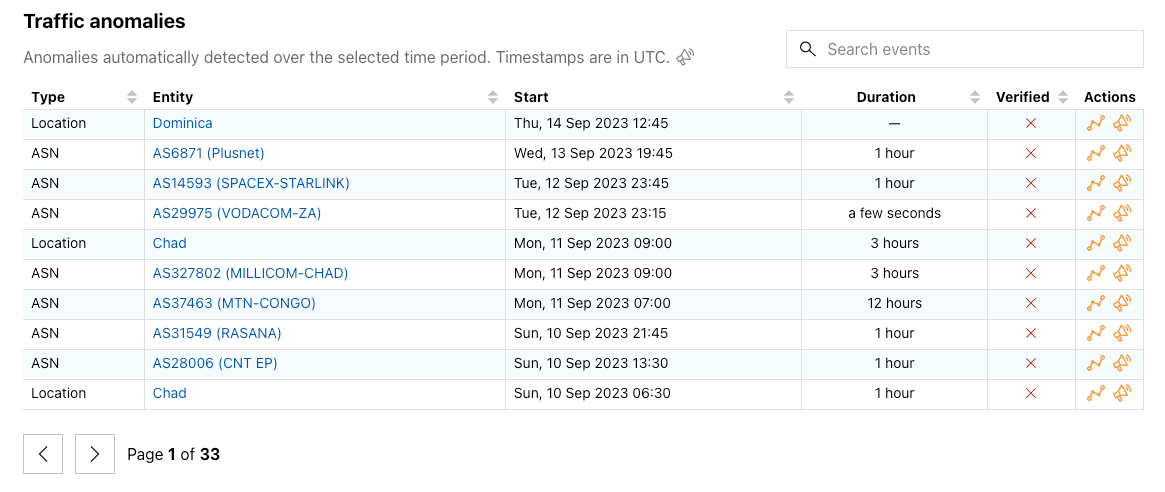
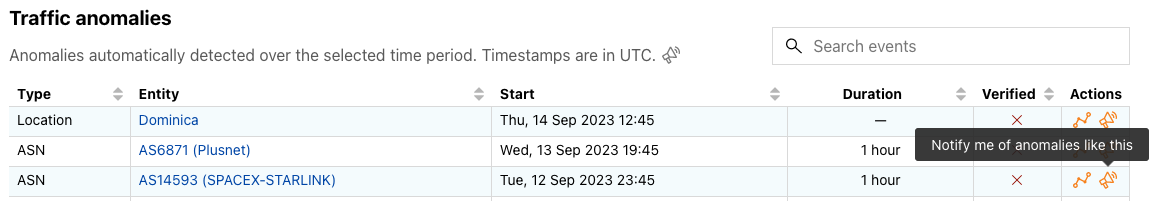
Many of these internal traffic anomaly alerts ultimately result in Outage Center entries and Cloudflare Radar social media posts. Today, we’re extending the Cloudflare Radar Outage Center and publishing information about these anomalies as we identify them. As shown in the figure below, the new Traffic anomalies table includes the type of anomaly (location or ASN), the entity where the anomaly was detected (country/region name or autonomous system), the start time, duration, verification status, and an “Actions” link, where the user can view the anomaly on the relevant entity traffic page or subscribe to a notification. (If manual review of a detected anomaly finds that it is present in multiple Cloudflare traffic datasets and/or is visible in third-party datasets, such as Georgia Tech’s IODA platform, we will mark it as verified. Unverified anomalies may be false positives, or related to Netflows collection issues, though we endeavor to minimize both.)
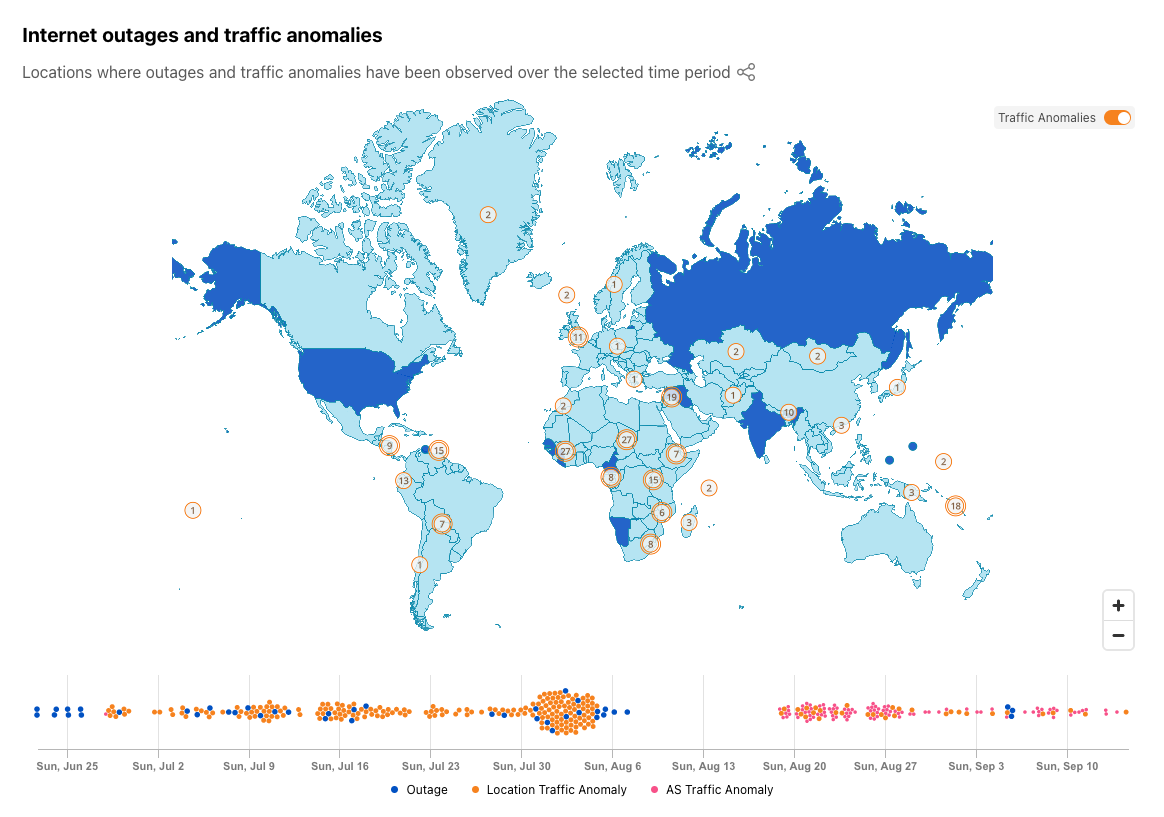
In addition to this new table, we have updated the Cloudflare Radar Outage Center map to highlight where we have detected anomalies, as well as placing them into a broader temporal context in a new timeline immediately below the map. Anomalies are represented as orange circles on the map, and can be hidden with the toggle in the upper right corner. Double-bordered circles represent an aggregation across multiple countries, and zooming in to that area will ultimately show the number of anomalies associated with each country that was included in the aggregation. Hovering over a specific dot in the timeline displays information about the outage or anomaly with which it is associated.
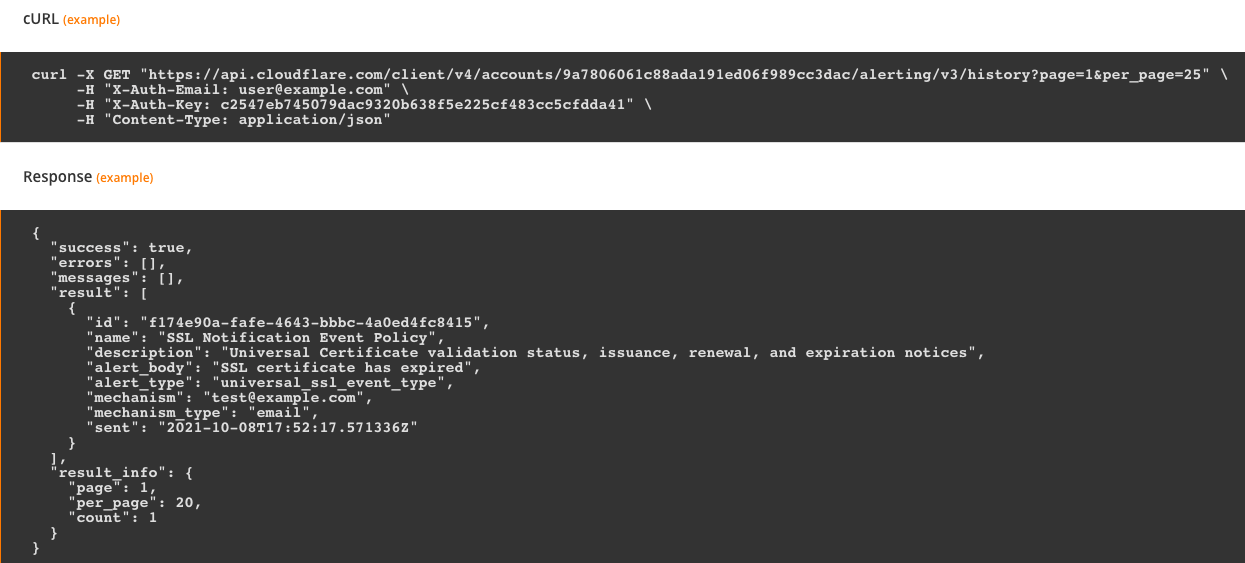
Internet outage information has been available via the Radar API since we launched the Outage Center and API in September 2022, and traffic anomalies are now available through a Radar API endpoint as well. An example traffic anomaly API request and response are shown below.
Timely knowledge about Internet “events”, such as drops in traffic or routing issues, are potentially of interest to multiple audiences. Customer service or help desk agents can use the information to help diagnose customer/user complaints about application performance or availability. Similarly, network administrators can use the information to better understand the state of the Internet outside their network. And civil society organizations can use the information to inform action plans aimed at maintaining communications and protecting human rights in areas of conflict or instability. With the new notifications functionality also being launched today, you can subscribe to be notified about observed traffic anomalies, confirmed Internet outages, route leaks, or route hijacks, at a country or autonomous system level. In the following sections, we discuss how to subscribe to and configure notifications, as well as the information contained within the various types of notifications.
Subscribing to notifications
Note that you need to log in to the Cloudflare dashboard to subscribe to and configure notifications. No purchase of Cloudflare services is necessary — just a verified email address is required to set up an account. While we would have preferred to not require a login, it enables us to take advantage of Cloudflare’s existing notifications engine, allowing us to avoid having to dedicate time and resources to building a separate one just for Radar. If you don’t already have a Cloudflare account, visit https://dash.cloudflare.com/sign-up to create one. Enter your username and a unique strong password, click “Sign Up”, and follow the instructions in the verification email to activate your account. (Once you’ve activated your account, we also suggest activating two-factor authentication (2FA) as an additional security measure.)
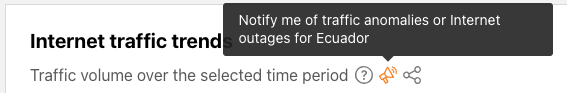
Once you have set up and activated your account, you are ready to start creating and configuring notifications. The first step is to look for the Notifications (bullhorn) icon – the presence of this icon means that notifications are available for that metric — in the Traffic, Routing, and Outage Center sections on Cloudflare Radar. If you are on a country or ASN-scoped traffic or routing page, the notification subscription will be scoped to that entity.
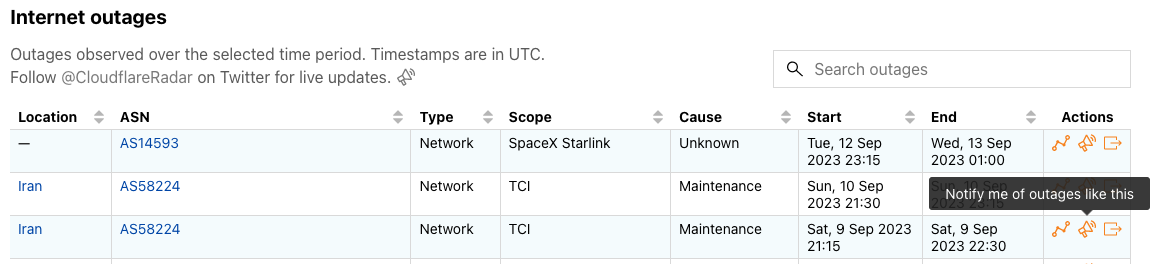
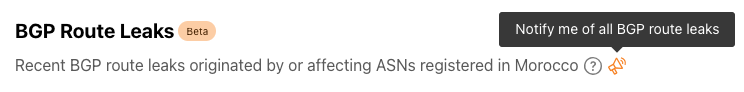
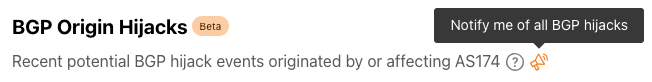
Look for this icon in the Traffic, Routing, and Outage Center sections of Cloudflare Radar to start setting up notifications.In the Outage Center, click the icon in the “Actions” column of an Internet outages table entry to subscribe to notifications for the related location and/or ASN(s). Click the icon alongside the table description to subscribe to notifications for all confirmed Internet outages.In the Outage Center, click the icon in the “Actions” column of a Traffic anomalies table entry to subscribe to notifications for the related entity. Click the icon alongside the table description to subscribe to notifications for all traffic anomalies.On country or ASN traffic pages, click the icon alongside the description of the traffic trends graph to subscribe to notifications for traffic anomalies or Internet outages impacting the selected country or ASN.On country or ASN routing pages, click the icon alongside the description to subscribe to notifications for route leaks or origin hijacks related to the selected country or ASN.Within the Route Leaks or Origin Hijacks tables on the routing pages, click the icon in a table entry to subscribe to notifications for route leaks or origin hijacks for referenced countries and/or ASNs.
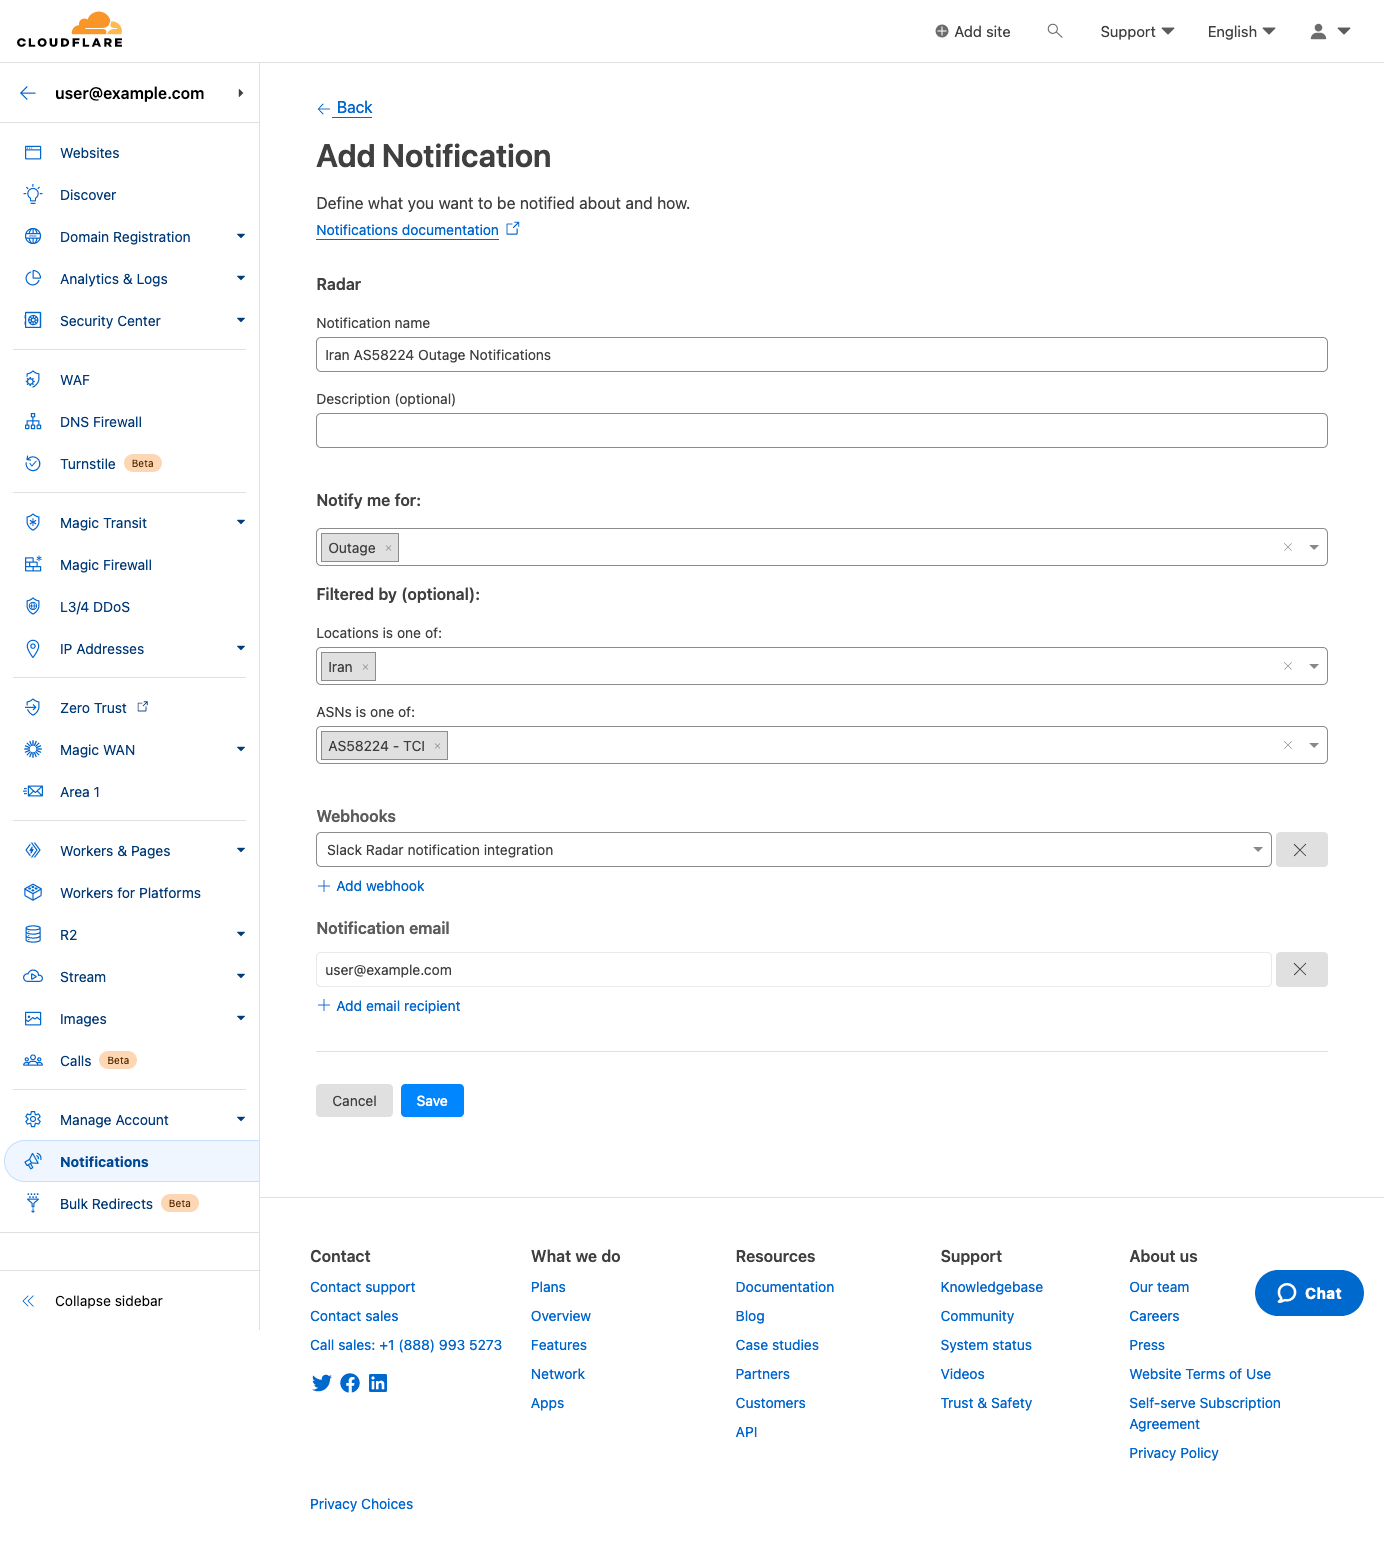
After clicking a notification icon, you’ll be taken to the Cloudflare login screen. Enter your username and password (and 2FA code if required), and once logged in, you’ll see the Add Notification page, pre-filled with the key information passed through from the referring page on Radar, including relevant locations and/or ASNs. (If you are already logged in to Cloudflare, then you’ll be taken directly to the Add Notification page after clicking a notification icon on Radar.) On this page, you can name the notification, add an optional description, and adjust the location and ASN filters as necessary. Enter an email address for notifications to be sent to, or select an established webhook destination (if you have webhooks enabled on your account).
Click “Save”, and the notification is added to the Notifications Overview page for the account.
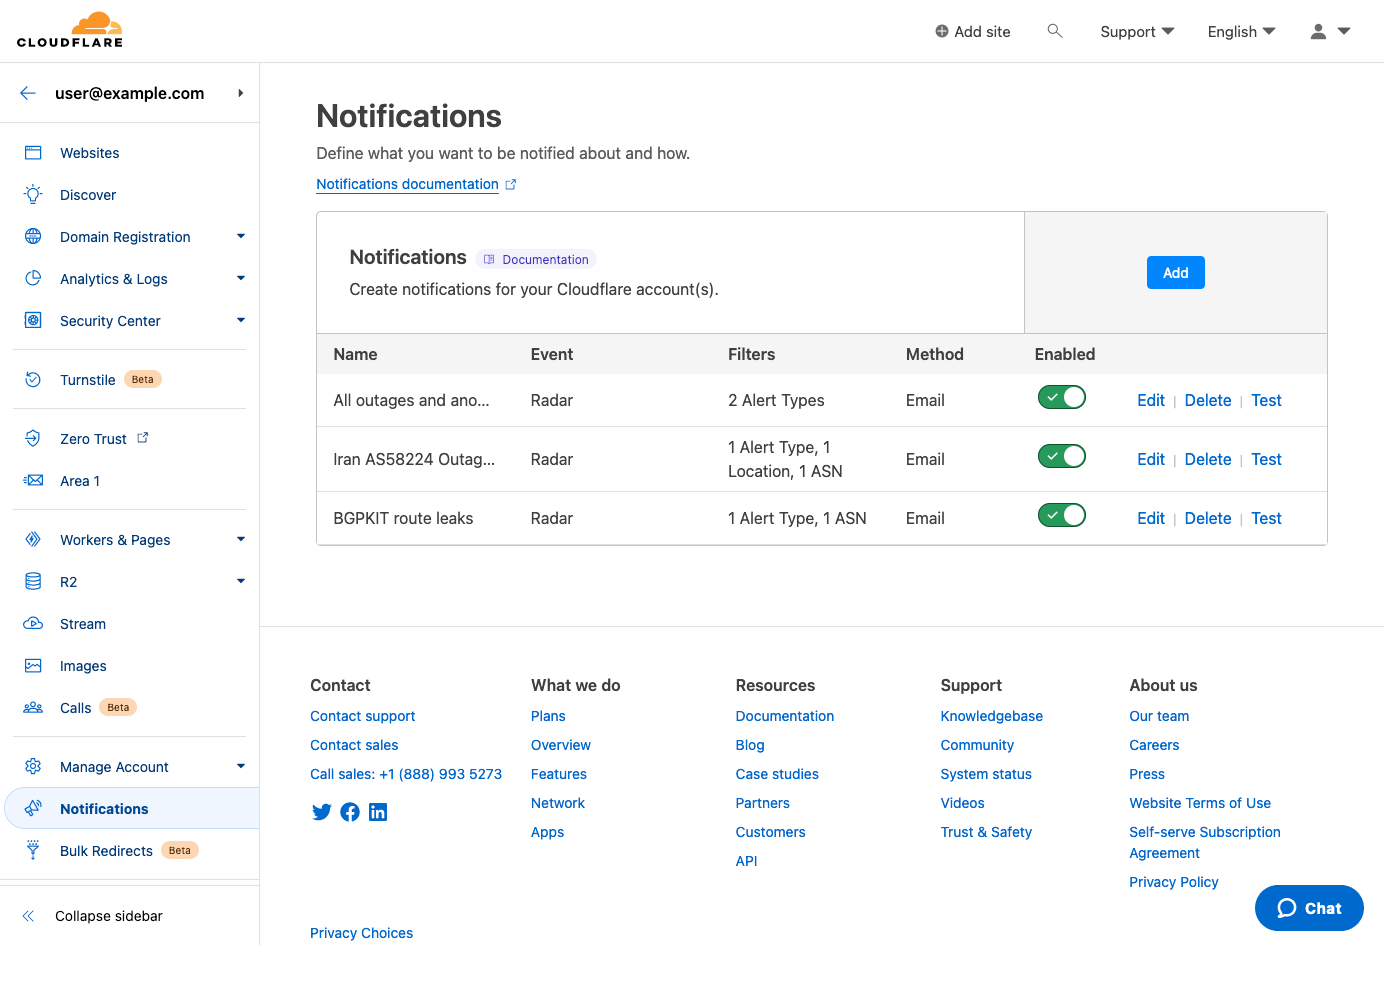
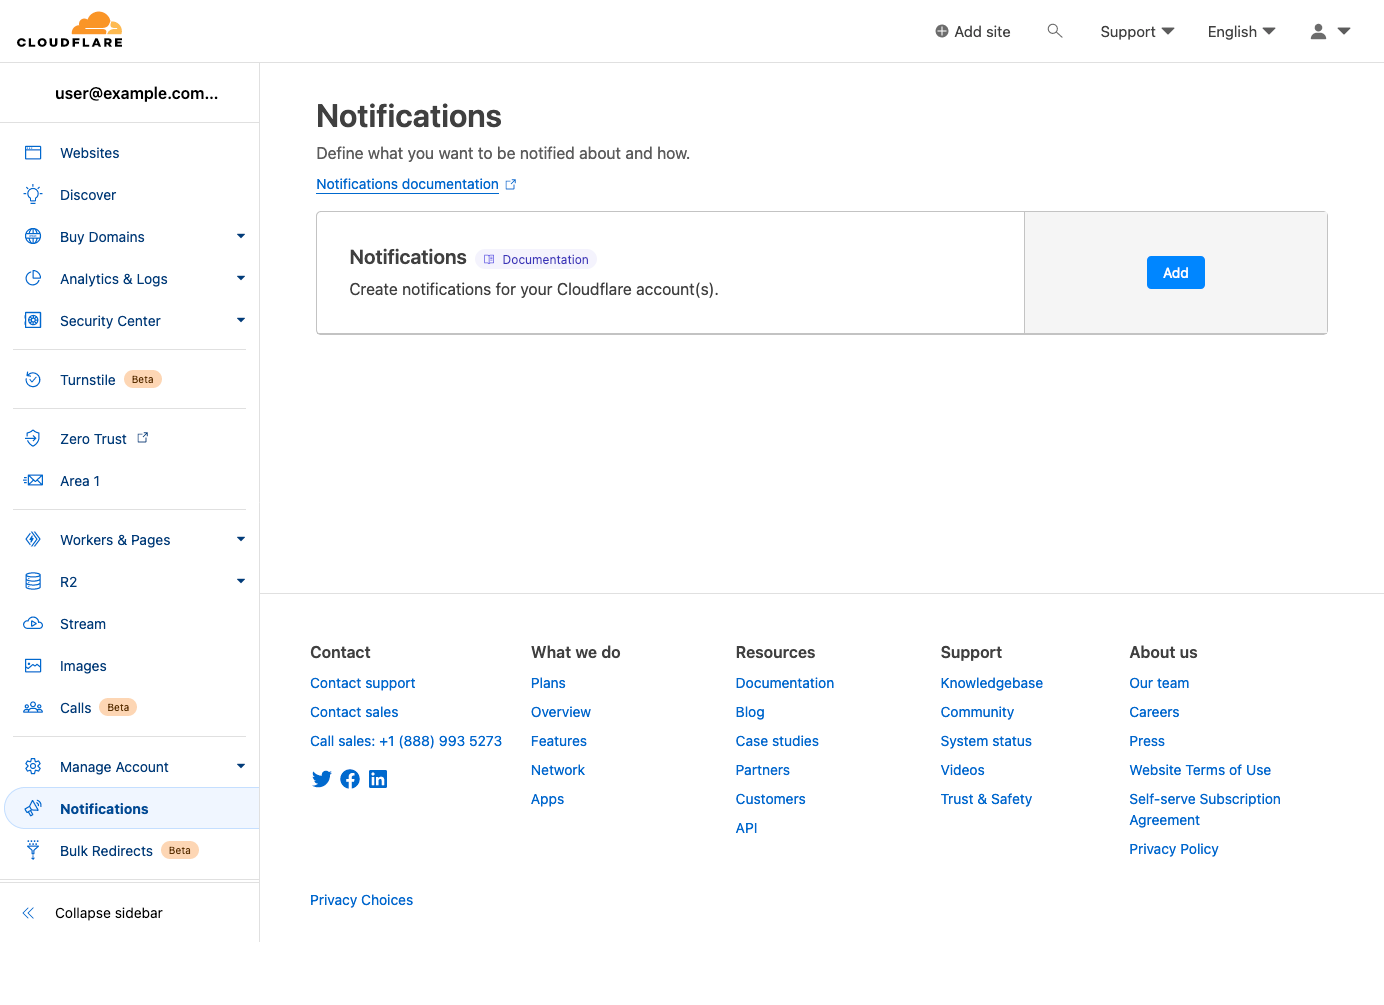
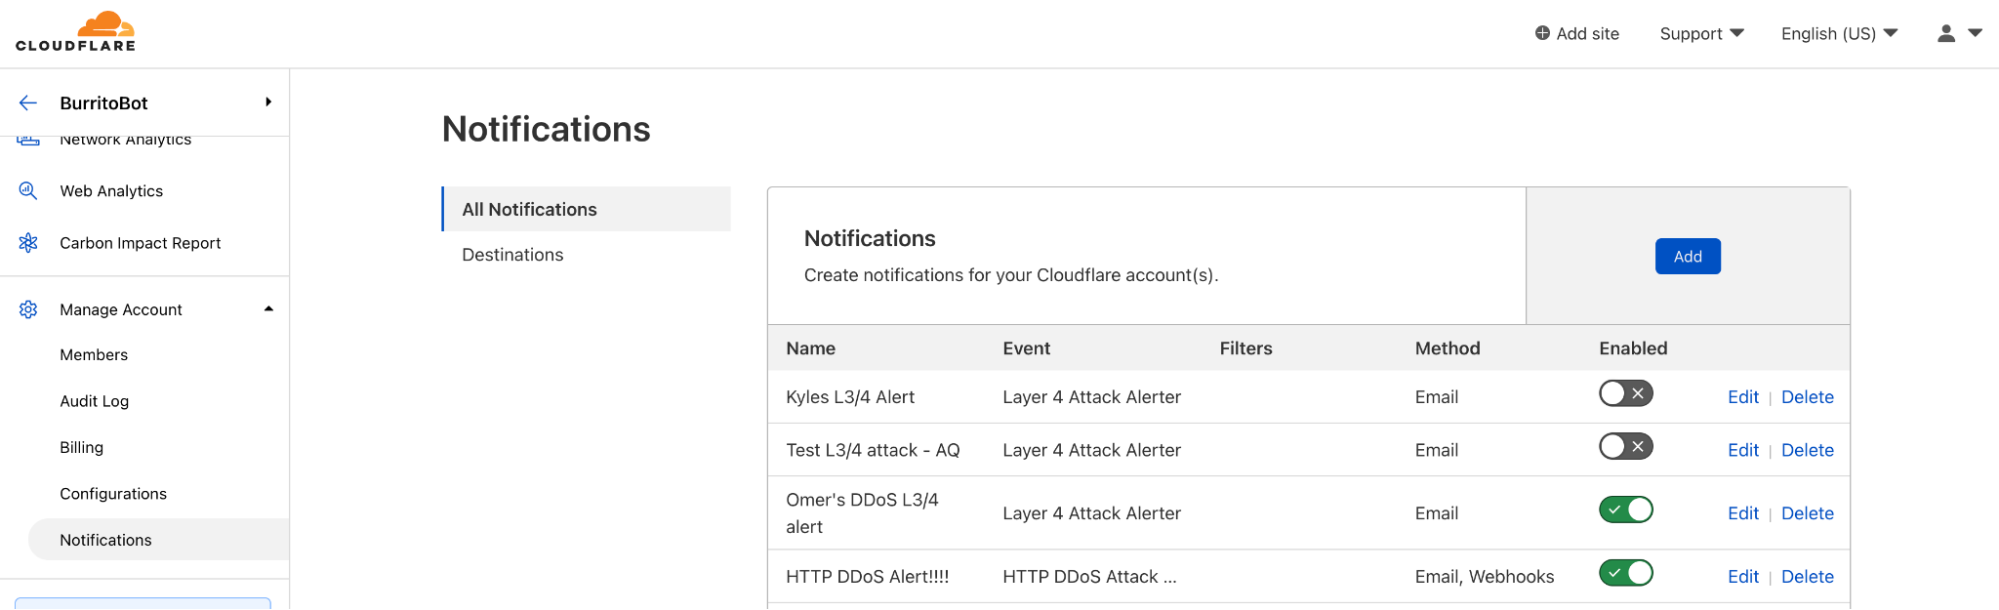
You can also create and configure notifications directly within Cloudflare, without starting from a link on Radar a Radar page. To do so, log in to Cloudflare, and choose “Notifications” from the left side navigation bar. That will take you to the Notifications page shown below. Click the “Add” button to add a new notification.
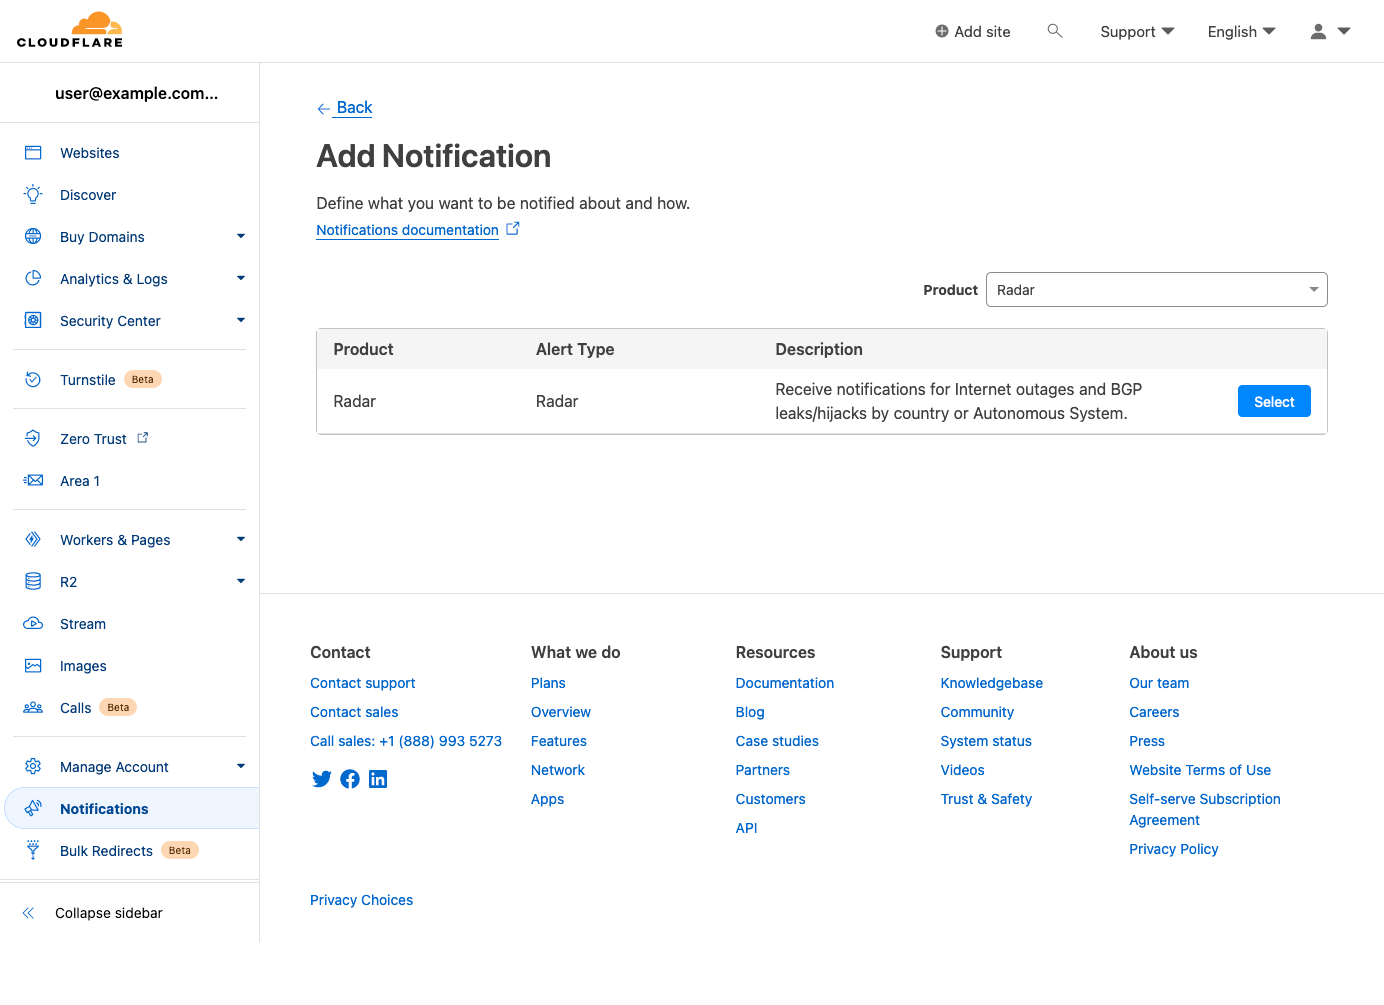
On the next page, search for and select “Radar” from the list of Cloudflare products for which notifications are available.
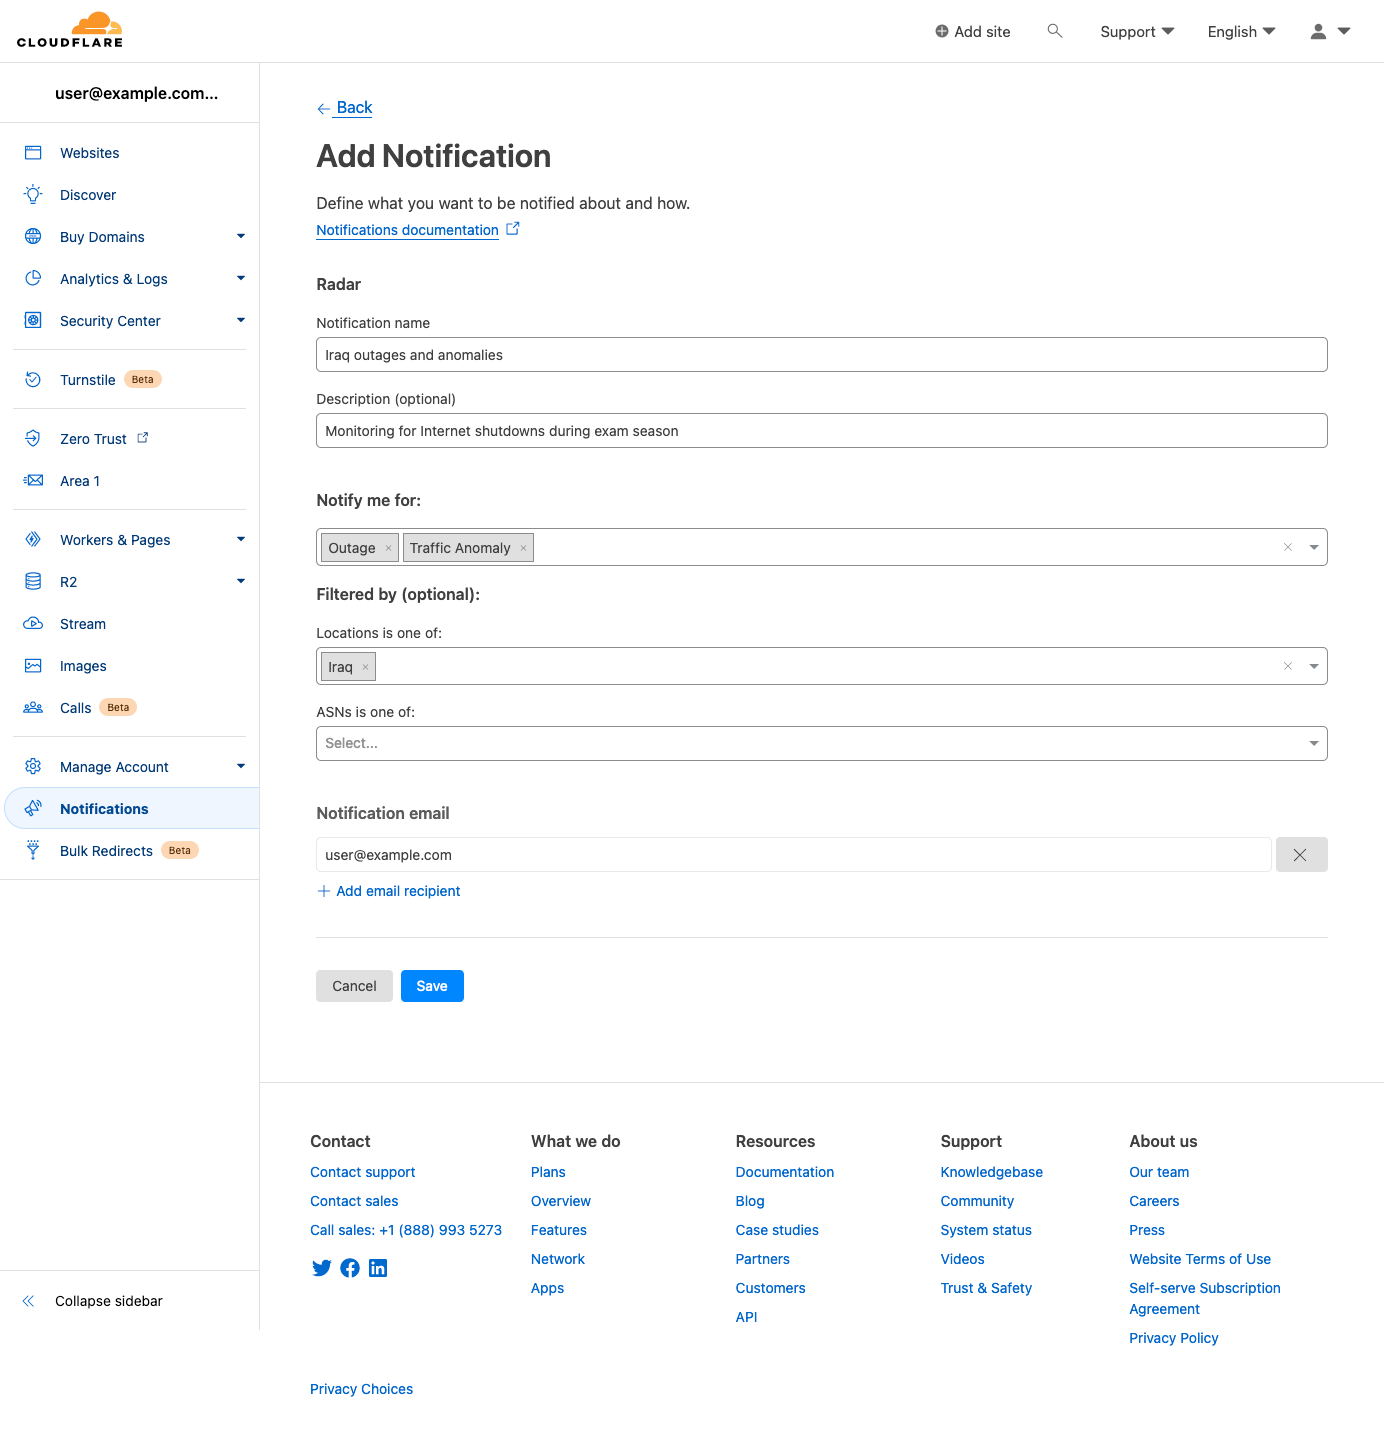
On the subsequent “Add Notification” page, you can create and configure a notification from scratch. Event types can be selected in the “Notify me for:” field, and both locations and ASNs can be searched for and selected within the respective “Filtered by (optional)” fields. Note that if no filters are selected, then notifications will be sent for all events of the selected type(s). Add one or more emails to send notifications to, or select a webhook target if available, and click “Save” to add it to the list of notifications configured for your account.
It is worth mentioning that advanced users can also create and configure notifications through the Cloudflare API Notification policies endpoint, but we will not review that process within this blog post.
Notification messages
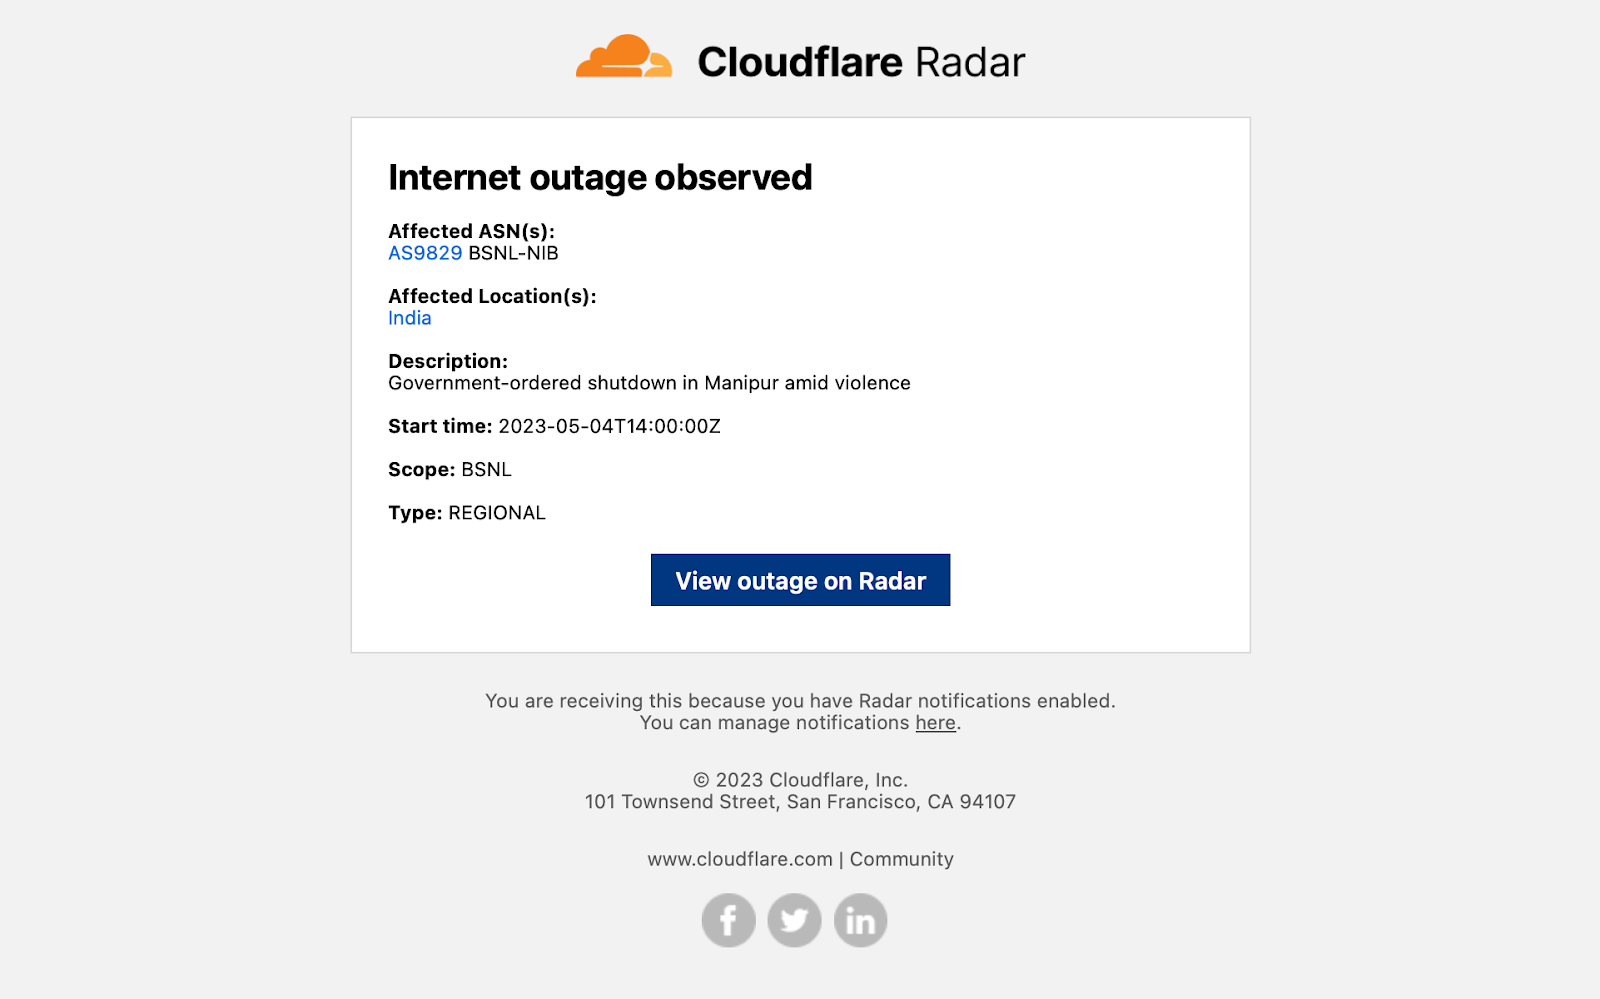
Example notification email messages are shown below for the various types of events. Each contains key information like the type of event, affected entities, and start time — additional relevant information is included depending on the event type. Each email includes both plaintext and HTML versions to accommodate multiple types of email clients. (Final production emails may vary slightly from those shown below.)
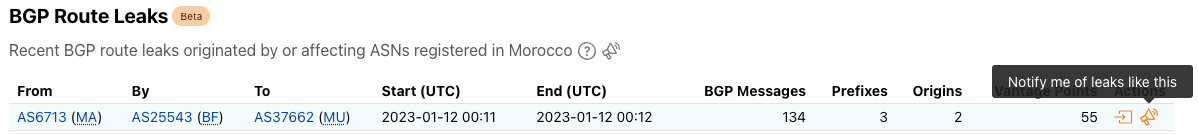
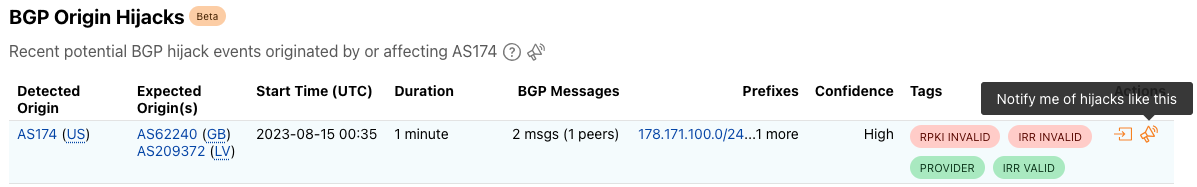
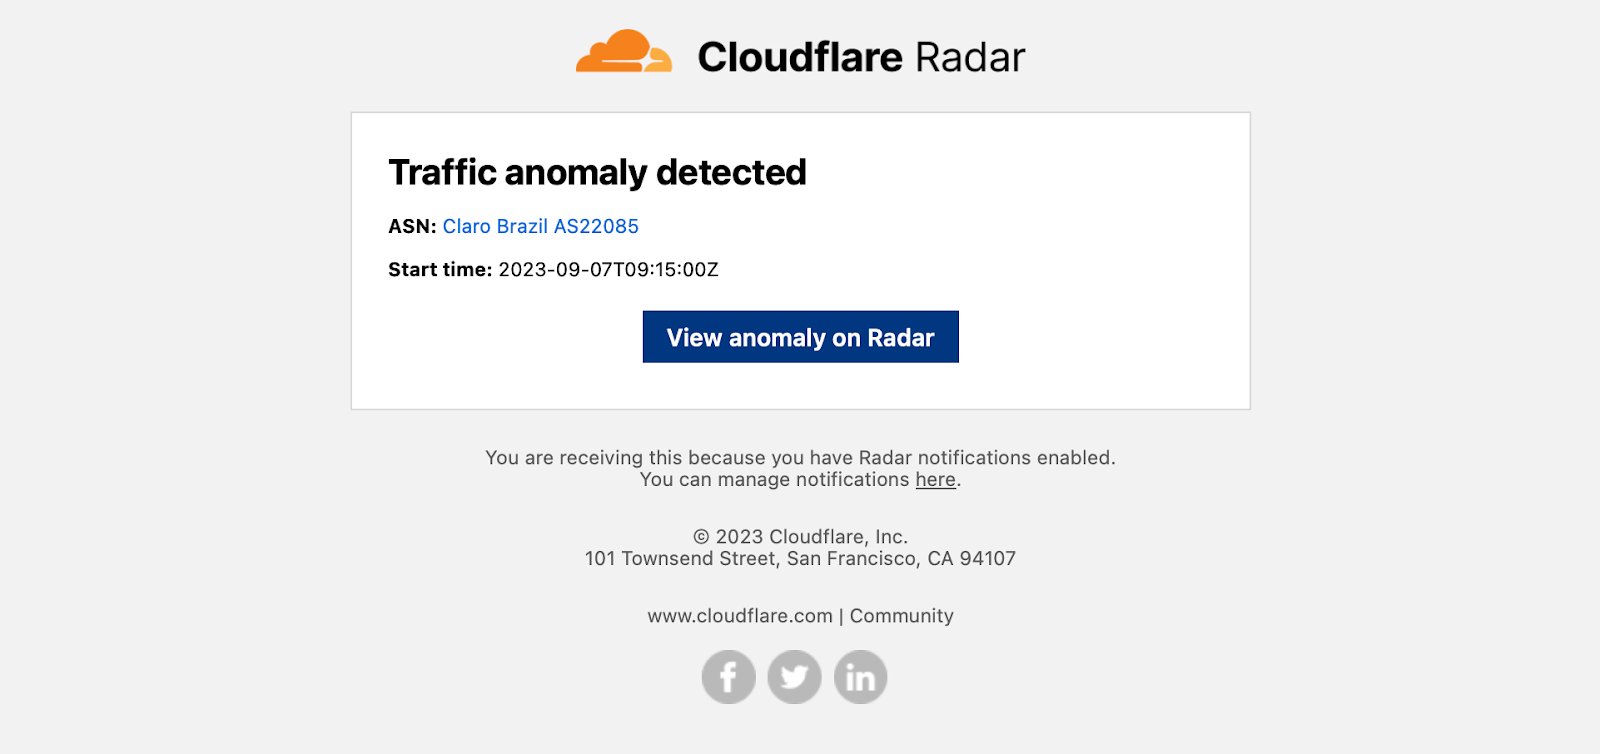
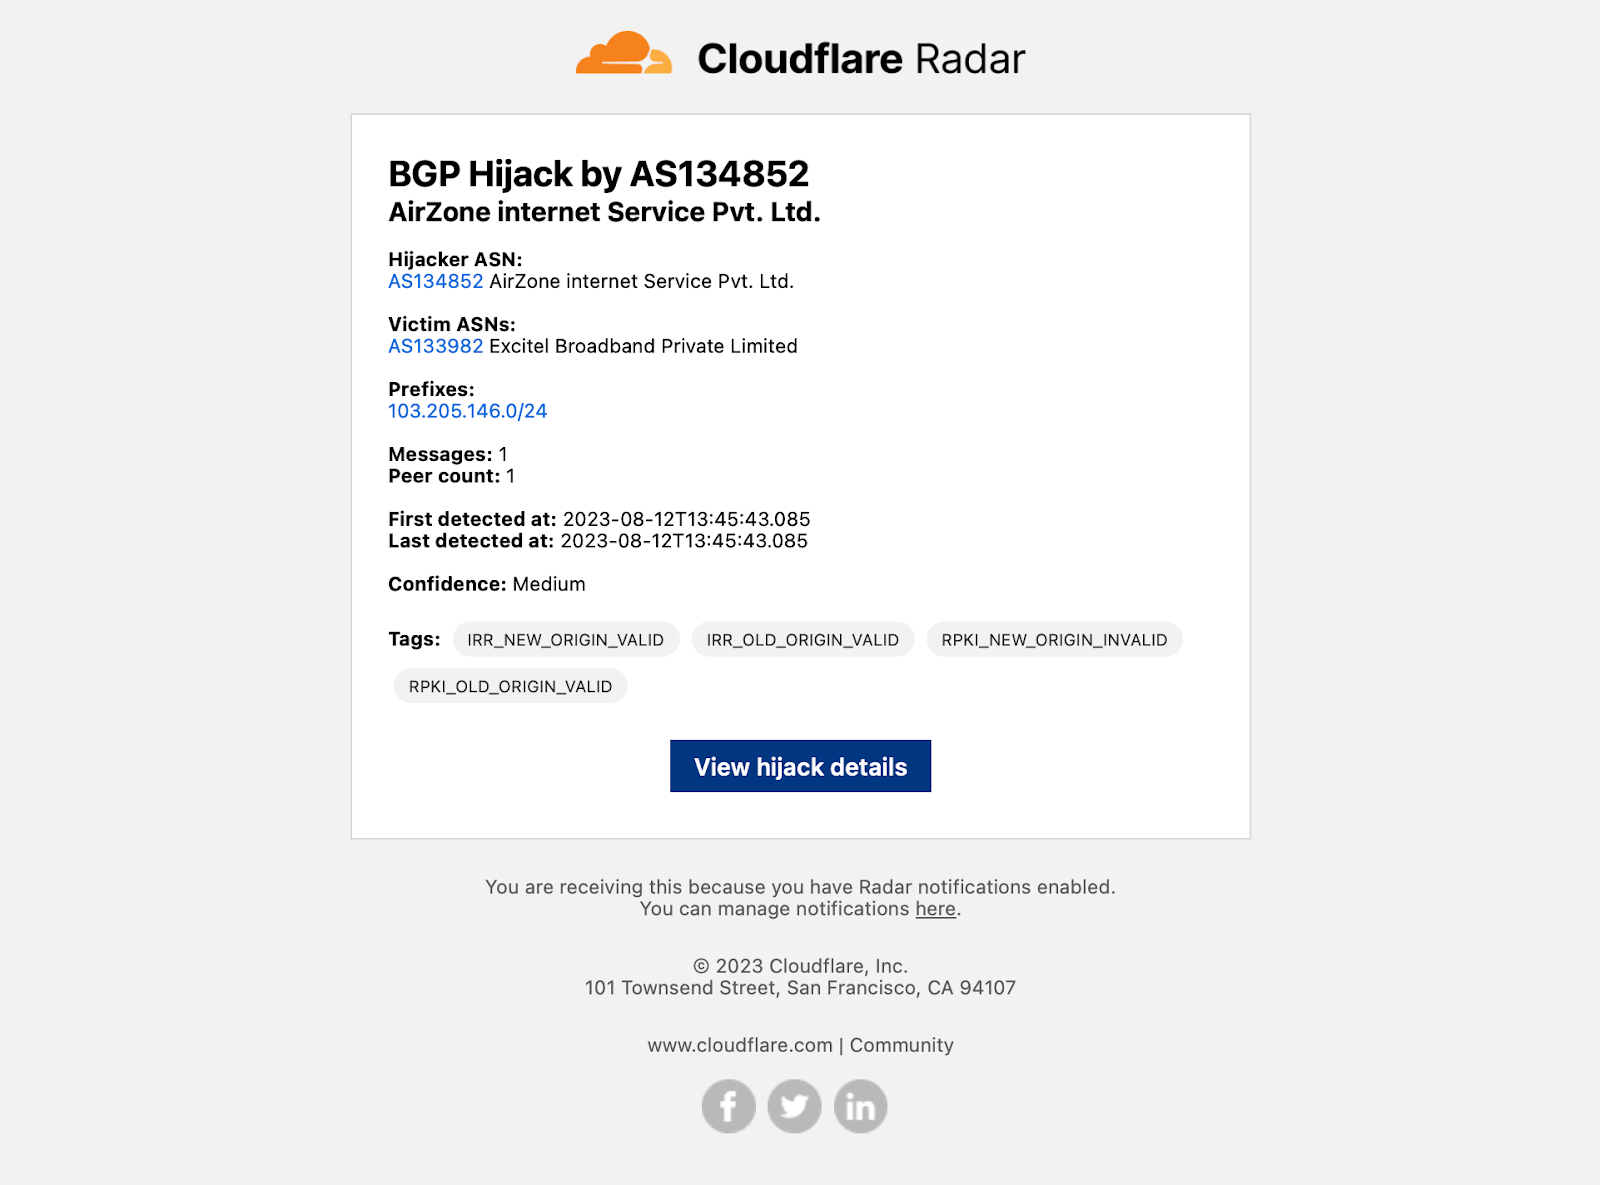
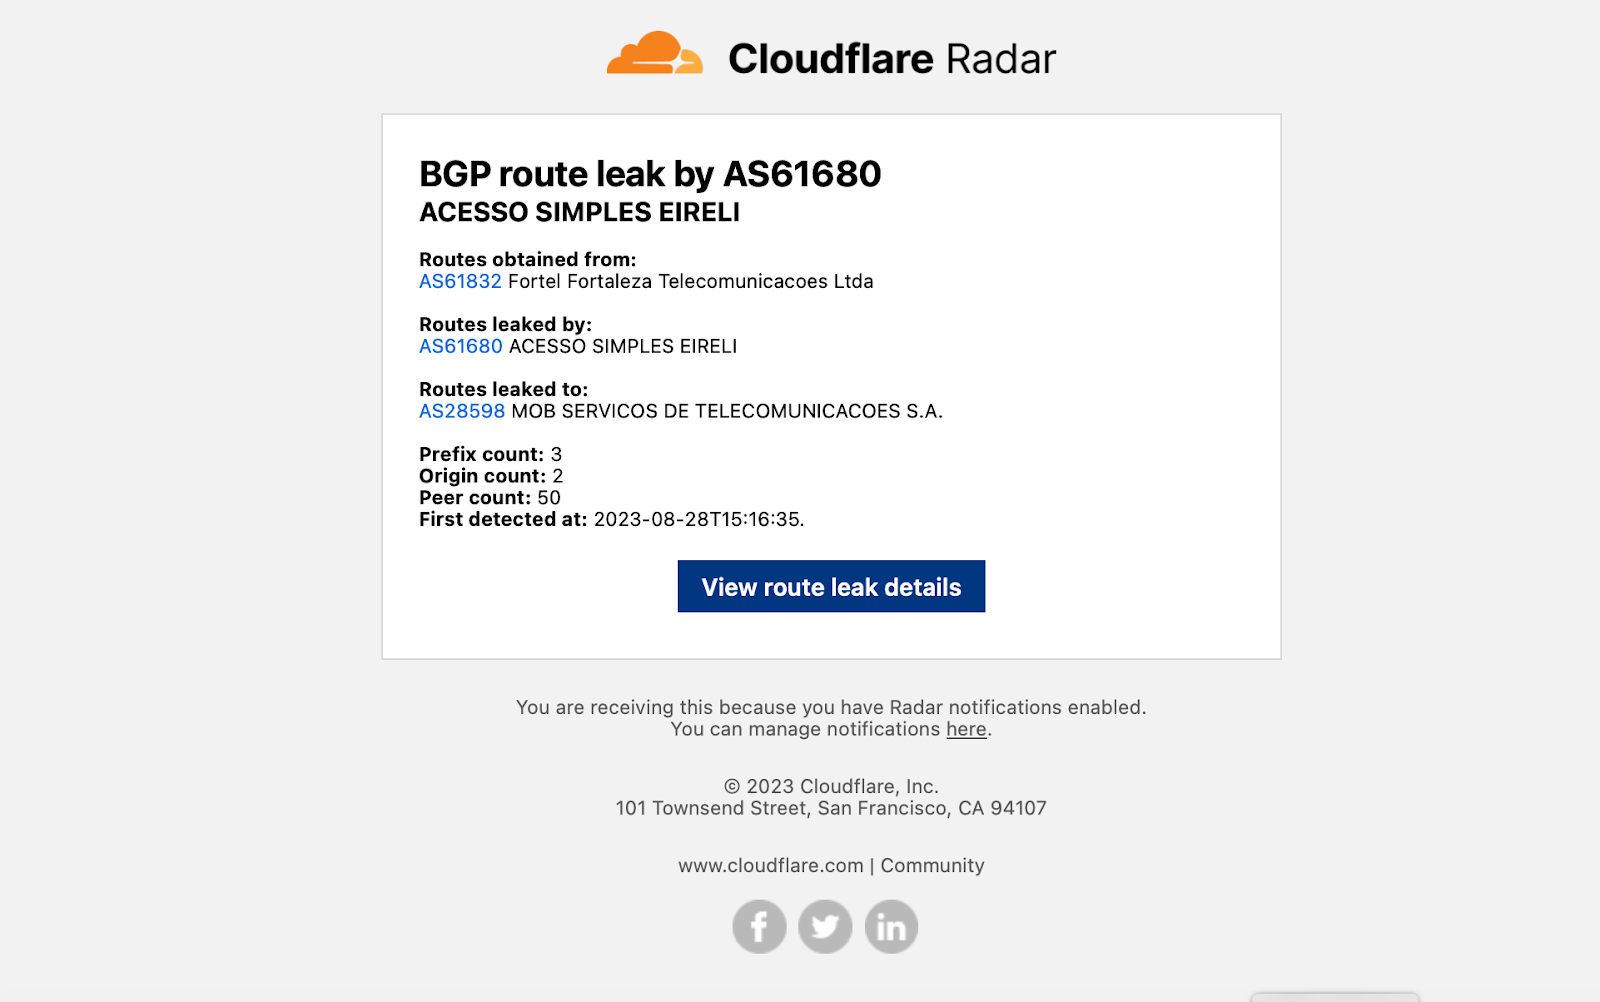
Internet outage notification emails include information about the affected entities, a description of the cause of the outage, start time, scope (if available), and the type of outage (Nationwide, Network, Regional, or Platform), as well as a link to view the outage in a Radar traffic graph.Traffic anomaly notification emails simply include information about the affected entity and a start time, as well as a link to view the anomaly in a Radar traffic graph.BGP hijack notification emails include information about the hijacking and victim ASNs, affected IP address prefixes, the number of BGP messages (announcements) containing leaked routes, the number of peers announcing the hijack, detection timing, a confidence level on the event being a true hijack, and relevant tags, as well as a link to view details of the hijack event on Radar.BGP route leak notification emails include information about the AS that the leaked routes were learned from, the AS that leaked the routes, the AS that received and propagated the leaked routes, the number of affected prefixes, the number of affected origin ASes, the number of BGP route collector peers that saw the route leak, and detection timing, as well as a link to view details of the route leak event on Radar.
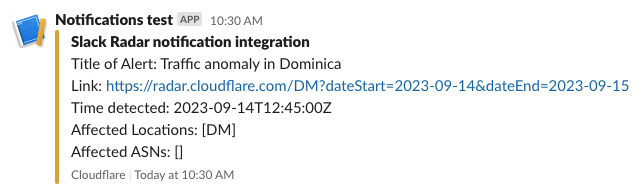
If you are sending notifications to webhooks, you can integrate those notifications into tools like Slack. For example, by following the directions in Slack’s API documentation, creating a simple integration took just a few minutes and results in messages like the one shown below.
Conclusion
Cloudflare’s unique perspective on the Internet provides us with near-real-time insight into unexpected drops in traffic, as well as potentially problematic routing events. While we’ve been sharing these insights with you over the past year, you had to visit Cloudflare Radar to figure out if there were any new “events”. With the launch of notifications, we’ll now automatically send you information about the latest events that you are interested in.
We encourage you to visit Cloudflare Radar to familiarize yourself with the information we publish about traffic anomalies, confirmed Internet outages, BGP route leaks, and BGP origin hijacks. Look for the notification icon on the relevant graphs and tables on Radar, and go through the workflow to set up and subscribe to notifications. (And don’t forget to sign up for a Cloudflare account if you don’t have one already.) Please send us feedback about the notifications, as we are constantly working to improve them, and let us know how and where you’ve integrated Radar notifications into your own tools/workflows/organization.
Today we are excited to announce thresholds for our Security Event Alerts: a new and improved way of detecting anomalous spikes of security events on your Internet properties. Previously, our calculations were based on z-score methodology alone, which was able to determine most of the significant spikes. By introducing a threshold, we are able to make alerts more accurate and only notify you when it truly matters. One can think of it as a romance between the two strategies. This is the story of how they met.
Author’s note: as an intern at Cloudflare I got to work on this project from start to finish from investigation all the way to the final product.
Once upon a time
In the beginning, there were Security Event Alerts. Security Event Alerts are notifications that are sent whenever we detect a threat to your Internet property. As the name suggests, they track the number of security events, which are requests to your application that match security rules. For example, you can configure a security rule that blocks access from certain countries. Every time a user from that country tries to access your Internet property, it will log as a security event. While a security event may be harmless and fired as a result of the natural flow of traffic, it is important to alert on instances when a rule is fired more times than usual. Anomalous spikes of too many security events in a short period of time can indicate an attack. To find these anomalies and distinguish between the natural number of security events and that which poses a threat, we need a good strategy.
The lonely life of a z-score
Before a threshold entered the picture, our strategy worked onlyon the basis of a z-score. Z-score is a methodology that looks at the number of standard deviations a certain data point is from the mean. In our current configuration, if a spike crosses the z-score value of 3.5, we send you an alert. This value was decided on after careful analysis of our customers’ data, finding it the most effective in determining a legitimate alert. Any lower and notifications will get noisy for smaller spikes. Any higher and we may miss out on significant events. You can read more about our z-score methodology in this blog post.
The following graphs are an example of how the z-score method works. The first graph shows the number of security events over time, with a recent spike.
To determine whether this spike is significant, we calculate the z-score and check if the value is above 3.5:
As the graph shows, the deviation is above 3.5 and so an alert is triggered.
However, relying on z-score becomes tricky for domains that experience no security events for a long period of time. With many security events at zero, the mean and standard deviation depress to zero as well. When a non-zero value finally appears, it will always be infinite standard deviations away from the mean. As a result, it will always trigger an alert even on spikes that do not pose any threat to your domain, such as the below:
With five security events, you are likely going to ignore this spike, as it is too low to indicate a meaningful threat. However, the z-score in this instance will be infinite:
Since a z-score of infinity is greater than 3.5, an alert will be triggered. This means that customers with few security events would often be overwhelmed by event alerts that are not worth worrying about.
Letting go of zeros
To avoid the mean and standard deviation becoming zero and thus alerting on every non-zero spike, zero values can be ignored in the calculation. In other words, to calculate the mean and standard deviation, only data points that are higher than zero will be considered.
With those conditions, the same spike to five security events will now generate a different z-score:
Great! With the z-score at zero, it will no longer trigger an alert on the harmless spike!
But what about spikes that could be harmful? When calculations ignore zeros, we need enough non-zero data points to accurately determine the mean and standard deviation. If only one non-zero value is present, that data point determines the mean and standard deviation. As such, the mean will always be equal to the spike, z-score will always be zero and an alert will never be triggered:
For a spike of 1000 events, we can tell that there is something wrong and we should trigger an alert. However, because there is only one non-zero data point, the z-score will remain zero:
The z-score does not cross the value 3.5 and an alert will not be triggered.
So what’s better? Including zeros in our calculations can skew the results for domains with too many zero events and alert them every time a spike appears. Not including zeros is mathematically wrong and will never alert on these spikes.
Threshold, the prince charming
Clearly, a z-score is not enough on its own.
Instead, we paired up the z-score with a threshold. The threshold represents the raw number of security events an Internet property can have, below which an alert will not be sent. While z-score checks whether the spike is at least 3.5 standard deviations above the mean, the threshold makes sure it is above a certain static value. If both of these conditions are met, we will send you an alert:
The above spike crosses the threshold of 200 security events. We now have to check that the z-score is above 3.5:
The z-score value crosses 3.5 and an alert will be sent.
A threshold for the number of security events comes as the perfect complement. By itself, the threshold cannot determine whether something is a spike, and would simply alert on any value crossing it. This blog post describes in more detail why thresholds alone do not work. However, when paired with z-score, they are able to share their strengths and cover for each other’s weaknesses. If the z-score falsely detects an insignificant spike, the threshold will stop the alert from triggering. Conversely, if a value does cross the security events threshold, the z-score ensures there is a reasonable variance from the data average before allowing an alert to be sent.
The invaluable value
To foster a successful relationship between the z-score and security events threshold, we needed to determine the most effective threshold value. After careful analysis of our previous attacks on customers, we set the value to 200. This number is high enough to filter out the smaller, noisier spikes, but low enough to expose any threats.
Am I invited to the wedding?
Yes, you are! The z-score and threshold relationship is already enabled for all WAF customers, so all you need to do is sit back and relax. For enterprise customers, the threshold will be applied to each type of alert enabled on your domain.
Happily ever after
The story certainly does not end here. We are constantly iterating on our alerts, so keep an eye out for future updates on the road to make our algorithms even more personalized for your Internet properties!
With AWS Security Hub you are able to manage your security posture in AWS, perform security best practice checks, aggregate alerts, and automate remediation. Now you are able to use Amazon Simple Notification Service (Amazon SNS) to subscribe to the new Security Hub Announcements topic to receive updates about new Security Hub services and features, newly supported standards and controls, and other Security Hub changes.
Introducing the Security Hub Announcements topic
Amazon SNS follows the publish/subscribe (pub/sub) messaging model, in which notifications are delivered to you by using a push mechanism that eliminates the need for you to periodically check or poll for new information and updates. You can now use this push mechanism to receive notifications about Security Hub by subscribing to the dedicated Security Hub Announcements topic.
The Security Hub Announcements topic publishes the following types of notifications:
General notifications
Upcoming standards and controls
New AWS Regions supported
New standards and controls
Updated standards and controls
Retired standards and controls
Updates to the AWS Security Finding Format (ASFF)
New integrations
New features
Changes to existing features
How to use the Security Hub Announcements topic
You can subscribe to the SNS topic for Security Hub Announcements to receive notification messages about newly released finding types, updates to the existing finding types, and other functionality changes. By subscribing to the SNS topic, you will receive Security Hub Announcements messages as soon as they are published. The notifications are available in all protocols that Amazon SNS supports, such as email and SMS. For more information about supported protocols in Amazon SNS, see Subscribing to an Amazon SNS topic.
The Security Hub Announcements topic is available in all AWS Regions in the aws and aws-cn partitions, but is not yet available in the AWS GovCloud (US) Regions (the aws-us-gov partition). Later in this post, we’ll show you how to subscribe to the Security Hub Announcements topic in a specific AWS Region by using the topic Amazon Resource Name (ARN) for that Region. The SNS topic messages are the same across Regions in a partition, so you can choose to subscribe to only one Region in a partition to avoid receiving duplicate information.
However, if you want to invoke an AWS Lambda function in reaction to a Security Hub Announcements message, you must subscribe to the topic ARN that is in the same Region as the Lambda function. The Lambda function can receive the SNS topic message payload as an input parameter and manipulate the information in the message, publish the message to other SNS topics, or send the message to other AWS services. For more information, see Subscribing a function to a topic in the Amazon SNS Developer Guide.
The same is true if you want to subscribe an Amazon Simple Queue Service (Amazon SQS) queue to the Security Hub Announcements topic, you must use a topic ARN that is in the same Region as the SQS queue. The SQS queue can be used to persist announcement SNS topic messages in the queue for other applications to process at a later time. For more information, see Subscribing an Amazon SQS queue to an Amazon SNS topic in the Amazon SQS Developer Guide.
IAM permissions
Your user account must have sns::subscribe AWS Identity and Access Management (IAM) permissions to subscribe to an SNS topic. For more information on IAM permissions for Amazon SNS, see Using identity-based policies with Amazon SNS.
Subscribe to the Security Hub Announcements topic
The following is the list of Security Hub Announcements topic ARNs for each currently supported Region. The examples in this post use the US West (Oregon) Region (us-west-2), but you can update the procedures with one of the following ARNs to use a different supported Region.
The two procedures that follow show you how to subscribe an email address to the Security Hub Announcements topic by using the AWS Management Console and the AWS CLI.
To subscribe an email address to the Security Hub Announcements topic (console)
For Endpoint, enter an email address that you can use to receive the notification.
Choose Create subscription.
In your email application, open the message from AWS Notifications and open the link to confirm your subscription. Your web browser displays a confirmation response from Amazon SNS, similar to that shown in Figure 1.
The following steps show you how to subscribe an email address to the Security Hub Announcements topic by using the AWS Command Line Interface (AWS CLI).
To subscribe an email address to the Security Hub Announcements topic (AWS CLI)
Run the following command in the AWS CLI, replacing <[email protected]> with your email address, and optionally replacing the ARN and reference to us-west-2 if you want to use a different Region: aws sns --region us-west-2 subscribe --topic-arn arn:aws:sns:us-west-2:393883065485:SecurityHubAnnouncements --protocol email --notification-endpoint<[email protected]>
In your email application, open the message from AWS Notifications and open the link to confirm your subscription.
Your web browser displays a confirmation response from Amazon SNS, similar to that shown in Figure 1.
Example subscription responses
The following sections contain examples of a message announcing new standard controls supported by Security Hub in email and sqs protocol types.
Example message from an email subscription (protocol type: email)
{"AnnouncementType":"NEW_STANDARDS_CONTROLS", “Title”:”[New Controls] 36 new Security Hub controls added to the AWS Foundational Security Best Practices standard”, "Description":"We have added 36 new controls to the AWS Foundational Security Best Practices standard. These include controls for Amazon Auto Scaling (AutoScaling.3, AutoScaling.4, AutoScaling.6), AWS CloudFormation (CloudFormation.1), Amazon CloudFront (CloudFront.10), Amazon Elastic Compute Cloud (Amazon EC2) (EC2.23, EC2.24, EC2.27), Amazon Elastic Container Registry (Amazon ECR) (ECR.1, ECR.2), Amazon Elastic Container Service (Amazon ECS) (ECS.3, ECS.4, ECS.5, ECS.8, ECS.10, ECS.12), Amazon Elastic File System (Amazon EFS) (EFS.3, EFS.4), Amazon Elastic Kubernetes Service (Amazon EKS) (EKS.2), Elastic Load Balancing (ELB.12, ELB.13, ELB.14), Amazon Kinesis (Kinesis.1), AWS Network Firewall (NetworkFirewall.3, NetworkFirewall.4, NetworkFirewall.5), Amazon OpenSearch Service (Opensearch.7), Amazon Redshift (Redshift.9), Amazon Simple Storage Service (Amazon S3) (S3.13), Amazon Simple Notification Service (SNS.2), AWF WAF (WAF.2, WAF.3, WAF.4, WAF.6, WAF.7, WAF.8). If you enabled the AWS Foundational Security Best Practices standard in an account and configured Security Hub to automatically enable new controls, these controls are enabled by default. Availability of controls can vary by Region."}
Example message from an SQS queue subscription (protocol type: sqs)
The following message shows the additional metadata included with an SQS subscription to the Security Hub Announcements topic. For more information about the metadata included in an SNS topic message delivered to an SQS queue, see Fanout to Amazon SQS Queues.
{
  "Type" : "Notification",
  "MessageId" : "c9c03e46-69df-5c3c-84e9-6520708ac394",
  "TopicArn" : "arn:aws:sns:us-west-2:393883065485:SecurityHubAnnouncements",
  "Message" : "{\"AnnouncementType\":\"NEW_STANDARDS_CONTROLS\",\"Title\":\"[New Controls] 36 new Security Hub controls added to the AWS Foundational Security Best Practices standard\",\"Description\":\"We have added 36 new controls to the AWS Foundational Security Best Practices standard. These include controls for Amazon Auto Scaling (AutoScaling.3, AutoScaling.4, AutoScaling.6), AWS CloudFormation (CloudFormation.1), Amazon CloudFront (CloudFront.10), Amazon Elastic Compute Cloud (Amazon EC2) (EC2.23, EC2.24, EC2.27), Amazon Elastic Container Registry (Amazon ECR) (ECR.1, ECR.2), Amazon Elastic Container Service (Amazon ECS) (ECS.3, ECS.4, ECS.5, ECS.8, ECS.10, ECS.12), Amazon Elastic File System (Amazon EFS) (EFS.3, EFS.4), Amazon Elastic Kubernetes Service (Amazon EKS) (EKS.2), Elastic Load Balancing (ELB.12, ELB.13, ELB.14), Amazon Kinesis (Kinesis.1), AWS Network Firewall (NetworkFirewall.3, NetworkFirewall.4, NetworkFirewall.5), Amazon OpenSearch Service (Opensearch.7), Amazon Redshift (Redshift.9), Amazon Simple Storage Service (Amazon S3) (S3.13), Amazon Simple Notification Service (SNS.2), AWF WAF (WAF.2, WAF.3, WAF.4, WAF.6, WAF.7, WAF.8). If you enabled the AWS Foundational Security Best Practices standard in an account and configured Security Hub to automatically enable new controls, these controls are enabled by default. Availability of controls can vary by Region. \"}",
  "Timestamp" : "2022-08-04T18:59:33.319Z",
  "SignatureVersion" : "1",
  "Signature" : "GdKokPEUexpKZn5da5u/p5eZF1cE3JUyL0uPVKmPnDzd3orkk5jJ211VsOflUFi6V9lSXF/V6RBpQN/9f3+JBFBprng7BRQwT9I4jSa1xOn1L3xKXEVGvWI6nl1oDqBl21Pj3owV+NZ+Exd2W0dpgg8B1LG4bYq5T73MjHjWGtelcBa15TpIz/+rynqanXCKCvc/50V/XZLjA5M7gU6Dzs9CULIjkdEpCsw5FvSxbtkEd6Ktx4LH7Zq6FlPKNli3EaEHRKh9uYPo6sR/yvF4RWg3E9O4dVsK7A8uTdR+pwVCU1M601KMRxO1OWF8VIdvyPINJND8Nu/70GRA2L+MRA==",
  "SigningCertURL" : "https://sns.us-west-2.amazonaws.com/SimpleNotificationService-56e67fcb41f6fec09b0196692625d385.pem",
  "UnsubscribeURL" : "https://sns.us-west-2.amazonaws.com/?Action=Unsubscribe&SubscriptionArn=arn:aws:sns:us-west-2:393883065485:SecurityHubAnnouncements:1eb29a83-8726-4366-891c-293ad5e35a53"
}
Note: You need to set up the SQS access policy in order for SNS to push message to the SNS queue. For more information, see Basic examples of Amazon SQS policies.
Available now
The SNS topic for Security Hub Announcements is available today in the Regions described in this post. Subscribe now to stay informed of Security Hub updates. With Amazon SNS, there is no minimum fee, and you pay only for what you use. For more information, see the Amazon SNS pricing page.
If you have feedback about this post, submit comments in the Comments section below. If you have questions about this post, contact AWS Support. You can also start a new thread on AWS Security Hub re:Post to get answers from the community.
Want more AWS Security news? Follow us on Twitter.
Since we launched Durable Objects, developers have leveraged them as a novel building block for distributed applications.
Durable Objects provide globally unique instances of a JavaScript class a developer writes, accessed via a unique ID. The Durable Object associated with each ID implements some fundamental component of an application — a banking application might have a Durable Object representing each bank account, for example. The bank account object would then expose methods for incrementing a balance, transferring money or any other actions that the application needs to do on the bank account.
Durable Objects work well as a stateful backend for applications — while Workers can instantiate a new instance of your code in any of Cloudflare’s data centers in response to a request, Durable Objects guarantee that all requests for a given Durable Object will reach the same instance on Cloudflare’s network.
Each Durable Object is single-threaded and has access to a stateful storage API, making it easy to build consistent and highly-available distributed applications on top of them.
This system makes distributed systems’ development easier — we’ve seen some impressive applications launched atop Durable Objects, from collaborative whiteboarding tools to conflict-free replicated data type (CRDT) systems for coordinating distributed state launch.
However, up until now, there’s been a piece missing — how do you invoke a Durable Object when a client Worker is not making requests to it?
As with any distributed system, Durable Objects can become unavailable and stop running. Perhaps the machine you were running on was unplugged, or the datacenter burned down and is never coming back, or an individual object exceeded its memory limit and was reset. Before today, a subsequent request would reinitialize the Durable Object on another machine, but there was no way to programmatically wake up an Object.
Durable Objects Alarms are here to change that, unlocking new use cases for Durable Objects like queues and deferred processing.
What is a Durable Object Alarm?
Durable Object Alarms allow you, from within your Durable Object, to schedule the object to be woken up at a time in the future. When the alarm’s scheduled time comes, the Durable Object’s alarm() handler will be called. If this handler throws an exception, the alarm will be automatically retried using exponential backoff until it succeeds — alarms have guaranteed at-least-once execution.
How are Alarms different from Workers Cron Triggers?
Alarms are more fine-grained than Cron Triggers. While a Workers service can have up to three Cron Triggers configured at once, it can have an unlimited amount of Durable Objects, each of which can have a single alarm active at a time.
Alarms are directly scheduled from and invoke a function within your Durable Object. Cron Triggers, on the other hand, are not programmatic — they execute based on their schedules, which have to be configured via the Cloudflare Dashboard or centralized configuration APIs.
How do I use Alarms?
First, you’ll need to add the durable_object_alarms compatibility flag to your wrangler.toml.
compatibility_flags = ["durable_object_alarms"]
Next, implement an alarm() handler in your Durable Object that will be called when the alarm executes. From anywhere else in your Durable Object, call state.storage.setAlarm() and pass in a time for the alarm to run at. You can use state.storage.getAlarm() to retrieve the currently set alarm time.
In this example, we implemented an alarm handler that wakes the Durable Object up once every 10 seconds to batch requests to a single Durable Object, deferring processing until there is enough work in the queue for it to be worthwhile to process them.
export default {
  async fetch(request, env) {
    let id = env.BATCHER.idFromName("foo");
    return await env.BATCHER.get(id).fetch(request);
  },
};

const SECONDS = 1000;

export class Batcher {
  constructor(state, env) {
    this.state = state;
    this.storage = state.storage;
    this.state.blockConcurrencyWhile(async () => {
      let vals = await this.storage.list({ reverse: true, limit: 1 });
      this.count = vals.size == 0 ? 0 : parseInt(vals.keys().next().value);
    });
  }
  async fetch(request) {
    this.count++;

    // If there is no alarm currently set, set one for 10 seconds from now
    // Any further POSTs in the next 10 seconds will be part of this kh.
    let currentAlarm = await this.storage.getAlarm();
    if (currentAlarm == null) {
      this.storage.setAlarm(Date.now() + 10 * SECONDS);
    }

    // Add the request to the batch.
    await this.storage.put(this.count, await request.text());
    return new Response(JSON.stringify({ queued: this.count }), {
      headers: {
        "content-type": "application/json;charset=UTF-8",
      },
    });
  }
  async alarm() {
    let vals = await this.storage.list();
    await fetch("http://example.com/some-upstream-service", {
      method: "POST",
      body: Array.from(vals.values()),
    });
    await this.storage.deleteAll();
    this.count = 0;
  }
}
Once every 10 seconds, the alarm() handler will be called. In the event an unexpected error terminates the Durable Object, it will be re-instantiated on another machine, following a short delay, after which it can continue processing.
Under the hood, Alarms are implemented by making reads and writes to the storage layer. This means Alarm get and set operations follow the same rules as any other storage operation – writes are coalesced with other writes, and reads have a defined ordering. See our blog post on the caching layer we implemented for Durable Objects for more information.
Durable Objects Alarms guarantee fault-tolerance
Alarms are designed to have no single point of failure and to run entirely on our edge – every Cloudflare data center running Durable Objects is capable of running alarms, including migrating Durable Objects from unhealthy data centers to healthy ones as necessary to ensure that their Alarm executes. Single failures should resolve in under 30 seconds, while multiple failures may take slightly longer.
We achieve this by storing alarms in the same distributed datastore that backs the Durable Object storage API. This allows alarm reads and writes to behave identically to storage reads and writes and to be performed atomically with them, and ensures that alarms are replicated across multiple datacenters.
Within each data center capable of running Durable Objects, there are multiple processes responsible for tracking upcoming alarms and triggering them, providing fault tolerance and scalability within the data center. A single elected leader in each data center is responsible for detecting failure of other data centers and assigning responsibility of those alarms to healthy local processes in its own data center. In the event of leader failure, another leader will be elected and become responsible for executing Alarms in the data center. This allows us to guarantee at-least-once execution for all Alarms.
How do I get started?
Alarms are a great way to build new distributed primitives, like queues, atop Durable Objects. They also provide a method for guaranteeing work within a Durable Object will complete, without relying on a client request to “kick” the Object.
You can get started with Alarms now by enabling Durable Objects in the Cloudflare dashboard. For more info, check the developer docs or jump in our Discord.
We are thrilled to announce the availability of Health Checks in the Cloudflare Dashboard’s Notifications tab, available to all Pro, Business, and Enterprise customers. Now, you can get critical alerts on the health of your origin without checking your inbox! Keep reading to learn more about how this update streamlines notification management and unlocks countless ways to stay informed on the health of your servers.
Keeping your site reliable
We first announced Health Checks when we realized some customers were setting up Load Balancers for their origins to monitor the origins’ availability and responsiveness. The Health Checks product provides a similarly powerful interface to Load Balancing, offering users the ability to ensure their origins meet criteria such as reachability, responsiveness, correct HTTP status codes, and correct HTTP body content. Customers can also receive email alerts when a Health Check finds their origin is unhealthy based on their custom criteria. In building a more focused product, we’ve added a slimmer, monitoring-based configuration, Health Check Analytics, and made it available for all paid customers. Health Checks run in multiple locations within Cloudflare’s edge network, meaning customers can monitor site performance across geographic locations.
What’s new with Health Checks Notifications
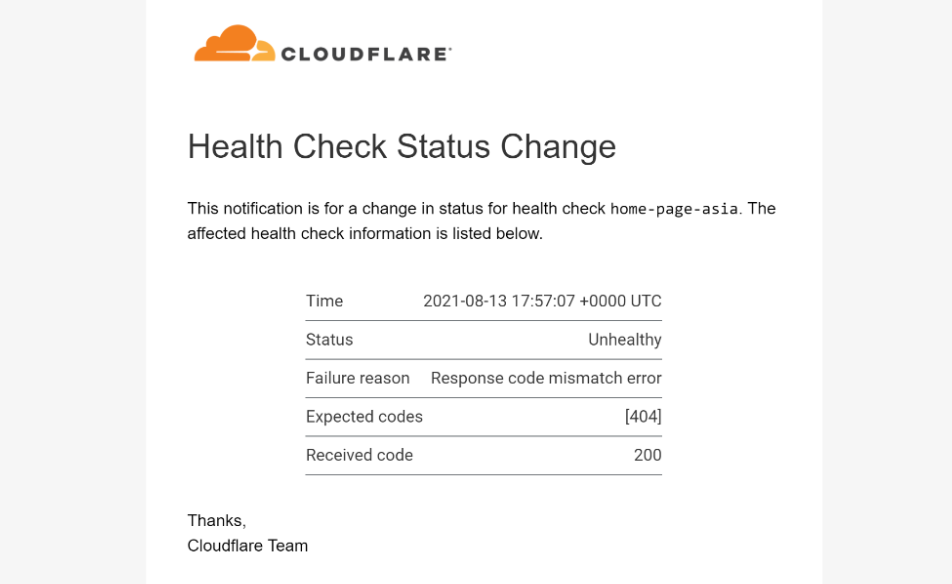
Health Checks email alerts have allowed customers to respond quickly to incidents and guarantee minimum disruption for their users. As before, Health Checks users can still select up to 20 email recipients to notify if a Health Check finds their site to be unhealthy. And if email is the right tool for your team, we’re excited to share that we have jazzed up our notification emails and added details on which Health Check triggered the notification, as well as the status of the Health Check:
New Health Checks email format with Time, Health Status, and Health Check details
That being said, monitoring an inbox is not ideal for many customers needing to stay proactively informed. If email is not the communication channel your team typically relies upon, checking emails can at best be inconvenient and, at worst, allow critical updates to be missed. That’s where the Notifications dashboard comes in.
Users can now create Health Checks notifications within the Cloudflare Notifications dashboard. By integrating Health Checks with Cloudflare’s powerful Notification platform, we have unlocked myriad new ways to ensure customers receive critical updates for their origin health. One of the key benefits of Cloudflare’s Notifications is webhooks, which give customers the flexibility to sync notifications with various external services. Webhook responses contain JSON-encoded information, allowing users to ingest them into their internal or third-party systems.
For real-time updates, users can now use webhooks to send Health Check alerts directly to their preferred instant messaging platforms such as Slack, Google Chat, or Microsoft Teams, to name a few. Beyond instant messaging, customers can also use webhooks to send Health Checks notifications to their internal APIs or their Security Information and Event Management (SIEM) platforms, such as DataDog or Splunk, giving customers a single pane of glass for all Cloudflare activity, including notifications and event logs. For more on how to configure popular webhooks, check out our developer docs. Below, we’ll walk you through a couple of powerful webhook applications. But first, let’s highlight a couple of other ways the update to Health Checks notifications improves user experience.
By including Health Checks in the Notifications tab, users need only to access one page for a single source of truth where they can manage their account notifications. For added ease of use, users can also migrate to Notification setup directly from the Health Check creation page as well. From within a Health Check, users will also be able to see what Notifications are tied to it.
Additionally, configuring notifications for multiple Health Checks is now simplified. Instead of configuring notifications one Health Check at a time, users can now set up notifications for multiple or even all Health Checks from a single workflow.
Also, users can now access Health Checks notification history, and Enterprise customers can integrate Health Checks directly with PagerDuty. Last but certainly not least, as Cloudflare’s Notifications infrastructure grows in capabilities, Health Checks will be able to leverage all of these improvements. This guarantees Health Checks users the most timely and versatile notification capabilities that Cloudflare offers now and into the future.
Setting up a Health Checks webhook
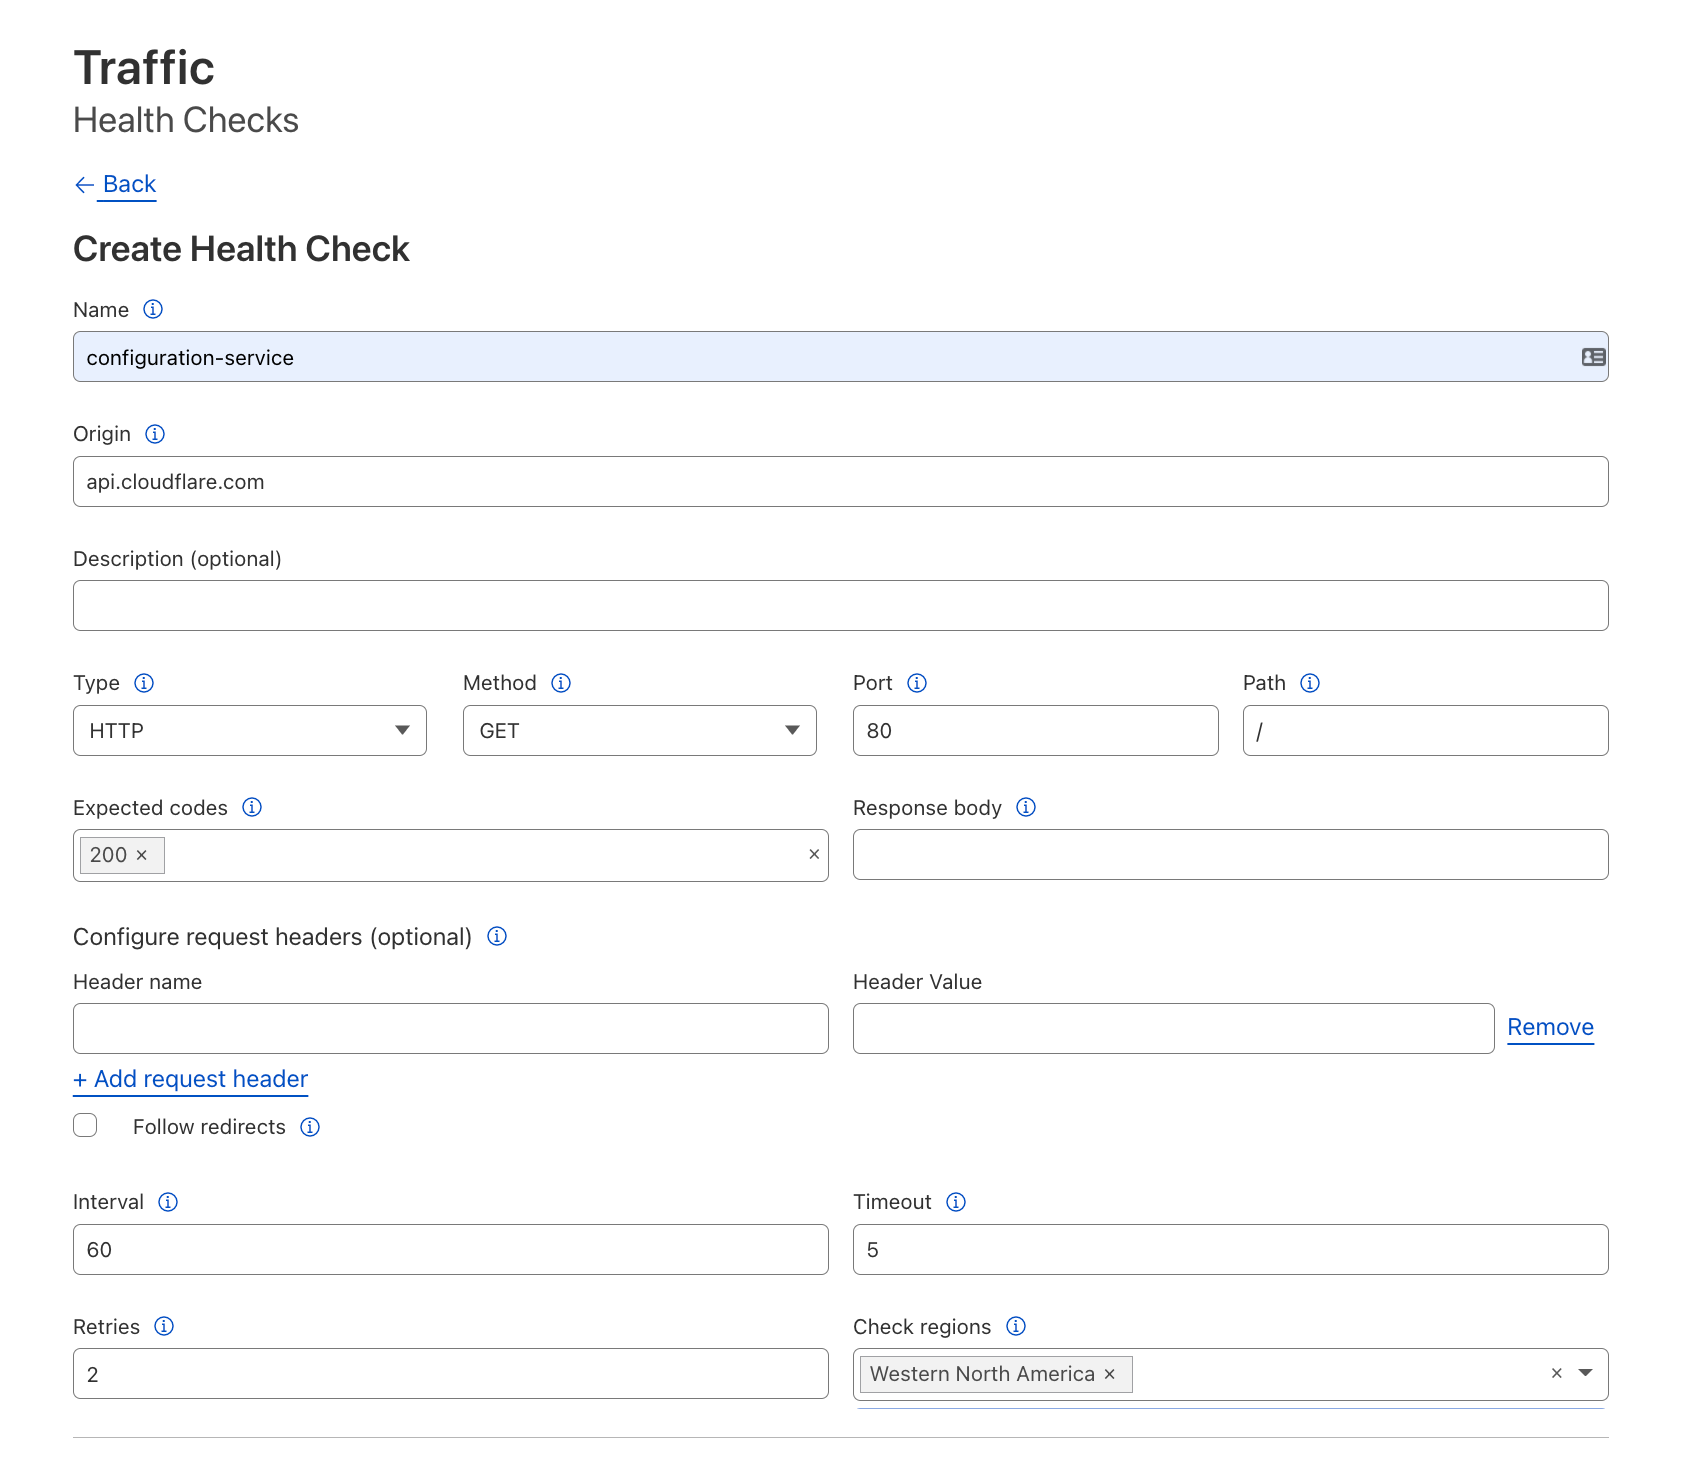
To get notifications for health changes at an origin, we first need to set up a Health Check for it. In this example, we’ll monitor HTTP responses: leave the Type and adjacent fields to their defaults. We will also monitor HTTP response codes: add `200` as an expected code, which will cause any other HTTP response code to trigger an unhealthy status.
Creating the webhook notification policy
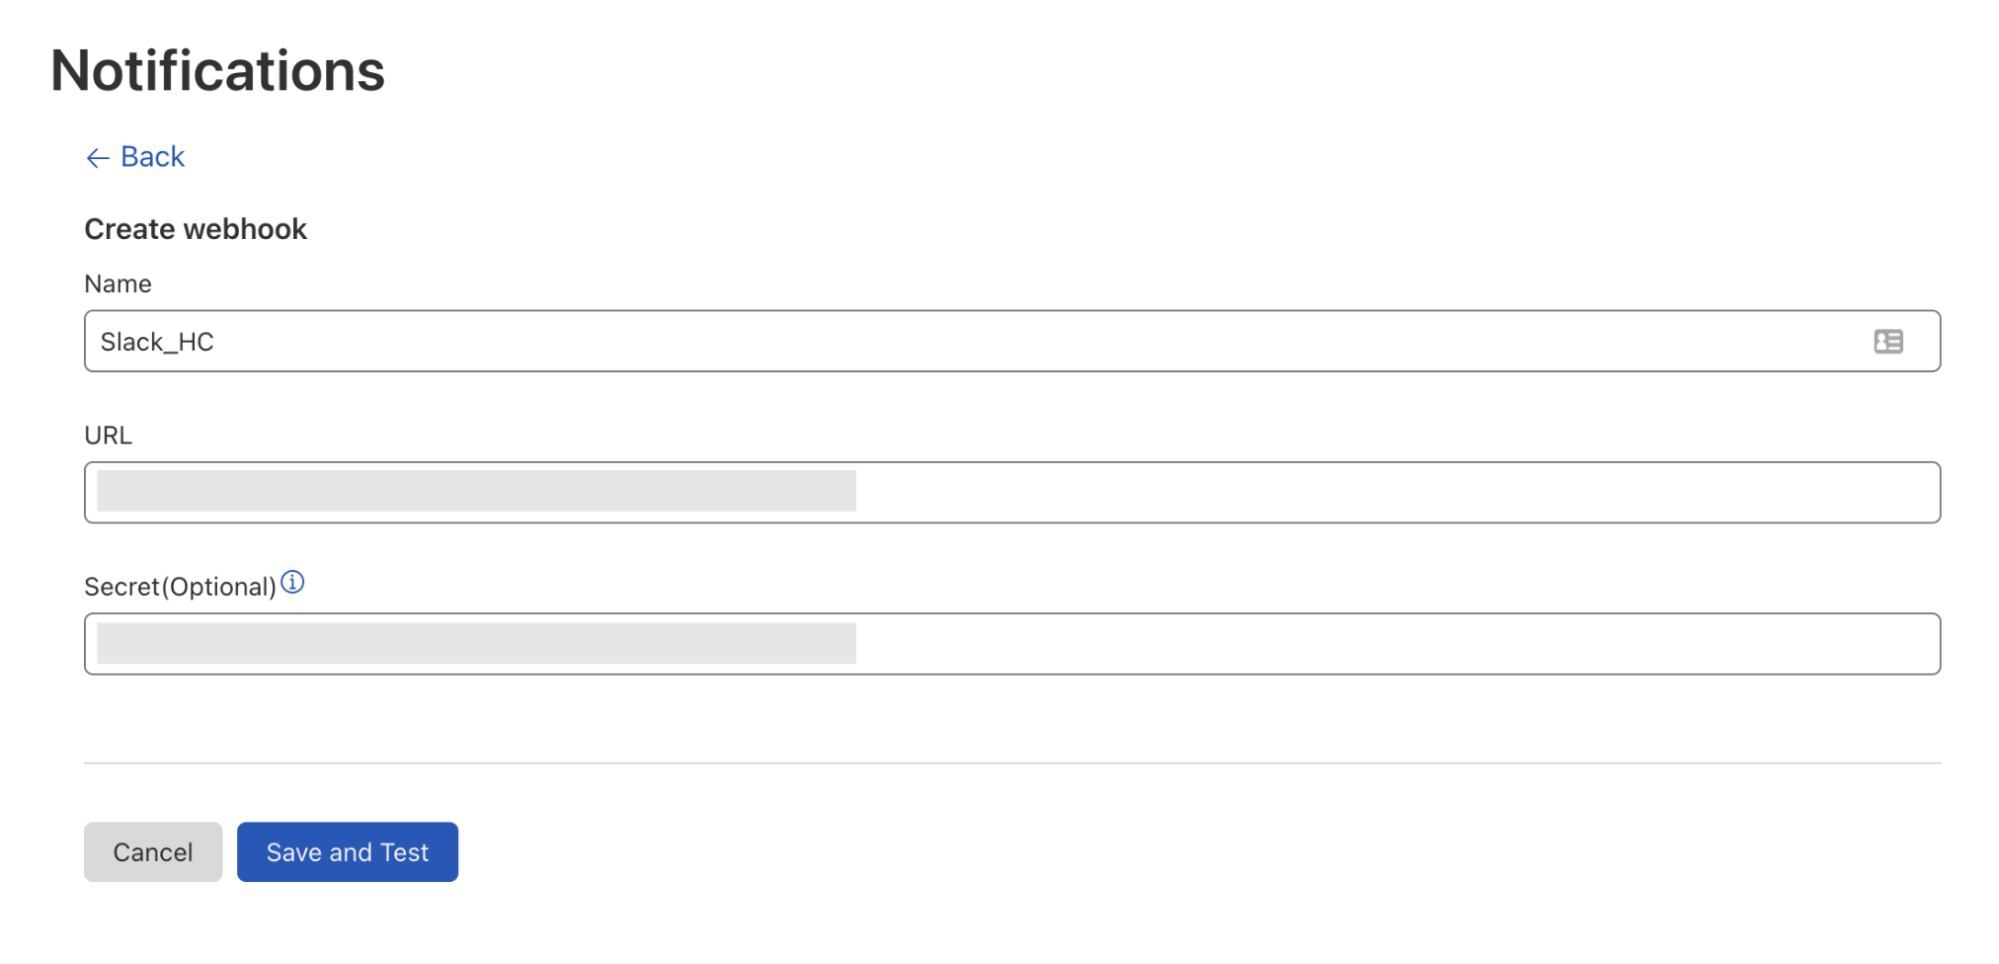
Once we’ve got our Health Check set up, we can create a webhook to link it to. Let’s start with a popular use case and send our Health Checks to a Slack channel. Before creating the webhook in the Cloudflare Notifications dashboard, we enable webhooks in our Slack workspace and retrieve the webhook URL of the Slack channel we want to send notifications to. Next, we navigate to our account’s Notifications tab to add the Slack webhook as a Destination, entering the name and URL of our webhook — the secret will populate automatically.
Webhook creation page with the following user input: Webhook name, Slack webhook url, and auto-populated Secret
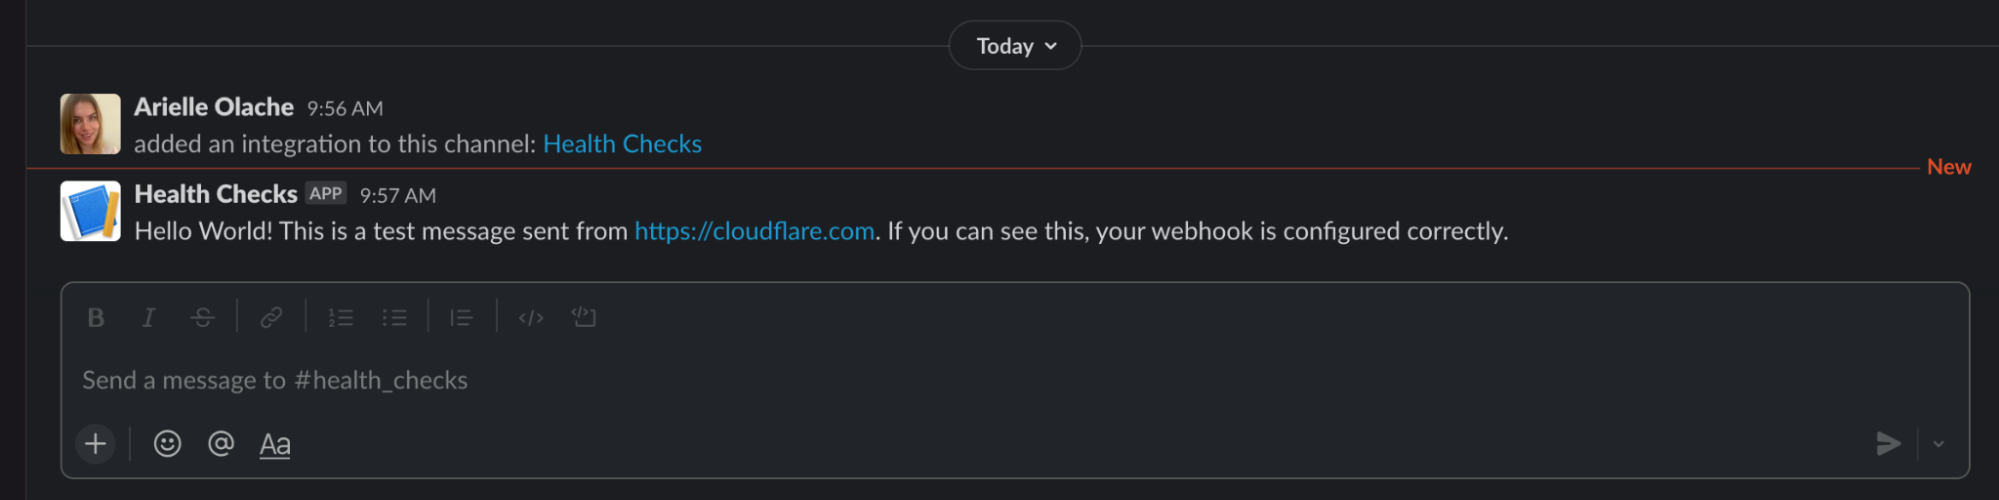
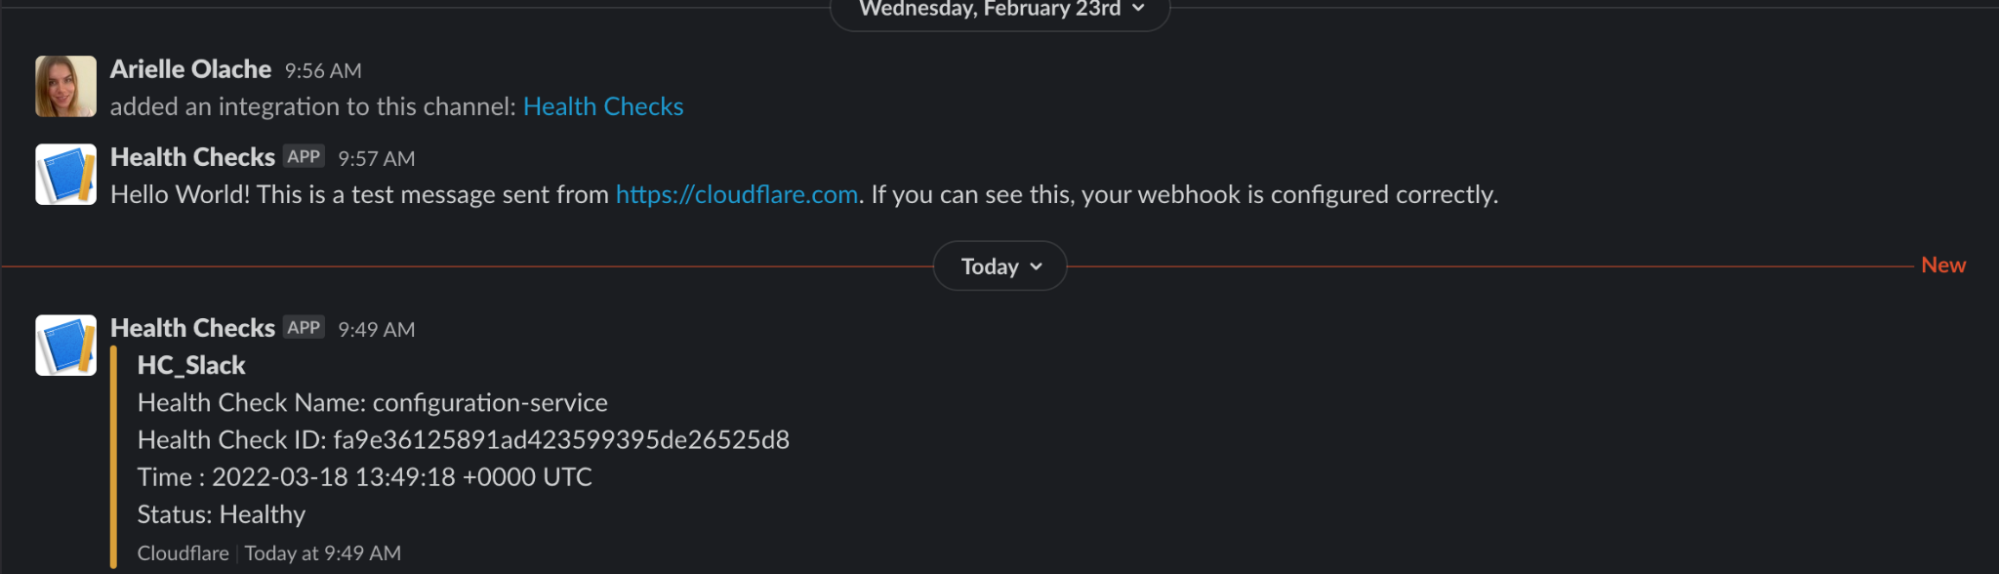
Once we hit Save and Test, we will receive a message in the designated Slack channel verifying that our webhook is working.
Message sent in Slack via the configured webhook, verifying the webhook is working
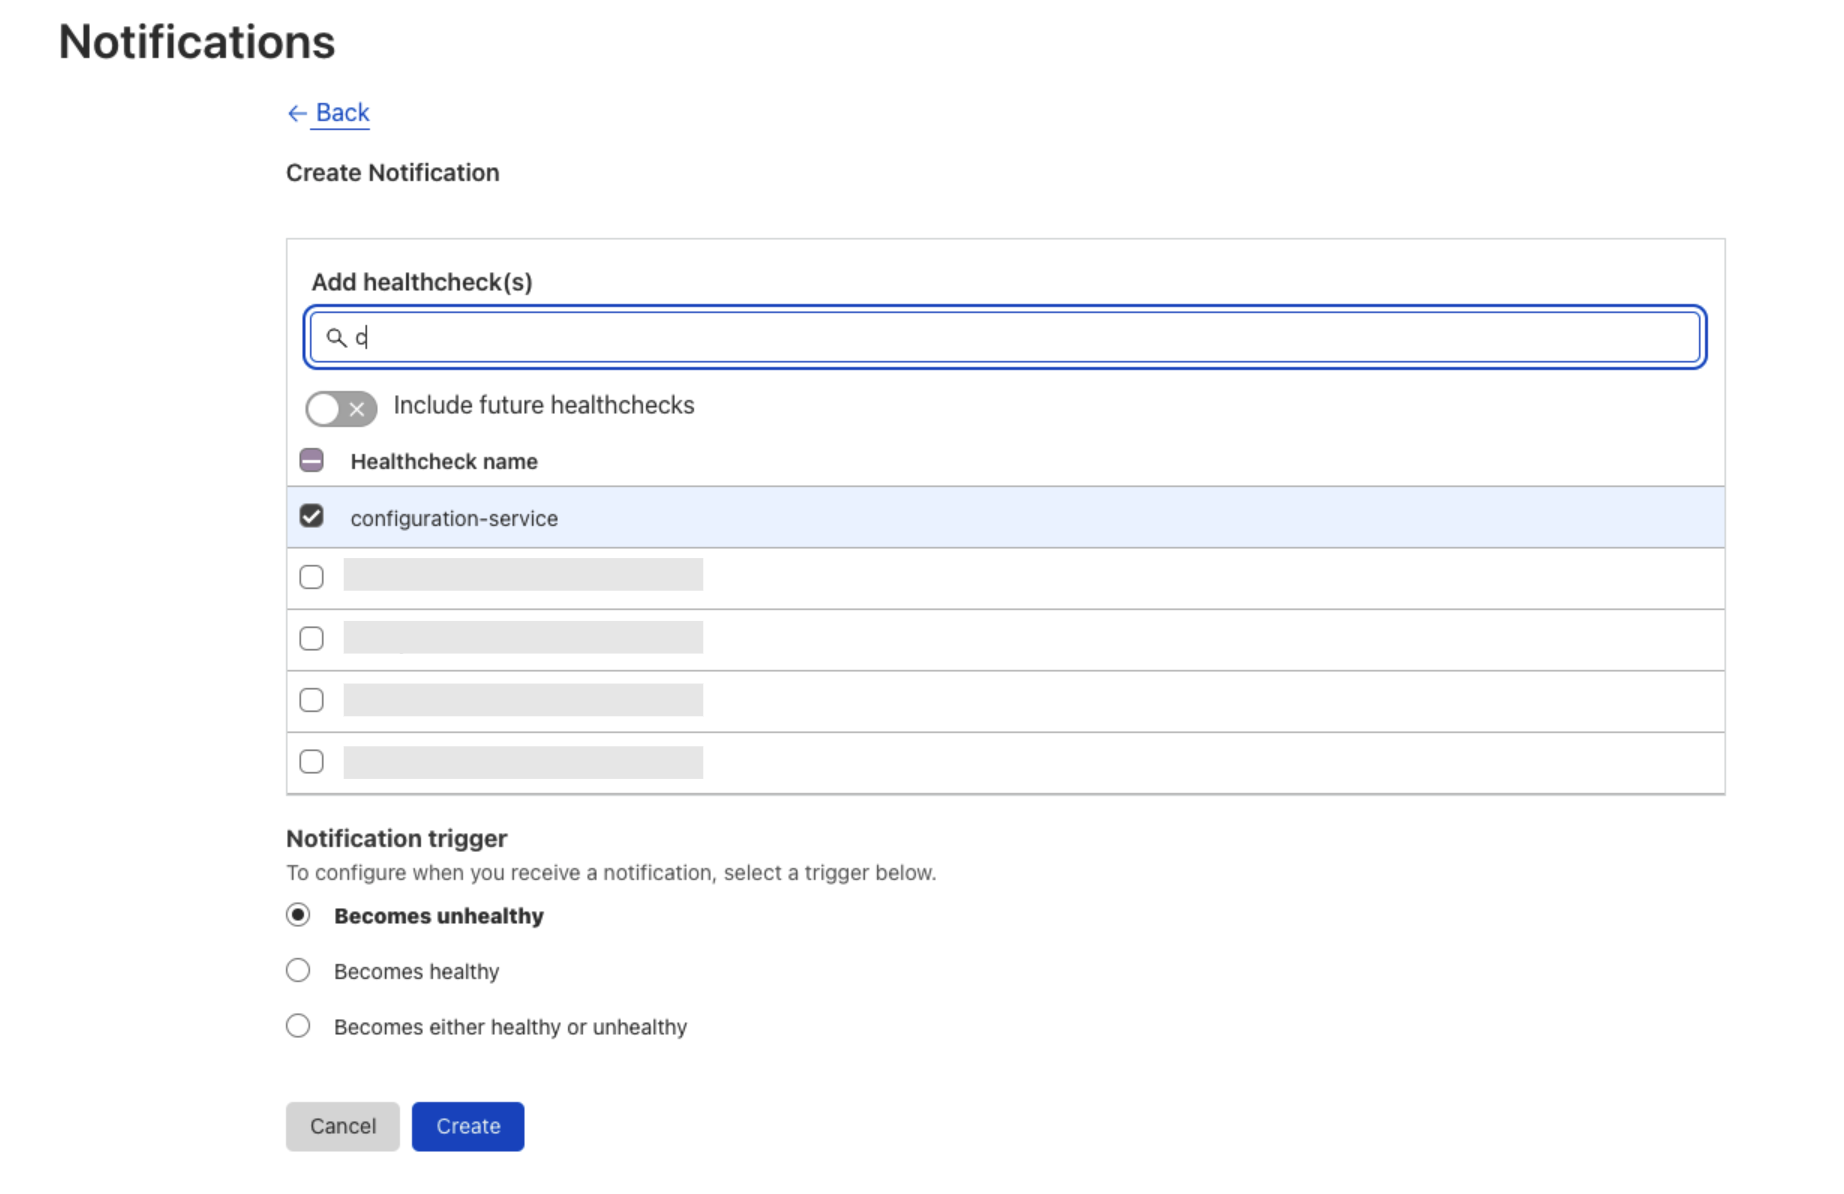
This webhook can now be used for any notification type available in the Notifications dashboard. To have a Health Check notification sent to this Slack channel, simply add a new Health Check notification from the Notifications dashboard, selecting the Health Check(s) to tie to this webhook and the Slack webhook we just created. And, voilà! Anytime our Health Check detects a response status code other than 200 or goes from unhealthy to healthy, this Slack channel will be notified.
Health Check notification sent to Slack, indicating our server is online and Healthy.
Create an Origin Health Status Page
Let’s walk through another powerful webhooks implementation with Health Checks. Using the Health Check we configured in our last example, let’s create a simple status page using Cloudflare Workers and Durable Objects that stores an origin’s health, updates it upon receiving a webhook request, and displays a status page to visitors.
Writing our worker You can find the code for this example in this GitHub repository, if you want to clone it and try it out.
We’ve got our Health Check set up, and we’re ready to write our worker and durable object. To get started, we first need to install wrangler, our CLI tool for testing and deploying more complex worker setups.
$ wrangler -V
wrangler 1.19.8
The examples in this blog were tested in this wrangler version.
Then, to speed up writing our worker, we will use a template to generate a project:
$ wrangler generate status-page [https://github.com/cloudflare/durable-objects-template](https://github.com/cloudflare/durable-objects-template)
$ cd status-page
The template has a Durable Object with the name Counter. We’ll rename that to Status, as it will store and update the current state of the page.
For that, we update wrangler.toml to use the correct name and type, and rename the Counter class in index.mjs.
name = "status-page"
# type = "javascript" is required to use the `[build]` section
type = "javascript"
workers_dev = true
account_id = "<Cloudflare account-id>"
route = ""
zone_id = ""
compatibility_date = "2022-02-11"

[build.upload]
# Upload the code directly from the src directory.
dir = "src"
# The "modules" upload format is required for all projects that export a Durable Objects class
format = "modules"
main = "./index.mjs"

[durable_objects]
bindings = [{name = "status", class_name = "Status"}]
Now, we’re ready to fill in our logic. We want to serve two different kinds of requests: one at /webhook that we will pass to the Notification system for updating the status, and another at / for a rendered status page.
First, let’s write the /webhook logic. We will receive a JSON object with a data and a text field. The `data` object contains the following fields:
time - The time when the Health Check status changed.
status - The status of the Health Check.
reason - The reason why the Health Check failed.
name - The Health Check name.
expected_codes - The status code the Health Check is expecting.
actual_code - The actual code received from the origin.
health_check_id - The id of the Health Check pushing the webhook notification.
For the status page we are using the Health Check name, status, and reason (the reason a Health Check became unhealthy, if any) fields. The text field contains a user-friendly version of this data, but it is more complex to parse.
 async handleWebhook(request) {
  const json = await request.json();

  // Ignore webhook test notification upon creation
  if ((json.text || "").includes("Hello World!")) return;

  let healthCheckName = json.data?.name || "Unknown"
  let details = {
    status: json.data?.status || "Unknown",
    failureReason: json.data?.reason || "Unknown"
  }
  await this.state.storage.put(healthCheckName, details)
 }
Now that we can store status changes, we can use our state to render a status page:
 async statusHTML() {
  const statuses = await this.state.storage.list()
  let statHTML = ""

  for(let[hcName, details] of statuses) {
   const status = details.status || ""
   const failureReason = details.failureReason || ""
   let hc = `<p>HealthCheckName: ${hcName} </p>
         <p>Status: ${status} </p>
         <p>FailureReason: ${failureReason}</p>
         <br/>`
   statHTML = statHTML + hc
  }

  return statHTML
 }

 async handleRoot() {
  // Default of healthy for before any notifications have been triggered
  const statuses = await this.statusHTML()

  return new Response(`
     <!DOCTYPE html>
     <head>
      <title>Status Page</title>
      <style>
       body {
        font-family: Courier New;
        padding-left: 10vw;
        padding-right: 10vw;
        padding-top: 5vh;
       }
      </style>
     </head>
     <body>
       <h1>Status of Production Servers</h1>
       <p>${statuses}</p>
     </body>
     `,
   {
    headers: {
     'Content-Type': "text/html"
    }
   })
 }
Then, we can direct requests to our two paths while also returning an error for invalid paths within our durable object with a fetch method:
async fetch(request) {
  const url = new URL(request.url)
  switch (url.pathname) {
   case "/webhook":
    await this.handleWebhook(request);
    return new Response()
   case "/":
    return await this.handleRoot();
   default:
    return new Response('Path not found', { status: 404 })
  }
 }
Finally, we can call that fetch method from our worker, allowing the external world to access our durable object.
export default {
 async fetch(request, env) {
  return await handleRequest(request, env);
 }
}
async function handleRequest(request, env) {
 let id = env.status.idFromName("A");
 let obj = env.status.get(id);

 return await obj.fetch(request);
}
Testing and deploying our worker
When we’re ready to deploy, it’s as simple as running the following command:
$ wrangler publish --new-class Status
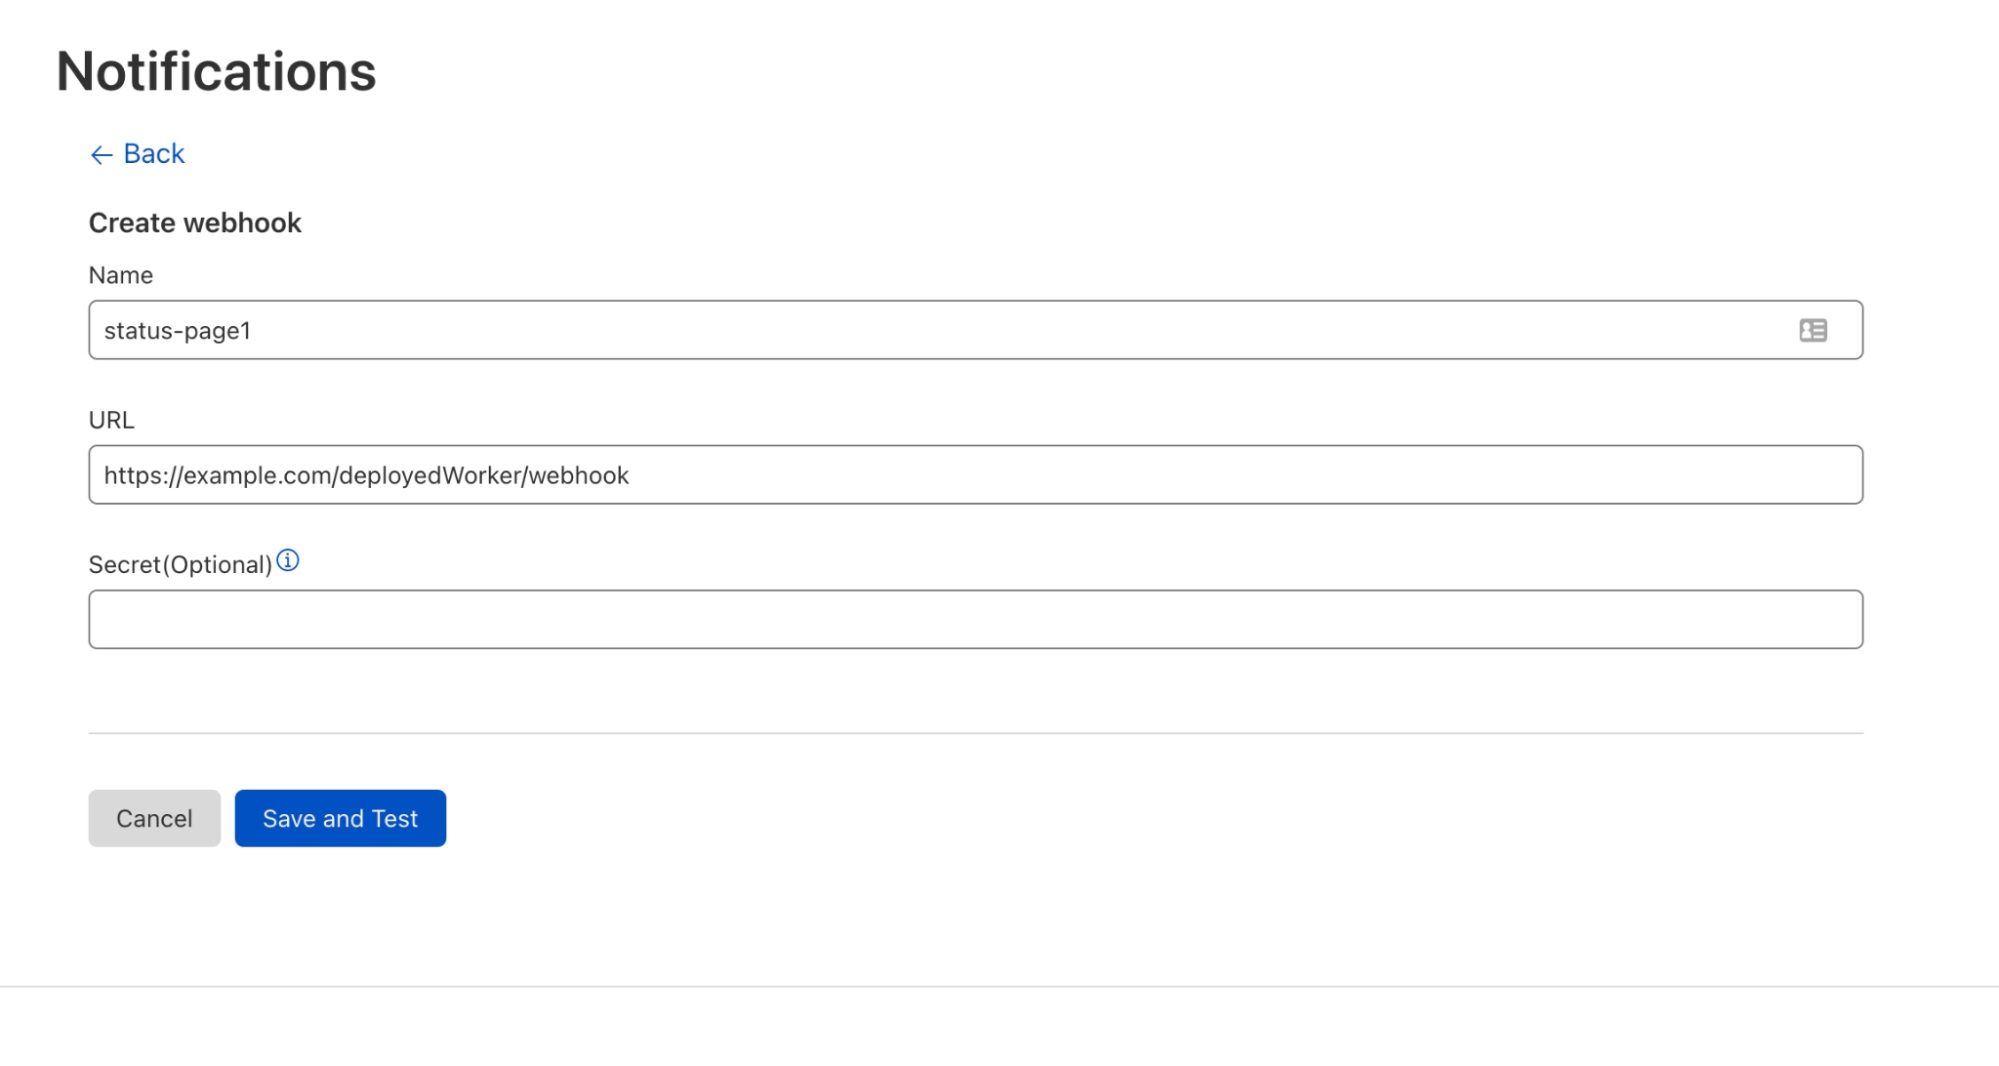
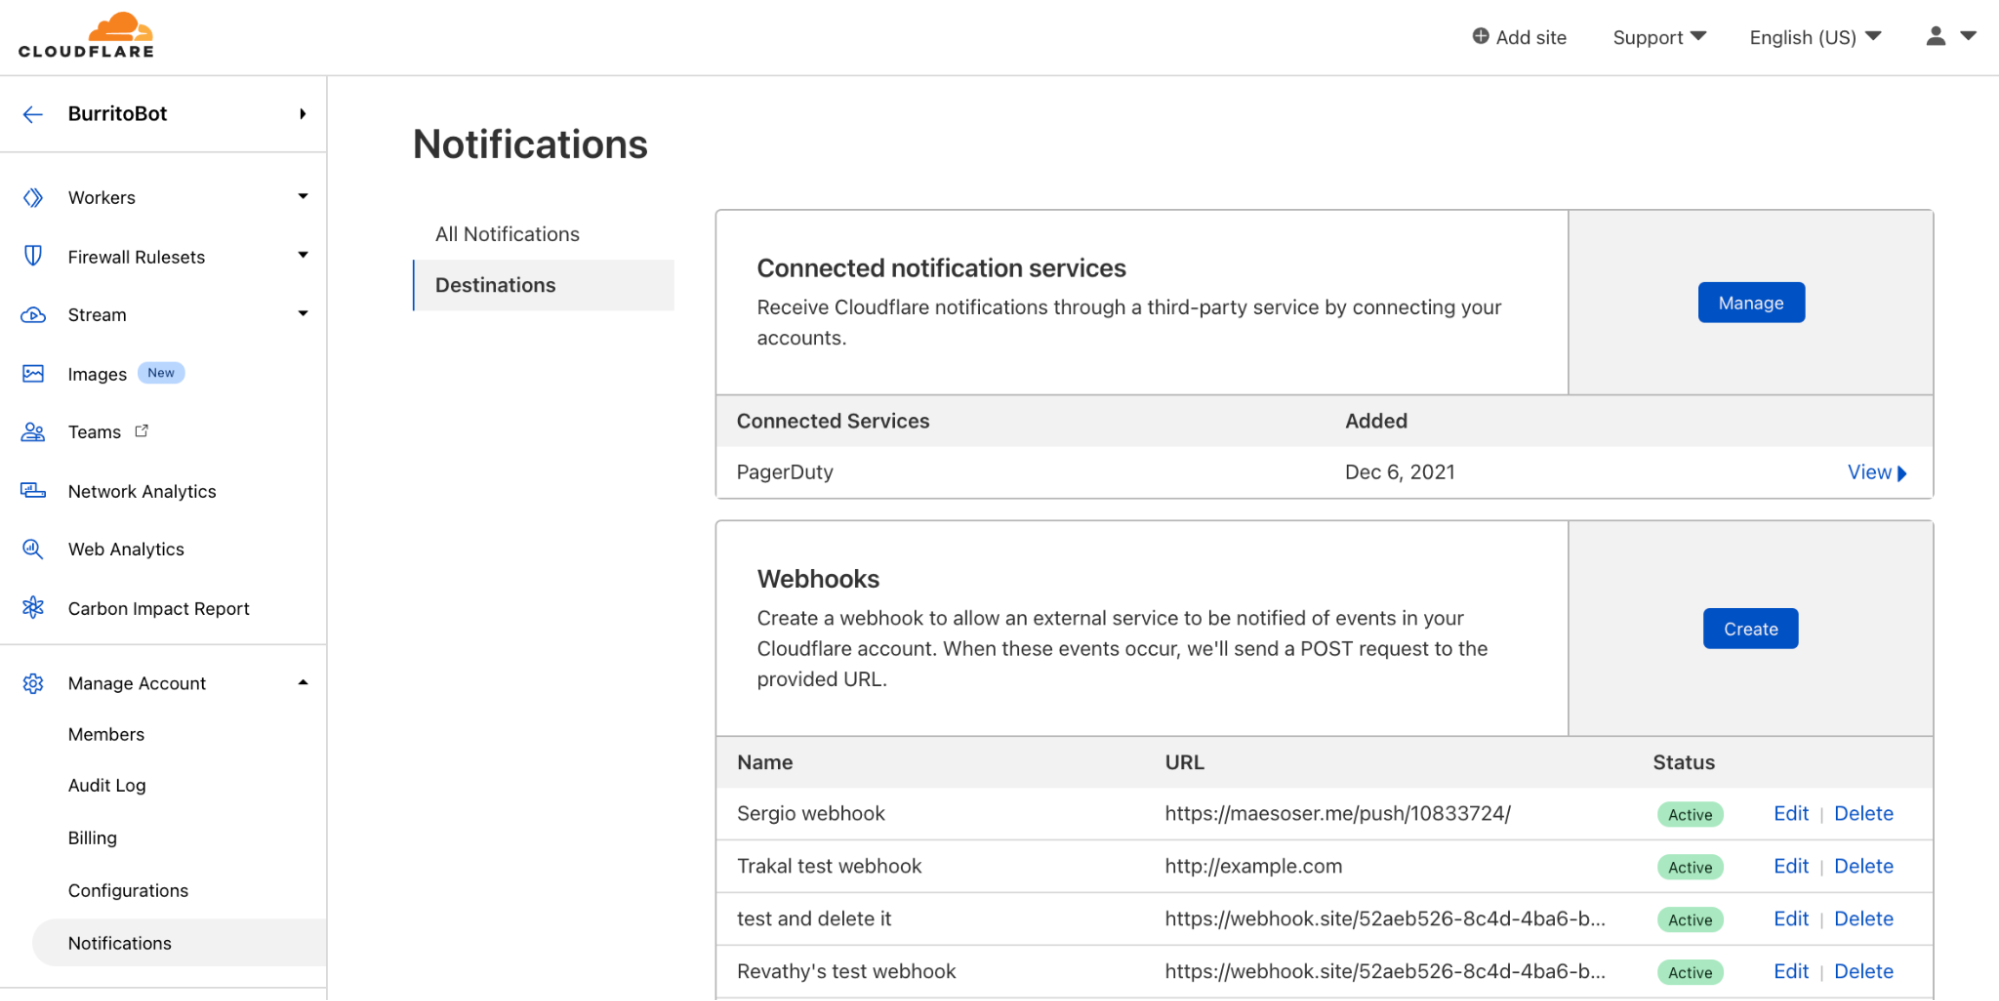
To test the change, we create a webhook pointing to the path the worker was deployed to. On the Cloudflare account dashboard, navigate to Notifications > Destinations, and create a webhook.
Webhook creation page, with the following user input: name of webhook, destination URL, and optional secret is left blank.
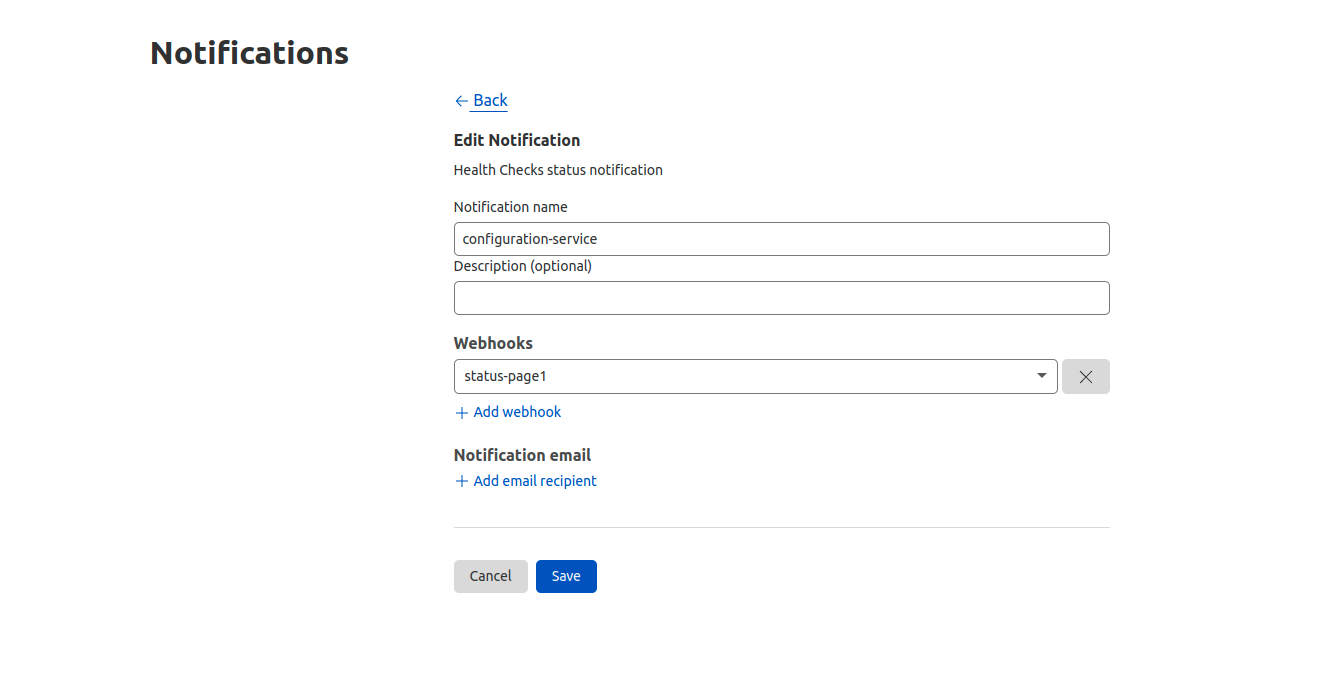
Then, while still in the Notifications dashboard, create a Health Check notification tied to the status page webhook and Health Check.
Notification creation page, with the following user input: Notification name and the Webhook created in the previous step added.
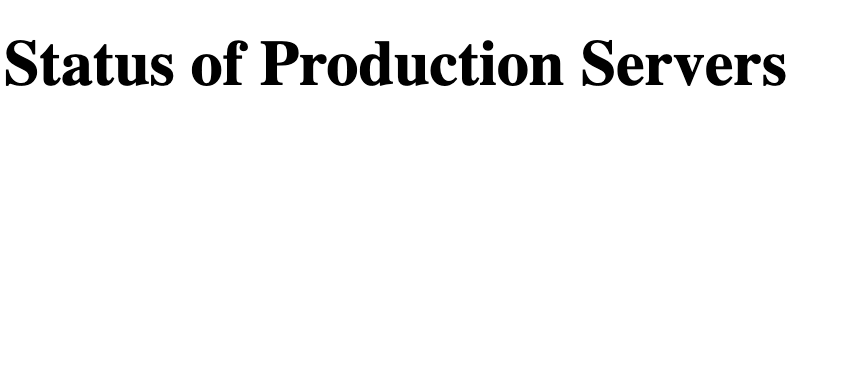
Before getting any updates the status-page worker should look like this:
Status page without updates reads: “Status of Production Servers”
Webhooks get triggered when the Health Check status changes. To simulate the change of Health Check status we take the origin down, which will send an update to the worker through the webhook. This causes the status page to get updated.
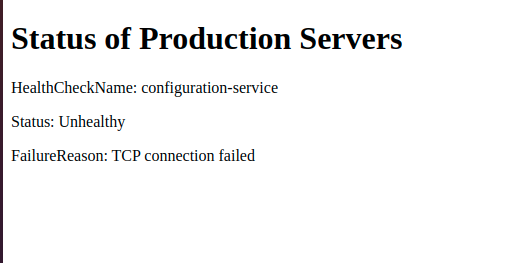
Status page showing the name of the Health Check as “configuration-service”, Status as “Unhealthy”, and the failure reason as “TCP connection failed”.
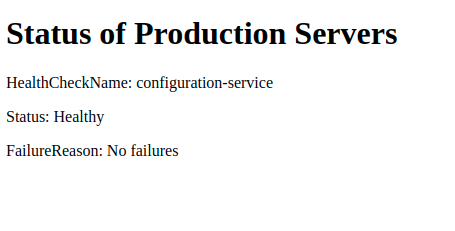
Next, we simulate a return to normal by changing the Health Check expected status back to 200. This will make the status page show the origin as healthy.
Status page showing the name of the Health Check as “configuration-service”, Status as “Healthy”, and the failure reason as “No failures”.
If you add more Health Checks and tie them to the webhook durable object, you will see the data being added to your account.
Authenticating webhook requests
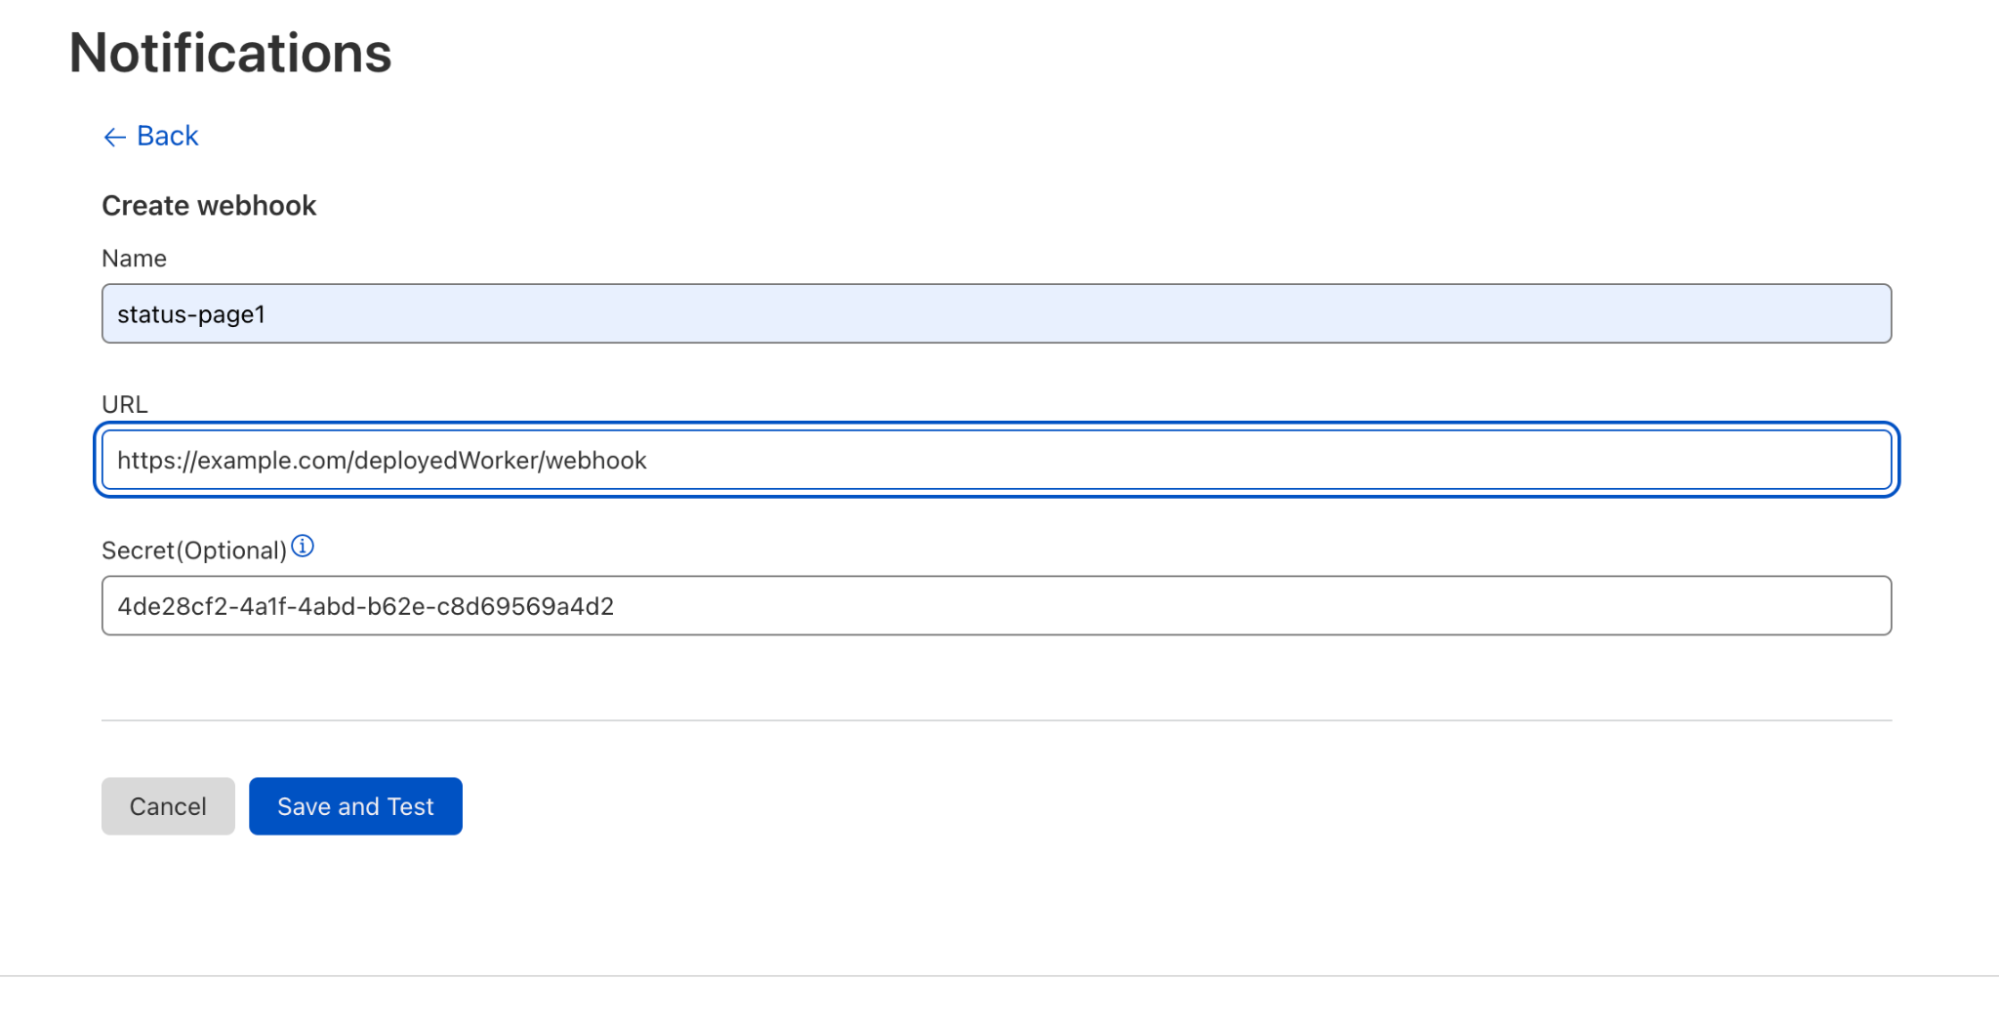
We already have a working status page! However, anyone possessing the webhook URL would be able to forge a request, pushing arbitrary data to an externally-visible dashboard. Obviously, that’s not ideal. Thankfully, webhooks provide the ability to authenticate these requests by supplying a secret. Let’s create a new webhook that will provide a secret on every request. We can generate a secret by generating a pseudo-random UUID with Python:
Webhook creation page, with the following user input: name of webhook, destination URL, and now with a secret added.
We also want to provide this secret to our worker. Wrangler has a command that lets us save the secret.
$ wrangler secret put WEBHOOK_SECRET
Enter the secret text you'd like assigned to the variable WEBHOOK_SECRET on the script named status-page:
4de28cf2-4a1f-4abd-b62e-c8d69569a4d2
🌀 Creating the secret for script name status-page
✨ Success! Uploaded secret WEBHOOK_SECRET.
Wrangler will prompt us for the secret, then provide it to our worker. Now we can check for the token upon every webhook notification, as the secret is provided by the header cf-webhook-auth. By checking the header’s value against our secret, we can authenticate incoming webhook notifications as genuine. To do that, we modify handleWebhook:
 async handleWebhook(request) {
  // ensure the request we receive is from the Webhook destination we created
  // by examining its secret value, and rejecting it if it's incorrect
  if((request.headers.get('cf-webhook-auth') != this.env.WEBHOOK_SECRET) {
    return
   }
  ...old code here
 }
This origin health status page is just one example of the versatility of webhooks, which allowed us to leverage Cloudflare Workers and Durable Objects to support a custom Health Checks application. From highly custom use cases such as this to more straightforward, out-of-the-box solutions, pairing webhooks and Health Checks empowers users to respond to critical origin health updates effectively by delivering that information where it will be most impactful.
Migrating to the Notifications Dashboard
The Notifications dashboard is now the centralized location for most Cloudflare services. In the interest of consistency and streamlined administration, we will soon be limiting Health Checks notification setup to the Notifications dashboard. Many existing Health Checks customers have emails configured via our legacy alerting system. Over the next three months, we will support the legacy system, giving customers time to transition their Health Checks notifications to the Notifications dashboard. Customers can expect the following timeline for the phasing out of existing Health Checks notifications:
For now, customers subscribed to legacy emails will continue to receive them unchanged, so any parsing infrastructure will still work. From within a Health Check, you will see two options for configuring notifications–the legacy format and a deep link to the Notifications dashboard.
On May 24, 2022, we will disable the legacy method for the configuration of email notifications from the Health Checks dashboard.
On June 28, 2022, we will stop sending legacy emails, and adding new emails at the /healthchecks endpoint will no longer send email notifications.
We strongly encourage all our users to migrate existing Health Checks notifications to the Notifications dashboard within this timeframe to avoid lapses in alerts.
We’re excited to announce that customers using our Free plan can now get real-time alerts about HTTP DDoS attacks that were automatically detected and mitigated by Cloudflare. The real-time DDoS alerts were originally announced over a year ago but were made available to customers on the Pro plan or higher. This announcement extends the DDoS alerts feature to Free plan users. You can read the original announcement blog post here.
What is a DDoS attack?
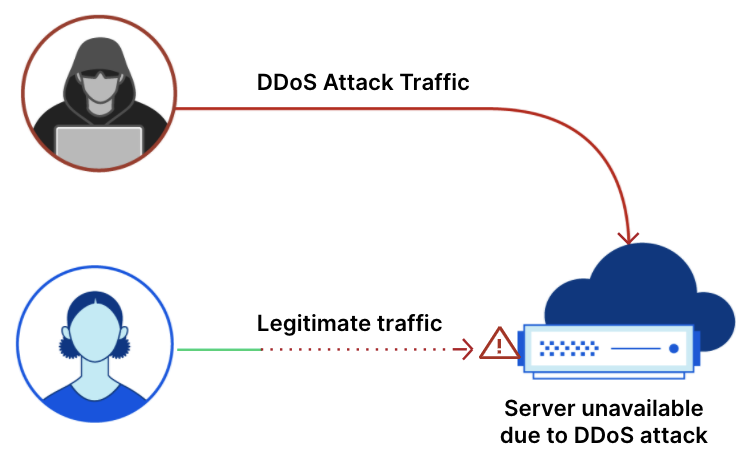
A Distributed Denial of Service (DDoS) attack is a cyber-attack that attempts to disrupt your online business. Whether your business relies on VoIP servers, UDP-based gaming servers, or HTTP servers, DDoS attacks can be used to disrupt any type of Internet property, server, or network.
In this blog post, we’ll focus on DDoS attacks that target HTTP servers. Whether your HTTP server is powering a mobile app, an eCommerce website, an API gateway, or any other HTTP application, if an attacker sends you more requests than it can handle, your server won’t be able to serve your real users. A flood of requests can cause service disruptions or even take your entire server offline. DDoS attacks can have real-world consequences such as a blow to your revenue and reputation.
How Cloudflare detects and mitigates DDoS attacks
Protecting your server against DDoS attacks requires two main capabilities:
The bandwidth to absorb both your users’ requests and the attack requests
The ability to differentiate between your users’ requests and the attack requests
Using our home-grown systems, we do just that, regardless of the size, frequency and duration of the attacks. All Cloudflare customers, including those using the Free plan, are protected by our unmetered DDoS mitigation commitment.
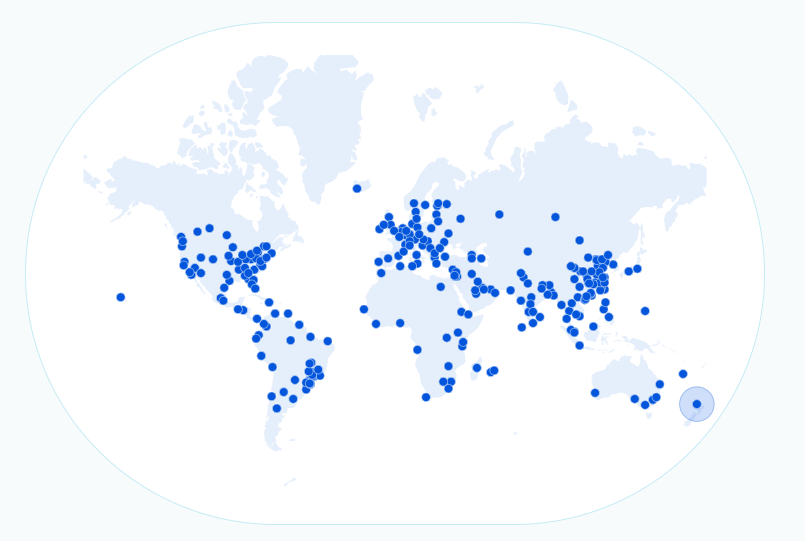
To protect against DDoS attacks, first, we route your traffic to our network of data centers. Our network spans more than 250 cities in over 100 countries around the world. Its capacity is over 100 Tbps — fifty times larger than the largest attack we’ve ever seen. Our bandwidth is more than enough to absorb both your users’ traffic and attack traffic.
Cloudflare’s global network
Cloudflare’s global network
Second, once your traffic reaches our data centers, it goes through state-of-the-art analysis mechanisms that constantly scan for DDoS attacks. Once an attack is detected, a real-time mitigation rule is automatically generated to surgically mitigate the attack requests based on the attack pattern, whilst leaving your users’ requests untouched. Using the HTTP DDoS Managed Ruleset you can customize the settings of the mitigation system to tailor it to your needs and specific traffic patterns.
Not sure what to do? That’s ok. For the most part, you won’t need to do anything and our system will automatically keep your servers protected. You can read more about it in our Get Started guide or in the original blog post. If you’re interested, you can also read more about how our mitigation system works in this technical blog post: A deep-dive into Cloudflare’s autonomous edge DDoS protection
Configuring a DDoS alert
Once our system detects and mitigates a DDoS attack, you’ll receive a real-time alert. To receive an alert, make sure you, first, configure a notification policy by following these steps:
Cloudflare’s mission is to help build a better Internet, and it guides everything we do. As part of this mission, we believe that a better Internet is one where enterprise-grade DDoS protection is available for everyone, not just bigger organizations.
Furthermore, we’ve also made our DDoS Managed Ruleset available for everyone to make sure that even non-paying customers can tailor and optimize their DDoS protection settings. Taking a step further, we want all of our users to be able to react as fast as possible when needed. This is why we’re providing real-time alerts for free. Knowledge is power, and notifying our users of attacks in real-time empowers them to ensure their website is safe, available, and performant.
Back in 2019, we blogged about our brand new Notification center as a centralized hub for configuring notifications on your account. Since then, we’ve talked a lot about new types of notifications you can set up, but not as much about updates to the notification platform itself. So what’s new with Notifications?
Why we care about notifications
We know that notifications are incredibly important to our customers. Cloudflare sits in between your Internet property and the rest of the world. When something goes wrong, you want to know right away because it could have a huge impact on your end users. However, you don’t want to have to sit on the Cloudflare Dashboard all day, pressing refresh on analytics pages over and over just to make sure that you don’t miss anything important. This is where Notifications come in. Instead of requiring you to actively monitor your Internet properties, you want Cloudflare to be able to directly inform you when something might be going wrong.
So we have all of these super great notifications, but how do we actually inform you of an event? The classic answer is “we email you.” All of our customers have the ability to configure notifications to send to the email addresses of their choosing.
However, email isn’t always the optimal choice. What happens when an email gets sent to spam, or filtered out into another folder that you rarely check? What if you’re a person who never cleans out their inbox and has four thousand unread emails that can drown out new important emails that come in? You want a way for notifications to go directly to the messaging platform that you check the most, whether that’s Slack or Microsoft Teams or Discord or something else entirely. For customers on our Professional, Business, and Enterprise plans, this is where webhooks come in.
Webhooks are incredibly powerful! They’re a type of API with a simple, standardized behavior. They allow one service (Cloudflare) to send events directly to another service. This destination service can be nearly anything: messaging platforms, data management systems, workflow automation systems, or even your own internal APIs.
While Cloudflare has had first class support for webhooking into Slack, Microsoft Teams, Google Chat, and customer’s own APIs for a while, we’ve recently added support for DataDog, Discord, OpsGenie, and Splunk as well. You can read about how to set up each of those types of webhooks in our Cloudflare Development Docs.
Because webhooks are so versatile, more and more customers are using them! The number of webhooks configured within Cloudflare’s notification system doubles, on average, every three months. Customers can configure webhooks in the Notifications tab in the dashboard.
Those who forget history are doomed to repeat it
Webhooks are cool, but they still leave room for error. What happens when you receive a notification but accidentally delete it? Or when someone new starts at your company, but you forget to update the notification settings to send to the new employee?
Before now, Cloudflare notifications were entirely point in time. We sent you a notification via your preferred method, and we no longer had any visibility into that notification. If that notification gets lost on your end, we don’t have any way to help recover the information it contained.
Notification history fixes that exact issue. Users are able to see a log of the notifications that were sent, when they were sent, and who they were sent to. Customers on Free, Professional, or Business plans are able to see notification history for the past 30 days. Customers on Enterprise plans are able to see notification history for the past 90 days.
Right now, notification history is only available via API, but stay tuned for updates about viewing directly in the Cloudflare Dashboard!
Our core application security features such as the WAF, firewall rules and rate limiting help keep millions of Internet properties safe. They all do so quietly without generating any notifications when attack traffic is blocked, as our focus has always been to stop malicious requests first and foremost.
Today, we are happy to announce a big step in that direction. Business and Enterprise customers can now set up proactive alerts whenever we observe a spike in firewall related events indicating a likely ongoing attack.
Alerts can be configured via email, PagerDuty or webhooks, allowing for flexible integrations across many systems.
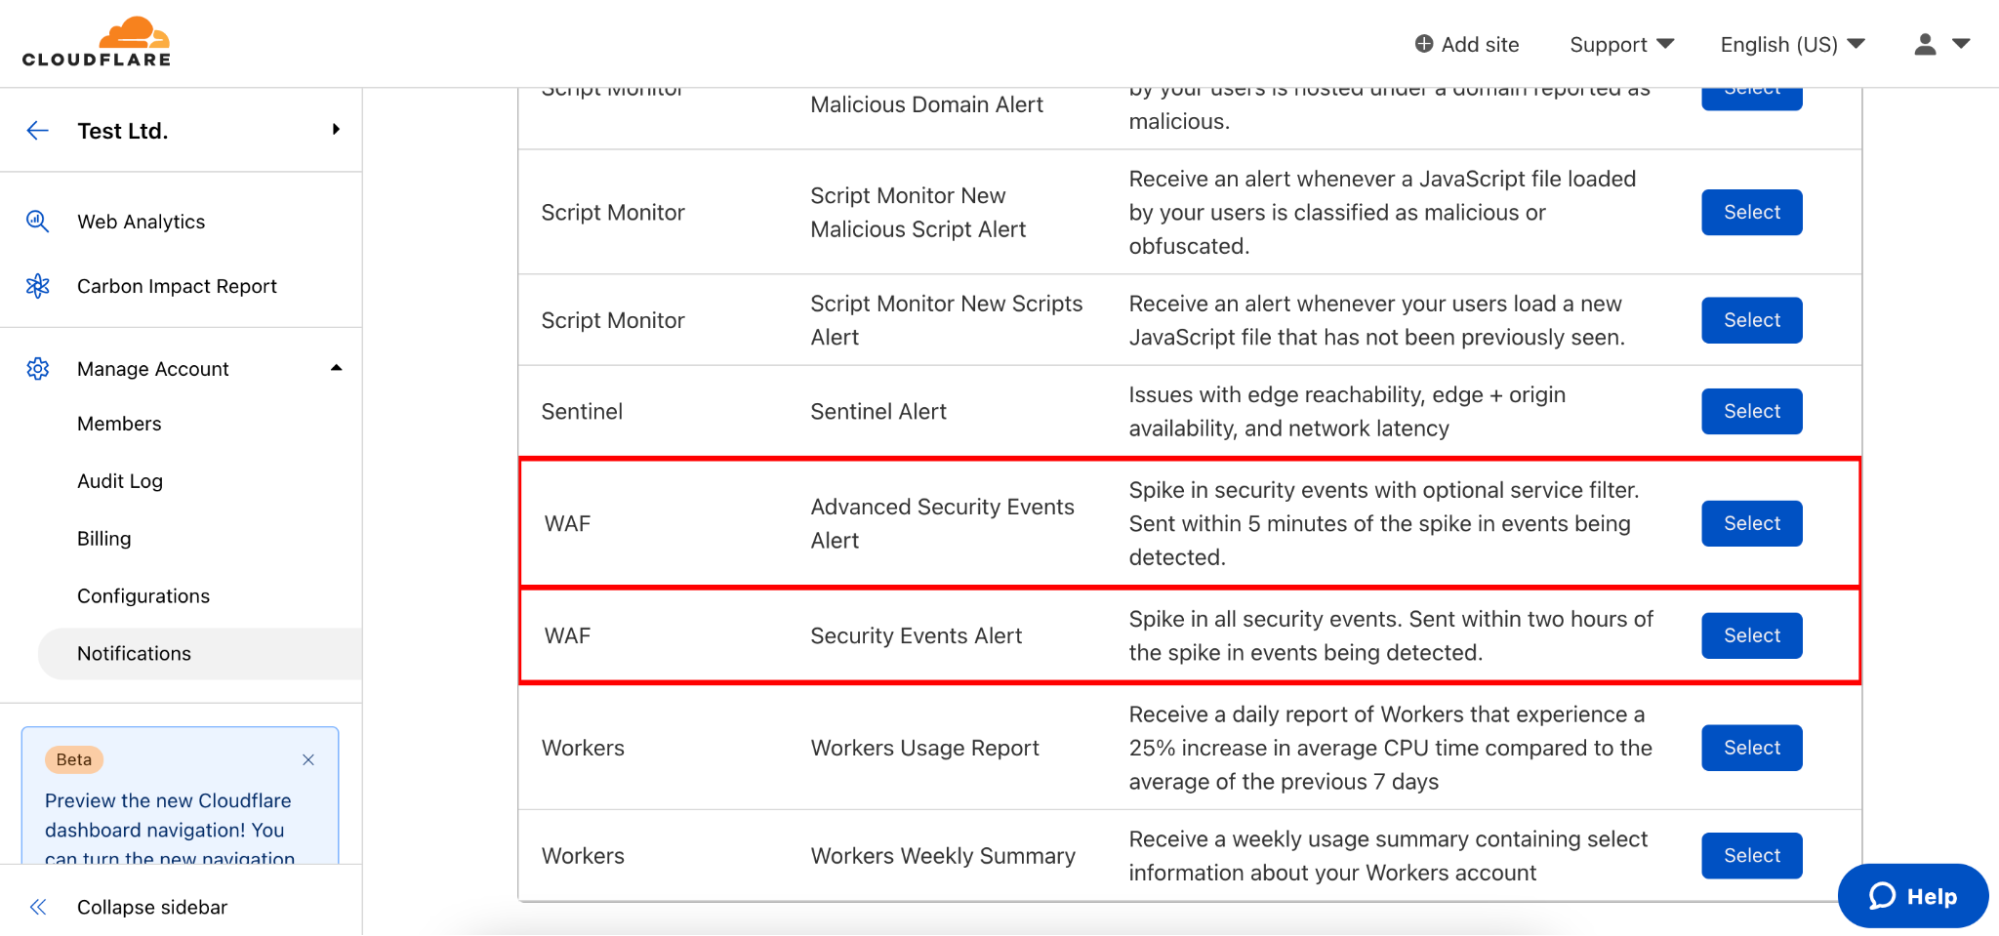
Two new notification types have been added to the platform.
Security Events Alert
This notification can be set up on Business and Enterprise zones, and will alert on any spike of firewall related events across all products and services. You will receive the alert within two hours of the attack being mitigated.
Advanced Security Events Alert
This notification can be set up on Enterprise zones only. It allows you to filter on the exact security service you are interested in monitoring and different notifications can be set up for different services as necessary. The alert will fire within five minutes of the attack being mitigated.
Alerting on Application Security Anomalies
We’ve previously blogged about how accurately calculating anomalies in time series data sets is hard. Simple threshold alerting — “notify me if there are more than X events” — doesn’t work well. It takes a lot of work to tune the specific thresholds to be accurate, and even then you’re still likely to end up with false positives or missed events.
For Origin Error Rate notifications, we leaned on the methodology outlined in the Google SRE Handbook for alerting based on Service Level Objectives (SLOs). However, SLO alerting assumes that there is an established baseline. We know exactly what percentage of responses from your origin are “allowed” to be errors before something is definitely wrong. We don’t know what that percentage is for Firewall events. For example, Internet properties with many Firewall rules are more likely to have more Firewall events than Internet properties with few Firewall rules.
Instead of using SLO based alerting for Security Event notifications, we’re using Z-score calculations. The z-score methodology calculates how many standard deviations away from the mean a certain data point is. For Security Event notifications we can take the mean number of Firewall events for each distinct Internet property as the effective “baseline”, and compare the current number of Firewall events to see if there is a significant spike.
In this first iteration, a z-score threshold of 3.5 has been configured in the system and will be adjusted based on customer feedback. You can read more about the system in our WAF developer docs.
Getting started with Application Security Event notifications
To configure these notifications, navigate to the Notifications tab of the dashboard and click “Add”. Select Security Events Alert or Advanced Security Events Alert.
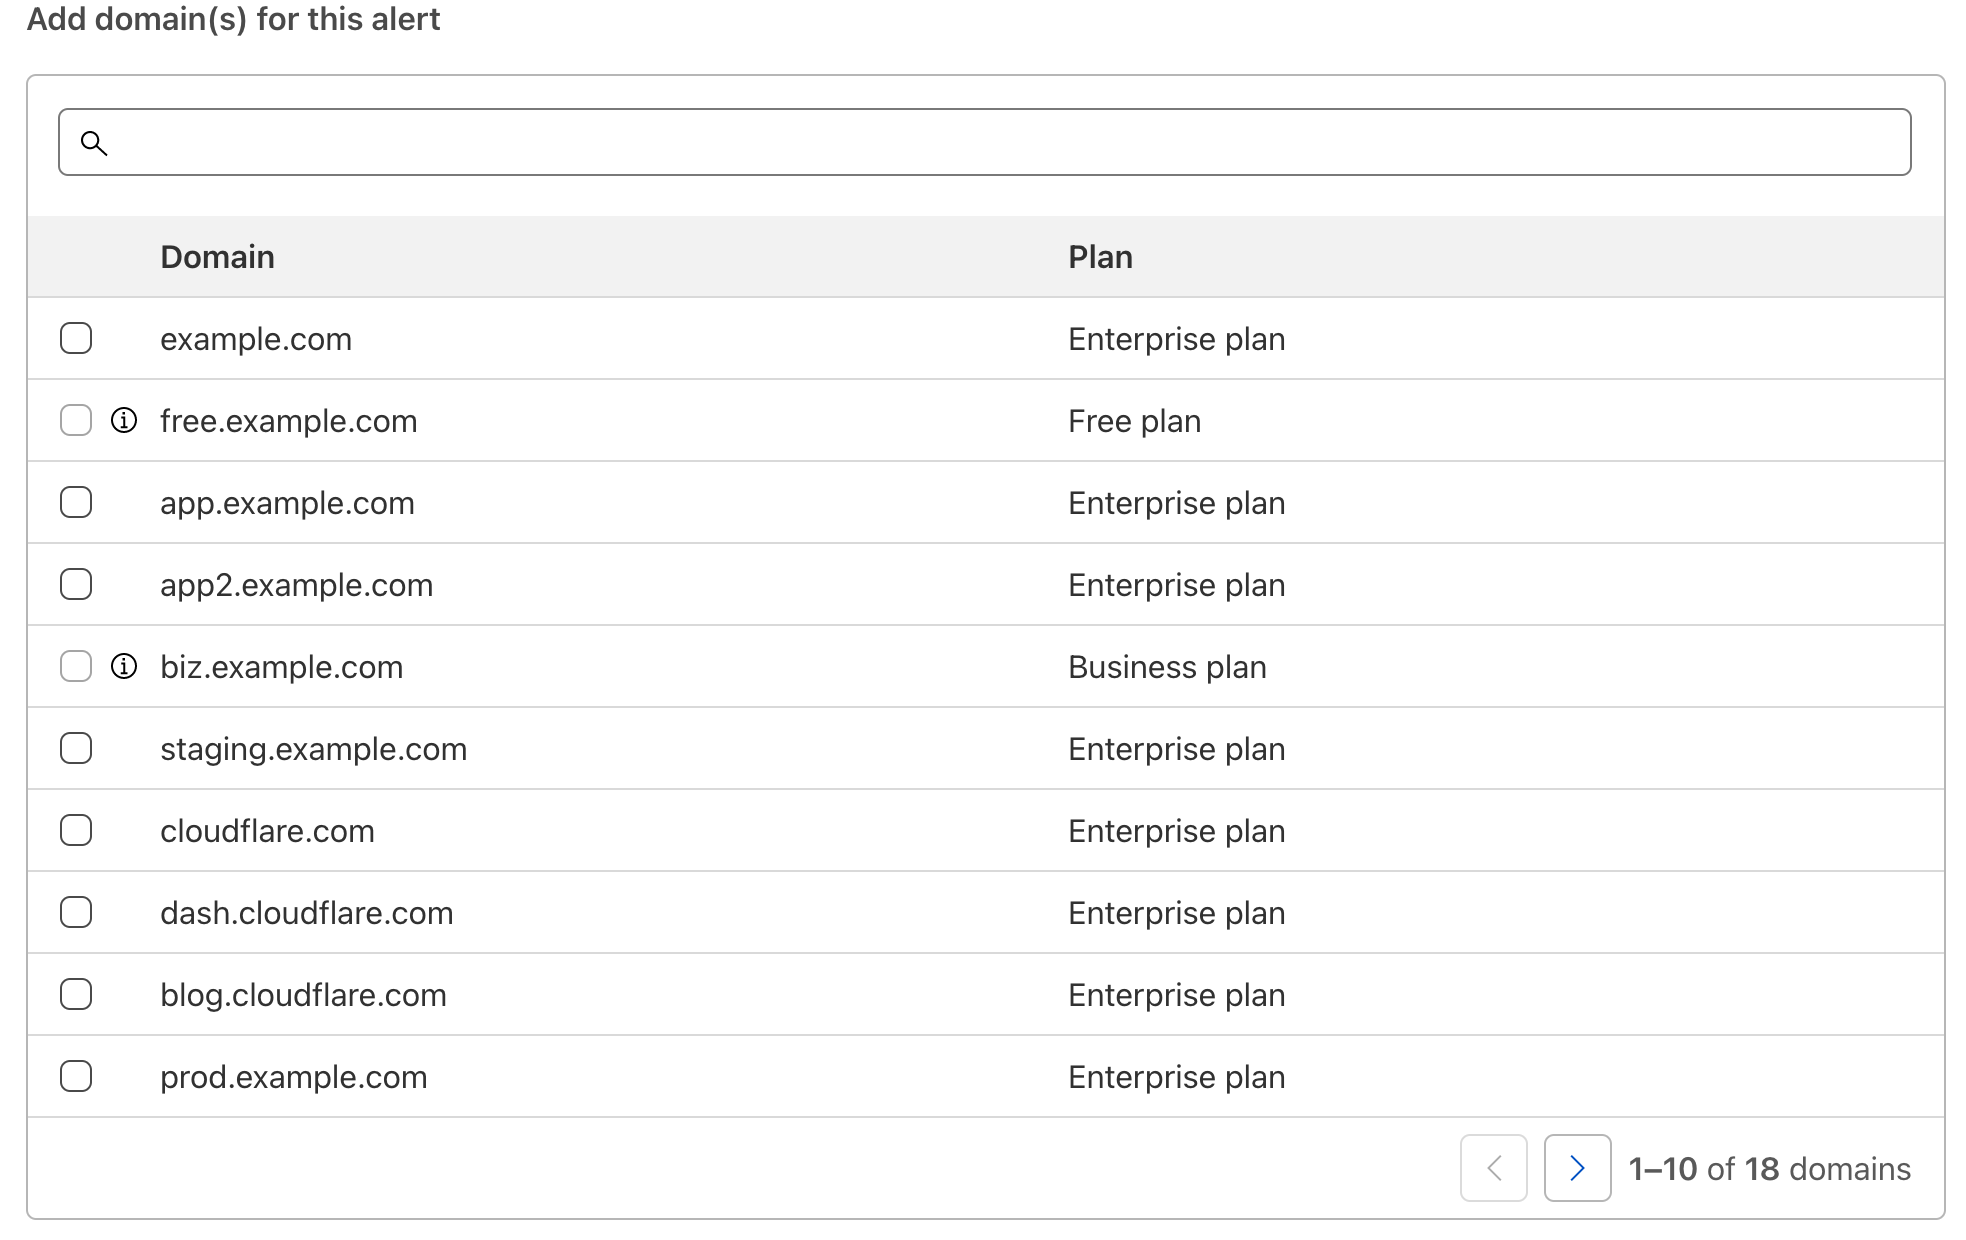
As with all Cloudflare notifications, you’re able to name and describe your notification, and choose how you want to be notified. From there, you can select which domains you want to monitor.
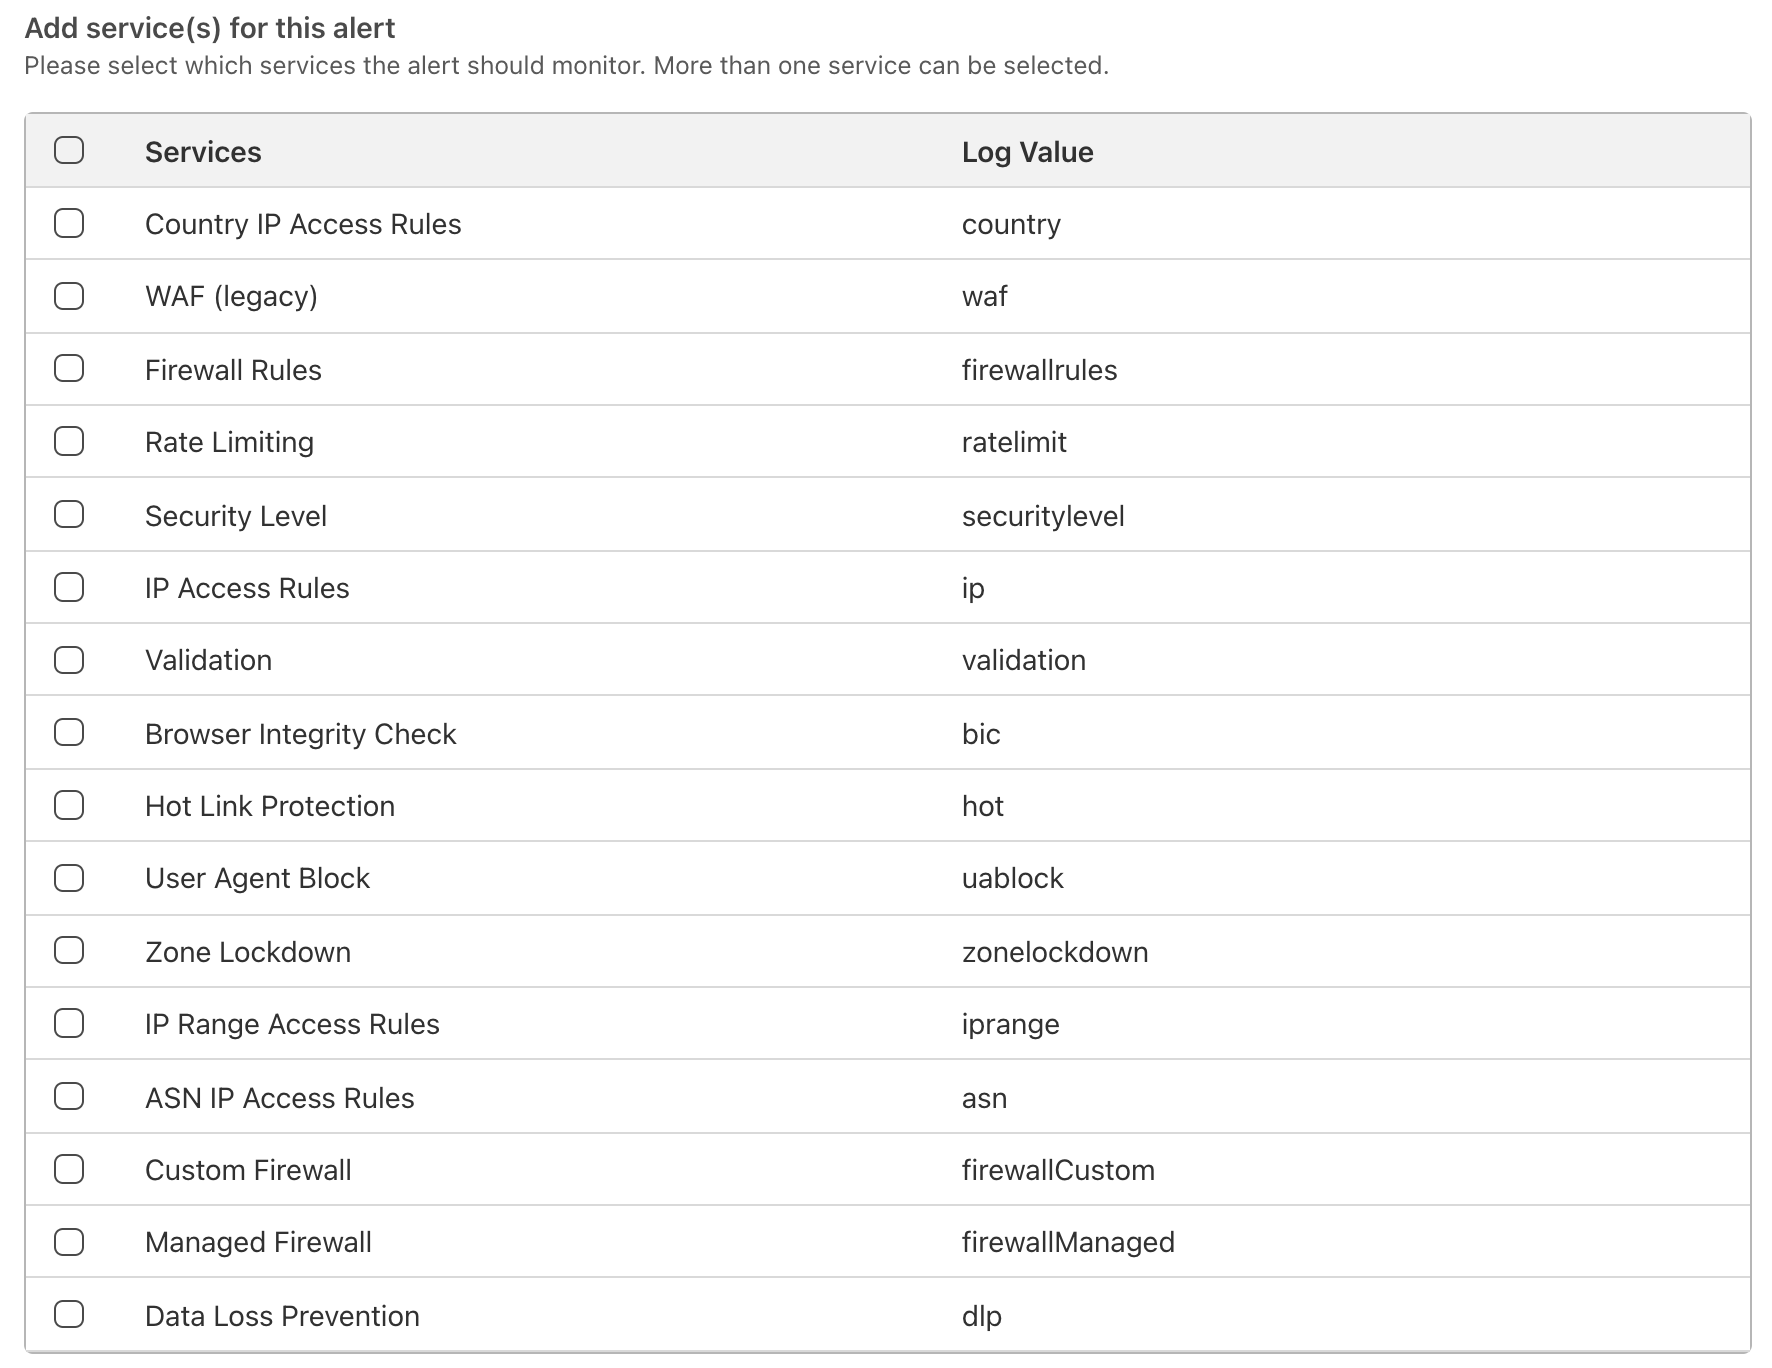
For Advanced Security Event notifications, you can also select which services the notification should monitor. The log value in Firewall Event logs for each relevant service is also displayed in the event you are integrating directly with Cloudflare logs and wish to filter relevant events in your existing SIEMs.
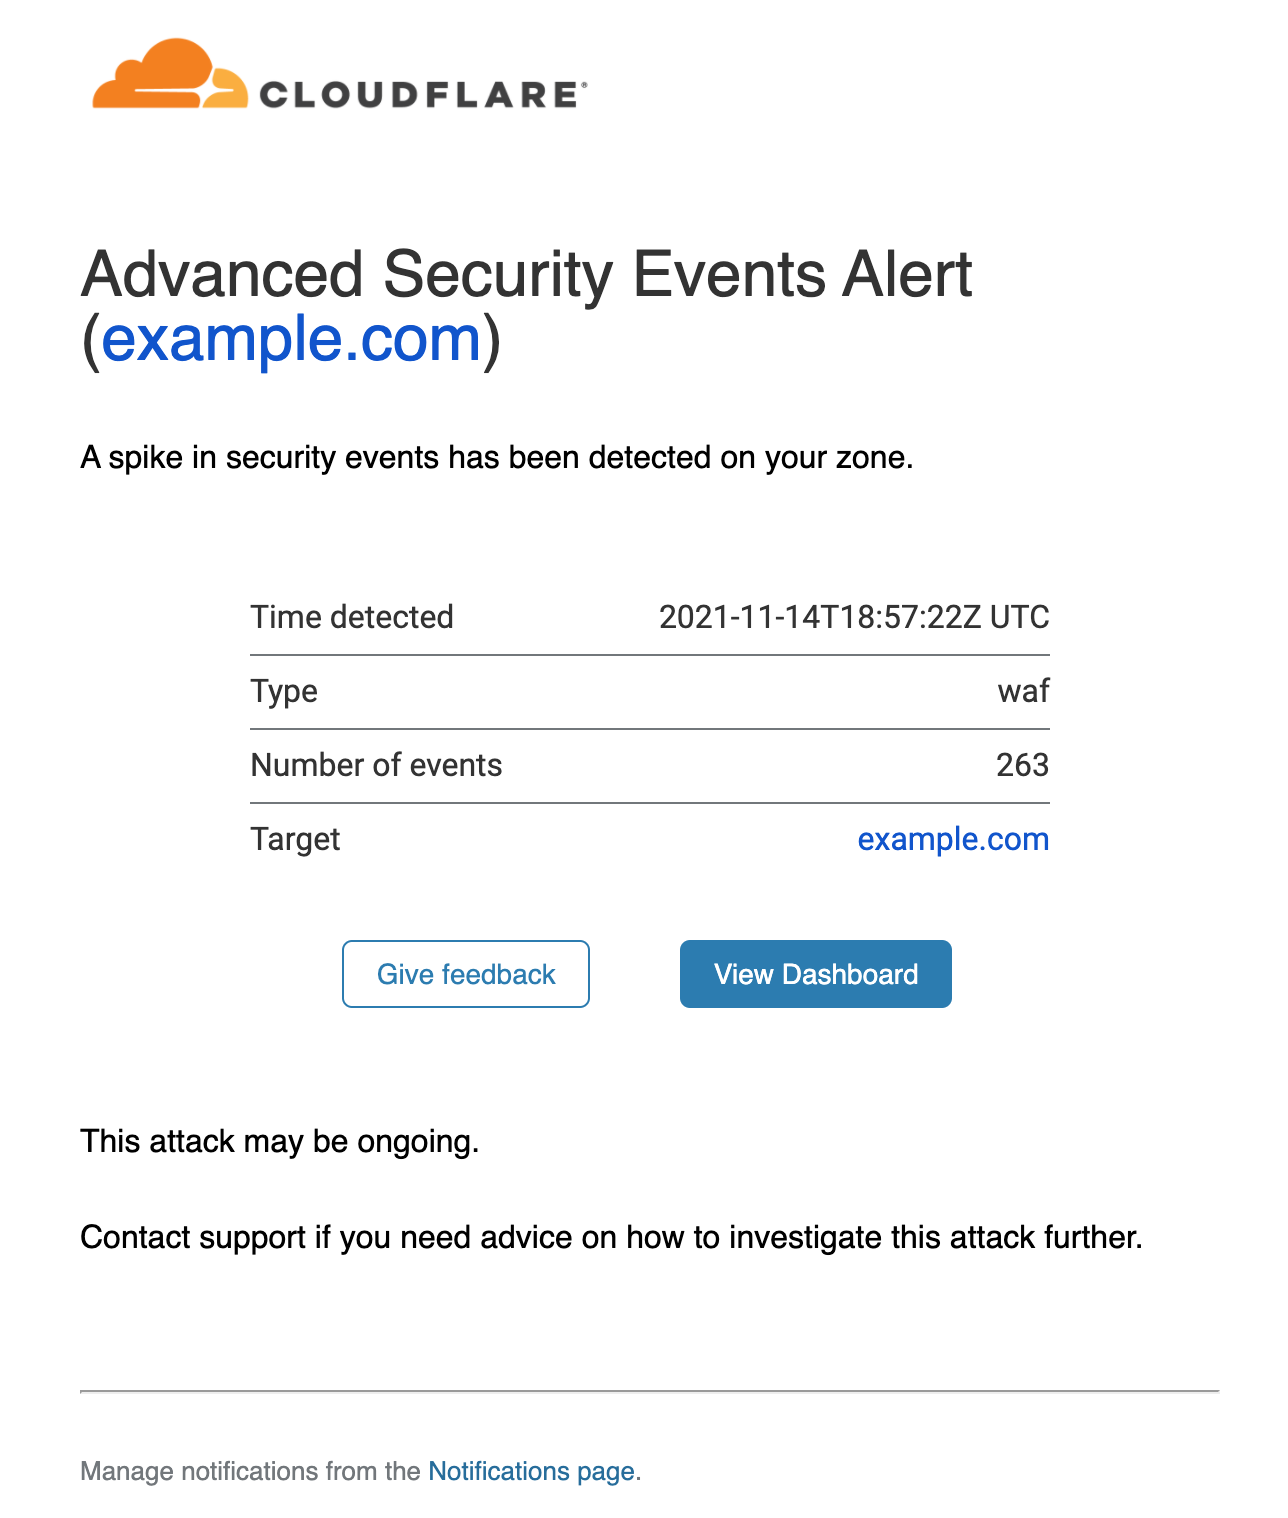
Once the notifications have been set up, you can rely on Cloudflare to warn you whenever an anomaly is detected. An example email notification is shown below:
The alert provides details on the service detecting the events (in this case the WAF), the timestamp and the affected zone. A link is provided that will direct you to the Firewall Events dashboard filtered on the correct service and time range.
The first of many alerts!
We are looking forward to customers setting up their notifications, so they can stay on top of any malicious activity affecting their applications.
This is just the first step of many towards building a much more comprehensive suite of notifications and incident management systems directly embedded in the Cloudflare dashboard. We look forward to posting feature improvements to our application security alert system in the near future.
Zabbix API enables you to collect any and all information from your Zabbix instance by using a multitude of API methods. You can even utilize Zabbix API calls in your HTTP items. For example, this can be used to monitor the number of particular sets of metrics and visualize their growth over time. With named Zabbix API tokens, such use cases are a lot more simple to implement.
Before Zabbix 5.4 we had to perform the user.login API call to obtain the authentication token. Once the user session was closed, we had to relog, obtain the new authentication token and use it in the subsequent API calls.
With the pre-defined named Zabbix API tokens, you don’t have to constantly check if the authentication token needs to be updated. Starting from Zabbix 5.4 you can simply create a new named Zabbix API token with an expiration date and use it in your API calls.
Creating a new named Zabbix API token
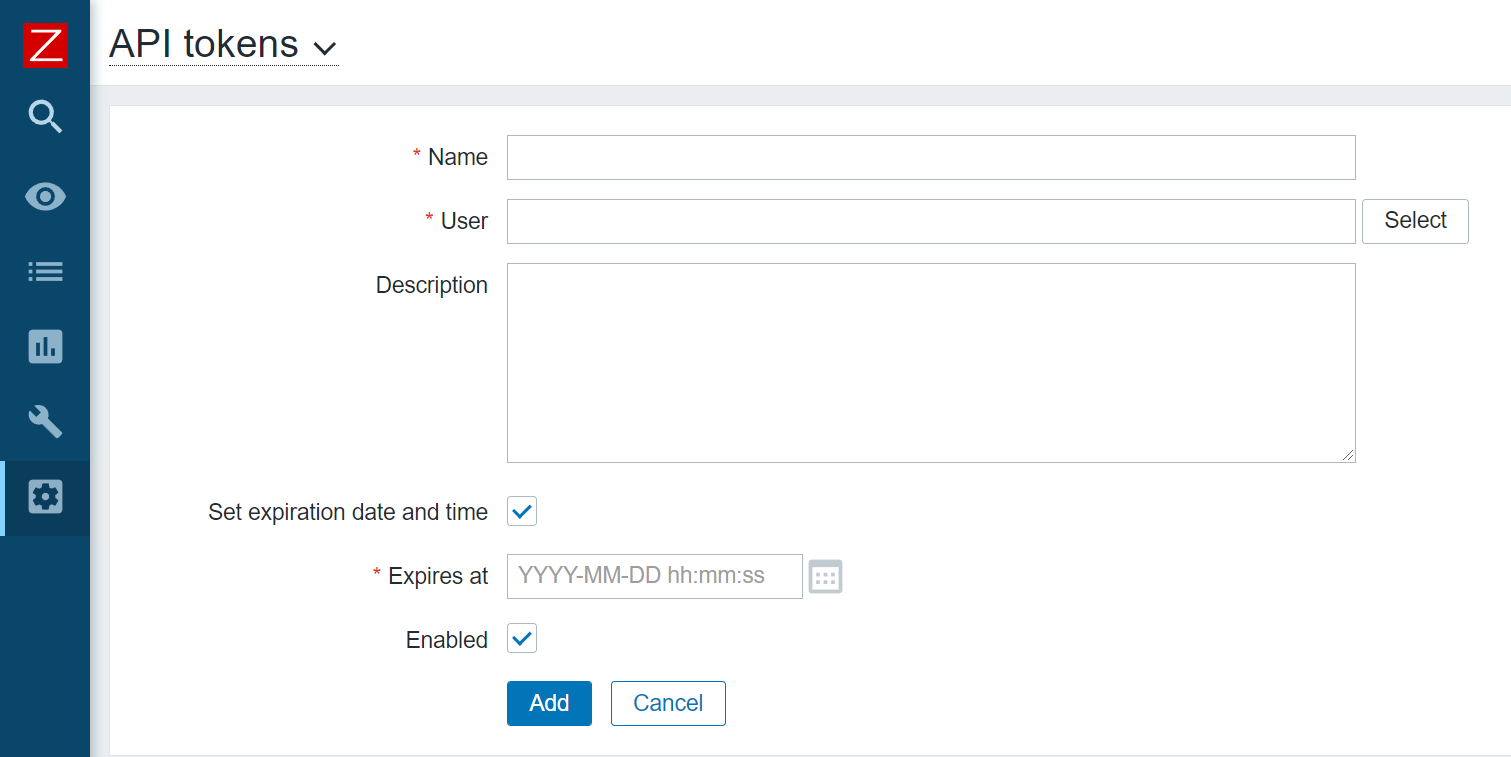
The Zabbix API token creation process is extremely simple. All you have to do is navigate to Administration – General – API tokens and create a new API token. The named API tokens are created for a particular user and can have an optional expiration date and time – otherwise, the tokens are defined without an expiry date.
You can create a named API token in the API tokens section, under Administration – General
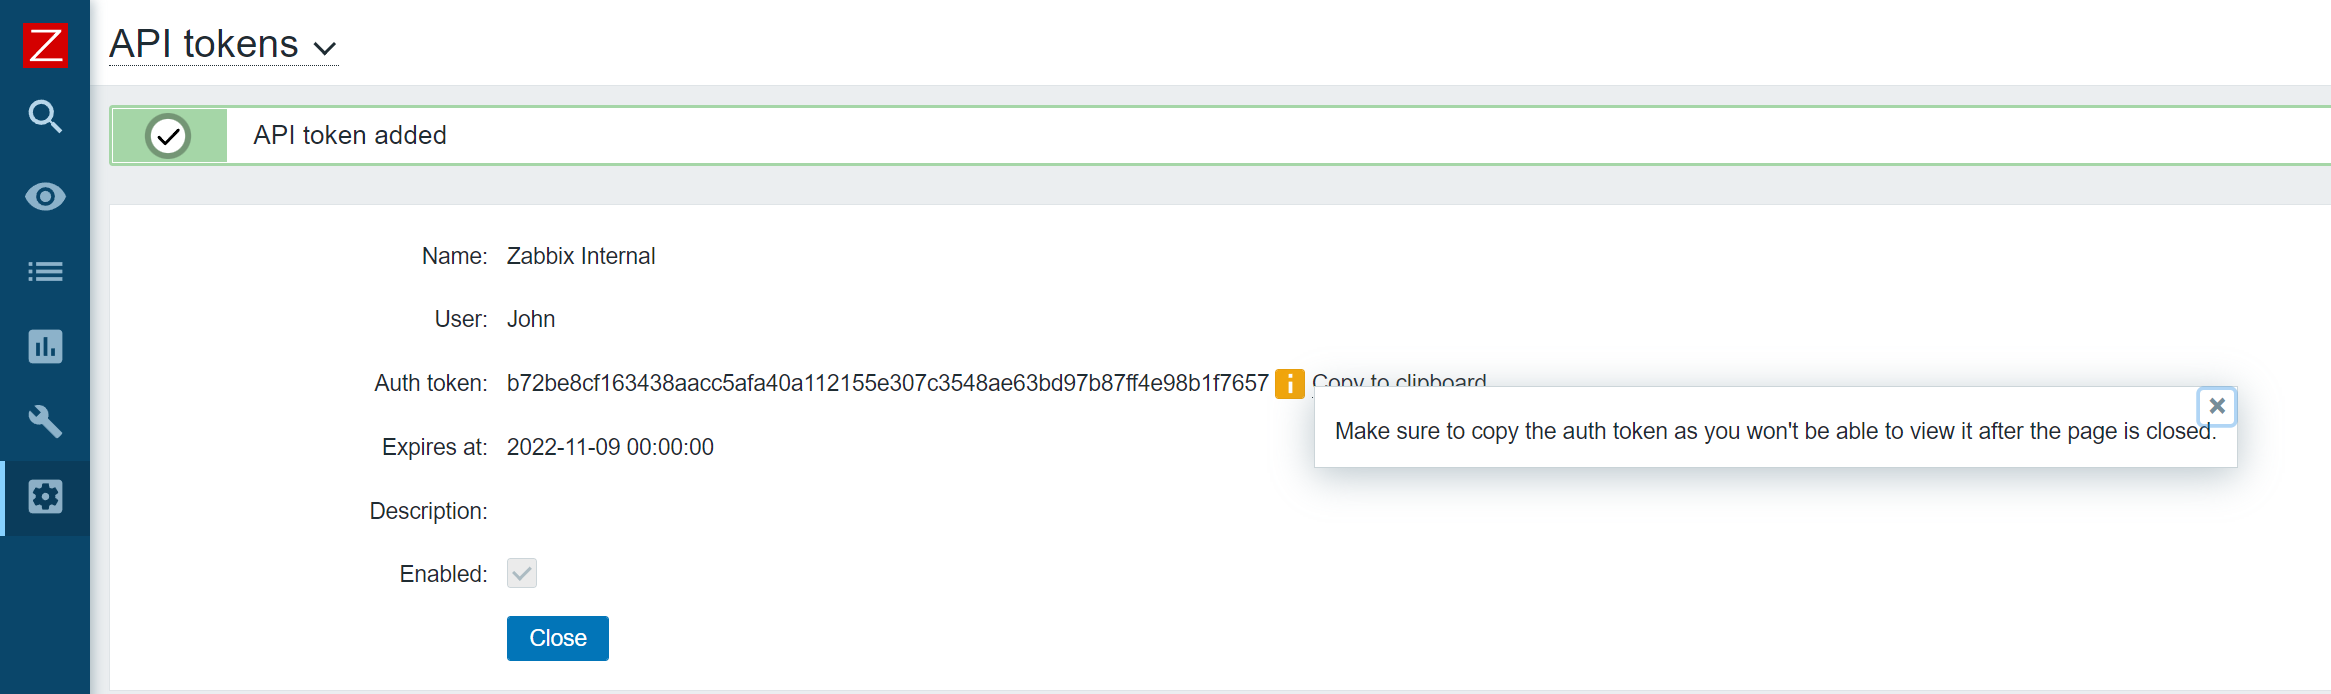
Once the Token has been created, make sure to store it somewhere safe, since you won’t be able to recover it afterward. If the token is lost – you will have to recreate it.
Make sure to store the auth token!
Don’t forget, that when defining a role for the particular API user, we can restrict which API methods this user has access to.
Simplifying API tasks with the named API token
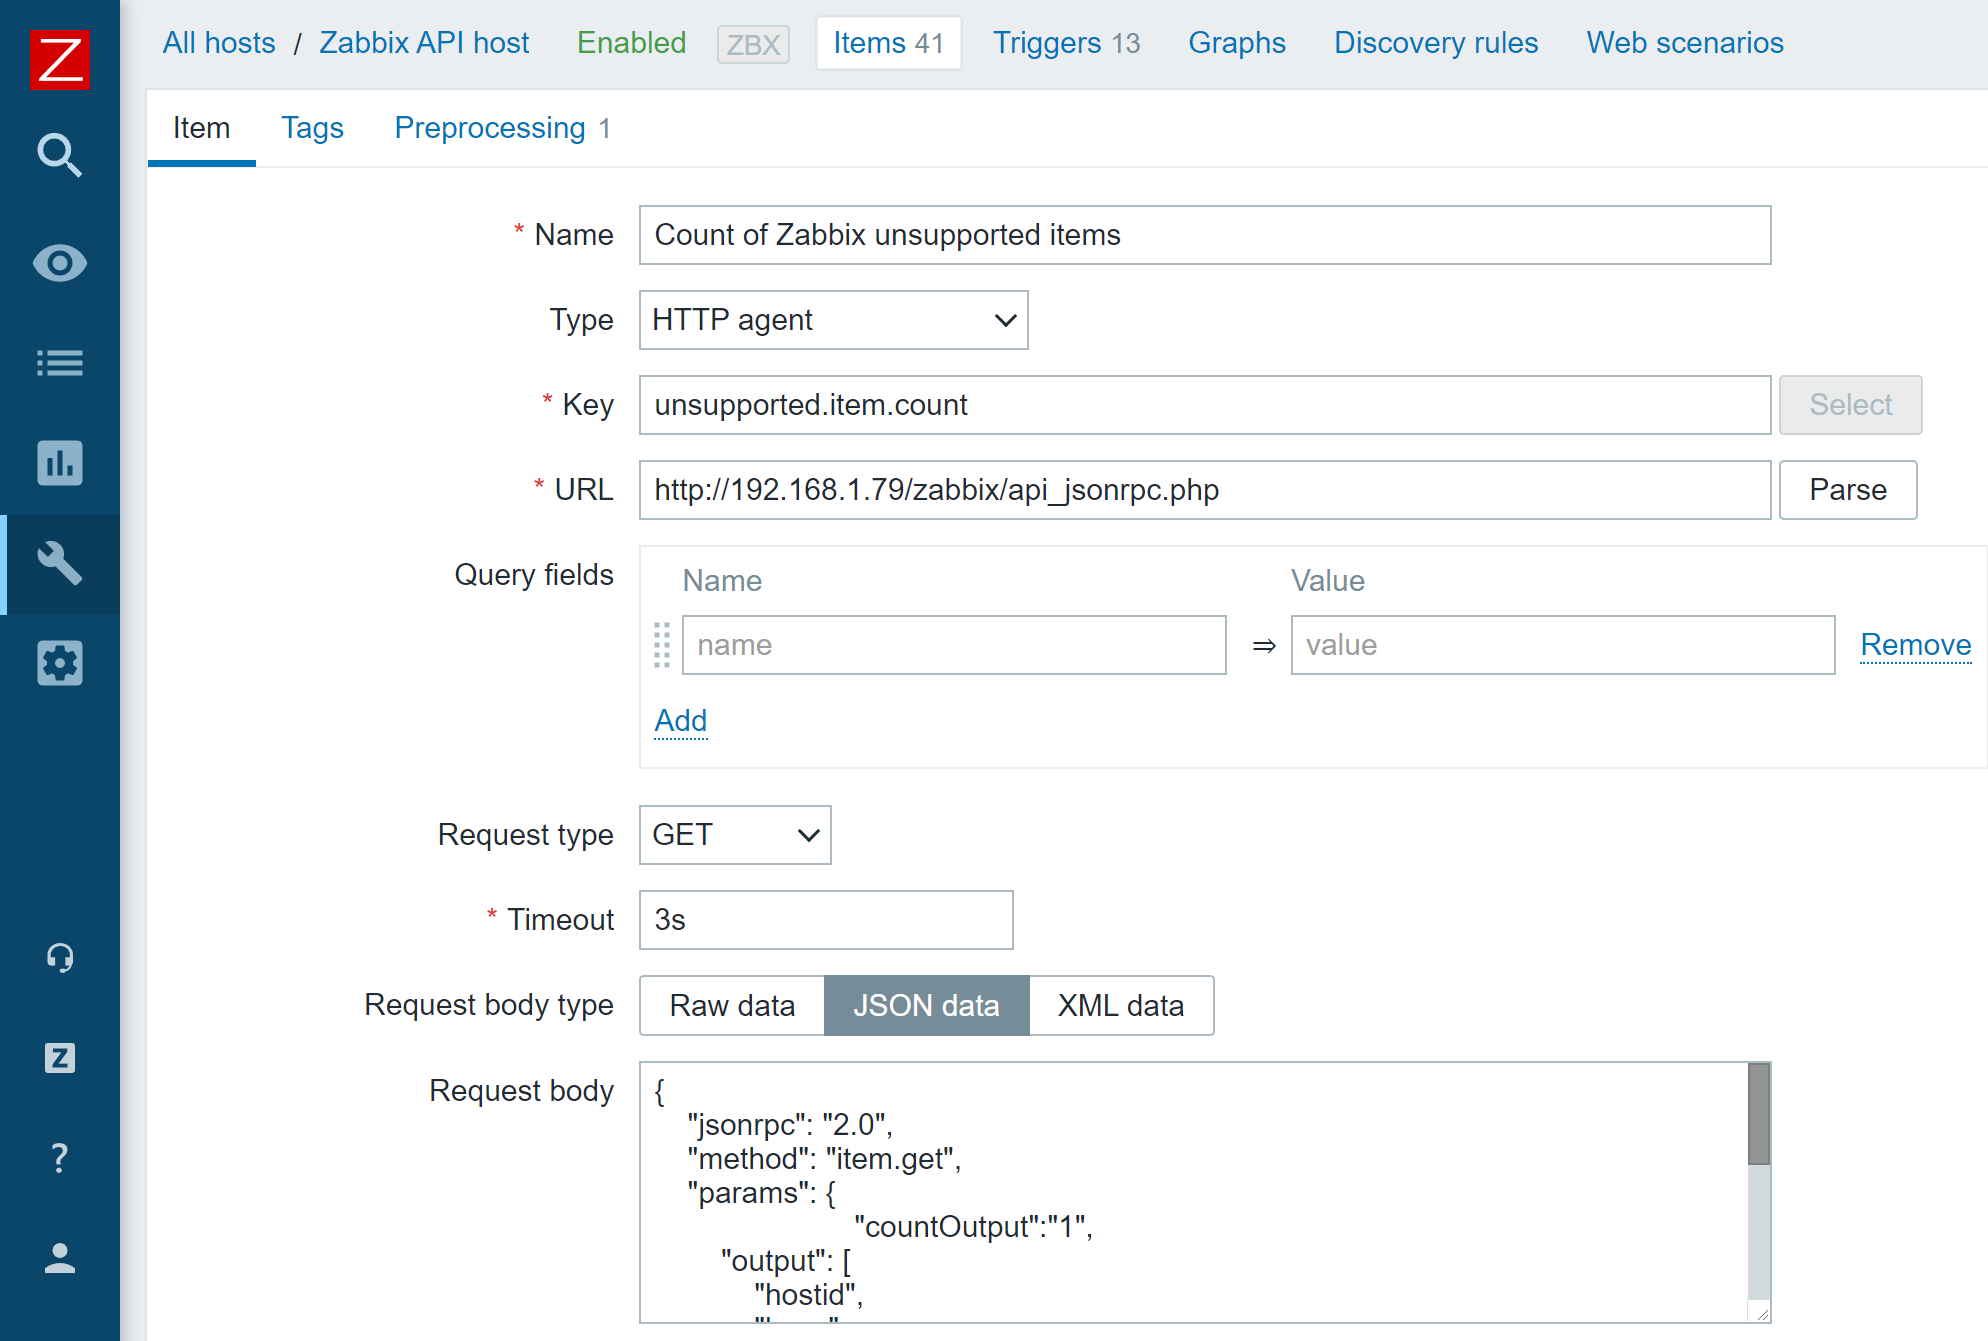
There are many different use cases where you could implement Zabbix API calls to collect some additional information. For this blog post, I will create an HTTP item that uses item.get API call to monitor the number of unsupported items.
To achieve that, I will create an HTTP item on a host (This can be the default Zabbix server host or a host dedicated to collecting metrics via Zabbix API calls) and provide the API call in the request body. Since the named API token now provides a static authentication token until it expires, I can simply use it in my API call without the need to constantly keep it updated.
An HTTP agent item that uses a Zabbix API call in its request body
HTTP item request body, which returns a count of unsupported items
I will also use regular expression preprocessing to obtain the numeric value from the API call result – otherwise, we won’t be able to graph our value or calculate trends for it.
Regular expression preprocessing step to obtain a numeric value from our Zabbix API call result
Utilizing Zabbix API scripts in Actions
In one of our previous blog posts, we covered resolving problems automatically with the event.acknowledge API method. The logic defined in the blog post was quite complex since we needed to keep an eye out for the authentication tokens and use a custom script to keep them up to date. With named Zabbix API tokens, this use case is a lot more simple.
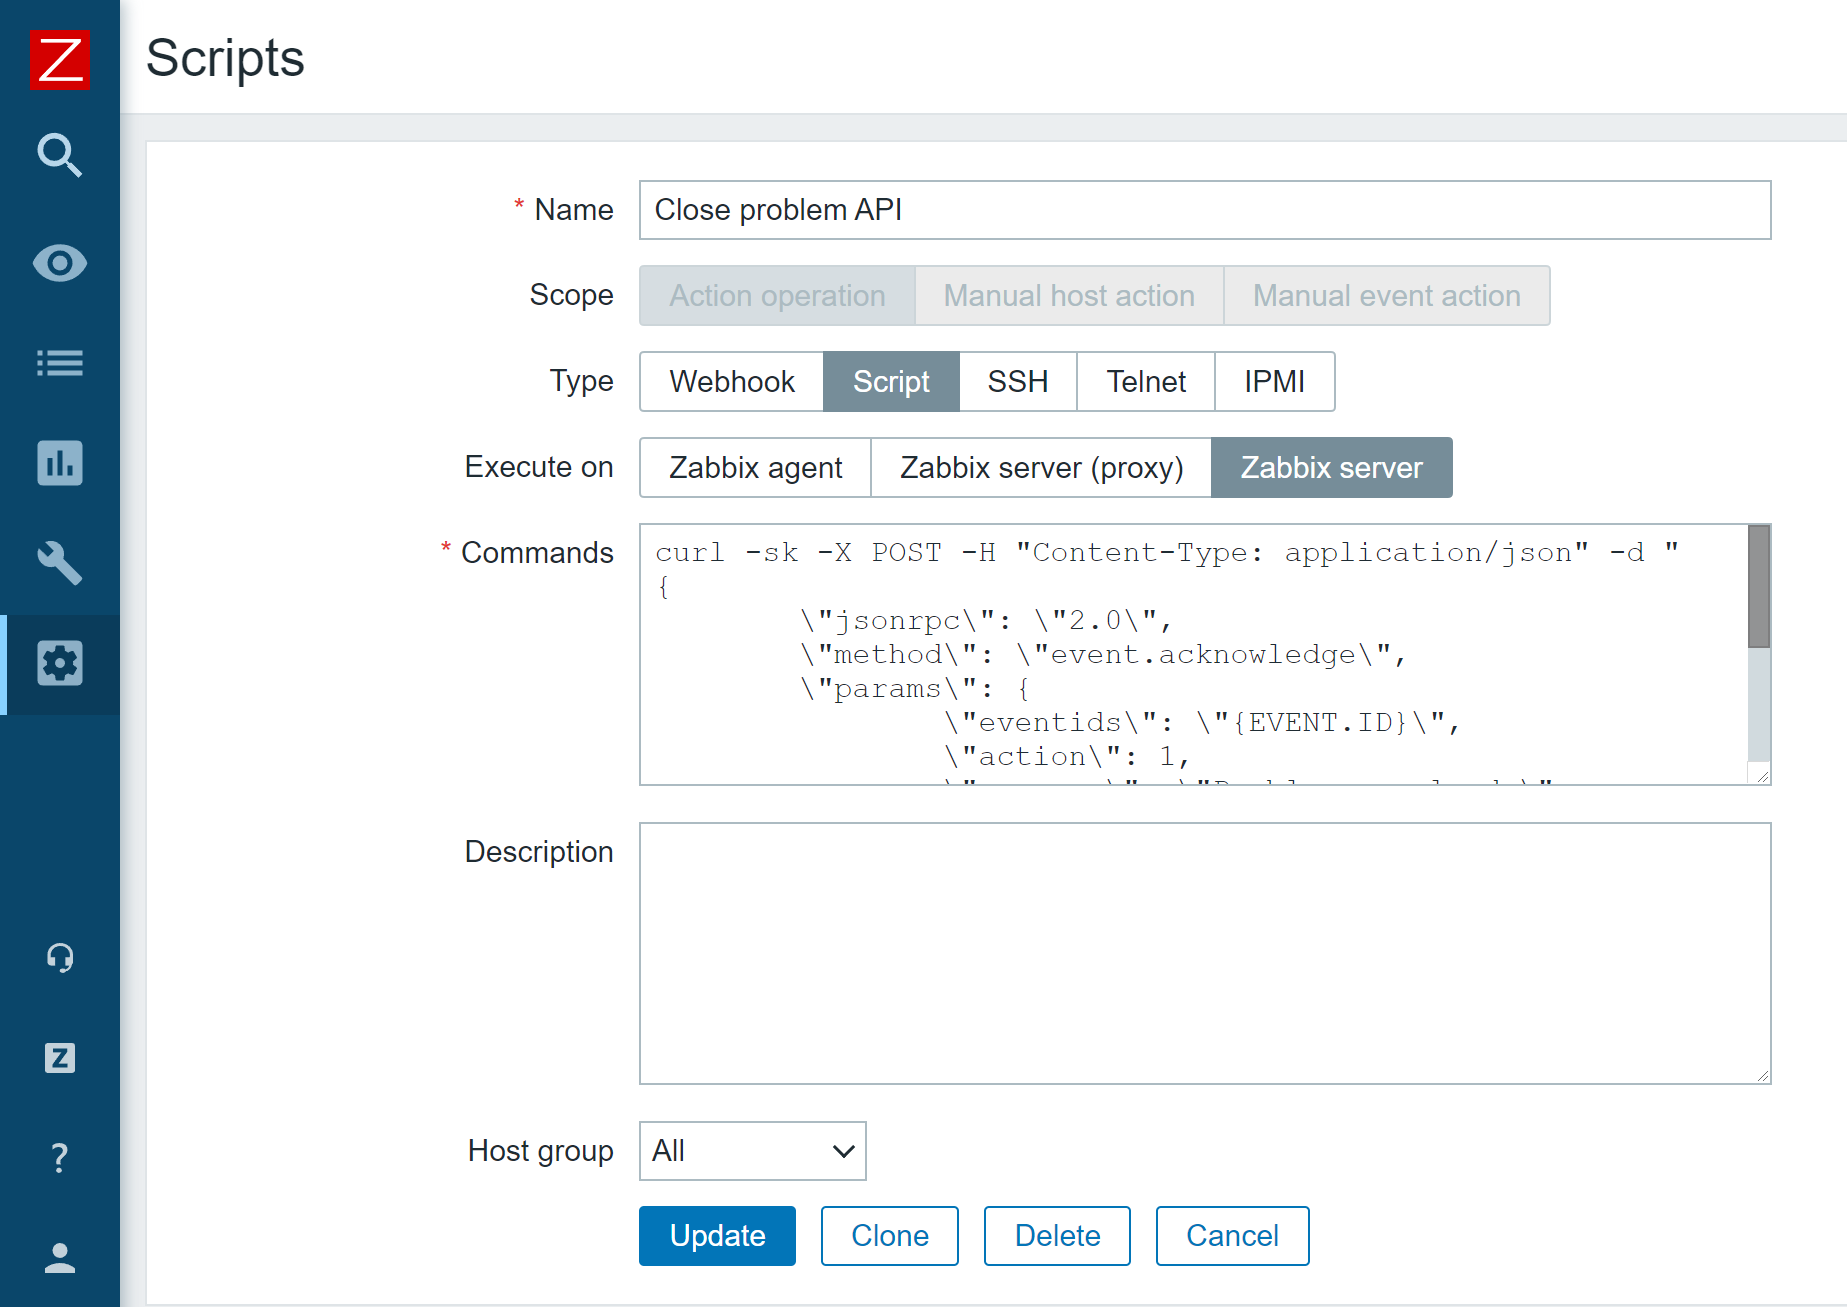
All I have to do is create an Action operation script containing my API call and pass it to an action operation.
Action operation script that invokes Zabbix event.acknowledge API method
curl -sk -X POST -H "Content-Type: application/json" -d "
{
\"jsonrpc\": \"2.0\",
\"method\": \"event.acknowledge\",
\"params\": {
\"eventids\": \"{EVENT.ID}\",
\"action\": 1,
\"message\": \"Problem resolved.\"
},
\"auth\": \"<Place your authentication token here>",
\"id\": 2
}" <Place your Zabbix API endpoint URL here>
Problem remediation script example
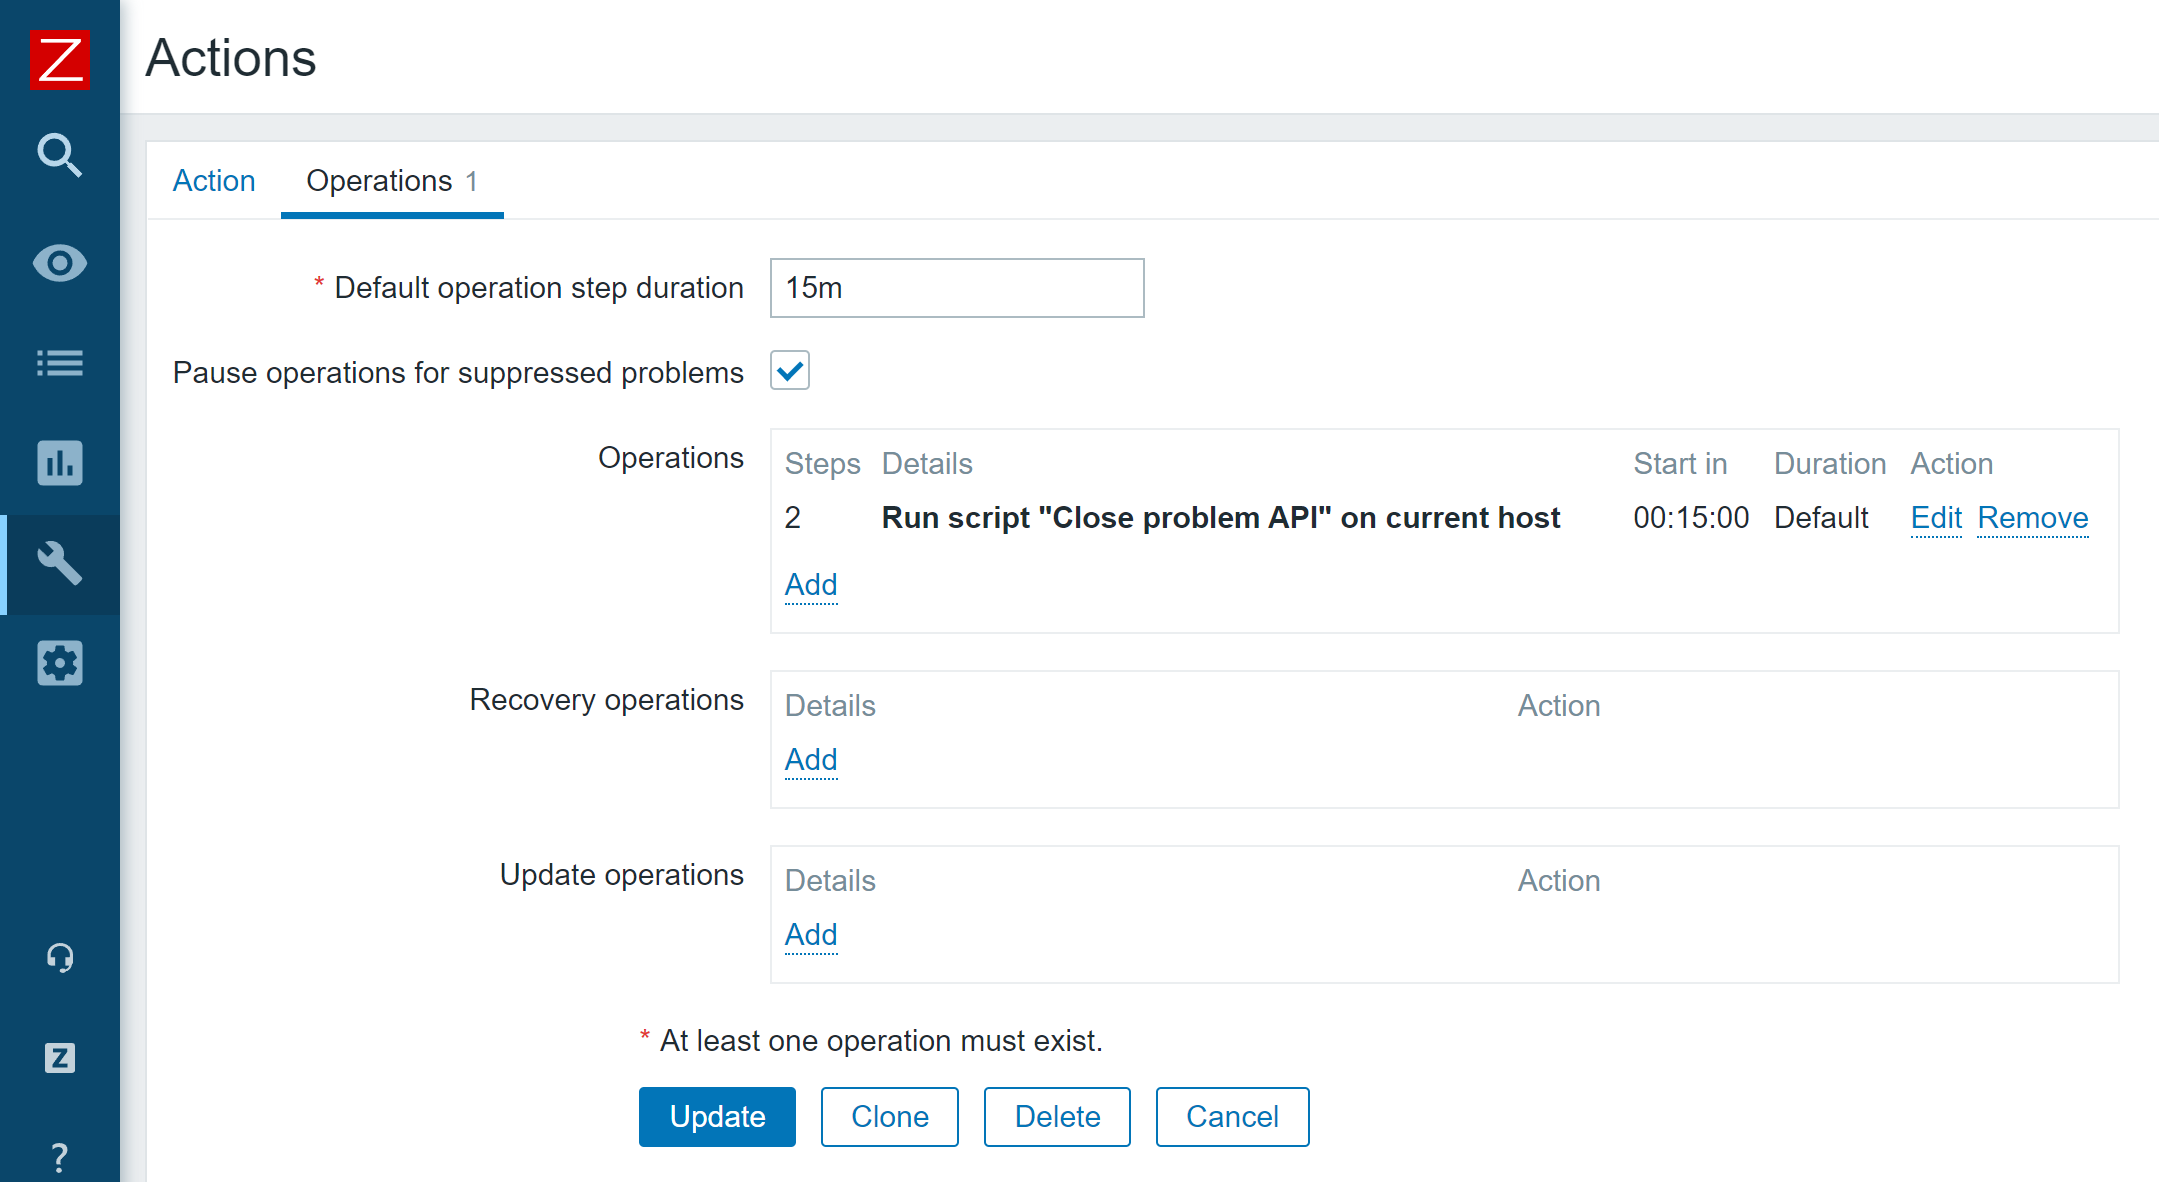
Now my problems will get closed automatically after the time period which I have defined in my action.
Action operation which runs our event.acknowledge Zabbix API script
These are but a few examples that we can now achieve by using API tokens. A lot of information can be obtained and filtered in a unique way via Zabbix API, thus providing you with a granular analysis of your monitored environment. If you have recently upgraded to Zabbix 5.4 or plan to upgrade to Zabbix 6.0 LTS in the future, I would recommend implementing named Zabbix API tokens to simplify your day-to-day workflow and consider the possibilities that this new feature opens up for you.
If you have any questions or if you wish to share your particular use case for data collection or task automation with Zabbix API – feel free to share them in the comments section below!
Today we’re excited to announce Origin Error Rate notifications: a new, sophisticated way to detect and notify you when Cloudflare sees elevated levels of 5xx errors from your origin.
In 2019, we announced Passive Origin Monitoring alerts to notify you when your origin goes down. Passive Origin Monitoring is great — it tells you if every request to your origin is returning a 521 error (web server down) for a full five minutes. But sometimes that’s not enough. You don’t want to wait for all of your users to have issues; you want to be notified when more users than normal are having issues before it becomes a big problem.
Calculating Anomalies
No service is perfect — we know that a very small percentage of your origin responses are likely to be 5xx errors. Most of the time, these issues are one-offs and nothing actually needs to be done. However, for Internet properties with very high traffic, even a very small percentage could potentially be a large number. If we alerted you for every one of these errors, you would never stop getting useless notifications. When it comes to notifying, the question isn’t whether there are any errors, but how many errors need to exist before it’s a problem.
So how do we actually tell if something is a problem? As humans, it’s relatively easy for us to look at a graph, identify a spike, and think “hmm, that’s not supposed to be there.” For a computer it gets a little more complicated. Unlike humans, who have intuition and can exercise judgement in grey areas, a computer needs an exact set of criteria to tell whether something is out of the ordinary.
The simplest way to detect abnormalities in a time series dataset is to set a single threshold — for example, “notify me whenever more than 5% of the requests to my Internet properties result in errors.” Unfortunately, it’s really hard to pick an effective threshold. Too high and you never actually get notified; too low, and you’re drowning in notifications:
Even when we find that happy medium, we can still miss issues that burn “low and slow”. This is where there’s no obvious, dramatic spike, but something has been going a little wrong for a long time:
We can try layering on multiple thresholds. For example: notify you if the error rate is ever over 10%, or if it’s over 5% for more than five minutes, or if it’s over 2% for more than 10 minutes. Not only does this quickly become complicated, but it also doesn’t account for periodic issues, such as kubernetes pods restarting or deployments going out at a regular interval. What if the error rate is over 5% for only four minutes, but it happens every five minutes? We know that a lot of your end users are being affected, but even the long set of rules listed above wouldn’t catch it.
So thresholds probably aren’t sophisticated enough to detect origin issues. Instead, we turn to the Google SRE Handbook for alerting based on Service Level Objectives (SLOs). An SLO is a part of an agreement between a customer and a service provider. It’s a defined metric and value that both parties agree on. One of the most common types of SLOs is availability, or “the service will be available for a certain percentage of the time”. In this case, the service is your origin and the agreement is between you and your end users. Your end users expect your origin to be available a certain percent of the time.
If we revisit our original concept, we know that you’re comfortable with your origin returning a certain number of errors. We define that number as your SLO. An SLO of 99.9 means that you’re OK with 0.01% of all of your requests over a month being errors. Therefore, 0.01% of all the requests that reach your origin is your total error budget — you can have this many errors in a month and never be notified, because you’ve defined that as acceptable.
What you really want to know is when you’re burning through that error budget too quickly — this probably means that something is actually going wrong (instead of a one-time occurrence). We can measure a burn rate to gauge how quickly you’re burning through your error budget, given the rate of errors that we’re currently seeing. A burn rate of one means that the entirety of the error budget will be used up exactly within the set time period — an ideal scenario. A burn rate of zero is even better since we’re not seeing any errors at all, but ultimately is pretty unrealistic. A burn rate of 10 is most likely a problem — if that rate keeps up for the full month, you’ll have had 10x the number of errors than you originally said was acceptable.
Even when using burn rates instead of thresholds, we still want to have multiple criteria. We want to measure a short time period with a high burn rate (a short indicator). This covers your need to “alert me quickly when something dramatic is happening.” But we also want to have a longer time period with a lower burn rate (a long indicator), in order to cover your need to “don’t alert me on issues that are over quickly.” This way we can ensure that we alert quickly without sending too many false positives.
Let’s take a look at the life of an incident using this methodology. In our first measurement, the short indicator tells us it looks like something is starting to go wrong. However, the long indicator is still within reasonable bounds. We’re not going to sound the alarm yet.
When we measure next, we see that the problem is worse. Now we’re at the point where there are enough errors that not only is the short indicator telling us there’s something wrong, but the long indicator has been impacted too. We feel confident that there’s a problem, and it’s time to notify you.
A couple cycles later, the incident is over. The long indicator is still telling us that something is wrong, because the incident is still within the long time period. However, the short indicator shows that nothing is currently concerning. Since we don’t have both indicators telling us that something is wrong, we won’t notify you. This keeps us from sending notifications for incidents that are already over.
This methodology is cool because of how well it responds to different incidents. If the original spike had been more dramatic, it would have triggered both the long and short indicators immediately. The more errors we’re seeing, the more confident we are that there’s an issue and the sooner we can notify you.
Even with this methodology, we know that different services behave differently. So for this notification, you can choose the Service Level Objective (SLO) you want to use to monitor your Internet property: 99.9% (high sensitivity), 99.8% (medium sensitivity), or 99.7% (low sensitivity). You can also choose which Internet properties you want to monitor — no need to be notified for test properties or lower priority domains.
Getting started today
HTTP Origin Error Rate notifications can be configured in the Notifications tab of the dashboard. Select Origin Error Rate Alert as your alert type. As with all Cloudflare notifications, you’re able to name and describe your notification, and choose how you want to be notified. From there, you can select which domains you want to monitor, and at what SLO.
This notification is available to all Enterprise customers. If you’re interested in monitoring your origin, we encourage you to give it a try.
To provide the best experiences, we use technologies like cookies to store and/or access device information. Consenting to these technologies will allow us to process data such as browsing behavior or unique IDs on this site. Not consenting or withdrawing consent, may adversely affect certain features and functions.
Functional
Always active
The technical storage or access is strictly necessary for the legitimate purpose of enabling the use of a specific service explicitly requested by the subscriber or user, or for the sole purpose of carrying out the transmission of a communication over an electronic communications network.
Preferences
The technical storage or access is necessary for the legitimate purpose of storing preferences that are not requested by the subscriber or user.
Statistics
The technical storage or access that is used exclusively for statistical purposes.The technical storage or access that is used exclusively for anonymous statistical purposes. Without a subpoena, voluntary compliance on the part of your Internet Service Provider, or additional records from a third party, information stored or retrieved for this purpose alone cannot usually be used to identify you.
Marketing
The technical storage or access is required to create user profiles to send advertising, or to track the user on a website or across several websites for similar marketing purposes.