Since it launched in 2022, the Customer Carbon Footprint Tool (CCFT) has supported our customers’ sustainability journey to track, measure, and review their carbon emissions by providing the estimated carbon emissions associated with their usage of Amazon Web Services (AWS) services.
The CCFT is informed by the Greenhouse Gas (GHG) Protocol’s classification of emissions, which classifies a company’s emissions. Today, we’re announcing the inclusion of Scope 3 emissions data and an update to Scope 1 emissions in the CCFT. The new emission categories complement the existing Scope 1 and 2 data, and they’ll give our customers a comprehensive look into their carbon emissions data.
In this updated methodology we incorporate new emissions categories. We’ve added Scope 1 refrigerants and natural gas, alongside the existing Scope 1 emissions from fuel combustion in emergency backup generators (diesel). Although Scope 1 emissions represent a small share of overall emissions, we provide our customers with a complete image of their carbon emissions.
To decide which categories of Scope 3 to include in our model we looked at how material each of them were to the overall carbon impact and confirmed the vast majority of emissions were represented. With that in mind, the methodology now includes:
Fuel- and energy-related activities (“FERA” under the GHG Protocol) – This includes upstream emissions from purchased fuels, upstream emissions of purchased electricity, and transmission and distribution (T&D) losses. AWS calculates these emissions using both LBM and the market-based method (MBM).
IT hardware – AWS uses a comprehensive cradle-to-gate approach that tracks emissions from raw material extraction through manufacturing and transportation to AWS data centers. We use four calculation pathways: process-based life cycle assessment (LCA) with engineering attributes, extrapolation, representative category average LCA, and economic input-output LCA. AWS prioritizes the most detailed and accurate methods for components that contribute significantly to overall emissions.
Buildings and equipment – AWS follows established whole building life cycle assessment (wbLCA) standards, considering emissions from construction, use, and end-of-life phases. The analysis covers data center shells, rooms, and long-lead equipment such as air handling units and generators. The methodology uses both process-based life cycle assessment models and economic input-output analysis to provide comprehensive coverage.
The Scope 3 emissions are then amortized over the assets’ service life (6 years for IT hardware, 50 years for buildings) to calculate monthly emissions that can be allocated to customers. This amortization means that we fairly distribute the total embodied carbon of each asset across its operational lifetime, accounting for scenarios such as early retirement or extended use.
All these updates are part of methodology version 3.0.0 and are explained in detail in our methodology document, which has been independently verified by a third party.
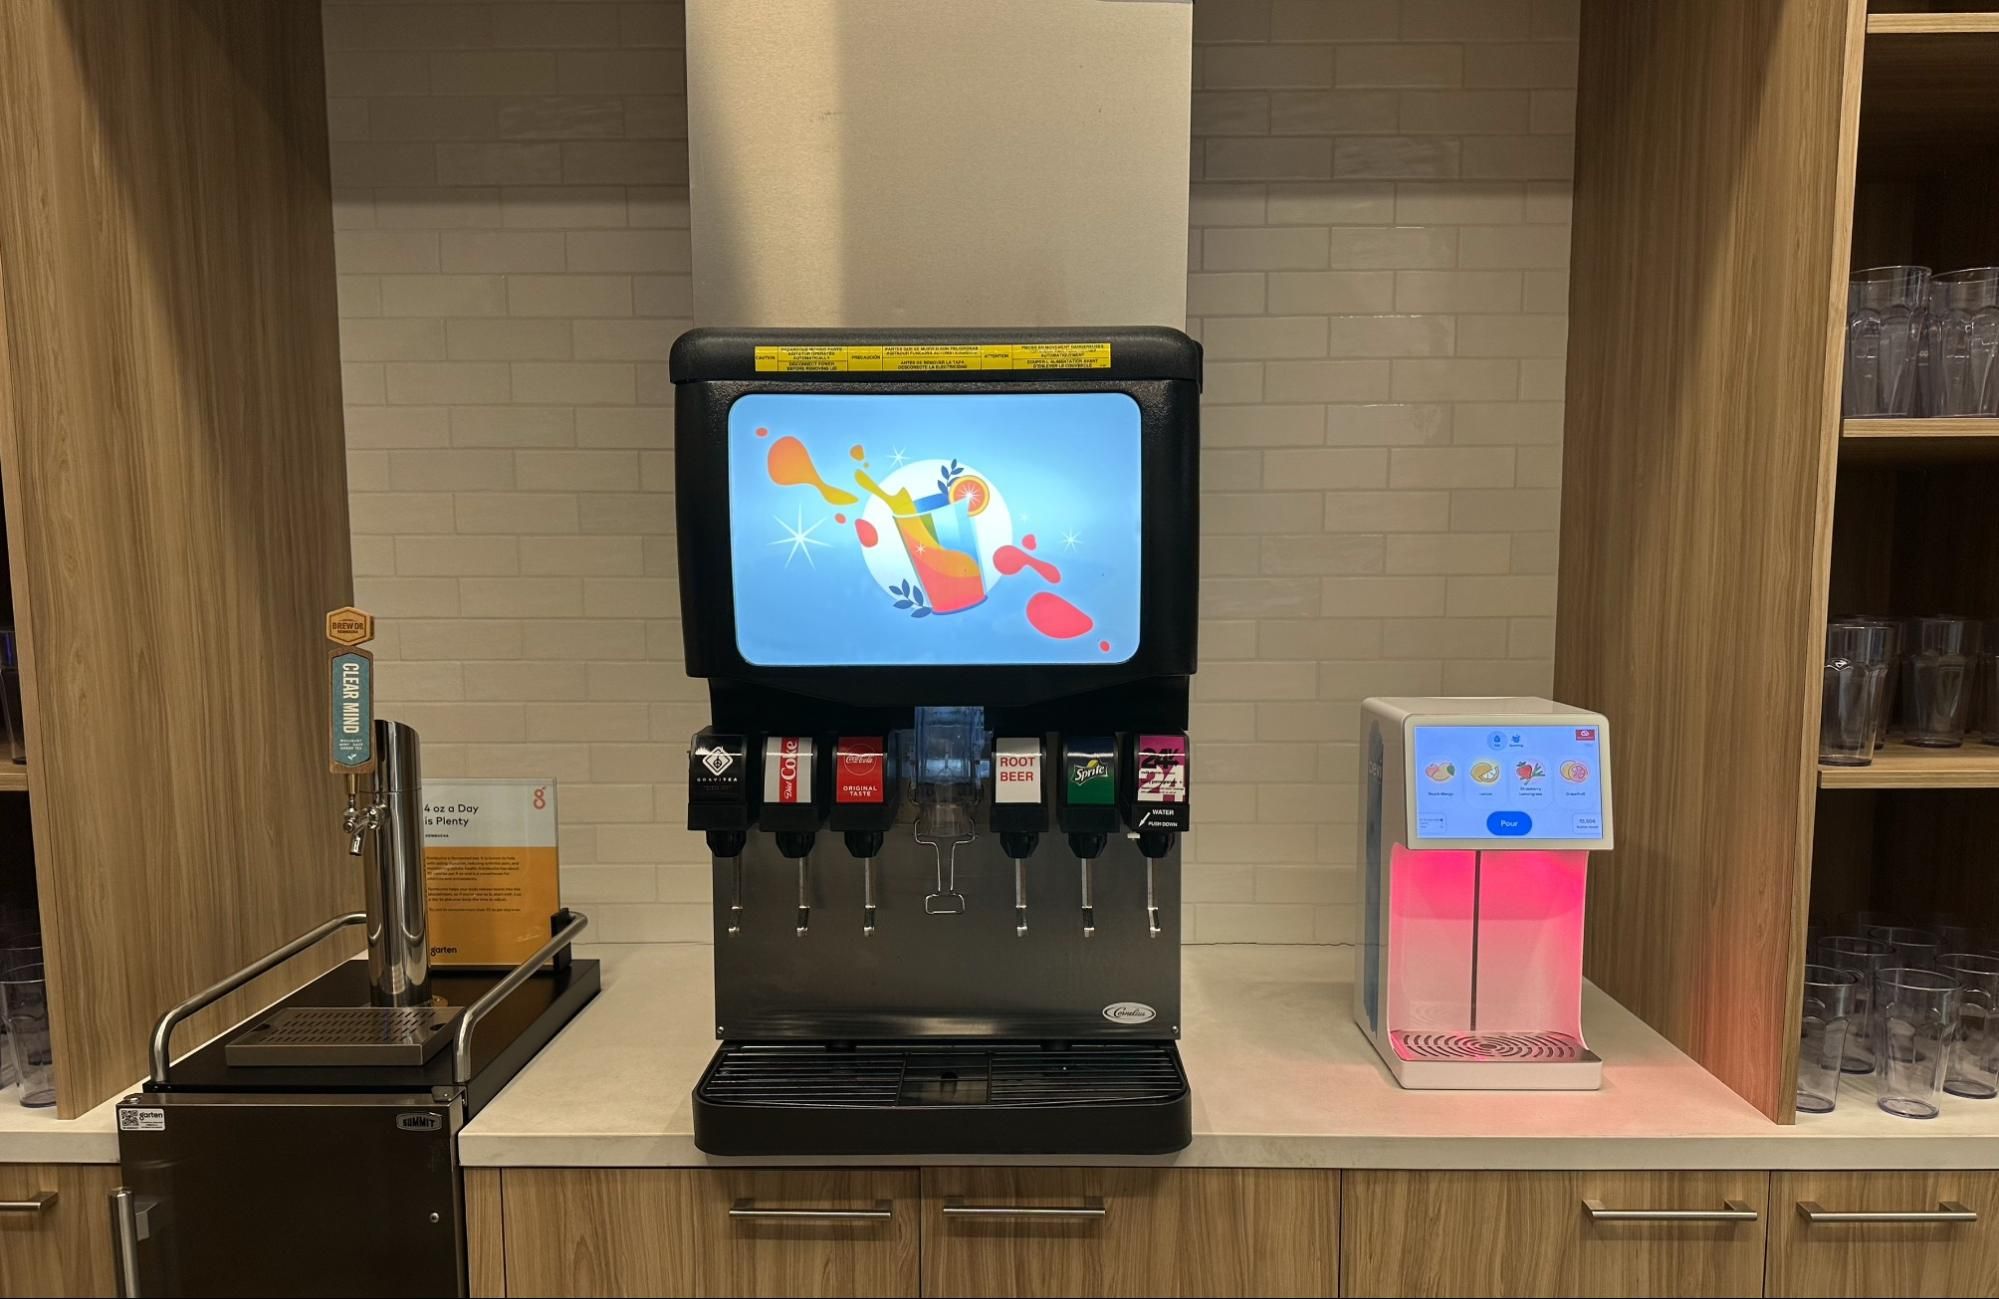
How to access the CCFT To get started, go to the AWS Billing and Cost Management console and choose Customer Carbon Footprint Tool under Cost and Usage Analysis. You can access your carbon emissions data in the dashboard, download a csv file, or export all data using basic SQL and visualize your data by integrating with AWS Data Exports and Amazon Quick Sight.
To ensure you can make meaningful year-over-year comparisons, we’ve recalculated historical data back to January 2022 using version 3 of the methodology. All the data displayed in the CCFT now uses version 3. To see historical data using v3, choose Create custom data export. A new data export now includes new columns breaking down emissions by Scope 1, 2, and 3.
You can see estimated AWS emissions and estimated emissions savings. The tool shows emissions calculated using the MBM for 38 months of data by default. You can find your emissions calculated using the LBM by choosing LBM in the Calculation method filter on the dashboard. The unit of measurement for carbon emissions is metric tons of carbon dioxide equivalent (MTCO2e), an industry-standard measure.
In the Carbon emissions summary, it shows trends of your carbon emissions over time. You can also find emissions resulting from your usage of AWS services and across all AWS Regions. To learn more, visit Viewing your carbon footprint in the AWS documentation.
Voice of the customer Some of our customers had early access to these updates. This is what they shared with us:
Sunya Norman, senior vice president, Impact at Salesforce shared “Effective decarbonization begins with visibility into our carbon footprint, especially in Scope 3 emissions. Industry averages are only a starting point. The granular carbon data we get from cloud providers like AWS are critical to helping us better understand the actual emissions associated with our cloud infrastructure and focus reductions where they matter most.”
Gerhard Loske, Head of Environmental Management at SAP said “The latest updates to the CCFT are a big step forward in helping us managing SAP’s sustainability goals. With new Region-specific data, we can now see better where emissions are coming from and take targeted action. The upcoming addition of Scope 3 emissions will give us a much fuller picture of our carbon footprint across AWS workloads. These improvements make it easier for us to turn data into meaningful climate action.”
Pinterest’s Global Sustainability Lead, Mia Ketterling highlighted the benefits of the Scope 3 emission data, saying, “By including Scope 3 emissions data in their CCFT, AWS empowers customers like Pinterest to more accurately measure and report the full carbon footprint of our digital operations. Enhanced transparency helps us drive meaningful climate action across our value chain.”
If you’re attending AWS re:Invent in person in December, join technical leaders from AWS, Adobe, and Salesforce as they reveal how the Customer Carbon Footprint Tool supports their environmental initiatives.
Now available With Scope 1, 2, and 3 coverage in the CCFT, you can track your emissions over time to understand how you’re trending towards your sustainability goals and see the impact of any carbon reduction projects you’ve implemented. To learn more, visit the Customer Carbon Footprint Tool (CCFT) page.
European banks face a new challenge with the European Commission’s transition from the Non-Financial Reporting Directive (NFRD) to the Corporate Sustainability Reporting Directive (CSRD) regulations. This transition represents an expansion in sustainability reporting scope that will affect approximately 50,000 companies, a significant increase from the previous 11,700.
This means that banks themselves need to file sustainability reports because they will now be one of those 50,000 companies, but for their own reporting, they also need to assess their clients’ sustainability reports because they lend or finance those companies.
In this post, you learn how you can use generative AI services on Amazon Web Services (AWS) to automate your sustainability reporting requirements, reduce manual effort, and improve accuracy. You do this by implementing an automated solution for extracting, processing, and validating data from corporate reports.
The challenge
Financial institutions and sustainability teams managing sustainability reporting face three critical challenges:
Scale and complexity: Banks and financial institutions must process thousands of annual reports and sustainability documents, often spanning hundreds of pages each. This process requires extensive data extraction, complex EU Taxonomy alignment calculations, and resource-intensive validation steps. Manual processing introduces significant risks of errors and consumes valuable team resources.
Regulatory compliance: Banks must now implement detailed CSRD requirements, track specific metrics for turnover, capital expenditure (CapEx), and operating expenses (OpEx), and calculate their Green Asset Ratio (GAR) as well as environmental risks that come with their loans, debt, or equity investments. These new requirements demand robust data collection and processing capabilities.
Data management: Processing Green House Gas (GHG) emissions data across Scope 1, 2, and 3 categories requires analyzing complex lending and investment activities. With strict reporting deadlines, organizations need efficient tools to process this expanding volume of sustainability data.
The sustainability team point of view
Banks finance a large variety of counterparties and economic activities. While their carbon footprint is primarily linked to the greenhouse gas (GHG) emissions of their counterparties (Scope 3), The direct GHG emissions (Scope 1) of financial institutions or the GHG emissions linked to their energy consumption (Scope 2) are usually limited. For banks, the most critical key performance indicator (KPI) is the GAR, which measures the proportion of a bank’s taxonomy-aligned balance sheet exposures versus its total eligible exposures, as shown in the following figure.
To calculate their GAR, banks must obtain and use sustainability data from annual reports or sustainability reports of up to 50,000 companies (many of which are subject to NFRD and CSRD reporting), and understand how much of their activities are linked to EU Taxonomy.
The manual process
In the example that follows, we use the Amazon 2023 Annual Report. Some of the data that teams would have to manually extract includes: Revenue, Scope 1, Scope 2, and Scope 3 emissions.
As you can see from the page count at the top of the preceding figure, people manually searching for this data would have to go through 92 pages to find the parameters they’re looking for. Next, we might determine that some of the data we need (Scope 1, Scope 2, Scope 3) isn’t available in the annual report, so we need to analyze the sustainability report. As shown in the following figure, to manually retrieve the relevant data from this report, we would have to go through 98 pages of information.
To prepare a GAR, we would have to repeat this process across hundreds or even thousands of companies.
A solution using AWS and generative AI
To address these challenges, we propose an automated approach using AWS services. This approach can help banks streamline their sustainability reporting processes.
Here’s how this solution works— as shown in the preceding figure:
Amazon Bedrock Knowledge Bases stores the vector embeddings in the vector database of your choice, such as in an Amazon OpenSearch Serverless collection.
Now the data is read, broken into chunks, converted to embeddings and stored in a vector store. You use a report generation flow to ask questions about the information in the knowledge base.
Report generation flow
To automate the report generation for sustainability teams, we created the report generation flow shown in the following figure.
The report generation flow includes the following steps:
When user uploads an annual report, the data from the report is ingested into the knowledge base, as shown in the data ingestion flow.
A Lambda function—Invoke Bedrock Agent—is triggered to invoke an Amazon Bedrock agent.
The Amazon Bedrock agent determines NFRD or CSRD applicability based on various parameters such as employee numbers and annual revenues. This agent then passes on what kind of regulation to apply to a Lambda function.
The Lambda function Retrieve Sustainability Metrics retrieves various parameters needed for NFRD or CSRD from the annual report.
The function receives NFRD or CSRD applicability from the Amazon Bedrock agent.
Based on NFRD or CSRD applicability, there are specific sustainability metrics that need to be retrieved. For NFRD, there are about 15 metrics that need to be retrieved, and for CSRD, there are about 30 metrics.
The function iteratively sends {variable} to the Amazon Bedrock flow. For example, if the metric to be retrieved is Scope 1 emission, then the Lambda function will send variable=‘Scope 1 emission’
The function gets the metric value from the Amazon Bedrock flow and when the required metrics are retrieved, creates a CSV file with the details.
Amazon Bedrock flow:
Retrieve {variable} (for example, ‘Scope 1 emission’) from the annual report. For this, we create a prompt, as shown in the following diagram.
Use the prompt to fetch the value from the knowledge base.
Prompt:
<query> You are an intelligent agent that helps retrieve information from a knowledgebase. Please find {{variable}}. Please return only a number and not any additional text. I only need the value so you will return one word</query>
Return the value to the Lambda function in Step 4.
Breakdown of key components
Amazon S3 is used for storing annual statements and sustainability reports, providing highly durable and secure object storage that facilitate immediate access when needed for processing.
Amazon Bedrock Knowledge Bases enables using Retrieval-Augmented Generation (RAG) to optimize the output of a large language model by giving it the context of companies’ annual reports and regulatory requirements. It does so by creating chunks and vector embeddings from the annual reports to enable efficient information retrieval from a vector database of your choice.
Amazon Bedrock foundation models (FMs) extract information from an Amazon Bedrock knowledge base and generate standardized PDF reports for regulators, providing consistent formatting and alignment with CSRD requirements. We encourage you to choose the best foundational model for your use case through the flexibility and enterprise-grade controls of Amazon Bedrock. For this solution, we used Anthropic’s Claude Sonnet 3.5 as the model, but by using Amazon Bedrock, you can choose from over 50 different models to see which one best fits your use case.
Amazon Bedrock Flows orchestrates the document processing pipeline, coordinating between services to automatically extract required sustainability metrics and validate compliance requirements. This feature helps us manage the workflow from initial document ingestion through to final report generation.
Amazon Bedrock Prompt Management creates and helps manage precise prompts that help retrieve multiple sustainability metrics from reports for example: turnover, Scope 1, Scope 2, and Scope 3 emissions data. These structured prompts facilitate consistent data extraction across different document formats.
Amazon Bedrock Agents evaluates each uploaded document to determine NFRD or CSRD eligibility by analyzing company revenue, employee count, and incorporation details. The agents retrieve these parameters by using a Lambda function that’s part of the actions the agent can perform.
Lambda handles event-driven processing when new documents are uploaded. Lambda functions are also used by the agent to retrieve data from companies’ annual reports and trigger the appropriate workflows based on document type.
Amazon EventBridge is used to build event-driven applications at scale across AWS and manages workflow orchestration, automatically initiating document processing when new reports are uploaded through S3 event notifications.
This architecture enables banks to process thousands of sustainability reports efficiently. The solution scales automatically to handle increasing document volumes while keeping security a top priority.
Additional considerations
You can use the following additional AWS service to help further increase the accuracy of information retrieval from sustainability documents.
Amazon Bedrock Guardrails to make sure that the solution caters to responsible AI policies. Specifically, we have added contextual grounding checks to reduce hallucinations. This is important for the solution because we’re trying to find a few specific values in a large document, and these checks make sure that the metrics retrieved are based on the documents.
Automated reasoning checks which help to verify the metrics returned by the solution. Consider the metric Number of employees. There can be multiple places in the annual report where the number of employees is mentioned; for example, temporary workers, part-time employees, employees from various departments, employees from a company that was taken over last year, and so on. To arrive at the right number, automated reasoning checks help.
Benefits
This sustainability reporting solution cuts document processing time from 8—10 weeks to few hours. Banks get clear audit trails showing exactly how they extracted and validated sustainability data. When regulations are updated, the system adapts through its knowledge base without disrupting operations. Built-in security protects company data through the entire process. Access controls and encryption are in place to secure information. The output delivers standardized, accurate reports. This automation lets sustainability teams concentrate on environmental improvements rather than paperwork. Teams can instead analyze trends and develop initiatives instead of hunting through reports for data points.
Conclusion
As sustainability reporting requirements evolve, having a flexible and automated solution will become crucial. While we focused on NFRD reporting, the same pattern can be adapted for CSRD compliance reporting, SFDR reporting requirements, and Internal sustainability metrics, or EU Taxonomy alignment.
Customers looking to build their products in the Financial Services industry have access to industry and domain AWS specialists; contact us for help in your cloud journey.
Well, it’s been another historic year! We’ve watched in awe as the use of real-world generative AI has changed the tech landscape, and while we at the Architecture Blog happily participated, we also made every effort to stay true to our channel’s original scope, and your readership this last year has proven that decision was the right one.
AI/ML carries itself in the top posts this year, but we’re also happy to see that foundational topics like resiliency and cost optimization are still of great interest to our audience.
(By the way, if you were hoping for more AI/ML content, head on over to our sister channel, the AWS Machine Learning Blog!).
Without further ado, here are our top posts from 2024!
In keeping with Let’s Architect! series, we have our first of three favorites for the year. This set of resources helps you apply Well-Architected standards in practice.
As I said, Let’s Architect! has a winning series, and they’ve got a finger on the pulse of the tech world. This post about machine learning showcases some of the most exciting things happening at AWS.
Figure 3. Let’s Architect
If you’re more interested in generative AI, you can also take a look at another post from 2024: Let’s Architect! GenAI
Preparedness is another common theme in this year’s favorites. Michael, John, and Saurabh are well-versed in multi-Region architecture, and they’re here to share some strategies to contain failure impact.
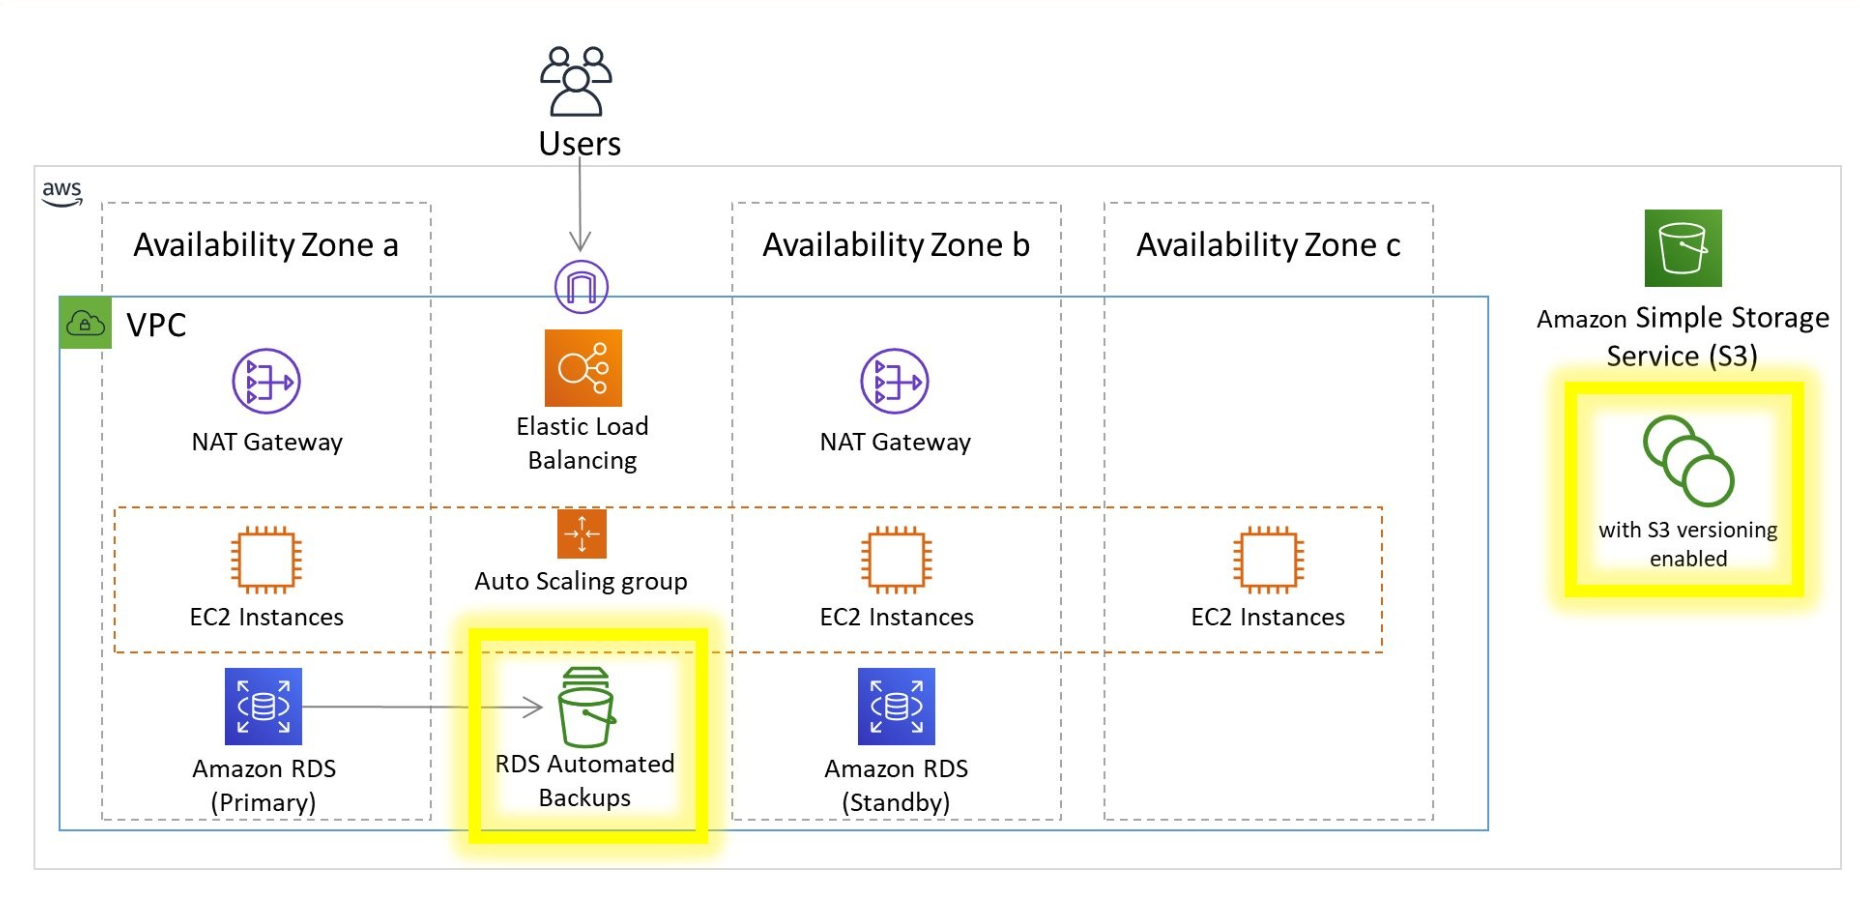
Figure 4. When the application experiences an impairment using S3 resources in the primary Region, it fails over to use an S3 bucket in the secondary Region.
Let’s talk cost optimization. This post about a three-tier architecture that relies on the AWS Free Tier is a must-read for anyone looking for tips to help them avoid unnecessary costs (and that’s everyone).
Figure 5. Example of a three-tier architecture on AWS
As usual, Haleh & team are pros at making sure the Well-Architected Framework is current and relevant. Take a look at the enhanced and expanded guidance in all six pillars.
One more winning post from Luca, Federica, Vittorio, and Zamira! This collection of developer resources includes new ideas in AWS Lambda, Amazon Q Developer, and Amazon DynamoDB.
Frugality AND Well-Architected? What a winning combo! This post, inspired by the 2023 re:Invent keynote, outlines the seven laws of Frugal Architecture.
And finally, our number one post of the year! Amit and Luiz showcase a customer solution with real-world applications that builds on the guidelines of other posts in this list! Well done!
Figure 10. The Pilot Light scenario for a 3-tier application that has application servers and a database deployed in two Regions
Thank you!
As always, thanks to our contributors for their dedication and desire to share, and to you, our readers! We would be nothing with you. Literally.
For other top post lists, see our Top 10 and Top 5 posts from previous years.
The design of cloud workloads can be a complex task, where a perfect and universal solution doesn’t exist. We should balance all the different trade-offs and find an optimal solution based on our context. But how does it work in practice? Which guiding principles should we follow? Which are the most important areas we should focus on?
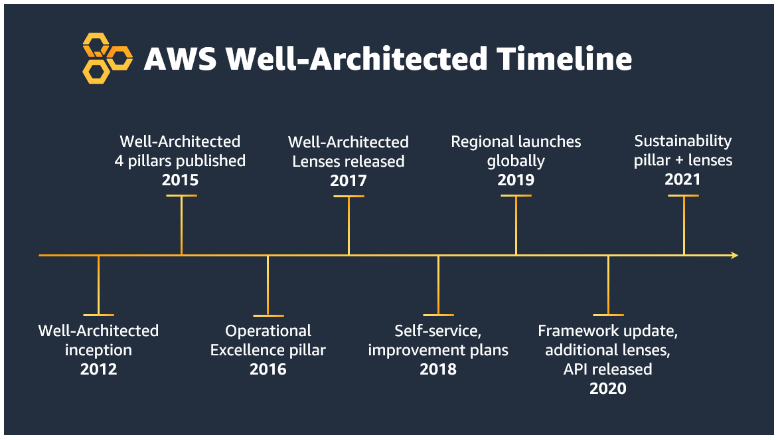
In this blog, we will try to answer some of these questions by sharing a set of resources related to the AWS Well-Architected Framework. The Framework shares a set of methods to help you understand the pros and cons of decisions you make while building cloud systems. By following this resource, you will learn architectural best practices for designing and operating reliable, secure, efficient, cost-effective, and sustainable systems in the cloud. The framework is constantly updated; it evolves as the technology landscape changes. Check out the latest updates from June 2024.
The AWS Well-Architected Framework is constantly updated across all six pillars. The security pillar added a new best practice area: application security (AppSec). In this session, you can learn about the best practices highlighted in this area. Review four key domains: organization and culture, security of the pipeline, security in the pipeline, and dependency management. Each area provides a set of principles that you can implement and provides a complete view of how you design, develop, build, deploy, and operate secure workloads in the cloud.
Figure 1. Security should be part of the end-to-end development process, and implementing best practices both in the application code as well as in the underlying infrastructure components.
How can we integrate different systems as a consequence of an acquisition? Mergers and acquisitions operations bring different people with different backgrounds together, with a need of driving systems convergence. Both organization and technical challenges can arise in this scenario. The Mergers and Acquisitions (M&A) Lens is a collection of customer-proven design principles, best practices, and prescriptive guidance to help you integrate the IT systems of two or more organizations. This lens helps companies follow AWS prescribed best practices during technical integration, drive cost optimization, and expedite merger and acquisition value realization.
Figure 2. If the seller company runs on another cloud platform or on-premises, the acquirer should plan a cloud migration while guaranteeing continuity of service.
One of the best ways to become familiar with new concepts and methodologies consist of doing hands-on work to absorb the techniques properly. For each Let’s Architect! blog, we tend to share at least one workshop associated with the topic. The AWS Well-Architected Framework covers six different pillars, so today we share the AWS Well-Architected Labs to cover each area of the framework. Feel free to jump across the different workshops and start building!
Figure 3. Sustainability is one of the pillars in the framework. Asynchronous and scheduled processing are key techniques for improving the sustainability and costs of cloud architectures.
Distributed systems are difficult to design. It’s even more difficult to test them and prove they are working. Formal methods enable the early discovery of design bugs that can escape the guardrails of design reviews and automated testing only to get uncovered in production. This video shows how AWS uses P, an open source, state machine–based programming language for formal modelling and analysis of distributed systems.
You can learn from AWS engineers and architects how to use P for your own applications to find bugs early in the development process and increase developer velocity. This tool is used in AWS to reason out the correctness of cloud services (for example, Amazon Simple Storage Service and Amazon DynamoDB).
Figure 4. An example of a distributed system for processing transactions.
Thanks for reading! Hopefully, you got interesting insights into the methodologies for designing Well-Architected systems. In the next blog, we will talk about multi-region architectures. We will understand when they are actually needed, and which design principles should be applied.
To revisit any of our previous posts or explore the entire series, visit the Let’s Architect! page.
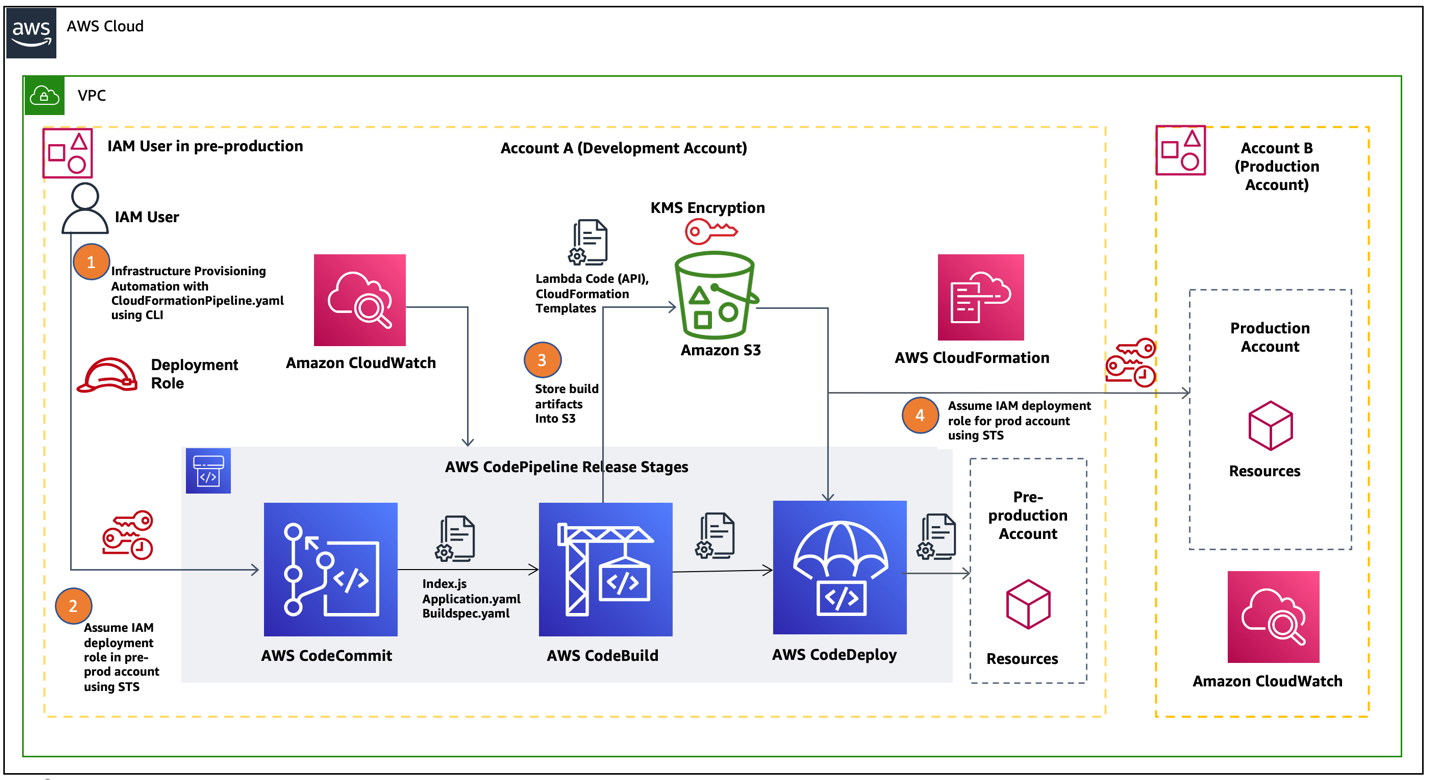
Today, more than 400 organizations have signed The Climate Pledge, a commitment to reach net-zero carbon by 2040. Some of the drivers that lead to setting explicit climate goals include customer demand, current and anticipated government relations, employee demand, investor demand, and sustainability as a competitive advantage. AWS customers are increasingly interested in ways to drive sustainability actions. In this blog, we will walk through how we can apply existing enterprise data to better understand and estimate Scope 1 carbon footprint using Amazon Simple Storage Service (S3) and Amazon Athena, a serverless interactive analytics service that makes it easy to analyze data using standard SQL.
The Greenhouse Gas Protocol
The Greenhouse Gas Protocol (GHGP) provides standards for measuring and managing global warming impacts from an organization’s operations and value chain.
The greenhouse gases covered by the GHGP are the seven gases required by the UNFCCC/Kyoto Protocol (which is often called the “Kyoto Basket”). These gases are carbon dioxide (CO2), methane (CH4), nitrous oxide (N2O), the so-called F-gases (hydrofluorocarbons and perfluorocarbons), sulfur hexafluoride (SF6) nitrogen trifluoride (NF3). Each greenhouse gas is characterized by its global warming potential (GWP), which is determined by the gas’s greenhouse effect and its lifetime in the atmosphere. Since carbon dioxide (CO2) accounts for about 76 percent of total man-made greenhouse gas emissions, the global warming potential of greenhouse gases are measured relative to CO2, and are thus expressed as CO2-equivalent (CO2e).
The GHGP divides an organization’s emissions into three primary scopes:
Scope 1 – Direct greenhouse gas emissions (for example from burning fossil fuels)
Scope 2 – Indirect emissions from purchased energy (typically electricity)
Scope 3 – Indirect emissions from the value chain, including suppliers and customers
How do we estimate greenhouse gas emissions?
There are different methods to estimating GHG emissions that includes the Continuous Emissions Monitoring System (CEMS) Method, the Spend-Based Method, and the Consumption-Based Method.
Direct Measurement – CEMS Method
An organization can estimate its carbon footprint from stationary combustion sources by performing a direct measurement of carbon emissions using the CEMS method. This method requires continuously measuring the pollutants emitted in exhaust gases from each emissions source using equipment such as gas analyzers, gas samplers, gas conditioning equipment (to remove particulate matter, water vapor and other contaminants), plumbing, actuated valves, Programmable Logic Controllers (PLCs) and other controlling software and hardware. Although this approach may yield useful results, CEMS requires specific sensing equipment for each greenhouse gas to be measured, requires supporting hardware and software, and is typically more suitable for Environment Health and Safety applications of centralized emission sources. More information on CEMS is available here.
Spend-Based Method
Because the financial accounting function is mature and often already audited, many organizations choose to use financial controls as a foundation for their carbon footprint accounting. The Economic Input-Output Life Cycle Assessment (EIO LCA) method is a spend-based method that combines expenditure data with monetary-based emission factors to estimate the emissions produced. The emission factors are published by the U.S. Environment Protection Agency (EPA) and other peer-reviewed academic and government sources. With this method, you can multiply the amount of money spent on a business activity by the emission factor to produce the estimated carbon footprint of the activity.
For example, you can convert the amount your company spends on truck transport to estimated kilograms (KG) of carbon dioxide equivalent (CO₂e) emitted as shown below.
Estimated Carbon Footprint = Amount of money spent on truck transport * Emission Factor [1]
Although these computations are very easy to make from general ledgers or other financial records, they are most valuable for initial estimates or for reporting minor sources of greenhouse gases. As the only user-provided input is the amount spent on an activity, EIO LCA methods aren’t useful for modeling improved efficiency. This is because the only way to reduce EIO-calculated emissions is to reduce spending. Therefore, as a company continues to improve its carbon footprint efficiency, other methods of estimating carbon footprint are often more desirable.
Consumption-Based Method
From either Enterprise Resource Planning (ERP) systems or electronic copies of fuel bills, it’s straightforward to determine the amount of fuel an organization procures during a reporting period. Fuel-based emission factors are available from a variety of sources such as the US Environmental Protection Agency and commercially-licensed databases. Multiplying the amount of fuel procured by the emission factor yields an estimate of the CO2e emitted through combustion. This method is often used for estimating the carbon footprint of stationary emissions (for instance backup generators for data centers or fossil fuel ovens for industrial processes).
If for a particular month an enterprise consumed a known amount of motor gasoline for stationary combustion, the Scope 1 CO2e footprint of the stationary gasoline combustion can be estimated in the following manner:
Organizations may estimate their carbon emissions by using existing data found in fuel and electricity bills, ERP data, and relevant emissions factors, which are then consolidated in to a data lake. Using existing analytics tools such as Amazon Athena and Amazon QuickSight an organization can gain insight into its estimated carbon footprint.
The data architecture diagram below shows an example of how you could use AWS services to calculate and visualize an organization’s estimated carbon footprint.
Customers have the flexibility to choose the services in each stage of the data pipeline based on their use case. For example, in the data ingestion phase, depending on the existing data requirements, there are many options to ingest data into the data lake such as using the AWS Command Line Interface (CLI),AWS DataSync, or AWS Database Migration Service.
Example of calculating a Scope 1 stationary emissions footprint with AWS services
Let’s assume you burned 100 standard cubic feet (scf) of natural gas in an oven. Using the US EPA emission factors for stationary emissions we can estimate the carbon footprint associated with the burning. In this case the emission factor is 0.05449555 Kg CO2e /scf.[3]
Amazon S3 is ideal for building a data lake on AWS to store disparate data sources in a single repository, due to its virtually unlimited scalability and high durability. Athena, a serverless interactive query service, allows the analysis of data directly from Amazon S3 using standard SQL without having to load the data into Athena or run complex extract, transform, and load (ETL) processes. Amazon QuickSight supports creating visualizations of different data sources, including Amazon S3 and Athena, and the flexibility to use custom SQL to extract a subset of the data. QuickSight dashboards can provide you with insights (such as your company’s estimated carbon footprint) quickly, and also provide the ability to generate standardized reports for your business and sustainability users.
The snapshot of the S3 console shows two newly added folders that contains the files.
To create new table schemas, we start by running the following script for the gas utilization table in the Athena query editor using Hive DDL. The script defines the data format, column details, table properties, and the location of the data in S3.
After creating the table schema in Athena, we run the below query against the gas utilization table that includes details of gas bills to show the gas utilization and the associated charges, such as gas public purpose program surcharge (PPPS) and total charges after taxes for the year of 2020:
SELECT * FROM "gasutilization" where year = 2020;
We are also able to analyze the emission factor data showing the different fuel types and their corresponding CO2e emission as shown in the screenshot.
With the emission factor and the gas utilization data, we can run the following query below to get an estimated Scope 1 carbon footprint alongside other details. In this query, we joined the gas utilization table and the gas emission factor table on fuel id and multiplied the gas usage in standard cubic foot (scf) by the emission factor to get the estimated CO2e impact. We also selected the month, year, total charge, and gas usage measured in therms and scf, as these are often attributes that are of interest for customers.
SELECT "gasutilization"."usage_scf" * "gas_emission_factor"."emission_factor"
AS "estimated_CO2e_impact",
"gasutilization"."month",
"gasutilization"."year",
"gasutilization"."totalcharge",
"gasutilization"."usage_therms",
"gasutilization"."usage_scf"
FROM "gasutilization"
JOIN "gas_emission_factor"
on "gasutilization"."fuel_id"="gas_emission_factor"."fuel_id";
Lastly, Amazon QuickSight allows visualization of different data sources, including Amazon S3 and Athena, and the flexibility to use custom SQL to get a subset of the data. The following is an example of a QuickSight dashboard showing the gas utilization, gas charges, and estimated carbon footprint across different years.
We have just estimated the Scope 1 carbon footprint for one source of stationary combustion. If we were to do the same process for all sources of stationary and mobile emissions (with different emissions factors) and add the results together, we could roll up an accurate estimate of our Scope 1 carbon emissions for the entire business by only utilizing native AWS services and our own data. A similar process will yield an estimate of Scope 2 emissions, with grid carbon intensity in the place of Scope 1 emission factors.
Summary
This blog discusses how organizations can use existing data in disparate sources to build a data architecture to gain better visibility into Scope 1 greenhouse gas emissions. With Athena, S3, and QuickSight, organizations can now estimate their stationary emissions carbon footprint in a repeatable way by applying the consumption-based method to convert fuel utilization into an estimated carbon footprint.
If you are interested in information on estimating your organization’s carbon footprint with AWS, please reach out to your AWS account team and check out AWS Sustainability Solutions.
References
An example from page four of Amazon’s Carbon Methodology document illustrates this concept. Amount spent on truck transport: $100,000 EPA Emission Factor: 1.556 KG CO2e /dollar of truck transport Estimated CO₂e emission: $100,000 * 1.556 KG CO₂e/dollar of truck transport = 155,600 KG of CO2e ↑
For example, Gasoline consumed: 1,000 US Gallons EPA Emission Factor: 8.81 Kg of CO2e /gallon of gasoline combusted Estimated CO2e emission = 1,000 US Gallons * 8.81 Kg of CO2e per gallon of gasoline consumed= 8,810 Kg of CO2e. EPA Emissions Factor for stationary emissions of motor gasoline is 8.78 kg CO2 plus .38 grams of CH4, plus .08 g of N2O. Combining these emission factors using 100-year global warming potential for each gas (CH4:25 and N2O:298) gives us Combined Emission Factor = 8.78 kg + 25*.00038 kg + 298 *.00008 kg = 8.81 kg of CO2e per gallon.↑
The Emission factor per scf is 0.05444 kg of CO2 plus 0.00103 g of CH4 plus 0.0001 g of N2O. To get this in terms of CO2e we need to multiply the emission factor of the other two gases by their global warming potentials (GWP). The 100-year GWP for CH4 and N2O are 25 and 298 respectively. Emission factors and GWPs come from the US EPA website. ↑
About the Authors
Thomas Burns,SCR, CISSP is a Principal Sustainability Strategist and Principal Solutions Architect at Amazon Web Services. Thomas supports manufacturing and industrial customers world-wide. Thomas’s focus is using the cloud to help companies reduce their environmental impact both inside and outside of IT.
Aileen Zheng is a Solutions Architect supporting US Federal Civilian Sciences customers at Amazon Web Services (AWS). She partners with customers to provide technical guidance on enterprise cloud adoption and strategy and helps with building well-architected solutions. She is also very passionate about data analytics and machine learning. In her free time, you’ll find Aileen doing pilates, taking her dog Mumu out for a hike, or hunting down another good spot for food! You’ll also see her contributing to projects to support diversity and women in technology.
Scope 3 emissions are indirect greenhouse gas emissions that are a result of a company’s activities, but occur outside the company’s direct control or ownership. Measuring these emissions requires collecting data from a wide range of external sources, like raw material suppliers, transportation providers, and other third parties. One of the main challenges with Scope 3 data collection is ensuring data confidentiality when sharing proprietary information between third-party suppliers. Organizations are hesitant to share information that could potentially be used by competitors. This can make it difficult for companies to accurately measure and report on their Scope 3 emissions. And the result is that it limits their ability to manage climate-related impacts and risks.
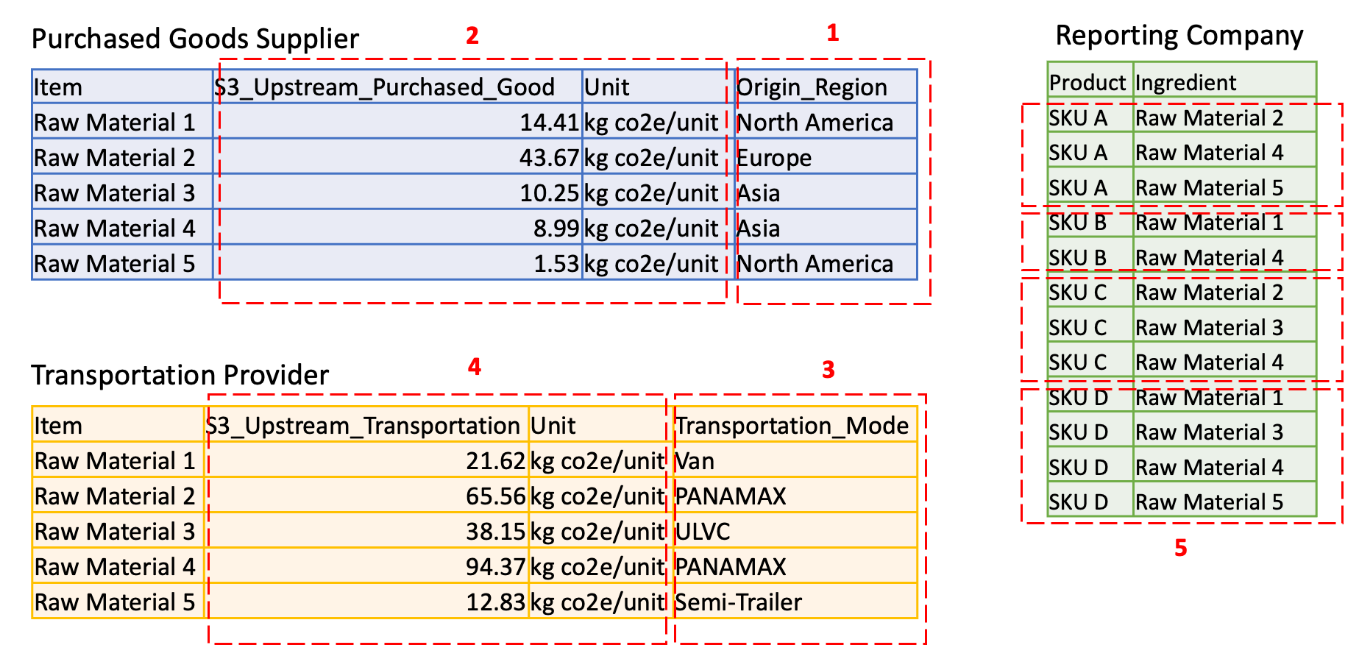
In this blog, we show how to use AWS Clean Rooms to share Scope 3 emissions data between a reporting company and two of their value chain partners (a raw material purchased goods supplier and a transportation provider). Data confidentially requirements are specified by each organization before participating in the data AWS Clean Rooms collaboration (see Figure 1).
Figure 1. Data confidentiality requirements of reporting company and value chain partners
Each account has confidential data described as follows:
Column 1 lists the raw material Region of origin. This is business confidential information for supplier.
Column 2 lists the emission factors at the raw material level. This is sensitive information for the supplier.
Column 3 lists the mode of transportation. This is business confidential information for the transportation provider.
Column 4 lists the emissions in transporting individual items. This is sensitive information for the transportation provider.
Rows in column 5 list the product recipe at the ingredient level. This is trade secret information for the reporting company.
Overview of solution
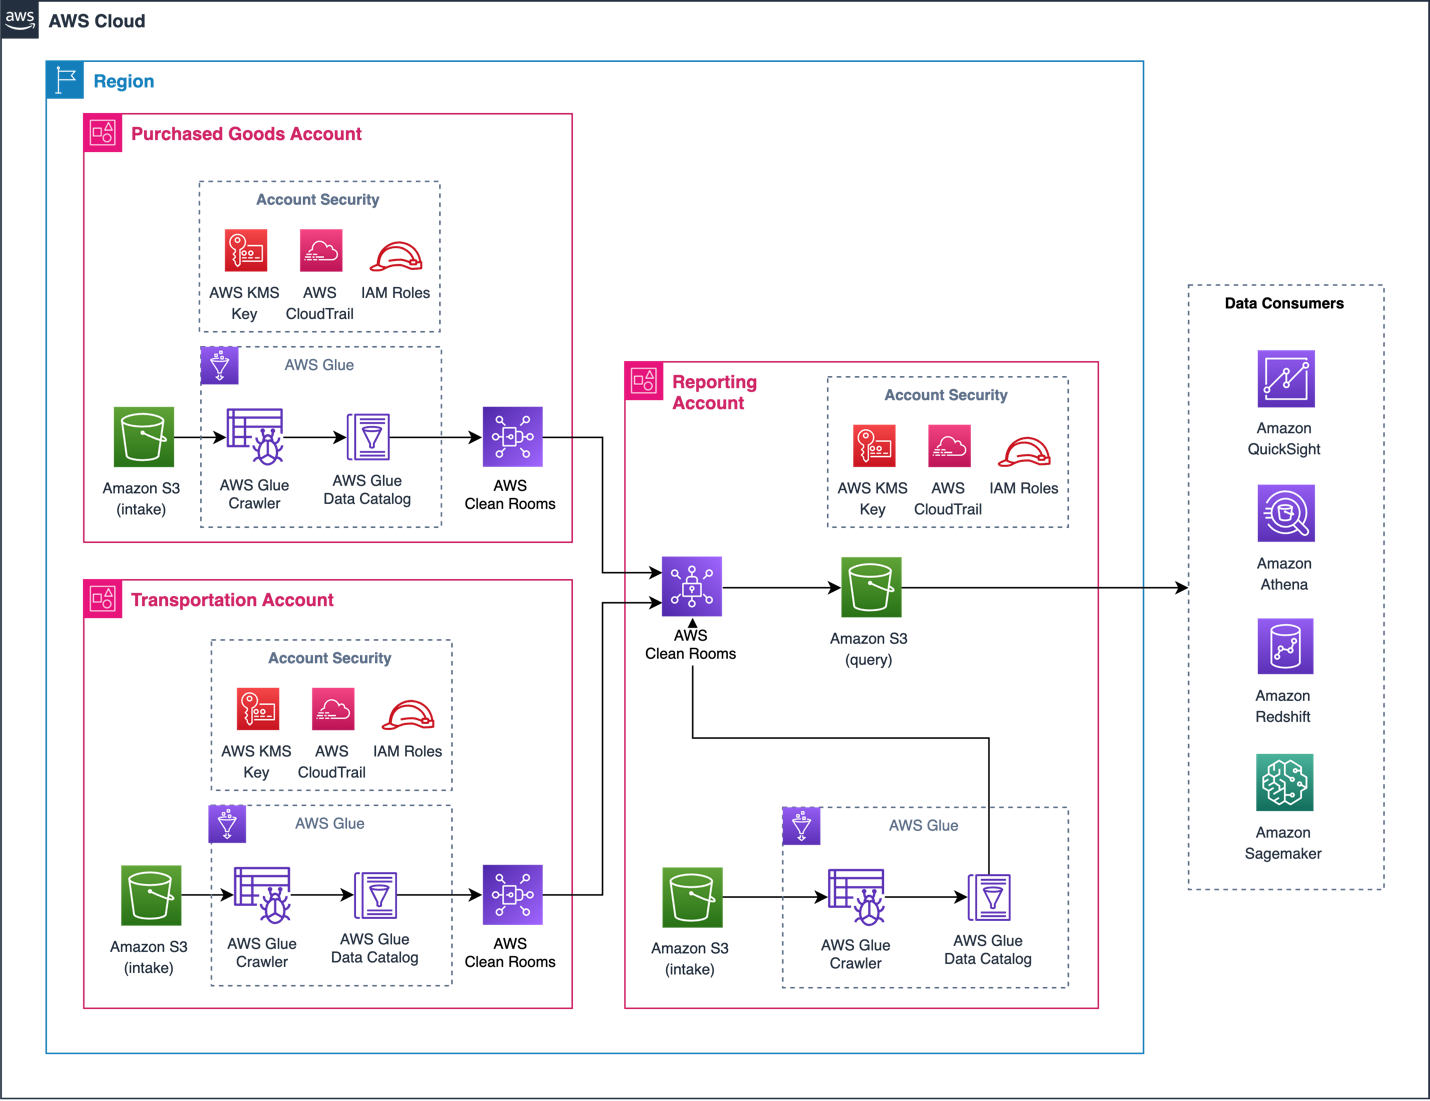
In this architecture, AWS Clean Rooms is used to analyze and collaborate on emission datasets without sharing, moving, or revealing underlying data to collaborators (shown in Figure 2).
Figure 2. Architecture for AWS Clean Rooms Scope 3 collaboration
Three AWS accounts are used to demonstrate this approach. The Reporting Account creates a collaboration in AWS Clean Rooms and invites the Purchased Goods Account and Transportation Account to join as members. All accounts can protect their underlying data with privacy-enhancing controls to contribute data directly from Amazon Simple Storage Service (S3) using AWS Glue tables.
The Purchased Goods Account includes users who can update the purchased goods bucket. Similarly, the Transportation Account has users who can update the transportation bucket. The Reporting Account can run SQL queries on the configured tables. AWS Clean Rooms only returns results complying with the analysis rules set by all participating accounts.
Prerequisites
For this walkthrough, you should have the following prerequisites:
Although Amazon S3 and AWS Clean Rooms are free-tier eligible, a low fee applies to AWS Glue. Clean-up actions are provided later in this blog post to minimize costs.
Configuration
We configured the S3 buckets for each AWS account as follows:
Reporting Account: reportingcompany.csv
Purchased Goods Account: purchasedgood.csv
Transportation Account: transportation.csv
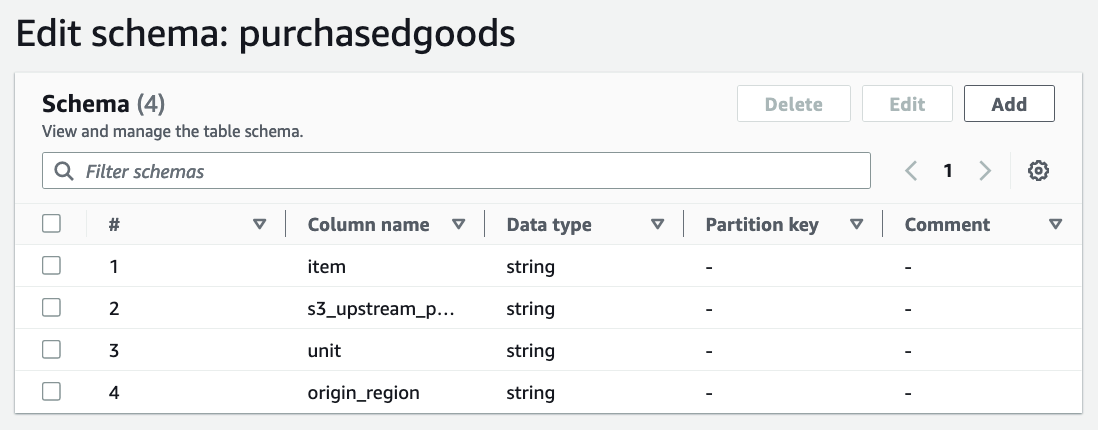
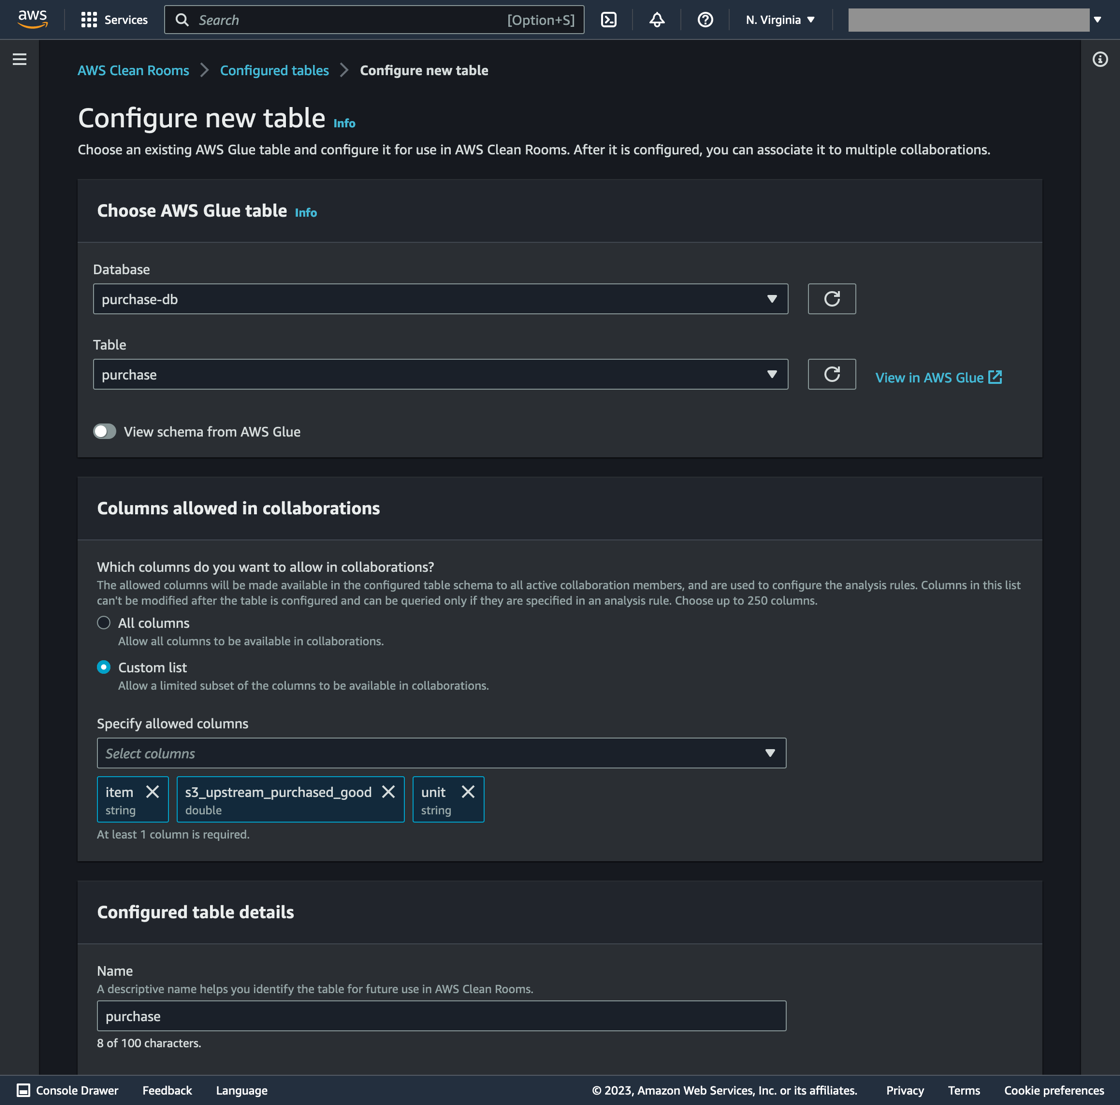
Create an AWS Glue Data Catalog for each S3 data source following the method in the Glue Data Catalog Developer Guide. The AWS Glue tables should match the schema detailed previously in Figure 1, for each respective account (see Figure 3).
Figure 3. Configured AWS Glue table for ‘Purchased Goods’
Data consumers can be configured to ingest, analyze, and visualize queries (refer back to Figure 2). We will tag the Reporting Account Glue Database as “reporting-db” and the Glue Table as “reporting.” Likewise, the Purchased Goods Account will have “purchase-db” and “purchase” tags.
Security
Additional actions are recommended to secure each account in a production environment. To configure encryption, review the Further Reading section at the end of this post, AWS Identity and Access Management (IAM) roles, and Amazon CloudWatch.
Walkthrough
This walkthrough consists of four steps:
The Reporting Account creates the AWS Clean Rooms collaboration and invites the Purchased Goods Account and Transportation Account to share data.
The Purchased Goods Account and Transportation Account accepts this invitation.
Rules are applied for each collaboration account restricting how data is shared between AWS Clean Rooms collaboration accounts.
The SQL query is created and run in the Reporting Account.
1. Create the AWS Clean Rooms collaboration in the Reporting Account
(The steps covered in this section require you to be logged into the Reporting Account.)
Navigate to the AWS Clean Rooms console and click Create collaboration.
In the Details section, type “Scope 3 Clean Room Collaboration” in the Name field.
Scroll to the Member 1 section. Enter “Reporting Account” in the Member display name field.
In Member 2 section, enter “Purchased Goods Account” for your first collaboration member name, with their account number in the Member AWS account ID box.
Click Add another member and add “Transportation Account” as the third collaborator with their AWS account number.
Choose the “Reporting Account” as the Member who can query and receive result in the Member abilities section. Click Next.
Select Yes, join by creating membership now. Click Next.
Verify the collaboration settings on the Review and Create page, then select Create and join collaboration and create membership.
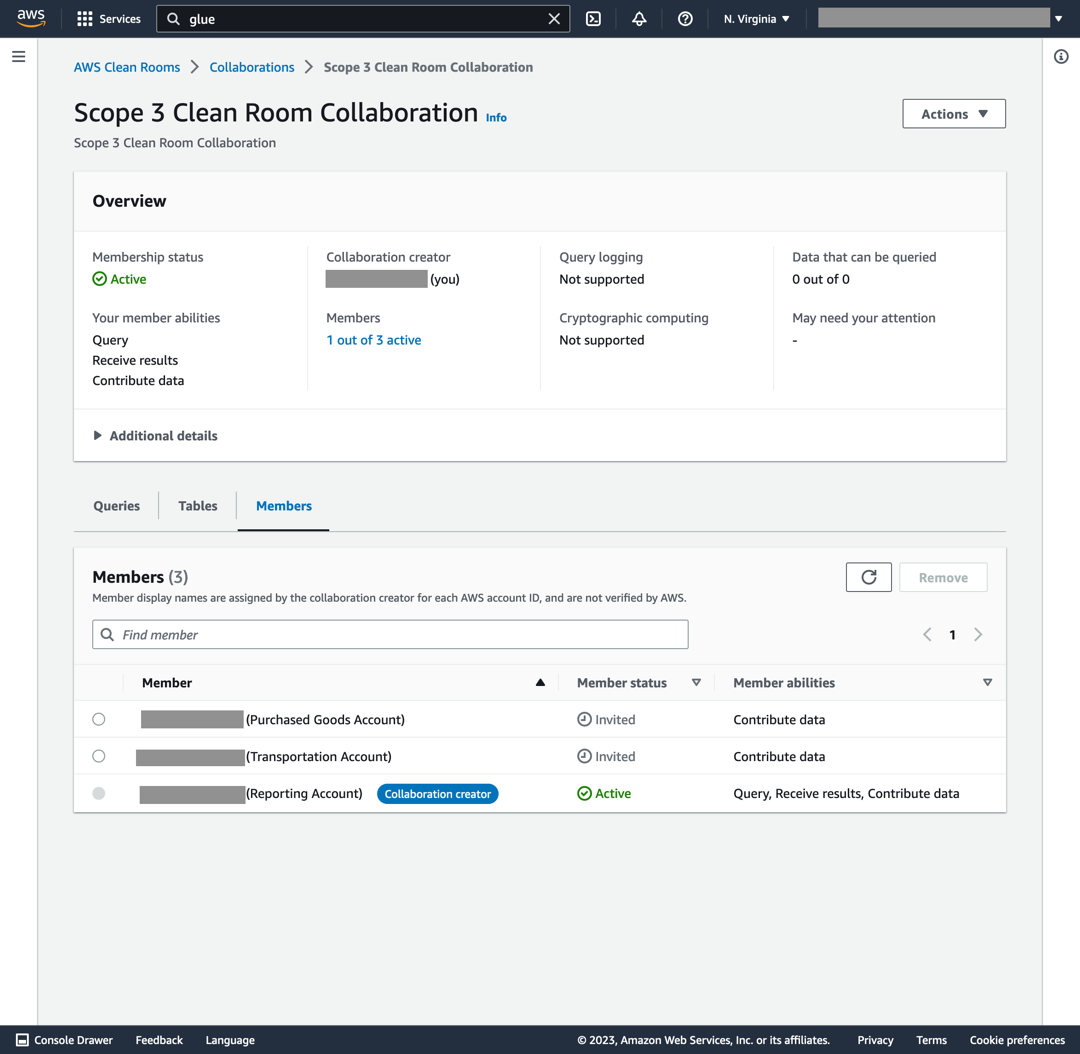
Both accounts will then receive an invitation to accept the collaboration (see Figure 4). The console reveals each member status as “Invited” until accepted. Next, we will show how the invited members apply query restrictions on their data.
Figure 4. New collaboration created in AWS Clean Rooms
2. Accept invitations and configure table collaboration rules
Steps in this section are applied to the Purchased Goods Account and Transportation Account following collaboration environment setup. For brevity, we will demonstrate steps using the Purchased Goods Account. Differences for the Transportation Account are noted.
Log in to the AWS account owning the Purchased Goods Account and accept the collaboration invitation.
Open the AWS Clean Rooms console and select Collaborations on the left-hand navigation pane, then click Available to join.
You will see an invitation from the Scope 3 Clean Room Collaboration. Click on Scope 3 Clean Room Collaboration and then Create membership.
Select Tables, then Associate table. Click Configure new table.
The next action is to associate the Glue table created from the purchasedgoods.csv file. This sequence restricts access to the origin_region column (transportation_mode for the Transportation Account table) in the collaboration.
In the Scope 3 Clean Room Collaboration, select Configured tables in the left-hand pane, then Configure new table. Select the AWS Glue table associated with purchasedgoods.csv (shown in Figure 5).
Verify the correct table section by toggling View schema from the AWS Glue slider bar.
In the Columns allowed in collaboration section, select all fields except for origin_region. This action prevents the origin_region column being accessed and viewed in the collaboration.
Complete this step by selecting Configure new table.
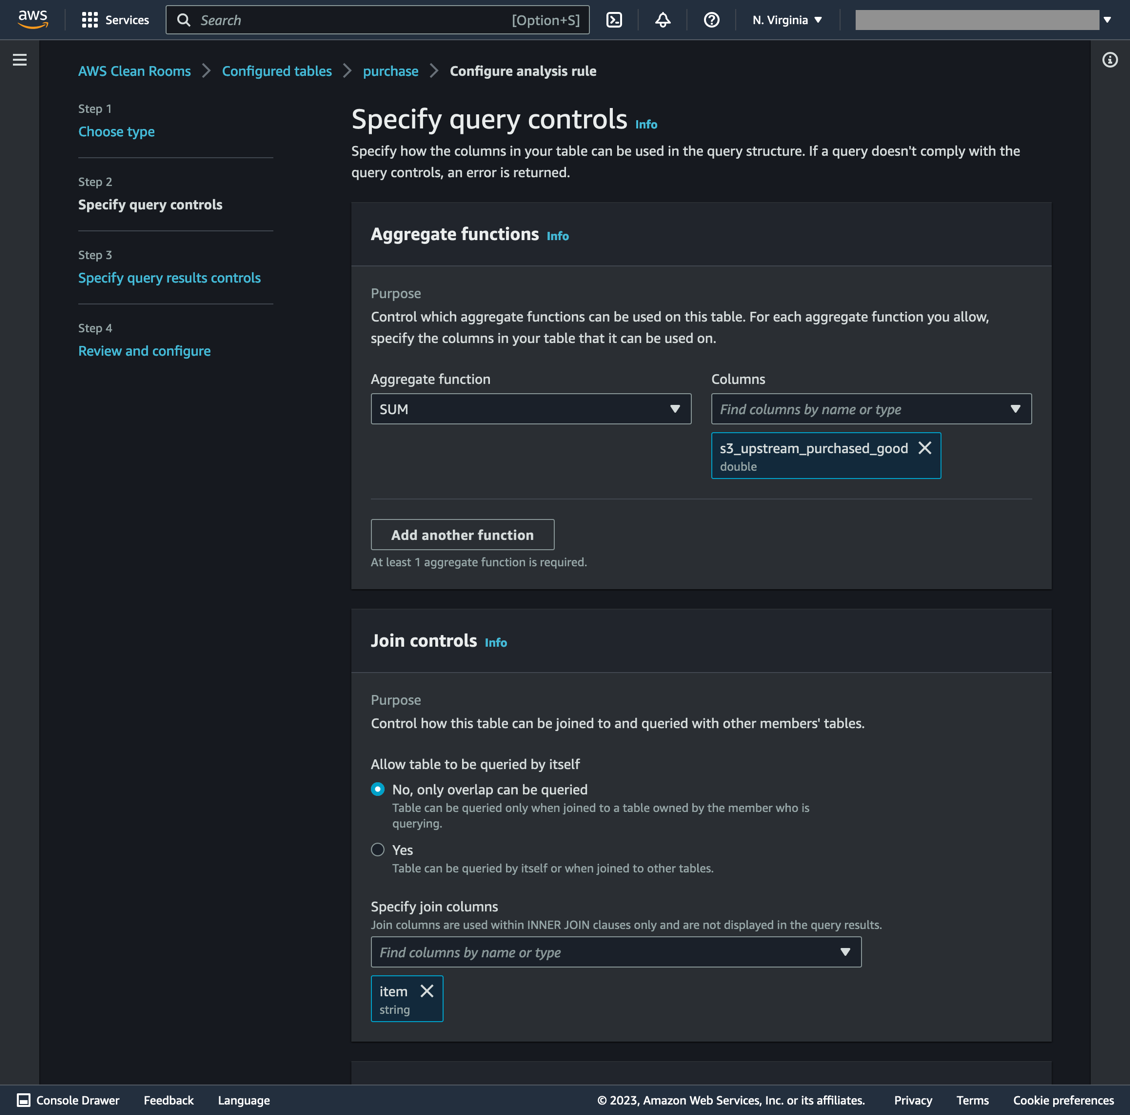
Select SUM as the Aggregate function and s3_upstream_purchased_good for the column.
Under Join controls, select Specify Join column. Select “item” from the list of options. This permits SQL join queries to execute on the “item” column. Click Next.
Figure 6. Table rules for the Purchased Goods account
The next page specifies the minimum number of unique rows to aggregate for the “join” command. Select “item” for Column name and “2” for the Minimum number of distinct values. Click Next.
To confirm the table configuration query rules, click Configure analysis rule.
The final step is to click Associate to collaboration and select Scope 3 Clean Room Collaboration in the pulldown menu. Select Associate table after page refresh.
The procedure in this section is repeated for the Transportation Account, with the following exceptions:
The columns shared in this collaboration are item, s3_upstream_transportation, and unit.
The Aggregation function is a SUM applied on the s3_upstream_transportation column.
The item column has an Aggregation constraint minimum of two distinct values.
3. Configure table collaboration rules inside the Reporting Account
At this stage, member account tables are created and shared in the collaboration. The next step is to configure the Reporting Account tables in the Reporting Account’s AWS account.
Navigate to AWS Clean Rooms. Select Configured tables, then Configure new table.
Select the Glue database and table associated with the file reportingcompany.csv.
Under Columns allowed in collaboration, select All columns, then Configure new table.
Configure collaboration rules by clicking Configure analysis rule using the Guided workflow.
Select Aggregation type, then Next.
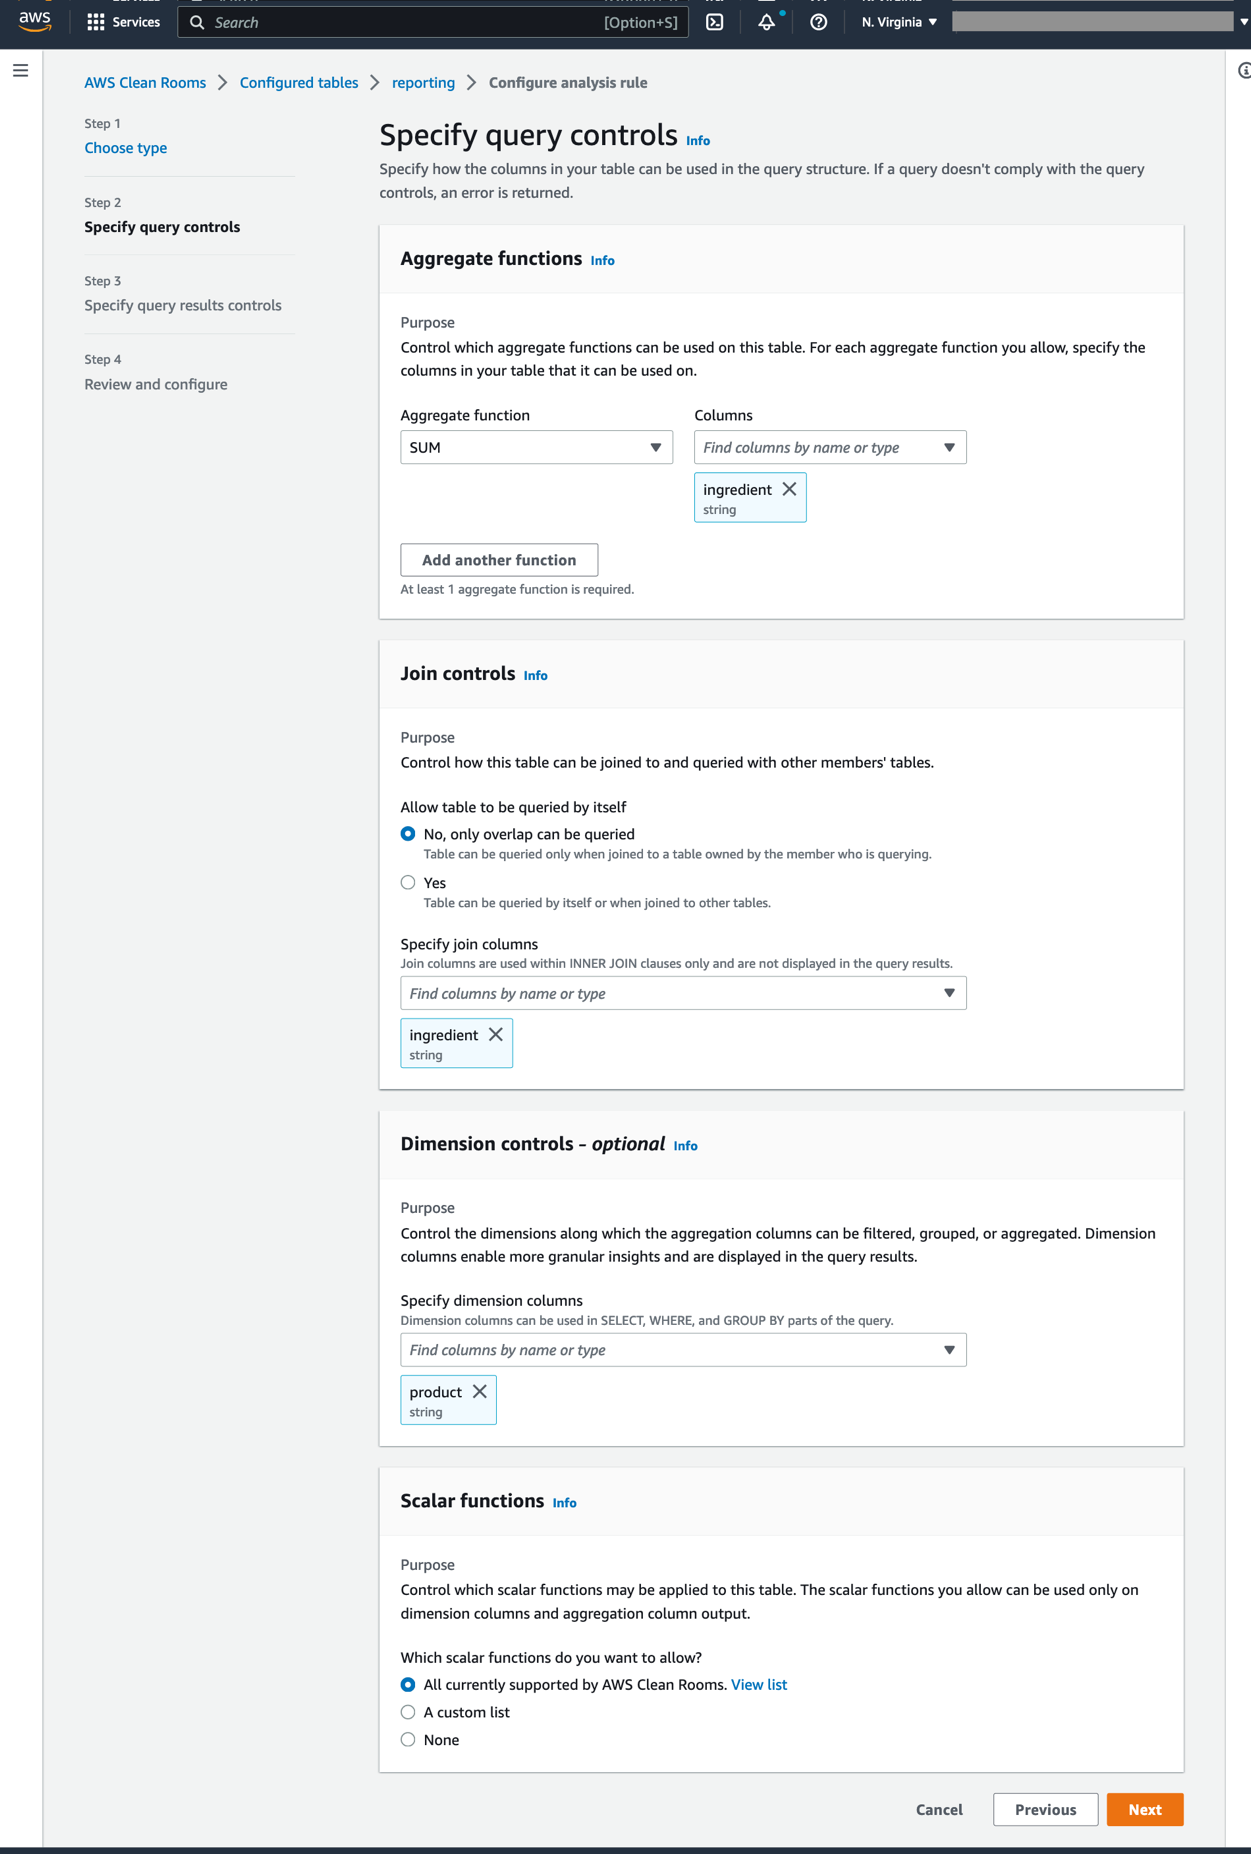
Select SUM as the Aggregate function and ingredient for the column (see Figure 7).
Only SQL join queries can be executed on the ingredient column by selecting it in the Specify join columns section.
In the Dimension controls, select product. This option permits grouping by product name in the SQL query. Select Next.
Select None in the Scalar functions section. Click Next. Read more about scalar functions in the AWS Clean Rooms User Guide.
Figure 7. Table rules for the Reporting account
On the next page, select ingredient for Column name and 2 for the Minimum number of distinct values. Click Next. To confirm query control submission, select Configure analysis rule on the next page.
Validate the setting in the Review and Configure window, then select Next.
Inside the Configured tables tab, select Associate to collaboration. Assign the table to the Scope 3 Clean Rooms Collaboration.
Select the Scope 3 Clean Room Collaboration in the dropdown menu. Select Choose collaboration. On the Scope 3 Clean Room Collaboration page, select reporting, then Associate table.
4. Create and run the SQL query
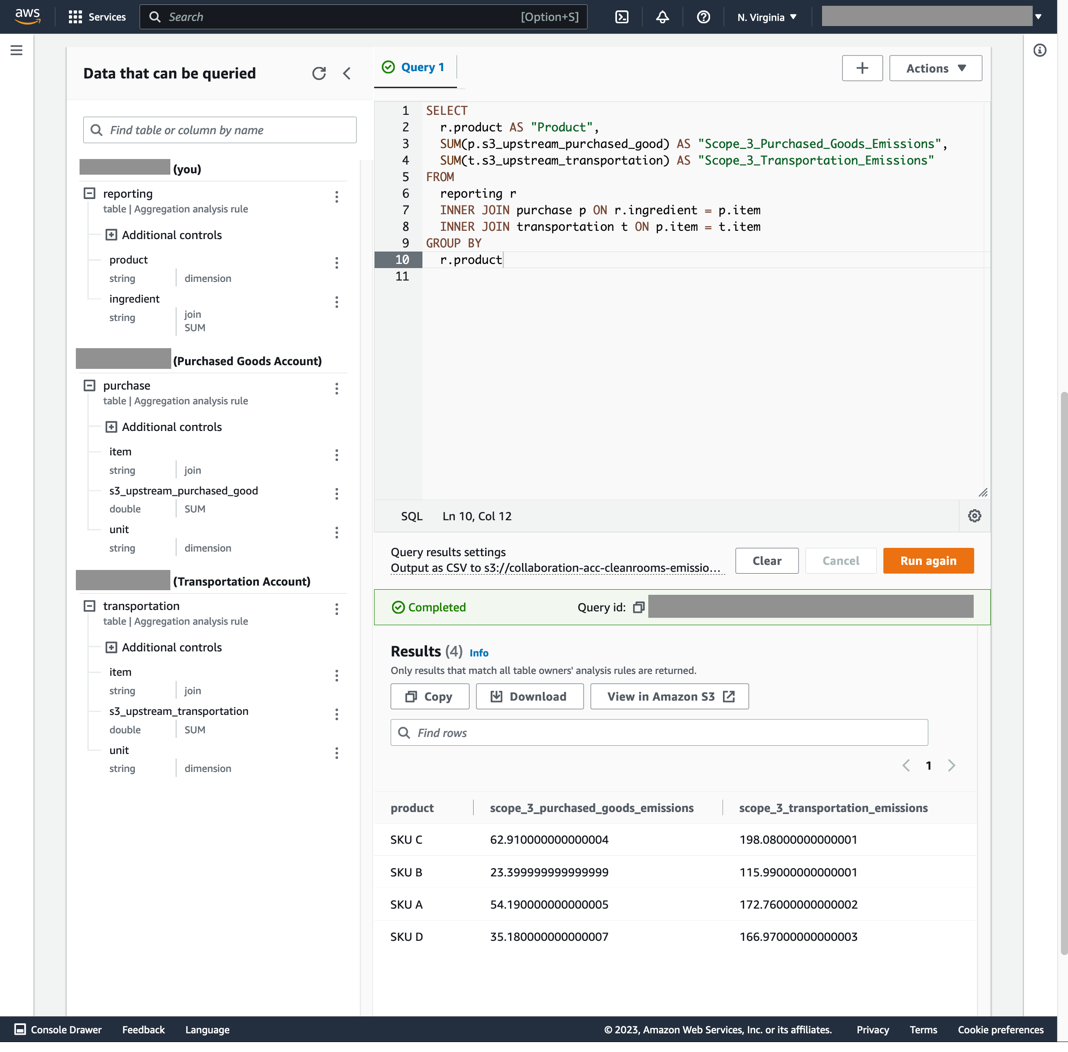
Queries can now be run inside the Reporting Account (shown in Figure 8).
Figure 8. Query results in the Clean Rooms Reporting Account
Select an S3 destination to output the query results. Select Action, then Set results settings.
Enter the S3 bucket name, then click Save changes.
Paste this SQL snippet inside the query text editor (see Figure 8):
SELECT r.product AS “Product”, SUM(p.s3_upstream_purchased_good) AS “Scope_3_Purchased_Goods_Emissions”, SUM(t.s3_upstream_transportation) AS “Scope_3_Transportation_Emissions” FROM reporting r INNER JOIN purchase p ON r.ingredient = p.item INNER JOIN transportation t ON p.item = t.item GROUP BY r.product
Click Run query. The query results should appear after a few minutes on the initial query, but will take less time for subsequent queries.
Conclusion
This example shows how Clean Rooms can aggregate data across collaborators to produce total Scope 3 emissions for each product from purchased goods and transportation. This query was performed between three organizations without revealing underlying emission factors or proprietary product recipe to one another. This alleviates data confidentially concerns and improves sustainability reporting transparency.
Clean Up
The following steps are taken to clean up all resources created in this walkthrough:
Member and Collaboration Accounts:
AWS Clean Rooms: Disassociate and delete collaboration tables
AWS Clean Rooms: Remove member account in the collaboration
AWS Glue: Delete the crawler, database, and tables
AWS IAM: Delete the AWS Clean Rooms service policy
Amazon S3: Delete the CSV file storage buckets ·
Collaboration Account only:
Amazon S3: delete the SQL query bucket
AWS Clean Rooms: delete the Scope 3 Clean Room Collaboration
With Earth Month upon us and in celebration of Earth Day tomorrow, 4/22, sustainability is top-of-mind for individuals and organizations around the world. But it doesn’t take a certain time of year to act toward the urgent need to innovate and adopt smarter, more efficient solutions!
Sustainable cloud architectures are fundamental to sustainable workloads, and we’re spotlighting content that helps build solutions to meet and advance sustainability goals. Here’s our recent post round up to make sustainable architectures meaningful and actionable for customers of all kinds:
This post spotlights the AWS re:Invent 2022 sustainability track and key conversations around sustainability of, in, and through the cloud. It covers key uses cases and breakout sessions, including AWS customers demonstrating best practices from the AWS Well-Architected Framework Sustainability Pillar. Hear about these and more:
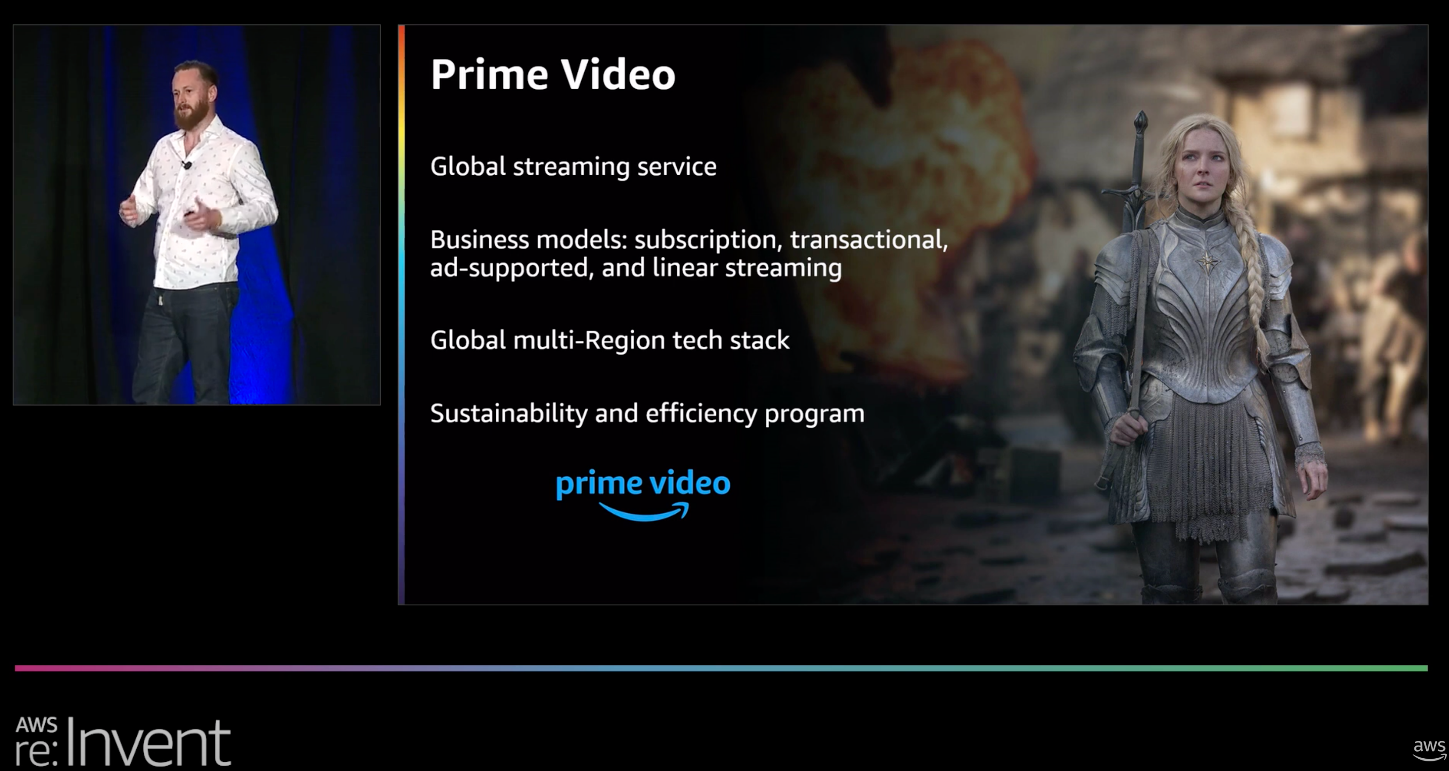
The Amazon Prime Video experience using the AWS sustainability improvement process for Thursday Night Football streaming
Pinterest’s sustainability journey with AWS from Pinterest Chief Architect David Chaiken
The most recent sustainability focused Let’s Architect! series post shares practical tips for making cloud applications more sustainable. It also covers the AWS customer carbon footprint tool to help organizations monitor, analyze, and reduce their AWS footprint, and details how Amazon Prime Video used these tools to establish baselines and drive significant efficiencies across their AWS usage.
Integrating a data lake and purpose-built data services to efficiently build analytics workloads to provide speed and agility at scale in Part 1 – Data Ingestion and Data Lake
Did you know workload Region selection significantly affects KPIs including performance, cost, and carbon footprint? For example, when an AWS Region is chosen based on the market-based method, emissions are calculated using the electricity that business purchases. Contracting and purchasing electricity produced by renewable energy sources like solar and wind are more sustainable. Region selection is is another part of the Well-Architected Framework Sustainability Pillar, and this blog post covers key considerations for choosing AWS Regions per workload.
Check back soon for more earth-friendly advice from our experts!
AWS re:Invent 2022 featured 24 breakout sessions, chalk talks, and workshops on sustainability. In this blog post, we’ll highlight the sessions and announcements and discuss their relevance to the sustainability of, in, and through the cloud.
First, we’ll look at AWS’ initiatives and progress toward delivering efficient, shared infrastructure, water stewardship, and sourcing renewable power.
Lastly, we’ll highlight use cases presented by customers who are solving sustainability challenges through the cloud.
Sustainability of the cloud
The re:Invent 2022 Sustainability in AWS global infrastructure (SUS204) session is a deep dive on AWS’ initiatives to optimize data centers to minimize their environmental impact. These increases in efficiency provide carbon reduction opportunities to customers who migrate workloads to the cloud. Amazon’s progress includes:
Amazon is on path to power its operations with 100% renewable energy by 2025, five years ahead of the original target of 2030.
Amazon is the largest corporate purchaser of renewable energy with more than 400 projects globally, including recently announced projects in India, Canada, and Singapore. Once operational, the global renewable energy projects are expected to generate 56,881 gigawatt-hours (GWh) of clean energy each year.
At re:Invent, AWS announced that it will become water positive (Water+) by 2030. This means that AWS will return more water to communities than it uses in direct operations. This Water stewardship and renewable energy at scale (SUS211) session provides an excellent overview of our commitment. For more details, explore the Water Positive Methodology that governs implementation of AWS’ water positive goal, including the approach and measuring of progress.
Sustainability in the cloud
Independent of AWS efforts to make the cloud more sustainable, customers continue to influence the environmental impact of their workloads through the architectural choices they make. This is what we call sustainability in the cloud.
At re:Invent 2021, AWS launched the sixth pillar of the AWS Well-Architected Framework to explain the concepts, architectural patterns, and best practices to architect sustainably. In 2022, we extended the Sustainability Pillar best practices with a more comprehensive structure of anti-patterns to avoid, expected benefits, and implementation guidance.
Let’s explore sessions that show the Sustainability Pillar in practice. In the session Architecting sustainably and reducing your AWS carbon footprint (SUS205), Elliot Nash, Senior Manager of Software Development at Amazon Prime Video, dives deep on the exclusive streaming of Thursday Night Football on Prime Video. The teams followed the Sustainability Pillar’s improvement process from setting goals to replicating the successes to other teams. Implemented improvements include:
Automation of contingency switches that turn off non-critical customer features under stress to flatten demand peaks
Pre-caching content shown to the whole audience at the end of the game
Another example of sustainability KPIs was presented in the Build a cost-, energy-, and resource-efficient compute environment (CMP204) session by Troy Gasaway, Vice President of Infrastructure and Engineering at Arm—a global semiconductor industry leader. Troy’s team wanted to measure, track, and reduce the impact of Electronic Design Automation (EDA) jobs. They used Amazon EC2 instances’ vCPU hours to calculate KPIs for Amazon EC2 Spot adoption, AWS Graviton adoption, and the resources needed per job.
The Sustainability Pillar recommends selecting Amazon EC2 instance types with the least impact and taking advantage of those designed to support specific workloads. The Sustainability and AWS silicon (SUS206) session gives an overview of the embodied carbon and energy consumption of silicon devices. The session highlights examples in which AWS silicon reduced the power consumption for machine learning (ML) inference with AWS Inferentia by 92 percent, and model training with AWS Trainium by 52 percent. Two effects contributed to the reduction in power consumption:
Purpose-built processors use less energy for the job
Due to better performance fewer instances are needed
David Chaiken, Chief Architect at Pinterest, shared Pinterest’s sustainability journey and how they complemented a rigid cost and usage management for ML workloads with data from the AWS Customer Carbon Footprint Tool, as in the figure below.
Figure 1. David Chaiken, Chief Architect at Pinterest, describes Pinterest’s sustainability journey with AWS
AWS announced the preview of a new generation of AWS Inferentia with the Inf2 instances, and C7gn instances. C7gn instances utilize the fifth generation of AWS Nitro cards. AWS Nitro offloads the host CPU to specialized hardware for a more consistent performance with lower CPU utilization. The new Nitro cards offer 40 percent better performance per watt than the previous generation.
Another best practice from the Sustainability Pillar is to use managed services. AWS is responsible for a large share of the optimization for resource efficiency for AWS managed services. We want to highlight the launch of AWS Verified Access. Traditionally, customers protect internal services from unauthorized access by placing resources into private subnets accessible through a Virtual Private Network (VPN). This often involves dedicated on-premises infrastructure that is provisioned to handle peak network usage of the staff. AWS Verified Access removes the need for a VPN. It shifts the responsibility for managing the hardware to securely access corporate applications to AWS and even improves your security posture. The service is built on AWS Zero Trust guiding principles and validates each application request before granting access. Explore the Introducing AWS Verified Access: Secure connections to your apps (NET214) session for demos and more.
Sustainability challenges are data problems that can be solved through the cloud with big data, analytics, and ML.
According to one study by PEDCA research, data centers in the EU consume approximately 3 percent of the EU’s energy generated. While it’s important to optimize IT for sustainability, we must also pay attention to reducing the other 97 percent of energy usage.
The session Serve your customers better with AWS Supply Chain (BIZ213) introduces AWS Supply Chain that generates insights into the data from your suppliers and your network to forecast and mitigate inventory risks. This service provides recommendations for stock rebalancing scored by distance to move inventory, risks, and also an estimation of the carbon emission impact.
We recommend revisiting the talks highlighted in this post to learn how you can utilize AWS to enhance your sustainability strategy. You can find all videos from the AWS re:Invent 2022 sustainability track in the Customer Enablement playlist. If you’d like to optimize your workloads on AWS for sustainability, visit the AWS Well-Architected Sustainability Pillar.
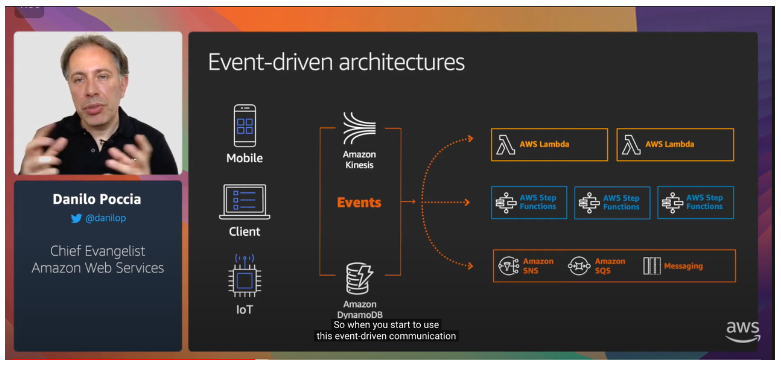
Sustainability is an important topic in the tech industry, as well as society as a whole, and defined as the ability to continue to perform a process or function over an extended period of time without depletion of natural resources or the environment.
One of the key elements to designing a sustainable workload is software architecture. Think about how event-driven architecture can help reduce the load across multiple microservices, leveraging solutions like batching and queues. In these cases, the main traffic is absorbed at the entry-point of a cloud workload and ease inside your system. On top of architecture, think about data patterns, hardware optimizations, multi-environment strategies, and many more aspects of a software development lifecycle that can contribute to your sustainable posture in the Cloud.
The key takeaway: designing with sustainability in mind can help you build an application that is not only durable but also flexible enough to maintain the agility your business requires.
In this edition of Let’s Architect!, we share hands-on activities, case studies, and tips and tricks for making your Cloud applications more sustainable.
This session provides updates on these programs and highlights the most effective techniques for optimizing your AWS architectures. Find out how Amazon Prime Video used these tools to establish baselines and drive significant efficiencies across their AWS usage.
The modern data architecture is the foundation for a sustainable and scalable platform that enables business intelligence. This AWS Architecture Blog series provides tips on how to develop a modern data architecture with sustainability in mind.
Comprised of two posts, it helps you revisit and enhance your current data architecture without compromising sustainability.
This workshop introduces participants to the AWS Well-Architected Framework, a set of best practices for designing and operating high-performing, highly scalable, and cost-efficient applications on AWS. The workshop also discusses how sustainability is critical to software architecture and how to use the AWS Well-Architected Framework to improve your application’s sustainability performance.
In this video, you can learn about the benefits of Rust and AWS Graviton to reduce energy consumption and increase performance. Rust combines the resource efficiency of programming languages, like C, with memory safety of languages, like Java. The video also explains the benefits deriving from AWS Graviton processors designed to deliver performance- and cost-optimized cloud workloads. This resource is very helpful to understand how sustainability can become a driver for cost optimization.
This blog post is written by Isha Dua Sr. Solutions Architect AWS, Ananth Kommuri Solutions Architect AWS, and Dr. Sam Mokhtari Sr. Sustainability Lead SA WA for AWS.
Today, more than ever, sustainability and cost-savings are top of mind for nearly every organization. Research has shown that AWS’ infrastructure is 3.6 times more energy efficient than the median of U.S. enterprise data centers and up to five times more energy efficient than the average in Europe. That said, simply migrating to AWS isn’t enough to meet the Environmental, Social, Governance (ESG) and Cloud Financial Management (CFM) goals that today’s customers are setting. In order to make conscious use of our planet’s resources, applications running on the cloud must be built with efficiency in mind.
That’s because cloud sustainability is a shared responsibility. At AWS, we’re responsible for optimizing the sustainability of the cloud – building efficient infrastructure, enough options to meet every customer’s needs, and the tools to manage it all effectively. As an AWS customer, you’re responsible for sustainability in the cloud – building workloads in a way that minimizes the total number of resource requirements and makes the most of what must be consumed.
Most AWS service charges are correlated with hardware usage, so reducing resource consumption also has the added benefit of reducing costs. In this blog post, we’ll highlight best practices for running efficient compute environments on AWS that maximize utilization and decrease waste, with both sustainability and cost-savings in mind.
First: Measure What Matters
Application optimization is a continuous process, but it has to start somewhere. The AWS Well Architected Framework Sustainability pillar includes an improvement process that helps customers map their journey and understand the impact of possible changes. There is a saying “you can’t improve what you don’t measure.”, which is why it’s important to define and regularly track metrics which are important to your business. Scope 2 Carbon emissions, such as those provided by the AWS Customer Carbon Footprint Tool, are one metric that many organizations use to benchmark their sustainability initiatives, but they shouldn’t be the only one.
Even after AWS meets our 2025 goal of powering our operations with 100% renewable energy, it’s still be important to maximize the utilization and minimize the consumption of the resources that you use. Just like installing solar panels on your house, it’s important to limit your total consumption to ensure you can be powered by that energy. That’s why many organizations use proxy metrics such as vCPU Hours, storage usage, and data transfer to evaluate their hardware consumption and measure improvements made to infrastructure over time.
In addition to these metrics, it’s helpful to baseline utilization against the value delivered to your end-users and customers. Tracking utilization alongside business metrics (orders shipped, page views, total API calls, etc) allows you to normalize resource consumption with the value delivered to your organization. It also provides a simple way to track progress towards your goals over time. For example, if the number of orders on your ecommerce site remained constant over the last month, but your AWS infrastructure usage decreased by 20%, you can attribute the efficiency gains to your optimization efforts, not changes in your customer behavior.
Utilize all of the available pricing models
Compute tasks are the foundation of many customers’ workloads, so it typically sees biggest benefit by optimization. Amazon EC2 provides resizable compute across a wide variety of compute instances, is well-suited to virtually every use case, is available via a number of highly flexible pricing options. One of the simplest changes you can make to decrease your costs on AWS is to review the purchase options for the compute and storage resources that you already use.
Amazon EC2 provides multiple purchasing options to enable you to optimize your costs based on your needs. Because every workload has different requirements, we recommend a combination of purchase options tailored for your specific workload needs. For steady-state workloads that can have a 1-3 year commitment, using Compute Savings Plans helps you save costs, move from one instance type to a newer, more energy-efficient alternative, or even between compute solutions (e.g., from EC2 instances to AWS Lambda functions, or AWS Fargate).
EC2 Spot instances are another great way to decrease cost and increase efficiency on AWS. Spot Instances make unused Amazon EC2 capacity available for customers at discounted prices. At AWS, one of our goals it to maximize utilization of our physical resources. By choosing EC2 Spot instances, you’re running on hardware that would otherwise be sitting idle in our datacenters. This increases the overall efficiency of the cloud, because more of our physical infrastructure is being used for meaningful work. Spot instances use market-based pricing that changes automatically based on supply and demand. This means that the hardware with the most spare capacity sees the highest discounts, sometimes up to XX% off on-demand prices, to encourage our customers to choose that configuration.
Savings Plans are ideal for predicable, steady-state work. On-demand is best suited for new, stateful, and spiky workloads which can’t be instance, location, or time flexible. Finally, Spotinstances are a great way to supplement the other options for applications that are fault tolerant and flexible. AWS recommends using a mix of pricing models based on your workload needs and ability to be flexible.
By using these pricing models, you’re creating signals for your future compute needs, which helps AWS better forecast resource demands, manage capacity, and run our infrastructure in a more sustainable way.
Choose efficient, purpose-built processors whenever possible
Choosing the right processor for your application is as equally important consideration because under certain use cases a more powerful processor can allow for the same level of compute power with a smaller carbon footprint. AWS has the broadest choice of processors, such as Intel – Xeon scalable processors, AMD – AMD EPYC processors, GPU’s FPGAs, and Custom ASICs for Accelerated Computing.
AWS Graviton3, AWS’s latest and most power-efficient processor, delivers 3X better CPU performance per-watt than any other processor in AWS, provides up to 40% better price performance over comparable current generation x86-based instances for various workloads, and helps customers reduce their carbon footprint. Consider transitioning your workload to Graviton-based instances to improve the performance efficiency of your workload (see AWS Graviton Fast Start and AWS Graviton2 for ISVs). Note the considerations when transitioning workloads to AWS Graviton-based Amazon EC2 instances.
The goal of efficient environments is to use only as many resources as required in order to meet your needs. Thankfully, this is made easier on the cloud because of the variety of instance choices, the ability to scale dynamically, and the wide array of tools to help track and optimize your cloud usage. At AWS, we offer a number of tools and services that can help you to optimize both the size of individual resources, as well as scale the total number of resources based on traffic and load.
Two of the most important tools to measure and track utilization are Amazon CloudWatch and the AWS Cost & Usage Report (CUR). With CloudWatch, you can get a unified view of your resource metrics and usage, then analyze the impact of user load on capacity utilization over time. The Cost & Usage Report (CUR) can help you understand which resources are contributing the most to your AWS usage, allowing you to fine-tune your efficiency and save on costs. CUR data is stored in S3, which allows you to query it with tools like Amazon Athena or generate custom reports in Amazon QuickSight or integrate with AWS Partner tools for better visibility and insights.
An example of a tool powered by CUR data is the AWS Cost Intelligence Dashboard. The Cost Intelligence Dashboard provides a detailed, granular, and recommendation-driven view of your AWS usage. With its prebuilt visualizations, it can help you identify which service and underlying resources are contributing the most towards your AWS usage, and see the potential savings you can realize by optimizing. It even provides right sizing recommendations and the appropriate EC2 instance family to help you optimize your resources.
Cost Intelligence Dashboard is also integrated with AWS Compute Optimizer, which makes instance type and size recommendations based on workload characteristics. For example, it can identify if the workload is CPU-intensive, if it exhibits a daily pattern, or if local storage is accessed frequently. Compute Optimizer then infers how the workload would have performed on various hardware platforms (for example, Amazon EC2 instance types) or using different configurations (for example, Amazon EBS volume IOPS settings, and AWS Lambda function memory sizes) to offer recommendations. For stable workloads, check AWS Compute Optimizer at regular intervals to identify right-sizing opportunities for instances. By right sizing with Compute Optimizer, you can increase resource utilization and reduce costs by up to 25%. Similarly, Lambda Power Tuning can help choose the memory allocated to Lambda functions is an optimization process that balances speed (duration) and cost while lowering your carbon emission in the process.
CloudWatch metrics are used to power EC2 Autoscaling, which can automatically choose the right instance to fit your needs with attribute-based instance selection and scale your entire instance fleet up and down based on demand in order to maintain high utilization. AWS Auto Scaling makes scaling simple with recommendations that let you optimize performance, costs, or balance between them. Configuring and testing workload elasticity will help save money, maintain performance benchmarks, and reduce the environmental impact of workloads. You can utilize the elasticity of the cloud to automatically increase the capacity during user load spikes, and then scale down when the load decreases. Amazon EC2 Auto Scaling allows your workload to automatically scale up and down based on demand. You can set up scheduled or dynamic scaling policies based on metrics such as average CPU utilization or average network in or out. Then, you can integrate AWS Instance Scheduler and Scheduled scaling for Amazon EC2 Auto Scaling to schedule shut downs and terminate resources that run only during business hours or on weekdays to further reduce your carbon footprint.
Design applications to minimize overhead and use fewer resources
Using the latest Amazon Machine Image (AMI) gives you updated operating systems, packages, libraries, and applications, which enable easier adoption as more efficient technologies become available. Up-to-date software includes features to measure the impact of your workload more accurately, as vendors deliver features to meet their own sustainability goals.
By reducing the amount of equipment that your company has on-premises and using managed services, you can help facilitate the move to a smaller, greener footprint. Instead of buying, storing, maintaining, disposing of, and replacing expensive equipment, businesses can purchase services as they need that are already optimized with a greener footprint. Managed services also shift responsibility for maintaining high average utilization and sustainability optimization of the deployed hardware to AWS. Using managed services will help distribute the sustainability impact of the service across all of the service tenants, thereby reducing your individual contribution. The following services help reduce your environmental impact because capacity management is automatically optimized.
You can run Amazon ECS on AWS Fargate to avoid the undifferentiated heavy lifting by leveraging sustainability best practices AWS put in place for management of the control plane.
You can use Auto-scaling for AWS Glue to enable on-demand scaling up and scaling down of the computing resources.
Centralized data centers consume a lot of energy, produce a lot of carbon emissions and cause significant electronic waste. While more data centers are moving towards green energy, an even more sustainable approach (alongside these so-called “green data centers”) is to actually cut unnecessary cloud traffic, central computation and storage as much as possible by shifting computation to the edge. Edge Computing stores and uses data locally, on or near the device it was created on. This reduces the amount of traffic sent to the cloud and, at scale, can limit the overall energy used and carbon emissions.
Use storage that best supports how your data is accessed and stored to minimize the resources provisioned while supporting your workload. Solid state devices (SSDs) are more energy intensive than magnetic drives and should be used only for active data use cases. You should look into using ephemeral storage whenever possible and categorize, centralize, deduplicate, and compress persistent storage.
AWS Outposts, AWS Local Zones and AWS Wavelength services deliver data processing, analysis, and storage close to your endpoints, allowing you to deploy APIs and tools to locations outside AWS data centers. Build high-performance applications that can process and store data close to where it’s generated, enabling ultra-low latency, intelligent, and real-time responsiveness. By processing data closer to the source, edge computing can reduce latency, which means that less energy is required to keep devices and applications running smoothly. Edge computing can help to reduce the carbon footprint of data centers by using renewable energy sources such as solar and wind power.
Conclusion
In this blog post, we discussed key methods and recommended actions you can take to optimize your AWS compute infrastructure for resource efficiency. Using the appropriate EC2 instance types with the right size, processor, instance storage and pricing model can enhance the sustainability of your applications. Use of AWS managed services, options for edge computing and continuously optimizing your resource usage can further improve the energy efficiency of your workloads. You can also analyze the changes in your emissions over time as you migrate workloads to AWS, re-architect applications, or deprecate unused resources using the Customer Carbon Footprint Tool.
Ready to get started? Check out the AWS Sustainability page to find out more about our commitment to sustainability and learn more about renewable energy usage, case studies on sustainability through the cloud, and more.
As we wrap up 2022, we want to take a moment to shine a bright light on our readers, who spend their time exploring our posts, providing generous feedback, and asking poignant questions! Much appreciation goes to our Solutions Architects, who work tirelessly to identify and produce what our customers need.
Without any further ado, here are the top 10 AWS Architecture Blog posts of 2022…
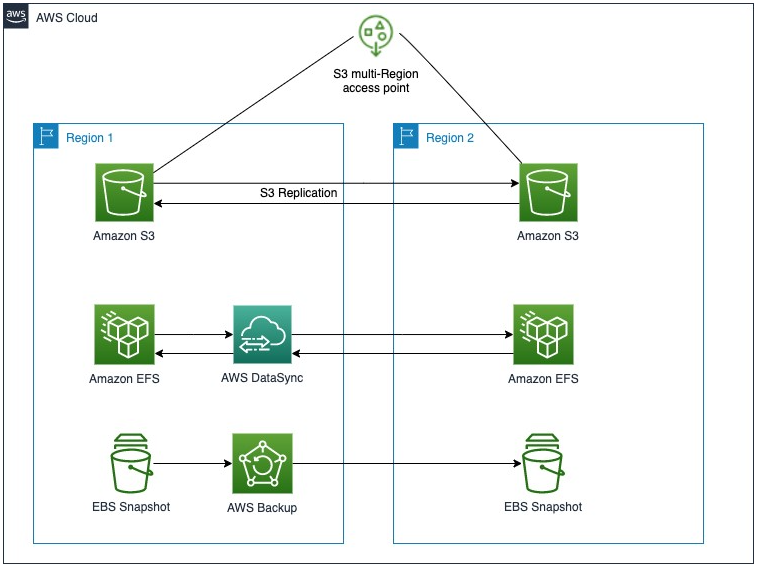
Joe Chapman, Senior Solutions Architect, and Seth Eliot, Principal Developer Advocate, come in at #1 with a review of AWS services that offer cross-Region data replication—getting data where in needs to be, quickly!
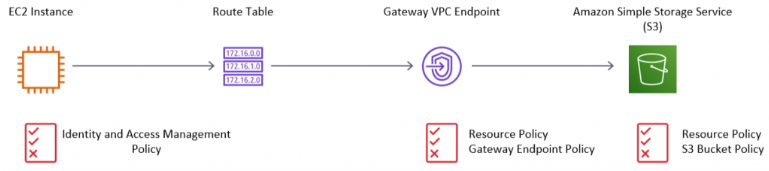
Nigel Harris and team. explain the benefits of using Amazon VPC endpoints, and how to appropriately restrict access to endpoints and the services they connect to. Learn more by taking the VPC Endpoint Workshop in the AWS Workshop Studio!
In this technical how-to post, Shreya Pathak and Medha Shree demonstrate how to configure AWS Application Migration Service to migrate workloads from one AWS Region to another.
The Let’s Architect! Team claims 4 of the top 10 spots for 2022! Luca, Laura, Vittorio, and Zamira kick-off the series by providing material to help our customers design sustainable architectures and create awareness on the topic of sustainability.
In this post, the Let’s Architect! Team shares insights into reimagining a serverless environment, including how to start prototype and scale to mass adoption using decoupled systems, integration approaches, serverless architectural patterns and best practices, and more!
For a three-in-a-row, the Let’s Architect! Team shares tools and methodologies for architects to learn and experiment with. This post was also a celebration of International Women’s Day, with half of the tools detailed developed with or by women!
Well-Architected is tried and true AWS, describing key concepts, design principles, and architecture best practices for cloud workloads. In this post, Haleh Najafzadeh, Senior Solutions Architecture Manager for AWS Well-Architected, updates our readers on improvements to the Well-Architected Framework across all six pillars.
Joe and Seth are back at #8, covering AWS services and features used for messaging, deployment, monitoring, and management in multi-Region applications.
“The need for resilient workloads transcends all customer industries…” In their last top 10 post, the team provides resources to help build resilience into your AWS architecture.
Subrahmanyam Madduru and team demonstrate how to automate release deployments in a repeatable and agile manner, reducing manual errors and increasing the speed of delivery for business capabilities.
Goodbye, 2022!
A big thank you to all our readers and authors! Your feedback and collaboration are appreciated and help us produce better content every day.
From all of us at the AWS Architecture Blog, happy holidays!
To conclude Impact Week, which has been filled with announcements about new initiatives and features that we are thrilled about, today we are publishing our 2022 Impact Report.
In short, the Impact Report is an annual summary highlighting how we are helping build a better Internet and the progress we are making on our environmental, social, and governance priorities. It is where we showcase successes from Cloudflare Impact programs, celebrate awards and recognitions, and explain our approach to fundamental values like transparency and privacy.
We believe that a better Internet is principled, for everyone, and sustainable; these are the three themes around which we constructed the report. The Impact Report also serves as our repository for disclosures consistent with our commitments for the Global Reporting Initiative (GRI), Sustainability Accounting Standards Board (SASB), and UN Global Compact (UNGC).
Explore how we are expanding the value and scope of our Cloudflare Impact programs
Review our latest diversity statistics — and our newest employee resource group
Understand how we are supporting humanitarian and human rights causes
Read quick summaries of Impact Week announcements
Examine how we calculate and validate emissions data
As fantastic as 2022 has been for scaling up Cloudflare Impact and making strides toward a better Internet, we are aiming even higher in 2023. To keep up with developments throughout the year, follow us on Twitter and LinkedIn, and keep an eye out for updates on our Cloudflare Impact page.
In July 2021, Cloudflare described that although we did not start out with the goal to reduce the Internet’s environmental impact, that has changed. Our mission is to help build a better Internet, and clearly a better Internet must be sustainable.
As we continue to hunt for efficiencies in every component of our network hardware, every piece of software we write, and every Internet protocol we support, we also want to understand in terms of Internet architecture how moving network security, performance, and reliability functions like those offered by Cloudflare from on-premise solutions to the cloud affects sustainability.
To that end, earlier this year we commissioned a study from the consulting firm Analysys Mason to evaluate the relative carbon efficiency of network functions like firewalls, WAF, SD-WAN, DDoS protection, content servers, and others that are provided through Cloudflare against similar on-premise solutions.
Although the full report will not be available until next year, we are pleased to share that according to initial findings:
Cloudflare Web Application Firewall (WAF) “generates up to around 90% less carbon than on-premises appliances at low-medium traffic demand.”
Needless to say, we are excited about the possibilities of these early findings, and look forward to the full report which early indications suggest will show more ways in which moving to Cloudflare will help reduce your infrastructure’s carbon footprint. However, like most things at Cloudflare, we see this as only the beginning.
Fixing the Internet’s energy/emissions problem
The Internet has a number of environmental impacts that need to be addressed, including raw material extraction, water consumption by data centers, and recycling and e-waste, among many others. But, none of those are more urgent than energy and emissions.
According to the United Nations, energy generation is the largest contributor to greenhouse gas emissions, responsible for approximately 35% of global emissions. If you think about all the power needed to run servers, routers, switches, data centers, and Internet exchanges around the world, it’s not surprising that the Boston Consulting Group found that 2% of all carbon output, about 1 billion metric tons per year, is attributable to the Internet.
Conceptually, reducing emissions from energy consumption is relatively straightforward — transition to zero emissions energy sources, and use energy more efficiently in order to speed that transition. However, practically, applying those concepts to a geographically distributed, disparate networks and systems like the global Internet is infinitely more difficult.
To date, much has been written about improving efficiency or individual pieces of network hardware (like Cloudflare’s deployment of more efficient Arm CPUs) and the power usage efficiency or “PUE” of hyperscale data centers. However, we think there are significant efficiency gains to be made throughout all layers of the network stack, as well as the basic architecture of the Internet itself. We think this study is the first step in investigating those underexplored areas.
How is the study being conducted?
Because the final report is still being written, we’ll have more information about its methodology upon publication. But, here is what we know so far.
To estimate the relative carbon savings of moving enterprise network functions, like those offered by Cloudflare, to the cloud, the Analysys Mason team is evaluating a wide range of enterprise network functions. These include firewalls, WAF, SD-WAN, DDoS protection, and content servers. For each function they are modeling a variety of scenarios, including usage, different sizes and types of organizations, and different operating conditions.
Information relating to the power and capacity of each on-premise appliance is being sourced from public data sheets from relevant vendors. Information on Cloudflare’s energy consumption is being compiled from internal datasets of total power usage of Cloudflare servers, and the allocation of CPU resources and traffic between different products.
Final report — coming soon!
According to the Analysys Mason team, we should expect the final report sometime in early 2023. Until then, we do want to mention again that the initial WAF results described above may be subject to change as the project continues, and assumptions and methodology are refined. Regardless, we think these are exciting developments and look forward to sharing the full report soon!
Today, as part of Cloudflare’s Impact Week, we’re excited to announce an opportunity for Cloudflare customers to make it easier to decommission and dispose of their used hardware appliances sustainably. We’re partnering with Iron Mountain to offer preferred pricing and discounts for Cloudflare customers that recycle or remarket legacy hardware through its service.
Replacing legacy hardware with Cloudflare’s network
Cloudflare’s products enable customers to replace legacy hardware appliances with our global network. Connecting to our network enables access to firewall (including WAF and Network Firewalls, Intrusion Detection Systems, etc), DDoS mitigation, VPN replacement, WAN optimization, and other networking and security functions that were traditionally delivered in physical hardware. These are served from our network and delivered as a service. This creates a myriad of benefits for customers including stronger security, better performance, lower operational overhead, and none of the headaches of traditional hardware like capacity planning, maintenance, or upgrade cycles. It’s also better for the Earth: our multi-tenant SaaS approach means more efficiency and a lower carbon footprint to deliver those functions.
But what happens with all that hardware you no longer need to maintain after switching to Cloudflare?
The life of a hardware box
The life of a hardware box begins on the factory line at the manufacturer. These are then packaged, shipped and installed at the destination infrastructure where they provide processing power to run front-end products or services, and routing network traffic. Occasionally, if the hardware fails to operate, or its performance declines over time, it will get fixed or will be returned for replacement under the warranty.
When none of these options work, the hardware box is considered end-of-life and it “dies”. This hardware must be decommissioned by being disconnected from the network, and then physically removed from the data center for disposal.
The useful lifespan of hardware depends on the availability of newer generations of processors which help realize critical efficiency improvements around cost, performance, and power. In general, the industry standard of hardware decommissioning timeline is between three and six years after installation. There are additional benefits to refreshing these physical assets at the lower end of the hardware lifespan spectrum, keeping your infrastructure at optimal performance.
In the instance where the hardware still works, but is replaced by newer technologies, it would be such a waste to discard this gear. Instead, there could be recoverable value in this outdated hardware. And simply tossing unwanted hardware into the trash indiscriminately, which will eventually become part of the landfill, causes devastating consequences as these electronic devices contain hazardous materials like lithium, palladium, lead, copper and cobalt or mercury, and those could contaminate the environment. Below, we explain sustainable alternatives and cost-beneficial practices one can pursue to dispose of your infrastructure hardware.
Option 1: Remarket / Reuse
For hardware that still works, the most sustainable route is to sanitize it of data, refurbish, and resell it in the second-hand market at a depreciated cost. Some IT asset disposition firms would also repurpose used hardware to maximize its market value. For example, harvesting components from a device to build part of another product and selling that at a higher price. For working parts that have very little resale value, companies can also consider reusing them to build a spare parts inventory for replacing failed parts later in the data centers.
The benefits of remarket and reuse are many. It helps maximize a hardware’s return of investment by including any reclaimed value at end-of-life stage, offering financial benefits to the business. And it reduces discarded electronics, or e-waste and their harmful efforts on our environment, helping socially responsible organizations build a more sustainable business. Lastly, it provides alternatives to individuals and organizations that cannot afford to buy new IT equipment.
Option 2: Recycle
For used hardware that is not able to be remarketed, it is recommended to engage an asset disposition firm to professionally strip it of any valuable and recyclable materials, such as precious metal and plastic, before putting it up for physical destruction. Similar to remarketing, recycling also reduces environmental impact, and cuts down the amount of raw materials needed to manufacture new products.
A key factor in hardware recycling is a secure chain of custody. Meaning, a supplier has the right certification, preferably its own fleet and secure facilities to properly and securely process the equipment.
Option 3: Destroy
From a sustainable point of view, this route should only be used as a last resort. When hardware does not operate as it is intended to, and has no remarketed nor recycled value, an asset disposition supplier would remove all the asset tags and information from it in preparation for a physical destruction. Depending on disposal policies, some companies would choose to sanitize and destroy all the data bearing hardware, such as SSD or HDD, for security reasons.
To further maximize recycling value and reduce e-waste, it is recommended to keep security policy up to date on discarded IT equipment and explore the option of reusing working devices after a professional data wiping as much as possible.
At Cloudflare, we follow an industry-standard capital depreciation timeline, which culminates in recycling actions through the engagement of IT asset disposition partners including Iron Mountain. Through these partnerships, besides data bearing hardware which follows the security policy to be sanitized and destroyed, approximately 99% of the rest decommissioned IT equipment from Cloudflare is sold or recycled.
Partnering with Iron Mountain to make sustainable goals more accessible
Hardware discomission can be a burden on a business, from operational strain to complex processes, a lack of streamlined execution to the risk of a data breach. Our experience shows that partnering with an established firm like Iron Mountain who is specialized in IT asset disposition would help kick-start one’s hardware recycling journey.
Iron Mountain has more than two decades of experience working with Hyperscale technology and data centers. A market leader in decommissioning, data security and remarketing capabilities. It has a wide footprint of facilities to support their customers’ sustainability goals globally.
Today, Iron Mountain has generated more than US$1.5 billion through value recovery and has been continually developing new ways to sell mass volumes of technology for their best use. Other than their end-to-end decommission offering, there are two additional value adding services that Iron Mountain provides to their customers that we find valuable. They offer a quarterly survey report which presents insights in the used market, and a sustainability report that measures the environmental impact based on total hardware processed with their customers.
Get started today
Get started today with Iron Mountain on your hardware recycling journey and sign up from here. After receiving the completed contact form, Iron Mountain will consult with you on the best solution possible. It has multiple programs to support including revenue share, fair market value, and guaranteed destruction with proper recycling. For example, when it comes to reselling used IT equipment, Iron Mountain would propose an appropriate revenue split, namely how much percentage of sold value will be shared with the customer, based on business needs. Iron Mountain’s secure chain of custody with added solutions such as redeployment, equipment retrieval programs, and onsite destruction can ensure it can tailor the solution that works best for your company’s security and environmental needs.
And in collaboration with Cloudflare, Iron Mountain offers additional two percent on your revenue share of the remarketed items and a five percent discount on the standard fees for other IT asset disposition services if you are new to Iron Mountain and choose to use these services via the link in this blog.
In July 2021, Cloudflare committed to removing or offsetting the historical emissions associated with powering our network by 2025. Earlier this year, after a comprehensive analysis of our records, we determined that our network has emitted approximately 31,284 metric tons (MTs) of carbon dioxide equivalent (CO2e) since our founding.
Today, we are excited to announce our first step toward offsetting our historical emissions by investing in 6,060 MTs’ worth of reforestation carbon offsets as part of the Pacajai Reduction of Emissions from Deforestation and forest Degradation (REDD+) Project in the State of Para, Brazil.
Generally, REDD+ projects attempt to create financial value for carbon stored in forests by using market approaches to compensate landowners for not clearing or degrading forests. From 2007 to 2016, approximately 13% of global carbon emissions from anthropogenic sources were the result of land use change, including deforestation and forest degradation. REDD+ projects are considered a low-cost policy mechanism to reduce emissions and promote co-benefits of reducing deforestation, including biodiversity conservation, sustainable management of forests, and conservation of existing carbon stocks. REDD projects were first recognized as part of the 11th Conference of the Parties (COP) of the United Nations Framework Convention on Climate Change in 2005, and REDD+ was further developed into a broad policy initiative and incorporated in Article 5 of the Paris Agreement.
The Pacajai Project is a Verra verified REDD+ project designed to stop deforestation and preserve local ecosystems. Specifically, to implement sustainable forest management and support socioeconomic development of riverine communities in Para, which is located in Northern Brazil near the Amazon River. The goal of the project is to train village families in land use stewardship to protect the rainforest, as well as agroforestry techniques that will help farmers transition to crops with smaller footprints to reduce the need to burn and clear large sections of adjacent forest.
If you follow sustainability initiatives at Cloudflare, including on this blog, you may know that we have also committed to purchasing renewable energy to account for our annual energy consumption. So how do all of these commitments and projects fit together? What is the difference between renewable energy (credits) and carbon offsets? Why did we choose offsets for our historical emissions? Great questions; here is a quick recap.
Cloudflare sustainability commitments
Last year, Cloudflare announced two sustainability commitments. First we committed to powering our operations with 100% renewable energy. Meaning, each year we will purchase the same amount of zero emissions energy (wind, solar, etc.) as we consume in all of our data centers and facilities around the world. Matching our energy consumption annually with renewable energy purchases ensures that under carbon accounting standards like the Greenhouse Gas Protocol (GHG), Cloudflare’s annual netemissions (or “market-based emissions”) from purchased electricity will be zero. This is important because it accounts for about 99.9% of Cloudflare’s 2021 emissions.
Renewable energy purchases help make sure Cloudflare accounts for its emissions from purchased electricity moving forward; however, it does not address emissions we generated prior to our first renewable energy purchase in 2018 (what we are calling “historical emissions”).
To that end, our second commitment was to “remove or offset all of our historical emissions resulting from powering our network by 2025.” For this initiative, we purposefully chose to use carbon removals or offsets, like the Pacajai REDD+ Project, rather than more renewable energy purchases (also called renewable energy credits, renewable energy certificates, or RECs).
Renewable energy vs. offsets and removals
Renewable energy certificates (RECs) and carbon offsets are both used by organizations to help mitigate their emissions footprint, but they are fundamentally different instruments.
Renewable energy certificates are created by renewable energy generators, like wind and solar farms, and represent a unit (e.g. 1 megawatt-hour) of low or zero emissions energy delivered to a local power grid. Individuals, organizations, and governments are able to purchase those units of energy, and legally claim their environmental benefits, even if the actual power they consume is from the standard electrical grid.
A carbon offset, according to the World Resources Institute (WRI), is “a unit of carbon dioxide-equivalent (CO2e) that is reduced, avoided, or sequestered.” Offsets can include a wide variety of projects, including reforestation, procurement of more efficient cookstoves in developing nations, avoidance of methane from municipal solid waste sites, and purchasing electric and hybrid vehicles for public transportation.
Carbon removals are a type of carbon offsets that involve actual removal of an amount of carbon from the atmosphere. According to WRI, carbon removal projects include “natural strategies like tree restoration and agricultural soil management; high-tech strategies like direct air capture and enhanced mineralization; and hybrid strategies like enhanced root crops, bioenergy with carbon capture and storage, and ocean-based carbon removal.”
As the climate crisis accelerates, carbon removals are an increasingly important part of global net zero efforts. For example, a recent analysis by the U.S. National Academy of Sciences and the Intergovernmental Panel on Climate Change (IPCC) found that even with rapid investment in emissions reductions (like increasing renewable energy supply), the United States must remove 2 gigatons of CO2 per year by midcentury to reach net zero.
RECs, offsets, and removals are all important tools for individuals, organizations, and governments to help lower their emissions footprint, and each has a specific purpose. As the U.S. Environmental Protection Agency puts it, “think of offsets and RECs as two tools in your sustainability tool box — like a hammer and a saw.” For example, RECs can only be used to account for emissions from an organization’s purchased electricity (Scope 2 emissions). Whereas offsets can be used to account for emissions from combustion engines and other direct emissions (Scope 1), purchased electricity (Scope 2), or carbon emitted by others, including supply chain and logistics emissions (Scope 3). In addition, some sustainability initiatives, like the Science Based Targets Initiative (SBTi) Net-Zero Standard, require the use of removals rather than other types of offsets.
Why did Cloudflare choose offsets or removals to account for its historical emissions?
We decided on a combination of offsets and removals for two reasons. The first reason is technical and relates to RECs and vintage years. Every REC produced by a renewable generator must include the date and time it was delivered to the local electrical grid. So, for example, RECs associated with renewable energy generation by a wind facility during the 2022 calendar year are considered 2022 vintage. Most green energy or renewable energy standards require organizations to purchase RECs from the same vintage year as the energy they are seeking to offset. Therefore, finding RECs to account for energy used by our network in 2012 or 2013 would be difficult, if not impossible, and purchasing current year RECs would be inconsistent with most standards.
The second reason we chose offsets and removals is that it gives us more flexibility to support different types of projects. As mentioned above, offset projects can be incredibly diverse and can be purchased all over the world. This gives Cloudflare the opportunity to support a variety of carbon reduction, avoidance, and sequestration projects that also contribute to other sustainable development goals like decent work and economic growth, gender equality and reduced inequalities, and life on land and below water.
How did we calculate historical emissions?
Once we decided how we planned to offset our historical emissions, we needed to determine how much to offset. Earlier this year our Infrastructure team led a comprehensive review of all historical asset records to create an annual picture of what hardware we deployed, the number of servers, the energy consumption of each model and configuration, and total energy consumption.
We also cross-checked our hardware deployment records with a review of all of our blog posts and other public statements documenting our network growth over the years. It was actually a pretty interesting exercise. Not only to see the cover art from some of our early blogs (our New Jersey data center announcement is a favorite), but more importantly to relive the amazing growth of our network, step by step, from three data centers in 2010 to more than 275 cities in over 100 countries! Pretty cool.
Finally, we converted those annual energy totals to emissions using a global average emissions factor from the International Energy Agency (IEA).
Energy (kWh) x Emissions Factor (gCO2e/kWh) = Carbon Emissions (gCO2e)
In total, we estimated that based on total power consumption, our network produced 31,284 MTs of CO2e prior to our first renewable energy purchase in 2018. We are proud to invest in offsets to mitigate the first 6,060 MTs this year; only 25,224 MTs to go.
Scope 3 emissions — sneak preview
Now that we have a firm understanding, reporting, and accounting for our current and past Scope 1 and Scope 2 emissions — we think it is time to focus on Scope 3.
Cloudflare published its first company-wide emissions inventory in 2020. Since then, we have focused our reporting and mitigating on our Scope 1 and Scope 2 emissions, as required under the GHG Protocol. However, although Scope 3 emissions reporting remains optional, we think it is an increasingly important part of all organizations’ responsibility to understand their total carbon footprint.
To that end, earlier this year we started a comprehensive internal assessment of all of our potential Scope 3 emissions sources. Like most things at Cloudflare we are starting with our network. Everything from embodied carbon in the hardware we buy, to shipping and logistics for moving our data center and server equipment around the world, to how we decommission and responsibly dispose of our assets.
Developing processes to quantify those emissions is one of our top objectives for 2023, and we plan to have more information to share soon. Stay tuned!
At Cloudflare, we are working hard to ensure that we are making a positive impact on the surrounding environment, with the goal of building the most sustainable network. At the same time, we want to make sure that the positive changes that we are making are also something that our local Cloudflare team members can touch and feel, and know that in each of our actions we are having a positive impact on the environment around us. This is why we make sustainability one of the underlying goals of the design, construction, and operations of our global office spaces.
To make this type of pervasive change we have focused our efforts in three main areas: working with sustainable construction materials, efficient operations, and renewable energy purchasing (using clean sources like sunlight and wind). We believe that sustainable design goes far beyond just purchasing recycled and regenerative products. If you don’t operate your space with efficiency and renewables in mind, we haven’t fully accounted for all of our environmental impact.
Sustainability in office design & construction
“The Retreat” in the San Francisco Cloudflare office, featuring preserved moss and live plants
Since 2020, we have been redefining how our teams work together, and how work takes place in physical spaces. You may have read last year about how we are thinking about the future of work at Cloudflare – and the experimentation that we are doing within our physical environments. Sustainable and healthy spaces are a major element to this concept.
We are excited to highlight a few of the different products and concepts that are currently being used in the development of our workplaces – both new locations and in the reimagination of our existing spaces. While experimenting with the way that our teams work together in person, we also consider our new and updated spaces a sort of sustainability learning lab. As we get more and more data on these different systems, we plan to expand these concepts to other global locations as we continue to think through the future of the in-office experience at Cloudflare.
An example of sustainable acoustic baffles as seen in our San Francisco office
Baffling baffles, fishing nets and more
It’s our goal to have the products, furniture, and systems that make up our offices be sustainable in a way that is pleasantly (and surprisingly) pervasive. Their materials, construction, and transportation should have either a minimal, or regenerative, impact on the environment or the waste stream while also meeting high performance standards. A great example of this is the acoustic sound baffling used in our recent San Francisco and London redesign and currently being installed at our newest office, which is under construction.
If you’ve ever worked in an open office, you know that effective sound management is critical, regardless of if the space is for collaborative or focus work. In order to help with this challenge, we use a substantial number of acoustic baffles to help significantly reduce sound transfer. Traditionally, baffles are made out of tightly woven synthetic fibers. Unfortunately, a majority of baffles on the market today generate new plastic in the waste stream.
The International Institute of Living Futures has certified that this product is acceptable for the Living Building Challenge, which is the most rigorous regenerative building standard in the world.
Similarly to FilaSorb, we also installed BAUX Acoustic Wood Wool paneling to provide additional sound dampening and a vibrant acoustic wall treatment. Designed using a process that focuses on recarbonation, BAUX Wood Wool panels absorb over 6.9 kg per meter squared of carbon dioxide. That’s a little over 70% of the total measured CO2 released during the entire manufacturing life cycle of the panel. Beyond their acoustic benefits, Wood Wool panels resist heat and are ideal insulators. This enables us to use less energy in heating and cooling to maintain a stable temperature in fluctuating weather.
Interface’s Net Effect Carpet Collection uses discarded fishing nets in their construction
Flooring is also a significant focus of our design team. We wanted to find a high wearing material that had brilliant color that also had strong regenerative properties across the full manufacturing lifecycle. We were very fortunate to have found Interface’s Net Effect Collection. Interface is one of the few fully certified carbon-neutral flooring materials providers.
Their Net Effect collection is made with 100% recycled content nylon, including postconsumer nylon from discarded fishing nets gathered through their Net-Works® partnership. Net-Works provides a source of income for small fishing villages in the Philippines while cleaning up their beaches and waters. The collected nets are sold to Aquafil, who, in turn, converts them into yarn for Interface carpet tile.
Furniture in landfills? Oh, my!
One shocking stat specifically has stood out to our team over the past two and half years as we have been rethinking our office spaces. 8.5 million tons of office furniture ends up in the landfill per year. That number was before the global pandemic completely redefined how companies think about their real estate footprints and shuttered a massive amount of office space in the United States. Major US cities like San Francisco and New York City still have commercial office vacancy rates upwards of 30% at the time of publishing. To do our part to keep furniture out of landfills, we are ensuring that we are reusing (and in some cases completely repurposing) our existing furniture portfolio as much as possible in every one of our projects.
We have taken it a step further to include our employees working from home. We commonly lend out office chairs and other unused office furniture to home office workers so that they don’t have to purchase new office furniture.
Sustainability in Office Operations
Rainwater harvesting system at our San Francisco office
We haven’t just been thinking about how our construction materials can have a more positive impact on the environment. We’ve also been incredibly focused on trialing a number of different sustainable operations concepts within our spaces.
For instance, we have installed a 500 gallon rainwater harvesting system above our outdoor bike storage in our San Francisco office, designed to support our internal gray water needs. We understand the importance of natural light and plants within our spaces to help encourage the health and wellbeing of our teammates, thus we have a vast amount of plants in our San Francisco office. While we chose our plants for their low water consumption, they still require water. Our rain water capture system provides the water for all of our plants.
Additionally, we are focused on cultural changes amongst our staff to reduce our waste streams (which was no small feat amongst our die-hard LaCroix fans!). We have adopted Bevi sparkling and flavored water dispensing machines alongside traditional soda fountains to fully remove bottled water from our facilities. We also shifted to bulk snacks to further reduce the packaging entering recycling centers and landfills.
Renewable energy purchasing
Our San Francisco office is also giving us direct on the ground exposure to the complexities of renewable power sourcing in a shared grid environment. In order to guarantee we are using all renewable energy, we purchase our power through Pacific Gas and Electric’s Supergreen Service. But we don’t just stop there. To ensure that our energy usage is totally based on renewable power, we take our efforts a step further and separately purchase renewable energy as if we didn’t already have sustainable power.
Coming soon: bees!
We are just getting started on our sustainability journey at Cloudflare. Over the next few years, we will continue to design, develop, and deploy a variety of different solutions to help make our offices as regenerative as possible. To leave you with a taste of where we are headed in 2023, I am excited to introduce you to a project that we are all very excited about: EntroBees. As you have likely heard, the global bee population has dropped dramatically, and a quarter of the bee species are at risk of extinction. We want to do our part to help encourage bees to thrive in urban environments.
Slated for installation at one of our global office locations, EntroBees will be fully managed onsite honey bee colonies. These colonies will provide a much-needed habitat for urban bees, produce honey for our local employees, and also serve as an additional source of entropy for our LavaRand system that provides the source of randomness for Cloudflare’s entire encryption system.
Whether you are building a global network or buying groceries, some rules of sustainable living remain the same: be thoughtful about what you get, make the most out of what you have, and try to upcycle your waste rather than throwing it away. These rules are central to Cloudflare — we take helping build a better Internet seriously, and we define this as not just having the most secure, reliable, and performant network — but also the most sustainable one.
With incredible growth of the Internet, and the increased usage of Cloudflare’s network, even linear improvements to sustainability in our hardware today will result in exponential gains in the future. We want to use this post to outline how we think about the sustainability impact of the hardware in our network, and what we’re doing to continually mitigate that impact.
Sustainability in the realm of servers
The total carbon footprint of a server is approximately 6 tons of Carbon Dioxide equivalent (CO2eq) when used in the US. There are four parts to the carbon footprint of any computing device:
The embodied emissions: source materials and production
Packing and shipping
Use of the product
End of life.
The emissions from the actual operations and use of a server account for the vast majority of the total life-cycle impact. The secondary impact is embodied emissions (which is the carbon footprint from the creation of the device in the first place), which is about 10% overall.
Use of Product Emissions
It’s difficult to reduce the total emissions for the operation of servers. If there’s a workload that needs computing power, the server will complete the workload and use the energy required to complete it. What we can do, however, is consistently seek to improve the amount of computing output per kilo of CO2 emissions — and the way we do that is to consistently upgrade our hardware to the most power-efficient designs. As we switch from one generation of server to the next, we often see very large increases in computing output, at the same level of power consumption. In this regard, given energy is a large cost for our business, our incentives of reducing our environmental impact are naturally aligned to our business model.
Embodied Emissions
The other large category of emissions — the embodied emissions — are a domain where we actually have a lot more control than the use of the product. Reminder from before: the embodied carbon means the sources of emissions generated outside of equipments’ operation. How can we reduce the embodied emissions involved in running a fleet of servers? Turns out, there are a few ways: modular design, relying on open vs proprietary standards to enable reuse, and recycling.
Modular Design
The first big opportunity is through modular system design. Modular systems are a great way of reducing embodied carbon, as they result in fewer new components and allow for parts that don’t have efficiency upgrades to be leveraged longer. Modular server design is essentially decomposing functions of the motherboard onto sub-boards so that the server owner can selectively upgrade the components that are required for their use cases.
How much of an impact can modular design have? Well, if 30% of the server is delivering meaningful efficiency gains (usually CPU and memory, sometimes I/O), we may really need to upgrade those in order to meet efficiency goals, but creating an additional 70% overhead in embodied carbon (i.e. the rest of the server, which often is made up of components that do not get more efficient) is not logical. Modular design allows us to upgrade the components that will improve the operational efficiency of our data centers, but amortize carbon in the “glue logic” components over the longer time periods for which they can continue to function.
Previously, many systems providers drove ridiculous and useless changes in the peripherals (custom I/Os, outputs that may not be needed for a specific use case such as VGA for crash carts we might not use given remote operations, etc.), which would force a new motherboard design for every new CPU socket design. By standardizing those interfaces across vendors, we can now only source the components we need, and reuse a larger percentage of systems ourselves. This trend also helps with reliability (sub-boards are more well tested), and supply assurance (since standardized subcomponent boards can be sourced from more vendors), something all of us in the industry have had top-of-mind given global supply challenges of the past few years.
Standards-based Hardware to Encourage Re-use
But even with modularity, components need to go somewhere after they’ve been deprecated — and historically, this place has been a landfill. There is demand for second-hand servers, but many have been parts of closed systems with proprietary firmware and BIOS, so repurposing them has been costly or impossible to integrate into new systems. The economics of a circular economy are such that service fees for closed firmware and BIOS support as well as proprietary interconnects or ones that are not standardized can make reuse prohibitively expensive. How do you solve this? Well, if servers can be supported using open source firmware and BIOS, you dramatically reduce the cost of reusing the parts — so that another provider can support the new customer.
Recycling
Beyond that, though, there are parts failures, or parts that are simply no longer economical to be run, even in the second hand market. Metal recycling can always be done, and some manufacturers are starting to invest in programs there, although the energy investment for extracting the usable elements sometimes doesn’t make sense. There is innovation in this domain, Zhan, et al. (2020) developed an environmentally friendly and efficient hydrothermal-buffering technique for the recycling of GaAs-based ICs, achieving gallium and arsenic recovery rates of 99.9 and 95.5% respectively. Adoption is still limited — most manufacturers are discussing water recycling and renewable energy vs. full-fledged recycling of metals — but we’re closely monitoring the space to take advantage of any further innovation that happens.
What Cloudflare is Doing To Reduce Our Server Impact
It is great to talk about these concepts, but we are doing this work today. I’d describe them as being under two main banners: taking steps to reduce embodied emissions through modular and open standards design, and also using the most power-efficient solutions for our workloads.
Gen 12: Walking the Talk
Our next generation of servers, Gen 12, will be coming soon. We’re emphasizing modular-driven design, as well as a focus on open standards, to enable reuse of the components inside the servers.
A modular-driven design
Historically, every generation of server here at Cloudflare has required a massive redesign. An upgrade to a new CPU required a new motherboard, power supply, chassis, memory DIMMs, and BMC. This, in turn, might mean new fans, storage, network cards, and even cables. However, many of these components are not changing drastically from generation to generation: these components are built using older manufacturing processes, and leverage interconnection protocols that do not require the latest speeds.
To help illustrate this, let’s look at our Gen 11 server today: a single socket server is ~450W of power, with the CPU and associated memory taking about 320W of that (potentially 360W at peak load). All the other components on that system (mentioned above) are ~100W of operational power (mostly dominated by fans, which is why so many companies are exploring alternative cooling designs), so they are not where the optimization efforts or newer ICs will greatly improve the system’s efficiency. So, instead of rebuilding all those pieces from scratch for every new server and generating that much more embodied carbon, we are reusing them as often as possible.
By disaggregating components that require changes for efficiency reasons from other system-level functions (storage, fans, BMCs, programmable logic devices, etc.), we are able to maximize reuse of electronic components across generations. Building systems modularly like this significantly reduces our embodied carbon footprint over time. Consider how much waste would be eliminated if you were able to upgrade your car’s engine to improve its efficiency without changing the rest of the parts that are working well, like the frame, seats, and windows. That’s what modular design is enabling in data centers like ours across the world.
A Push for Open Standards, Too
We, as an industry, have to work together to accelerate interoperability across interfaces, standards, and vendors if we want to achieve true modularity and our goal of a 70% reduction in e-waste. We have begun this effort by leveraging standard add-in-card form factors (OCP 2.0 and 3.0 NICs, Datacenter Secure Control Module for our security and management modules, etc.) and our next server design is leveraging Datacenter Modular Hardware System, an open-source design specification that allows for modular subcomponents to be connected across common buses (regardless of the system manufacturer). This technique allows us to maintain these components over multiple generations without having to incur more carbon debt on parts that don’t change as often as CPUs and memory.
In order to enable a more comprehensive circular economy, Cloudflare has made extensive and increasing use of open-source solutions, like OpenBMC, a requirement for all of our vendors, and we work to ensure fixes are upstreamed to the community. Open system firmware allows for greater security through auditability, but the most important factor for sustainability is that a new party can assume responsibility and support for that server, which allows systems that might otherwise have to be destroyed to be reused. This ensures that (other than data-bearing assets, which are destroyed based on our security policy) 99% of hardware used by Cloudflare is repurposed, reducing the number of new servers that need to be built to fulfill global capacity demand. Further details about the specifics of how that happens – and how you can join our vision of reducing e-waste – you can find in this blog post.
Using the most power-efficient solutions for our workloads
The other big way we can push for sustainability (in our hardware) while responding to our exponential increase in demand without wastefully throwing more servers at the problem is simple in concept, and difficult in practice: testing and deploying more power-efficient architectures and tuning them for our workloads. This means not only evaluating the efficiency of our next generation of servers and networking gear, but also reducing hardware and energy waste in our fleet.
Currently, in production, we see that Gen 11 servers can handle about 25% more requests than Gen 10 servers for the same amount of energy. This is about what we expected when we were testing in mid-2021, and is exciting to see given that we continue to launch new products and services we couldn’t test at that time.
System power efficiency is not as simple a concept as it used to be for us. Historically, the key metric for assessing efficiency has been requests per second per watt. This metric allowed for multi-generational performance comparisons when qualifying new generations of servers, but it was really designed with our historical core product suite in mind.
We want – and, as a matter of scaling, require – our global network to be an increasingly intelligent threat detection mechanism, and also a highly performant development platform for our customers. As anyone who’s looked at a benchmark when shopping for a new computer knows, fast performance in one domain (traditional benchmarks such as SpecInt_Rate, STREAM, etc.) does not necessarily mean fast performance in another (e.g. AI inference, video processing, bulk object storage). The validation testing process for our next generation of server needs to take all of these workloads and their relative prevalence into account — not just requests. The deep partnership between hardware and software that Cloudflare can have is enabling optimization opportunities that other companies running third party code cannot pursue. I often say this is one of our superpowers, and this is the opportunity that makes me most excited about my job every day.
The other way we can be both sustainable and efficient is by leveraging domain-specific accelerators. Accelerators are a wide field, and we’ve seen incredible opportunities with application-level ones (see our recent announcement on AV1 hardware acceleration for Cloudflare Stream) as well as infrastructure accelerators (sometimes referred to as Smart NICs). That said, adding new silicon to our fleet is only adding to the problem if it isn’t as efficient as the thing it’s replacing, and a node-level performance analysis often misses the complexity of deployment in a fleet as distributed as ours, so we’re moving quickly but cautiously.
Moving Forward: Industry Standard Reporting
We’re pushing by ourselves as hard as we can, but there are certain areas where the industry as a whole needs to step up.
In particular: there is a woeful lack of standards about emissions reporting for server component manufacturing and operation, so we are engaging with standards bodies like the Open Compute Project to help define sustainability metrics for the industry at large. This post explains how we are increasing our efficiency and decreasing our carbon footprint generationally, but there should be a clear methodology that we can use to ensure that you know what kind of businesses you are supporting.
The Greenhouse Gas (GHG) Protocol initiative is doing a great job developing internationally accepted GHG accounting and reporting standards for business and to promote their broad adoption. They define scope 1 emissions to be the “direct carbon accounting of a reporting company’s operations” which is somewhat easy to calculate, and quantify scope 3 emissions as “the indirect value chain emissions.” To have standardized metrics across the entire life cycle of generating equipment, we need the carbon footprint of the subcomponents’ manufacturing process, supply chains, transportation, and even the construction methods used in building our data centers.
Ensuring embodied carbon is measured consistently across vendors is a necessity for building industry-standard, defensible metrics.
Helping to build a better, greener, Internet
The carbon impact of the cloud has a meaningful impact on the Earth–by some accounts, the ICT footprint will be 21% of global energy demand by 2030. We’re absolutely committed to keeping Cloudflare’s footprint on the planet as small as possible. If you’ve made it this far through, and you’re interested in contributing to building the most global, efficient, and sustainable network on the Internet — the Hardware Systems Engineering team is hiring. Come join us.
Once a year, we pull data from our Bot Fight Mode to determine the number of trees we can donate to our partners at One Tree Planted. It’s part of the commitment we made in 2019 to deter malicious bots online by redirecting them to a challenge page that requires them to perform computationally intensive, but meaningless tasks. While we use these tasks to drive up the bill for bot operators, we account for the carbon cost by planting trees.
This year when we pulled the numbers, we saw something exciting. While the number of bot detections has gone significantly up, the time bots spend in the Bot Fight Mode challenge page has gone way down. We’ve observed that bot operators are giving up quickly, and moving on to other, unprotected targets. Bot Fight Mode is getting smarter at detecting bots and more efficient at deterring bot operators, and that’s a win for Cloudflare and the environment.
What’s changed?
We’ve seen two changes this year in the Bot Fight Mode results. First, the time attackers spend in Bot Fight Mode challenges has reduced by 166%. Many bot operators are disconnecting almost immediately now from Cloudflare challenge pages. We expect this is because they’ve noticed the sharp cost increase associated with our CPU intensive challenge and given up. Even though we’re seeing individual bot operators give up quickly, Bot Fight Mode is busier than ever. We’re issuing six times more CPU intensive challenges per day compared to last year, thanks to a new detection system written using Cloudflare’s ruleset engine, detailed below.
How did we do this?
When Bot Fight Mode launched, we highlighted one of our core detection systems:
“Handwritten rules for simple bots that, however simple, get used day in, day out.”
Some of them are still very simple. We introduce new simple rules regularly when we detect new software libraries as they start to source a significant amount of traffic. However, we started to reach the limitations of this system. We knew there were sophisticated bots out there that we could identify easily, but they shared enough overlapping traits with good browser traffic that we couldn’t safely deploy new rules to block them safely without potentially impacting our customers’ good traffic as well.
To solve this problem, we built a new rules system written on the same highly performant Ruleset Engine that powers the new WAF, Transform Rules, and Cache Rules, rather than the old Gagarin heuristics engine that was fast but inflexible. This new framework gives us the flexibility we need to write highly complex rules to catch more elusive bots without the risk of interfering with legitimate traffic. The data gathered by these new detections are then labeled and used to train our Machine Learning engine, ensuring we will continue to catch these bots as their operators attempt to adapt.
What’s next?
We’ve heard from Bot Fight Mode customers that they need more flexibility. Website operators now expect a significant percentage of their legitimate traffic to come from automated sources, like service to service APIs. These customers are waiting to enable Bot Fight Mode until they can tell us what parts of their website it can run on safely. In 2023, we will give everyone the ability to write their own flexible Bot Fight Mode rules, so that every Cloudflare customer can join the fight against bots!
Update: Mangroves, Climate Change & economic development
Source: One Tree Planted
We’re also pleased to report the second tree planting project from our 2021 bot activity is now complete! Earlier this year, Cloudflare contributed 25,000 trees to a restoration project at Victoria Park in Nova Scotia.
For our second project, we donated 10,000 trees to a much larger restoration project on the eastern shoreline of Kumirmari island in the Sundarbans of West Bengal, India. In total, the project included more than 415,000 trees along 7.74 hectares of land in areas that have been degraded or deforested. The types of trees planted included Bain, Avicennia officianalis, Kalo Bain, and eight others.
The Sundarbans are located on the delta of the Ganges, Brahmaptura, and Meghna rivers on the Bay of Bengal, and are home to one of the world’s largest mangrove forests. The forest is not only a UNESCO World Heritage site, but also home to 260 bird species as well as a number of threatened species like the Bengal tiger, the estuarine crocodile, and Indian python. According to One Tree Planted, the Sundarbans are currently under threat from rising sea levels, increasing salinity in the water and soil, cyclonic storms, and flooding.
The Intergovernmental Panel on Climate Change (IPCC) has found that mangroves are critical to mitigating greenhouse gas (GHG) emissions and protecting coastal communities from extreme weather events caused by climate change. The Sundarbans mangrove forest is one of the world’s largest carbon sinks (an area that absorbs more carbon than it emits). One study suggested that coastal mangrove forests sequester carbon at a rate of two to four times that of a mature tropical or subtropical forest region.
One of the most exciting parts of this project was its focus on hiring and empowering local women. According to One Tree Planted, 75 percent of those involved in the project were women, including 85 women employed to monitor and manage the planting site over a five-month period. Participants also received training in the seed collection process with the goal of helping local residents lead mangrove planting from start to finish in the future.
More bots stopped, more trees planted!
Thanks to every Cloudflare customer who’s enabled Bot Fight Mode so far. You’ve helped make the Internet a better place by stopping malicious bots, and you’ve helped make the planet a better place by reforesting the Earth on bot operators’ dime. The more domains that use Bot Fight Mode, the more trees we can plant, so sign up for Cloudflare and activate Bot Fight Mode today!
In the first part of this blog series, Optimize your modern data architecture for sustainability: Part 1 – data ingestion and data lake, we focused on the 1) data ingestion, and 2) data lake pillars of the modern data architecture. In this blog post, we will provide guidance and best practices to optimize the components within the 3) unified data governance, 4) data movement, and 5) purpose-built analytics pillars. Figure 1 shows the different pillars of the modern data architecture. It includes data ingestion, data lake, unified data governance, data movement, and purpose-built analytics pillars.
Figure 1. Modern Data Analytics Reference Architecture on AWS
3. Unified data governance
A centralized Data Catalog is responsible for storing business and technical metadata about datasets in the storage layer. Administrators apply permissions in this layer and track events for security audits.
Data discovery
To increase data sharing and reduce data movement and duplication, enable data discovery and well-defined access controls for different user personas. This reduces redundant data processing activities. Separate teams within an organization can rely on this central catalog. It provides first-party data (such as sales data) or third-party data (such as stock prices, climate change datasets). You’ll only need access data once, rather than having to pull from source repeatedly.
AWS Glue Data Catalog can simplify the process for adding and searching metadata. Use AWS Glue crawlers to update the existing schemas and discover new datasets. Carefully plan schedules to reduce unnecessary crawling.
Data sharing
Establish well-defined access control mechanisms for different data consumers using services such as AWS Lake Formation. This will enable datasets to be shared between organizational units with fine-grained access control, which reduces redundant copying and movement. Use Amazon Redshift data sharing to avoid copying the data across data warehouses.
Well-defined datasets
Create well-defined datasets and associated metadata to avoid unnecessary data wrangling and manipulation. This will reduce resource usage that might result from additional data manipulation.
4. Data movement
AWS Glue provides serverless, pay-per-use data movement capability, without having to stand up and manage servers or clusters. Set up ETL pipelines that can process tens of terabytes of data.
You can create and share AWS Glue workflows for similar use cases by using AWS Glue blueprints, rather than creating an AWS Glue workflow for each use case. AWS Glue job bookmark can track previously processed data.
Consider using Glue Flex Jobs for non-urgent or non-time sensitive data integration workloads such as pre-production jobs, testing, and one-time data loads. With Flex, AWS Glue jobs run on spare compute capacity instead of dedicated hardware.
Joins between several dataframes is a common operation in Spark jobs. To reduce shuffling of data between nodes, use broadcast joins when one of the merged dataframes is small enough to be duplicated on all the executing nodes.
The latest AWS Glue version provides more new and efficient features for your workload.
5. Purpose-built analytics
Data Processing modes
Real-time data processing options need continuous computing resources and require more energy consumption. For the most favorable sustainability impact, evaluate trade-offs and choose the optimal batch data processing option.
Identify the batch and interactive workload requirements and design transient clusters in Amazon EMR. Using Spot Instances and configuring instance fleets can maximize utilization.
To improve energy efficiency, Amazon EMR Serverless can help you avoid over- or under-provisioning resources for your data processing jobs. Amazon EMR Serverless automatically determines the resources that the application needs, gathers these resources to process your jobs, and releases the resources when the jobs finish.
Amazon Redshift RA3 nodes can improve compute efficiency. With RA3 nodes, you can scale compute up and down without having to scale storage. You can choose Amazon Redshift Serverless to intelligently scale data warehouse capacity. This will deliver faster performance for the most demanding and unpredictable workloads.
Energy efficient transformation and data model design
Data processing and data modeling best practices can reduce your organization’s environmental impact.
The Amazon Redshift Advisor provides specific, tailored recommendations to optimize the data warehouse based on performance statistics and operations data.
Consider migrating Amazon EMR or Amazon OpenSearch Service to a more power-efficient processor such as AWS Graviton. AWS Graviton 3 delivers 2.5–3 times better performance over other CPUs. Graviton 3-based instances use up to 60% less energy for the same performance than comparable EC2 instances.
Consider querying the data in place with Amazon Athena or Amazon Redshift Spectrum for one-off analysis, rather than copying the data to Amazon Redshift.
Track and assess improvement for environmental sustainability
The optimal way to evaluate success in optimizing your workloads for sustainability is to use proxy measures and unit of work KPI. This can be GB per transaction for storage, or vCPU minutes per transaction for compute.
In Table 1, we list certain metrics you could collect on analytics services as proxies to measure improvement. These fall under each pillar of the modern data architecture covered in this post.
Table 1. Metrics for the Modern data architecture pillars
Conclusion
In this blog post, we provided best practices to optimize processes under the unified data governance, data movement, and purpose-built analytics pillars of modern architecture.
If you are looking for more architecture content, refer to the AWS Architecture Center for reference architecture diagrams, vetted architecture solutions, Well-Architected best practices, patterns, icons, and more.
The Amazon Web Services (AWS) Cloud is a constantly expanding network of Regions and points of presence (PoP), with a global network infrastructure linking them together. The choice of Regions for your workload significantly affects your workload KPIs, including performance, cost, and carbon footprint.
The Well-Architected Framework’s sustainability pillar offers design principles and best practices that you can use to meet sustainability goals for your AWS workloads. It recommends choosing Regions for your workload based on both your business requirements and sustainability goals. In this blog, we explain how to select an appropriate AWS Region for your workload. This process includes two key steps:
Assess and shortlist potential Regions for your workload based on your business requirements.
Choose Regions near Amazon renewable energy projects and Region(s) where the grid has a lower published carbon intensity.
To demonstrate this two-step process, let’s assume we have a web application that must be deployed in the AWS Cloud to support end users in the UK and Sweden. Also, let’s assume there is no local regulation that binds the data residency to a specific location. Let’s select a Region for this workload based on guidance in the sustainability pillar of AWS Well-Architected Framework.
Shortlist potential Regions for your workload
Let’s follow the best practice on Region selection in the sustainability pillar of AWS Well-Architected Framework. The first step is to assess and shortlist potential Regions for your workload based on your business requirements.
Test the network latency between your end user locations and each AWS Region.
At this point, you should have a list of AWS Regions. For this sample workload, let’s assume only Europe (London) and Europe (Stockholm) Regions are shortlisted. They can address the requirements for latency, cost, and features for our use case.
Choose Regions for your workload
After shortlisting the potential Regions, the next step is to choose Regions for your workload. Choose Regions near Amazon renewable energy projects or Regions where the grid has a lower published carbon intensity. To understand this step, you need to first understand the Greenhouse Gas (GHG) Protocol to track emissions.
Based on the GHG Protocol, there are two methods to track emissions from electricity production: market-based and location-based. Companies may choose one of these methods based on their relevant sustainability guidelines to track and compare their year-to-year emissions. Amazon uses the market-based model to report our emissions.
AWS Region(s) selection based on market-based method
With the market-based method, emissions are calculated based on the electricity that businesses have chosen to purchase. For example, the business could decide to contract and purchase electricity produced by renewable energy sources like solar and wind.
Amazon’s goal is to power our operations with 100% renewable energy by 2025 – five years ahead of our original 2030 target. We contract for renewable power from utility-scale wind and solar projects that add clean energy to the grid. These new renewable projects support hundreds of jobs and hundreds of millions of dollars investment in local communities. Find more details about our work around the globe. We support these grids through the purchase of environmental attributes, like Renewable Energy Certificates (RECs) and Guarantees of Origin (GoO), in line with our renewable energy methodology. As a result, we have a number of Regions listed that are powered by more than 95% renewable energy on the Amazon sustainability website.
Choose one of these Regions to help you power your workload with more renewable energy and reduce your carbon footprint. For the sample workload we’re using as our example, both the Europe (London) and Europe (Stockholm) Regions are in this list. They are powered by over 95% renewable energy based on the market-based emission method.
AWS Regions selection based on location-based carbon method
The location-based method considers the average emissions intensity of the energy grids where consumption takes place. As a result, wherever the organization conducts business, it assesses emissions from the local electricity system. You can use the emissions intensity of the energy grids through a trusted data source to assess Regions for your workload.
Let’s look how we can use Electricity Maps data to select a Region for our sample workload:
2. Search for South Central Sweden zone to get carbon intensity of electricity consumed for Europe (Stockholm) Region (display aggregated data on yearly basis)
Figure 1. Carbon intensity of electricity for South Central Sweden
3. Search for Great Britain to get carbon intensity of electricity consumed for Europe (London) Region (display aggregated data on yearly basis)
Figure 2. Carbon intensity of electricity for Great Britain
As you can determine from Figure 2, the Europe (Stockholm) Region has a lower carbon intensity of electricity consumed compared to the Europe (London) Region.
For our sample workload, we have selected the Europe (Stockholm) Region due to latency, cost, features, and compliance. It also provides 95% renewable energy using the market-based method, and low grid carbon intensity with the location-based method.
Conclusion
In this blog, we explained the process for selecting an appropriate AWS Region for your workload based on both business requirements and sustainability goals.
For more architecture content, refer to AWS Architecture Center for reference architecture diagrams, vetted architecture solutions, Well-Architected best practices, patterns, icons, and more.
The collective thoughts of the interwebz
Manage Consent
To provide the best experiences, we use technologies like cookies to store and/or access device information. Consenting to these technologies will allow us to process data such as browsing behavior or unique IDs on this site. Not consenting or withdrawing consent, may adversely affect certain features and functions.
Functional
Always active
The technical storage or access is strictly necessary for the legitimate purpose of enabling the use of a specific service explicitly requested by the subscriber or user, or for the sole purpose of carrying out the transmission of a communication over an electronic communications network.
Preferences
The technical storage or access is necessary for the legitimate purpose of storing preferences that are not requested by the subscriber or user.
Statistics
The technical storage or access that is used exclusively for statistical purposes.The technical storage or access that is used exclusively for anonymous statistical purposes. Without a subpoena, voluntary compliance on the part of your Internet Service Provider, or additional records from a third party, information stored or retrieved for this purpose alone cannot usually be used to identify you.
Marketing
The technical storage or access is required to create user profiles to send advertising, or to track the user on a website or across several websites for similar marketing purposes.
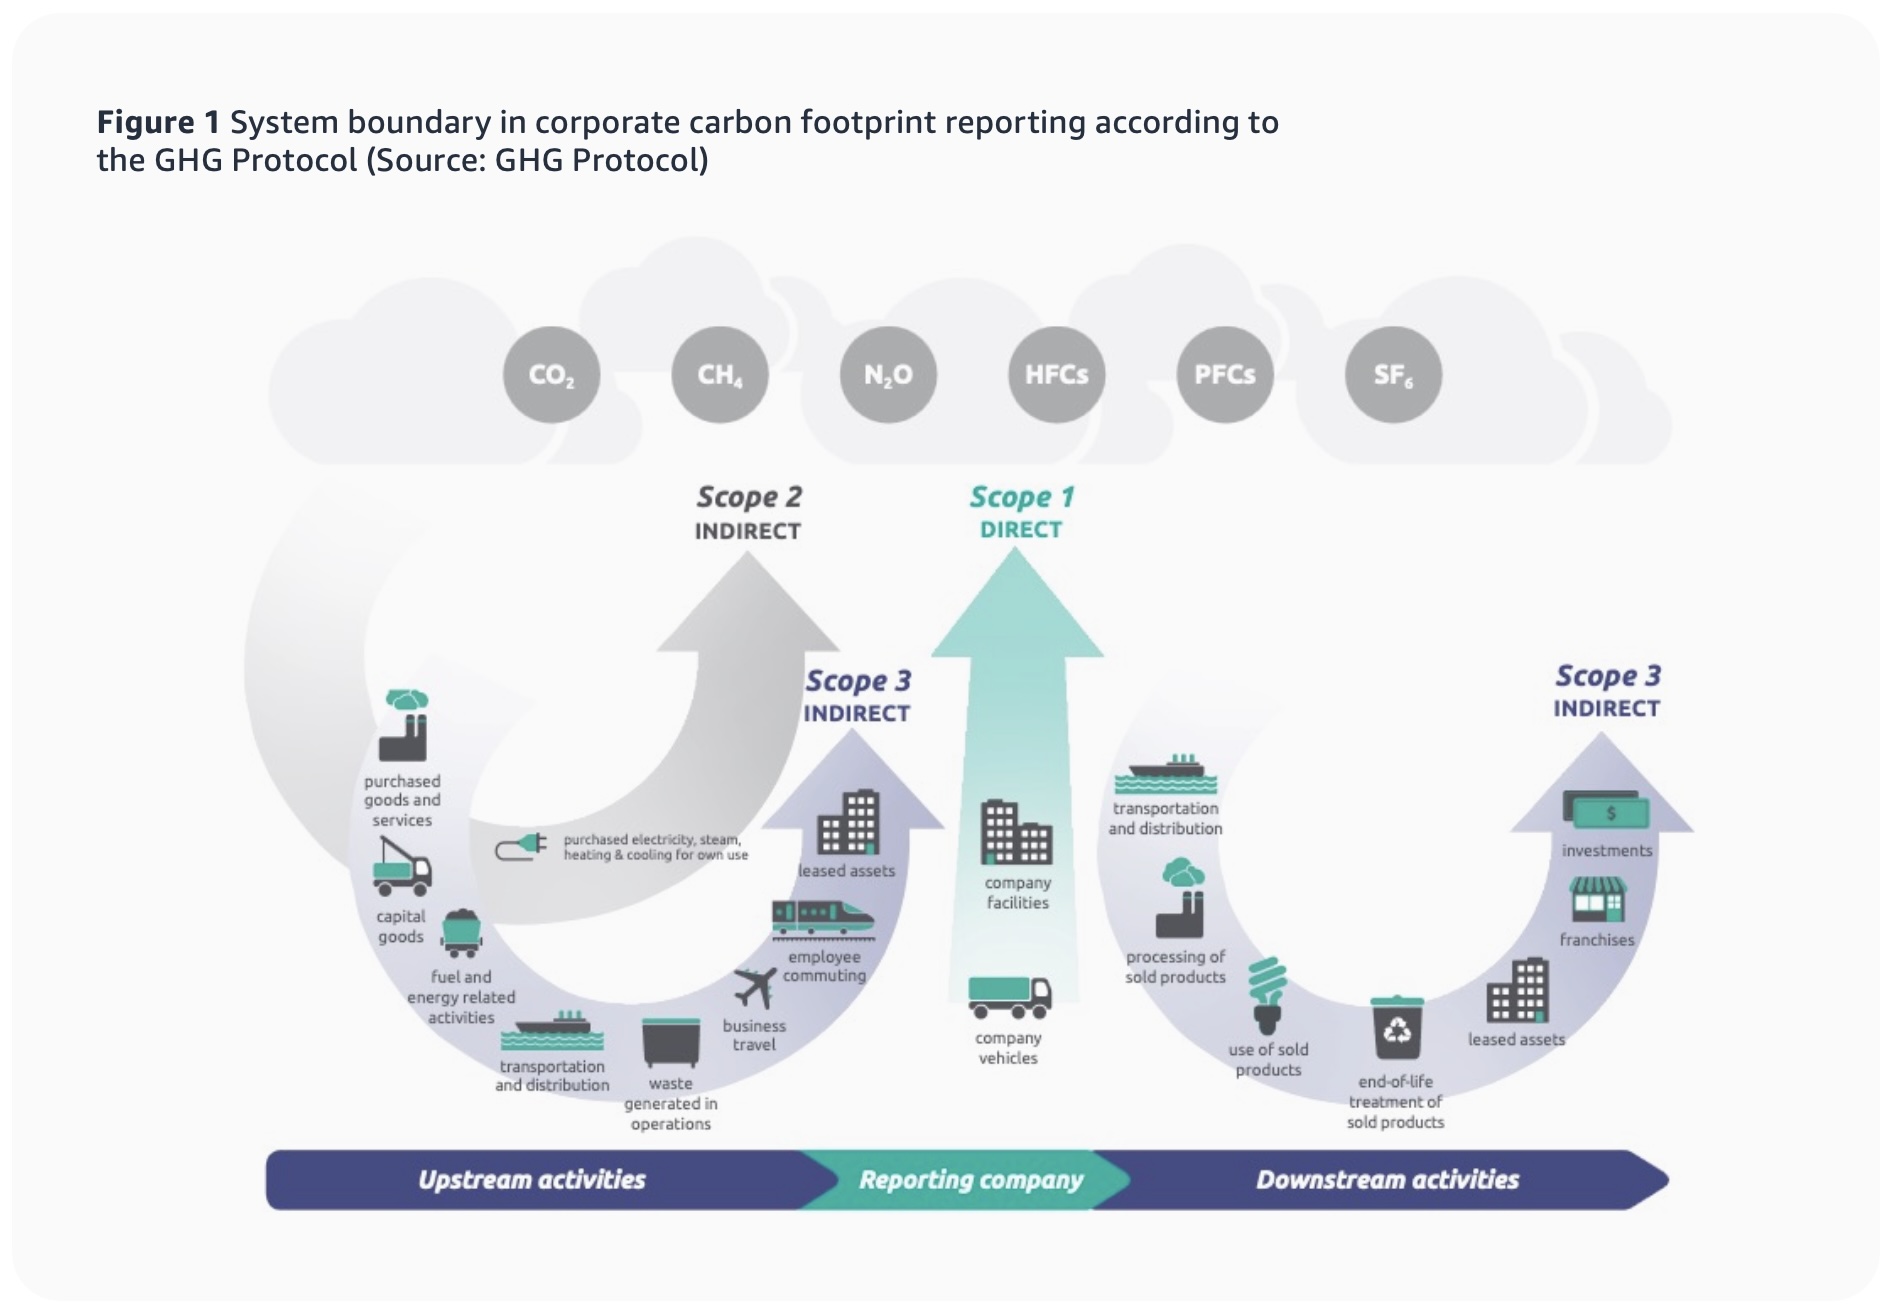
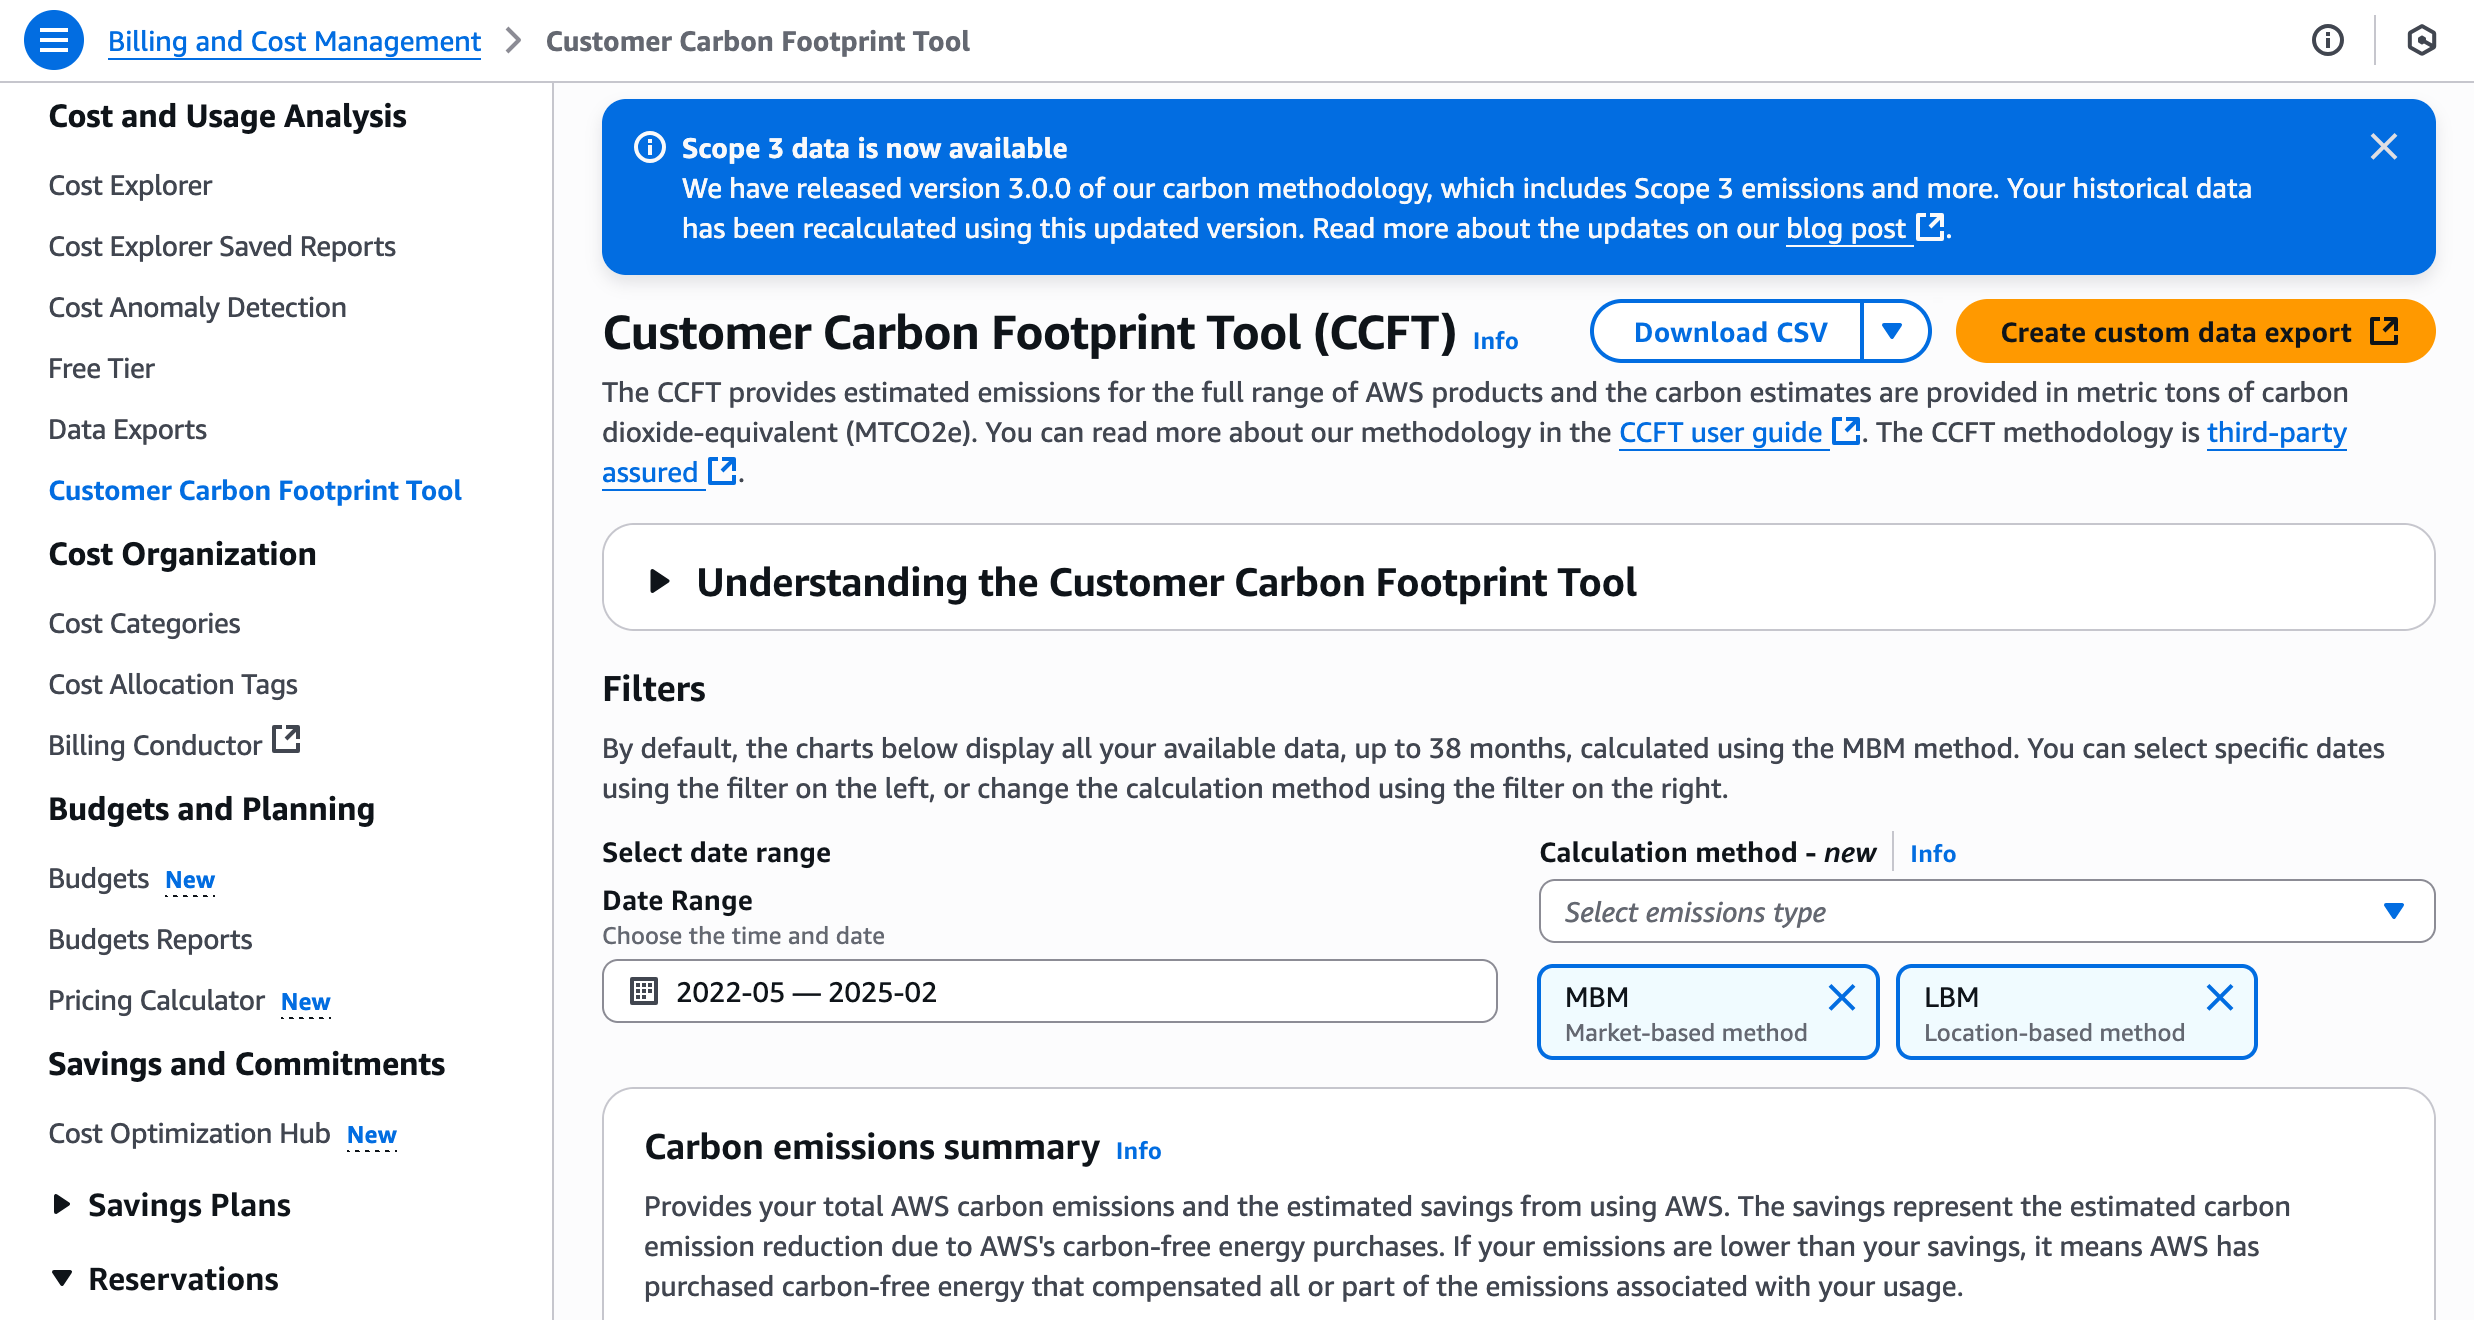
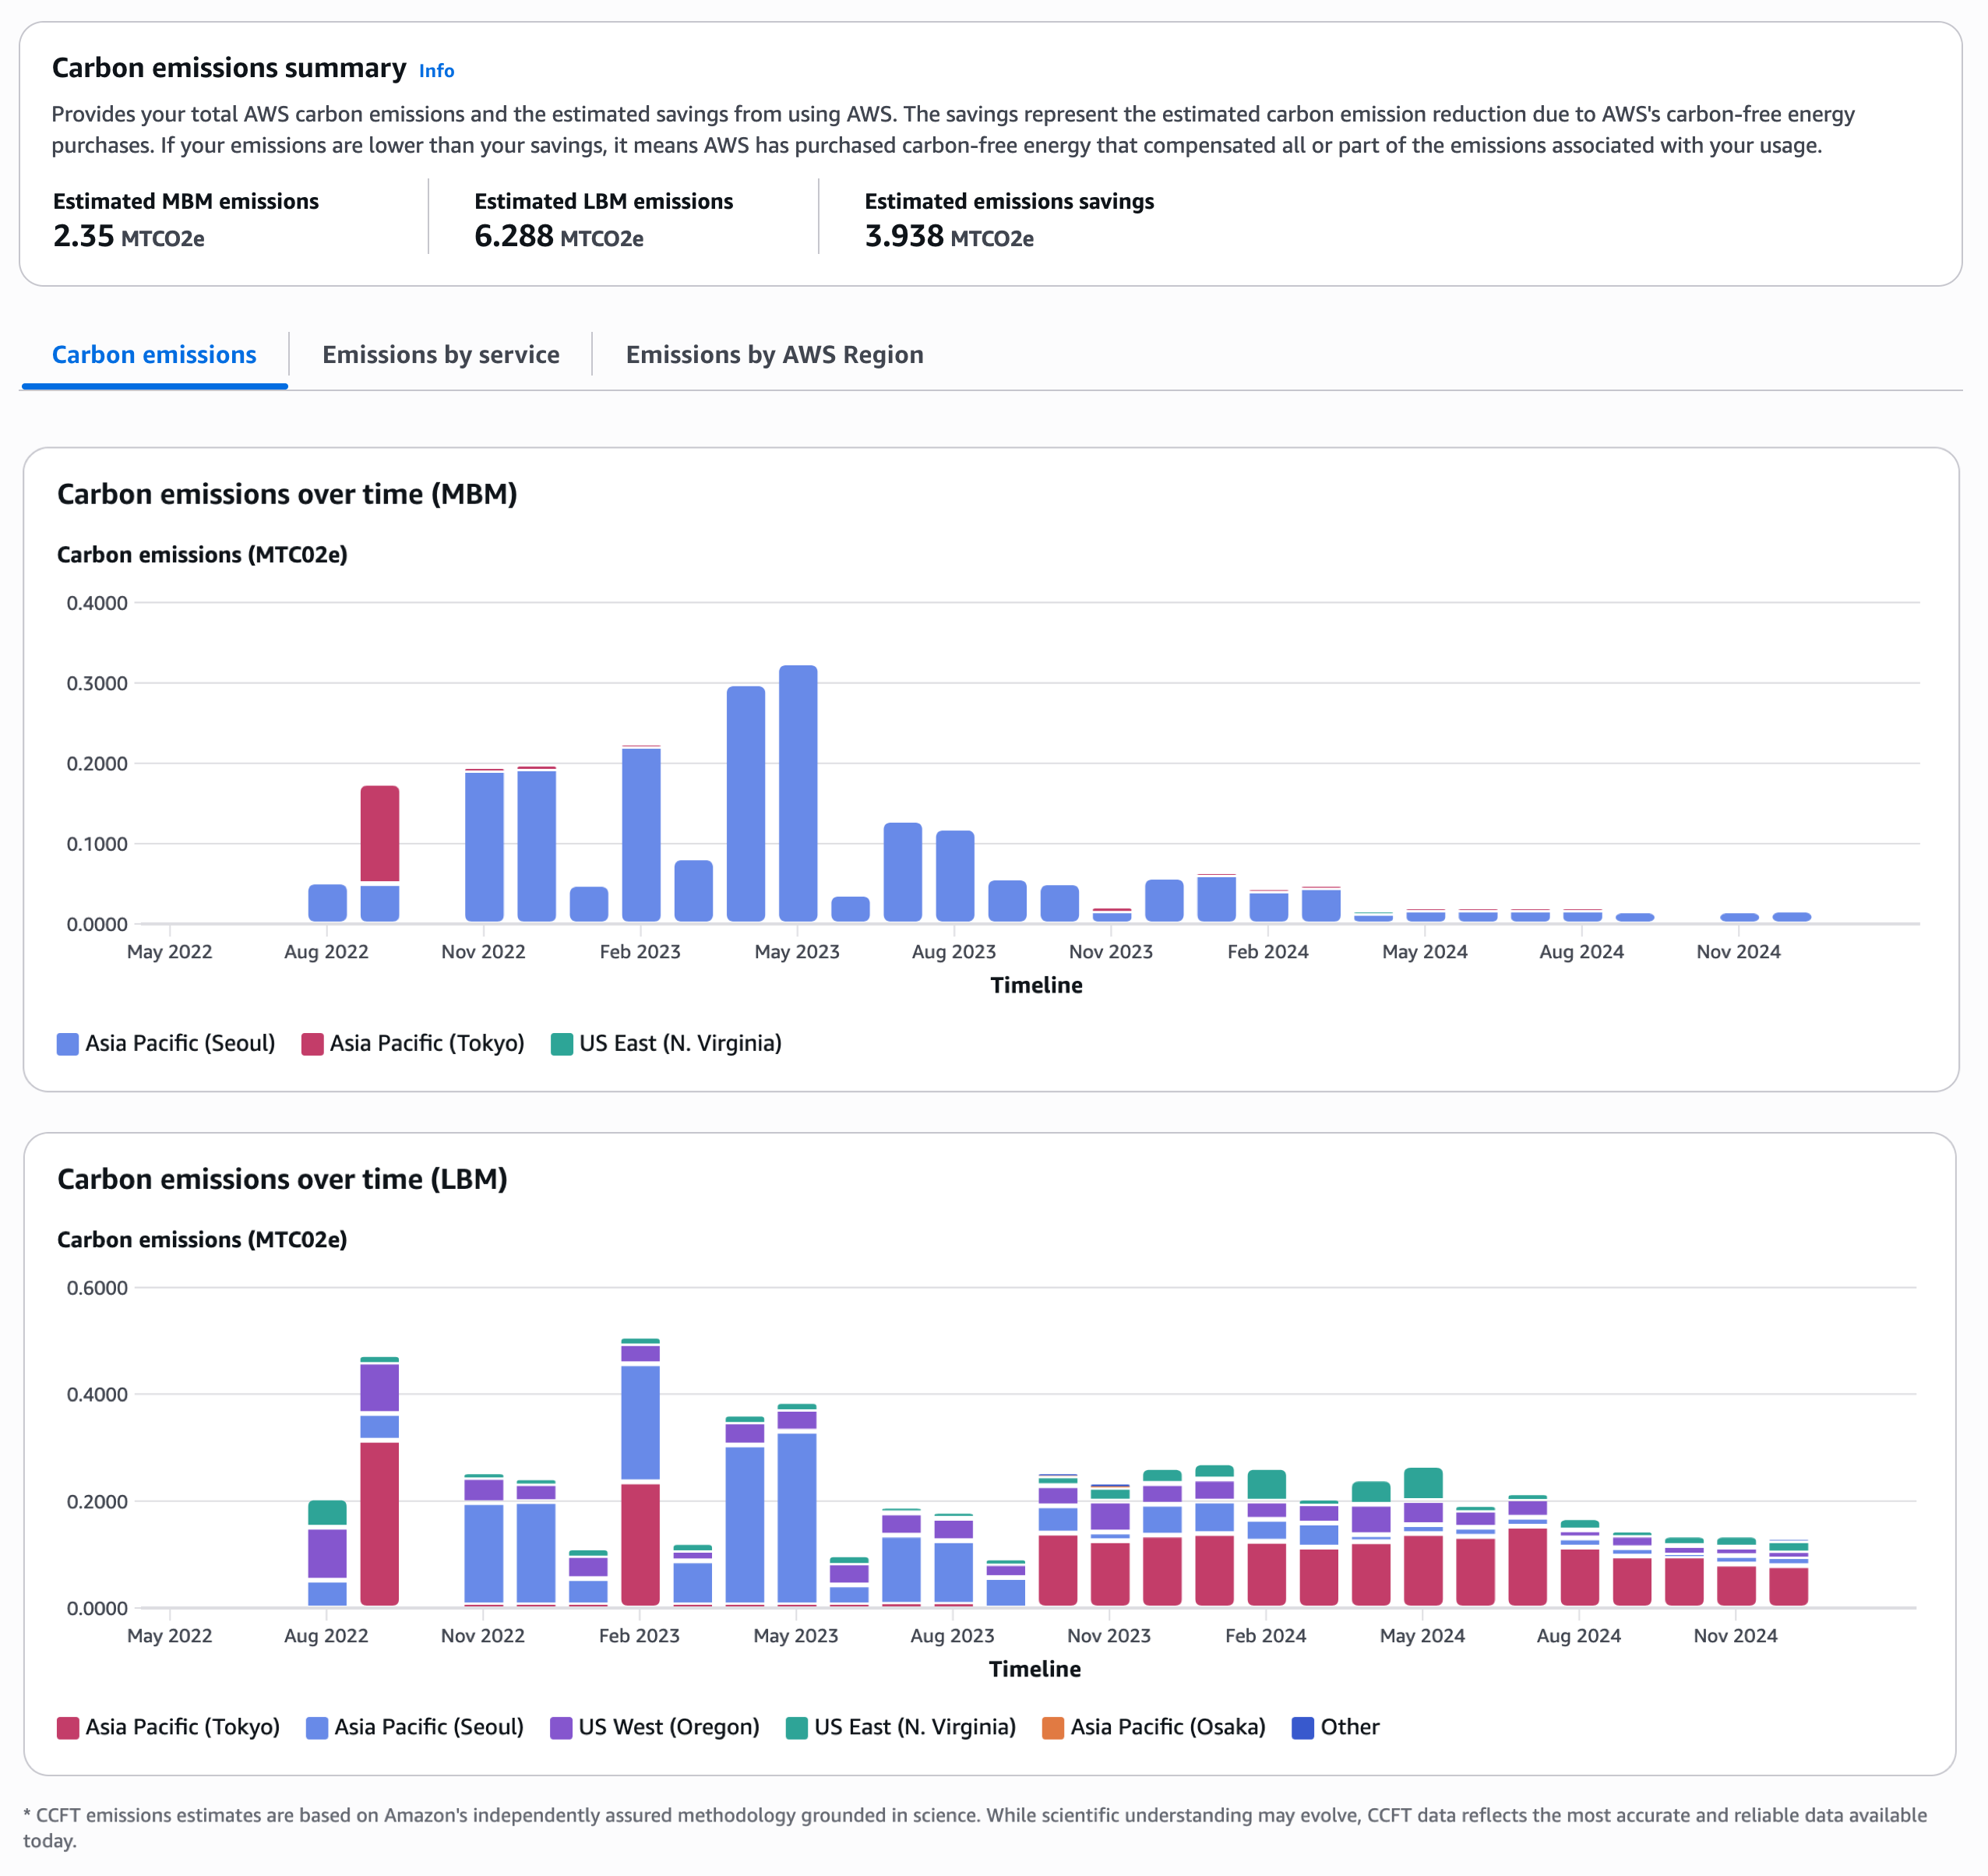
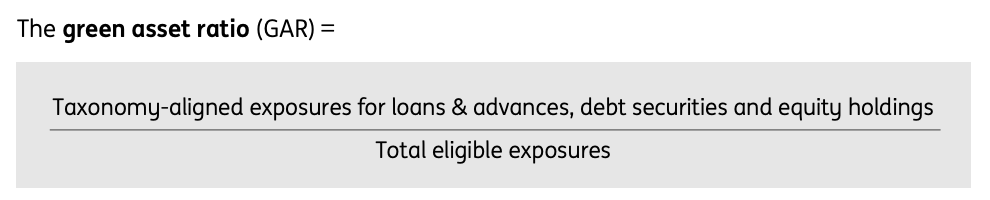
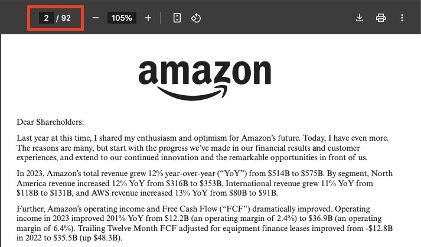
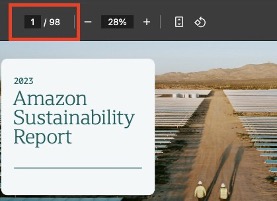
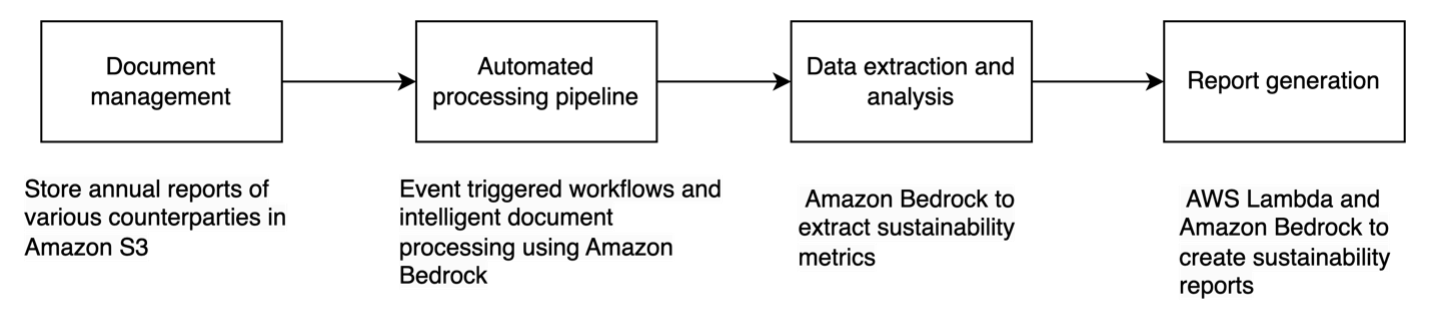
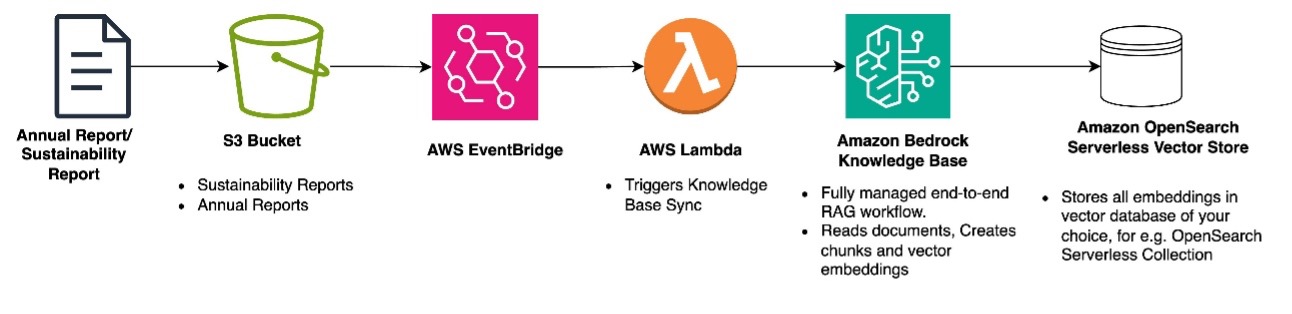
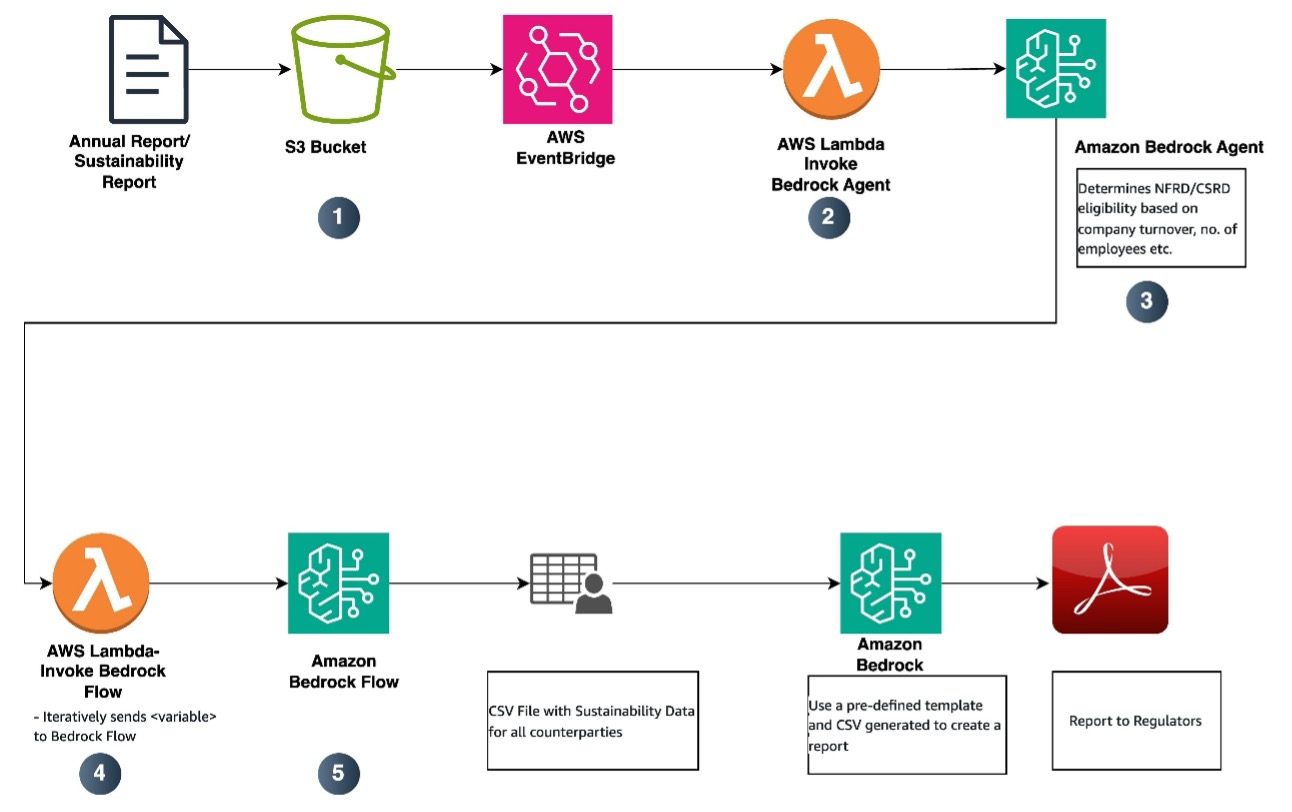
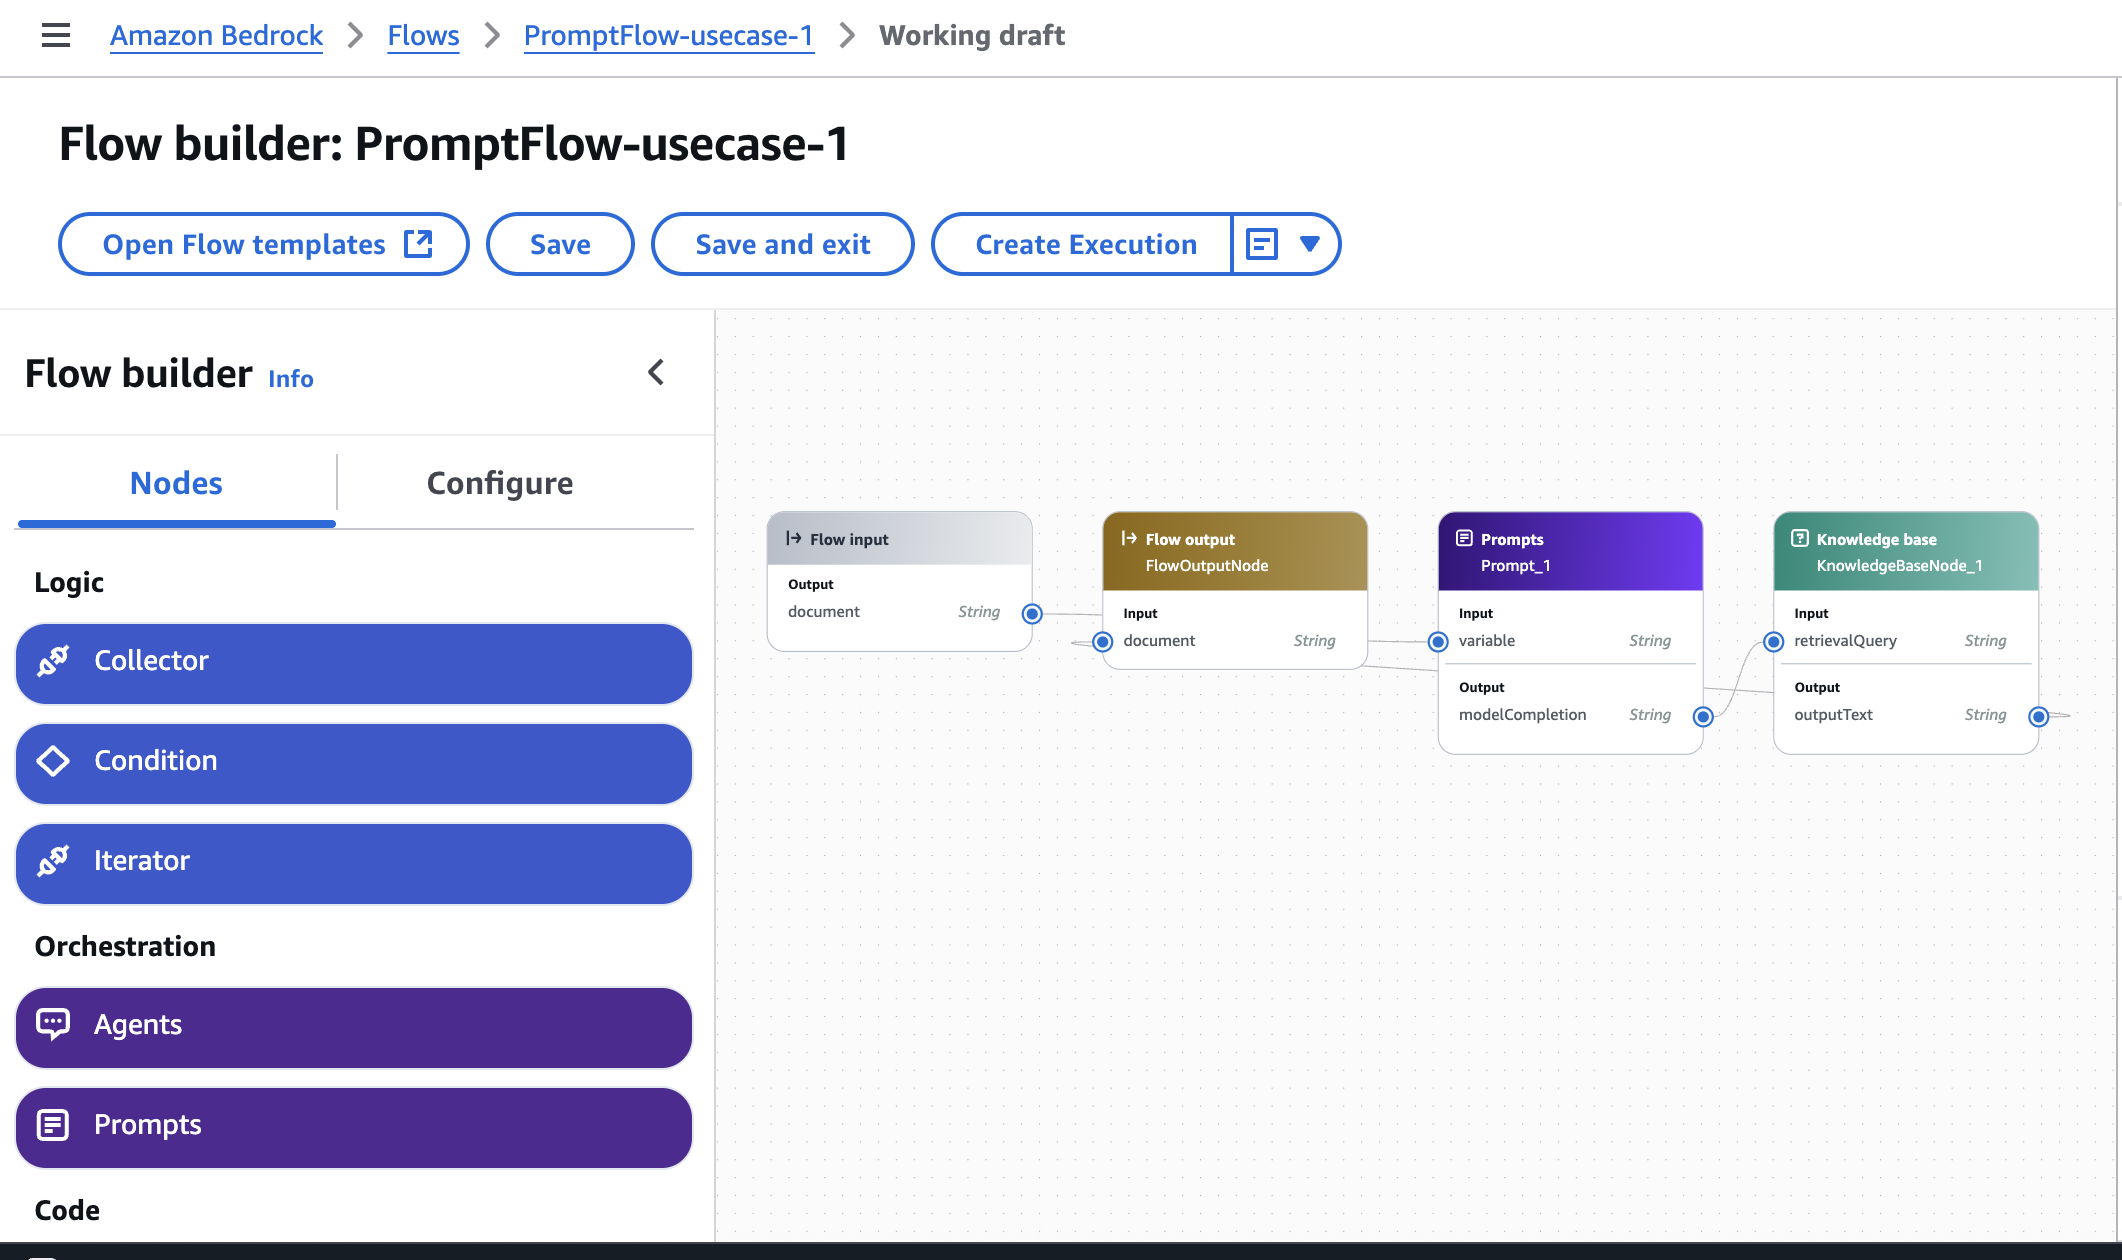


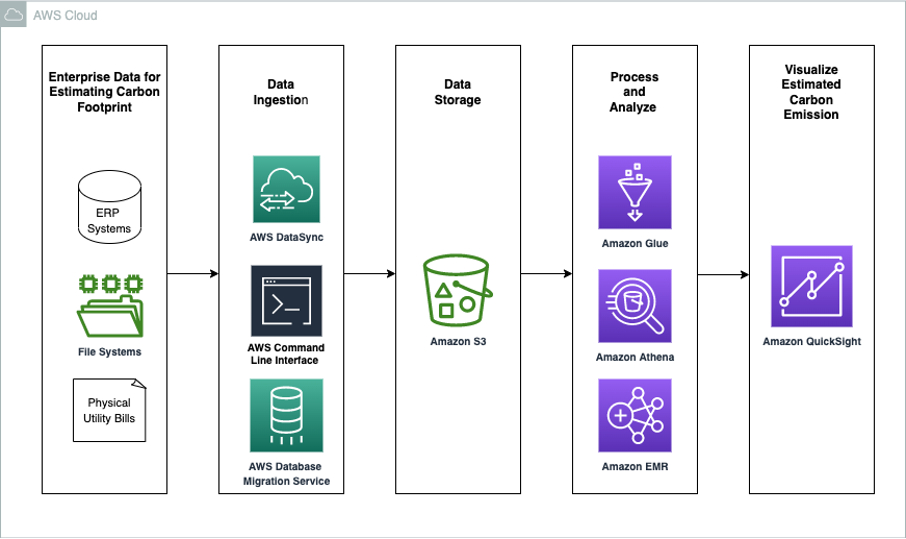

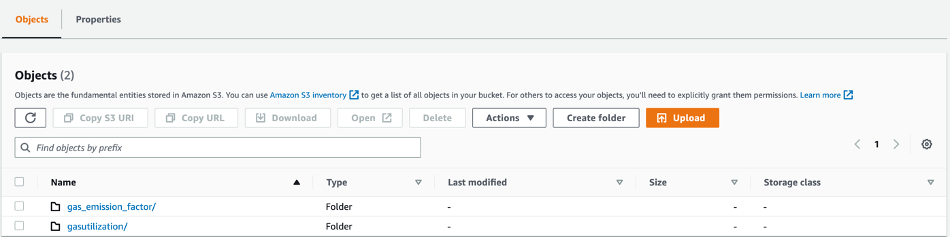
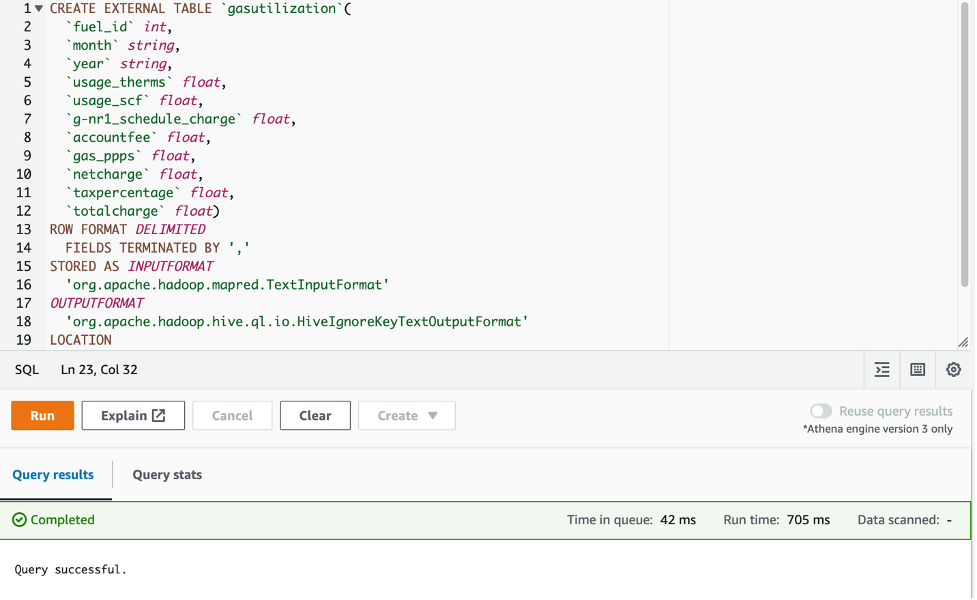
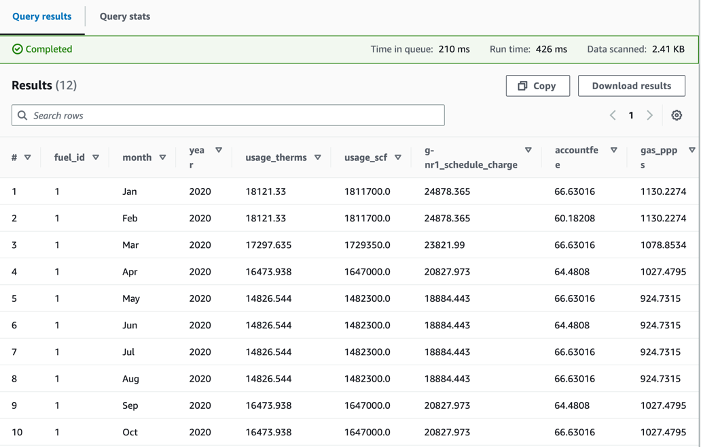
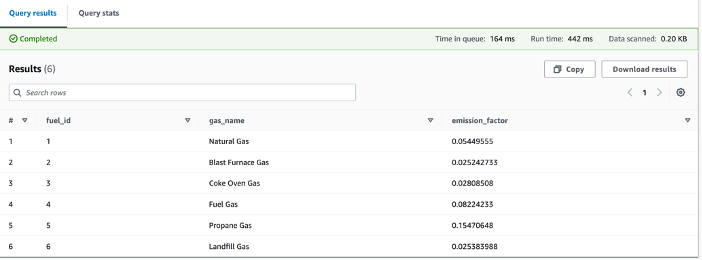
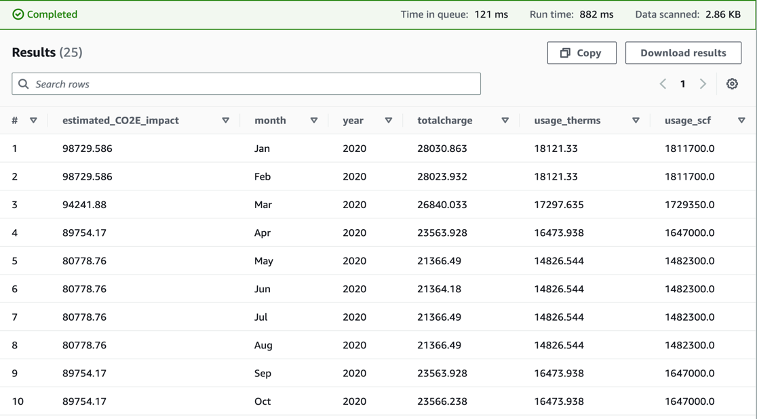
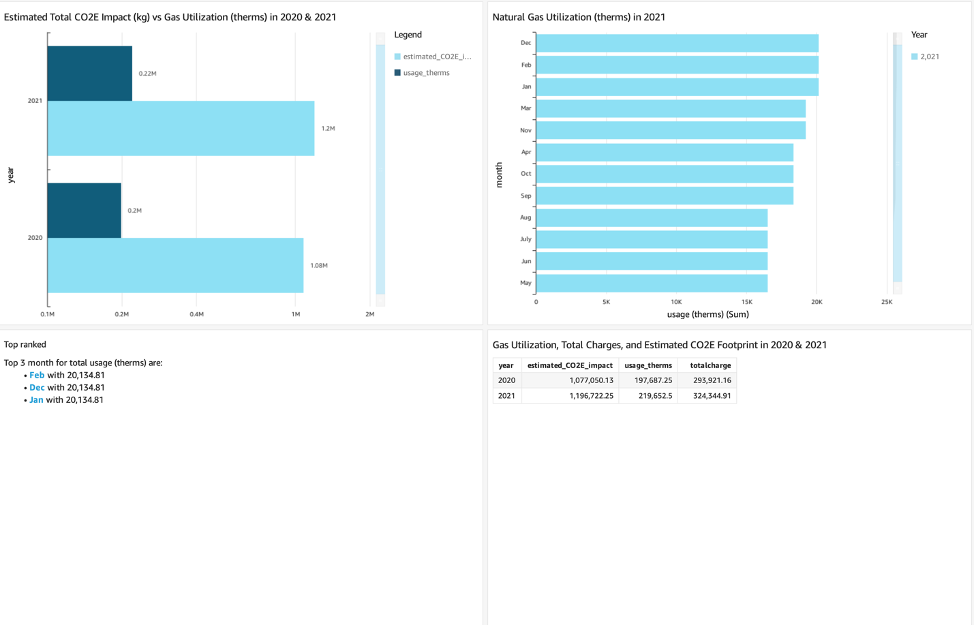
 Thomas Burns,
  Aileen Zheng is a Solutions Architect supporting US Federal Civilian Sciences customers at Amazon Web Services (AWS). She partners with customers to provide technical guidance on enterprise cloud adoption and strategy and helps with building well-architected solutions. She is also very passionate about data analytics and machine learning. In her free time, you’ll find Aileen doing pilates, taking her dog Mumu out for a hike, or hunting down another good spot for food! You’ll also see her contributing to projects to support diversity and women in technology.