Post Syndicated from Nathan Taber original https://aws.amazon.com/blogs/compute/bluegreen-deployments-with-amazon-ecs/
This post and accompanying code was generously contributed by:
 |
 |
 |
| Jeremy Cowan Solutions Architect |
Anuj Sharma DevOps Cloud Architect |
Peter Dalbhanjan Solutions Architect |
Deploying software updates in traditional non-containerized environments is hard and fraught with risk. When you write your deployment package or script, you have to assume that the target machine is in a particular state. If your staging environment is not an exact mirror image of your production environment, your deployment could fail. These failures frequently cause outages that persist until you re-deploy the last known good version of your application. If you are an Operations Manager, this is what keeps you up at night.
Increasingly, customers want to do testing in production environments without exposing customers to the new version until the release has been vetted. Others want to expose a small percentage of their customers to the new release to gather feedback about a feature before it’s released to the broader population. This is often referred to as canary analysis or canary testing. In this post, I introduce patterns to implement blue/green and canary deployments using Application Load Balancers and target groups.
If you’d like to try this approach to blue/green deployments, we have open sourced the code and AWS CloudFormation templates in the ecs-blue-green-deployment GitHub repo. The workflow builds an automated CI/CD pipeline that deploys your service onto an ECS cluster and offers a controlled process to swap target groups when you’re ready to promote the latest version of your code to production. You can quickly set up the environment in three steps and see the blue/green swap in action. We’d love for you to try it and send us your feedback!
What are blue/green deployments?
Blue/green deployments are a type of immutable deployment used to deploy software updates with less risk by creating two separate environments, blue and green. “Blue” is the current running version of your application and “green” is the new version of your application you will deploy.
This type of deployment gives you an opportunity to test features in the green environment without impacting the current running version of your application. When you’re satisfied that the green version is working properly, you can gradually reroute the traffic from the old blue environment to the new green environment by modifying DNS. By following this method, you can update and roll back features with near zero downtime.
 |
A typical blue/green deployment involves shifting traffic between 2 distinct environments. |
This ability to quickly roll traffic back to the still-operating blue environment is one of the key benefits of blue/green deployments. With blue/green, you should be able to roll back to the blue environment at any time during the deployment process. This limits downtime to the time it takes to realize there’s an issue in the green environment and shift the traffic back to the blue environment. Furthermore, the impact of the outage is limited to the portion of traffic going to the green environment, not all traffic. If the blast radius of deployment errors is reduced, so is the overall deployment risk.
Containers make it simpler
Historically, blue/green deployments were not often used to deploy software on-premises because of the cost and complexity associated with provisioning and managing multiple environments. Instead, applications were upgraded in place.
Although this approach worked, it had several flaws, including the ability to roll back quickly from failures. Rollbacks typically involved re-deploying a previous version of the application, which could affect the length of an outage caused by a bad release. Fixing the issue took precedence over the need to debug, so there were fewer opportunities to learn from your mistakes.
Containers can ease the adoption of blue/green deployments because they’re easily packaged and behave consistently as they’re moved between environments. This consistency comes partly from their immutability. To change the configuration of a container, update its Dockerfile and rebuild and re-deploy the container rather than updating the software in place.
Containers also provide process and namespace isolation for your applications, which allows you to run multiple versions of them side by side on the same Docker host without conflicts. Given their small sizes relative to virtual machines, you can binpack more containers per host than VMs. This lets you make more efficient use of your computing resources, reducing the cost of blue/green deployments.
Fully Managed Updates with Amazon ECS
Amazon Elastic Container Service (ECS) performs rolling updates when you update an existing Amazon ECS service. A rolling update involves replacing the current running version of the container with the latest version. The number of containers Amazon ECS adds or removes from service during a rolling update is controlled by adjusting the minimum and maximum number of healthy tasks allowed during service deployments.
When you update your service’s task definition with the latest version of your container image, Amazon ECS automatically starts replacing the old version of your container with the latest version. During a deployment, Amazon ECS drains connections from the current running version and registers your new containers with the Application Load Balancer as they come online.
Target groups
A target group is a logical construct that allows you to run multiple services behind the same Application Load Balancer. This is possible because each target group has its own listener.
When you create an Amazon ECS service that’s fronted by an Application Load Balancer, you have to designate a target group for your service. Ordinarily, you would create a target group for each of your Amazon ECS services. However, the approach we’re going to explore here involves creating two target groups: one for the blue version of your service, and one for the green version of your service. We’re also using a different listener port for each target group so that you can test the green version of your service using the same path as the blue service.
With this configuration, you can run both environments in parallel until you’re ready to cut over to the green version of your service. You can also do things such as restricting access to the green version to testers on your internal network, using security group rules and placement constraints. For example, you can target the green version of your service to only run on instances that are accessible from your corporate network.
Swapping Over
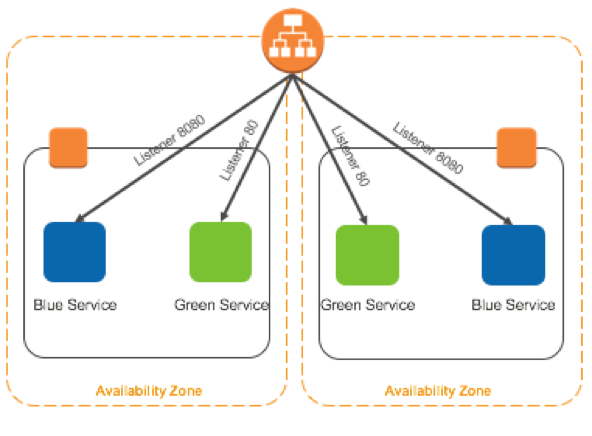
When you’re ready to replace the old blue service with the new green service, call the ModifyListener API operation to swap the listener’s rules for the target group rules. The change happens within a few seconds. Afterward, the green service is running in the target group with the port 80 listener and the blue service is running in the target group with the port 8080 listener. The diagram below is an illustration of the approach described.
Scenario
Two services are defined, each with their own target group registered to the same Application Load Balancer but listening on different ports. Deployment is completed by swapping the listener rules between the two target groups.
The second service is deployed with a new target group listening on a different port but registered to the same Application Load Balancer.
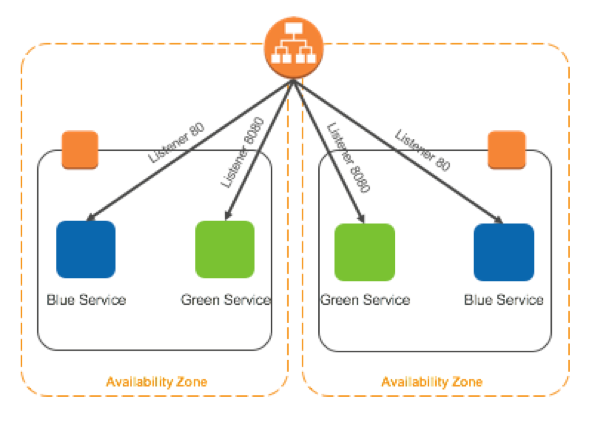
By using 2 listeners, requests to blue services are directed to the target group with the port 80 listener, while requests to the green services are directed to target group with the port 8080 listener.
After automated or manual testing, the deployment can be completed by swapping the listener rules on the Application Load Balancer and sending traffic to the green service.
Caveats
There are a few caveats to be mindful of when using this approach. This method:
- Assumes that your application code is completely stateless. Store state outside of the container.
- Doesn’t gracefully drain connections. The swapping of target groups is sudden and abrupt. Therefore, be cautious about using this approach if your service has long-running transactions.
- Doesn’t allow you to perform canary deployments. While the method gives you the ability to quickly switch between different versions of your service, it does not allow you to divert a portion of the production traffic to a canary or control the rate at which your service is deployed across the cluster.
Canary testing
While this type of deployment automates much of the heavy lifting associated with rolling deployments, it doesn’t allow you to interrupt the deployment if you discover an issue midstream. Rollbacks using the standard Amazon ECS deployment require updating the service’s task definition with the last known good version of the container. Then, you wait for Amazon ECS to schedule and deploy it across the cluster. If the latest version introduces a breaking change that went undiscovered during testing, this might be too slow.
With canary testing, if you discover the green environment is not operating as expected, there is no impact on the blue environment. You can route traffic back to it, minimizing impaired operation or downtime, and limiting the blast radius of impact.
This type of deployment is particularly useful for A/B testing where you want to expose a new feature to a subset of users to get their feedback before making it broadly available.
For canary style deployments, you can use a variation of the blue/green swap that involves deploying the blue and the green service to the same target group. Although this method is not as fast as the swap, it allows you to control the rate at which your containers are replaced by adjusting the task count for each service. Furthermore, it gives you the ability to roll back by adjusting the number of tasks for the blue and green services respectively. Unlike the swap approach described above, connections to your containers are drained gracefully. We plan to address canary style deployments for Amazon ECS in a future post.
Conclusion
With AWS, you can operationalize your blue/green deployments using Amazon ECS, an Application Load Balancer, and target groups. I encourage you to adapt the code published to the ecs-blue-green-deployment GitHub repo for your use cases and look forward to reading your feedback.
If you’re interested in learning more, I encourage you to read the Blue/Green Deployments on AWS and Practicing Continuous Integration and Continuous Delivery on AWS whitepapers.
If you have questions or suggestions, please comment below.