Did you know that, at GitHub, we host all of our own source code on github.com? We do this because we’re our own biggest customer—testing out changes internally before they go to users. However, there’s one downside: If github.com were ever to go down, we wouldn’t be able to access our own source code.
This is what you’d call a very simple circular dependency: to deploy GitHub, we needed GitHub. If GitHub is down, then we wouldn’t be able to deploy something to fix it. We mitigate this by maintaining a mirror of our code for fixing forward and built assets for rolling back.
So we’re done, right? Problem solved? Nope, there are more circular dependencies to consider. For example, how do you stop a deployment script introducing a circular dependency of its own on an internal service or downloading a binary from GitHub?
When we started to design our new host-based deployment system, we evaluated some new approaches to prevent deployment code from creating circular dependencies. We found that using eBPF, we could selectively monitor and block those calls. In this blog post, we’ll take you through our findings and show how you can get started writing your own eBPF programs.
Types of circular dependencies
Let’s start by looking at the types of circular dependencies through a hypothetical scenario.
Suppose a MySQL outage occurs, which causes GitHub to be unable to serve release data from repositories. To resolve the incident, we need to roll out a configuration change to the stateful MySQL nodes that are impacted. This configuration change is applied by executing a deploy script on each node.
Now, let’s look at the different types of circular dependencies that could impact GitHub during this scenario.
Direct dependency: The MySQL deploy script attempts to pull the latest release of an open source tool from GitHub. Since GitHub can’t serve the release data (due to the outage), the script can’t complete.
Hidden dependencies: The MySQL deploy script uses a servicing tool that is already present on the machine’s disk. However, when the tool runs, it checks GitHub to see if an update is available. If it’s unable to contact GitHub (due to the outage), the script may fail or hang, depending on how the tool handles the error when checking for updates.
Transient dependencies: The MySQL deploy script calls, via an API, another internal service (for example, a migrations service), which in turn attempts to fetch the latest release of an open source tool from GitHub to use the new binary. The failure propagates back to the deploy script.
How do you solve these circular dependencies?
Until recently, the onus has been on every team who that owns stateful hosts to review their deployment scripts and identify circular dependencies.
In practice, however, many dependencies aren’t identified until an incident occurs, which can delay recovery.
The obvious route would be to block access to github.com from the machines to validate that the system can deploy without it. But these hosts are stateful and serve customer traffic even during rolling deploys, drains, or restarts. Blocking github.com entirely would impact their ability to handle production requests.
This is where we started to look at eBPF, which lets you load custom programs into the Linux kernel and hook into core system primitives like networking.
A cGroup is a Linux primitive (used heavily by Docker but not limited to it) that enforces resource limits and isolation for sets of processes. You can create a cGroup, configure it, and move processes into it—no Docker required.
This started to look very promising. Could we create a cGroup, place only the deployment script inside it, and then limit the outbound network access of only that script? It certainly looked possible, so we started to build a proof of concept.
Building out per-process conditional network filtering with eBPF
We started on a proof of concept in go that used the cilium/ebpf library.
ebpf-go is a pure-Go library to read, modify, and load eBPF programs and attach them to various hooks in the Linux kernel.
It massively simplifies the process of authoring, building, and running programs that use eBPF. For example, to hook the BPF_PROG_TYPE_CGROUP_SKB program type, we can do this as follows: 👇
//go:generate go tool bpf2go -tags linux bpf cgroup_skb.c -- -I../headers


func main() {

   // Load pre-compiled programs and maps into the kernel.

   objs := bpfObjects{}

   if err := loadBpfObjects(&objs, nil); err != nil {

       log.Fatalf("loading objects: %v", err)

   }

   defer objs.Close()


   // Link the count_egress_packets program to the cgroup.

   l, err := link.AttachCgroup(link.CgroupOptions{

       Path:    "/sys/fs/cgroup/system.slice",

       Attach:  ebpf.AttachCGroupInetEgress,

       Program: objs.CountEgressPackets,

   })

   if err != nil {

       log.Fatal(err)

   }

   defer l.Close()


   log.Println("Counting packets...")


   // Read loop reporting the total amount of times the kernel

   // function was entered, once per second.

   ticker := time.NewTicker(1 * time.Second)

   defer ticker.Stop()


   for range ticker.C {

       var value uint64

       if err := objs.PktCount.Lookup(uint32(0), &value); err != nil {

           log.Fatalf("reading map: %v", err)

       }

       log.Printf("number of packets: %d\n", value)

   }

}
The //go:generate line handles compiling the eBPF C code and auto-generating the bpfObjects struct, which allows us to attach and interact with the program. This means a simple go build is all you need. 🥳
There was still a missing piece though: CGROUP_SKB operates on IP addresses. Given the breadth of GitHub’s systems and rate of change, keeping an up-to-date block IP list would be very hard.
Could we use more eBPF to create a DNS-based blocked list? Yes, it turns out we could.
Here is a simplified example where we rewrite any connect4 syscall targeting DNS (Port 53) to localhost:53.
cgroupLink, err := link.AttachCgroup(link.CgroupOptions{

       Path:    cgroup.Name(),

       Attach:  ebpf.AttachCGroupInet4Connect,

       Program: obj.Connect4,

   })

   if err != nil {

       return nil, fmt.Errorf("attaching eBPF program Connect4 to cgroup: %w", err)

   }
/* This is the hexadecimal representation of 127.0.0.1 address */

const __u32 ADDRESS_LOCALHOST_NETBYTEORDER = bpf_htonl(0x7f000001);


SEC("cgroup/connect4")

int connect4(struct bpf_sock_addr *ctx) {

 __be32 original_ip = ctx->user_ip4;

 __u16 original_port = bpf_ntohs(ctx->user_port);


 if (ctx->user_port == bpf_htons(53)) {

   /* For DNS Query (*:53) rewire service to backend

    * 127.0.0.1:const_dns_proxy_port */

   ctx->user_ip4 = const_mitm_proxy_address;

   ctx->user_port = bpf_htons(const_dns_proxy_port);

 }


 return 1;

}
We used this to intercept DNS queries from the cGroup and forward them to a userspace DNS proxy we run.
Now, any DNS queries initiated by the deployment script are routed through our DNS proxy. Our proxy evaluates each requested domain against our block list and uses eBPF Maps to communicate with the CGROUP_SKB program, allowing or denying the request accordingly.
If you’d like to dig into the code, here’s an early proof of concept we put together. Our current implementation has progressed since then, but this should serve as a good intro.
Like any fun project, the deeper we got, the more we realized we could do.
For example, could we correlate blocked DNS requests back to the specific command or process that triggered them, so teams could more easily debug and fix issues? Yes, we can!
As we’re redirecting all DNS calls to our userspace DNS proxy, we can look at the transaction ID of each request, find the domain being resolved, and lookup in the eBPF Map to see which process made the request. By reading /proc/{PID}/cmdline, we can even extract the full command line that triggered the request.
Then we can output a log line with all the information:
Conditionally block domains that would cause circular dependencies from deployment scripts.
Inform the owning team which command triggered the blocked request.
Provide an audit list of all domains contacted during a deployment.
Use the cGroups to enforce CPU and memory limits on deploy scripts, preventing runaway resource usage from impacting workloads.
What’s next?
Our new circular dependency detection process is live after a six-month rollout.
Now, if a team accidentally adds a problematic dependency, or if an existing binary tool we use takes a new dependency, the tooling will detect that problem and flag it to the team.
The net result is a more stable GitHub and faster mean time to recovery during incidents (due to the removal of these circular dependencies).
Are there ways for circular dependencies to still trip things up? You bet—and we’ll look to improve the tool as we discover them.
Want to dive in?
Has this piqued your interest in what you might be able to do with eBPF?
Get started by having a look through the examples in cilium/ebpf and the great documentation on the docs.ebpf.io site.
You’ve vibe-coded an AI assistant that’s a game-changer for your team. It works perfectly on your laptop. But when you try to deploy it company-wide, everything falls apart.
This is what is known as “deployment slop”—the messy reality when quick AI prototypes hit the enterprise world. Your tool suddenly becomes unreliable, insecure, and impossible to maintain. Different teams run different versions. Security flags it. IT won’t touch it. Your innovation dies.
BriX solves this. It’s a platform that takes your working AI prototype and makes it production-ready—without forcing you to become a full-stack developer. BriX handles the hard parts such as security, scaling, and data connections, so you can focus on building great tools. Switch between AI models like Claude or GPT with a click. Connect securely to your company’s data sources. Deploy once, and it just works—for everyone.
This article shows how BriX transforms AI deployment from an engineering bottleneck into a configuration task, enabling domain experts to ship enterprise-grade AI tools in days instead of months.
Introduction
Building AI tools has never been easier. With ChatGPT, Claude, and other Large Language Models (LLMs), anyone can prototype a useful AI assistant in an afternoon. Data analysts build metric query tools; product managers create research assistants. This rapid experimentation—”vibe coding”—has sparked innovation across organizations.
But then comes the hard part: deployment.
That brilliant tool you built on your laptop? It works great for you. But when your boss asks you to “roll it out to the whole company,” you hit a wall. Suddenly you need:
Security reviews (Is it leaking sensitive data?)
Reliability guarantees (What happens when 500 people use it at once?)
Access controls (Who can see what data?)
Audit trails (Who asked what, and when?)
Consistent behavior (Why does it give different answers to different people?)
Most builders aren’t DevOps engineers. They’re domain experts who had a good idea. So these tools either:
Never get deployed (innovation dies in a Jupyter notebook); or
Get deployed badly (creating “Deployment Slop”—a mess of insecure, unreliable scripts).
The three failure modes of deployment slop
The chaos problem: Everyone’s running a different version
Marketing copies your script and tweaks the prompts. Finance changed the model from GPT-4 to Claude because it’s cheaper. Sales adds their own data sources. Within weeks, you have:
Five different versions of “the same tool”.
Wildly different answers to the same question.
No one knows which version is “correct”.
Teams making decisions based on inconsistent data.
Potential risk: A senior executive receiving conflicting answers from different teams, resulting in a loss of trust.
The reliability problem: It works until it doesn’t
Your laptop script was built for one user (you). Now 50 people are using it simultaneously. The result:
Timeouts and crashes during peak hours.
No error handling (users see cryptic Python stack traces).
Rate limits hit on API calls.
No monitoring or alerts when things break.
You become the “on-call” support person for a side project.
Potential risk: The tool fails during a critical metric review leaving folks to find the solution manually.
The security problem: Accidental data leaks
Your prototype connects directly to production databases. It has your personal credentials hardcoded. There’s no:
Access control (everyone sees all data, including sensitive info).
Audit trail (no record of who queried what).
Data governance (PII might be exposed).
Compliance review (legal and security teams don’t even know it exists).
Potential risk: An employee inadvertently querying PII, resulting in a potential breach.
Who gets hit hardest?
This problem is especially painful for semi-technical builders—the domain experts who understand the business problem but aren’t DevOps engineers:
Product Managers who write SQL but not Kubernetes configs.
Data Analysts who know Python but not cloud security.
Marketing Ops who build dashboards but not CI/CD pipelines.
HR Analytics who understand people data but not infrastructure scaling.
The traditional solution is to “hand it to Engineering,” but they are backlogged for months. By the time they rebuild your tool “properly,” the business need has changed.
Solution: Enter BriX: From prototype to production in days, not months
BriX is a platform that solves the deployment problem by centralizing all the hard infrastructure work. Instead of forcing every builder to become a DevOps expert, BriX provides the production-ready foundation so you can focus on building great AI tools.
The core insight: Deployment doesn’t have to be an engineering problem. It can be a configuration problem.
What BriX does
Think of BriX as the “production layer” for AI tools. You bring your working prototype. BriX handles security, scaling, data connections, monitoring, audit trails, and consistent behavior across teams.
You configure. BriX deploys.
Figure 1. BriX infrastructure
The three core capabilities
Choose your AI model (Model agnosticism)
Different tasks need different models. BriX lets you switch between models with a dropdown—Claude, GPT, Gemini, or others. Test which works best. Change models without rewriting code. Optimize for cost vs. performance.
Example: Your finance tool uses GPT-4 for complex analysis, but a new better model is available. Change it in BriX with one click—no code changes needed.
Figure 2. Model selection interface
Connect to enterprise data securely (Model Context Protocols)
This is where BriX really shines. Your AI tool needs data—metrics, customer info, documentation. But connecting to enterprise systems securely is hard.
Model Context Protocols (MCPs) are BriX’s solution. Think of them as secure, pre-built connectors to your company’s data sources.
Why MCPs matter:
Security built-in: No hardcoded credentials, proper access controls.
Certified data: Connect only to approved, governed data sources.
No custom integration: Pre-built connectors, not custom API code.
Audit trails: Every query is logged automatically.
Example: Your marketing tool can query the metrics system to get conversion rates, search the knowledge base for campaign guidelines, and pull customer data from the data lake —all through secure, governed connections.
Technical note: MCPs use a standardized protocol, so adding new data sources doesn’t require rebuilding your tool. BriX handles the complexity.
Figure 3. BriX chat user interface
Ensure consistent behavior (System prompts and context)
Remember the “chaos problem” where everyone runs different versions? BriX solves this with centralized configurations by allowing you to lock it down for the users:
System prompts: Define your AI’s personality, tone, and guardrails once.
Context files: Upload reference documents that every instance uses.
Global enforcement: All users get the same behavior automatically.
Example: Your customer support tool has a system prompt that says “Always be empathetic, never make promises about refunds, escalate to humans for complaints.” Every support agent’s AI follows these rules—no exceptions.
Figure 4. The builder’s view
Additional feature: Flexible interfaces and collaboration
Beyond the core infrastructure, BriX offers flexible ways to consume these tools. BriX goes beyond conversational interfaces—you can host custom UIs built with any frontend framework while BriX handles the AI backend. Users can also generate and share analyses as persistent reports, turning individual queries into institutional knowledge accessible across teams via shareable links—complete with data, visualizations, and AI insights.
Figure 5. Share feature interface
The BriX workflow: A real example
Let’s see how a product manager would use BriX:
Step 1: Upload your prototype
You’ve built a Jupyter notebook that queries metrics and generates reports.
Upload it to BriX (or connect your GitHub repo).
Step 2: Configure (Not code)
Choose your AI model: Claude 4.5 Sonnet
Connect data sources: Midas (metrics), Hubble (data lake)
Set system prompt: “You’re a data analyst. Always cite sources. Format numbers with commas.”
Upload context: Your company’s metrics definitions guide.
Step 3: Lock
Lock all the configurations of your BriX.
Share with your team.
Figure 6. BriX landing page
Figure 7. The user’s view (Locks and edit not available)
Step 4: It just works
Certification by design with Brick Quality residing with the brick admin.
Focused use cases have specific system prompts, context – minimizing hallucination concerns.
People can use it simultaneously (BriX handles scaling).
Everyone gets consistent answers (same model, same prompts).
All queries are logged (audit trail automatic).
The security team is happy (proper access controls).
You’re not on-call (BriX monitors and alerts).
Time to production: 3 Days, not 3 months.
Under the hood: The BriX architecture
BriX is built on a synchronous streaming architecture—a design that prioritizes real-time responsiveness without sacrificing enterprise security. Think of it like a live sports broadcast: you see the action as it happens, not a delayed replay.
Figure 8. BriX architecture
Here’s how a single user request flows through the system, from question to answer.
The request journey: Six layers
User Question
      ↓
[1] The Frontend — Real-Time Streaming
      ↓
[2] The Gateway — FastAPI Backend
      ↓
[3] The Brain — LangGraph Orchestration
      ↓
[4] Memory — Hot and Cold Storage
      ↓
[5] Security — Identity Propagation ("On-Behalf-Of" Flow)
      ↓
[6] Data Processing — Full Context, Not Fragments
      ↓
Response streams back to user in real-time
Let’s break down each layer.
Layer 1: The frontend — Real-time streaming
Technology: React (TypeScript)
User experience: ChatGPT-style interface
The User types a question: “What’s our conversion rate in Singapore last month?”
The frontend opens a persistent connection to BriX servers. As the AI processes the question, updates stream back instantly:
“🤔 Thinking…”
“📊 Querying metrics database…”
“✅ Found 3 relevant data points…”
[Final answer appears]
Why streaming matters:
Traditional approach
BriX approach
❌ User waits 30 seconds, sees nothing, then gets full answer (feels broken).
✅ User sees progress every second (feels responsive and trustworthy).
Technical implementation: Server-Sent Events (SSE) for real-time updates without WebSocket complexity.
Layer 2: The Gateway — FastAPI backend
Technology: FastAPI (Python)
Role: Central traffic controller
What it does:
Receives all incoming requests
Authenticates users (checks SSO tokens)
Routes requests to the appropriate agent
Manages rate limiting (prevents abuse)
Handles errors gracefully
Why FastAPI?
⚡ Fast (async/await for concurrent requests)
🔒 Secure (built-in authentication)
📈 Scalable (handles thousands of concurrent users)
Layer 3: The Brain — LangGraph orchestration
Technology: LangGraph (AI workflow framework)
Role: The “main agent” that coordinates everything.
Think of LangGraph as a smart router that understands intent and delegates work.
Example flow:
User asks: “Compare our Singapore and Malaysia conversion rates, then explain why they differ”.
This is where BriX’s security model shines. Instead of using a single “service account” to access all data, BriX uses your credentials for every query.
How it works:
Step 1: Authentication (Login)
You log in via SSO (e.g., Okta, Azure AD)
BriX receives a secure token that represents your identity
This token includes your permissions (what data you can access)
Step 2: Identity propagation (Query execution)
You ask: “Show me customer revenue data”
BriX doesn’t use its own credentials to query the database
Instead, BriX carries your token to the data source
The data source checks: “Does this user have permission to see revenue data?”
If yes → Returns data
If no → Access denied
Step 3: Audit trail
Every query is logged with:
Who asked (your user ID)
What they asked (the question)
What data was accessed (the query)
When it happened (timestamp)
Why this matters:
Traditional approach
BriX approach
❌ Service account has access to ALL data.
✅ Each user only sees their authorized data.
❌ Can’t tell who accessed what.
✅ Complete audit trail per user.
❌ Security team nervous about AI tools.
✅ Security team approves (same controls as existing tools).
❌ One compromised credential = full breach.
✅ Breach limited to single user’s permissions.
Real-world example:
Finance analyst asks about revenue → Sees all financial data (authorized)
Marketing analyst asks same question → Sees only marketing budget (restricted)
Same AI tool, different permissions → Security enforced automatically
Technical term: This is called “identity propagation” or “on-behalf-of flow” in enterprise security.
Layer 6: Data processing — Full context, not fragments
The old way (Retrieval Augmented Generation (RAG)):
User asks a question.
System searches for relevant document chunks.
System sends top 5 chunks to AI.
AI answers based on fragments.
Problem: AI might miss context from other parts of the document.
The BriX way (Full context):
User uploads a document.
BriX feeds the entire document into the AI’s context window.
AI reads and understands the full document.
AI answers with complete context.
Why this works now: Modern AI models (Claude, GPT-4) have massive context windows (100K+ tokens). They can process entire documents, not just snippets—resulting in more accurate answers and fewer hallucinations.
Example:
Question: “What’s our refund policy for international orders?”
RAG approach: Finds 3 snippets about refunds → Might miss international-specific rules
The result: An AI platform that feels as fast as ChatGPT but with enterprise-grade security and reliability.
What using BriX actually feels like
All the technical architecture is invisible to end users. Here’s what they actually see and experience.
Login: One click, no new passwords
What users see:
Visit BriX URL
Click “Log in with SSO” (uses your existing company login)
Redirects to familiar authentication screen
Logged in automatically
What users DON’T see:
No new account creation
No password to remember
No security questionnaire
BriX inherits your existing permissions automatically
Why this matters: Zero onboarding friction. If you can access your email, you can use BriX.
The app library: Your company’s AI tools
What users see: Company’s internal “App Store” for AI tools.
Each tool is pre-configured and vetted
Click to launch (no installation)
Tools are tailored to company’s data and processes
Using a Tool: ChatGPT-style interface
What users see:
See the AI “thinking” and “querying”—no black box waiting. Builds trust (“I can see it’s actually checking the data”).
Source citations:
Every answer includes a data source. Click to view original data. No “trust me” answers.
Conversational follow-ups:
“Why did it increase?” | “Compare to Malaysia” | “Show me a chart”
BriX remembers the context.
Data upload: Drag, drop, analyze
What users have:
Files are processed securely (encrypted).
AI reads the full content.
Users can ask questions about the files.
Files are only visible to the uploader (privacy).
Trustworthy answers: Certified data, not hallucinations
The problem BriX solves:
ChatGPT/Generic AI
BriX
❌ Makes up data (“hallucinations”)
✅ Only uses your company’s real data
❌ No source citations
✅ Every answer cites the source
❌ Can’t access internal data
✅ Connects to your data lakes, metrics, docs
❌ Same answer for everyone
✅ Respects your permissions (you only see your data)
Why users trust it:
✅ Specific number (not vague)
✅ Source cited (can verify)
✅ Certified data (governance approved)
✅ Timestamp (know it’s current)
✅ Can export/verify (transparency)
The impact: What BriX actually changes
BriX shifts how organizations build AI tools. Here’s what that looks like in practice.
From months to days
Traditional path
BriX path
1. Domain expert has idea.
1. Domain expert has idea
2. Submits request to engineering.
2. Configures the idea in BriX.
3. Waits in backlog (weeks to months).
3. Tests with small group.
4. Engineering rebuilds it “properly”.
4. Deploys to production.
5. Tool finally launches.
5. Shares with team.
What changes:
⚡ Speed (hours instead of months)
👤 Ownership (domain experts maintain their tools)
🔄 Iteration (refine based on feedback immediately)
✅ Success rate (ideas get tested instead of dying in backlog)
True democratization
Who builds tools with BriX:
The shift isn’t just engineers anymore. We’re seeing:
Product managers building feature analysis tools.
Data analysts creating custom dashboards.
Marketing ops building campaign trackers.
Sales ops creating pipeline monitors.
HR analytics building retention tools.
What this means:
Domain expertise stays with domain experts (no translation loss). Engineering focuses on platforms (not individual tool requests). Innovation happens at business speed (not constrained by engineering capacity).
The reality check:
Not every domain expert will build tools (and that’s fine). Some tools still need engineering (complex integrations, custom logic). But the bottleneck shifts from “engineering capacity” to “good ideas.”
Flexibility without fragility
What you can change without rewriting code:
Swap AI models:
Dropdown menu selection (GPT-5, Claude, Gemini)
Different teams can setup different models for their BriX
Can test new models without rebuilding tools
Add data sources:
New MCP connector (one-time setup)
All existing tools can access the new source
No need to update individual tools
Update behavior globally:
Change system prompt in one place
All instances follow new rules immediately
Useful for policy updates, compliance changes
Real example: When a company needs to update data access policies:
Traditional approach: Update each tool individually (days/weeks)
BriX approach: Update system prompt once (minutes)
Fast tools = security nightmares, compliance issues
BriX’s approach: Security is built into the platform, not added per tool.
What’s automatic:
SSO authentication (no passwords to manage)
Identity propagation (users see only their authorized data)
Audit logging (every query tracked)
What this changes:
Security team reviews the platform once (not every tool)
Builders don’t need to become security experts
Compliance is automatic (audit trails, access controls)
Tools can move fast without sacrificing governance
Real impact: Security teams that previously rejected most AI proposals can pre-approve BriX. Then tools built on BriX inherit those security controls automatically.
BriX will:
Provide infrastructure for rapid AI tool deployment.
Make it easier for domain experts to productionize ideas.
Centralize security and governance.
Reduce (not eliminate) the engineering bottleneck.
Give you a path from prototype to production.
The real impact
The biggest change isn’t technical. It’s organizational.
BriX changes the conversation from:
“Can engineering build this for us?”
to:
“Let me try building this and see if it works”
That shift—from asking permission to testing ideas—is the real impact.
Some ideas will fail. That’s fine. The cost of testing is now low enough that failure is acceptable.
The ideas that succeed can scale immediately. That’s what matters.
Adoption: From zero to production reality
This isn’t theoretical. Real teams are using BriX right now:
The Universal Playground – Data analysts and product managers drop in to run quick analyses or ask questions—no setup, no credentials to configure. Just connect and go. It’s become the default “let me check something” tool.
Country Intelligence Assistant – Country Analytics built a specialized assistant that answers country-specific questions—market data, regulations, operational metrics. It’s now the go-to source for regional teams making local decisions.
Medallion Architecture Validator – A data engineer created a tool that validates table compliance with medallion architecture standards. What used to take manual reviews now happens instantly. Teams query it before deployments to catch issues early.
Conversion Funnel Analyzer – Product analyst built an assistant that tracks user conversion funnels step-by-step in a custom UI. Marketing and product teams use it daily to understand drop-off points without writing SQL.
Learnings/conclusion
The promise: Anyone can build AI tools. The reality: Anyone can build prototypes, but production requires engineering expertise most people don’t have.
BriX bridges that gap.
What BriX does
For domain experts: Build and own tools without becoming DevOps experts. Iterate in hours, not months. For engineering: Stop being the bottleneck. Secure the platform once, not every tool. For the organization: Test more ideas. Scale what works. Automatic security and compliance.
Why BriX works: Three design principles
Building BriX taught us that successful enterprise AI platforms require:
Specialization over generalization
Users prefer 5 focused tools over 1 unpredictable tool. That’s why BriX uses modular “Bricks”—each specialized for specific tasks (data analysis, trend detection, document search). Narrow scope = better reliability.
Enablement over control
Deployment slop isn’t a problem to eliminate—it’s evidence of demand. Don’t kill experimentation; provide the path to production. BriX lets teams experiment locally, then offers the infrastructure to scale what works.
Reliability over features
Users forgive missing features. They don’t forgive unreliability. One slow response or wrong answer = they never come back. That’s why BriX prioritizes real-time streaming, certified data sources, and source citations over adding more capabilities.
The result: A platform that feels as fast as ChatGPT but with enterprise-grade security and governance.
Configure once. Analyze everywhere. Act fast.
BriX makes AI tool deployment a configuration problem, not an engineering problem.
Your domain experts have the ideas. BriX gives them the path to production.
What’s next
BriX solves deployment, but we’re not stopping there.
More data sources
We’re expanding the MCP library. If our company uses it, BriX should connect to it—securely and without custom engineering work.
Bring your own code
For technical builders who want custom logic without DevOps headaches, we’re launching a mono repo setup:
Onboarding more BriX for different tech and non-tech personas.
Join us
Grab is a leading superapp in Southeast Asia, operating across the deliveries, mobility and digital financial services sectors. Serving over 800 cities in eight Southeast Asian countries, Grab enables millions of people everyday to order food or groceries, send packages, hail a ride or taxi, pay for online purchases or access services such as lending and insurance, all through a single app. Grab was founded in 2012 with the mission to drive Southeast Asia forward by creating economic empowerment for everyone. Grab strives to serve a triple bottom line – we aim to simultaneously deliver financial performance for our shareholders and have a positive social impact, which includes economic empowerment for millions of people in the region, while mitigating our environmental footprint.
Powered by technology and driven by heart, our mission is to drive Southeast Asia forward by creating economic empowerment for everyone. If this mission speaks to you, join our team today!
This post and accompanying code was generously contributed by:
Jeremy Cowan Solutions Architect
Anuj Sharma DevOps Cloud Architect
Peter Dalbhanjan Solutions Architect
Deploying software updates in traditional non-containerized environments is hard and fraught with risk. When you write your deployment package or script, you have to assume that the target machine is in a particular state. If your staging environment is not an exact mirror image of your production environment, your deployment could fail. These failures frequently cause outages that persist until you re-deploy the last known good version of your application. If you are an Operations Manager, this is what keeps you up at night.
Increasingly, customers want to do testing in production environments without exposing customers to the new version until the release has been vetted. Others want to expose a small percentage of their customers to the new release to gather feedback about a feature before it’s released to the broader population. This is often referred to as canary analysis or canary testing. In this post, I introduce patterns to implement blue/green and canary deployments using Application Load Balancers and target groups.
If you’d like to try this approach to blue/green deployments, we have open sourced the code and AWS CloudFormation templates in the ecs-blue-green-deployment GitHub repo. The workflow builds an automated CI/CD pipeline that deploys your service onto an ECS cluster and offers a controlled process to swap target groups when you’re ready to promote the latest version of your code to production. You can quickly set up the environment in three steps and see the blue/green swap in action. We’d love for you to try it and send us your feedback!
What are blue/green deployments?
Blue/green deployments are a type of immutable deployment used to deploy software updates with less risk by creating two separate environments, blue and green. “Blue” is the current running version of your application and “green” is the new version of your application you will deploy.
This type of deployment gives you an opportunity to test features in the green environment without impacting the current running version of your application. When you’re satisfied that the green version is working properly, you can gradually reroute the traffic from the old blue environment to the new green environment by modifying DNS. By following this method, you can update and roll back features with near zero downtime.
A typical blue/green deployment involves shifting traffic between 2 distinct environments.
This ability to quickly roll traffic back to the still-operating blue environment is one of the key benefits of blue/green deployments. With blue/green, you should be able to roll back to the blue environment at any time during the deployment process. This limits downtime to the time it takes to realize there’s an issue in the green environment and shift the traffic back to the blue environment. Furthermore, the impact of the outage is limited to the portion of traffic going to the green environment, not all traffic. If the blast radius of deployment errors is reduced, so is the overall deployment risk.
Containers make it simpler
Historically, blue/green deployments were not often used to deploy software on-premises because of the cost and complexity associated with provisioning and managing multiple environments. Instead, applications were upgraded in place.
Although this approach worked, it had several flaws, including the ability to roll back quickly from failures. Rollbacks typically involved re-deploying a previous version of the application, which could affect the length of an outage caused by a bad release. Fixing the issue took precedence over the need to debug, so there were fewer opportunities to learn from your mistakes.
Containers can ease the adoption of blue/green deployments because they’re easily packaged and behave consistently as they’re moved between environments. This consistency comes partly from their immutability. To change the configuration of a container, update its Dockerfile and rebuild and re-deploy the container rather than updating the software in place.
Containers also provide process and namespace isolation for your applications, which allows you to run multiple versions of them side by side on the same Docker host without conflicts. Given their small sizes relative to virtual machines, you can binpack more containers per host than VMs. This lets you make more efficient use of your computing resources, reducing the cost of blue/green deployments.
Fully Managed Updates with Amazon ECS
Amazon Elastic Container Service (ECS) performs rolling updates when you update an existing Amazon ECS service. A rolling update involves replacing the current running version of the container with the latest version. The number of containers Amazon ECS adds or removes from service during a rolling update is controlled by adjusting the minimum and maximum number of healthy tasks allowed during service deployments.
When you update your service’s task definition with the latest version of your container image, Amazon ECS automatically starts replacing the old version of your container with the latest version. During a deployment, Amazon ECS drains connections from the current running version and registers your new containers with the Application Load Balancer as they come online.
Target groups
A target group is a logical construct that allows you to run multiple services behind the same Application Load Balancer. This is possible because each target group has its own listener.
When you create an Amazon ECS service that’s fronted by an Application Load Balancer, you have to designate a target group for your service. Ordinarily, you would create a target group for each of your Amazon ECS services. However, the approach we’re going to explore here involves creating two target groups: one for the blue version of your service, and one for the green version of your service. We’re also using a different listener port for each target group so that you can test the green version of your service using the same path as the blue service.
With this configuration, you can run both environments in parallel until you’re ready to cut over to the green version of your service. You can also do things such as restricting access to the green version to testers on your internal network, using security group rules and placement constraints. For example, you can target the green version of your service to only run on instances that are accessible from your corporate network.
Swapping Over
When you’re ready to replace the old blue service with the new green service, call the ModifyListener API operation to swap the listener’s rules for the target group rules. The change happens within a few seconds. Afterward, the green service is running in the target group with the port 80 listener and the blue service is running in the target group with the port 8080 listener. The diagram below is an illustration of the approach described.
Scenario
Two services are defined, each with their own target group registered to the same Application Load Balancer but listening on different ports. Deployment is completed by swapping the listener rules between the two target groups.
The second service is deployed with a new target group listening on a different port but registered to the same Application Load Balancer.
By using 2 listeners, requests to blue services are directed to the target group with the port 80 listener, while requests to the green services are directed to target group with the port 8080 listener.
After automated or manual testing, the deployment can be completed by swapping the listener rules on the Application Load Balancer and sending traffic to the green service.
Caveats
There are a few caveats to be mindful of when using this approach. This method:
Assumes that your application code is completely stateless. Store state outside of the container.
Doesn’t gracefully drain connections. The swapping of target groups is sudden and abrupt. Therefore, be cautious about using this approach if your service has long-running transactions.
Doesn’t allow you to perform canary deployments. While the method gives you the ability to quickly switch between different versions of your service, it does not allow you to divert a portion of the production traffic to a canary or control the rate at which your service is deployed across the cluster.
Canary testing
While this type of deployment automates much of the heavy lifting associated with rolling deployments, it doesn’t allow you to interrupt the deployment if you discover an issue midstream. Rollbacks using the standard Amazon ECS deployment require updating the service’s task definition with the last known good version of the container. Then, you wait for Amazon ECS to schedule and deploy it across the cluster. If the latest version introduces a breaking change that went undiscovered during testing, this might be too slow.
With canary testing, if you discover the green environment is not operating as expected, there is no impact on the blue environment. You can route traffic back to it, minimizing impaired operation or downtime, and limiting the blast radius of impact.
This type of deployment is particularly useful for A/B testing where you want to expose a new feature to a subset of users to get their feedback before making it broadly available.
For canary style deployments, you can use a variation of the blue/green swap that involves deploying the blue and the green service to the same target group. Although this method is not as fast as the swap, it allows you to control the rate at which your containers are replaced by adjusting the task count for each service. Furthermore, it gives you the ability to roll back by adjusting the number of tasks for the blue and green services respectively. Unlike the swap approach described above, connections to your containers are drained gracefully. We plan to address canary style deployments for Amazon ECS in a future post.
Conclusion
With AWS, you can operationalize your blue/green deployments using Amazon ECS, an Application Load Balancer, and target groups. I encourage you to adapt the code published to the ecs-blue-green-deployment GitHub repo for your use cases and look forward to reading your feedback.
At GitHub, the branch deploy model is ubiquitous and it is the standard way we ship code to production, and it has been for years. We released details about how we perform branch deployments with ChatOps all the way back in 2015.
We are able to use ChatOps to perform branch deployments for most of our repositories, but there are a few situations where ChatOps simply won’t work for us. What if developers want to leverage branch deployments but don’t have a full ChatOps stack integrated with their repositories? We wanted to set out to find a way for all developers to be able to take advantage of branch deployments with ease, right from their GitHub repository, and so the branch-deploy Action was born!
How Does GitHub use this Action?
GitHub primarily uses ChatOps with Hubot to facilitate branch deployments where we can. If ChatOps isn’t an option, we use this branch-deploy Action instead. The majority of our use cases include Infrastructure as Code (IaC) repositories where we use Terraform to deploy infrastructure changes. GitHub uses this Action in many internal repositories and so does npm. There are also many other public, open source, and corporate organizations adopting this Action, as well, to help ship their code to production!
Understanding the branch deploy model
Before we dive into the branch-deploy Action, let’s first understand what the branch deploy model is and why it is so useful.
To really understand the branch deploy model, let’s first take a look at a traditional deploy → merge model. It goes like this:
Create a branch.
Add commits to your branch.
Open a pull request.
Gather feedback plus peer reviews.
Merge your branch.
A deployment starts from the main branch.
Now, let’s take a look at the branch deploy model:
Create a branch.
Add commits to your branch.
Open a pull request.
Gather feedback plus peer reviews.
Deploy your change.
Validate.
Merge your branch to the main / master branch.
The merge deploy model is inherently riskier because the main branch is never truly a stable branch. If a deployment fails, or we need to roll back, we follow the entire process again to roll back our changes. However, in the branch deploy model, the main branch is always in a “good” state and we can deploy it at any time to revert the deployment from a branch deploy. In the branch deploy model, we only merge our changes into main once the branch has been successfully deployed and validated.
Note: this is sometimes referred to as the GitHub flow.
Key concepts
Key concepts of the branch deploy model:
The main branch is always considered to be a stable and deployable branch.
All changes are deployed to production before they are merged to the main branch.
To roll back a branch deployment, you deploy the main branch.
By now you may be sold on the branch deploy methodology. How do we implement it? Introducing IssueOps with GitHub Actions!
IssueOps
The best way to define IssueOps is to compare it to something similar, ChatOps. You may be familiar with the concept, ChatOps, already; if not, here is a quick definition:
ChatOps is the process of interacting with a chat bot to execute commands directly in a chat platform. For example, with ChatOps you might do something like .ping example.org to check the status of a website.
IssueOps adopts the same mindset but through a different medium. Rather than using a chat service (Discord, Slack, etc.) to invoke the commands we use comments on a GitHub Issue or pull request. GitHub Actions is the runtime that executes our desired logic when an IssueOps command is invoked.
GitHub Actions
How does it work? This section will go into detail about how this Action works and hopefully inspire you to leverage it in your own projects. The full source code and further documentation can be found on GitHub.
Let’s walk through the process using the demo configuration of a branch-deploy Action below.
1. Create this file under .github/workflows/branch-deploy.yml in your GitHub repository:
name: "branch deploy demo"

# The workflow will execute on new comments on pull requests - example: ".deploy" as a comment
on:
  issue_comment:
    types: [created]

jobs:
  demo:
    if: ${{ github.event.issue.pull_request }} # only run on pull request comments (no need to run on issue comments)
    runs-on: ubuntu-latest
    steps:
      # Execute IssueOps branch deployment logic, hooray!
      # This will be used to "gate" all future steps below and conditionally trigger steps/deployments
      - uses: github/[email protected] # replace X.X.X with the version you want to use
        id: branch-deploy # it is critical you have an id here so you can reference the outputs of this step
        with:
          trigger: ".deploy" # the trigger phrase to look for in the comment on the pull request

      # Run your deployment logic for your project here - examples seen below

      # Checkout your project repository based on the ref provided by the branch-deploy step
      - uses: actions/[email protected]
        if: ${{ steps.branch-deploy.outputs.continue == 'true' }} # skips if the trigger phrase is not found
        with:
          ref: ${{ steps.branch-deploy.outputs.ref }} # uses the detected branch from the branch-deploy step

      # Do some fake "noop" deployment logic here
      # conditionally run a noop deployment
      - name: fake noop deploy
        if: ${{ steps.branch-deploy.outputs.continue == 'true' && steps.branch-deploy.outputs.noop == 'true' }} # only run if the trigger phrase is found and the branch-deploy step detected a noop deployment
        run: echo "I am doing a fake noop deploy"

      # Do some fake "regular" deployment logic here
      # conditionally run a regular deployment
      - name: fake regular deploy
        if: ${{ steps.branch-deploy.outputs.continue == 'true' && steps.branch-deploy.outputs.noop != 'true' }} # only run if the trigger phrase is found and the branch-deploy step detected a regular deployment
        run: echo "I am doing a fake regular deploy"
2. Trigger a noop deploy by commenting .deploy noop on a pull request.
A noop deployment is detected so this action outputs the noop variable to true. If you have the correct permissions to execute the IssueOps command, the action outputs the continue variable to true as well. The step named fake noop deploy runs, while the fake regular deploy step is skipped.
3. After your noop deploy completes, you would typically run .deploy to execute the actual deployment, fake regular deploy.
Features
The best part about the branch-deploy Action is that it is highly customizable for any deployment targets and use cases. Here are just a few of the features that this Action comes bundled with:
Detects when IssueOps commands are used on a pull request.
Configurable: choose your command syntax, environment, noop trigger, base branch, reaction, and more.
Respects your branch protection settings configured for the repository.
Comments and reacts to your IssueOps commands.
Triggers GitHub deployments for you with simple configuration.
Deploy locks to prevent multiple deployments from clashing.
Configurable environment targets.
The repository also comes with a usage guide, which can be referenced by you and your team to quickly get familiar with available IssueOps commands and how they work.
Examples
The branch-deploy Action is customizable and suited for a wide range of projects. Here are a few examples of how you can use the branch-deploy Action to deploy to different services:
If you are looking to enhance your DevOps experience, have better reliability in your deployments, or ship changes faster, then branch deployments are for you!
Hopefully, you now have a better understanding of why the branch deploy model is a great option for shipping your code to production.
By using GitHub plus Actions plus IssueOps you can leverage the branch deploy model in any repository!
asset — any business logic code in a raw (e.g. SQL) or compiled (e.g. JAR) form to be executed as part of the user defined data pipeline.
data pipeline — a set of tasks (or jobs) to be executed in a predefined order (a.k.a. DAG) for the purpose of transforming data using some business logic.
Dataflow — Netflix homegrown CLI tool for data pipeline management.
job — a.k.a task, an atomic unit of data transformation logic, a non-separable execution block in the workflow chain.
namespace — unique label, usually representing a business subject area, assigned to a workflow asset to identify it across all other assets managed by Dataflow (e.g. security).
workflow — see “data pipeline”
Intro
The problem of managing scheduled workflows and their assets is as old as the use of cron daemon in early Unix operating systems. The design of a cron job is simple, you take some system command, you pick the schedule to run it on and you are done. Example:
0 0 * * MON /home/alice/backup.sh
In the above example the system would wake up every Monday morning and execute the backup.sh script. Simple right? But what if the script does not exist in the given path, or what if it existed initially but then Alice let Bob access her home directory and he accidentally deleted it? Or what if Alice wanted to add new backup functionality and she accidentally broke existing code while updating it?
The answers to these questions is something we would like to address in this article and propose a clean solution to this problem.
Let’s define some requirements that we are interested in delivering to the Netflix data engineers or anyone who would like to schedule a workflow with some external assets in it. By external assets we simply mean some executable carrying the actual business logic of the job. It could be a JAR compiled from Scala, a Python script or module, or a simple SQL file. The important thing is that this business logic can be built in a separate repository and maintained independently from the workflow definition. Keeping all that in mind we would like to achieve the following properties for the whole workflow deployment:
Versioning: we want both the workflow definition and its assets to be versioned and we want the versions to be tied together in a clear way.
Transparency: we want to know which version of an asset is running along with every workflow instance, so if there are any issues we can easily identify which version caused the problem and to which one we could revert, if necessary.
ACID deployment: for every scheduler workflow definition change, we would like to have all the workflow assets bundled in an atomic, durable, isolated and consistent manner. This way, if necessary, all we need to know is which version of the workflow to roll back to, and the rest would be taken care of for us.
While all the above goals are our North Star, we also don’t want to negatively affect fast deployment, high availability and arbitrary life span of any deployed asset.
Previous solutions
The basic approach to pulling down arbitrary workflow resources during workflow execution has been known to mankind since the invention of cron, and with the advent of “infinite” cloud storage systems like S3, this approach has served us for many years. Its apparent flexibility and convenience can often fool us into thinking that by simply replacing the asset in the S3 location we can, without any hassle, introduce changes to our business logic. This method often proves very troublesome especially if there is more than one engineer working on the same pipeline and they are not all aware of the other folks’ “deployment process”.
The slightly improved approach is shown on the diagram below.
In Figure 1, you can see an illustration of a typical deployment pipeline manually constructed by a user for an individual project. The continuous deployment tool submits a workflow definition with pointers to assets in fixed S3 locations. These assets are then separately deployed to these fixed locations. At runtime, the assets are retrieved from the defined locations in S3 and executed in the runtime container. Despite requiring users to construct the deployment pipeline manually, often by writing their own scripts from scratch, this design works and has been successfully used by many teams for years. That being said, it does have some drawbacks that are revealed as you try to add any amount of complexity to your deployment logic. Let’s discuss a few of them.
Does not consider branch/PR deployments
In any production pipeline, you want the flexibility of having a “safe” alternative deployment logic. For example, you may want to build your Scala code and deploy it to an alternative location in S3 while pushing a sandbox version of your workflow that points to this alternative location. Something this simple gets very complicated very quickly and requires the user to consider a number of things. Where should this alternative location be in S3? Is a single location enough? How do you set up your deployment logic to know when to deploy the workflow to a test or dev environment? Answers to these questions often end up being more custom logic inside of the user’s deployment scripts.
Cannot rollback to previous workflow versions
When you deploy a workflow, you really want it to encapsulate an atomic and idempotent unit of work. Part of the reason for that is the desire for the ability to rollback to a previous workflow version and knowing that it will always behave as it did in previous runs. There can be many reasons to rollback but the typical one is when you’ve recognized a regression in a recent deployment that was not caught during testing. In the current design, reverting to a previous workflow definition in your scheduling system is not enough! You have to rebuild your assets from source and move them to your fixed S3 location that your workflow points to. To enable atomic rollbacks, you can add more custom logic to your deployment scripts to always deploy your assets to a new location and generate new pointers for your workflows to use, but that comes with higher complexity that often just doesn’t feel worth it. More commonly, teams will opt to do more testing to try and catch regressions before deploying to production and will accept the extra burden of rebuilding all of their workflow dependencies in the event of a regression.
Runtime dependency on user-managed cloud storage locations
At runtime, the container must reach out to a user-defined storage location to retrieve the assets required. This causes the user-managed storage system to be a critical runtime dependency. If we zoom out to look at an entire workflow management system, the runtime dependencies can become unwieldy if it relies on various storage systems that are arbitrarily defined by the workflow developers!
Dataflow deployment with asset management
In the attempt to deliver a simple and robust solution to the managed workflow deployments we created a command line utility called Dataflow. It is a Python based CLI + library that can be installed anywhere inside the Netflix environment. This utility can build and configure workflow definitions and their assets during testing and deployment. See below diagram:
Figure 2. Dataflow asset management system.
In Figure 2, we show a variation of the typical manually constructed deployment pipeline. Every asset deployment is released to some newly calculated UUID. The workflow definition can then identify a specific asset by its UUID. Deploying the workflow to the scheduling system produces a “Deployment Bundle”. The bundle includes all of the assets that have been referenced by the workflow definition and the entire bundle is deployed to the scheduling system. At every scheduled runtime, the scheduling system can create an instance of your workflow without having to gather runtime dependencies from external systems.
The asset management system that we’ve created for Dataflow provides a strong abstraction over this deployment design. Deploying the asset, generating the UUID, and building the deployment bundle is all handled automatically by the Dataflow build logic. The user does not need to be aware of anything that’s happening on S3, nor that S3 is being used at all! Instead, the user is given a flexible UUID referencing system that’s layered on top of our scheduling system’s workflow DSL. Later in the article we’ll cover this referencing system in some detail. But first, let’s look at an example of deploying an asset and a workflow.
Deployment of an asset
Let’s walk through an example of a workflow asset build and deployment. Let’s assume we have a repository called stranger-data with the following structure:
Before deploying the assets, and especially if we made any changes to them, we can run unit tests to make sure that we didn’t break anything. In a typical Dataflow configuration this manual testing is optional because Dataflow continuous integration tests will do that for us on any pull-request.
Notice that the test command we use above not only executes unit test suites defined in our Scala and Python sub-projects, but it also renders and statically validates all the workflow definitions in our repo, but more on that later…
Assuming all tests passed, let’s now use the Dataflow command to build and deploy a new version of the Scala and Python assets into the Dataflow asset registry.
stranger-data$ dataflow project deploy
Building Python Assets: -> ./pyspark-workflow/hello_world/setup.py... CREATED ./pyspark-workflow/hello_world/dist/hello_world-0.0.1-py3.7.egg Summary: 1 successful, 0 failed.
The above list could come in handy, for example if we needed to find and access an older version of an asset deployed from a given branch and commit hash.
Deployment of a workflow
Now let’s have a look at the build and deployment of the workflow definition which references the above assets as part of its pipeline DAG.
Let’s list the workflow definitions in our repo again:
You can see from the above snippet that the write job wants to access some version of the JAR from the scala-workflow namespace. A typical workflow definition, written in YAML, does not need any compilation before it is shipped to the Scheduler API, but Dataflow designates a special step called “rendering” to substitute all of the Dataflow variables and build the final version.
The above expression ${dataflow.jar.scala-workflow} means that the workflow will be rendered and deployed with the latest version of the scala-workflow JAR available at the time of the workflow deployment. It is possible that the JAR is built as part of the same repository in which case the new build of the JAR and a new version of the workflow may be coming from the same deployment. But the JAR may be built as part of a completely different project and in that case the testing and deployment of the new workflow version can be completely decoupled.
We showed above how one would request the latest asset version available during deployment, but with Dataflow asset management we can distinguish two more asset access patterns. An obvious next one is to specify it by all its attributes: asset type, asset namespace, git repo owner, git repo name, git branch name, commit hash and consecutive build number. There is one more extra method for a middle ground solution to pick a specific build for a given namespace and git branch, which can help during testing and development. All of this is part of the user-interface for determining how the deployment bundle will be created. See below diagram for a visual illustration.
Figure 3. A closer at the Deployment Bundle
In short, using the above variables gives the user full flexibility and allows them to pick any version of any asset in any workflow.
An example of the workflow deployment with the rendering step is shown below:
stranger-data$ dataflow project deploy
...
Building Scheduler Workflows:
 -> ./scala-workflow/main.sch.yaml... CREATED ./.workflows/scala-workflow.main.sch.rendered.yaml
 -> ./pyspark-workflow/main.sch.yaml... CREATED ./.workflows/pyspark-workflow.main.sch.rendered.yaml
Summary: 2 successful, 0 failed.
And here you can see what the workflow definition looks like before it is sent to the Scheduler API and registered as the latest version. Notice the value of the script variable of the write job. In the original code says ${dataflow.jar.scala-workflow} and in the rendered version it is translated to a specific file pointer:
The Infrastructure DSE team at Netflix is responsible for providing insights into data that can help the Netflix platform and service scale in a secure and effective way. Our team members partner with business units like Platform, OpenConnect, InfoSec and engage in enterprise level initiatives on a regular basis.
One side effect of such wide engagement is that over the years our repository evolved into a mono-repo with each module requiring a customized build, testing and deployment strategy packaged into a single Jenkins job. This setup required constant upkeep and also meant every time we had a build failure multiple people needed to spend a lot of time in communication to ensure they did not step on each other.
Last quarter we decided to split the mono-repo into separate modules and adopt Dataflow as our asset orchestration tool. Post deployment, the team relies on Dataflow for automated execution of unit tests, management and deployment of workflow related assets.
By the end of the migration process our Jenkins configuration went from:
Figure 4. Real example of a deployment script.
to:
cd /dataflow_workspace
dataflow project deploy
The simplicity of deployment enabled the team to focus on the problems they set out to solve while the branch based customization gave us the flexibility to be our most effective at solving them.
Conclusions
This new method available for Netflix data engineers makes workflow management easier, more transparent and more reliable. And while it remains fairly easy and safe to build your business logic code (in Scala, Python, etc) in the same repository as the workflow definition that invokes it, the new Dataflow versioned asset registry makes it easier yet to build that code completely independently and then reference it safely inside data pipelines in any other Netflix repository, thus enabling easy code sharing and reuse.
One more aspect of data workflow development that gets enabled by this functionality is what we call branch-driven deployment. This approach enables multiple versions of your business logic and workflows to be running at the same time in the scheduler ecosystem, and makes it easy, not only for individual users to run isolated versions of the code during development, but also to define isolated staging environments through which the code can pass before it reaches the production stage. Obviously, in order for the workflows to be safely used in that configuration they must comply with a few simple rules with regards to the parametrization of their inputs and outputs, but let’s leave this subject for another blog post.
Credits
Special thanks to Peter Volpe, Harrington Joseph and Daniel Watson for the initial design review.
In the first part of this blog post, you’ve read about the improvements made to our build and staging deployment process, and how plenty of manual tasks routinely taken by engineers have been automated with Conveyor: an in-house continuous delivery solution.
This new post begins with the introduction of the hermeticity principle for our deployments, and how it improves the confidence with promoting changes to production. Changes sent to production via Conveyor’s deployment pipelines are then described in detail.
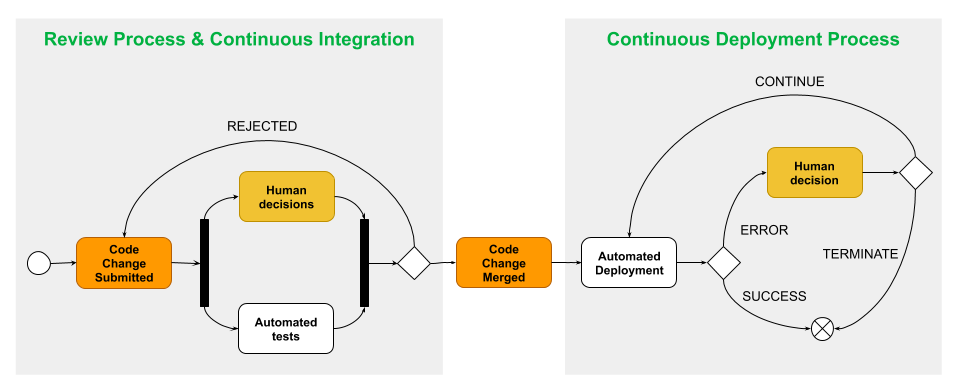
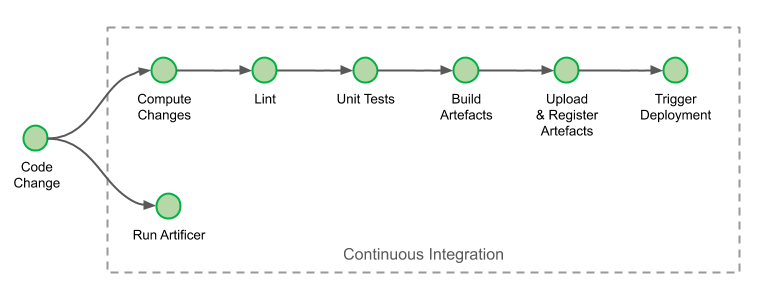
Overview of Grab delivery process
Finally, looking back at the engineering efficiency improvements around velocity and reliability over the last 2 years, we answer the big question – was the investment on a custom continuous delivery solution like Conveyor the right decision for Grab?
Improving Confidence in our Production Deployments with Hermeticity
The term deployment hermeticity is borrowed from build systems. A build system is called hermetic if builds always produce the same artefacts regardless of changes in the environment they run on. Similarly, we call our deployments hermetic if they always result in the same deployed artefacts regardless of the environment’s change or the number of times they are executed.
The behaviour of a service is rarely controlled by a single variable. The application that makes up your service is an important driver of its behaviour, but its configuration is an important contributor, for example. The behaviour for traditional microservices at Grab is dictated mainly by 3 versioned artefacts: application code, static and dynamic configuration.
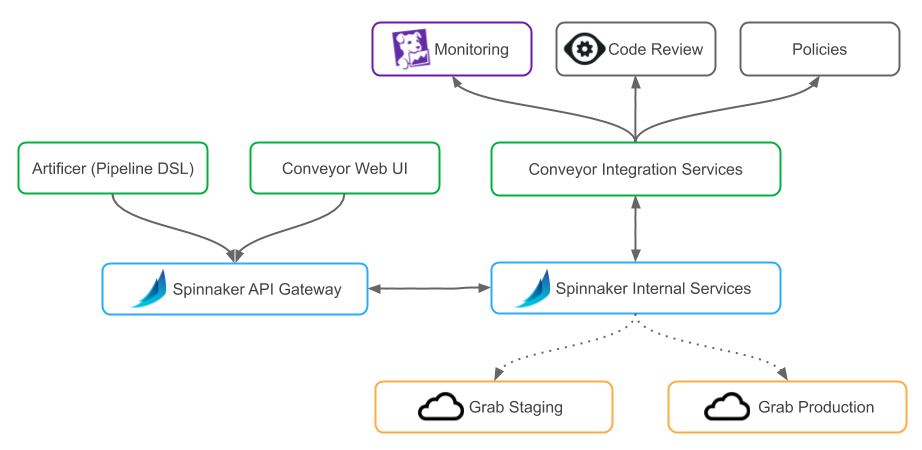
Conveyor has been integrated with the systems that operate changes in each of these parameters. By tracking all 3 parameters at every deployment, Conveyor can reproducibly deploy microservices with similar behaviour: its deployments are hermetic.
Building upon this property, Conveyor can ensure that all deployments made to production have been tested before with the same combination of parameters. This is valuable to us:
An outcome of staging deployments for a specific set of parameters is a good predictor of outcomes in production deployments for the same set of parameters and thus it makes testing in staging more relevant.
Rollbacks are hermetic; we never rollback to a combination of parameters that has not been used previously.
In the past, incidents had resulted from an application rollback not compatible with the current dynamic configuration version; this was aggravating since rollbacks are expected to be a safe recovery mechanism. The introduction of hermetic deployments has largely eliminated this category of problems.
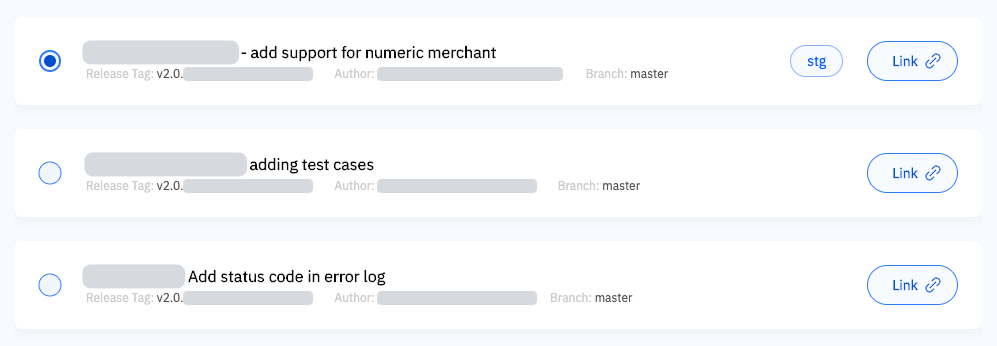
Hermeticity is maintained by registering the deployment parameters as artefacts after each successfully completed pipeline. Users must then select one of the registered deployment metadata to promote to production.
At this point, you might be wondering: why not use a single pipeline that includes both staging and production deployments? This was indeed how it started, with a single pipeline spanning multiple environments. However, engineers soon complained about it.
The most obvious reason for the complaint was that less than 20% of changes deployed in staging will make their way to production. This meant that engineers would have toil associated with each completed staging deployment since the pipeline must be manually cancelled rather than continued to production.
The other reason is that this multi-environment pipeline approach reduced flexibility when promoting changes to production. There are different ways to apply changes to a cluster. For example, lengthy pipelines that refresh instances can be used to deploy any combination of changes, while there are quicker pipelines restricted to dynamic configuration changes (such as feature flags rollouts). Regardless of the order in which the changes are made and how they are applied, Conveyor tracks the change.
Eventually, engineers promote a deployment artefact to production. However they do not need to apply changes in the same sequence with which were applied to staging. Furthermore, to prevent erroneous actions, Conveyor presents only changes that can be applied with the requested pipeline (and sometimes, no changes are available). Not being forced into a specific method of deploying changes is one of added benefits of hermetic deployments.
Returning to Our Journey Towards Engineering Efficiency
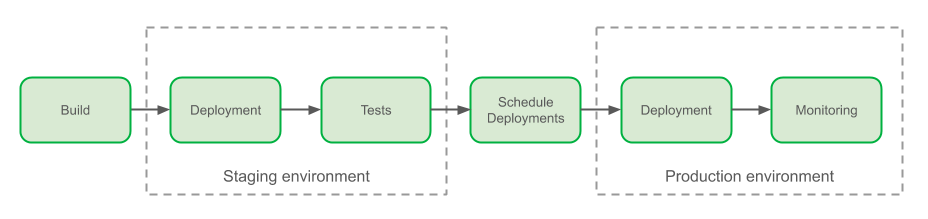
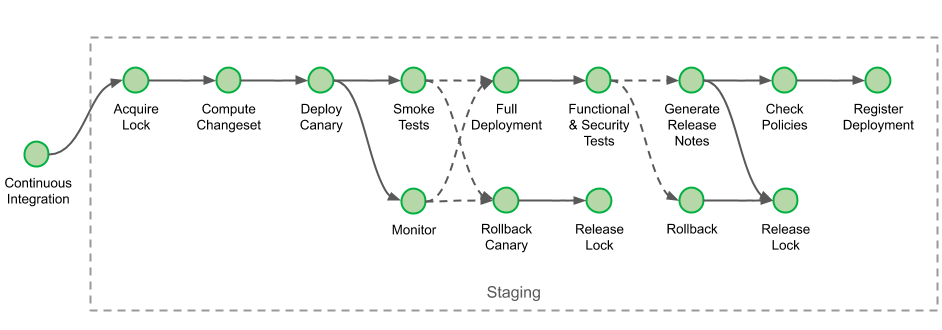
If you can recall, the first part of this blog post series ended with a description of staging deployment. Our deployment to production starts with a verification that we uphold our hermeticity principle, as explained above.
Our production deployment pipelines can run for several hours for large clusters with rolling releases (few run for days), so we start by acquiring locks to ensure there are no concurrent deployments for any given cluster.
Before making any changes to the environment, we automatically generate release notes, giving engineers a chance to abort if the wrong set of changes are sent to production.
The pipeline next waits for a deployment slot. Early on, engineers adopted deployment windows that coincide with office hours, such that if anything goes wrong, there is always someone on hand to help. Prior to the introduction of Conveyor, however, engineers would manually ask a Slack bot for approval. This interaction is now automated, and the only remaining action left is for the engineer to approve that the deployment can proceed via a single click, in line with our hands-off deployment principle.
When the canary is in production, Conveyor automates monitoring it. This process is similar to the one already discussed in the first part of this blog post: Engineers can configure a set of alerts that Conveyor will keep track of. As soon as any one of the alerts is triggered, Conveyor automatically rolls back the service.
If no alert is raised for the duration of the monitoring period, Conveyor waits again for a deployment slot. It then publishes the release notes for that deployment and completes the deployments for the cluster. After the lock is released and the deployment registered, the pipeline finally comes to its successful completion.
Benefits of Our Journey Towards Engineering Efficiency
All these improvements made over the last 2 years have reduced the effort spent by engineers on deployment while also reducing the failure rate of our deployments.
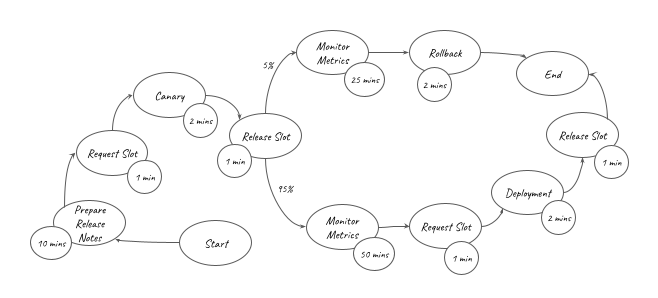
If you are an engineer working on DevOps in your organisation, you know how hard it can be to measure the impact you made on your organisation. To estimate the time saved by our pipelines, we can model the activities that were previously done manually with a rudimentary weighted graph. In this graph, each edge carries a probability of the activity being performed (100% when unspecified), while each vertex carries the time taken for that activity.
Focusing on our regular staging deployments only, such a graph would look like this:
The overall amount of effort automated by the staging pipelines () is represented in the graph above. It can be converted into the equation below:
This equation shows that for each staging deployment, around 16 minutes of work have been saved. Similarly, for regular production deployments, we find that 67 minutes of work were saved for each deployment:
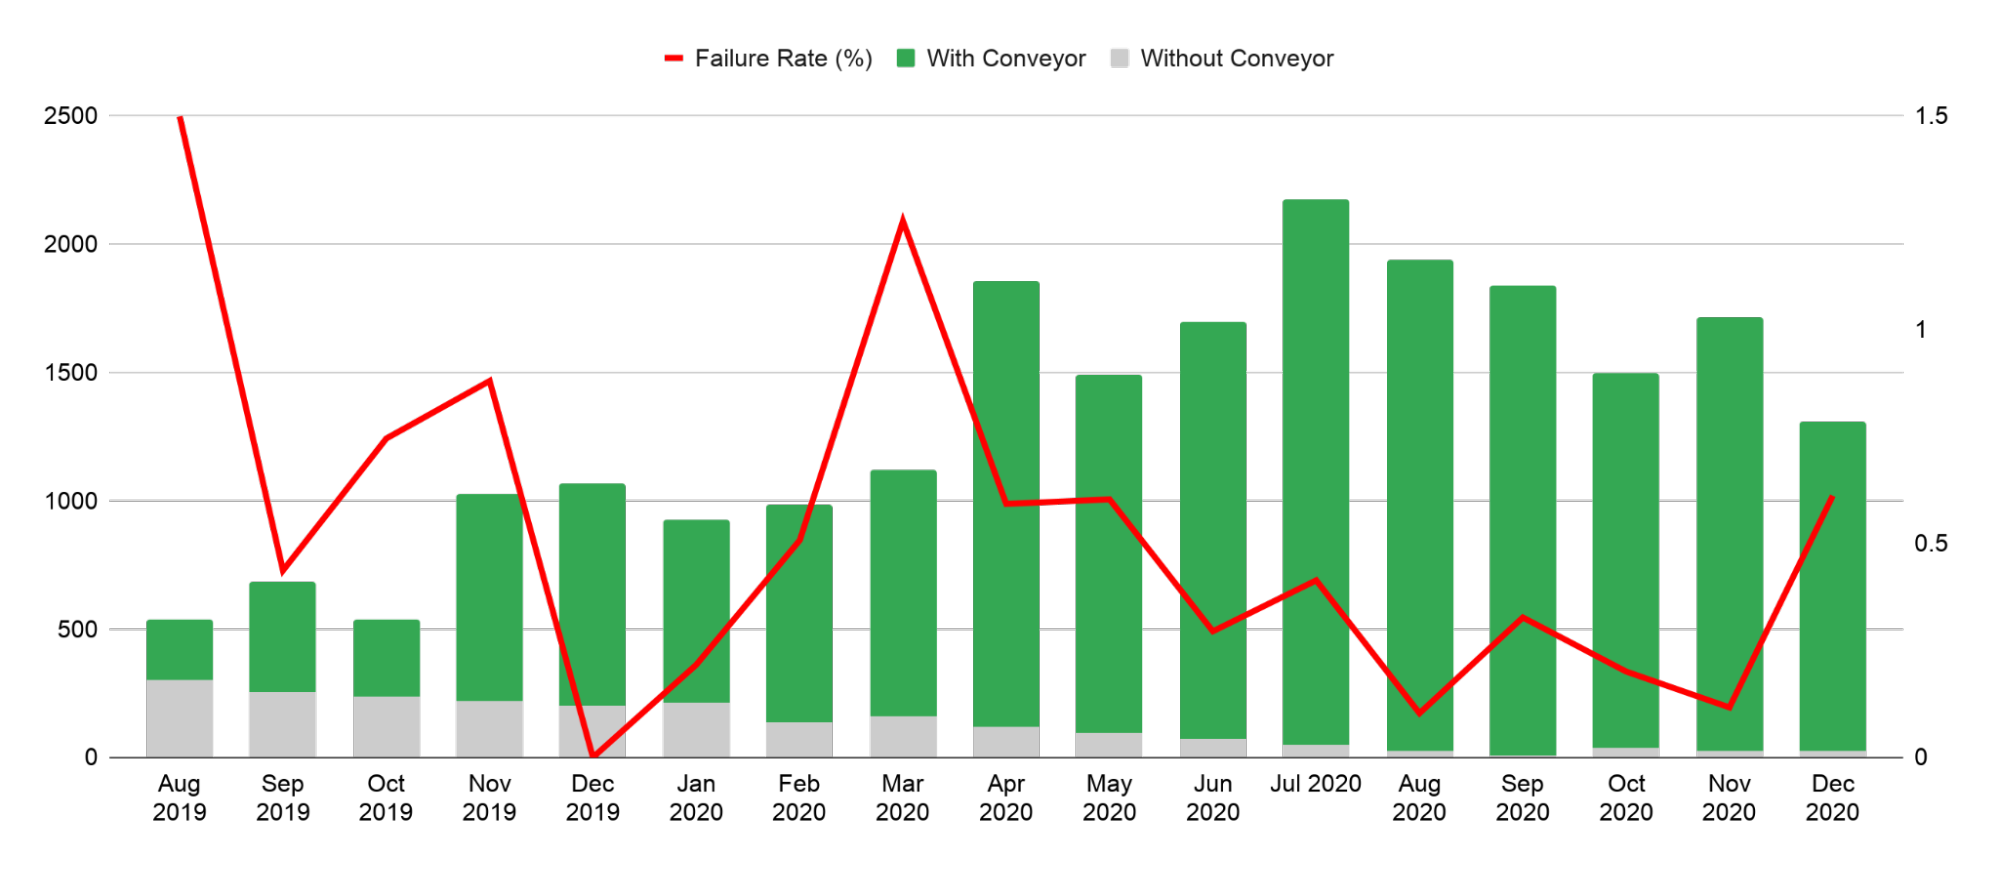
Moreover, efficiency was not the only benefit brought by the use of deployment pipelines for our traditional microservices. Surprisingly perhaps, the rate of failures related to production changes is progressively reducing while the amount of production changes that were made with Conveyor increased across the organisation (starting at 1.5% of failures per deployments, and finishing at 0.3% on average over the last 3 months for the period of data collected):
Keep Calm and Automate
Since the first draft for this post was written, we’ve made many more improvements to our pipelines. We’ve begun automating Database Migrations; we’ve extended our set of hermetic variables to Amazon Machine Image (AMI) updates; and we’re working towards supporting container deployments.
Through automation, all of Conveyor’s deployment pipelines have contributed to save more than 5,000 man-days of efforts in 2020 alone, across all supported teams. That’s around 20 man-years worth of effort, which is around 3 times the capacity of the team working on the project! Investments in our automation pipelines have more than paid for themselves, and the gains go up every year as more workflows are automated and more teams are onboarded.
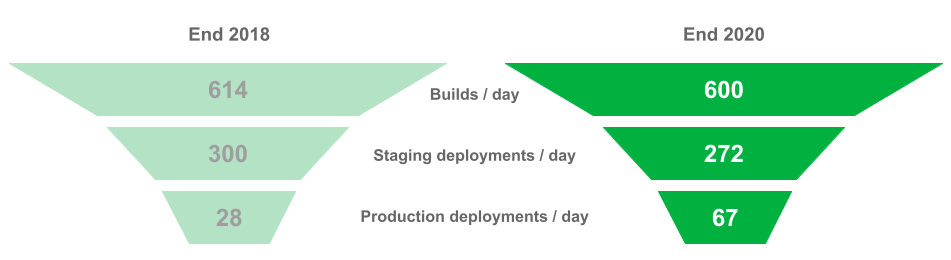
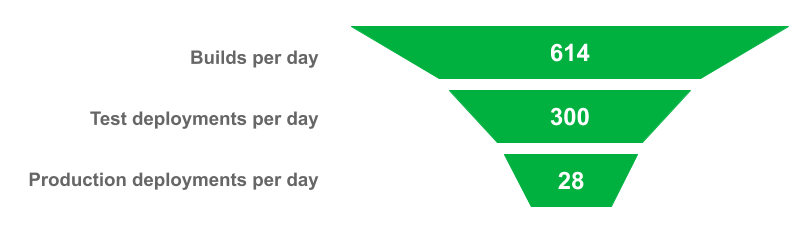
If Conveyor has saved efforts for engineering teams, has it then helped to improve velocity? I had opened the first part of this blog post with figures on the deployment funnel for microservice teams at Grab, towards the end of 2018. So where do the figures stand today for these teams?
In the span of 2 years, the average number of build and staging deployment performed each day has not varied much. However, in the last 3 months of 2020, engineers have sent twice more changes to production than they did for the same period in 2018.
Perhaps the biggest recognition received by the team working on the project, was from Grab’s engineers themselves. In the 2020 internal NPS survey for engineering experience at Grab, Conveyor received the highest score of any tools (built in-house or not).
All these improvements in efficiency for our engineers would never have been possible without the hard work of all team members involved in the project, past and present: Tanun Chalermsinsuwan, Aufar Gilbran, Deepak Ramakrishnaiah, Repon Kumar Roy (Kowshik), Su Han, Voislav Dimitrijevikj, Stanley Goh, Htet Aung Shine, Evan Sebastian, Qijia Wang, Oscar Ng, Jacob Sunny, Subhodip Mandal and many others who have contributed and collaborated with them.
Join Us
Grab is the leading superapp platform in Southeast Asia, providing everyday services that matter to consumers. More than just a ride-hailing and food delivery app, Grab offers a wide range of on-demand services in the region, including mobility, food, package and grocery delivery services, mobile payments, and financial services across 428 cities in eight countries.
Powered by technology and driven by heart, our mission is to drive Southeast Asia forward by creating economic empowerment for everyone. If this mission speaks to you, join our team today!
This is our second post on cloud deployment with containers. Looking for more? Join our upcoming GitHub Actions webcast with Sarah, Solutions Engineer Pavan Ravipati, and Senior Product Manager Kayla Ngan on October 22.
In the past few years, businesses have moved towards cloud-native operating models to help streamline operations and move away from costly infrastructure. When running applications in dynamic environments with Docker, Kubernetes, and other tooling, a container becomes the tool of choice as a consistent, atomic unit of packaging, deployment, and application management. This sounds straightforward: build a new application, package it into containers, and scale elastically across the infrastructure of your choice. Then you can automatically update with new images as needed and focus more on solving problems for your end users and customers.
However, organizations don’t work in vacuums. They’re part of a larger ecosystem of customers, partners, and open source communities, with unique cultures, existing processes, applications, and tooling investments in place. This adds new challenges and complexity for adopting cloud native tools such as containers, Kubernetes, and other container schedulers.
Challenges for adopting container-based strategies in organizations
At GitHub, we’re fortunate to work with many customers on their container and DevOps strategy. When it comes to adopting containers, there are a few consistent challenges we see across organizations.
Containerizing and maintaining applications: Most organizations have existing applications and need to make the decision about whether to keep them as-is, or to place them in containers for an easier transition to the cloud. Even then, teams need to determine whether a single container for the application is appropriate (in a lift-and-shift motion to the cloud), or if more extensive work is needed to break it down into multiple services, delivered as a set of containers.
Efficiently configuring and managing permissions: Adopting containers often translates to better collaboration for everyone in your organization. DevOps is now more than just core developers and IT operators. It includes release and infosec engineers, data scientists, QA, project managers, and other roles. But collaborating across multiple teams introduces new needs for configuring and managing permissions for code, along with the automation to support it.
Standardizing best practices across the organization: Containers help teams scale and integrate quickly, but may also require updating your CI/CD practices to match. You have to validate they work well for existing applications, while incorporating the correct user and package permissions and policies.. The best practices you set have to be flexible for others too. Individual teams—who are transitioning to new ways of working—need to be able to optimize for their own goals.
Connecting teams and cloud-native tools with GitHub
Despite the few challenges of adopting containers and leveraging Kubernetes, more and more organizations continue to use them. Stepping over those hurdles allows enterprises to automate and streamline their operations, here with a few examples of how enterprises make it work successfully with support from package managers and CI/CD tools. At GitHub, we’ve introduced container support in GitHub Packages, CI/CD through GitHub Actions, and partnered within the ecosystem to simplify cloud-native workflows. Finding the right container tools should mean less work, not more—easily integrating alongside other tools, projects, and processes your organization already uses.
See container best practices in action
Want to simplify container deployments in your organization? Join me, Solutions Engineer Pavan Ravipati, and Senior Product Manager Kayla Ngan on October 22 to learn more about successfully adopting containers. We’ll walk through how to use them in the real world and demo best practices for deploying an application to Azure with GitHub Container Registry.
Many organizations have been shifting to DevOps practices, which is the combination of cultural philosophies, practices, and tools that increases your organization’s ability to deliver applications and services at high velocity; for example, evolving and improving products at a faster pace than organizations using traditional software development and infrastructure management processes.
An integral part of DevOps is adopting the culture of continuous integration and continuous delivery/deployment (CI/CD), where a commit or change to code passes through various automated stage gates, all the way from building and testing to deploying applications, from development to production environments.
This post uses the AWS suite of CI/CD services to compile, build, and install a version-controlled Java application onto a set of Amazon Elastic Compute Cloud (Amazon EC2) Linux instances via a fully automated and secure pipeline. The goal is to promote a code commit or change to pass through various automated stage gates all the way from development to production environments, across AWS accounts.
AWS services
This solution uses the following AWS services:
AWS CodeCommit – A fully-managed source control service that hosts secure Git-based repositories. CodeCommit makes it easy for teams to collaborate on code in a secure and highly scalable ecosystem. This solution uses CodeCommit to create a repository to store the application and deployment codes.
AWS CodeBuild – A fully managed continuous integration service that compiles source code, runs tests, and produces software packages that are ready to deploy, on a dynamically created build server. This solution uses CodeBuild to build and test the code, which we deploy later.
AWS CodeDeploy – A fully managed deployment service that automates software deployments to a variety of compute services such as Amazon EC2, AWS Fargate, AWS Lambda, and your on-premises servers. This solution uses CodeDeploy to deploy the code or application onto a set of EC2 instances running CodeDeploy agents.
AWS CodePipeline – A fully managed continuous delivery service that helps you automate your release pipelines for fast and reliable application and infrastructure updates. This solution uses CodePipeline to create an end-to-end pipeline that fetches the application code from CodeCommit, builds and tests using CodeBuild, and finally deploys using CodeDeploy.
AWS CloudWatch Events – An AWS CloudWatch Events rule is created to trigger the CodePipeline on a Git commit to the CodeCommit repository.
Amazon Simple Storage Service (Amazon S3) – An object storage service that offers industry-leading scalability, data availability, security, and performance. This solution uses an S3 bucket to store the build and deployment artifacts created during the pipeline run.
AWS Key Management Service (AWS KMS) – AWS KMS makes it easy for you to create and manage cryptographic keys and control their use across a wide range of AWS services and in your applications. This solution uses AWS KMS to make sure that the build and deployment artifacts stored on the S3 bucket are encrypted at rest.
Overview of solution
This solution uses two separate AWS accounts: a devaccount (111111111111) and a prod account (222222222222) in Region us-east-1.
We use the dev account to deploy and set up the CI/CD pipeline, along with the source code repo. It also builds and tests the code locally and performs a test deploy.
The prod account is any other account where the application is required to be deployed from the pipeline in the dev account.
In summary, the solution has the following workflow:
A change or commit to the code in the CodeCommit application repository triggers CodePipeline with the help of a CloudWatch event.
The pipeline downloads the code from the CodeCommit repository, initiates the Build and Test action using CodeBuild, and securely saves the built artifact on the S3 bucket.
If the preceding step is successful, the pipeline triggers the Deploy in Dev action using CodeDeploy and deploys the app in dev account.
If successful, the pipeline triggers the Deploy in Prod action using CodeDeploy and deploys the app in the prod account.
The following diagram illustrates the workflow:
Failsafe deployments
This example of CodeDeploy uses the IN_PLACE type of deployment. However, to minimize the downtime, CodeDeploy inherently supports multiple deployment strategies. This example makes use of following features: rolling deployments and automatic rollback.
CodeDeploy provides the following three predefined deployment configurations, to minimize the impact during application upgrades:
CodeDeployDefault.OneAtATime – Deploys the application revision to only one instance at a time
CodeDeployDefault.HalfAtATime – Deploys to up to half of the instances at a time (with fractions rounded down)
CodeDeployDefault.AllAtOnce – Attempts to deploy an application revision to as many instances as possible at once
For OneAtATime and HalfAtATime, CodeDeploy monitors and evaluates instance health during the deployment and only proceeds to the next instance or next half if the previous deployment is healthy. For more information, see Working with deployment configurations in CodeDeploy.
You can also configure a deployment group or deployment to automatically roll back when a deployment fails or when a monitoring threshold you specify is met. In this case, the last known good version of an application revision is automatically redeployed after a failure with the new application version.
How CodePipeline in the dev account deploys apps in the prod account
In this post, the deployment pipeline using CodePipeline is set up in the dev account, but it has permissions to deploy the application in the prod account. We create a special cross-account role in the prod account, which has the following:
Permission to use fetch artifacts (app) rom Amazon S3 and deploy it locally in the account using CodeDeploy
Trust with the dev account where the pipeline runs
CodePipeline in the dev account assumes this cross-account role in the prod account to deploy the app.
Do I need multiple accounts? If you answer “yes” to any of the following questions you should consider creating more AWS accounts:
Does your business require administrative isolation between workloads? Administrative isolation by account is the most straightforward way to grant independent administrative groups different levels of administrative control over AWS resources based on workload, development lifecycle, business unit (BU), or data sensitivity.
Does your business require limited visibility and discoverability of workloads? Accounts provide a natural boundary for visibility and discoverability. Workloads cannot be accessed or viewed unless an administrator of the account enables access to users managed in another account.
Does your business require isolation to minimize blast radius? Separate accounts help define boundaries and provide natural blast-radius isolation to limit the impact of a critical event such as a security breach, an unavailable AWS Region or Availability Zone, account suspensions, and so on.
Does your business require a particular workload to operate within AWS service limits without impacting the limits of another workload? You can use AWS account service limits to impose restrictions on a business unit, development team, or project. For example, if you create an AWS account for a project group, you can limit the number of Amazon Elastic Compute Cloud (Amazon EC2) or high performance computing (HPC) instances that can be launched by the account.
Does your business require strong isolation of recovery or auditing data? If regulatory requirements require you to control access and visibility to auditing data, you can isolate the data in an account separate from the one where you run your workloads (for example, by writing AWS CloudTrail logs to a different account).
Prerequisites
For this walkthrough, you should complete the following prerequisites:
Have access to at least two AWS accounts. For this post, the dev and prod accounts are in us-east-1. You can search and replace the Region and account IDs in all the steps and sample AWS Identity and Access Management (IAM) policies in this post.
Ensure you have EC2 Linux instances with the CodeDeploy agent installed in all the accounts or VPCs where the sample Java application is to be installed (dev and prod accounts).
CodeDeploy uses EC2 instance tags to identify instances to use to deploy the application, so it’s important to set tags appropriately. For this post, we use the tag name Application with the value MyWebApp to identify instances where the sample app is installed.
Make sure to use an EC2 instance profile (AWS Service Role for EC2 instance) with permissions to read the S3 bucket containing artifacts built by CodeBuild. Refer to the IAM role cicd_ec2_instance_profile in the table Roles-1 below for the set of permissions required. You must update this role later with the actual KMS key and S3 bucket name created as part of the deployment process.
This deploys an EC2 instance with AWS CodeDeploy agent.
Inputs required:
AMI : Enter name of the Linux AMI in your region. (This template has been tested with latest Amazon Linux 2 AMI)
Ec2SshKeyPairName: Name of an existing SSH KeyPair
Ec2IamInstanceProfile: Name of an existing EC2 instance profile. Note: Use the permissions in the template cicd_ec2_instance_profile_policy.json to create the policy for this EC2 Instance Profile role. You must update this role later with the actual KMS key and S3 bucket name created as part of the deployment process.
Update the EC2 instance Tags per your need.
Ensure required IAM permissions. Have an IAM user with an IAM Group or Role that has the following access levels or permissions:
AWS Service / Components
Access Level
Accounts
Comments
AWS CodeCommit
Full (admin)
Dev
Use AWS managed policy AWSCodeCommitFullAccess.
AWS CodePipeline
Full (admin)
Dev
Use AWS managed policy AWSCodePipelineFullAccess.
AWS CodeBuild
Full (admin)
Dev
Use AWS managed policy AWSCodeBuildAdminAccess.
AWS CodeDeploy
Full (admin)
All
Use AWS managed policy
AWSCodeDeployFullAccess.
Create S3 bucket and bucket policies
Full (admin)
Dev
IAM policies can be restricted to specific bucket.
Create KMS key and policies
Full (admin)
Dev
IAM policies can be restricted to specific KMS key.
AWS CloudFormation
Full (admin)
Dev
Use AWS managed policy
AWSCloudFormationFullAccess.
Create and pass IAM roles
Full (admin)
All
Ability to create IAM roles and policies can be restricted to specific IAM roles or actions. Also, an admin team with IAM privileges could create all the required roles. Refer to the IAM table Roles-1 below.
AWS Management Console and AWS CLI
As per IAM User permissions
All
To access suite of Code services.
Create Git credentials for CodeCommit in the pipeline account (dev account). AWS allows you to either use Git credentials or associate SSH public keys with your IAM user. For this post, use Git credentials associated with your IAM user (created in the previous step). For instructions on creating a Git user, see Create Git credentials for HTTPS connections to CodeCommit. Download and save the Git credentials to use later for deploying the application.
Create all AWS IAM roles as per the following tables (Roles-1). Make sure to update the following references in all the given IAM roles and policies:
Replace the sample dev account (111111111111) and prod account (222222222222) with actual account IDs
Replace the S3 bucket mywebapp-codepipeline-bucket-us-east-1-111111111111 with your preferred bucket name.
Replace the KMS key ID key/82215457-e360-47fc-87dc-a04681c91ce1 with your KMS key ID.
Table: Roles-1
Service
IAM Role Type
Account
IAM Role Name (used for this post)
IAM Role Policy (required for this post)
IAM Role Permissions
AWS CodePipeline
Service role
Dev (111111111111)
cicd_codepipeline_service_role
Select Another AWS Account and use this account as the account ID to create the role.
Later update the trust as follows: “Principal”: {“Service”: “codepipeline.amazonaws.com”},
This role is created in the prod account and has permissions to use CodeDeploy and fetch from Amazon S3. The role is assumed by CodePipeline from the dev account to deploy the app in the prod account. Make sure to set up trust with the dev account for this IAM role on the Trust relationships tab.
AWS CodeBuild
Service role
Dev (111111111111)
cicd_codebuild_service_role
Choose CodeBuild as the use case to create the role.
This is set as the EC2 instance profile for the EC2 instances where the app is deployed. It has appropriate permissions to fetch artefacts from Amazon S3 and decrypt contents using the KMS key.
You must update this role later with the actual KMS key and S3 bucket name created as part of the deployment process.
Setting up the prod account
To set up the prod account, complete the following steps:
This deploys the CodeDeploy app and deployment group.
Make sure that you already have a set of EC2 Linux instances with the CodeDeploy agent installed in all the accounts where the sample Java application is to be installed (dev and prod accounts). If not, refer back to the Prerequisites section.
Update the existing EC2 IAM instance profile (cicd_ec2_instance_profile):
Replace the S3 bucket name mywebapp-codepipeline-bucket-us-east-1-111111111111 with your S3 bucket name (the one used for the CodePipelineArtifactS3Bucket variable when you launched the CloudFormation template in the dev account).
Replace the KMS key ARN arn:aws:kms:us-east-1:111111111111:key/82215457-e360-47fc-87dc-a04681c91ce1 with your KMS key ARN (the one created as part of the CloudFormation template launch in the dev account).
Setting up the dev account
To set up your dev account, complete the following steps:
Download and launch the CloudFormation template from the GitHub repo: cicd-aws-code-suite-dev.json The stack deploys the following services in the dev account:
CodeCommit repository
CodePipeline
CodeBuild environment
CodeDeploy app and deployment group
CloudWatch event rule
KMS key (used to encrypt the S3 bucket)
S3 bucket and bucket policy
Use following values as inputs to the CloudFormation template. You should have created all the existing resources and roles beforehand as part of the prerequisites.
Key
Example Value
Comments
CodeCommitWebAppRepo
MyWebAppRepo
Name of the new CodeCommit repository for your web app.
CodeCommitMainBranchName
master
Main branch name on your CodeCommit repository. Default is master (which is pushed to the prod environment).
ARN of an existing IAM service role to be associated with CodeBuild to build web app code.
CodeDeployApp
MyCDWebApp
Name of the new CodeDeploy app to be created for your web app. We assume that the CodeDeploy app name is the same in all accounts where deployment needs to occur (in this case, the prod account).
CodeDeployGroupDev
MyCICD-Deployment-Group-Dev
Name of the new CodeDeploy deployment group to be created in the dev account.
CodeDeployGroupProd
MyCICD-Deployment-Group-Prod
Name of the existing CodeDeploy deployment group in prod account. Created as part of the prod account setup.
CodeDeployGroupTagKey
Application
Name of the tag key that CodeDeploy uses to identify the existing EC2 fleet for the deployment group to use.
CodeDeployGroupTagValue
MyWebApp
Value of the tag that CodeDeploy uses to identify the existing EC2 fleet for the deployment group to use.
ARN of an existing IAM role in the cross-account for CodePipeline to assume to deploy the app.
It should take 5–10 minutes for the CloudFormation stack to complete. When the stack is complete, you can see that CodePipeline has built the pipeline (MyWebAppPipeline) with the CodeCommit repository and CodeBuild environment, along with actions for CodeDeploy in local (dev) and cross-account (prod). CodePipeline should be in a failed state because your CodeCommit repository is empty initially.
Update the existing Amazon EC2 IAM instance profile (cicd_ec2_instance_profile):
Replace the S3 bucket name mywebapp-codepipeline-bucket-us-east-1-111111111111 with your S3 bucket name (the one used for the CodePipelineArtifactS3Bucket parameter when launching the CloudFormation template in the dev account).
Replace the KMS key ARN arn:aws:kms:us-east-1:111111111111:key/82215457-e360-47fc-87dc-a04681c91ce1 with your KMS key ARN (the one created as part of the CloudFormation template launch in the dev account).
Deploying the application
You’re now ready to deploy the application via your desktop or PC.
Assuming you have the required HTTPS Git credentials for CodeCommit as part of the prerequisites, clone the CodeCommit repo that was created earlier as part of the dev account setup. Obtain the name of the CodeCommit repo to clone, from the CodeCommit console. Enter the Git user name and password when prompted. For example:
$ git clone https://git-codecommit.us-east-1.amazonaws.com/v1/repos/MyWebAppRepo my-web-app-repo
Cloning into 'my-web-app-repo'...
Username for 'https://git-codecommit.us-east-1.amazonaws.com/v1/repos/MyWebAppRepo': xxxx
Password for 'https://[email protected]/v1/repos/MyWebAppRepo': xxxx
Download the MyWebAppRepo.zip file containing a sample Java application, CodeBuild configuration to build the app, and CodeDeploy config file to deploy the app.
Copy and unzip the file into the my-web-app-repo Git repository folder created earlier.
Assuming this is the sample app to be deployed, commit these changes to the Git repo. For example:
$ cd my-web-app-repo
$ git add -A
$ git commit -m "initial commit"
$ git push
After you commit the code, the CodePipeline will be triggered and all the stages and your application should be built, tested, and deployed all the way to the production environment!
The following screenshot shows the entire pipeline and its latest run:
Troubleshooting
To troubleshoot any service-related issues, see the following:
To avoid incurring future charges or to remove any unwanted resources, delete the following:
EC2 instance used to deploy the application
CloudFormation template to remove all AWS resources created through this post
IAM users or roles
Conclusion
Using this solution, you can easily set up and manage an entire CI/CD pipeline in AWS accounts using the native AWS suite of CI/CD services, where a commit or change to code passes through various automated stage gates all the way from building and testing to deploying applications, from development to production environments.
FAQs
In this section, we answer some frequently asked questions:
Can I expand this deployment to more than two accounts?
Yes. You can deploy a pipeline in a tooling account and use dev, non-prod, and prod accounts to deploy code on EC2 instances via CodeDeploy. Changes are required to the templates and policies accordingly.
Can I ensure the application isn’t automatically deployed in the prod account via CodePipeline and needs manual approval?
Yes. Minor changes are required to the CodePipeline section of the CloudFormation template for the dev environment to add an Approval stage and action. Refer to the following Solution Variations section for more information.
Can I use a CodeDeploy group with an Auto Scaling group?
Yes. Minor changes required to the CodeDeploy group creation process. Refer to the following Solution Variations section for more information.
Nitin is currently a Sr. Cloud Architect in the AWS Managed Services(AMS). He has many years of experience with DevOps-related tools and technologies. Speak to your AWS Managed Services representative to deploy this solution in AMS!
This blog post is a two-part presentation of the effort that went into improving the continuous delivery processes for backend services at Grab in the past two years. In the first part, we take stock of where we started two years ago and describe the software and tools we created while introducing some of the integrations we’ve done to automate our software delivery in our staging environment.
Continuous Delivery is the principle of delivering software often, every day.
As a backend engineer at Grab, nothing matters more than the ability to innovate quickly and safely. Around the end of 2018, Grab’s transportation and deliveries backend architecture consisted of roughly 270 services (the majority being microservices). The deployment process was lengthy, required careful inputs and clear communication. The care needed to push changes in production and the risk associated with manual operations led to the introduction of a Slack bot to coordinate deployments. The bot ensures that deployments occur only during off-peak and within work hours:
Overview of the Grab Delivery Process
Once the build was completed, engineers who desired to deploy their software to the Staging environment would copy release versions from the build logs, and paste them in a Jenkins job’s parameter. Tests needed to be manually triggered from another dedicated Jenkins job.
Prior to production deployments, engineers would generate their release notes via a script and update them manually in a wiki document. Deployments would be scheduled through interactions with a Slack bot that controls release notes and deployment windows. Production deployments were made once again by pasting the correct parameters into two dedicated Jenkins jobs, one for the canary (a.k.a. one-box) deployment and the other for the full deployment, spread one hour apart. During the monitoring phase, engineers would continuously observe metrics reported on our dashboards.
In spite of the fragmented process and risky manual operations impacting our velocity and stability, around 614 builds were running each business day and changes were deployed on our staging environment at an average rate of 300 new code releases per business day, while production changes averaged a rate of 28 new code releases per business day.
Our Deployment Funnel, Towards the End of 2018
These figures meant that, on average, it took 10 business days between each service update in production, and only 10% of the staging deployments were eventually promoted to production.
Automating Continuous Deployments at Grab
With an increased focus on Engineering efficiency, in 2018 we started an internal initiative to address frictions in deployments that became known as Conveyor. To build Conveyor with a small team of engineers, we had to rely on an already mature platform which exhibited properties that are desirable to us to achieve our mission.
Hands-off deployments
Deployments should be an afterthought. Engineers should be as removed from the process as possible, and whenever possible, decisions should be taken early, during the code review process. The machine will do the heavy lifting, and only when it can’t decide for itself, should the engineer be involved. Notifications can be leveraged to ensure that engineers are only informed when something goes wrong and a human decision is required.
Hands-off Deployment Principle
Confidence in Deployments
Grab’s focus on gathering internal Engineering NPS feedback helped us collect valuable metrics. One of the metrics we cared about was our engineers’ confidence in their production deployments. A team’s entire deployment process to production could last for more than a day and may extend up to a week for teams with large infrastructures running critical services. The possibility of losing progress in deployments when individual steps may last for hours is detrimental to the improvement of Engineering efficiency in the organisation. The deployment automation platform is the bedrock of that confidence. If the platform itself fails regularly or does provide a path of upgrade that is transparent to end-users, any features built on top of it would suffer from these downtimes and ultimately erode confidence in deployments.
Tailored To Most But Extensible For The Few
Our backend engineering teams are working on diverse stacks, and so are their deployment processes. Right from the start, we wanted our product to benefit the largest population of engineers that had adopted the same process, so as to maximize returns on our investments. To ease adoption, we decided to tailor a deployment pipeline such that:
It would model the exact sequence of manual processes followed by this population of engineers.
Switching to use that pipeline should require as little work as possible by service teams.
However, in cases where this model would not fit a team’s specific process, our deployment platform should be open and extensible and support new customizations even when they are not originally supported by the product’s ecosystem.
Cloud-Agnosticity
While we were going to target a specific process and team, to ensure that our solution would stand the test of time, we needed to ensure that our solution would support the variety of environments currently used in production. This variety was also likely to increase, and we wanted a platform that would mature together with the rest of our ecosystem.
Overview Of Conveyor
Setting Sail With Spinnaker
Conveyor is based on Spinnaker, an open-source, multi-cloud continuous delivery platform. We’ve chosen Spinnaker over other platforms because it is a mature deployment platform with no single point of failure, supports complex workflows (referred to as pipelines in Spinnaker), and already supports a large array of cloud providers. Since Spinnaker is open-source and extensible, it allowed us to add the features we needed for the specificity of our ecosystem.
To further ease adoption within our organization, we built a tailored user interface and created our own domain-specific language (DSL) to manage its pipelines as code.
Outline of Conveyor’s Architecture
Onboarding To A Simpler Interface
Spinnaker comes with its own interface, it has all the features an engineer would want from an advanced continuous delivery system. However, Spinnaker interface is vastly different from Jenkins and makes for a steep learning curve.
To reduce our barrier to adoption, we decided early on to create a simple interface for our users. In this interface, deployment pipelines take the center stage of our application. Pipelines are objects managed by Spinnaker, they model the different steps in the workflow of each deployment. Each pipeline is made up of stages that can be assembled like lego-bricks to form the final pipeline. An instance of a pipeline is called an execution.
Conveyor Dashboard
With this interface, each engineer can focus on what matters to them immediately: the pipeline they have started, or those started by other teammates working on the same services as they are. Conveyor also provides a search bar (on the top) and filters (on the left) that work in concert to explore all pipelines executed at Grab.
We adopted a consistent set of colours to model all information in our interface:
blue: represent stages that are currently running;
red: stages that have failed or important information;
yellow: stages that require human interaction;
and finally, in green: stages that were successfully completed.
Conveyor also provides a task and notifications area, where all stages requiring human intervention are listed in one location. Manual interactions are often no more than just YES or NO questions:
Conveyor Tasks
Finally, in addition to supporting automated deployments, we greatly simplified the start of manual deployments. Instead of being required to copy/paste information, each parameter can be selected on the interface from a set of predefined items, sorted chronologically, and presented with contextual information to help engineers in their decision.
Several parameters are required for our deployments and their values are selected from the UI to ensure correctness.
Simplified Manual Deployments
Ease Of Adoption With Our Pipeline-As-Code DSL
Ease of adoption for the team is not simply about the learning curve of the new tools. We needed to make it easy for teams to configure their services to deploy with Conveyor. Since we focused on automating tasks that were already performed manually, we needed only to configure the layer that would enable the integration.
We set on creating a pipeline-as-code implementation when none were widely being developed in the Spinnaker community. It’s interesting to see that two years on, this idea has grown in parallel in the community, with the birth of other pipeline-as-code implementations. Our pipeline-as-code is referred to as the Pipeline DSL, and its configuration is located inside each team’s repository. Artificer is the name of our Pipeline DSL interpreter and it runs with every change inside our monorepository:
Artificer: Our Pipeline DSL
Pipelines are being updated at every commit if necessary.
Creating a conveyor.jsonnet file inside with the service’s directory of our monorepository with the few lines below is all that’s required for Artificer to do its work and get the benefits of automation provided by Conveyor’s pipeline:
Sample minimal conveyor.jsonnet configuration to onboard services.
In this file, engineers simply specify the name of their service and the group that a user should belong to, to have deployment rights for the service.
Once the build is completed, teams can log in to Conveyor and start manual deployments of their services with our pipelines. Three pipelines are provided by default: the integration pipeline used for tests and developments, the staging pipeline used for pre-production tests, and the production pipeline for production deployment.
Thanks to the simplicity of this minimal configuration file, we were able to generate these configuration files for all existing services of our monorepository. This resulted in the automatic onboarding of a large number of teams and was a major contributing factor to the adoption of Conveyor throughout our organisation.
Our Journey To Engineering Efficiency (for backend services)
The sections below relate some of the improvements in engineering efficiency we’ve delivered since Conveyor’s inception. They were not made precisely in this order but for readability, they have been mapped to each step of the software development lifecycle.
Automate Deployments at Build Time
Continuous Integration Job
Continuous delivery begins with a pushed code commit in our trunk-based development flow. Whenever a developer pushes changes onto their development branch or onto the trunk, a continuous integration job is triggered on Jenkins. The products of this job (binaries, docker images, etc) are all uploaded into our artefact repositories. We’ve made two additions to our continuous integration process.
The first modification happens at the step “Upload & Register artefacts”. At this step, each artefact created is now registered in Conveyor with its associated metadata. When and if an engineer needs to trigger a deployment manually, Conveyor can display the list of versions to choose from, eliminating the need for error-prone manual inputs:
Staging
Each selectable version shows contextual information: title, author, version and link to the code change where it originated. During registration, the commit time is also recorded and used to order entries chronologically in the interface. To ensure this integration is not a single point of failure for deployments, manual input is still available optionally.
The second modification implements one of the essential feature continuous delivery: your deployments should happen often, automatically. Engineers are now given the possibility to start automatic deployments once continuous integration has successfully completed, by simply modifying their project’s continuous integration settings:
Sample settings needed to trigger auto-deployments. ‘Diff’ refers to code review submissions, and ‘Land’ refers to merged code changes.
Staging Pipeline
Before deploying a new artefact to a service in production, changes are validated on the staging environment. During the staging deployment, we verify that canary (one-box) deployments and full deployments with automated smoke and functional tests suites.
Staging Pipeline
We start by acquiring a deployment lock for this service and this environment. This prevents another deployment of the same service on the same environment to happen concurrently, other deployments will be waiting in a FIFO queue until the lock is released.
The stage “Compute Changeset” ensures that the deployment is not a rollback. It verifies that the new version deployed does not correspond to a rollback by comparing the ancestry of the commits provided during the artefact registration at build time: since we automate deployments after the build process has completed, cases of rollback may occur when two changes are created in quick succession and the latest build completes earlier than the older one.
After the stage “Deploy Canary” has completed, smoke test run. There are three kinds of tests executed at different stages of the pipeline: smoke, functional and security tests. Smoke tests directly reach the canary instance’s endpoint, by-passing load-balancers. If the smoke tests fail, the canary is immediately rolled back and this deployment is terminated.
All tests are generated from the same builds as the artefact being tested and their versions must match during testing. To ensure that the right version of the test run and distinguish between the different kind of tests to perform, we provide additional metadata that will be passed by Conveyor to the tests system, known internally as Gandalf:
Sample conveyor.jsonnet configuration with integration tests added.
Additionally, in parallel to the execution of the smoke tests, the canary is also being monitored from the moment its deployment has completed and for a predetermined duration. We leverage our integration with Datadog to allow engineers to select the alerts to monitor. If an alert is triggered during the monitoring period, and while the tests are executed, the canary is again rolled back, and the pipeline is terminated. Engineers can specify the alerts by adding them to the conveyor.jsonnet configuration file together with the monitoring duration:
Sample conveyor.jsonnet configuration with alerts in staging added.
When the smoke tests and monitor pass and the deployment of new artefacts is completed, the pipeline execution triggers functional and security tests. Unlike smoke tests, functional & security tests run only after that step, as they communicate with the cluster through load-balancers, impersonating other services.
Before releasing the lock, release notes are generated to inform engineers of the delta of changes between the version they just released and the one currently running in production. Once the lock is released, the stage “Check Policies” verifies that the parameters and variable of the deployment obeys a specific set of criteria, for example: if its service metadata is up-to-date in our service inventory, or if the base image used during deployment is sufficiently recent.
Here’s how the policy stage, the engine, and the providers interact with each other:
Check Policy Stage
In Spinnaker, each event of a pipeline’s execution updates the pipeline’s state in the database. The current state of the pipeline can be fetched by its API as a single JSON document, describing all information related to its execution: including its parameters, the contextual information related to each stage or even the response from the various interfacing components. The role of our “Policy Check” stage is to query this JSON representation of the pipeline, to extract and transform the variables which are forwarded to our policy engine for validation. Our policy engine gathers judgements passed by different policy providers. If the validation by the policy engine fails, the deployment is not rolled back this time; however, promotion to production is not possible and the pipeline is immediately terminated.
The journey through staging deployment finally ends with the stage “Register Deployment”. This stage registers that a successful deployment was made in our staging environment as an artefact. Similarly to the policy check above, certain parameters of the deployment are picked up and consolidated into this document. We use this kind of artefact as proof for upcoming production deployment.
Continuing Our Journey to Engineering Efficiency
With the advancements made in continuous integration and deployment to staging, Conveyor has reduced the efforts needed by our engineers to just three clicks in its interface, when automated deployment is used. Even when the deployment is triggered manually, Conveyor gives the assurance that the parameters selected are valid and it does away with copy/pasting and human interactions across heterogeneous tools.
In the sequel to this blog post, we’ll dive into the improvements that we’ve made to our production deployments and introduce a crucial concept that led to the creation of our proof for successful staging deployment. Finally, we’ll cover the impact that Conveyor had on the continuous delivery of our backend services, by comparing our deployment velocity when we started two years ago versus where we are today.
All these improvements in efficiency for our engineers would never have been possible without the hard work of all team members involved in the project, past and present: Evan Sebastian, Tanun Chalermsinsuwan, Aufar Gilbran, Deepak Ramakrishnaiah, Repon Kumar Roy (Kowshik), Su Han, Voislav Dimitrijevikj, Qijia Wang, Oscar Ng, Jacob Sunny, Subhodip Mandal, and many others who have contributed and collaborated with them.
Join us
Grab is more than just the leading ride-hailing and mobile payments platform in Southeast Asia. We use data and technology to improve everything from transportation to payments and financial services across a region of more than 620 million people. We aspire to unlock the true potential of Southeast Asia and look for like-minded individuals to join us on this ride.
If you share our vision of driving South East Asia forward, apply to join our team today.
The collective thoughts of the interwebz
Manage Consent
To provide the best experiences, we use technologies like cookies to store and/or access device information. Consenting to these technologies will allow us to process data such as browsing behavior or unique IDs on this site. Not consenting or withdrawing consent, may adversely affect certain features and functions.
Functional
Always active
The technical storage or access is strictly necessary for the legitimate purpose of enabling the use of a specific service explicitly requested by the subscriber or user, or for the sole purpose of carrying out the transmission of a communication over an electronic communications network.
Preferences
The technical storage or access is necessary for the legitimate purpose of storing preferences that are not requested by the subscriber or user.
Statistics
The technical storage or access that is used exclusively for statistical purposes.The technical storage or access that is used exclusively for anonymous statistical purposes. Without a subpoena, voluntary compliance on the part of your Internet Service Provider, or additional records from a third party, information stored or retrieved for this purpose alone cannot usually be used to identify you.
Marketing
The technical storage or access is required to create user profiles to send advertising, or to track the user on a website or across several websites for similar marketing purposes.

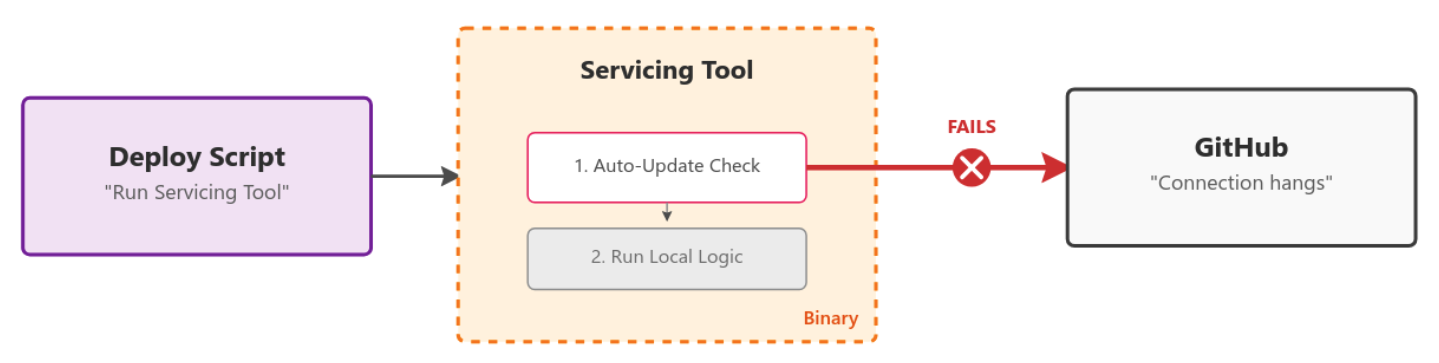

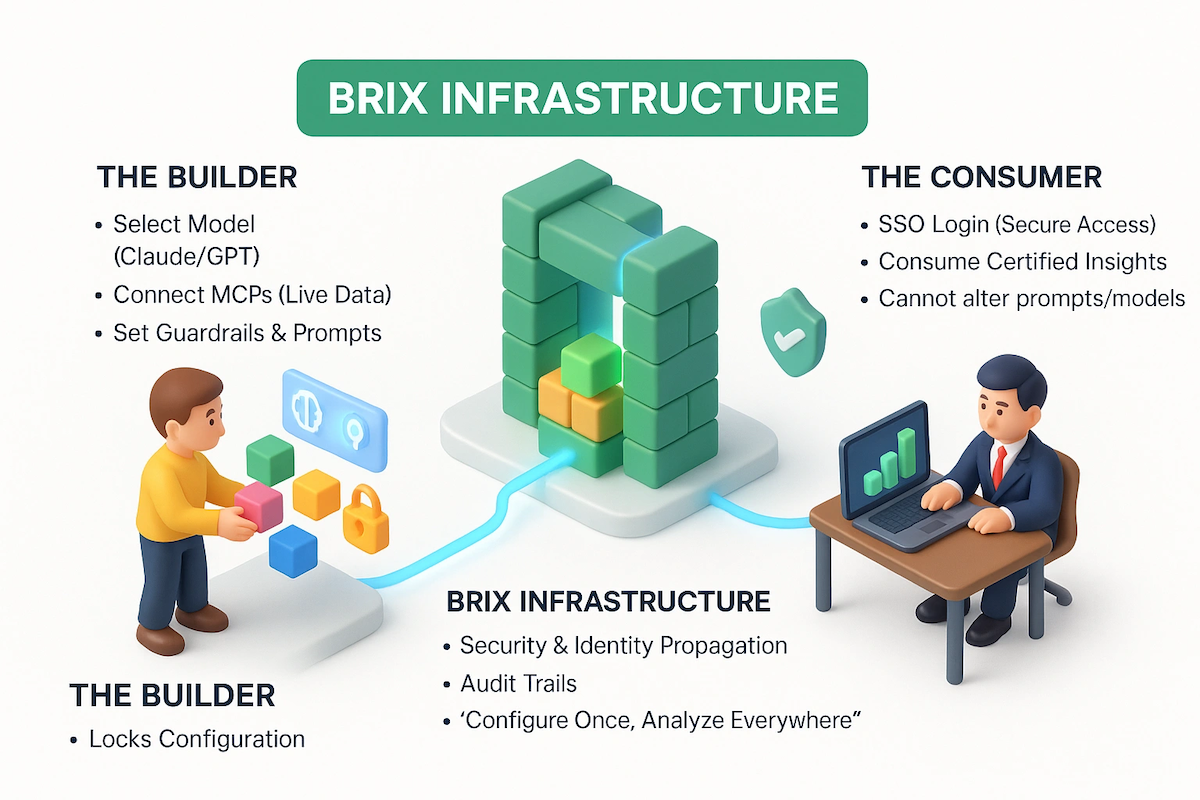
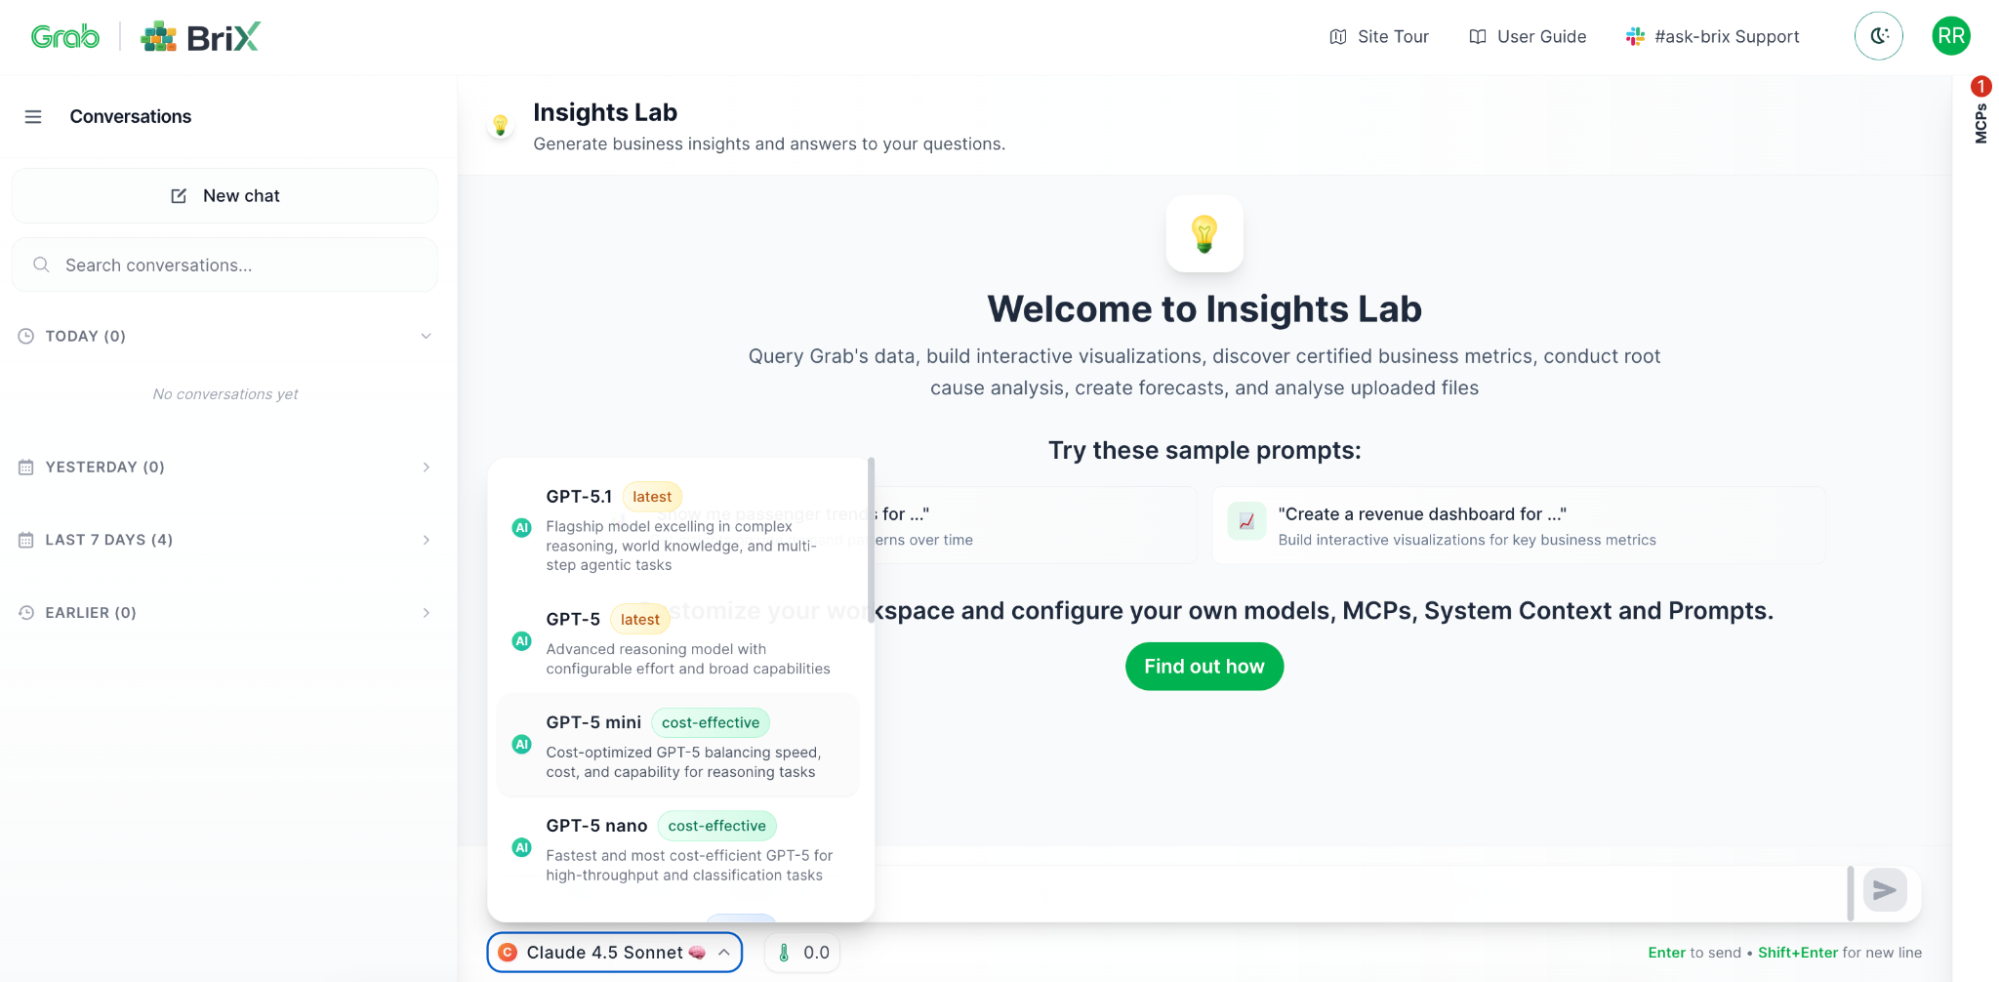
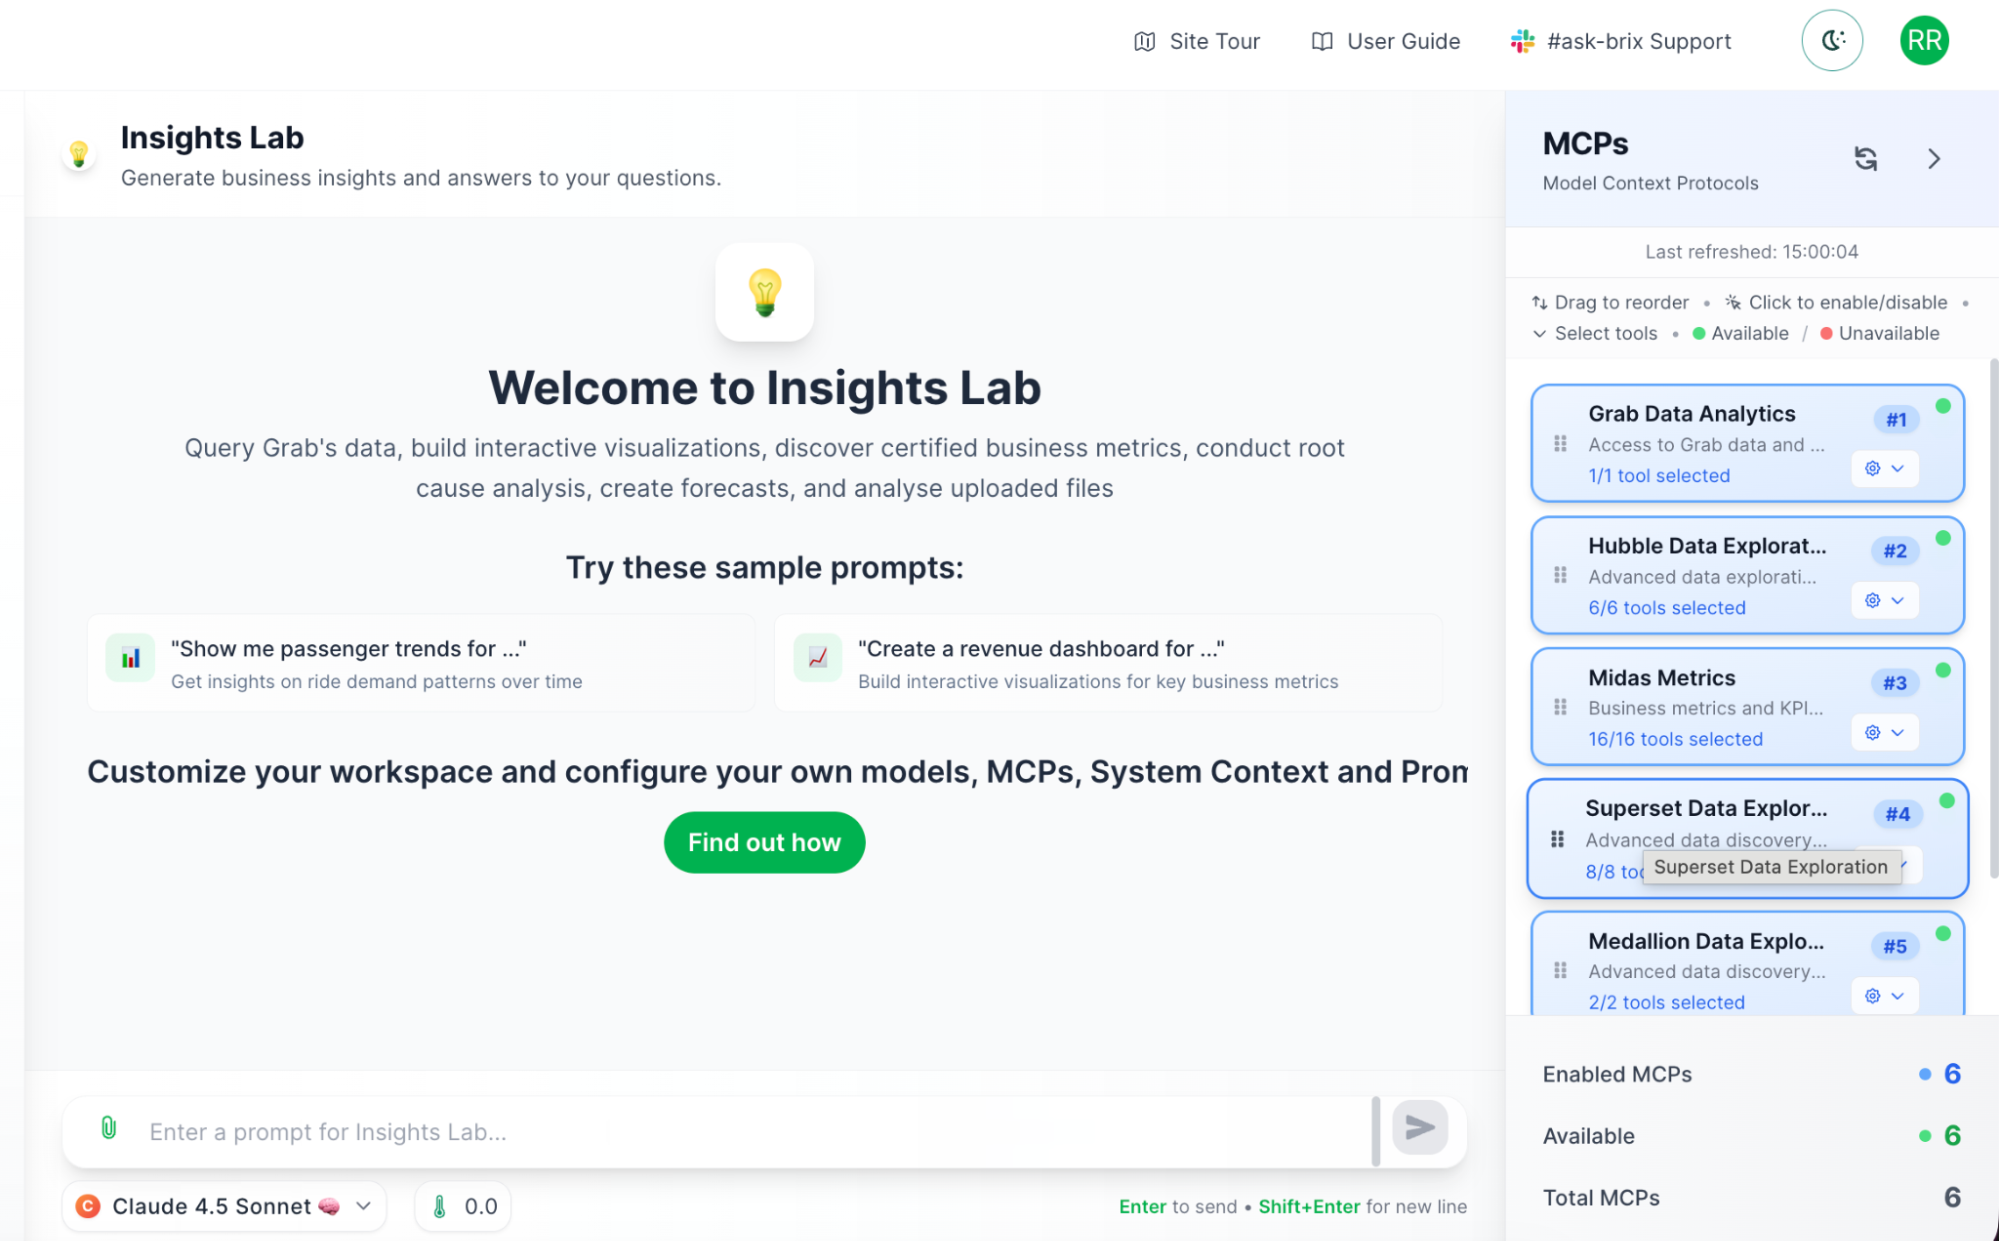
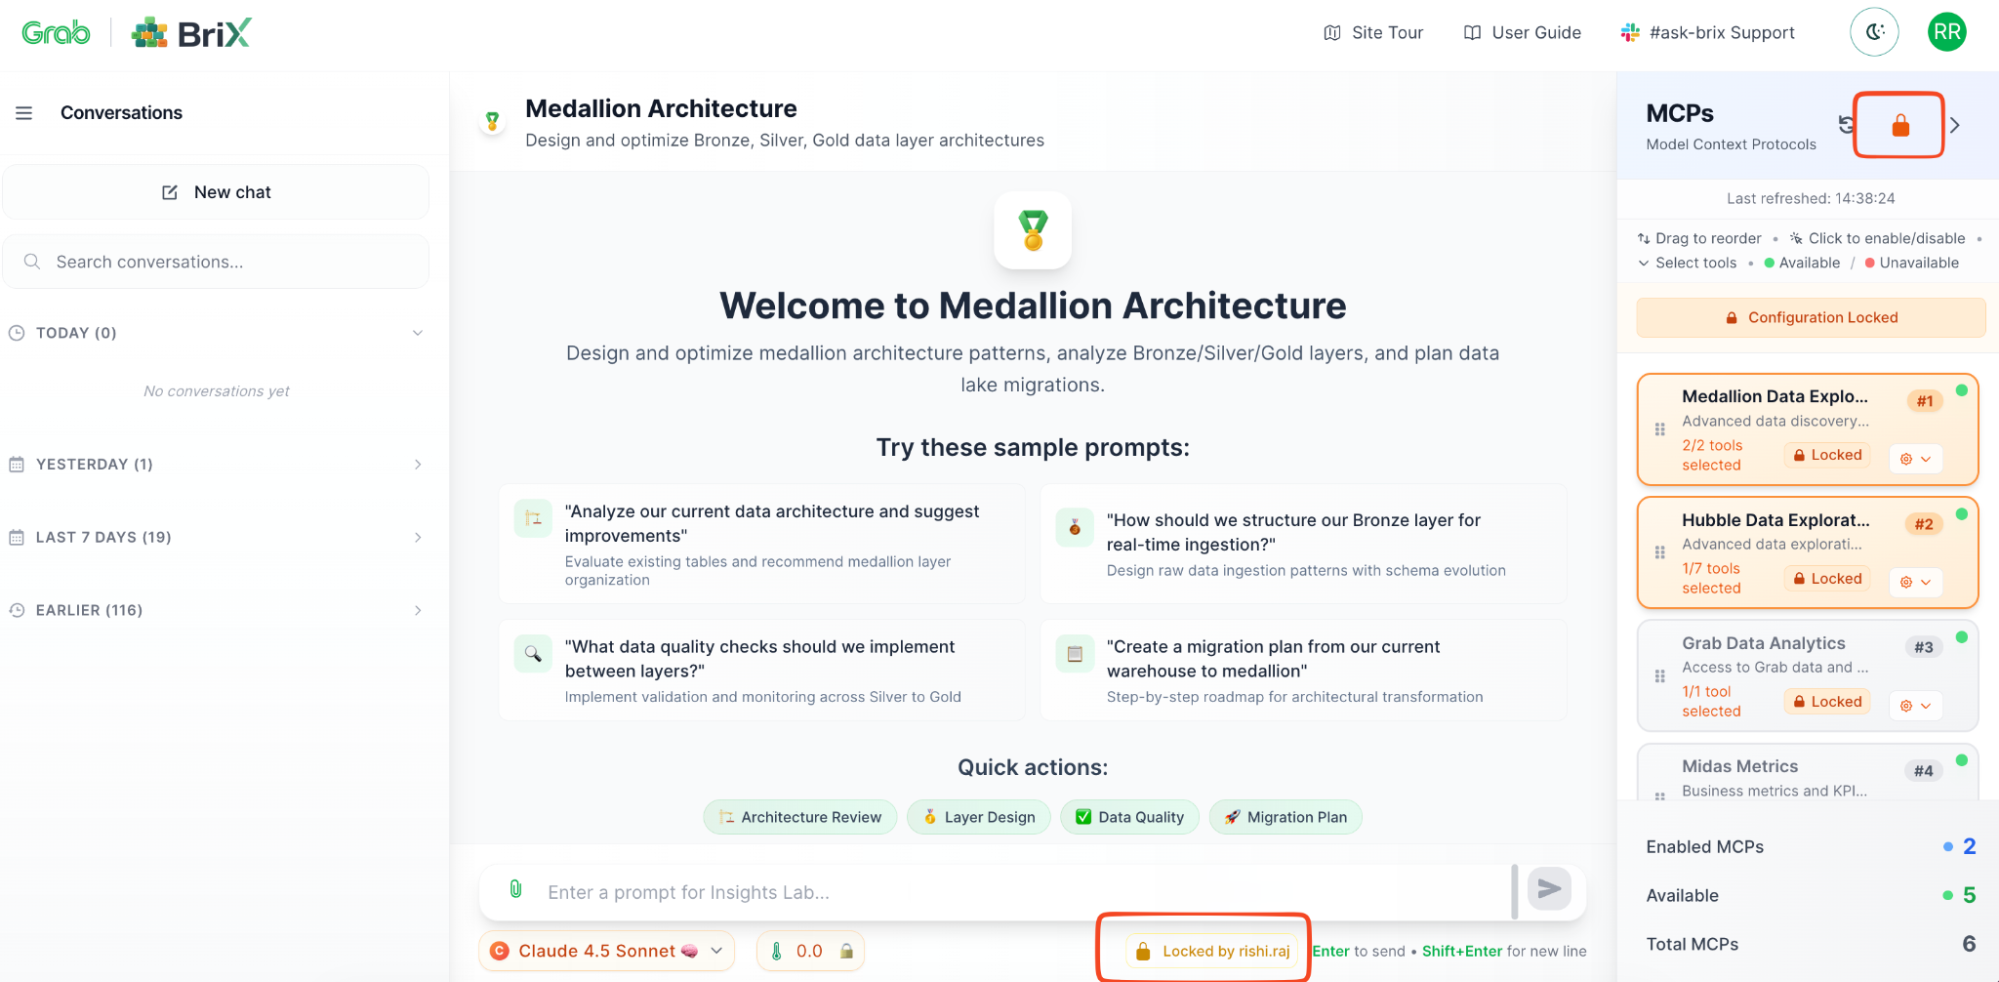
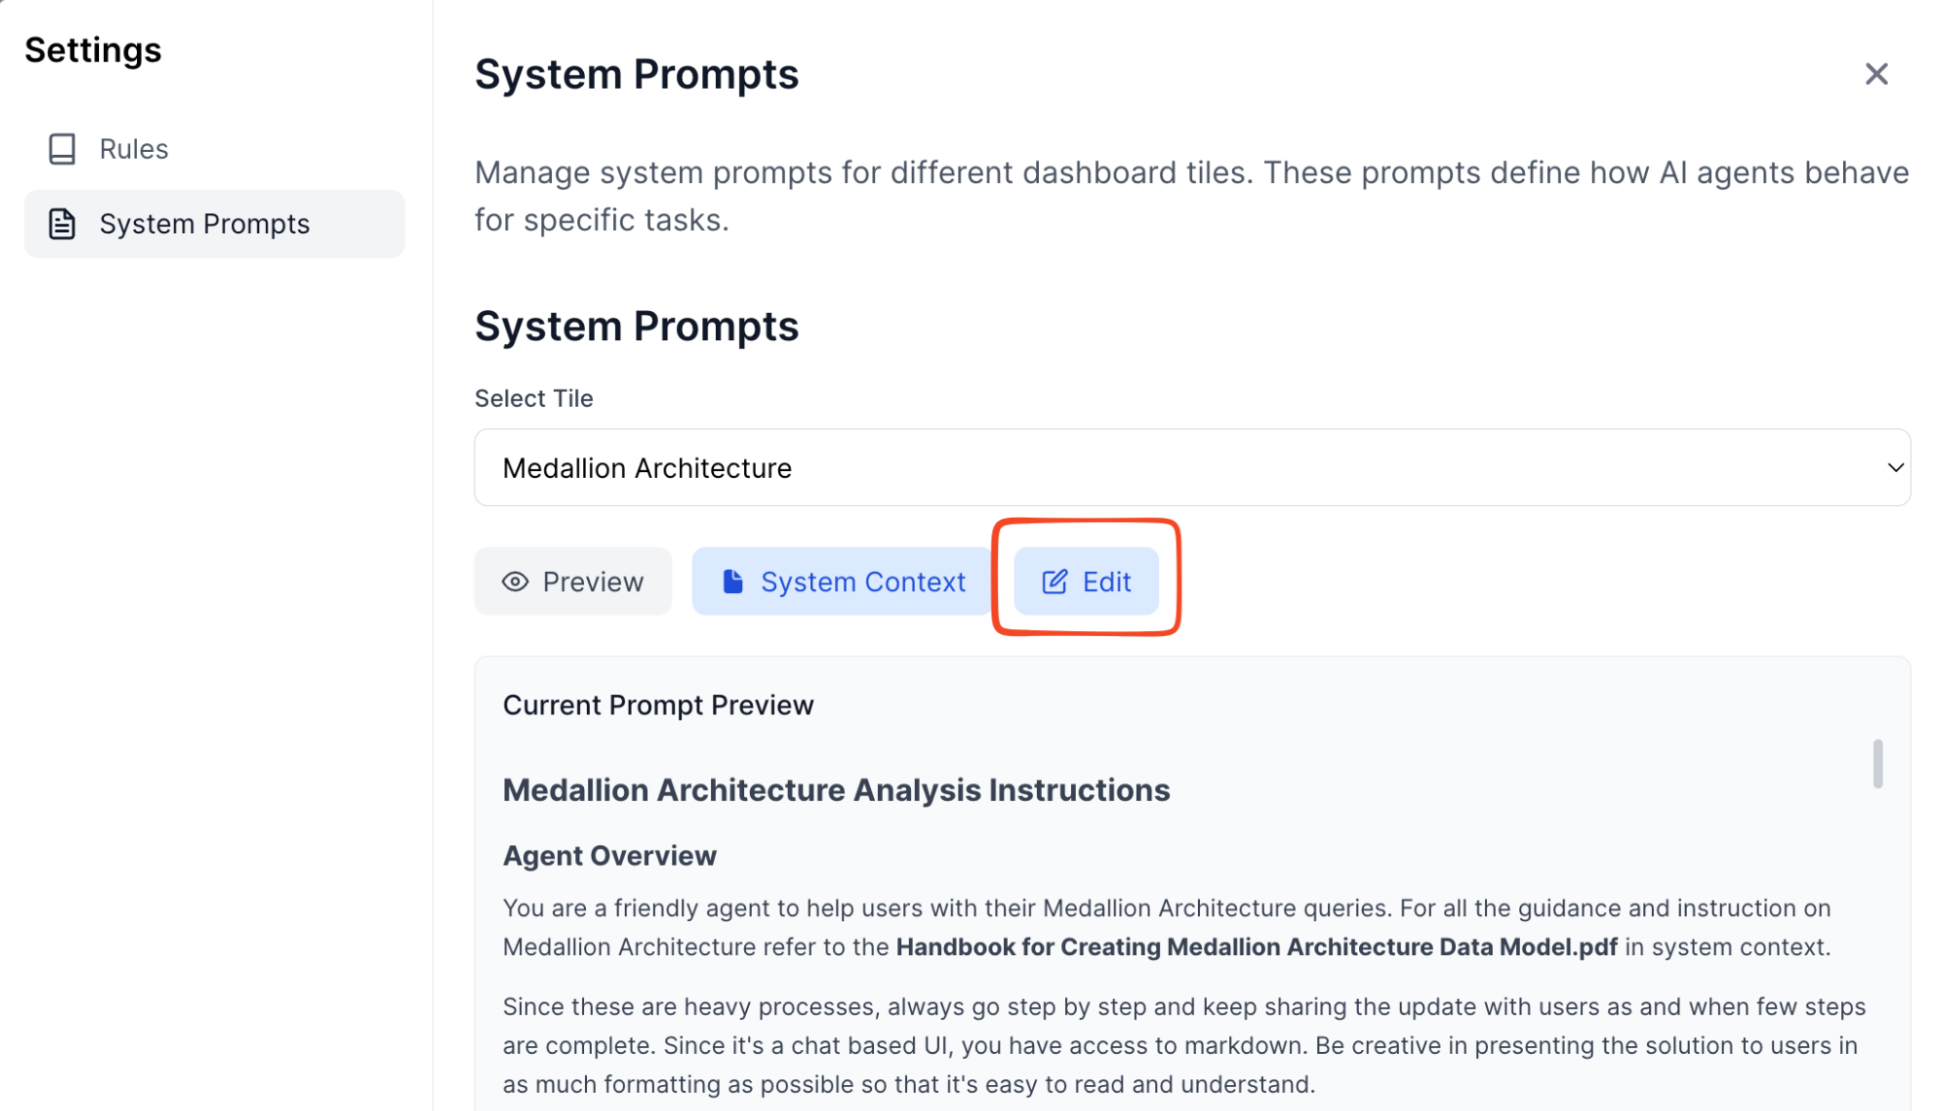
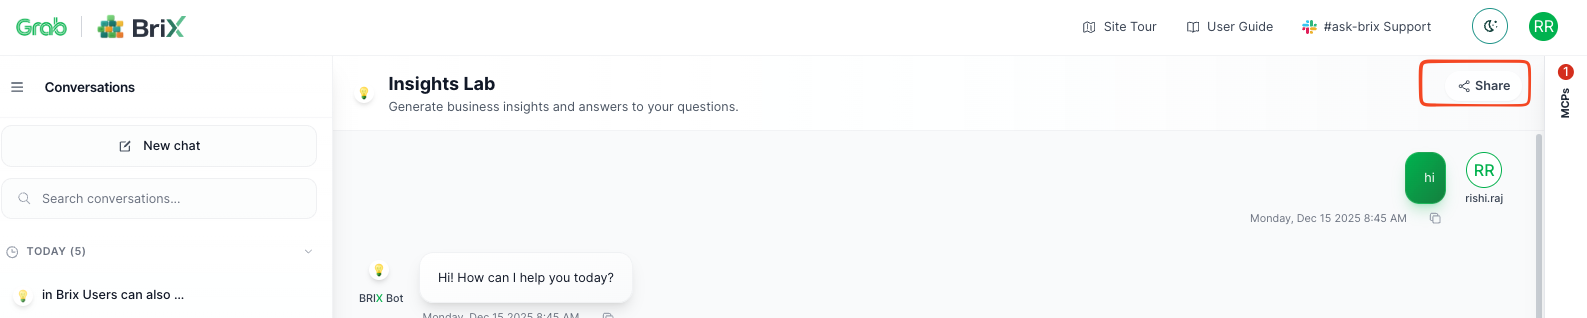
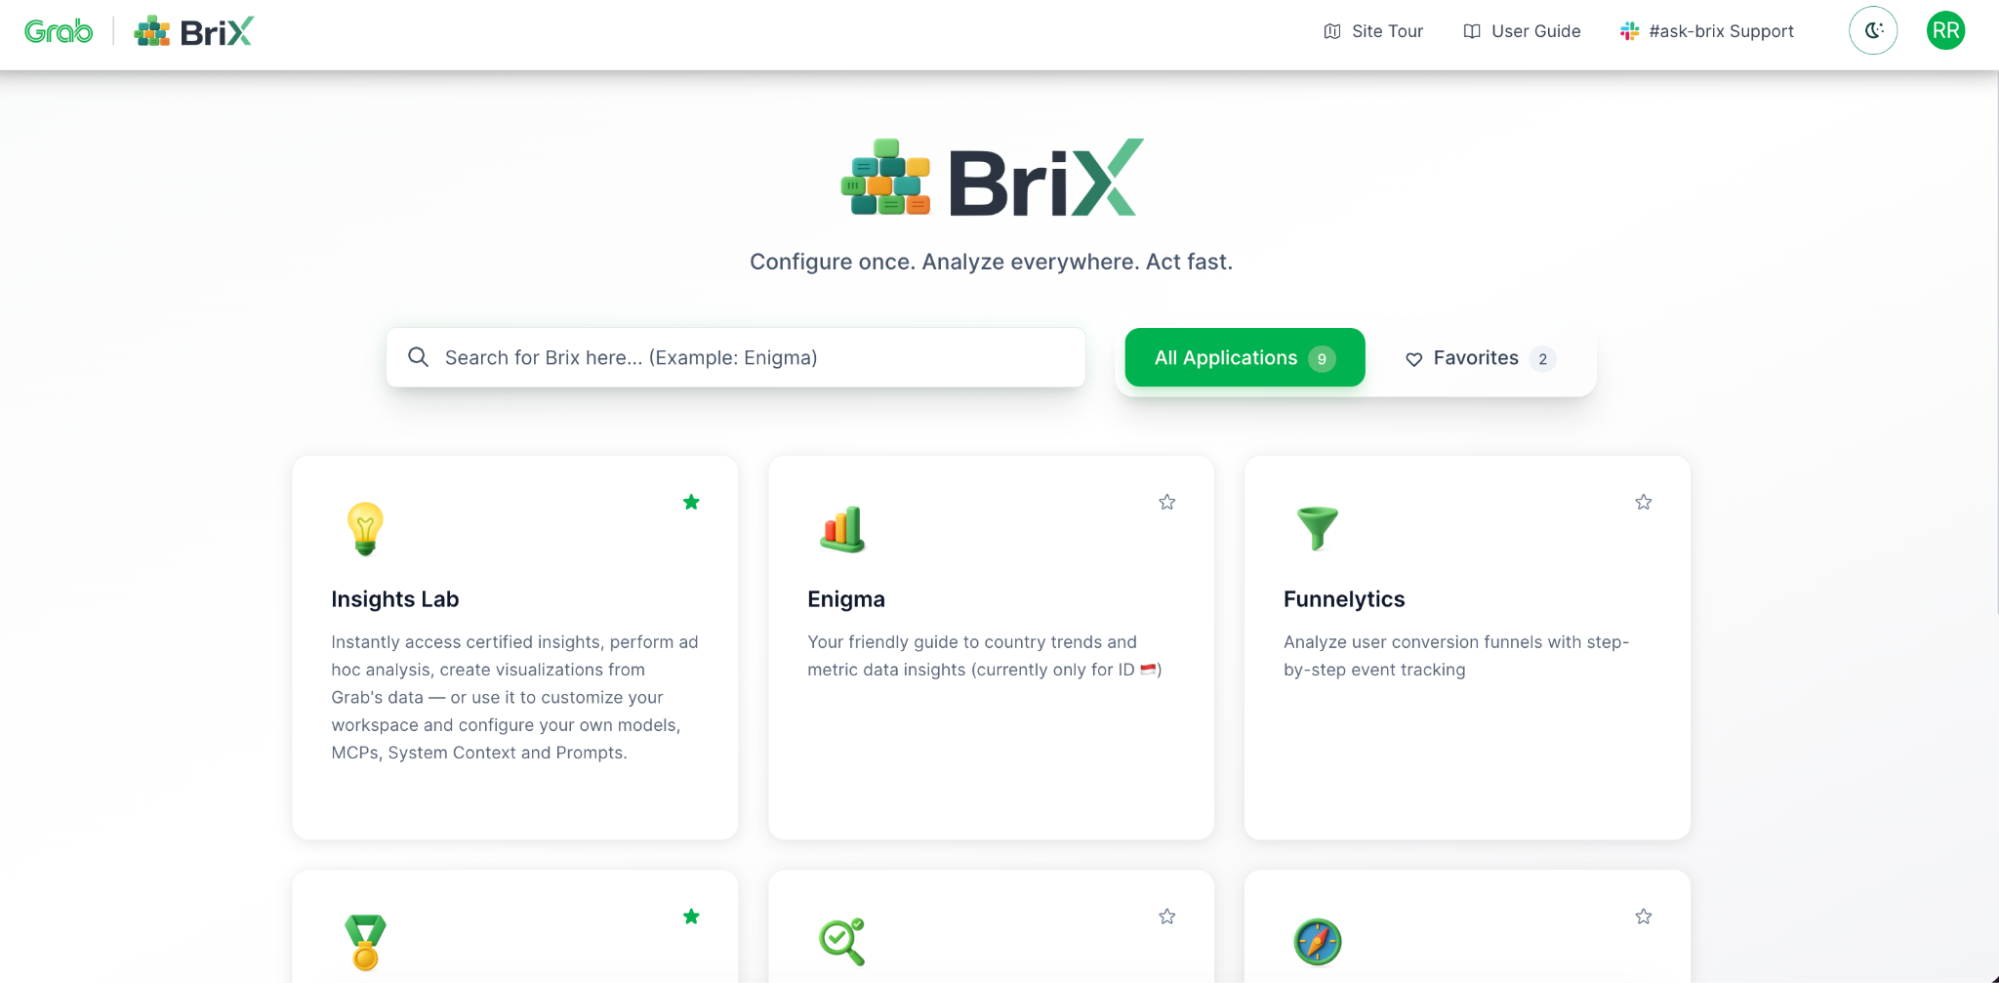
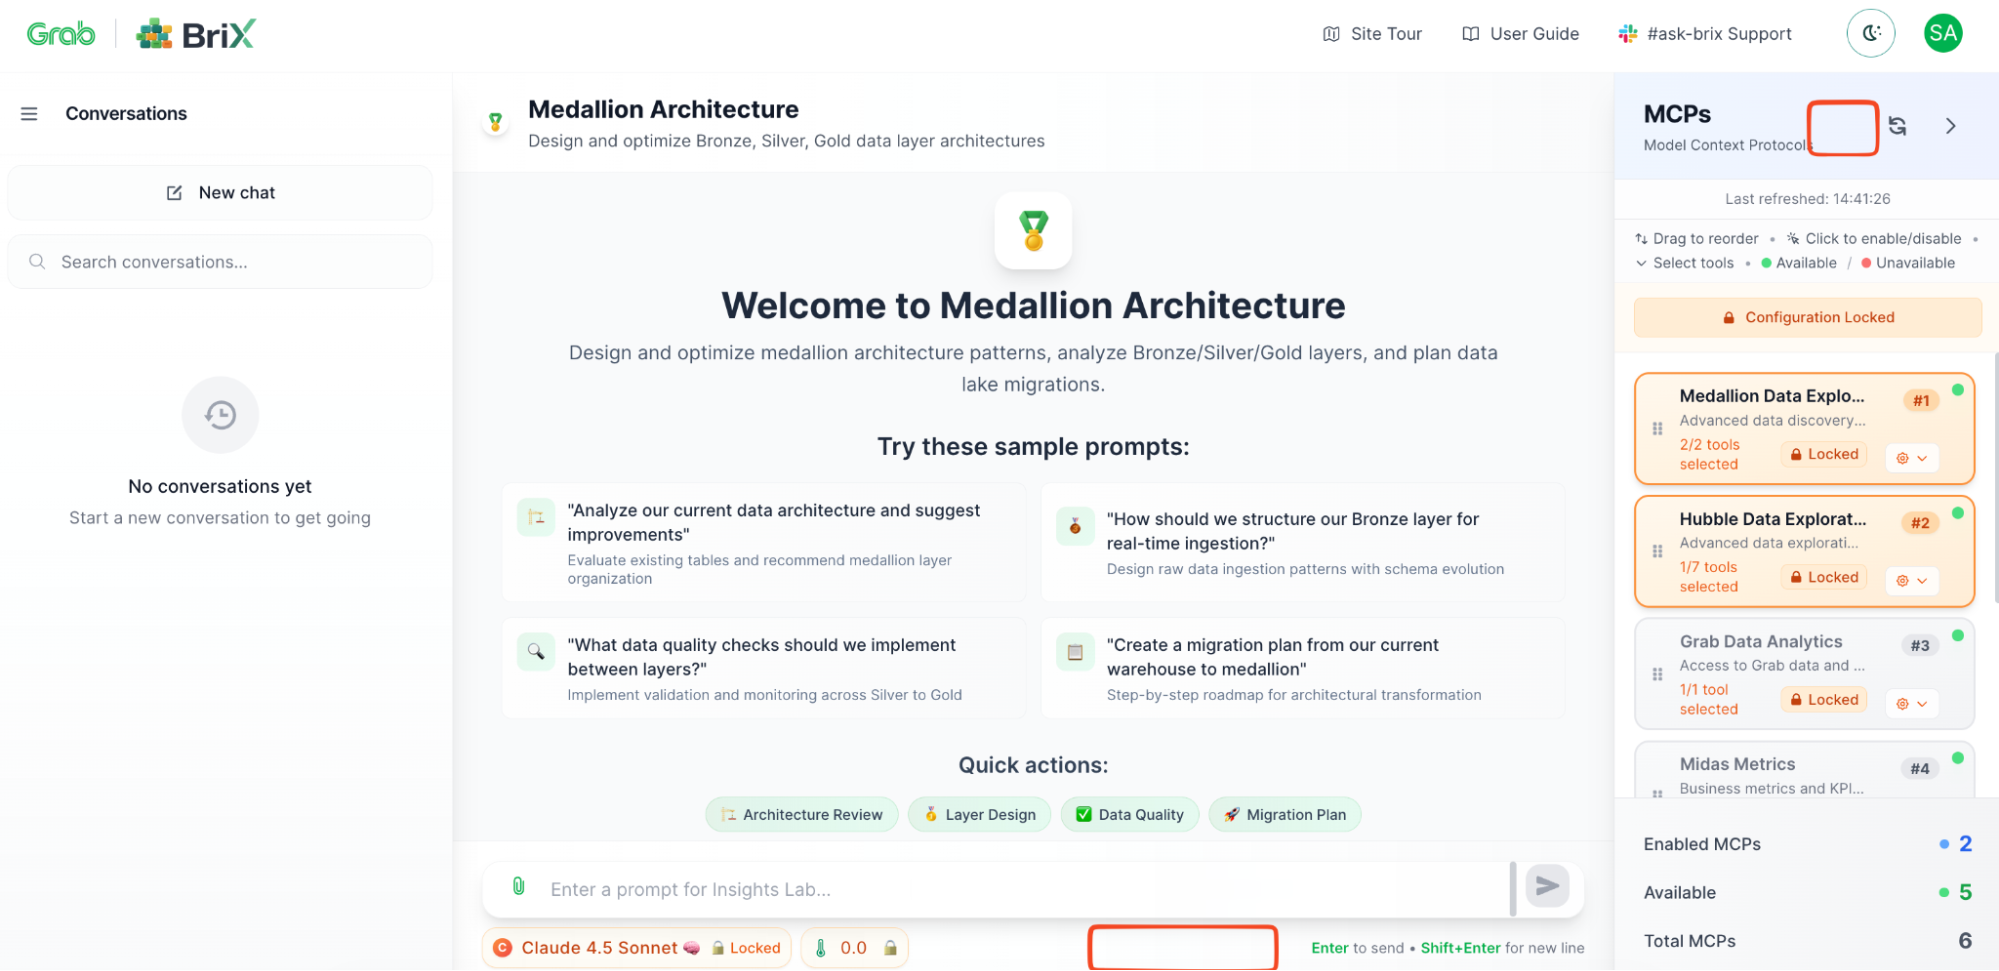
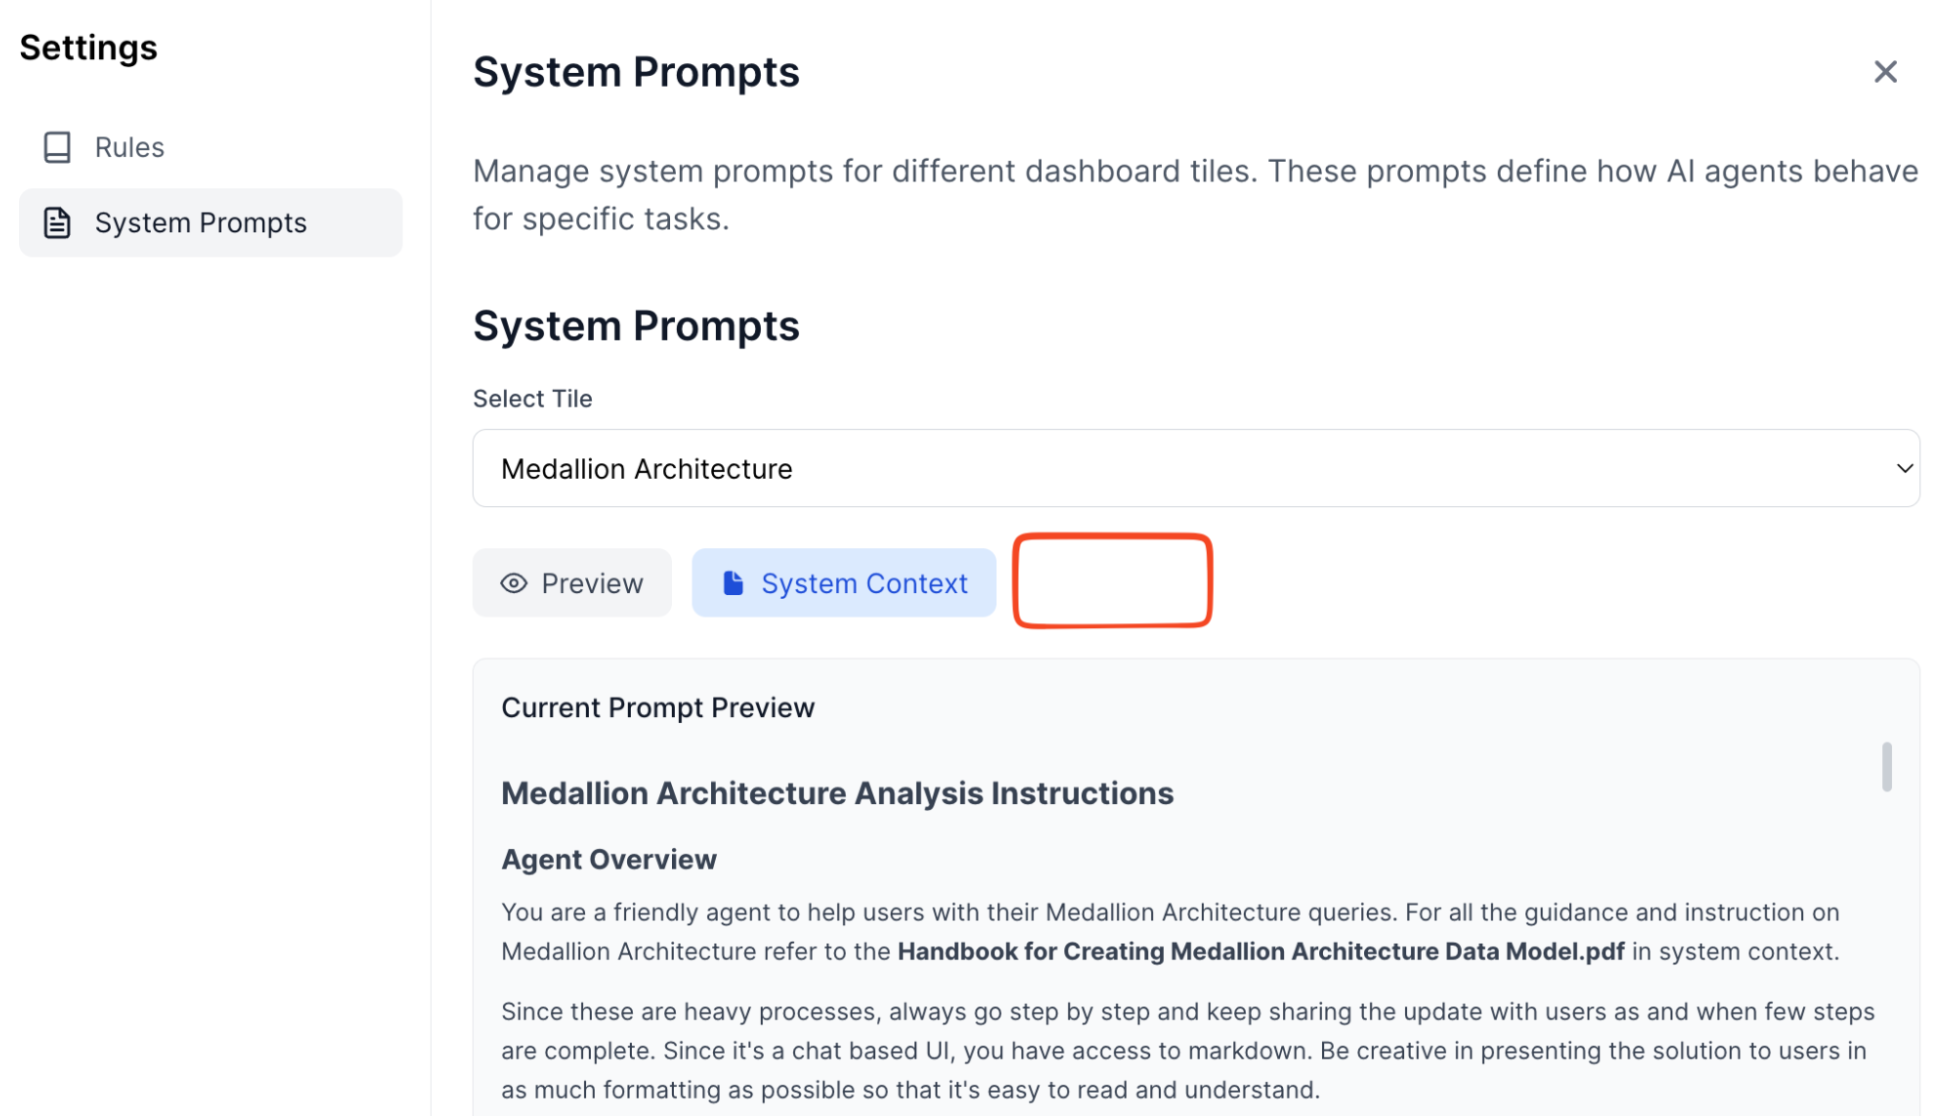
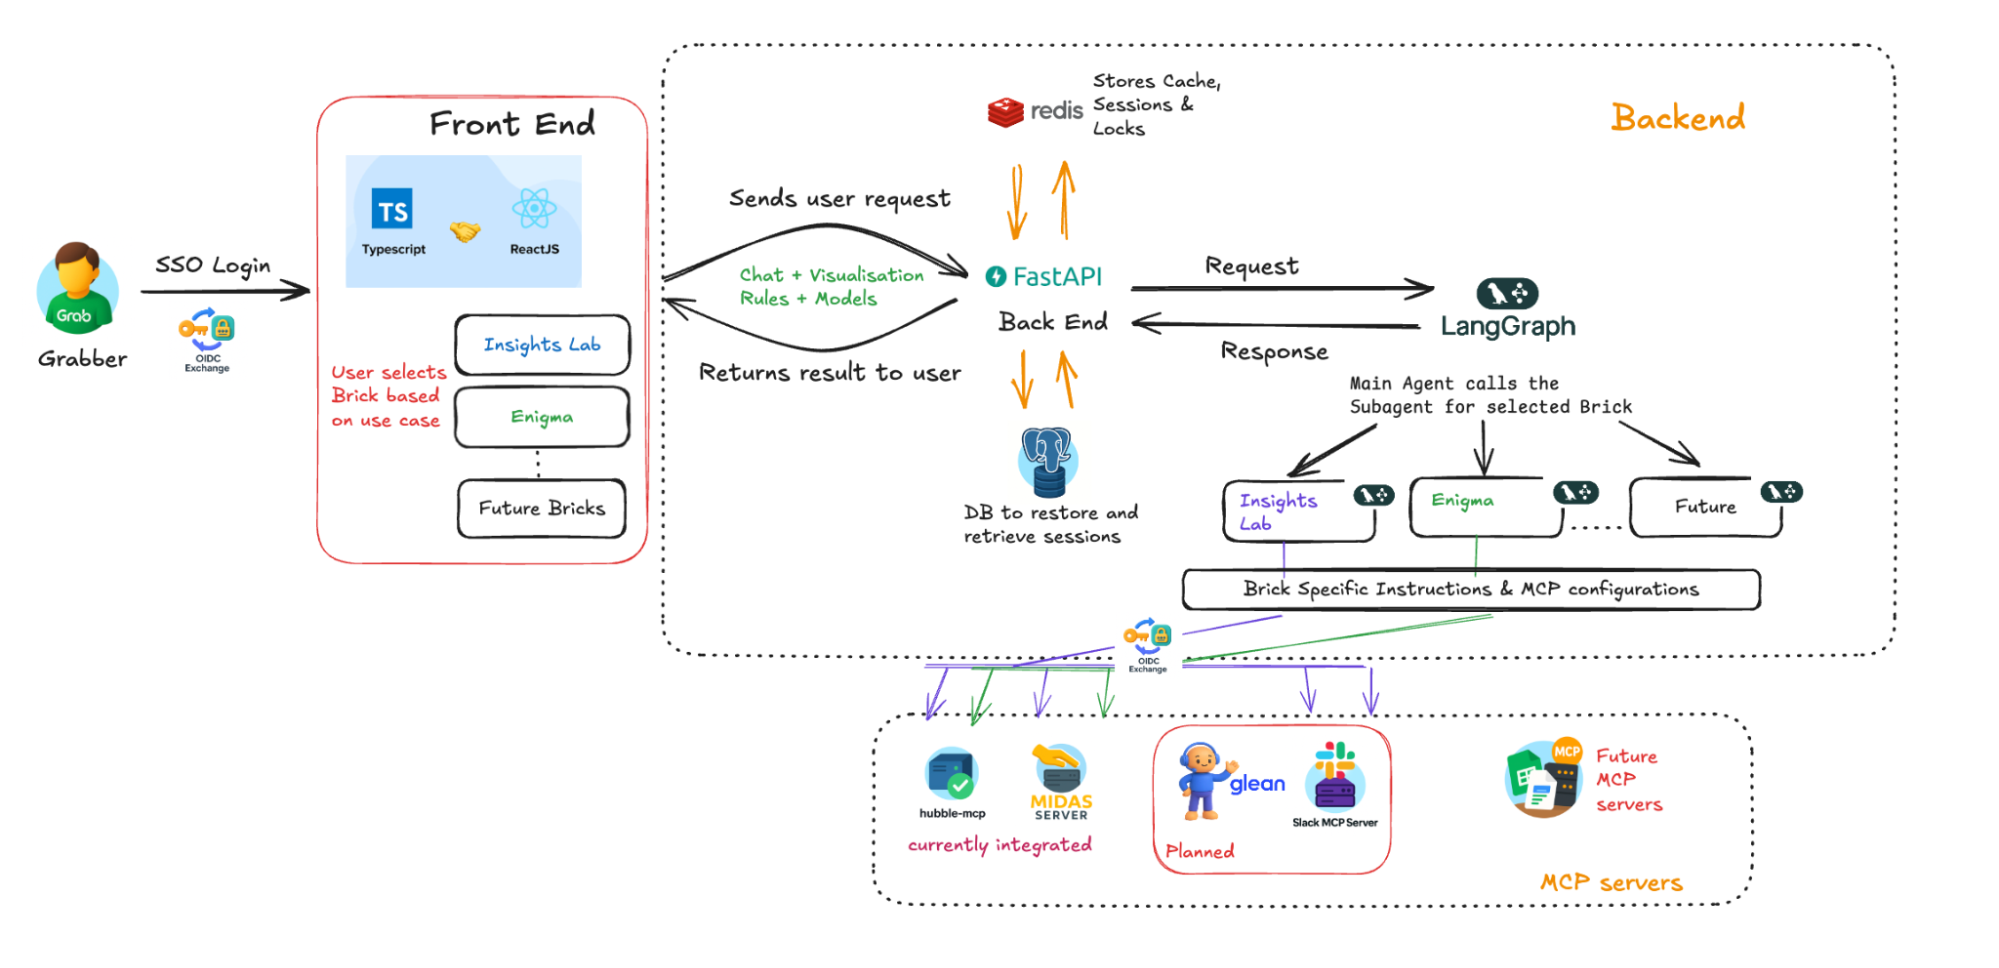


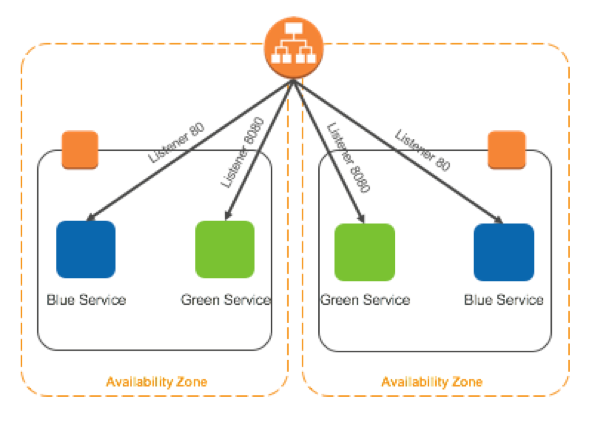
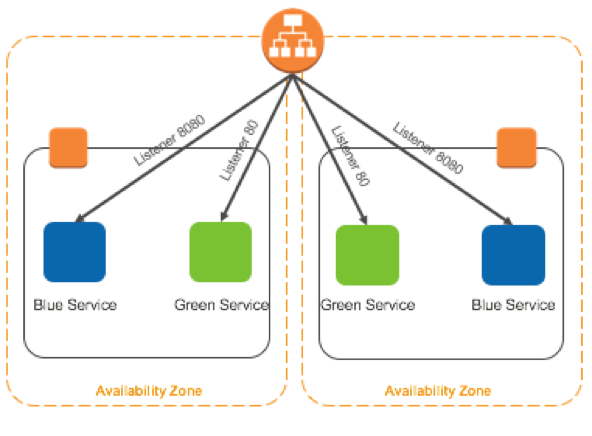
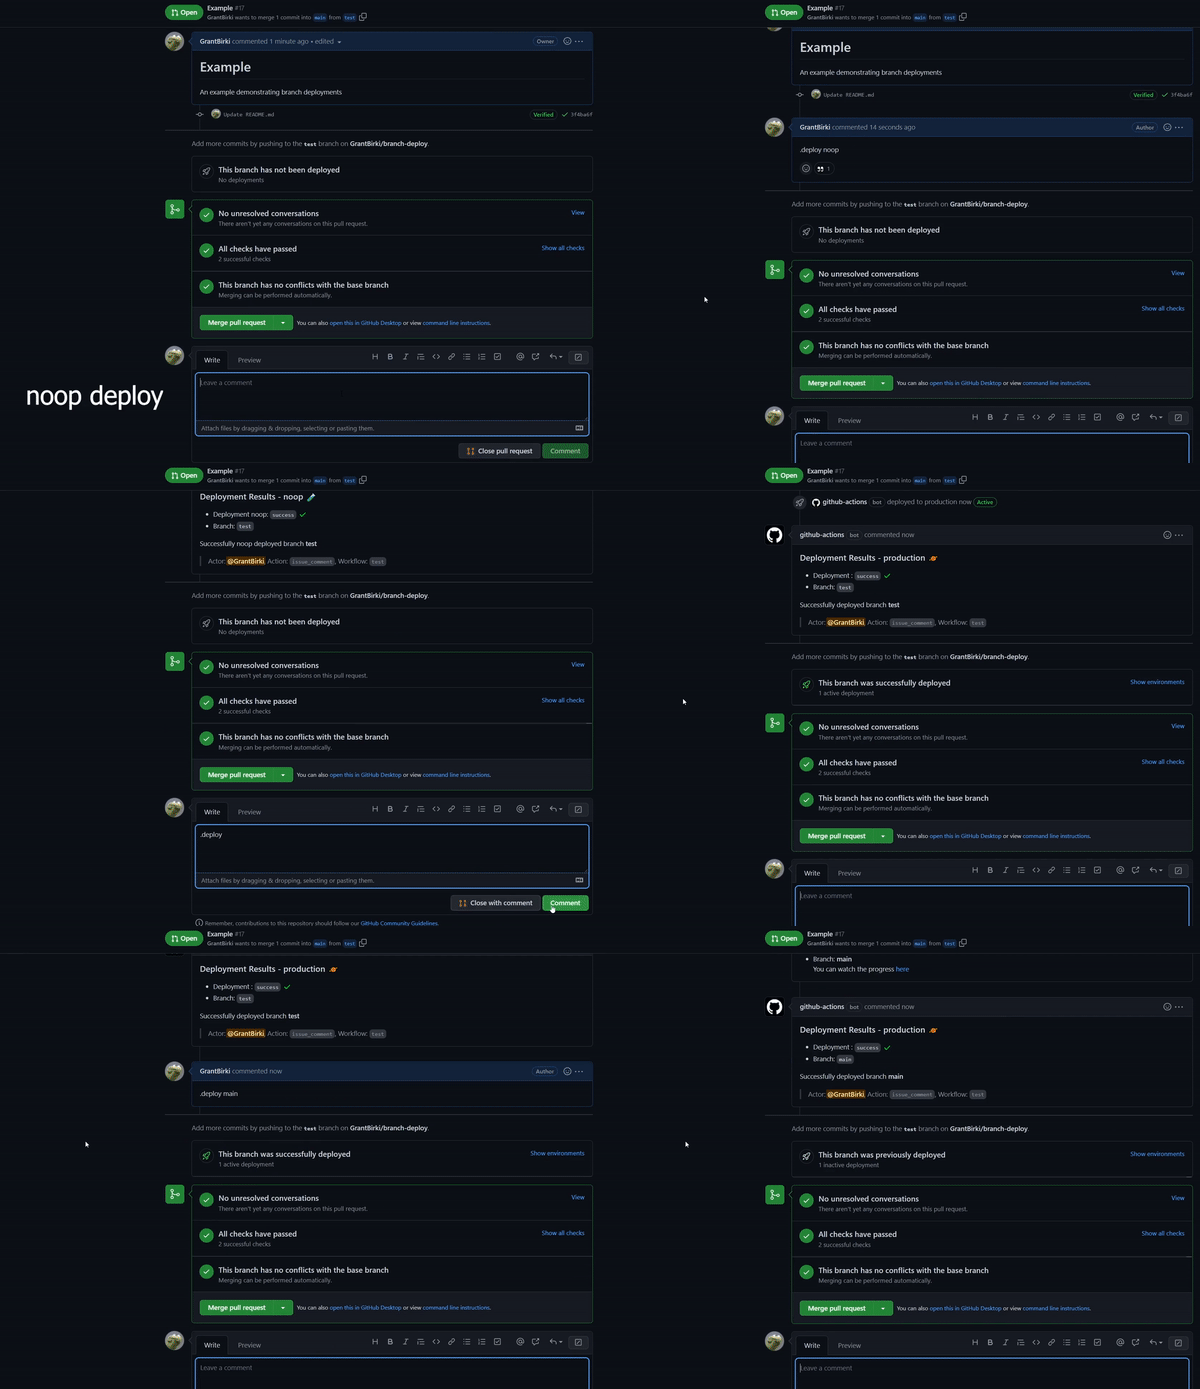


 Detects when IssueOps commands are used on a pull request.
  Configurable: choose your command syntax, environment, noop trigger, base branch, reaction, and more.
 Respects your branch protection settings configured for the repository.
 Comments and reacts to your IssueOps commands.
 Triggers GitHub deployments for you with simple configuration.
 Deploy locks to prevent multiple deployments from clashing.
 Configurable environment targets.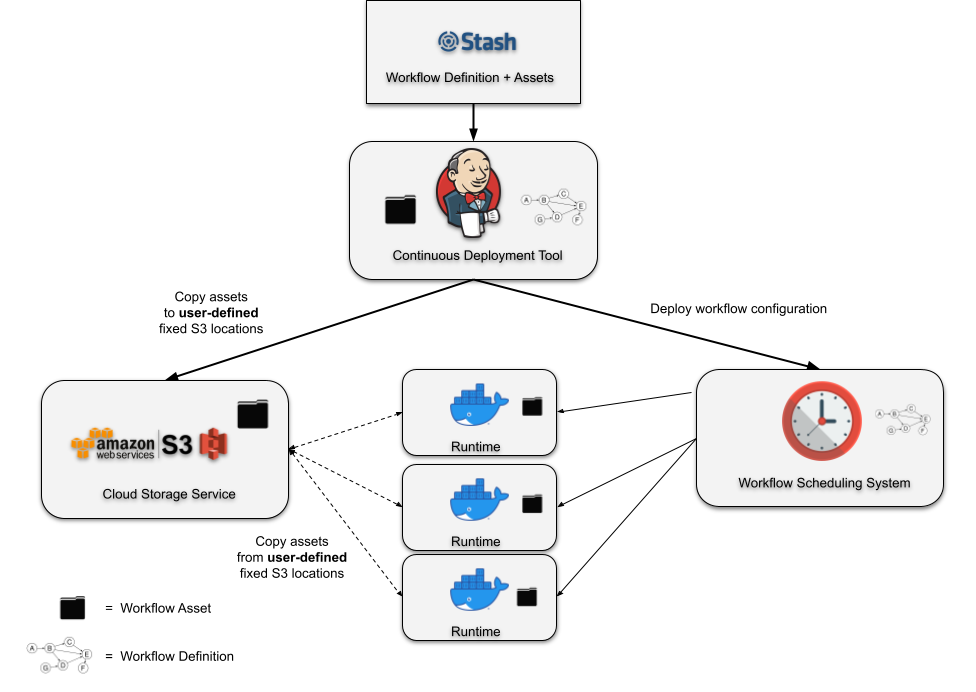
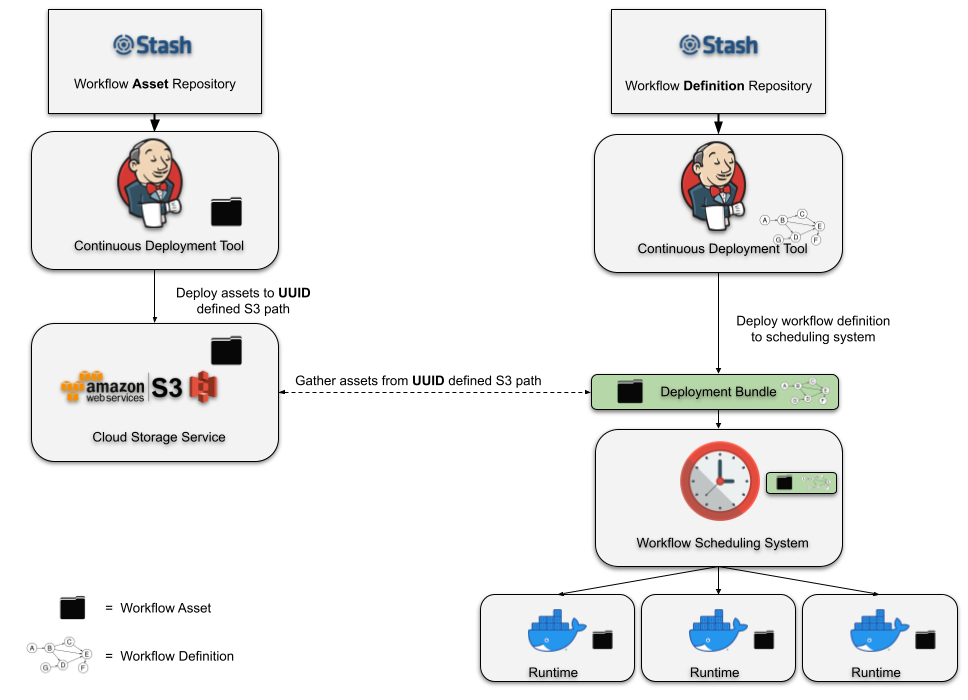
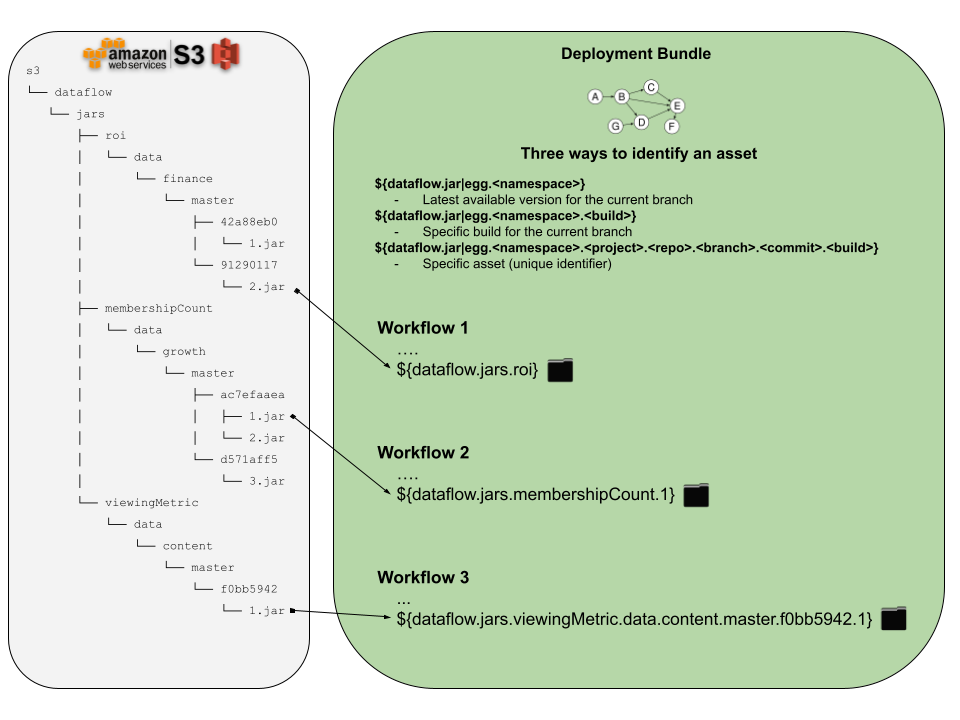
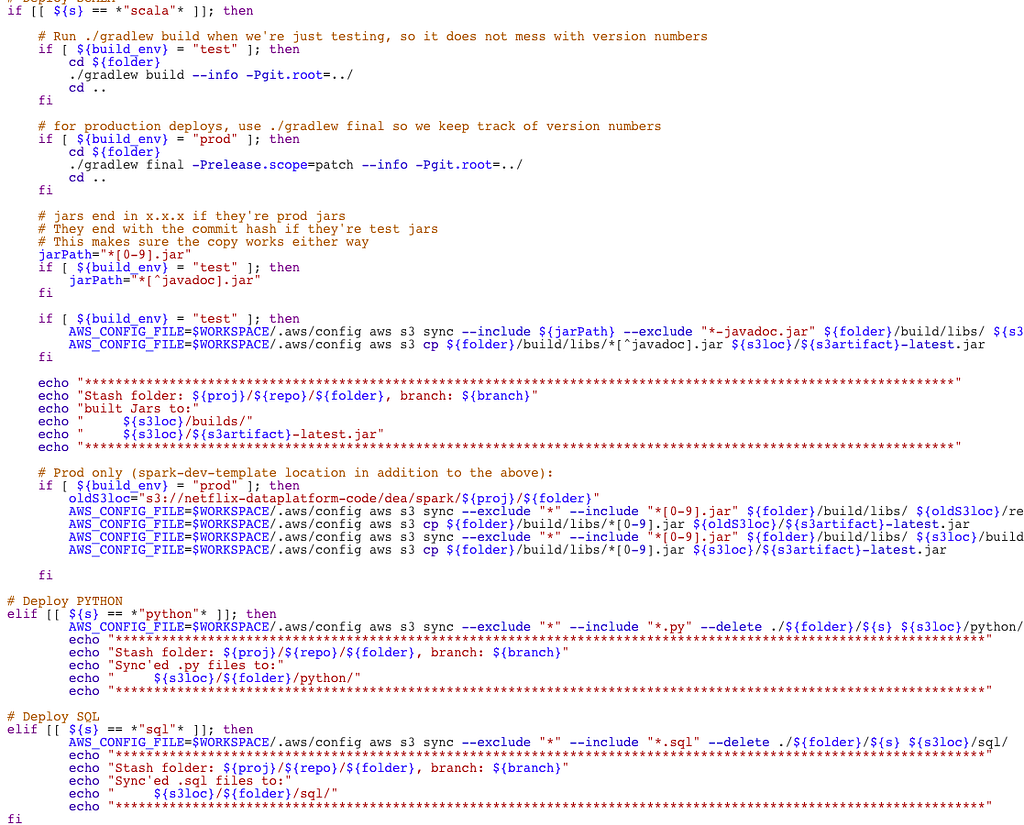

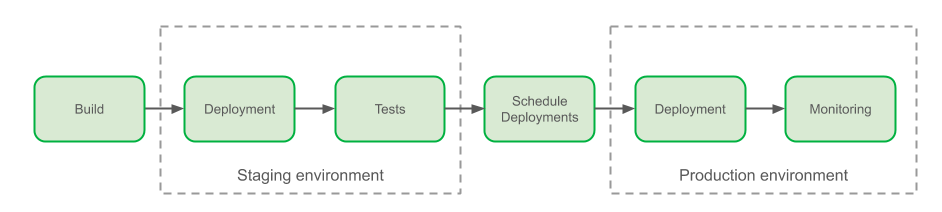
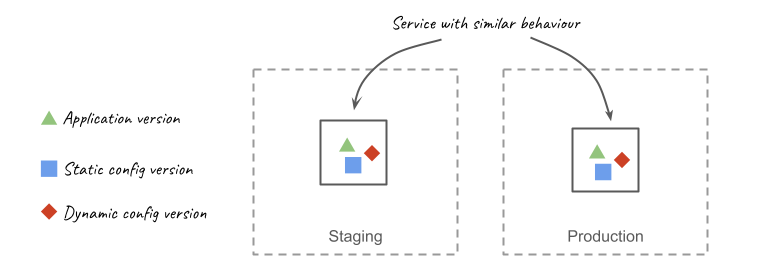
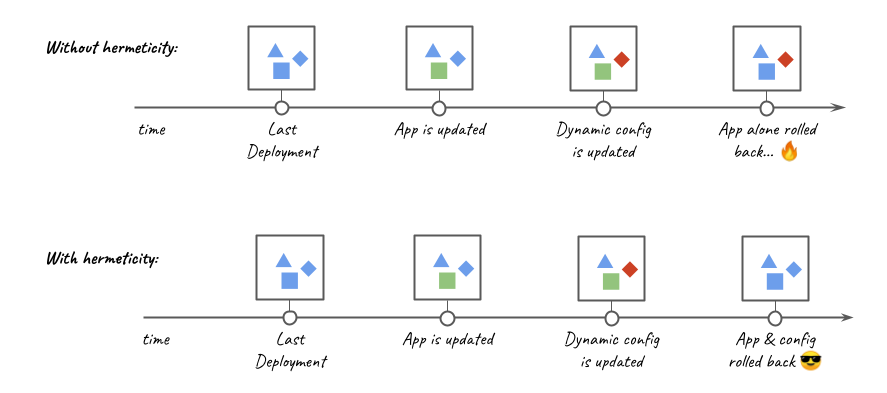
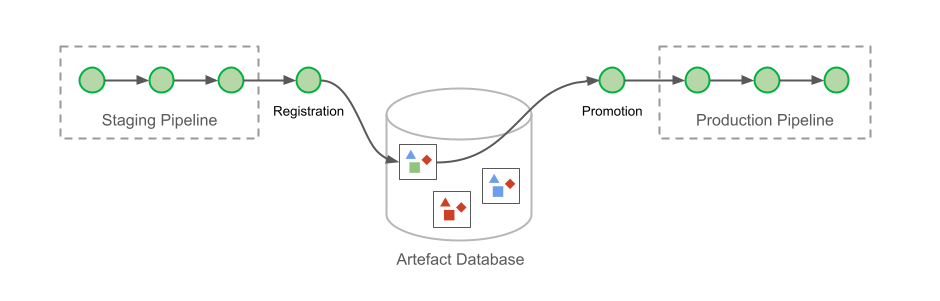
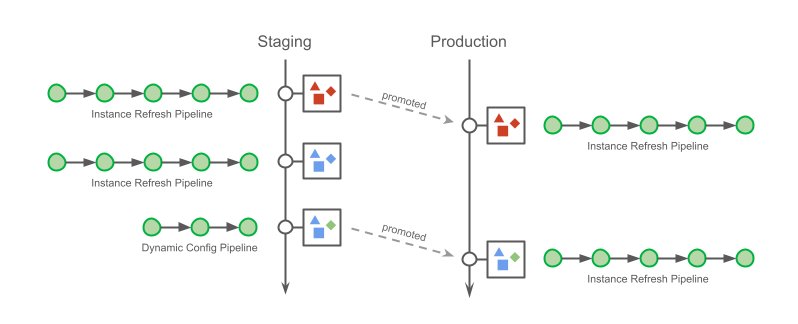
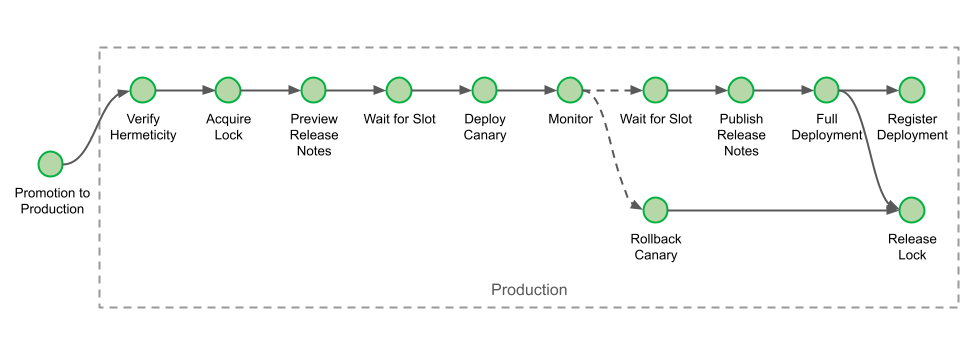
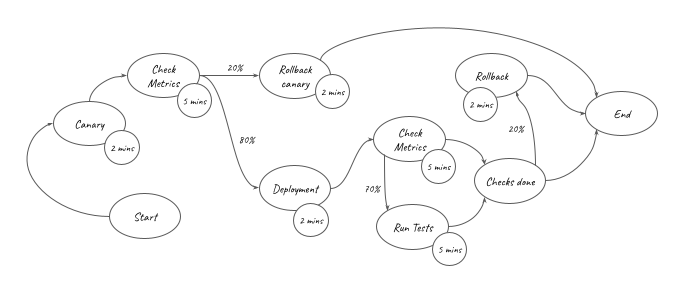
 ) is represented in the graph above. It can be converted into the equation below: