Tag Archives: ECS

Introducing workload simulation workbench for Amazon MSK Express broker

Post Syndicated from Manu Mishra original https://aws.amazon.com/blogs/big-data/introducing-workload-simulation-workbench-for-amazon-msk-express-broker/

Validating Kafka configurations before production deployment can be challenging. In this post, we introduce the workload simulation workbench for Amazon Managed Streaming for Apache Kafka (Amazon MSK) Express Broker. The simulation workbench is a tool that you can use to safely validate your streaming configurations through realistic testing scenarios.

Solution overview

Varying message sizes, partition strategies, throughput requirements, and scaling patterns make it challenging for you to predict how your Apache Kafka configurations will perform in production. The traditional approaches to test these variables create significant barriers: ad-hoc testing lacks consistency, manual set up of temporary clusters is time-consuming and error-prone, production-like environments require dedicated infrastructure teams, and team training often happens in isolation without realistic scenarios. You need a structured way to test and validate these configurations safely before deployment. The workload simulation workbench for MSK Express Broker addresses these challenges by providing a configurable, infrastructure as code (IaC) solution using AWS Cloud Development Kit (AWS CDK) deployments for realistic Apache Kafka testing. The workbench supports configurable workload scenarios, and real-time performance insights.

Express brokers for MSK Provisioned make managing Apache Kafka more streamlined, more cost-effective to run at scale, and more elastic with the low latency that you expect. Each broker node can provide up to 3x more throughput per broker, scale up to 20x faster, and recover 90% quicker compared to standard Apache Kafka brokers. The workload simulation workbench for Amazon MSK Express broker facilitates systematic experimentation with consistent, repeatable results. You can use the workbench for multiple use cases like production capacity planning, progressive training to prepare developers for Apache Kafka operations with increasing complexity, and architecture validation to prove streaming designs and compare different approaches before making production commitments.

Architecture overview

The workbench creates an isolated Apache Kafka testing environment in your AWS account. It deploys a private subnet where consumer and producer applications run as containers, connects to a private MSK Express broker and monitors for performance metrics and visibility. This architecture mirrors the production deployment pattern for experimentation. The following image describes this architecture using AWS services.
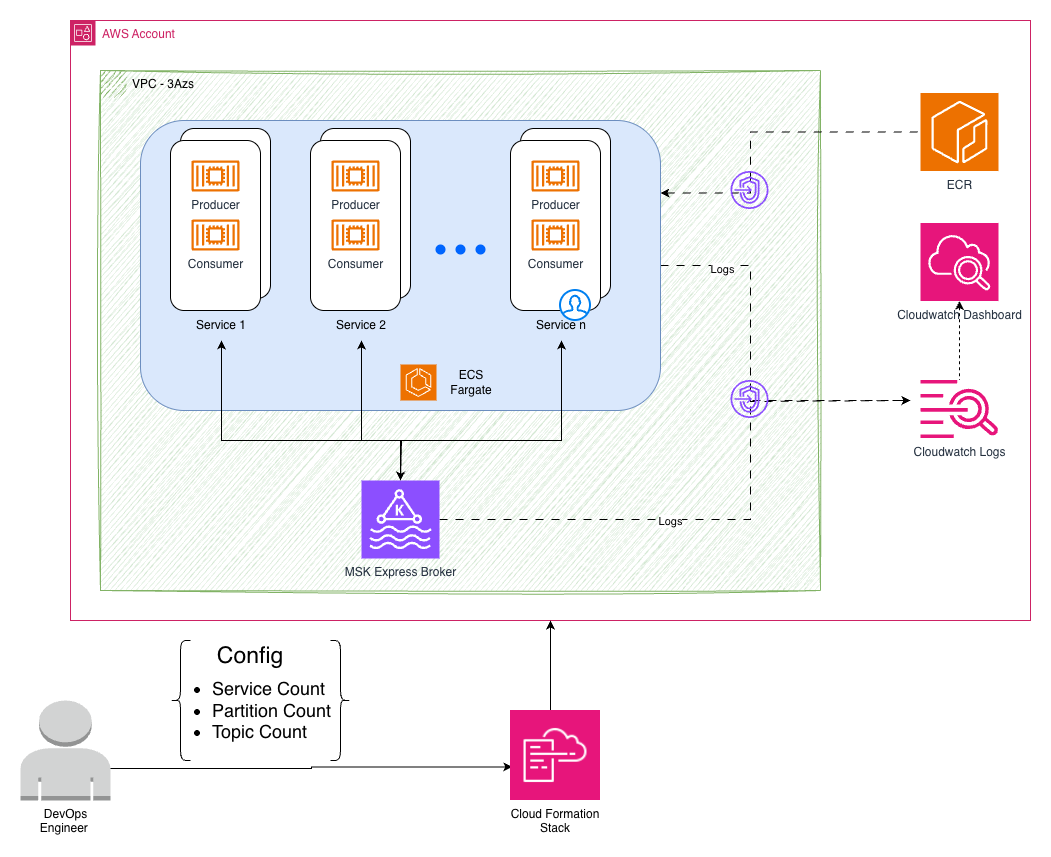
MSK Workload SImulator WorkBench Architecture Diagram

This architecture is deployed using the following AWS services:

Amazon Elastic Container Service (Amazon ECS) generate configurable workloads with Java-based producers and consumers, simulating various real-world scenarios through different message sizes and throughput patterns.

Amazon MSK Express Cluster runs Apache Kafka 3.9.0 on Graviton-based instances with hands-free storage management and enhanced performance characteristics.

Dynamic Amazon CloudWatch Dashboards automatically adapt to your configuration, displaying real-time throughput, latency, and resource utilization across different test scenarios.

Secure Amazon Virtual Private Cloud (Amazon VPC) Infrastructure provides private subnets across three Availability Zones with VPC endpoints for secure service communication.

Configuration-driven testing

The workbench provides different configuration options for your Apache Kafka testing environment, so you can customize instance types, broker count, topic distribution, message characteristics, and ingress rate. You can adjust the number of topics, partitions per topic, sender and receiver service instances, and message sizes to match your testing needs. These flexible configurations support two distinct testing approaches to validate different aspects of your Kafka deployment:

Approach 1: Workload validation (single deployment)

Test different workload patterns against the same MSK Express cluster configuration. This is useful for comparing partition strategies, message sizes, and load patterns.

// Fixed MSK Express Cluster Configuration
export const mskBrokerConfig: MskBrokerConfig = {
numberOfBrokers: 1, // 1 broker per AZ = 3 total brokers
instanceType: 'express.m7g.large', // MSK Express instance type
};

// Multiple Concurrent Workload Tests
export const deploymentConfig: DeploymentConfig = { services: [
{ topics: 2, partitionsPerTopic: 6, instances: 3, messageSizeBytes: 1024 }, // High-throughput scenario
{ topics: 1, partitionsPerTopic: 3, instances: 1, messageSizeBytes: 512 }, // Latency-optimized scenario
{ topics: 3, partitionsPerTopic: 4, instances: 2, messageSizeBytes: 4096 }, // Multi-topic scenario
]};

Approach 2: Infrastructure rightsizing (redeploy and compare)

Test different MSK Express cluster configurations by redeploying the workbench with different broker settings while keeping the same workload. This is recommended for rightsizing experiments and understanding the impact of vertical compared to horizontal scaling.

// Baseline: Deploy and test
export const mskBrokerConfig: MskBrokerConfig = { numberOfBrokers: 1, instanceType: 'express.m7g.large',};

// Vertical scaling: Redeploy with larger instances
export const mskBrokerConfig: MskBrokerConfig = { numberOfBrokers: 1,
instanceType: 'express.m7g.xlarge', // Larger instances
};

// Horizontal scaling: Redeploy with more brokers
export const mskBrokerConfig: MskBrokerConfig = {
numberOfBrokers: 2, // More brokers
instanceType: 'express.m7g.large',};

Each redeployment uses the same workload configuration, so you can isolate the impact of infrastructure changes on performance.

Workload testing scenarios (single deployment)

These scenarios test different workload patterns against the same MSK Express cluster:

Partition strategy impact testing

Scenario: You are debating the usage of fewer topics with many partitions compared to many topics with fewer partitions for your microservices architecture. You want to understand how partition count affects throughput and consumer group coordination before making this architectural decision.

const deploymentConfig = { services: [
{ topics: 1, partitionsPerTopic: 1, instances: 2, messageSizeBytes: 1024 }, // Baseline: minimal partitions
{ topics: 1, partitionsPerTopic: 10, instances: 2, messageSizeBytes: 1024 }, // Medium partitions
{ topics: 1, partitionsPerTopic: 20, instances: 2, messageSizeBytes: 1024 }, // High partitions
]};

Message size performance analysis

Scenario: Your application handles different types of events – small IoT sensor readings (256 bytes), medium user activity events (1 KB), and large document processing events (8KB). You must understand how message size impacts your overall system performance and if you should separate these into different topics or handle them together.

const deploymentConfig = { services: [
{ topics: 2, partitionsPerTopic: 6, instances: 3, messageSizeBytes: 256 }, // IoT sensor data
{ topics: 2, partitionsPerTopic: 6, instances: 3, messageSizeBytes: 1024 }, // User events
{ topics: 2, partitionsPerTopic: 6, instances: 3, messageSizeBytes: 8192 }, // Document events
]};

Load testing and scaling validation

Scenario: You expect traffic to vary significantly throughout the day, with peak loads requiring 10× more processing capacity than off-peak hours. You want to validate how your Apache Kafka topics and partitions handle different load levels and understand the performance characteristics before production deployment.

const deploymentConfig = { services: [
{ topics: 2, partitionsPerTopic: 6, instances: 1, messageSizeBytes: 1024 }, // Off-peak load simulation
{ topics: 2, partitionsPerTopic: 6, instances: 5, messageSizeBytes: 1024 }, // Medium load simulation
{ topics: 2, partitionsPerTopic: 6, instances: 10, messageSizeBytes: 1024 }, // Peak load simulation
]};

Infrastructure rightsizing experiments (redeploy and compare)

These scenarios help you understand the impact of different MSK Express cluster configurations by redeploying the workbench with different broker settings:

MSK broker rightsizing analysis

Scenario: You deploy a cluster with basic configuration and put load on it to establish baseline performance. Then you want to experiment with different broker configurations to see the effect of vertical scaling (larger instances) and horizontal scaling (more brokers) to find the right cost-performance balance for your production deployment.

Step 1: Deploy with baseline configuration

// Initial deployment: Basic configuration
export const mskBrokerConfig: MskBrokerConfig = {
numberOfBrokers: 1, // 3 total brokers (1 per AZ)
instanceType: 'express.m7g.large',};export const deploymentConfig: DeploymentConfig = { services: [ { topics: 2, partitionsPerTopic: 6, instances: 3, messageSizeBytes: 1024 }, ]};

Step 2: Redeploy with vertical scaling

// Redeploy: Test vertical scaling impact
export const mskBrokerConfig: MskBrokerConfig = {
numberOfBrokers: 1, // Same broker count
instanceType: 'express.m7g.xlarge', // Larger instances
};

// Keep same workload configuration to compare results

Step 3: Redeploy with horizontal scaling

// Redeploy: Test horizontal scaling impact
export const mskBrokerConfig: MskBrokerConfig = {
numberOfBrokers: 2, // 6 total brokers (2 per AZ)
instanceType: 'express.m7g.large', // Back to original size
};

// Keep same workload configuration to compare results

This rightsizing approach helps you understand how broker configuration changes affect the same workload, so you can improve both performance and cost for your specific requirements.

Performance insights

The workbench provides detailed insights into your Apache Kafka configurations through monitoring and analytics, creating a CloudWatch dashboard that adapts to your configuration. The dashboard starts with a configuration summary showing your MSK Express cluster details and workbench service configurations, helping you to understand what you’re testing. The following image shows the dashboard configuration summary:

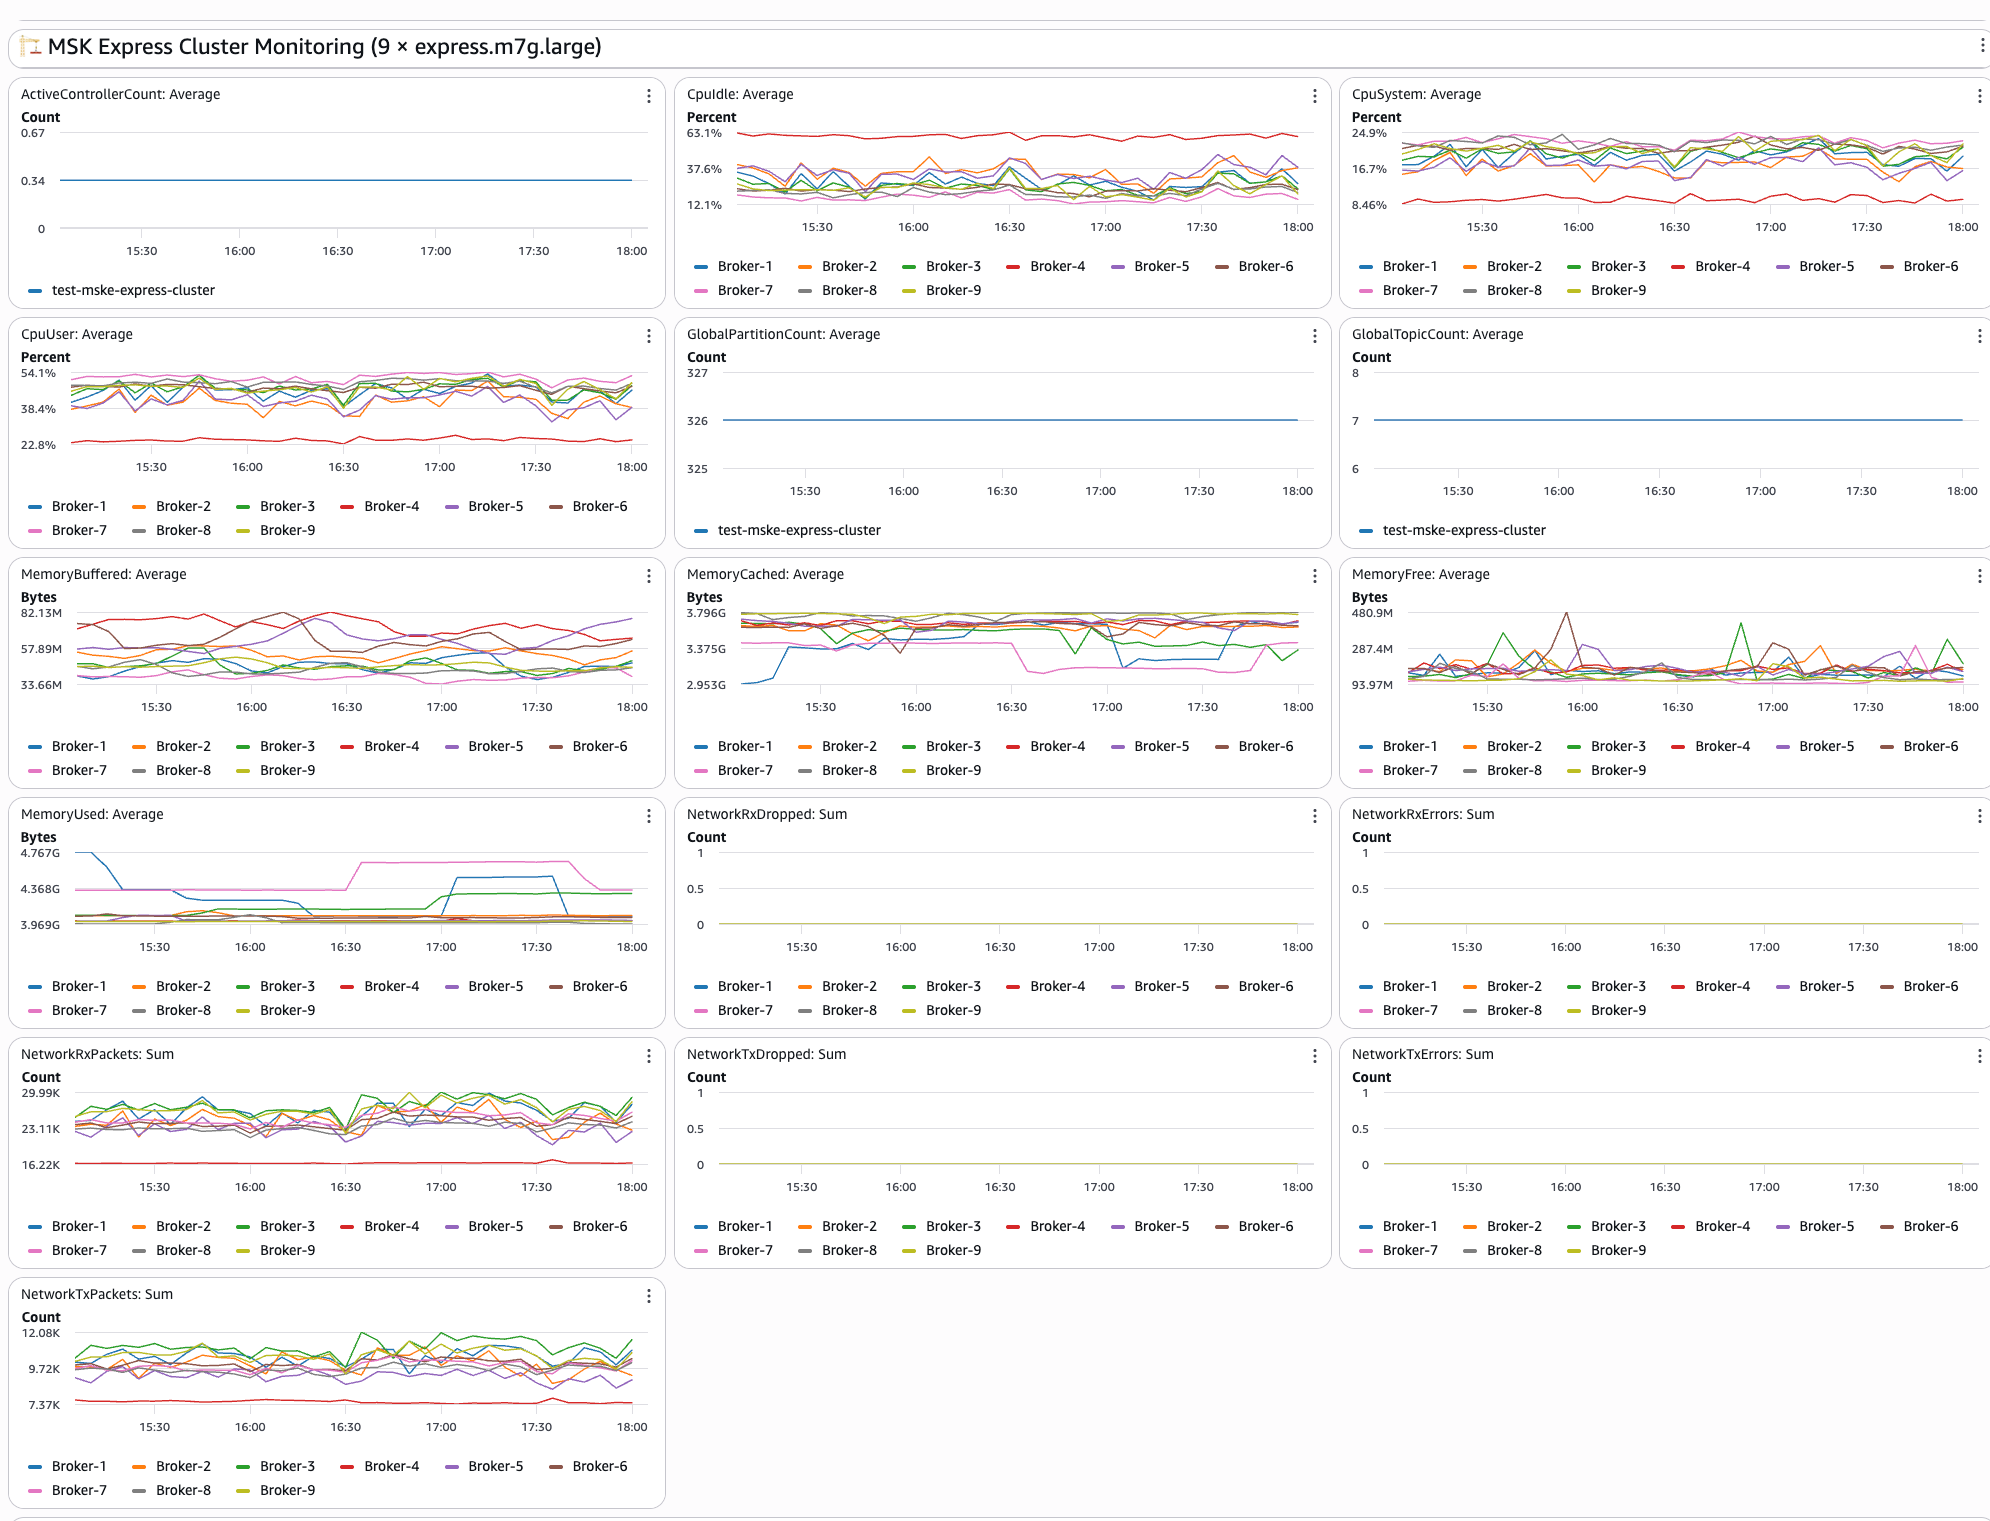
The second section of dashboard shows real-time MSK Express cluster metrics including:

  • Broker performance: CPU utilization and memory usage across brokers in your cluster
  • Network activity: Monitor bytes in/out and packet counts per broker to understand network utilization patterns
  • Connection monitoring: Displays active connections and connection patterns to help identify potential bottlenecks
  • Resource utilization: Broker-level resource tracking provides insights into overall cluster health

The following image shows the MSK cluster monitoring dashboard:
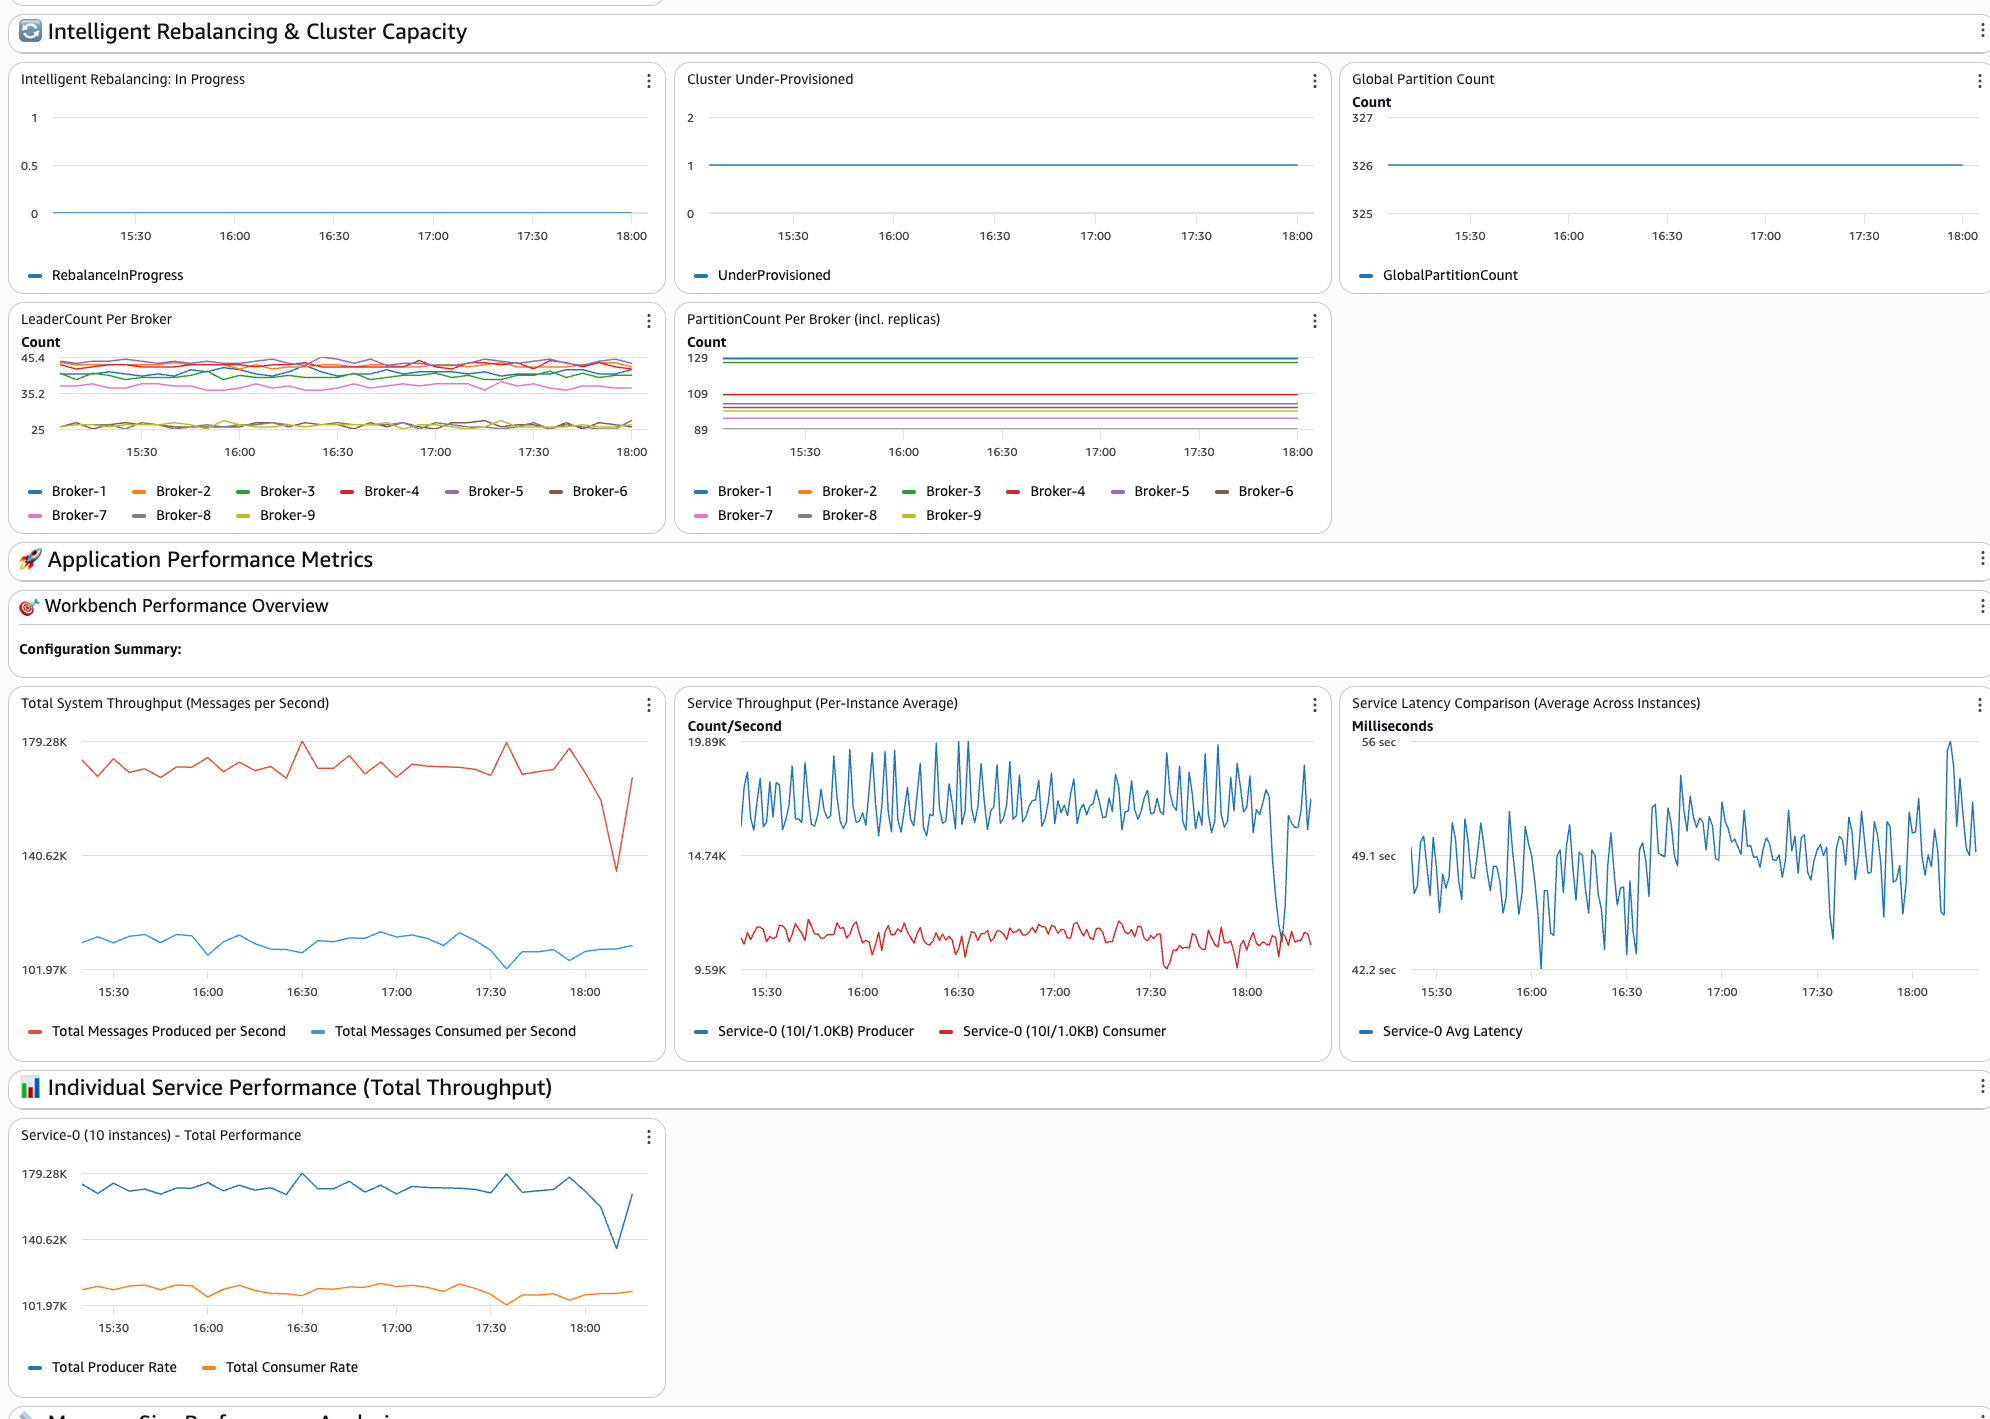
The third section of the dashboard shows the Intelligent Rebalancing and Cluster Capacity insights showing:

  • Intelligent rebalancing: in progress: Shows whether a rebalancing operation is currently in progress or has occurred in the past. A value of 1 indicates that rebalancing is actively running, while 0 means that the cluster is in a steady state.
  • Cluster under-provisioned: Indicates whether the cluster has insufficient broker capacity to perform partition rebalancing. A value of 1 means that the cluster is under-provisioned and Intelligent Rebalancing can’t redistribute partitions until more brokers are added or the instance type is upgraded.
  • Global partition count: Displays the total number of unique partitions across all topics in the cluster, excluding replicas. Use this to track partition growth over time and validate your deployment configuration.
  • Leader count per broker: Shows the number of leader partitions assigned to each broker. An uneven distribution indicates partition leadership skew, which can lead to hotspots where certain brokers handle disproportionate read/write traffic.
  • Partition count per broker: Shows the total number of partition replicas hosted on each broker. This metric includes both leader and follower replicas and is key to identifying replica distribution imbalances across the cluster.

The following image shows the Intelligent Rebalancing and Cluster Capacity section of the dashboard:
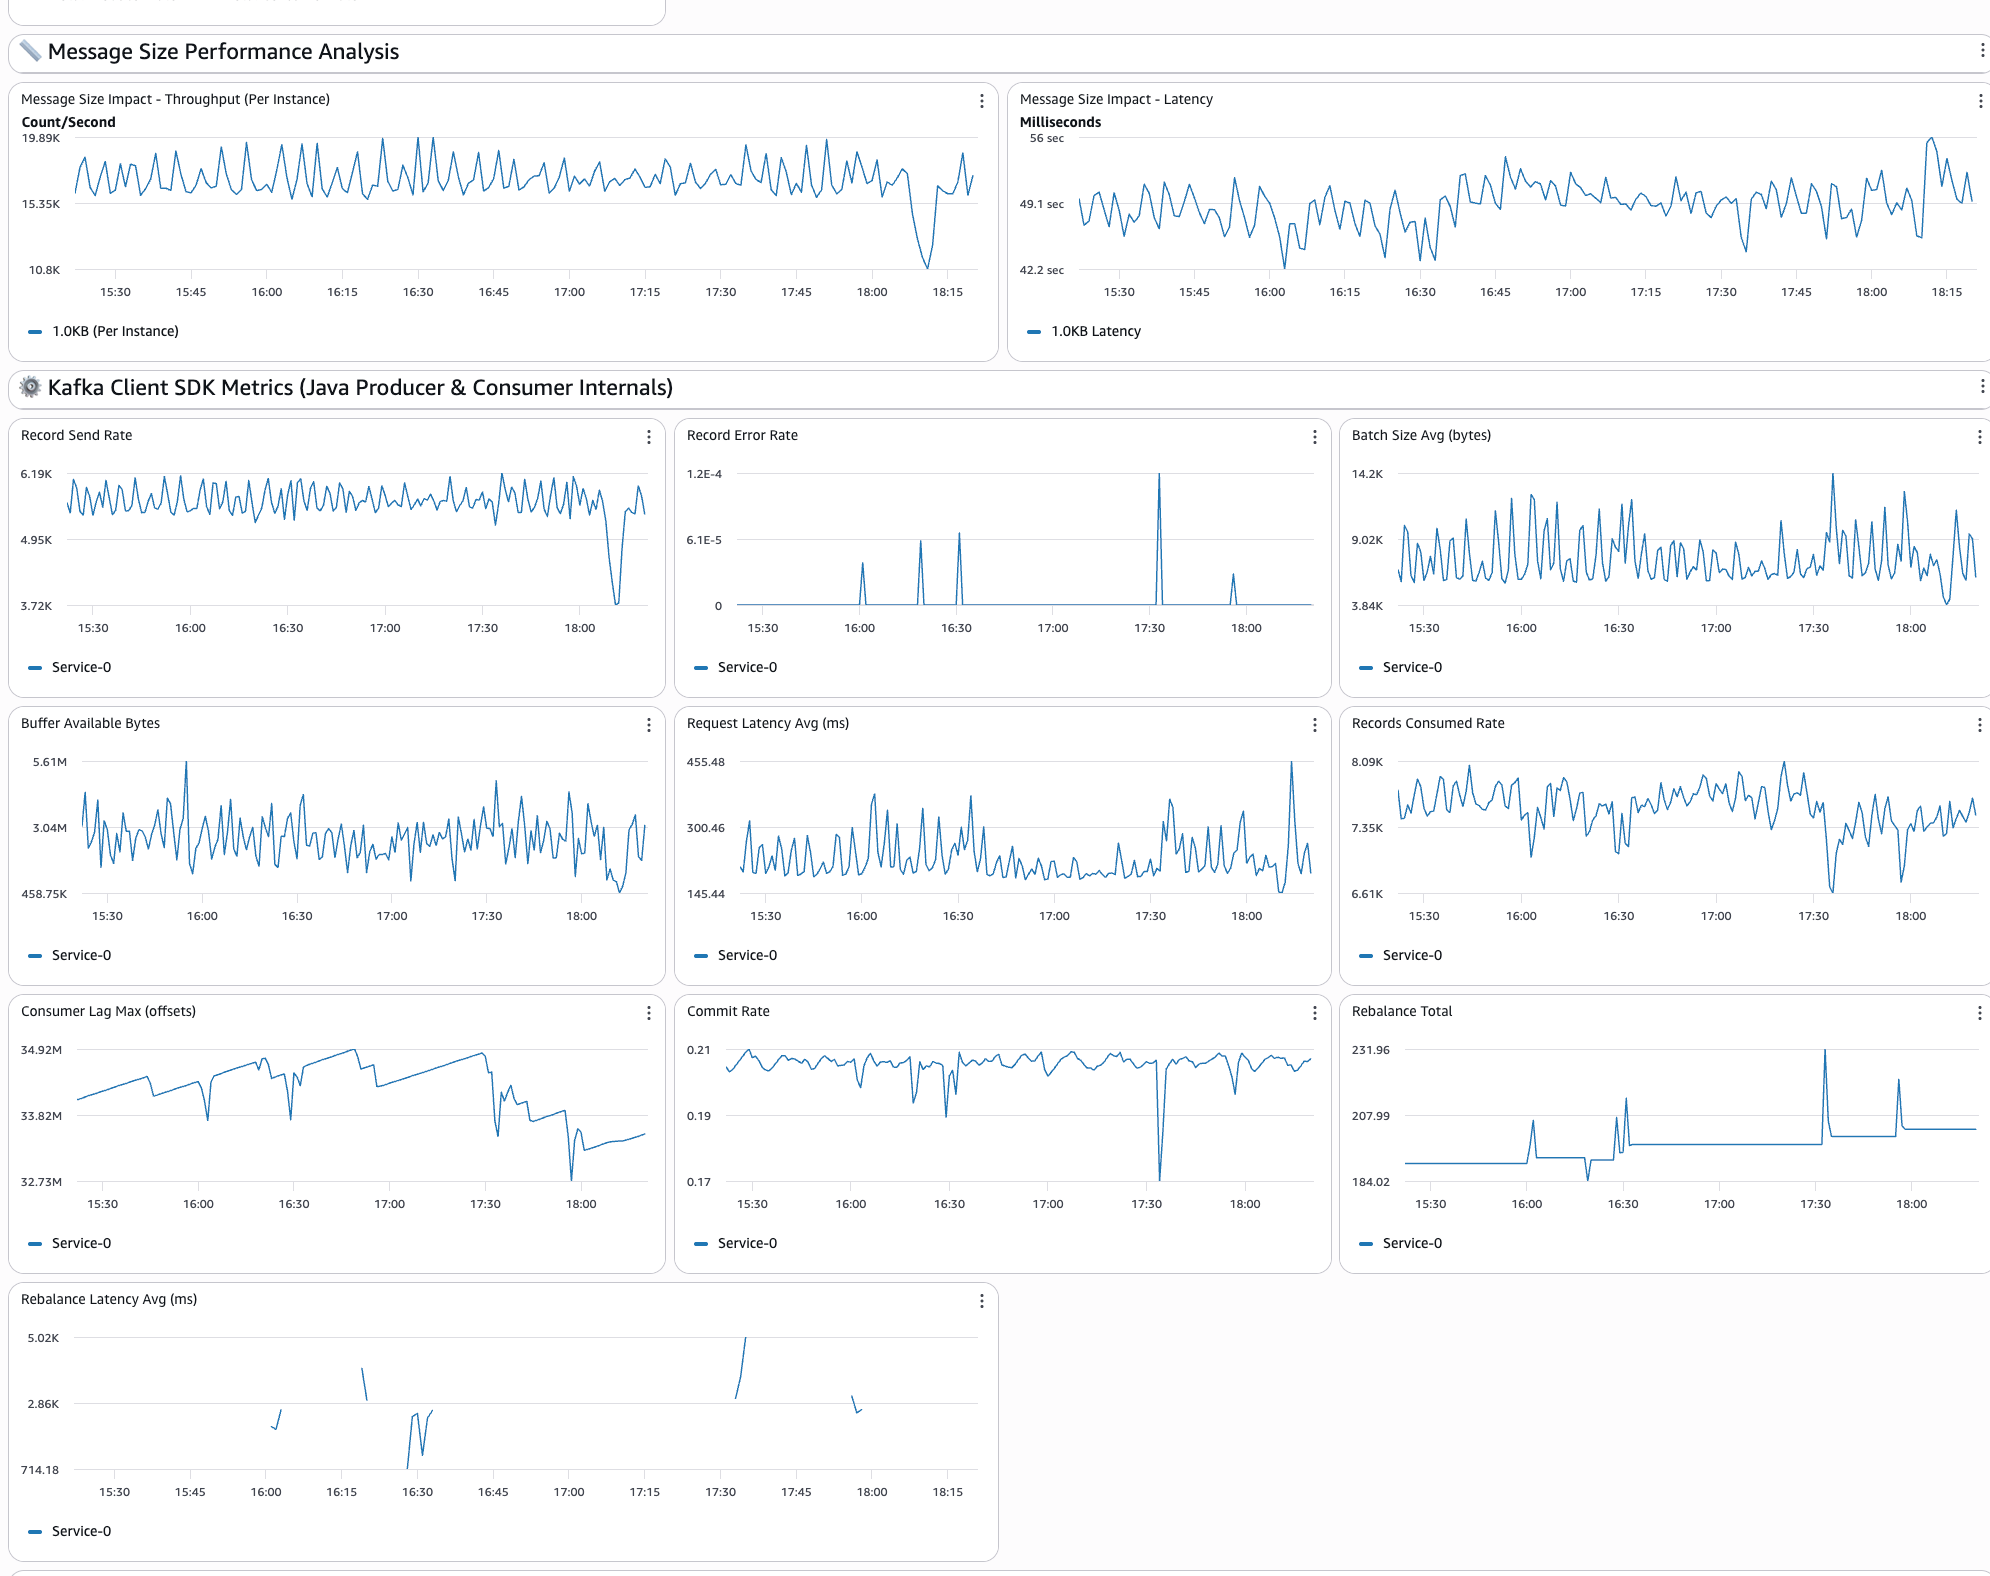
The fourth section of the dashboard shows the application-level insights showing:

  • System throughput: Displays the total number of messages per second across services, giving you a complete view of system performance
  • Service comparisons: Performs side-by-side performance analysis of different configurations to understand which approaches fit
  • Individual service performance: Each configured service has dedicated throughput tracking widgets for detailed analysis
  • Latency analysis: The end-to-end message delivery times and latency comparisons across different service configurations
  • Message size impact: Performance analysis across different payload sizes helps you understand how message size affects overall system behavior

The following image shows the application performance metrics section of the dashboard:
Getting started

This section walks you through setting up and deploying the workbench in your AWS environment. You will configure the necessary prerequisites, deploy the infrastructure using AWS CDK, and customize your first test.

Prerequisites

You can deploy the solution from the GitHub Repo. You can clone it and run it on your AWS environment. To deploy the artifacts, you will require:

  • AWS account with administrative credentials configured for creating AWS resources.
  • AWS Command Line Interface (AWS CLI) must be configured with appropriate permissions for AWS resource management.
  • AWS Cloud Development Kit (AWS CDK) should be installed globally using npm install -g aws-cdk for infrastructure deployment.
  • Node.js version 20.9 or higher is required, with version 22+ recommended.
  • Docker engine must be installed and running locally as the CDK builds container images during deployment. Docker daemon should be running and accessible to CDK for building the workbench application containers.

Deployment

# Clone the workbench repository
git clone https://github.com/aws-samples/sample-simulation-workbench-for-msk-express-brokers.git

# Install dependencies and build
npm install 
npm run build

# Bootstrap CDK (first time only per account/region)
cd cdk 
npx cdk bootstrap

# Synthesize CloudFormation template (optional verification step)
npx cdk synth

# Deploy to AWS (creates infrastructure and builds containers)
npx cdk deploy

After deployment is completed, you will receive a CloudWatch dashboard URL to monitor the workbench performance in real-time.You can also deploy multiple isolated instances of the workbench in the same AWS account for different teams, environments, or testing scenarios. Each instance operates independently with its own MSK cluster, ECS services, and CloudWatch dashboards.To deploy additional instances, modify the Environment Configuration in cdk/lib/config.ts:

// Instance 1: Development team
export const AppPrefix = 'mske';export const EnvPrefix = 'dev';

// Instance 2: Staging environment (separate deployment)
export const AppPrefix = 'mske';export const EnvPrefix = 'staging';

// Instance 3: Team-specific testing (separate deployment)
export const AppPrefix = 'team-alpha';export const EnvPrefix = 'test';

Each combination of AppPrefix and EnvPrefix creates completely isolated AWS resources so that multiple teams or environments can use the workbench simultaneously without conflicts.

Customizing your first test

You can edit the configuration file located at folder “cdk/lib/config-types.ts” to define your testing scenarios and run the deployment. It is preconfigured with the following configuration:

export const deploymentConfig: DeploymentConfig = { services: [
// Start with a simple baseline test
{ topics: 1, partitionsPerTopic: 3, instances: 1, messageSizeBytes: 1024 },

// Add a comparison scenario
{ topics: 1, partitionsPerTopic: 6, instances: 1, messageSizeBytes: 1024 }, ]};

Best practices

Following a structured approach to benchmarking ensures that your results are reliable and actionable. These best practices will help you isolate performance variables and build a clear understanding of how each configuration change affects your system’s behavior. Begin with single-service configurations to establish baseline performance:

const deploymentConfig = { services: [ { topics: 1, partitionsPerTopic: 3, instances: 1, messageSizeBytes: 1024 } ]};

After you understand the baseline, add comparison scenarios.

Change one variable at a time

For clear insights, modify only one parameter between services:

const deploymentConfig = { services: [
{ topics: 1, partitionsPerTopic: 3, instances: 1, messageSizeBytes: 1024 }, // Baseline
{ topics: 1, partitionsPerTopic: 6, instances: 1, messageSizeBytes: 1024 }, // More partitions
{ topics: 1, partitionsPerTopic: 12, instances: 1, messageSizeBytes: 1024 }, // Even more partitions
]};

This approach helps you understand the impact of specific configuration changes.

Important considerations and limitations

Before relying on workbench results for production decisions, it is important to understand the tool’s intended scope and boundaries. The following considerations will help you set appropriate expectations and make the most effective use of the workbench in your planning process.

Performance testing disclaimer

The workbench is designed as an educational and sizing estimation tool to help teams prepare for MSK Express production deployments. While it provides valuable insights into performance characteristics:

  • Results can vary based on your specific use cases, network conditions, and configurations
  • Use workbench results as guidance for initial sizing and planning
  • Conduct comprehensive performance validation with your actual workloads in production-like environments before final deployment

Recommended usage approach

Production readiness training – Use the workbench to prepare teams for MSK Express capabilities and operations.

Architecture validation – Test streaming architectures and performance expectations using MSK Express enhanced performance characteristics.

Capacity planning – Use MSK Express streamlined sizing approach (throughput-based rather than storage-based) for initial estimates.

Team preparation – Build confidence and expertise with production Apache Kafka implementations using MSK Express.

Conclusion

In this post, we showed how the workload simulation workbench for Amazon MSK Express Broker supports learning and preparation for production deployments through configurable, hands-on testing and experiments. You can use the workbench to validate configurations, build expertise, and improve performance before production deployment. If you’re preparing for your first Apache Kafka deployment, training a team, or improving existing architectures, the workbench provides practical experience and insights needed for success. Refer to Amazon MSK documentation – Complete MSK Express documentation, best practices, and sizing guidance for more information.

About the authors

Manu MishraManu Mishra is a Senior Solutions Architect at AWS with over 18 years of experience in the software industry, specializing in artificial intelligence, data and analytics, and security. His expertise spans strategic oversight and hands-on technical leadership, where he reviews and guides the work of both internal and external customers. Manu collaborates with AWS customers to shape technical strategies that drive impactful business outcomes, providing alignment between technology and organizational goals.

Manu Mishra Ramesh Chidirala is a Senior Solutions Architect at Amazon Web Services with over two decades of technology leadership experience in architecture and digital transformation, helping customers align business strategy and technical execution. He specializes in designing innovative, AI-powered, cost-efficient serverless event-driven architectures and has extensive experience architecting secure, scalable, and resilient cloud solutions for enterprise customers.

Cryptomining campaign targeting Amazon EC2 and Amazon ECS

Post Syndicated from Kyle Koeller original https://aws.amazon.com/blogs/security/cryptomining-campaign-targeting-amazon-ec2-and-amazon-ecs/

Amazon GuardDuty and our automated security monitoring systems identified an ongoing cryptocurrency (crypto) mining campaign beginning on November 2, 2025. The operation uses compromised AWS Identity and Access Management (IAM) credentials to target Amazon Elastic Container Service (Amazon ECS) and Amazon Elastic Compute Cloud (Amazon EC2). GuardDuty Extended Threat Detection was able to correlate signals across these data sources to raise a critical severity attack sequence finding. Using the massive, advanced threat intelligence capability and existing detection mechanisms of Amazon Web Services (AWS), GuardDuty proactively identified this ongoing campaign and quickly alerted customers to the threat. AWS is sharing relevant findings and mitigation guidance to help customers take appropriate action on this ongoing campaign.

It’s important to note that these actions don’t take advantage of a vulnerability within an AWS service but rather require valid credentials that an unauthorized user uses in an unintended way. Although these actions occur in the customer domain of the shared responsibility model, AWS recommends steps that customers can use to detect, prevent, or reduce the impact of such activity.

Understanding the crypto mining campaign

The recently detected crypto mining campaign employed a novel persistence technique designed to disrupt incident response and extend mining operations. The ongoing campaign was originally identified when GuardDuty security engineers discovered similar attack techniques being used across multiple AWS customer accounts, indicating a coordinated campaign targeting customers using compromised IAM credentials.

Operating from an external hosting provider, the threat actor quickly enumerated Amazon EC2 service quotas and IAM permissions before deploying crypto mining resources across Amazon EC2 and Amazon ECS. Within 10 minutes of the threat actor gaining initial access, crypto miners were operational.

A key technique observed in this attack was the use of ModifyInstanceAttribute with disable API termination set to true, forcing victims to re-enable API termination before deleting the impacted resources. Disabling instance termination protection adds an additional consideration for incident responders and can disrupt automated remediation controls. The threat actor’s scripted use of multiple compute services, in combination with emerging persistence techniques, represents an advancement in crypto mining persistence methodologies that security teams should be aware of.

The multiple detection capabilities of GuardDuty successfully identified the malicious activity through EC2 domain/IP threat intelligence, anomaly detection, and Extended Threat Detection EC2 attack sequences. GuardDuty Extended Threat Detection was able to correlate signals as an AttackSequence:EC2/CompromisedInstanceGroup finding.

Indicators of compromise (IoCs)

Security teams should monitor for the following indicators to identify this crypto mining campaign. Threat actors frequently modify their tactics and techniques, so these indicators might evolve over time:

  • Malicious container image – The Docker Hub image yenik65958/secret, created on October 29, 2025, with over 100,000 pulls, was used to deploy crypto miners to containerized environments. This malicious image contained a SBRMiner-MULTI binary for crypto mining. This specific image has been taken down from Docker Hub, but threat actors might deploy similar images under different names.
  • Automation and toolingAWS SDK for Python (Boto3) user agent patterns indicating Python-based automation scripts were used across the entire attack chain.
  • Crypto mining domains: asia[.]rplant[.]xyz, eu[.]rplant[.]xyz, and na[.]rplant[.]xyz.
  • Infrastructure naming patterns – Auto scaling groups followed specific naming conventions: SPOT-us-east-1-G*-* for spot instances and OD-us-east-1-G*-* for on-demand instances, where G indicates the group number.

Attack chain analysis

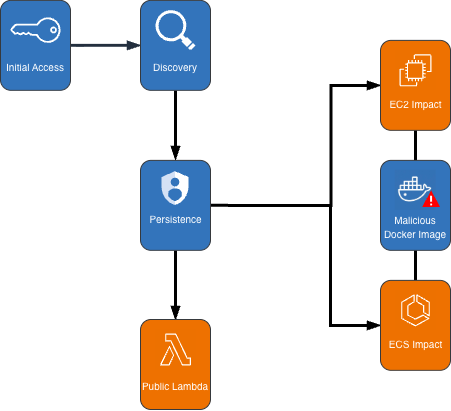
The crypto mining campaign followed a systematic attack progression across multiple phases. Sensitive fields in this post were given fictitious values to protect personally identifiable information (PII).

Cryptocurrency Mining Campaign Diagram

Figure 1: Cryptocurrency mining campaign diagram

Initial access, discovery, and attack preparation

The attack began with compromised IAM user credentials possessing admin-like privileges from an anomalous network and location, triggering GuardDuty anomaly detection findings. During the discovery phase, the attacker systematically probed customer AWS environments to understand what resources they could deploy. They checked Amazon EC2 service quotas (GetServiceQuota) to determine how many instances they could launch, then tested their permissions by calling the RunInstances API multiple times with the DryRun flag enabled.

The DryRun flag was a deliberate reconnaissance tactic that allowed the actor to validate their IAM permissions without actually launching instances, avoiding costs and reducing their detection footprint. This technique demonstrates the threat actor was validating their ability to deploy crypto mining infrastructure before acting. Organizations that don’t typically use DryRun flags in their environments should consider monitoring for this API pattern as an early warning indicator of compromise. AWS CloudTrail logs can be used with Amazon CloudWatch alarms, Amazon EventBridge, or your third-party tooling to alert on these suspicious API patterns.

The threat actor called two APIs to create IAM roles as part of their attack infrastructure: CreateServiceLinkedRole to create a role for auto scaling groups and CreateRole to create a role for AWS Lambda. They then attached the AWSLambdaBasicExecutionRole policy to the Lambda role. These two roles were integral to the impact and persistence stages of the attack.

Amazon ECS impact

The threat actor first created dozens of ECS clusters across the environment, sometimes exceeding 50 ECS clusters in a single attack. They then called RegisterTaskDefinition with a malicious Docker Hub image yenik65958/secret:user. With the same string used for the cluster creation, the actor then created a service, using the task definition to initiate crypto mining on ECS AWS Fargate nodes. The following is an example of API request parameters for RegisterTaskDefinition with a maximum CPU allocation of 16,384 units.

{   
    "dryrun": false,   
    "requiresCompatibilities": ["FARGATE"],   
    "cpu": 16384,   
    "containerDefinitions": [     
        {       
            "name": "a1b2c3d4e5",       
            "image": "yenik65958/secret:user",       
            "cpu": 0,       
            "command": []     
        }   
    ],   
    "networkMode": "awsvpc",   
    "family": "a1b2c3d4e5",   
    "memory": 32768 
}

Using this task definition, the threat actor called CreateService to launch ECS Fargate tasks with a desired count of 10.

{   
    "dryrun": false,   
    "capacityProviderStrategy": [     
        {       
            "capacityProvider": "FARGATE",       
            "weight": 1,       
            "base": 0     
        },     
        {       
            "capacityProvider": "FARGATE_SPOT",       
            "weight": 1,       
            "base": 0     
        }   
    ],   
    "desiredCount": 10 
}

Figure 2: Contents of the cryptocurrency mining script within the malicious image

Figure 2: Contents of the cryptocurrency mining script within the malicious image

The malicious image (yenik65958/secret:user) was configured to execute run.sh after it has been deployed. run.sh runs randomvirel mining algorithm with the mining pools: asia|eu|na[.]rplant[.]xyz:17155. The flag nproc --all indicates that the script should use all processor cores.

Amazon EC2 impact

The actor created two launch templates (CreateLaunchTemplate) and 14 auto scaling groups (CreateAutoScalingGroup) configured with aggressive scaling parameters, including a maximum size of 999 instances and desired capacity of 20. The following example of request parameters from CreateLaunchTemplate shows the UserData was supplied, instructing the instances to begin crypto mining.

{   
    "CreateLaunchTemplateRequest": {       
        "LaunchTemplateName": "T-us-east-1-a1b2",       
        "LaunchTemplateData": {           
            "UserData": "<sensitiveDataRemoved>",           
            "ImageId": "ami-1234567890abcdef0",           
            "InstanceType": "c6a.4xlarge"       
        },       
        "ClientToken": "a1b2c3d4-5678-90ab-cdef-EXAMPLE11111"   
    } 
}

The threat actor created auto scaling groups using both Spot and On-Demand Instances to make use of both Amazon EC2 service quotas and maximize resource consumption.

Spot Instance groups:

  • Targeted high performance GPU and machine learning (ML) instances (g4dn, g5, g5, p3, p4d, inf1)
  • Configured with 0% on-demand allocation and capacity-optimized strategy
  • Set to scale from 20 to 999 instances

On-Demand Instance groups:

  • Targeted compute, memory, and general-purpose instances (c5, c6i, r5, r5n, m5a, m5, m5n).
  • Configured with 100% on-demand allocation
  • Also set to scale from 20 to 999 instances

After exhausting auto scaling quotas, the actor directly launched additional EC2 instances using RunInstances to consume the remaining EC2 instance quota.

Persistence

An interesting technique observed in this campaign was the threat actor’s use of ModifyInstanceAttribute across all launched EC2 instances to disable API termination. Although instance termination protection prevents accidental termination of the instance, it adds an additional consideration for incident response capabilities and can disrupt automated remediation controls. The following example shows request parameters for the API ModifyInstanceAttribute.

{     
    "disableApiTermination": {         
        "value": true     
    },     
    "instanceId": "i-1234567890abcdef0" 
}

After all mining workloads were deployed, the actor created a Lambda function with a configuration that bypasses IAM authentication and creates a public Lambda endpoint. The threat actor then added a permission to the Lambda function that allows the principal to invoke the function. The following examples show CreateFunctionUrlConfig and AddPermission request parameters.

CreateFunctionUrlConfig:

{     
    "authType": "NONE",     
    "functionName": "generate-service-a1b2c3d4" 
}

AddPermission:

{     
    "functionName": "generate-service-a1b2c3d4",     
    "functionUrlAuthType": "NONE",    
    "principal": "*",     
    "statementId": "FunctionURLAllowPublicAccess",     
    "action": "lambda:InvokeFunctionUrl" 
}

The threat actor concluded the persistence stage by creating an IAM user user-x1x2x3x4 and attaching the IAM policy AmazonSESFullAccess (CreateUser, AttachUserPolicy). They also created an access key and login profile for that user (CreateAccessKey, CreateLoginProfile). Based on the SES role that was attached to the user, it appears the threat actor was attempting Amazon Simple Email Service (Amazon SES) phishing.

To prevent public Lambda URLs from being created, organizations can deploy service control policies (SCPs) that deny creation or updating of Lambda URLs with an AuthType of “NONE”.

{   
    "Version": "2012-10-17",   
    "Statement": [     
        {       
            "Effect": "Deny",       
            "Action": [         
                "lambda:CreateFunctionUrlConfig",         
                "lambda:UpdateFunctionUrlConfig"       
            ],       
            "Resource": "arn:aws:lambda:*:*:function/*",       
            "Condition": {         
                "StringEquals": {           
                    "lambda:FunctionUrlAuthType": "NONE"         
                }       
            }     
        }   
    ] 
}

Detection methods using GuardDuty

The multilayered detection approach of GuardDuty proved highly effective in identifying all stages of the attack chain using threat intelligence, anomaly detection, and the recently launched Extended Threat Detection capabilities for EC2 and ECS.

Next, we walk through the details of these features and how you can deploy them to detect attacks such as these. You can enable GuardDuty foundational protection plan to receive alerts on crypto mining campaigns like the one described in this post. To further enhance detection capabilities, we highly recommend enabling GuardDuty Runtime Monitoring, which will extend finding coverage to system-level events on Amazon EC2, Amazon ECS, and Amazon Elastic Kubernetes Service (Amazon EKS).

GuardDuty EC2 findings

Threat intelligence findings for Amazon EC2 are part of the GuardDuty foundational protection plan, which will alert you to suspicious network behaviors involving your instances. These behaviors can include brute force attempts, connections to malicious or crypto domains, and other suspicious behaviors. Using third-party threat intelligence and internal threat intelligence, including active threat defense and MadPot, GuardDuty provides detection over the indicators in this post through the following findings: CryptoCurrency:EC2/BitcoinTool.B and CryptoCurrency:EC2/BitcoinTool.B!DNS.

GuardDuty IAM findings

The IAMUser/AnomalousBehavior findings spanning multiple tactic categories (PrivilegeEscalation, Impact, Discovery) showcase the ML capability of GuardDuty to detect deviations from normal user behavior. In the incident described in this post, the compromised credentials were detected due to the threat actor using them from an anomalous network and location and calling APIs that were unusual for the accounts.

GuardDuty Runtime Monitoring

GuardDuty Runtime Monitoring is an important component for Extended Threat Detection attack sequence correlation. Runtime Monitoring provides host level signals, such as operating system visibility, and extends detection coverage by analyzing system-level logs indicating malicious process execution at the host and container level, including the execution of crypto mining programs on your workloads. The CryptoCurrency:Runtime/BitcoinTool.B!DNS and CryptoCurrency:Runtime/BitcoinTool.B findings detect network connections to crypto-related domains and IPs, while the Impact:Runtime/CryptoMinerExecuted finding detects when a process running is associated with a cryptocurrency mining activity.

GuardDuty Extended Threat Detection

Launched at re:Invent 2025, AttackSequence:EC2/CompromisedInstanceGroup finding represents one of the latest Extended Threat Detection capabilities in GuardDuty. This feature uses AI and ML algorithms to automatically correlate security signals across multiple data sources to detect sophisticated attack patterns of EC2 resource groups. Although AttackSequences for EC2 are included in the GuardDuty foundational protection plan, we strongly recommend enabling Runtime Monitoring. Runtime Monitoring provides key insights and signals from compute environments, enabling detection of suspicious host-level activities and improving correlation of attack sequences. For AttackSequence:ECS/CompromisedCluster attack sequences, Runtime Monitoring is required to correlate container-level activity.

Monitoring and remediation recommendations

To protect against similar crypto mining attacks, AWS customers should prioritize strong identity and access management controls. Implement temporary credentials instead of long-term access keys, enforce multi-factor authentication (MFA) for all users, and apply least privilege to IAM principals limiting access to only required permissions. You can use AWS CloudTrail to log events across AWS services and combine logs into a single account to make them available to your security teams to access and monitor. To learn more, refer to Receiving CloudTrail log files from multiple accounts in the CloudTrail documentation.

Confirm GuardDuty is enabled across all accounts and Regions with Runtime Monitoring enabled for comprehensive coverage. Integrate GuardDuty with AWS Security Hub and Amazon EventBridge or third-party tooling to enable automated response workflows and rapid remediation of high-severity findings. Implement container security controls, including image scanning policies and monitoring for unusual CPU allocation requests in ECS task definitions. Finally, establish specific incident response procedures for crypto mining attacks, including documented steps to handle instances with disabled API termination—a technique used by this attacker to complicate remediation efforts.

If you believe your AWS account has been impacted by a crypto mining campaign, refer to remediation steps in the GuardDuty documentation: Remediating potentially compromised AWS credentials, Remediating a potentially compromised EC2 instance, and Remediating a potentially compromised ECS cluster.

To stay up to date on the latest techniques, visit the Threat Technique Catalog for AWS.


If you have feedback about this post, submit comments in the Comments section below. If you have questions about this post, contact AWS Support.

Kyle Koeller
Kyle Koeller

Kyle is a security engineer in the GuardDuty team with a focus on threat detection. He is passionate about cloud threat detection and offensive security, and he holds the following certifications: CompTIA Security+, PenTest+, CompTIA Network Vulnerability Assessment Professional, and SecurityX. When not working, Kyle enjoys spending his time in the gym and exploring New York City.

Architecting conversational observability for cloud applications

Post Syndicated from Anton Aleksandrov original https://aws.amazon.com/blogs/architecture/architecting-conversational-observability-for-cloud-applications/

Modern cloud applications are commonly built as a collection of loosely coupled microservices running on services like Amazon Elastic Kubernetes Service (Amazon EKS), Amazon Elastic Container Service (Amazon ECS), or AWS Lambda. This architecture gives engineering teams flexibility and scalability, but its inherently distributed nature also makes troubleshooting more difficult. When something breaks, engineers often find themselves digging through logs, events, and metrics scattered across different observability layers. With Kubernetes, for example, without a deep understanding of the service, troubleshooting can turn into a time-consuming effort to manually correlate information from different sources.

In this post, we walk through building a generative AI–powered troubleshooting assistant for Kubernetes. The goal is to give engineers a faster, self-service way to diagnose and resolve cluster issues, cut down Mean Time to Recovery (MTTR), and reduce the cycles experts spend finding the root cause of issues in complex distributed systems.

Overview

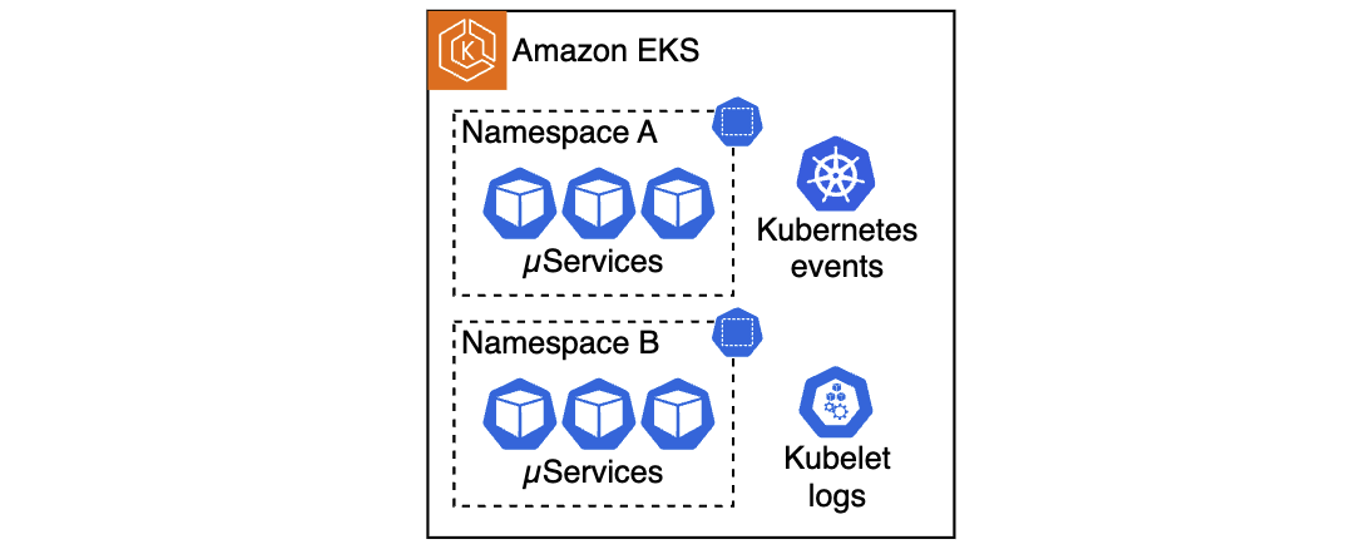
One of the challenges of architecting a modern cloud application is keeping observability intact across many moving pieces. Anyone who has ever tailed logs in one terminal while running kubectl describe and curl commands in another, knows how tedious this can get. Distributed systems are powerful, but they’re also complex. Kubernetes, for example, offers strong orchestration capabilities, yet troubleshooting inside a cluster often means navigating multiple layers of abstractions such as pods, nodes, networking, logs, and events. On top of that, the system generates a large volume of telemetry, including kubelet logs, application logs, cluster events, and metrics. Making sense of these layers requires both expertise on the system and application knowledge.

This skill gap shows up in the numbers. According to the 2024 Observability Pulse Report, 48% of organizations say that lack of team knowledge is their biggest challenge to observability in cloud-native environments. MTTR has also been going up for three years straight, with most teams (82%) saying it can take more than an hour to resolve production issues.

When something goes wrong and your applications start to fail for an unknown reason, engineers often must start stitching together signals from multiple sources to find the root cause. That can be tedious for specialists, and it gets worse when the issue is intermittent or spans across services. Often, multiple teams need to get involved – application engineers may not know Kubernetes well, while platform teams may not have deep insight into the applications. This can result in longer troubleshooting cycles, potentially degraded user experience, and pulling engineers away from planned work that drives business goals.

Figure 1. A multitude of telemetry sources in Kubernetes clusters
This is where generative artificial intelligence (AI) can help. Users can build an AI assistant that combines large language model (LLM)-driven analysis and guidance with existing telemetry data. This assistant enables engineers to troubleshoot issues faster, in a self-service way, without requiring every team to become Kubernetes experts. In the following sections, we show how to build such an assistant for Amazon EKS, however, keep in mind that a similar approach can be extended to other compute services like Amazon ECS or AWS Lambda.

Solution architecture

Architecting this AI-powered troubleshooting assistant consists of three primary parts:

  • Deployment approach selection: The solution supports two architectures – a traditional Retrieval-Augmented Generation (RAG)-based chatbot and a modern Strands-based agentic system that uses the Strands Agents SDK with EKS MCP Server integration for direct EKS API access.
  • Telemetry collection and storage: Collecting telemetry from various sources and storing it as vector embeddings in Amazon OpenSearch (RAG approach) or as 1024-dimensional embeddings in Amazon S3 Vectors (Strands approach).
  • Interactive troubleshooting interface: Building either a web-based chatbot that retrieves relevant telemetry and injects it into LLM prompts, or a Slack integrated multi-agent system that uses MCP tools for real-time Kubernetes diagnostics.

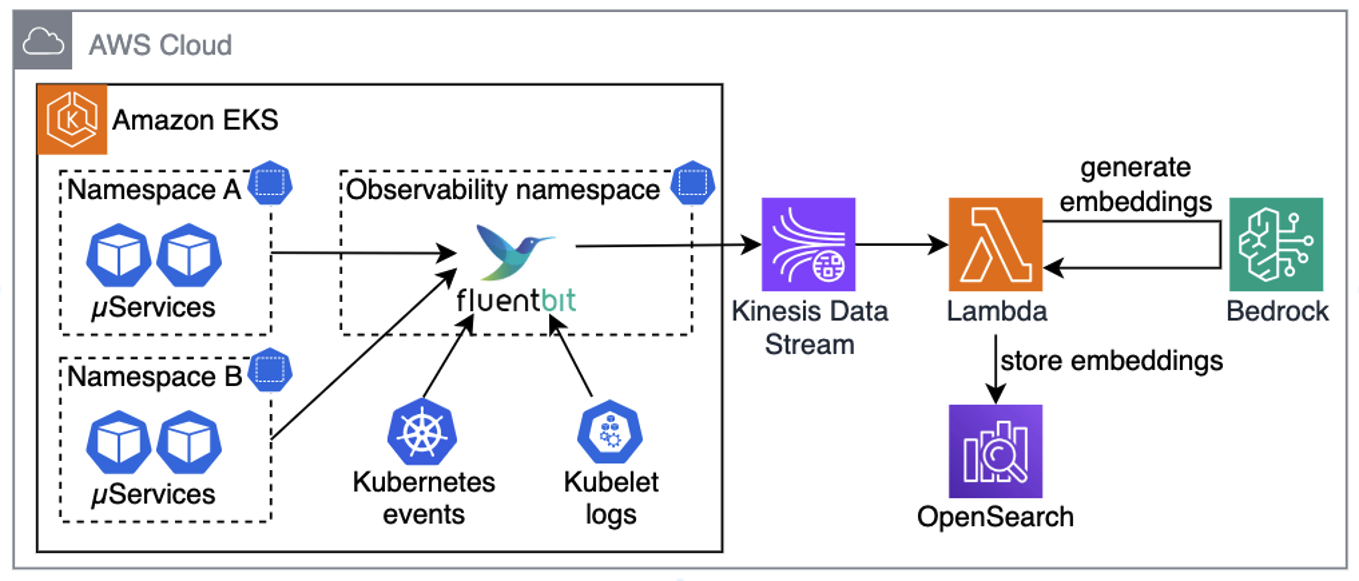
For this architecture walkthrough, we focus on the RAG-based approach. The first step is setting up a pipeline that can reliably collect, process, and store telemetry data. This pipeline aggregates telemetry from the relevant data sources, such as application logs, kubelet logs, and Kubernetes events. In Kubernetes environments, this can be done with a telemetry processor and forwarder, such as Fluent Bit, which streams telemetry into Amazon Kinesis Data Streams. On the receiving end, we use a Lambda function to normalize collected data, Amazon Bedrock to generate vector embeddings, and OpenSearch Serverless to store this embedded representation for efficient retrieval. Because these services are serverless, we can avoid the overhead of managing infrastructure and can focus on the troubleshooting workflow itself.

Figure 2. Collecting telemetry from sources, generating embeddings, and saving in OpenSearch
Pro tip: for better performance and cost-efficiency, your Lambda functions should use batching when ingesting data from Kinesis, generating embeddings, and storing them in OpenSearch.

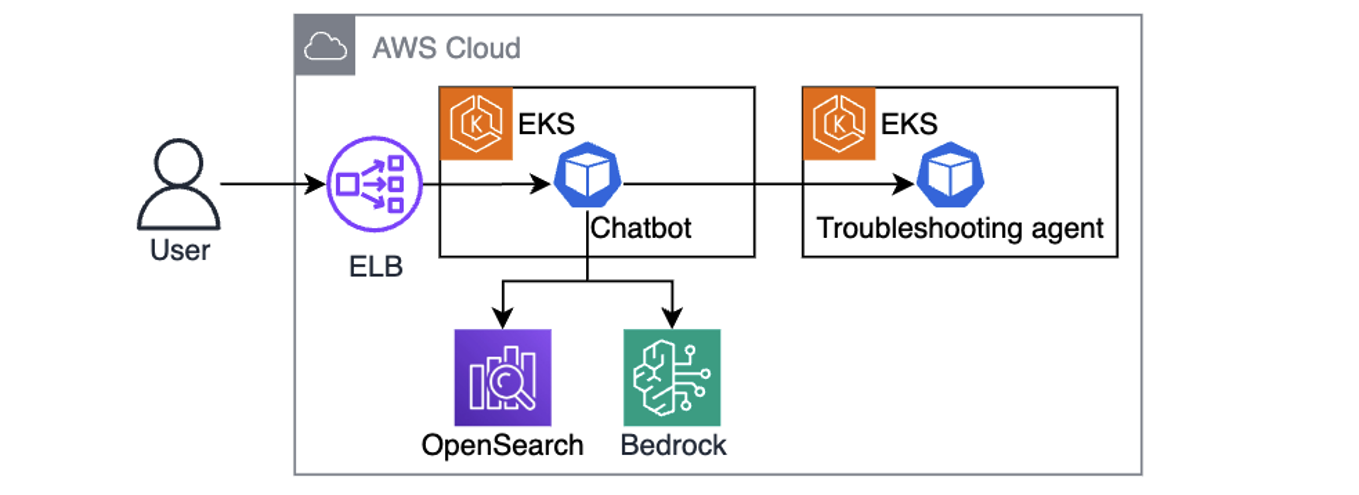
Once telemetry is collected, converted to embeddings, and stored in OpenSearch, the next step is building a chatbot that uses RAG. Using RAG means that when a user asks a question, the chatbot looks up semantically similar telemetry in OpenSearch, adds it to the prompt, and sends it to the LLM. Instead of generic answers, the model now has relevant telemetry and cluster-specific details it can use to generate useful next steps, such as precise kubectl commands for the troubleshooting assistant, as illustrated in the following diagram.

Figure 3. Chatbot is using user queries augmented with telemetry context to send kubectl commands to the troubleshooting assistant. 
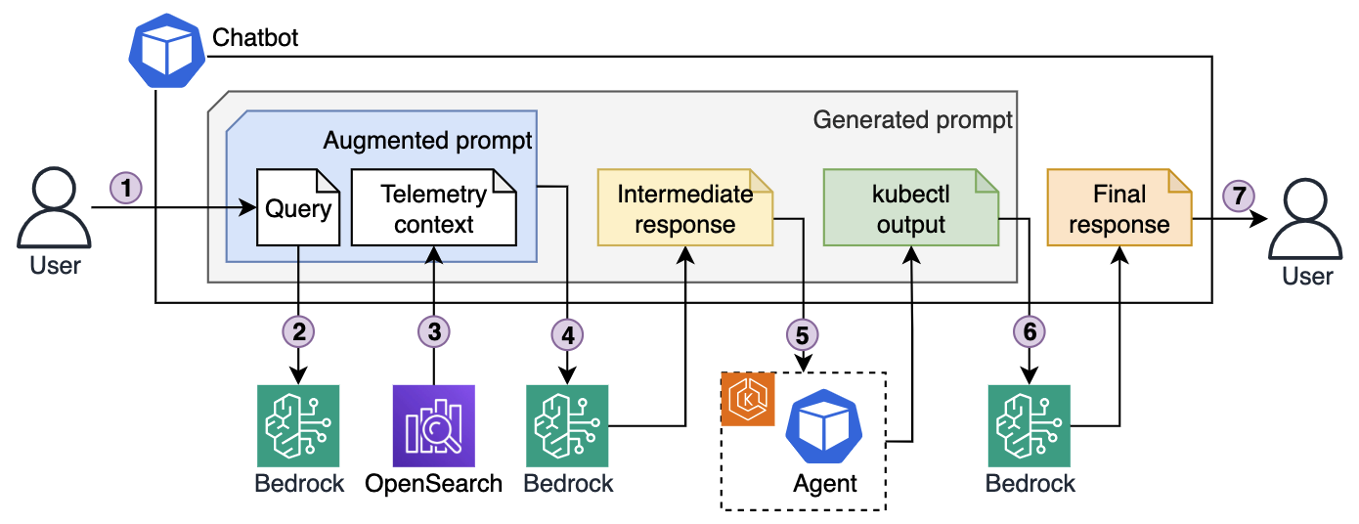
One powerful aspect of this design is its iterative nature. The chatbot hands instructions to a troubleshooting assistant running in the cluster, which executes a set of allowlisted, read-only kubectl commands. The output comes back to the LLM, which can decide whether it needs to investigate further (by asking the troubleshooting assistant to run more kubectl commands), or present a clear resolution path to the engineer. This cycle gradually builds a richer picture of the issue by combining historical telemetry with real-time cluster state to speed up root cause analysis.

Figure 4. Iterative troubleshooting process.
Here’s the end-to-end troubleshooting flow illustrated in the preceding diagram:

  1. An engineer enters a query into the chatbot interface, for example “My pod is stuck in pending state. Investigate.”
  2. The chatbot sends the query to Bedrock, which converts it into vector embeddings.
  3. Using those embeddings, the chatbot retrieves semantically matching telemetry that was previously stored in OpenSearch.
  4. The chatbot generates an augmented prompt, which contains both the original query and semantically relevant telemetry, and passes it to the LLM. The LLM responds with a list of kubectl commands to run for further diagnostics.
  5. The chatbot forwards those commands to the troubleshooting assistant running in the EKS cluster. The agent executes them with a service account that has read-only permissions, following the principle of least privilege, and sends the output back.
  6. Based on the output, the chatbot asks LLM to decide whether to continue investigation (by asking the agent to run more commands), or whether it has enough context to produce an answer.
  7. Once enough information has been gathered (investigation concluded), the chatbot composes a final prompt, including the query, telemetry, and investigation results, and asks the LLM for a final resolution, which it then returns to the engineer.

Example implementation

Use the example repo to deploy the solution in your AWS account. Follow the instructions in README.md for provisioning and testing the sample project using Terraform. Resources provisioned by the example project incur costs in your AWS account. Make sure to clean up the project as described in the README.md to avoid unexpected costs.

The repository provides two deployment architectures controlled by the deployment_type Terraform variable:

  1. RAG-based deployment (default): See the ./terraform/modules directory for the “ingestion-pipeline” module that creates a Kinesis Data Stream and Lambda function to generate embeddings using "amazon.titan-embed-test-v2:0" and store them in OpenSearch. The “agentic-chatbot” module handles the Gradio web interface and kubectl command execution.
  2. Strands agentic deployment: this approach uses the Strands Agents SDK to create a multi-agent system with three specialized agents:
    1. Agent Orchestrator: Coordinates troubleshooting workflows
    2. Memory Agent: Manages conversation context and historical insights
    3. K8s Specialist: Handles Kubernetes diagnostics

The agentic system stores knowledge as 1024-dimensional embeddings in Amazon S3 Vectors, providing cost-optimized vector storage for AI agents. EKS MCP Server integration enabled direct EKS API access through standardized MCP tools located in ./apps/agentic-troubleshooting/src/tools/. Engineers interact via Slack bot integration, where the Strands agents can execute kubectl commands through the MCP protocol while maintaining Pod Identity security for AWS service access.

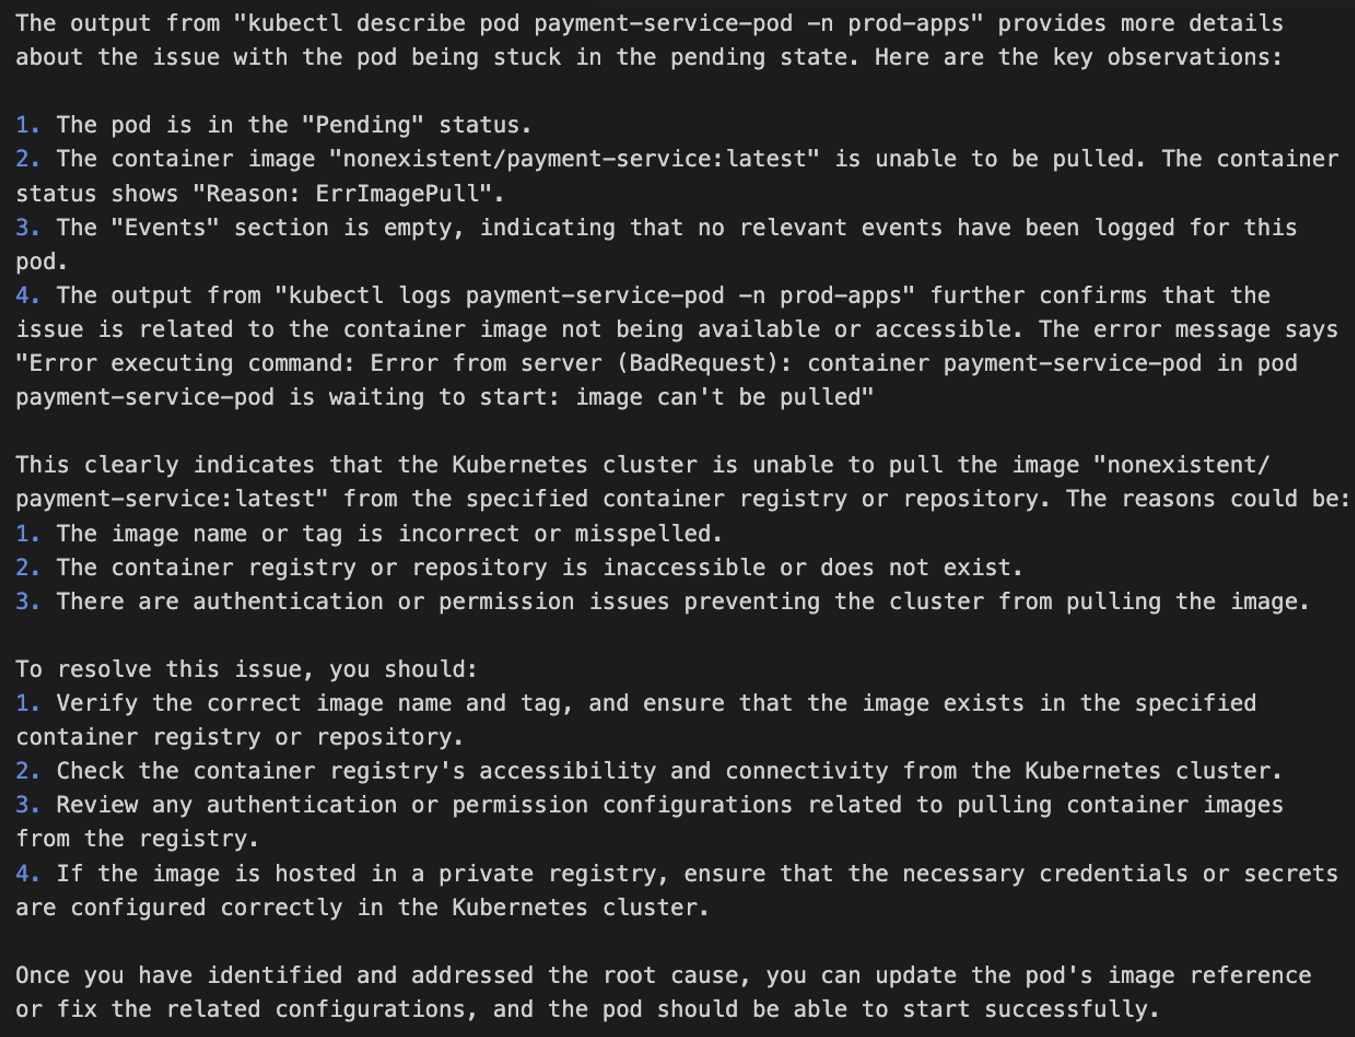
The following screenshot shows an example chatbot response to a query about a pod being stuck in pending state. The assistant generated and ran multiple kubectl commands to build the output and came up with recommendations for issue remediation.

Figure 5. EKS cluster troubleshooting, example output

See AWS re:Invent 2025 – Streamline Amazon EKS operations with Agentic AI and KubeCon – From Logs To Insights: Real-time Conversational Troubleshooting for Kubernetes with GenAI sessions for a deeper dive into solution implementation.

Security considerations

When implementing AI agents for Kubernetes environments, security must be a primary consideration throughout the architecture. The solution requires secure communication channels between the chatbot and EKS clusters, with interactions authenticated through AWS Identity and Access Management (AWS IAM) roles.

Permissions-wise, command execution security is critical. Implementing strict allowlists that only allow read-only kubectl operations to help prevent unauthorized cluster modifications while maintaining diagnostic capabilities. The troubleshooting assistant should also operate with minimal Kubernetes RBAC permissions, limited to viewing pods, services, events, and logs within specific namespaces.

Data protection measures must include sanitizing application logs before embedding generation to help prevent sensitive information exposure, encrypting the telemetry data in transit through Kinesis and at rest in OpenSearch using AWS Key Management Service (AWS KMS).

Follow the AWS Well-Architected Framework Security Pillar principles, deploy components within Amazon Virtual Private Cloud (Amazon VPC) using private subnets and VPC endpoints to minimize network exposure, implement comprehensive logging of troubleshooting activities for audit purposes, and validate user inputs to protect against prompt injection attacks that could manipulate the AI assistant’s behavior.

Conclusion

In this post, we walked through how to architect a generative AI-powered troubleshooting assistant that gives engineers a way to solve Kubernetes issues in a self-service way, without always needing service experts to step in. By combining telemetry analysis with AI-driven context, engineers can get to the root causes faster and keep MTTR low. Assistant’s ability to pull from multiple telemetry sources, run safe diagnostic commands, and provide actionable recommendations helps to make the troubleshooting process more efficient and less disruptive to ongoing work.

As distributed systems continue to grow in scale and complexity, solutions like the one described in this post become essential. Putting AI on top of your observability data helps to practically handle these challenges today, while also setting you up for more autonomous, resilient operations in the future.

Blue/Green Deployments with Amazon Elastic Container Service

Post Syndicated from Nathan Taber original https://aws.amazon.com/blogs/compute/bluegreen-deployments-with-amazon-ecs/

This post and accompanying code was generously contributed by:

Jeremy Cowan
Solutions Architect
Anuj Sharma
DevOps Cloud Architect
Peter Dalbhanjan
Solutions Architect

Deploying software updates in traditional non-containerized environments is hard and fraught with risk. When you write your deployment package or script, you have to assume that the target machine is in a particular state. If your staging environment is not an exact mirror image of your production environment, your deployment could fail. These failures frequently cause outages that persist until you re-deploy the last known good version of your application. If you are an Operations Manager, this is what keeps you up at night.

Increasingly, customers want to do testing in production environments without exposing customers to the new version until the release has been vetted. Others want to expose a small percentage of their customers to the new release to gather feedback about a feature before it’s released to the broader population. This is often referred to as canary analysis or canary testing. In this post, I introduce patterns to implement blue/green and canary deployments using Application Load Balancers and target groups.

If you’d like to try this approach to blue/green deployments, we have open sourced the code and AWS CloudFormation templates in the ecs-blue-green-deployment GitHub repo. The workflow builds an automated CI/CD pipeline that deploys your service onto an ECS cluster and offers a controlled process to swap target groups when you’re ready to promote the latest version of your code to production. You can quickly set up the environment in three steps and see the blue/green swap in action. We’d love for you to try it and send us your feedback!

What are blue/green deployments?

Blue/green deployments are a type of immutable deployment used to deploy software updates with less risk by creating two separate environments, blue and green. “Blue” is the current running version of your application and “green” is the new version of your application you will deploy.

This type of deployment gives you an opportunity to test features in the green environment without impacting the current running version of your application. When you’re satisfied that the green version is working properly, you can gradually reroute the traffic from the old blue environment to the new green environment by modifying DNS. By following this method, you can update and roll back features with near zero downtime.

A typical blue/green deployment involves shifting traffic between 2 distinct environments.

This ability to quickly roll traffic back to the still-operating blue environment is one of the key benefits of blue/green deployments. With blue/green, you should be able to roll back to the blue environment at any time during the deployment process. This limits downtime to the time it takes to realize there’s an issue in the green environment and shift the traffic back to the blue environment. Furthermore, the impact of the outage is limited to the portion of traffic going to the green environment, not all traffic. If the blast radius of deployment errors is reduced, so is the overall deployment risk.

Containers make it simpler

Historically, blue/green deployments were not often used to deploy software on-premises because of the cost and complexity associated with provisioning and managing multiple environments. Instead, applications were upgraded in place.

Although this approach worked, it had several flaws, including the ability to roll back quickly from failures. Rollbacks typically involved re-deploying a previous version of the application, which could affect the length of an outage caused by a bad release. Fixing the issue took precedence over the need to debug, so there were fewer opportunities to learn from your mistakes.

Containers can ease the adoption of blue/green deployments because they’re easily packaged and behave consistently as they’re moved between environments. This consistency comes partly from their immutability. To change the configuration of a container, update its Dockerfile and rebuild and re-deploy the container rather than updating the software in place.

Containers also provide process and namespace isolation for your applications, which allows you to run multiple versions of them side by side on the same Docker host without conflicts. Given their small sizes relative to virtual machines, you can binpack more containers per host than VMs. This lets you make more efficient use of your computing resources, reducing the cost of blue/green deployments.

Fully Managed Updates with Amazon ECS

Amazon Elastic Container Service (ECS) performs rolling updates when you update an existing Amazon ECS service. A rolling update involves replacing the current running version of the container with the latest version. The number of containers Amazon ECS adds or removes from service during a rolling update is controlled by adjusting the minimum and maximum number of healthy tasks allowed during service deployments.

When you update your service’s task definition with the latest version of your container image, Amazon ECS automatically starts replacing the old version of your container with the latest version. During a deployment, Amazon ECS drains connections from the current running version and registers your new containers with the Application Load Balancer as they come online.

Target groups

A target group is a logical construct that allows you to run multiple services behind the same Application Load Balancer. This is possible because each target group has its own listener.

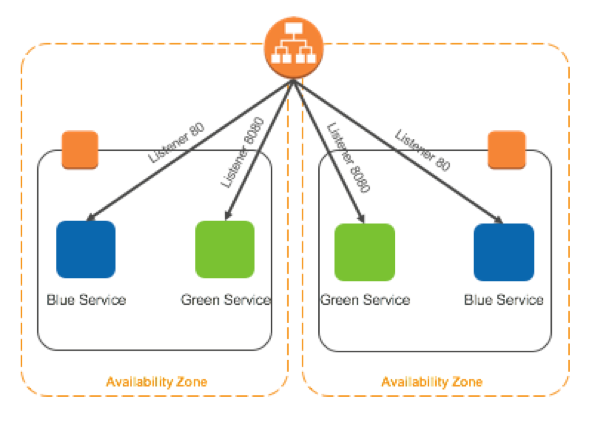
When you create an Amazon ECS service that’s fronted by an Application Load Balancer, you have to designate a target group for your service. Ordinarily, you would create a target group for each of your Amazon ECS services. However, the approach we’re going to explore here involves creating two target groups: one for the blue version of your service, and one for the green version of your service. We’re also using a different listener port for each target group so that you can test the green version of your service using the same path as the blue service.

With this configuration, you can run both environments in parallel until you’re ready to cut over to the green version of your service. You can also do things such as restricting access to the green version to testers on your internal network, using security group rules and placement constraints. For example, you can target the green version of your service to only run on instances that are accessible from your corporate network.

Swapping Over

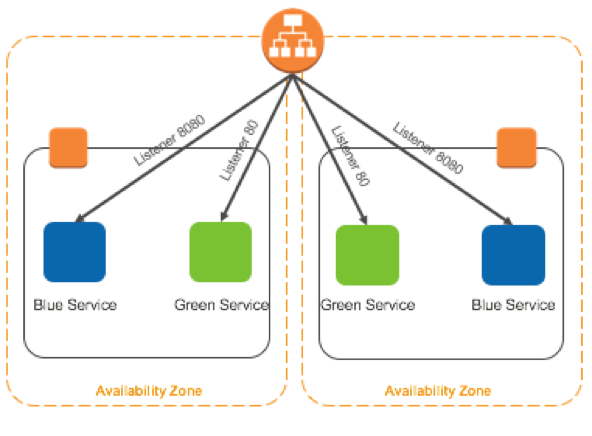
When you’re ready to replace the old blue service with the new green service, call the ModifyListener API operation to swap the listener’s rules for the target group rules. The change happens within a few seconds. Afterward, the green service is running in the target group with the port 80 listener and the blue service is running in the target group with the port 8080 listener. The diagram below is an illustration of the approach described.

Scenario

Two services are defined, each with their own target group registered to the same Application Load Balancer but listening on different ports. Deployment is completed by swapping the listener rules between the two target groups.

The second service is deployed with a new target group listening on a different port but registered to the same Application Load Balancer.

By using 2 listeners, requests to blue services are directed to the target group with the port 80 listener, while requests to the green services are directed to target group with the port 8080 listener.

After automated or manual testing, the deployment can be completed by swapping the listener rules on the Application Load Balancer and sending traffic to the green service.

Caveats

There are a few caveats to be mindful of when using this approach. This method:

  • Assumes that your application code is completely stateless. Store state outside of the container.
  • Doesn’t gracefully drain connections. The swapping of target groups is sudden and abrupt. Therefore, be cautious about using this approach if your service has long-running transactions.
  • Doesn’t allow you to perform canary deployments. While the method gives you the ability to quickly switch between different versions of your service, it does not allow you to divert a portion of the production traffic to a canary or control the rate at which your service is deployed across the cluster.

Canary testing

While this type of deployment automates much of the heavy lifting associated with rolling deployments, it doesn’t allow you to interrupt the deployment if you discover an issue midstream. Rollbacks using the standard Amazon ECS deployment require updating the service’s task definition with the last known good version of the container. Then, you wait for Amazon ECS to schedule and deploy it across the cluster. If the latest version introduces a breaking change that went undiscovered during testing, this might be too slow.

With canary testing, if you discover the green environment is not operating as expected, there is no impact on the blue environment. You can route traffic back to it, minimizing impaired operation or downtime, and limiting the blast radius of impact.

This type of deployment is particularly useful for A/B testing where you want to expose a new feature to a subset of users to get their feedback before making it broadly available.

For canary style deployments, you can use a variation of the blue/green swap that involves deploying the blue and the green service to the same target group. Although this method is not as fast as the swap, it allows you to control the rate at which your containers are replaced by adjusting the task count for each service. Furthermore, it gives you the ability to roll back by adjusting the number of tasks for the blue and green services respectively. Unlike the swap approach described above, connections to your containers are drained gracefully. We plan to address canary style deployments for Amazon ECS in a future post.

Conclusion

With AWS, you can operationalize your blue/green deployments using Amazon ECS, an Application Load Balancer, and target groups. I encourage you to adapt the code published to the ecs-blue-green-deployment GitHub repo for your use cases and look forward to reading your feedback.

If you’re interested in learning more, I encourage you to read the Blue/Green Deployments on AWS and Practicing Continuous Integration and Continuous Delivery on AWS whitepapers.

If you have questions or suggestions, please comment below.

How to create an AMI hardening pipeline and automate updates to your ECS instance fleet

Post Syndicated from Nima Fotouhi original https://aws.amazon.com/blogs/security/how-to-create-an-ami-hardening-pipeline-and-automate-updates-to-your-ecs-instance-fleet/

Amazon Elastic Container Service (Amazon ECS) is a comprehensive managed container orchestrator that simplifies the deployment, maintenance, and scalability of container-based applications. With Amazon ECS, you can deploy your containerized application as a standalone task, or run a task as part of a service in your cluster. The Amazon ECS infrastructure for tasks includes Amazon Elastic Compute Cloud (Amazon EC2) instances in the AWS Cloud, serverless (AWS Fargate) in the AWS Cloud, or on-premises virtual machines (VMs) or servers. You can enable auto-scaling for Amazon ECS capacity providers when using EC2 instances, allowing your infrastructure to dynamically adjust based on workload demands. You define the infrastructure type or the capacity providers where you deploy your tasks or services.

You can choose EC2 instances as the computing resources for your ECS cluster, which allows you to control your cluster’s underlying infrastructure, including the size of EC2 instances, the instance operating system, and extra security controls required by a compliance framework. AWS recommends that you use Amazon ECS-optimized Amazon Machine Images (AMIs), which are set up with the requirements and recommendations to efficiently run your container workloads on Amazon Linux instances. We recommend that you refresh your container instances fleet with the latest ECS-optimized AMIs to include the latest bug fixes and feature updates. However, managing and updating your container instance fleet might become complex as your Amazon ECS workload grows.

In this blog post, I will show you how to create a workflow to enhance Amazon ECS-optimized AMIs by using the CIS Docker Benchmark and automatically updating your EC2 instances in your ECS cluster with the newly created AMIs.

Overview of CIS Docker Benchmark

The CIS Docker Benchmark provides prescriptive guidance for establishing a secure configuration posture for a Docker container engine, container host, container images and build files. The CIS Docker Benchmark has seven sections about Docker and container security:

  1. Host configuration
  2. Docker daemon configuration
  3. Docker daemon configuration files
  4. Container images and build file configuration
  5. Container runtime configuration
  6. Docker security operations
  7. Docker swarm configuration

The solution described in this post covers sections 1, 2, and 3 of the CIS Docker Benchmark, including security recommendations to prepare the host machine used for Amazon ECS workloads, securing the behavior of the Docker daemon (server), and securing Docker-related files and directory permissions and ownerships. However, the solution doesn’t implement all of the controls listed in these three sections. For a complete list of controls implemented, see the solution’s repository.

Solution overview

EC2 Image Builder is a fully managed AWS service, designed to simplify the process of creating, handling, and implementing server images that are custom, secure, and consistently updated. For this solution, you will deploy an EC2 Image Builder pipeline to apply the CIS Docker Benchmarks to an Amazon ECS-optimized AMI and use the created AMI to refresh the Amazon ECS instance fleet. This solution is customizable, so you can select the security controls to harden your base AMI. You can also specify cluster tags during CloudFormation template deployment; these tags will filter the ECS clusters that you have included in the Amazon EC2 instance refresh process. I’ve provided an AWS CloudFormation template that you can use to provision the necessary resources.

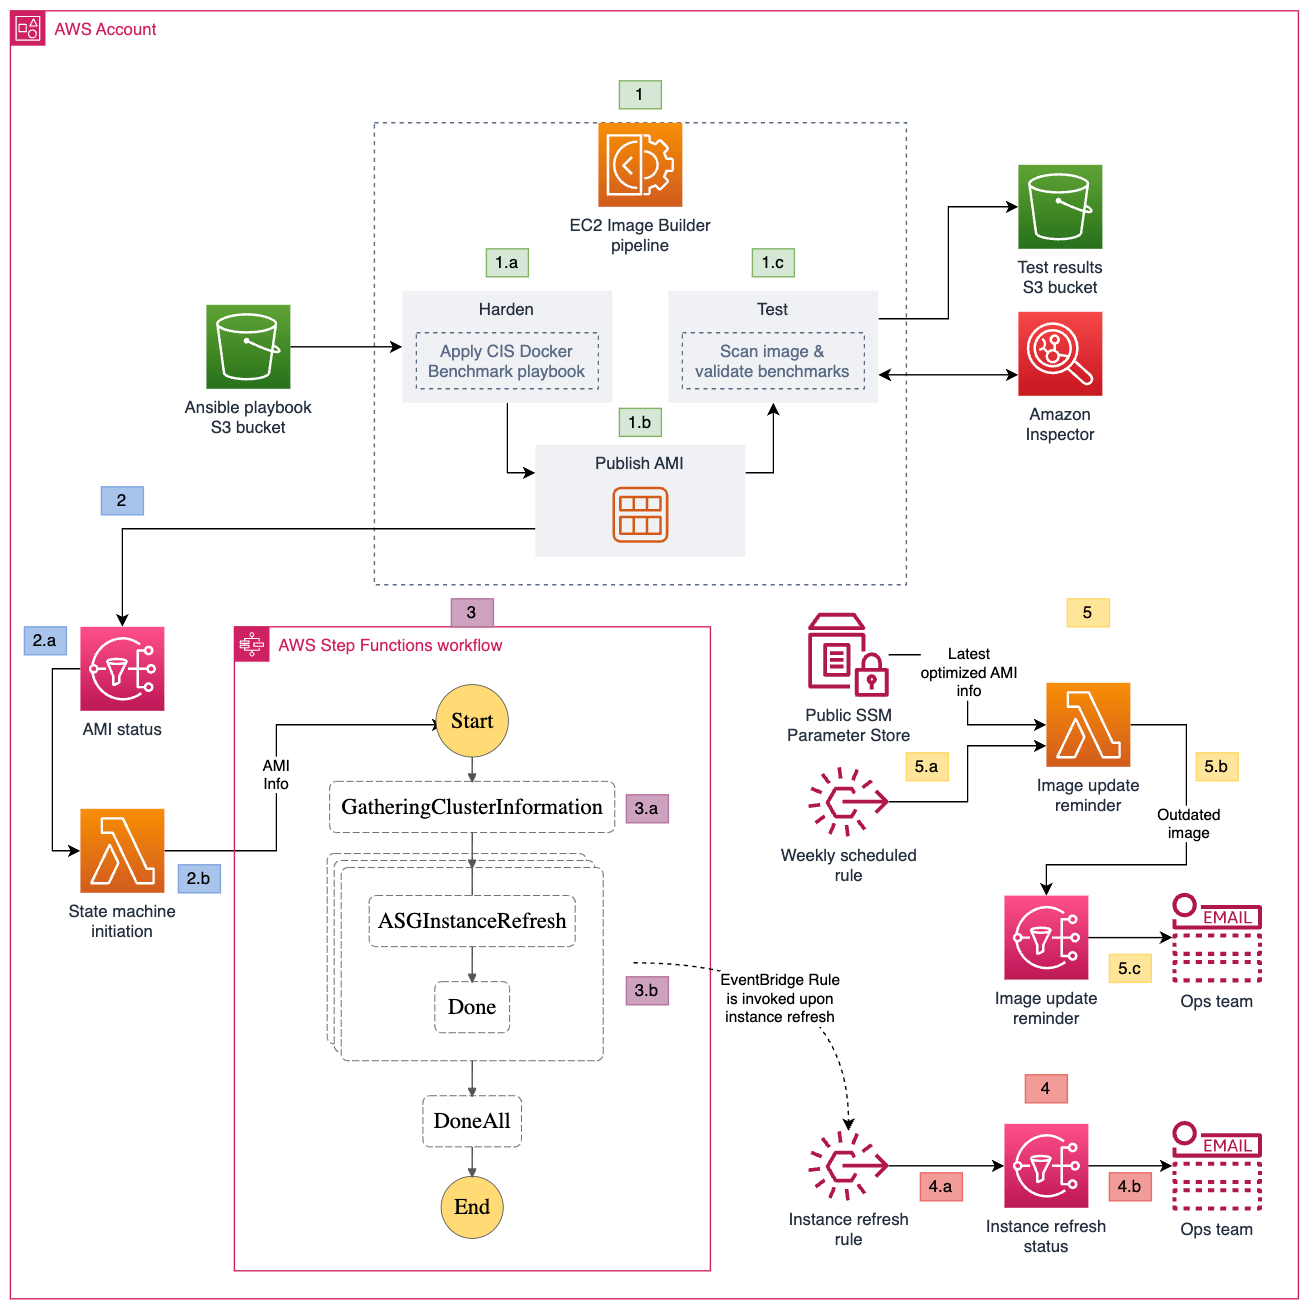
Figure 1: Amazon ECS instance refresh workflow

Figure 1: Amazon ECS instance refresh workflow

As shown in Figure 1, the solution involves the following steps:

  1. EC2 Image Builder
    1. The AMI image pipeline downloads the ansible playbook from the S3 bucket, and runs it against the base image.
    2. The pipeline publishes the hardened AMI.
    3. The pipeline validates the benchmarks applied to the base image and publishes the results to a test results S3 bucket. It also invokes Amazon Inspector to run a vulnerability scan on the published image.
  2. State machine initiation
    1. When the AMI is successfully published, the pipeline publishes a message to the AMI status SNS topic. The SNS topic invokes the State machine initiation Lambda function.
    2. The State machine initiation Lambda function extracts the image ID of the published AMI and uses it as the input to initiate the state machine.
  3. State machine
    1. The first state gathers information related to Amazon ECS clusters, including the capacity providers for the EC2 auto scaling group. It creates a new launch template version with the hardened AMI image ID for the EC2 auto scaling group.
    2. The second state uses the new launch template to initiate an instance refresh for the EC2 auto scaling group.
  4. Instance refresh status update
    1. The instance refresh rule selects the auto scaling group instance refresh events (failure, success, and cancellation events) and sends them to the Instance refresh status SNS topic.
    2. The Instance refresh status SNS topic sends an email on the instance refresh status to subscribers.
  5. Image update reminder
    1. A weekly scheduled rule invokes the Image update reminder Lambda function.
    2. The Image update reminder Lambda function retrieves the value for LatestECSOptimizedAMI from the CloudFormation template, and extracts the last modified date of the Amazon ECS-optimized AMI used as the base image in the EC2 Image Builder pipeline. It compares the last modified date of the AMI with the creation date of the latest AMI published by the pipeline. If a new base image is available, it publishes a message to the image update reminder SNS topic.
    3. The Image update reminder SNS topic sends a message to subscribers notifying them of a new base image. You need to create a new version of your image recipe to update it with the new AMI.

Prerequisites

To follow along with this walkthrough, make sure that you have the following prerequisites in place:

Walkthrough

To deploy the solution, complete the following steps.

Step 1: Download or clone the repository

The first step is to download or clone the solution’s repository.

To download the repository

  1. Go to the main page of the repository on GitHub.
  2. Choose Code, and then choose Download ZIP.

To clone the repository

  1. Make sure that you have Git installed.
  2. Run the following command in your terminal:

git clone https://github.com/aws-samples/ecs-image-hardening-and-instance-refresh.git

Step 2: Create an S3 bucket

Amazon Simple Storage Service (Amazon S3) is an object storage service that offers industry-leading scalability, data availability, security, and performance. An S3 bucket is a container for objects stored on Amazon S3. For this walkthrough, you need to create an S3 bucket and copy the content of the ansible folder to your newly created bucket. Make a note of your S3 bucket name because you will need it in the next step.

Step 3: Create the CloudFormation stack

In this step, you deploy the solution’s resources by creating a CloudFormation stack using the provided CloudFormation template. Sign in to your account and choose an AWS Region where you want to create the stack. Make sure that the Region you choose supports the services used by this solution. To create the stack, follow the steps in Creating a stack on the AWS CloudFormation console. Note that you need to provide values for the parameters defined in the template to deploy the stack. The following table lists the parameters that you need to provide.

Parameter Description
AnsiblePlaybookArguments ansible-playbook command arguments
AnsiblePlaybookBucket S3 bucket name containing ansible playbook
CloudFormationUpdaterEventBridgeRuleState Amazon EventBridge rule that invokes the Lambda function that checks for a new version of the EC2 Image Builder parent image
ClusterTags Tags in JSON format to filter the ECS clusters that you want to update
ComponentName Name of the EC2 Image Builder component
DistributionConfigurationName Name of the EC2 Image Builder distribution configuration
EnableImageScanning Choose whether or not to enable Amazon Inspector image scanning
ImagePipelineName Name of the EC2 Image Builder pipeline
InfrastructureConfigurationName Name of the EC2 Image Builder infrastructure configuration
InstanceType EC2 Image Builder infrastructure configuration EC2 instance type
LatestECSOptimizedAMI ECS-optimized AMI parameter name; for more info, see Retrieving Amazon ECS-optimized AMI metadata
libDockerVolumeSize Container partition size in gigabytes (GB)
libDockerVolumeType Container partition volume type
RecipeName Name of the EC2 Image Builder recipe
RootVolumeSize AMI root partition volume size in GB
RootVolumeType AMI root partition volume type

Step 4: Set up Amazon SNS topic subscribers

Amazon Simple Notification Service (Amazon SNS) is a web service that coordinates and manages the delivery or sending of messages to subscribing endpoints or clients. An Amazon SNS topic is a logical access point that acts as a communication channel.

The solution in this post creates three Amazon SNS topics to keep you informed of each step of the process. The following is a list of the topics that the solution creates and their purpose.

  • AMI status topic – a message is published to this topic upon successful creation of an AMI.
  • Image update reminder topic – a message is published to this topic if a newer version of the base Amazon ECS-optimized AMI is published by AWS.
  • Instance refresh status topic – a message is published to this topic each time that an ECS cluster capacity provider gets an instance fleet refresh.

You need to manually modify the subscriptions for each topic to receive messages published to that topic.

To modify the subscriptions for the topics created by the CloudFormation template

  1. Sign in to the Amazon SNS console.
  2. In the left navigation pane, choose Subscriptions.
  3. On the Subscriptions page, choose Create subscription.
  4. On the Create subscription page, in the Details section, do the following:
    • For Topic ARN, choose the Amazon Resource Name (ARN) of one of the topics that the CloudFormation topic created.
    • For Protocol, choose Email.
    • For Endpoint, enter the endpoint value. In our example, this is an email address, such as the email address of a distribution list.
    • Choose Create subscription.
  5. Repeat the preceding steps for the other two topics.

Step 5: Run the pipeline

The EC2 Image Builder pipeline that the solution creates consists of an image recipe with one component, an infrastructure configuration, and a distribution configuration. I’ve set up the image recipe to create an AMI, select a base image, choose components, and define block device mapping. There’s only one component where building and testing steps are defined. For the building step, the solution creates a separate partition for /var/lib/docker and mounts it to a dedicated device specified in the image recipe. It then applies the CIS Docker Benchmark ansible playbook and cleans up the unnecessary files and folders. In the test step, the solution runs Amazon inspector, a continuous assessment service that scans your AWS workloads for software vulnerabilities and unintended network exposure, and Docker Bench for Security. Optionally, you can create your own components and associate them with the image recipe to make further modifications on the base image.

You will need to manually run the pipeline by using either the AWS Management Console or AWC CLI.

To run the pipeline (console)

  1. Open the EC2 Image Builder console.
  2. From the pipeline details page, choose the name of your pipeline.
  3. From the Actions menu at the top of the page, select Run pipeline.

To run the pipeline (AWS CLI)

  1. Make sure that you have properly configured your AWS CLI.
  2. Run the following command. Replace <pipeline region> with your own information.

aws imagebuilder list-image-pipelines –region <pipeline region>

  1. From the list of pipelines, find the pipeline named ECSAnsiblePipeline and note the pipeline ARN, which you will use in the next step.
  2. Run the pipeline. Make sure to replace <pipeline arn> and <region> with your own information.

aws imagebuilder start-image-pipeline-execution –image-pipeline-arn <pipeline arn> –region <region>

The following is a process overview of the image hardening and instance refresh:

  1. Image hardening – when you start the pipeline, EC2 Image Builder creates the required infrastructure to build your AMI, applies the ansible playbook (CIS Docker Benchmark) to the base AMI, and publishes the hardened AMI. A message is published to the AMI status topic as well.
  2. Image testing – after publishing the AMI, EC2 Image Builder scans the newly created AMI with Amazon Inspector and reports the findings back. It also runs Docker Bench for Security to verify the changes that the ansible playbook made to the base AMI and publishes the results to an S3 bucket.
  3. State machine initiation – after a new AMI is successfully published, the AMI status topic invokes the State machine initiation Lambda function. The Lambda function invokes the instance refresh state machine and passes on the AMI info.
  4. Instance refresh – the instance refresh state machine has two steps:
    1. Gather cluster information – a Lambda function gathers information regarding EC2 capacity providers and their associated auto scaling groups. For each auto scaling group, it creates a new launch template and includes the hardened AMI information. When you create the CloudFormation stack, if you pass a tag or a list of tags, only clusters with matching tags are processed in this step.
    2. Auto scaling group instance refresh – the state machine uses the output of the first Lambda function (first state) and starts instance refresh for auto scaling groups in parallel (second state). An EventBridge rule publishes a message to the Instance refresh status topic upon successful refresh of each auto scaling group.

This solution also creates an EventBridge rule that is invoked weekly. This rule invokes the Image update reminder Lambda function, and notifies you if a new version of your base AMI has been published by AWS so that you can run the pipeline and update your hardened AMI.

Conclusion

In this blog post, you learned how to create a workflow to harden Amazon ECS-optimized AMIs by using the CIS Docker Benchmark and to automate the refresh of EC2 instances in your ECS clusters. This automated workflow has several advantages. First, it helps ensure a consistent and standardized process for image hardening, reducing potential human errors and inconsistencies. By automating the entire process, you can apply security and compliance standards across your instances. Second, the tight integration with AWS Step Functions enables smooth, orchestrated updates to the ECS cluster instances, enhancing the reliability and predictability of deployments. This automation also reduces manual intervention, helping you achieve time savings so that your teams can focus on more value-driven tasks. Moreover, this systematic approach helps to enhance the security posture of your Amazon ECS workloads because you can address vulnerabilities rapidly and systematically, helping to keep the environment resilient against potential threats.

If you have feedback about this post, submit comments in the Comments section below. If you have questions about this post, contact AWS Support.

Want more AWS Security news? Follow us on Twitter.

Nima Fotouhi

Nima Fotouhi

Nima is a Security Consultant at AWS. He’s a builder with a passion for infrastructure as code (IaC) and policy as code (PaC) and helps customers build secure infrastructure on AWS. In his spare time, he loves to hit the slopes and go snowboarding.

Automate the deployment of an NGINX web service using Amazon ECS with TLS offload in CloudHSM

Post Syndicated from Nikolas Nikravesh original https://aws.amazon.com/blogs/security/automate-the-deployment-of-an-nginx-web-service-using-amazon-ecs-with-tls-offload-in-cloudhsm/

Customers who require private keys for their TLS certificates to be stored in FIPS 140-2 Level 3 certified hardware security modules (HSMs) can use AWS CloudHSM to store their keys for websites hosted in the cloud. In this blog post, we will show you how to automate the deployment of a web application using NGINX in AWS Fargate, with full integration with CloudHSM. You will also use AWS CodeDeploy to manage the deployment of changes to your Amazon Elastic Container Service (Amazon ECS) service.

CloudHSM offers FIPS 140-2 Level 3 HSMs that you can integrate with NGINX or Apache HTTP Server through the OpenSSL Dynamic Engine. The CloudHSM Client SDK 5 includes the OpenSSL Dynamic Engine to allow your web server to use a private key stored in the HSM with TLS versions 1.2 and 1.3 to support applications that are required to use FIPS 140-2 Level 3 validated HSMs.

CloudHSM uses the private key in the HSM as part of the server verification step of the TLS handshake that occurs every time that a new HTTPS connection is established between the client and server. Using the exchanged symmetric key, OpenSSL software performs the key exchange and bulk encryption. For more information about this process and how CloudHSM fits in, see How SSL/TLS offload with AWS CloudHSM works.

Solution overview

This blog post uses the AWS Cloud Development Kit (AWS CDK) to deploy the solution infrastructure. The AWS CDK allows you to define your cloud application resources using familiar programming languages.

Figure 1 shows an overview of the overall architecture deployed in this blog. This solution contains three CDK stacks: The TlsOffloadContainerBuildStack CDK stack deploys the CodeCommit, CodeBuild, and AmazonECR resources. The TlsOffloadEcsServiceStack CDK stack deploys the ECS Fargate service along with the required VPC resources. The TlsOffloadPipelineStack CDK stack deploys the CodePipeline resources to automate deployments of changes to the service configuration.

Figure 1: Overall architecture

Figure 1: Overall architecture

At a high level, here’s how the solution in Figure 1 works:

  1. Clients make an HTTPS request to the public IP address exposed by Network Load Balancer to connect to the web server and establish a secure connection that uses TLS.
  2. Network Load Balancer routes the request to one of the ECS hosts running in private virtual private cloud (VPC) subnets, which are connected to the CloudHSM cluster.
  3. The NGINX web server that is running on ECS containers performs a TLS handshake by using the private key stored in the HSM to establish a secure connection with the requestor.

Note: Although we don’t focus on perimeter protection in this post, AWS has a number of services that help provide layered perimeter protection for your internet-facing applications, such as AWS Shield and AWS WAF.

Figure 2 shows an overview of the automation infrastructure that is deployed by the TlsOffloadContainerBuildStack and TlsOffloadPipelineStack CDK stacks.

Figure 2: Deployment pipeline

Figure 2: Deployment pipeline

At a high level, here’s how the solution in Figure 2 works:

  1. A developer makes changes to the service configuration and commits the changes to the AWS CodeCommit repository.
  2. AWS CodePipeline detects the changes and invokes AWS CodeBuild to build a new version of the Docker image that is used in Amazon ECS.
  3. CodeBuild builds a new Docker image and publishes it to the Amazon Elastic Container Registry (Amazon ECR) repository.
  4. AWS CodeDeploy creates a new revision of the ECS task definition for the Amazon ECS service and initiates a deployment of the new service.

Required services

To build this architecture in your account, you need to use a role within your account that can configure the following services and features:

Prerequisites

To follow this walkthrough, you need to have the following components in place:

Step 1: Store secrets in Secrets Manager

As with other container projects, you need to decide what to build statically into the container (for example, libraries, code, or packages) and what to set as runtime parameters, to be pulled from a parameter store. In this walkthrough, we use Secrets Manager to store sensitive parameters and use the integration of Amazon ECS with Secrets Manager to securely retrieve them when the container is launched.

Important: You need to store the following information in Secrets Manager as plaintext, not as key/value pairs.

To create a new secret

  1. Open the Secrets Manager console and choose Store a new secret.
  2. On the Choose secret type page, do the following:
    1. For Secret type, choose Other type of secret.
    2. In Key/value pairs, choose Plaintext and enter your secret just as you would need it in your application.

The following is a list of the required secrets for this solution and how they look in the Secrets Manager console.

  • Your cluster-issuing certificate – this is the certificate that corresponds to the private key that you used to sign the cluster’s certificate signing request. In this example, the name of the secret for the certificate is tls/clustercert.
    Figure 3: Store the cluster certificate

    Figure 3: Store the cluster certificate

  • The web server certificate – In this example, the name of the secret for the web server certificate is tls/servercert. It will look similar to the following:
    Figure 4: Store the web server certificate

    Figure 4: Store the web server certificate

  • The fake PEM file for the private key stored in the HSM that you generated in the Prerequisites section. In this example, the name of the secret for the fake PEM file is tls/fakepem.
    Figure 5: Store the fake PEM

    Figure 5: Store the fake PEM

  • The HSM pin used to authenticate with the HSMs in your cluster. In this example, the name of the secret for the HSM pin is tls/pin.
    Figure 6: Store the HSM pin

    Figure 6: Store the HSM pin

After you’ve stored your secrets, you should see output similar to the following:

Figure 7: List of required secrets

Figure 7: List of required secrets

Step 2: Download and configure the CDK app

This post uses the AWS CDK to deploy the solution infrastructure. In this section, you will download the CDK app and configure it.

To download and configure the CDK app

  1. In your CDK environment that you created in the Prerequisites section, check out the source code from the aws-cloudhsm-tls-offload-blog GitHub repository.
  2. Edit the app_config.json file and update the <placeholder values> with your target configuration:
    {
        "applicationAccount": "<AWS_ACCOUNT_ID>",
        "applicationRegion": "<REGION>",
        "networkConfig": {
            "vpcId": "<VPC_ID>",
            "publicSubnets": ["<PUBLIC_SUBNET_1>", "<PUBLIC_SUBNET_2>", ...],
            "privateSubnets": ["<PRIVATE_SUBNET_1>", "<PRIVATE_SUBNET_2>", ...]
        },
        "secrets": {
            "cloudHsmPin": "arn:aws:secretsmanager:<REGION>:<AWS_ACCOUNT_ID>:secret:<SECRET_ID>",
            "fakePem": "arn:aws:secretsmanager:<REGION>:<AWS_ACCOUNT_ID>:secret:<SECRET_ID>",
            "serverCert": "arn:aws:secretsmanager:<REGION>:<AWS_ACCOUNT_ID>:secret:<SECRET_ID>",
            "clusterCert": "arn:aws:secretsmanager:<REGION>:<AWS_ACCOUNT_ID>:secret:<SECRET_ID>"
        },
        "cloudhsm": {
            "clusterId": "<CLUSTER_ID>",
            "clusterSecurityGroup": "<CLUSTER_SECURITY_GROUP>"
        }
    }

  3. Run the following command to build the CDK stacks from the root of the project directory.
    npm run build

  4. To view the stacks that are available to deploy, run the following command from the root of the project directory.
    cdk ls

    You should see the following stacks available to deploy:

    • TlsOffloadContainerBuildStack — Deploys the CodeCommit, CodeBuild, and ECR repository that builds the ECS container image.
    • TlsOffloadEcsServiceStack — Deploys the ECS Fargate service along with the required VPC resources.
    • TlsOffloadPipelineStack — Deploys the CodePipeline that automates the deployment of updates to the service.

Step 3: Deploy the container build stack

In this step, you will deploy the container build stack, and then create a build and verify that the image was built successfully.

To deploy the container build stack

Deploy the TlsOffloadContainerBuildStack stack that we described in Figure 2 to your AWS account. In your CDK environment, run the following command:

cdk deploy TlsOffloadContainerBuildStack

The command line interface (CLI) will prompt you to approve the changes. After you approve them, you will see the following resources deployed to your newly created CodeCommit repository.

  • Dockerfile — This file provides a containerized environment for each of the Fargate containers to run. It downloads and installs necessary dependencies to run the NGINX web server with CloudHSM.
  • nginx.conf — This file provides NGINX with the configuration settings to run an HTTPS web server with CloudHSM configured as the SSL engine that performs the TLS handshake. The following nginx.conf values have already been configured in the file; if you want to make changes, update the file before deployment:
    • ssl_engine is set to cloudhsm
    • the environment variable is env CLOUDHSM_PIN
    • error_log is set to stderr so that the Fargate container can capture the logs in CloudWatch
    • the server section is set up to listen on port 443
    • ssl_ciphers are configured for a server with an RSA private key
  • run.sh — This script configures the CloudHSM OpenSSL Dynamic Engine on the Fargate task before the NGINX server is started.
  • nginx.service — This file specifies the configuration settings that systemd uses to run the NGINX service. Included in this file is a reference to the file that contains the environment variables for the NGINX service. This provides the HSM pin to the OpenSSL Engine.
  • index.html — This file is a sample HTML file that is displayed when you navigate to the HTTPS endpoint of the load balancer in your browser.
  • dhparam.pem — This file provides sample Diffie-Hellman parameters for demonstration purposes, but AWS recommends that you generate your own. You can generate your own Diffie-Hellman parameters by running the following command with the OpenSSL CLI. These parameters are not required for TLS but are recommended to provide perfect forward secrecy in your encrypted messages.
    openssl dhparam -out ./dhparam.pem 2048

Your repository should look like the following:

Figure 8: CodeCommit repository

Figure 8: CodeCommit repository

Before you deploy the Amazon ECS service, you need to build your first Docker image to populate the ECR repository. To successfully deploy the service, you need to have at least one image already present in the repository.

To create a build and verify the image was built successfully

  1. Open the AWS CodeBuild console.
  2. Find the CodeBuild project that was created by the CDK deployment and select it.
  3. Choose Start Build to initiate a new build.
  4. Wait for the build to complete successfully, and then open the Amazon ECR console.
  5. Select the repository that the CDK deployment created.

You should now see an image in your repository, similar to the following:

Figure 9: ECR repository

Figure 9: ECR repository

Step 4: Deploy the Amazon ECS service

Now that you have successfully built an ECR image, you can deploy the Amazon ECS service. This step deploys the following resources to your account:

  • VPC endpoints for the required AWS services that your ECS task needs to communicate with, including the following:
    • Amazon ECR
    • Secrets Manager
    • CloudWatch
    • CloudHSM
  • Network Load Balancer, which load balances HTTPS traffic to your ECS tasks.
  • A CloudWatch Logs log group to host the logs for the ECS tasks.
  • An ECS cluster with ECS tasks using your previously built Docker image that hosts the NGINX service.

To deploy the Amazon ECS service with the CDK

  • In your CDK environment, run the following command:
    cdk deploy TlsOffloadEcsServiceStack

The CLI will prompt you to approve the changes. After you approve them, you will see these resources deploy to your account.

Checkpoint

At this point, you should have a working service. To confirm that you do, in your browser, navigate using HTTPS to the public address associated with the Network Load Balancer. While not covered in this blog, you can additionally configure DNS routing using Amazon Route53 to setup a custom domain name for your web service. You should see a screen similar to the following.

Figure 10: The sample website

Figure 10: The sample website

Step 5: Use CodePipeline to automate the deployment of changes to the web server

Now that you have deployed a preliminary version of the application, you can take a few steps to automate further releases of the web server. As you maintain this application in production, you might need to update one or more of the following items:

  • Your website HTML source and other required libraries (for example, CSS or JavaScript)
  • Your Docker environment, such as the OpenSSL libraries, operating system and CloudHSM packages, and NGINX version.
  • Re-deploy the service after rotating your web server private key and certificate in Secrets Manager

Next, you will set up a CodePipeline project that orchestrates the end-to-end deployment of a change to the application—from an update to the code in our CodeCommit repo to the deployment of updated container images and the redirection of user traffic by the load balancer to the updated application.

This step deploys to your account a deployment pipeline that connects your CodeCommit, CodeBuild, and Amazon ECS services.

Deploy the CodePipeline stack with CDK

In your CDK environment, run the following command:

cdk deploy TlsOffloadPipelineStack

The CLI will prompt you to approve the changes. After you approve them, you will see the resources deploy to your account.

Start a deployment

To verify that your automation is working correctly, start a new deployment in your CodePipeline by making a change to your source repository. If everything works, the CodeBuild project will build the latest version of the Dockerfile located in your CodeCommit repository and push it to Amazon ECR. Then, the CodeDeploy application will create a new version of the ECS task definition and deploy new tasks while spinning down the existing tasks.

View your website

Now that the deployment is complete, you should again be able to view your website in your browser by navigating to the website for your application. If you made changes to the source code, such as changes to your index.html file, you should see these changes now.

Verify that the web server is properly configured by checking that the website’s certificate matches the one that you created in the Prerequisites section. Figure 11 shows an example of a certificate.

Figure 11: Certificate for the application

Figure 11: Certificate for the application

To verify that your NGINX service is using your CloudHSM cluster to offload the TLS handshake, you can view the CloudHSM client logs for this application in CloudWatch in the log group that you specified when you configured the ECS task definition.

To view your CloudHSM client logs in CloudWatch

  1. Open the CloudWatch console.
  2. In the navigation pane, select Log Groups.
  3. Select the log group that was created for you by the CDK deployment.
  4. Select a log stream entry. Each log stream corresponds to an ECS instance that is running the NGINX web server.
  5. You should see the client logs for this instance, which will look similar to the following:
    Figure 12: Fargate task logs

    Figure 12: Fargate task logs

You can also verify your HSM connectivity by viewing your HSM audit logs.

To view your HSM audit logs

  1. Open the CloudWatch console.
  2. In the navigation pane, select Log Groups.
  3. Select the log group corresponding to your CloudHSM cluster. The log group has the following format: /aws/cloudhsm/<cluster-id>.
  4. You can see entries similar to the following, which indicates that the NGINX application is connecting and logging in to the HSM to perform cryptographic operations.
    Time: 02/04/23 17:45:40.333033, usecs:1675532740333033
    Version No : 1.0
    Sequence No : 0x2
    Reboot counter : 0x8
    Opcode : CN_LOGIN (0xd)
    Command Type(hex) : CN_MGMT_CMD (0x0)
    User id : 3
    Session Handle : 0x15010002
    Response : 0x0:HSM Return: SUCCESS
    Log type : USER_AUTH_LOG (2)
    User Name : crypto_user
    User Type : CN_CRYPTO_USER (1) 

Conclusion

In this post, you learned how to set up a NGINX web server on Fargate in a secure, private subnet that offloads the TLS termination to a FIPS 140-2 Level 3 HSM environment that uses the CloudHSM OpenSSL Dynamic Engine. You also learned how to set up a deployment pipeline to automate the Fargate deployments when updates are made.

You can expand this solution to fit your individual use case. For example, you can use the NGINX web server as a reverse proxy for additional servers in your internal network, and set up mutual TLS between these internal servers.

Further reading

If you have feedback about this post, submit comments in the Comments section below. If you have questions about this post, start a new thread on the AWS CloudHSM re:Post or contact AWS Support.

Want more AWS Security news? Follow us on Twitter.

Alket Memushaj

Alket Memushaj

Alket Memushaj is a Principal Solutions Architect in the Market Development team for Capital Markets at AWS. In his role, Alket helps customers transform their business with the power of the AWS Cloud. His main focus is on helping customers deploy data and analytics, risk management, and electronic trading platforms in AWS. Alket previously led engineering teams at Morgan Stanley and consulted for global financial services at VMware.

Nikolas Nikravesh

Nikolas Nikravesh

Nikolas is a Software Development Engineer at AWS CloudHSM. He works with the SDK team to develop standards compliant SDKs and integrations to enable AWS customers to develop secure applications with CloudHSM.

Brad Woodward

Brad Woodward

Brad is a Senior Customer Delivery Architect with AWS Professional Services. Brad has presented at RSA and DefCon Skytalks, been an instructor at BlackHat and BlackHat Europe, presented tools at BlackHat Arsenal, and is the maintainer of several open source tools and platforms.