Post Syndicated from Pradip Thoke original https://aws.amazon.com/blogs/big-data/dream11s-journey-to-building-their-data-highway-on-aws/
This is a guest post co-authored by Pradip Thoke of Dream11. In their own words, “Dream11, the flagship brand of Dream Sports, is India’s biggest fantasy sports platform, with more than 100 million users. We have infused the latest technologies of analytics, machine learning, social networks, and media technologies to enhance our users’ experience. Dream11 is the epitome of the Indian sports technology revolution.”

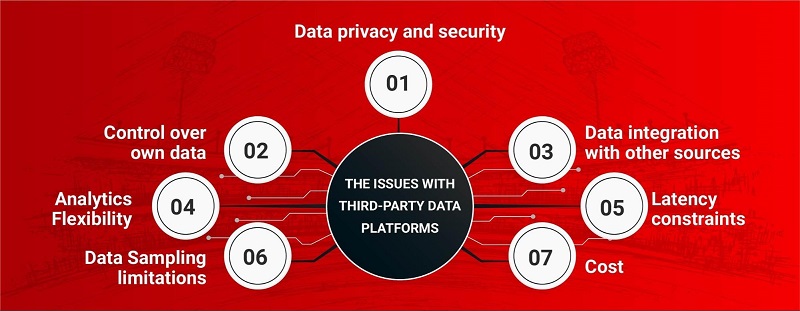
Since inception, Dream11 has been a data-driven sports technology brand. The systems that power Dream11, including their transactional data warehouse, run on AWS. As Dream11 hosts fantasy sports contests that are joined by millions of Indian sports fans, they have large volumes of transactional data that is organized in a well-defined Amazon Redshift data warehouse. Previously they were using 3rd party services to collect, analyze and build models over user interaction data combined with transactional data. Although this approach was convenient, it presented certain critical issues:
- The approach wasn’t conducive to 360-degree user analytics. Dream11’s user interactions data wasn’t present on the cloud, where the rest of Dream11’s infrastructure and data were present (AWS, in this case). To get a complete picture of a user’s experience and journey, the user’s interaction data (client events) needs to be analyzed alongside their transactional data (server events). This is known as 360-degree user analytics.
- It wasn’t possible to get accurate user journey funnel reports. Currently, there are limitations with every tool available on the market with respect to identifying and mapping a given user’s actions across multiple platforms (on the web, iOS, or Android), as well as multiple related apps. This use case is specifically important if your company is a parent to other companies.
- The statistics on user behavior that Dream11 was getting weren’t as accurate as they wanted. Some of the popular services they were using for web & mobile analytics use the technique of sampling to be able to deal with high volumes of data. Although this is a well-regarded technique to deal with high volumes of data and provides reasonable accuracy in multiple cases, Dream11 wanted statistics to be as accurate as possible.
- The analytics wasn’t real-time. Dream11 experiences intense use by their users just before and during the real-life sports matches, so real-time and near-real-time analytics is very critical for them. This need wasn’t sufficiently met by the plethora of services they were using.
- Their approach was leading to high cost for custom analytics for Dream11’s user interactions data, consisting of hundreds of event types. Serverless query engines typically charge by the amount of data scanned and so it can get very expensive if events data isn’t organized properly in separate tables in a data lake to enable selective access.
All these concerns and needs, led Dream11 to conclude that they needed their own centralized 360-degree analytics platform. Therefore, they embarked on the Data Highway project on AWS.
This project has additional advantages. It is increasingly becoming important to store and process data securely. Having everything in-house can help Dream11 with data security and data privacy objectives. The platform enables 360-degree customer analytics, which further allows Dream11 to do intelligent user segmentation in-house and share only those segments (without exposing underlying transactional or interactions data) with third-party messaging service providers.
Design goals
Dream11 had the following design goals for the project:
- The system should be easy to maintain and should be able to handle a very high volume of data, consisting of billions of events and terabytes of data daily.
- The cost should be low and should be pay-as-you-go.
- Dream11’s web and mobile developers regularly create new types of events to capture new types of interactions. Whenever they add new types of events, they should be immediately available in the system for analytics, and their statistics should immediately reflect in relevant dashboards and reports without any human intervention.
- Certain types of statistics (such as concurrency) should be available in real-time and near-real time—within 5 minutes or less.
- Dream11 should be able to use custom logic to calculate key statistics. The analytics should be accurate—no more sampling.
- The data for various events should be neatly organized in separate tables and analytics-friendly file formats.
- Although Dream11 will have a common data lake, they shouldn’t be constrained to use a single analytics engine for all types of analytics. Different types of analytics engines excel for different types of queries.
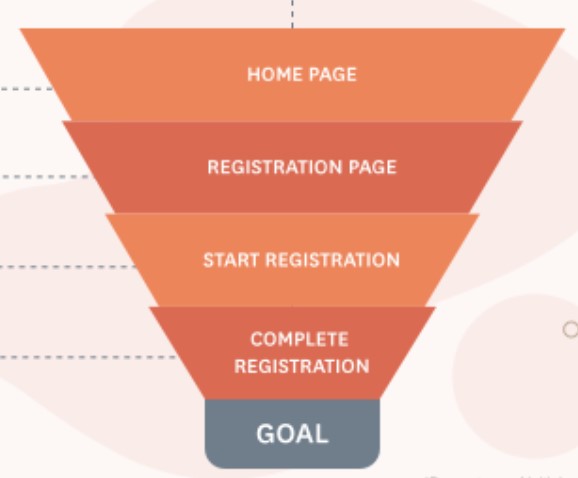
- The Product Management team should have access to views they commonly use in their decision-making process, such as funnels and user flow diagrams.
- The system should be extensible by adding lanes in the system. Lanes allow you to reuse your basic setup without mixing events data for different business units. It also potentially allows you to study user behavior across different apps.
- The system should be able to build 360-degree user profiles
- The system should provide alerting on important changes to key business metrics.
- Last but not the least, the system should be secure and reliable with 6 nines of availability guarantee.
Data Highway architecture
In less than 3 months, Dream11’s data team built a system that met all the aforementioned goals. The following diagram shows the high-level architecture.
For this project, they used the following components:
- Amazon Athena
- Apache Airflow
- Apache Kafka and Kafka Connect
- Apache Ni-Fi
- Apache Phoenix
- Amazon EMR (HBase and Presto)
- AWS Glue Data Catalog
- Looker
- Amazon Redshift
- Amazon Simple Storage Service (Amazon S3)
The rest of this post explains the various design choices and trade-offs made by the Dream11’s data engineers.
Event ingestion, segregation, and organization
Dream11 has several hundred event types. These events have common attributes and specific attributes. The following diagram shows the logical structure of these events.

When the front end receives an event, it saves fields up to common attributes into a message and posts it to Kafka_AllEvents_CommonAttributes. This Kafka topic is the source for the following systems:
- Apache HBase on Amazon EMR – Provides real-time concurrency analytics
- Apache Druid – Provides near real-time dimensional analytics
- Amazon Redshift – Provides session analytics
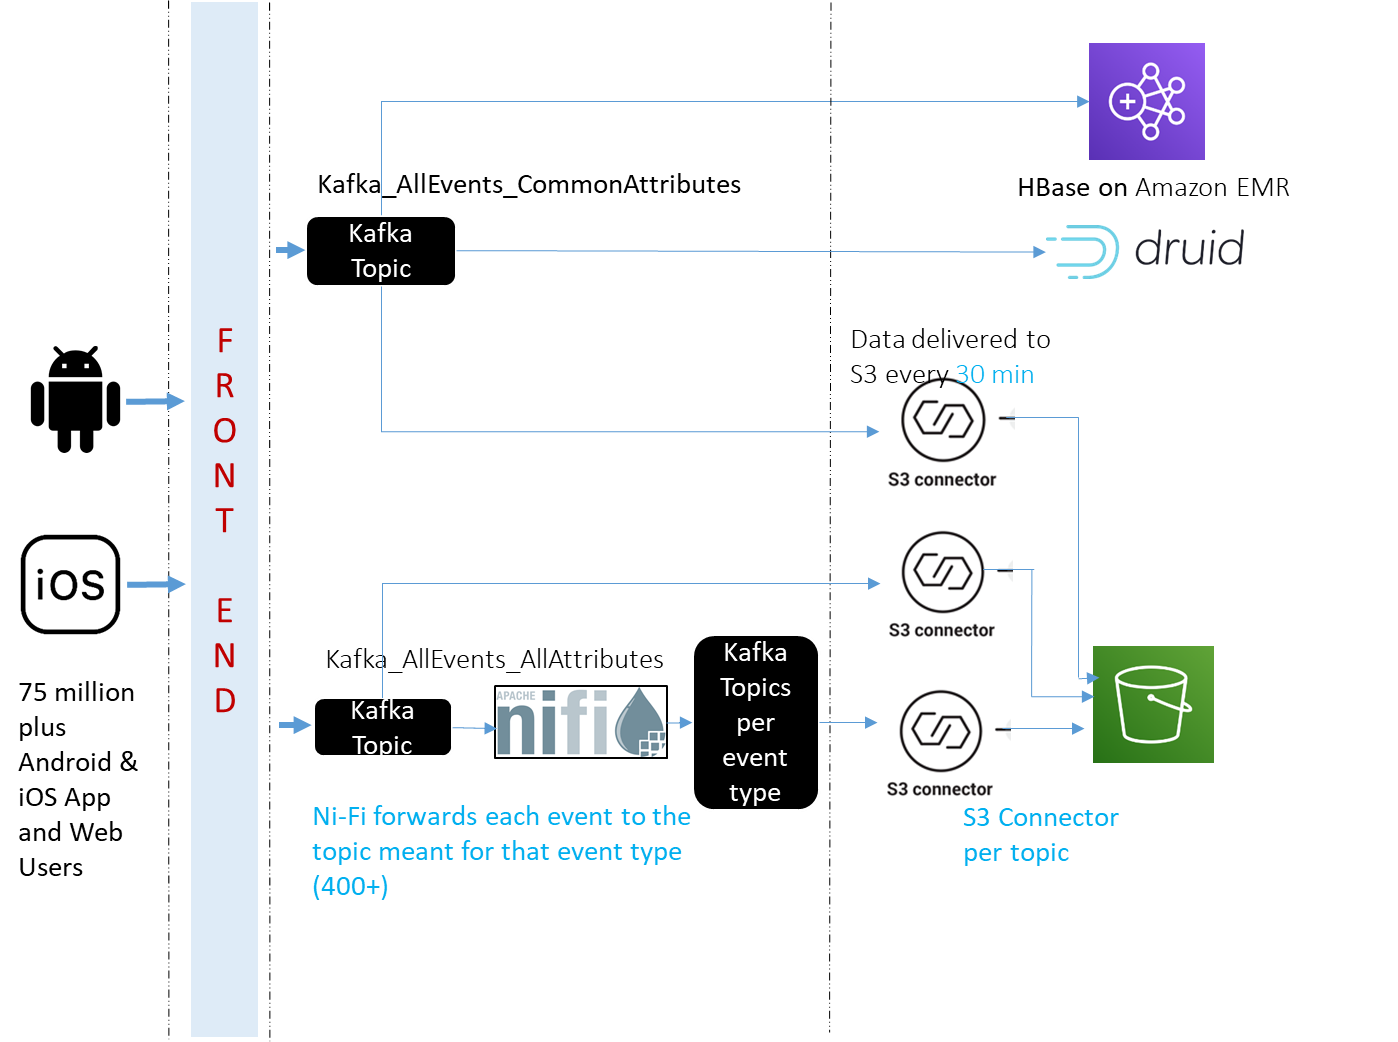
The front end also saves events, as they are, into Kafka_AllEvents_AllAttributes. These events are further picked by Apache Ni-Fi, which forwards them to their respective topics. Apache Ni-Fi supports data routing, transformation, and system mediation logic using powerful and scalable directed graphs. Data is transformed and published to Kafka by using a combination of RouteOnAttribute and JoltTransformJSON processors (to parse JSON). Apache Ni-Fi basically reads event names and posts to the Kafka topic with matching names. If Kafka doesn’t have a topic with that name, it creates a new topic with that name. You can configure your Kafka brokers to auto-create a topic when a message is received for a non-existent topic.
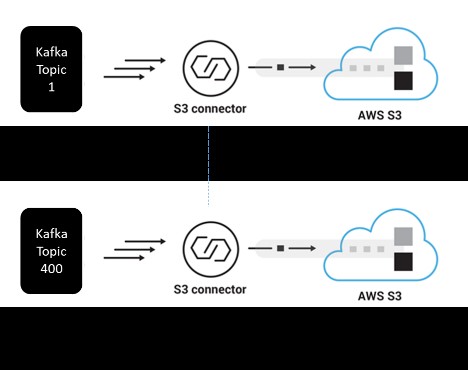
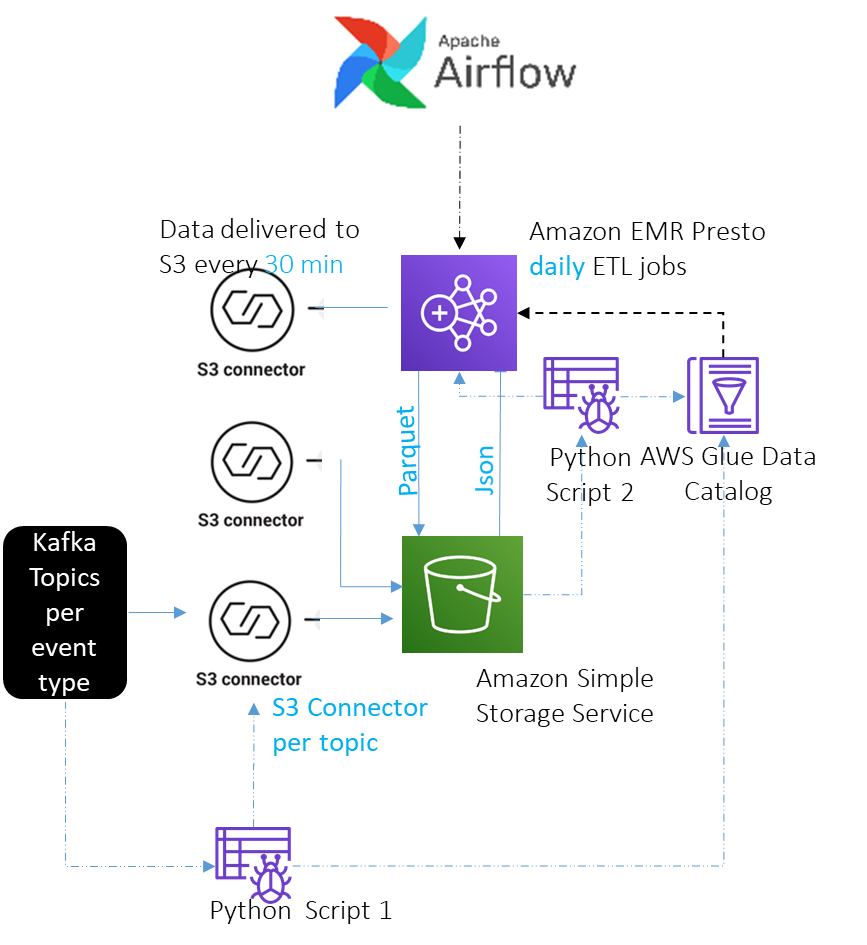
The following diagram illustrates the Amazon S3 sink connector per Kafka topic.
The following diagram summarizes the overall design of the system for event ingestion, segregation, and organization.
Storage, cataloging, ETL, and scheduling
In this section, we discuss how Dream11 updates their AWS Glue Data Catalog, performs extract, transform, and load (ETL) jobs with Amazon EMR Presto, and uses Apache Airflow for schedule management.
Updating the AWS Glue Data Catalog with metadata for the target table
The AWS Glue Data Catalog provides a unified metadata repository across a variety of data sources and data formats. It provides out-of-the-box integration with Amazon S3, Amazon Relational Database Service (Amazon RDS), Amazon Redshift, Amazon Redshift Spectrum, Athena, Amazon EMR, and any application compatible with the Apache Hive metastore. You can create your table definitions one time and query across engines. For more information, see FAQ: Upgrading to the AWS Glue Data Catalog.
Because this Data Catalog is accessible from multiple services that were going to be used for the Data Highway project, Dream11 decided to use it to register all the table definitions.
Registering tables with AWS Glue Data Catalog is easy. You can use an AWS Glue crawler. It can infer schema from files in Amazon S3 and register a table in the Data Catalog. It works quite well, but Dream11 needed additional actions, such as automatically configuring Kafka Amazon S3 sink connectors etc. Therefore, they developed two Python based crawlers.
The first Python based crawler runs every 2 hours and looks up Kafka topics. If it finds a new topic, it configures a Kafka Amazon S3 connector sink to dump its data to Amazon S3 every 30 minutes in JSON Gzip format. It also registers a table with Glue Data Catalog so that users can query the JSON data directly, if needed.
The second Python based crawler runs once a day and registers a corresponding table for each new table created that day to hold flattened data (Parquet, Snappy). It infers schemas and registers tables with the Data Catalog using its Table API. It adds customization needed by the Dream11 team to the metadata. It then creates Amazon EMR Presto ETL jobs to convert JSON, Gzip data to Parquet, Snappy, and registers them with Apache Airflow to run every 24 hours.
ETL with Amazon EMR Presto
Dream11 has a multi node, long-running, multi-purpose EMR cluster. They decided to run scheduled ETL jobs on it for the Data Highway project.
ETL for an event table involves a simple SELECT FROM -> INSERT INTO command to convert JSON (Gzip) to Parquet (Snappy). Converted data takes up to 70% less space, results in 10 times improvement in Athena query performance. ETL happens once a day. Tables are partitioned by day.
Data received on Kafka_AllEvents_CommonAttributes topic is loaded to Redshift. ETL involves SELECT FROM -> INSERT INTO to convert JSON (Gzip) to CSV, followed by Amazon Redshift COPY.
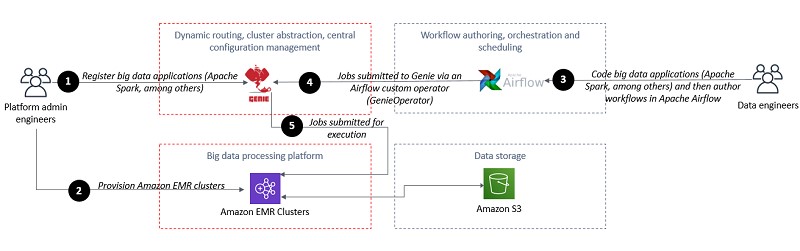
Apache Airflow for schedule management
Apache Airflow is an open-source tool for authoring and orchestrating big data workflows. With Apache Airflow, data engineers define direct acyclic graphs (DAGs). DAGs describe how to run a workflow and are written in Python. Workflows are designed as a DAG that groups tasks that run independently. The DAG keeps track of the relationships and dependencies between tasks.
Dream11 uses Apache Airflow to schedule Python scripts and over few hundred ETL jobs on Amazon EMR Presto to convert JSON (Gzip) data for over few hundred events to Parquet (Snappy) format, and converts JSON data containing common attributes for all events to CSV before loading to Amazon Redshift. For more information, see Orchestrate big data workflows with Apache Airflow, Genie, and Amazon EMR: Part 1.
The following diagram shows the workflow to connect Apache Airflow to Amazon EMR.
The following diagram summarizes the overall design of the system for storage, cataloging, ETL, and scheduling.
Real-time and near-real-time analytics
In this section, we discuss the real-time and near-real-time analytics performed on Dream11’s data.
Concurrency analytics with Apache Druid
Apache Druid is an OLAP-style data store. It computes facts and metrics against various dimensions while data is being loaded. This avoids the need to compute results when a query is run.
Dream11’s web and mobile events are loaded from the Kafka_AllEvents_CommonAttributes topic to Apache Druid with the help of the Apache Druid Kafka indexing service. Dream11 has a dashboard with different granularity levels and dimensions such as app version, org, and other dimensions present in the common event attributes list.
Finding active users with Amazon EMR HBase
Dream11 also needs to identify individual active users at any given time or during a given window. This is required by other downstream teams such as the Data Science team and Digital User Engagement team.
With the help of a Java consumer, they push all events from the Kafka_AllEvents_ CommonAttributes topic to HBase on an EMR cluster with just required user dimensions. They can query the data in HBase with SQL syntax supported by the Apache Phoenix interface.
Session analytics with Amazon Redshift
Dream11 maintains their transactional data warehouse on Amazon Redshift multi node cluster. Amazon Redshift allows them to run complex SQL queries efficiently. Amazon Redshift would have been a natural choice for event analytics for hundreds of event types. However, in Dream11’s case, events data grows very rapidly and this would be a lot of data in Amazon Redshift. Also, this data loses its value rapidly as time passes (relatively speaking) compared with transactional data. Therefore, they decided to do only session analytics in Amazon Redshift to benefit from its complex SQL query capabilities and to do analytics for individual events with the help of Athena (which we discuss in the next section).
Data received on Kafka_AllEvents_CommonAttributes is loaded into Amazon S3 every 30 minutes by the associated kafka connector sink. This data is in JSON format with Gzip compression. Every 24 hours, a job runs on Amazon EMR Presto that flattens this data into CSV format. The data is loaded into Amazon Redshift with the COPY command. The data gets loaded first into a staging table. Data in the staging table is aggregated to get sessions data. Amazon Redshift already has transactional data from other tables that, combined now with the session data, allows Dream11 to perform 360-degree user analytics. They can now easily segment users based on their interactions data and transactions data. They can then run campaigns for those users with the help of messaging platforms.
Event analytics with Athena
Dream11 uses Athena to analyze the data in Amazon S3. Athena is an interactive query service that makes it easy to analyze data in Amazon S3 using standard SQL. Athena is serverless, so there is no infrastructure to manage, and you pay only for the queries that you run. It made perfect sense to organize data for over hundreds of event tables in Amazon S3 and analyze them with Athena on demand.
With Athena, you’re charged based on the amount of data scanned by each query. You can get significant cost savings and performance gains by compressing, partitioning, or converting your data to a columnar format, because each of those operations reduces the amount of data that Athena needs to scan to run a query. For more information, see Top 10 Performance Tuning Tips for Amazon Athena.
As discussed before, Dream11 has registered over hundreds of tables for events data in JSON format, and similar number of tables for events data in Parquet format with the AWS Glue Data Catalog. They observed a performance gain of 10 times on conversion of data format to Parquet, and an 80% savings in space. Data in Amazon S3 can be queried directly through the Athena UI with SQL queries. The other option they use is connecting to Athena using a JDBC driver from Looker and their custom Java UI for the Data Aware project.
Athena helps Dream11 produce funnel analytics and user path analytics reports and visualizations.
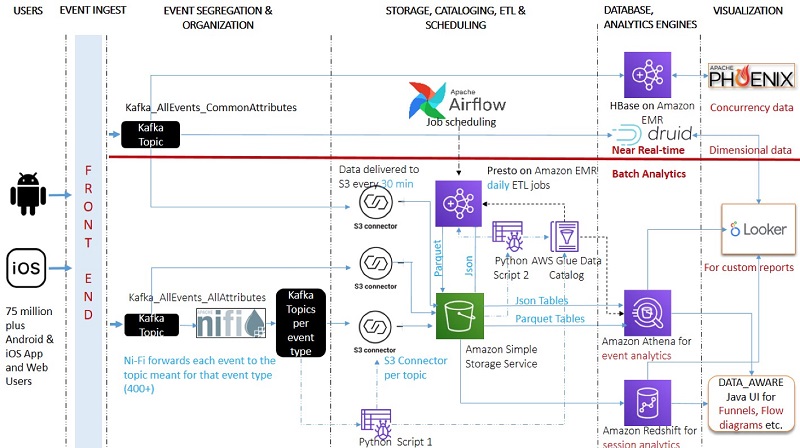
The following diagram summarizes the overall design of the system for real-time and near-real-time analytics and visualization.

Conclusion
This architecture has enabled Dream11 to achieve all the design goals they set out with. Results of analytics for real-time requirements are available under millisecond latency, and the system costs 40% less than the previous system. Analytics is performed with all the data without sampling, so results are accurate and reliable. All the data and analytics engines are within Dream11’s AWS account, improving data security and privacy.
As of this writing, the system handles 14 TB of data per day and it has served 80 million requests per minute at peak during Dream11 IPL 2020.
Doing all their analytics in-house on AWS has not just improved speed, accuracy, and data security, it has also enabled newer possibilities. Now Dream11 has a 360-degree view of their users. They can study their users’ progress across multiple platforms – web, Android, and IOS. This new system is enabling novel applications of machine learning, digital user engagement, and social media technologies at Dream11.
About the Authors

Pradip Thoke is a AVP Data Engineering at Dream11 and leads their Data Engineering team. The team involved in this implementation includes Vikas Gite, Salman Dhariwala, Naincy Suman, Lavanya Pulijala, Ruturaj Bhokre, Dhanraj Gaikwad, Vishal Verma, Hitesh Bansal, Sandesh Shingare, Renu Yadav, Yash Anand, Akshay Rochwani, Alokh P, Sunaim and Nandeesh Bijoor.

Girish Patil is a Principal Architect AI, Big Data, India Scale Apps for Amazon.