All posts by Ramkumar Nottath

Accelerating SQL analytics with Amazon Redshift MCP server

Post Syndicated from Ramkumar Nottath original https://aws.amazon.com/blogs/big-data/accelerating-sql-analytics-with-amazon-redshift-mcp-server/

As data analysts and engineers, we often find ourselves switching between multiple tools to explore database schemas, understand table structures, and execute queries across different Amazon Redshift data warehouses. Using natural language to explore metadata and data can simplify this process, but an AI agent often needs the additional context of your Redshift cluster configurations and schemas to successfully discover and build the best execution path.

This is where the Model Context Protocol (MCP) can act as a bridge between the AI agent and your Redshift clusters to provide the necessary information to better support natural language interfaces to your data. MCP is an open standard that enables AI applications to securely connect to external data sources and tools, providing them with rich, real-time context about your specific environment. Unlike static tools, MCP allows AI agents to dynamically discover database structures, understand table relationships, and execute queries with full awareness of your Amazon Redshift setup.

To address these challenges and unlock the full potential of conversational data analysis, Amazon Web Services (AWS) released the Amazon Redshift MCP server, an open source solution that innovates how you interact with Amazon Redshift data warehouses. The Amazon Redshift MCP server integrates seamlessly with Amazon Q Developer command line interface (CLI), Claude Desktop, Kiro, and other MCP-compatible tools. It can enable discover, explore, and analyze your Amazon Redshift metadata and data through natural language conversations with an AI assistant that truly understands your database environment.

In this post, we walk through setting up the Amazon Redshift MCP server and demonstrate how a data analyst can efficiently explore Redshift data warehouses and perform data analysis using natural language queries.

What is the Amazon Redshift MCP Server?

The Amazon Redshift MCP server is a MCP implementation that provides AI agents with safe, structured access to Amazon Redshift resources. It enables:

  • Cluster discovery – Automatically discover both provisioned Redshift clusters and serverless workgroups
  • Metadata exploration – Browse databases, schemas, tables, and columns through natural language
  • Safe query execution – Execute SQL queries in READ ONLY mode with built-in safety protections
  • Multi-cluster support – Work with multiple clusters and workgroups simultaneously for data reconciliation tasks

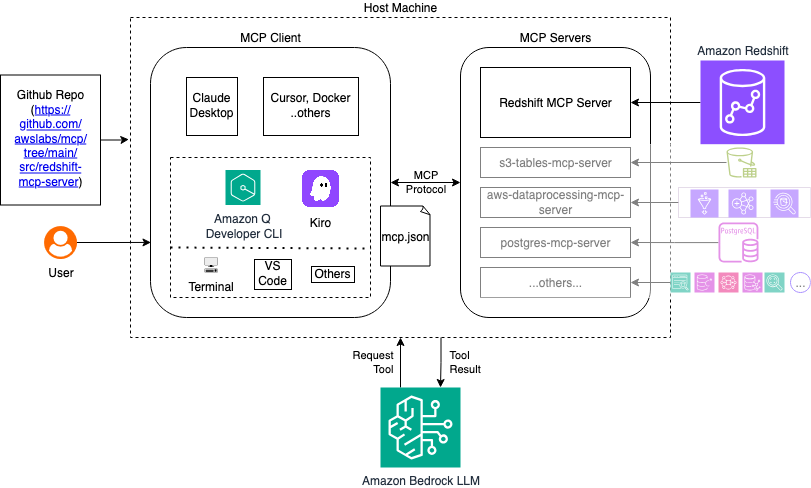
The MCP server acts as a bridge between Amazon Q CLI and your Amazon Redshift infrastructure, translating natural language requests into appropriate API calls and SQL queries. The following diagram illustrates the high-level architecture.

Figure 1 - High level architecture diagram

The following video demonstrates the solution outlined in this post.

Prerequisites

Before you begin, ensure you have the following:

System requirements

  • Python 3.10 or newer
  • uv package manager (installation guide)
  • Amazon Q CLI or other tools such as Claude Desktop installed and configured

AWS requirements

Required IAM permissions

The user identity needs the following IAM permissions in your access policies:

{
  "Version": "2012-10-17",
  "Statement": [
    {
      "Effect": "Allow",
      "Action": [
        "redshift:DescribeClusters",
        "redshift-serverless:ListWorkgroups",
        "redshift-serverless:GetWorkgroup",
        "redshift-data:ExecuteStatement",
        "redshift-data:BatchExecuteStatement",
        "redshift-data:DescribeStatement",
        "redshift-data:GetStatementResult"
      ],
      "Resource": "*"
    }
  ]
}

Installation and configuration

The following section covers the steps required to install and configure Amazon Redshift MCP server.

Install required dependencies

Complete the following steps to install required dependencies:

  1. Install the uv package manager if you haven’t already:
# macOS/Linux
curl -LsSf https://astral.sh/uv/install.sh | sh

# Windows
powershell -c "irm https://astral.sh/uv/install.ps1 | iex"
  1. Install Python 3.10 or newer:

uv python install 3.10

Configure the MCP server

The MCP server can be configured using several MCP supported clients. In this post we discuss the steps using Amazon Q Developer CLI and Claude Desktop.Complete the following instructions to set up Amazon Q Developer CLI on your host machine and access the Amazon Redshift MCP Server:

  1. Install the Amazon Q Developer CLI.
  2. Configure the Amazon Redshift MCP server in your Amazon Q CLI configuration. Edit the MCP configuration file at ~/.aws/amazonq/mcp.json:
{
  "mcpServers": {
    "awslabs.redshift-mcp-server": {
      "command": "uvx",
      "args": ["awslabs.redshift-mcp-server@latest"],
      "env": {
        "AWS_PROFILE": "default",
        "AWS_REGION": "us-east-1",
        "FASTMCP_LOG_LEVEL": "INFO"
      },
      "disabled": false,
      "autoApprove": []
    }
  }
}

For further details on installation, refer to the Installation section in the Amazon Redshift MCP server README.md.

  1. Start Amazon Q CLI to verify the MCP server is properly configured:
q chat

/tools

You should notice the Amazon Redshift MCP server initialize successfully in the startup logs.To set up Amazon Q Developer CLI on your host machine and access the Amazon Redshift MCP Server using Claude Desktop, complete the following steps:

  1. Download and install Claude Desktop for your operating system
  2. Open Claude Desktop and in the bottom left, choose the gear icon to navigate to Settings
  3. Choose the Developer tab and configure your MCP server by adding the same configuration as step 3 in the Amazon Q CLI setup
  4. Restart Claude Desktop to activate the MCP server connection
  5. Test the integration by starting a new conversation and asking: Show me all available Redshift clusters

Use case: Customer purchase analysis

Imagine a practical scenario where a data analyst needs to explore customer purchase data across multiple Redshift clusters. The following walkthrough demonstrates how the MCP server simplifies this workflow.As a data analyst at an ecommerce company, you need to:

  1. Discover available Redshift clusters
  2. Explore the database structure to find customer and sales data
  3. Analyze customer purchase patterns
  4. Generate insights for the business team

To accomplish these tasks, you follow these steps:

  1. Ask Amazon Q to show you available Amazon Redshift resources:
Show me all available Redshift clusters

Amazon Q will use the MCP server to discover your clusters and provide details such as cluster identifiers and types (provisioned or serverless), current status and availability, connection endpoints and configuration, and node types and capacity information.

  1. Explore the database structure to understand your data organization:
What databases and tables are available in the analytics-cluster?

Amazon Q will use the MCP server to systematically explore the objects in the cluster:

  1. Before analyzing data, understand the table schemas:
Show me the structure of the customers and orders tables in analytics-cluster

Amazon Q will use the MCP server to will examine the table columns and provide detailed schema information.

  1. Analyze customer purchase patterns using natural language queries:
Analyze customer purchase pattern from analytics cluster. Show me the top 10 customers by total purchase amount and their buying frequency

Amazon Q will use the MCP server to run the appropriate SQL queries and provide insights.

  1. The MCP server supports analyzing data across multiple clusters:
Compare customer acquisition costs between the analytics-cluster and marketing-cluster data.

Amazon Q will use the MCP server to run the appropriate SQL queries compare the data across analytics-cluster and marketing-cluster.

Best Practices

The MCP server comes equipped with several essential safety protections designed to safeguard your data and system performance. The READ ONLY mode serves as a critical safeguard against unintended data modifications, and we recommend enabling this feature when applicable to your use case. To further enhance security, the server implements query validation mechanisms that scrutinize operations for potential harmful impacts, with user-in-loop validation being recommended for optimal safety. For resource management, the server enforces resource limits to prevent performance-impacting runaway queries, again benefiting from user-in-loop validation for best results. In terms of accessibility, the MCP capability maintains broad availability across all AWS Regions where Amazon Redshift Data API is supported, with throttling limits aligned to existing Amazon Redshift Data API service quotas to ensure consistent performance and reliability.For best results, follow these recommendations:

  1. Start with discovery – Begin by exploring cluster and database structure and tables
  2. Use natural language – Describe what you want to analyze rather than writing SQL directly
  3. Iterate gradually – Build complex analyses step by step
  4. Verify results – Cross-check important findings with business stakeholders
  5. Document insights – Save important queries and results for future reference

Conclusion

The Amazon Redshift MCP server transforms how data analysts interact with Redshift clusters by enabling natural language data exploration and analysis through agentic tooling like Kiro and Amazon Q CLI. By eliminating the need to manually write SQL queries and navigate complex database structures, analysts can focus on generating insights rather than wrestling with syntax and schema discovery.Whether you’re performing a one-time analysis, generating regular reports, or exploring new datasets, the Amazon Redshift MCP server provides a powerful, intuitive interface for your data analysis workflows.Ready to get started? Here’s what to do next:

  1. Install the MCP server following the configuration steps in this post
  2. Explore your Amazon Redshift environment using natural language queries
  3. Start with simple analyses and gradually build complexity
  4. Share insights with your team using the natural language summaries
  5. Provide feedback to help improve the MCP server capabilities

Check out these blog posts to help you navigate using natural language with your use cases:


About the authors

Ramkumar Nottath

Ramkumar Nottath

Ramkumar is a Principal Solutions Architect at AWS focusing on Data and AI services. He enjoys working with various customers to help them build scalable, reliable big data and analytics solutions. His interests extend to various technologies such as analytics, machine learning, generative AI, data warehousing, streaming, and data governance. He loves spending time with his family and friends.

Rohit Vashishtha

Rohit Vashishtha

Rohit is a Senior Analytics Specialist Solutions Architect at AWS based in Dallas, Texas. He has two decades of experience architecting, building, leading, and maintaining big data platforms. Rohit helps customers modernize their analytic workloads using the breadth of AWS services and ensures that customers get the best price/performance with utmost security and data governance.

Decentralize LF-tag management with AWS Lake Formation

Post Syndicated from Ramkumar Nottath original https://aws.amazon.com/blogs/big-data/decentralize-lf-tag-management-with-aws-lake-formation/

In today’s data-driven world, organizations face unprecedented challenges in managing and extracting valuable insights from their ever-expanding data ecosystems. As the number of data assets and users grow, the traditional approaches to data management and governance are no longer sufficient. Customers are now building more advanced architectures to decentralize permissions management to allow for individual groups of users to build and manage their own data products, without being slowed down by a central governance team. One of the core features of AWS Lake Formation is the delegation of permissions on a subset of resources such as databases, tables, and columns in AWS Glue Data Catalog to data stewards, empowering them make decisions regarding who should get access to their resources and helping you decentralize the permissions management of your data lakes. Lake Formation has added a new capability that further allows data stewards to create and manage their own Lake Formation tags (LF-tags). Lake Formation tag-based access control (LF-TBAC) is an authorization strategy that defines permissions based on attributes. In Lake Formation, these attributes are called LF-Tags. LF-TBAC is the recommended method to use to grant Lake Formation permissions when there is a large number of Data Catalog resources. LF-TBAC is more scalable than the named resource method and requires less permission management overhead.

In this post, we go through the process of delegating the LF-tag creation, management, and granting of permissions to a data steward.

Lake Formation serves as the foundation for these advanced architectures by simplifying security management and governance for users at scale across AWS analytics. Lake Formation is designed to address these challenges by providing secure sharing between AWS accounts and tag-based access control to be able scale permissions. By assigning tags to data assets based on their characteristics and properties, organizations can implement access control policies tailored to specific data attributes. This ensures that only authorized individuals or teams can access and work with the data relevant to their domain. For example, it allows customers to tag data assets as “Confidential” and grant access to that LF-Tag to only those users who should have access to confidential data. Tag-based access control not only enhances data security and privacy, but also promotes efficient collaboration and knowledge sharing.

The need for producer autonomy and decentralized tag creation and delegation in data governance is paramount, regardless of the architecture chosen, whether it be a single account, hub and spoke, or data mesh with central governance. Relying solely on centralized tag creation and governance can create bottlenecks, hinder agility, and stifle innovation. By granting producers and data stewards the autonomy to create and manage tags relevant to their specific domains, organizations can foster a sense of ownership and accountability among producer teams. This decentralized approach allows you to adapt and respond quickly to changing requirements. This methodology helps organizations strike a balance between central governance and producer ownership, leading to improved governance, enhanced data quality, and data democratization.

Lake Formation announced the tag delegation feature to address this. With this feature, a Lake Formation admin can now provide permission to AWS Identity and Access Management (IAM) users and roles to create tags, associate them, and manage the tag expressions.

Solution overview

In this post, we examine an example organization that has a central data lake that is being used by multiple groups. We have two personas: the Lake Formation administrator LFAdmin, who manages the data lake and onboards different groups, and the data steward LFDataSteward-Sales, who owns and manages resources for the Sales group within the organization. The goal is to grant permission to the data steward to be able to use LF-Tags to perform permission grants for the resources that they own. In addition, the organization has a set of common LF-Tags called Confidentiality and Department, which the data steward will be able to use.

The following diagram illustrates the workflow to implement the solution.

The following are the high-level steps:

  1. Grant permissions to create LF-Tags to a user who is not a Lake Formation administrator (the LFDataSteward-Sales IAM role).
  2. Grant permissions to associate an organization’s common LF-Tags to the LFDataSteward-Sales role.
  3. Create new LF-Tags using the LFDataSteward-Sales role.
  4. Associate the new and common LF-Tags to resources using the LFDataSteward-Sales role.
  5. Grant permissions to other users using the LFDataSteward-Sales role.

Prerequisites

For this walkthrough, you should have the following:

  • An AWS account.
  • Knowledge of using Lake Formation and enabling Lake Formation to manage permissions to a set of tables.
  • An IAM role that is a Lake Formation administrator. For this post, we name ours LFAdmin.
  • Two LF-Tags created by the LFAdmin:
    • Key Confidentiality with values PII and Public.
    • Key Department with values Sales and Marketing.
  • An IAM role that is a data steward within an organization. For this post, we name ours LFDataSteward-Sales.
  • The data steward should have ‘Super’ access to at least one database. In this post, the data steward has access to three databases: sales-ml-data, sales-processed-data, and sales-raw-data.
  • An IAM role to serve as a user that the data steward will grant permissions to using LF-Tags. For this post, we name ours LFAnalysts-MLScientist.

Grant permission to the data steward to be able to create LF-Tags

Complete the following steps to grant LFDataSteward-Sales the ability to create LF-Tags:

  1. As the LFAdmin role, open the Lake Formation console.
  2. In the navigation pane, choose LF-Tags and permissions under Permissions.

Under LF-Tags, because you are logged in as LFAdmin, you can see all the tags that have been created within the account. You can see the Confidentiality LF-Tag as well as the Department LF-Tag and the possible values for each tag.

  1. On the LF-Tag creators tab, choose Add LF-Tag creators.

  1. For IAM users and roles, enter the LFDataSteward-Sales IAM role.
  2. For Permission, select Create LF-Tag.
  3. If you want this data steward to be able to grant Create LF-Tag permissions to other users, select Create LF-Tag under Grantable permission.
  4. Choose Add.

The LFDataSteward-Sales IAM role now has permissions to create their own LF-Tags.

Grant permission to the data steward to use common LF-Tags

We now want to give permission to the data steward to tag using the Confidentiality and Department tags. Complete the following steps:

  1. As the LFAdmin role, open the Lake Formation console.
  2. In the navigation pane, choose LF-Tags and permissions under Permissions.
  3. On the LF-Tag permissions tab, choose Grant permissions.

  1. Select LF-Tag key-value permission for Permission type.

The LF-Tag permission option grants the ability to modify or drop an LF-Tag, which doesn’t apply in this use case.

  1. Select IAM users and roles and enter the LFDataSteward-Sales IAM role.

  1. Provide the Confidentiality LF-Tag and all its values, and the Department LF-Tag with only the Sales value.
  2. Select Describe, Associate, and Grant with LF-Tag expression under Permissions.
  3. Choose Grant permissions.

This gave the LFDataSteward-Sales role the ability to tag resources using the Confidentiality tag and all its values as well as the Department tag with only the Sales value.

Create new LF-Tags using the data steward role

This step demonstrates how the LFDataSteward-Sales role can now create their own LF-Tags.

  1. As the LFDataSteward-Sales role, open the Lake Formation console.
  2. In the navigation pane, choose LF-Tags and permissions under Permissions.

The LF-Tags section only shows the Confidentiality tag and Department tag with only the Sales value. As the data steward, we want to create our own LF-Tags to make permissioning easier.

  1. Choose Add LF-Tag.

  1. For Key, enter Sales-Subgroups.
  2. For Values¸ enter DataScientists, DataEngineers, and MachineLearningEngineers.
  3. Choose Add LF-Tag.

As the LF-Tag creator, the data steward has full permissions on the tags that they created. You will be able to see all the tags that the data steward has access to.

Associate LF-Tags to resources as the data steward

We now associate resources to the LF-Tags that we just created so that Machine Learning Engineers can have access to the sales-ml-data resource.

  1. As the LFDataSteward-Sales role, open the Lake Formation console.
  2. In the navigation pane, choose Databases.
  3. Select sales-ml-data and on the Actions menu, choose Edit LF-Tags.

  1. Add the following LF-Tags and values:
    1. Key Sales-Subgroups with value MachineLearningEngineers.
    2. Key Department with value analytics.
    3. Key Confidentiality with value Public.
  2. Choose Save.

Grant permissions using LF-Tags as the data steward

To grant permissions using LF-Tags, complete the following steps:

  1. As the LFDataSteward-Sales role, open the Lake Formation console.
  2. In the navigation pane, choose Data lake permissions under Permissions.
  3. Choose Grant.
  4. Select IAM users and roles and enter the IAM principal to grant permission to (for this example, the Sales-MLScientist role).

  1. In the LF-Tags or catalog resources section, select Resources matched by LF-Tags.
  2. Enter the following tag expressions:
    1. For the Department LF-Tag, set the Sales value.
    2. For the Sales-Subgroups LF-Tag, set the MachineLearningEngineers value.
    3. For the Confidentiality LF-Tag, set the Public value.

Because this is a machine learning (ML) and data science user, we want to give full permissions so that they can manage databases and create tables.

  1. For Database permissions, select Super, and for Table permissions, select Super.

  1. Choose Grant.

We now see the permissions granted to the LF-Tag expression.

Verify permissions granted to the user

To verify permissions using Amazon Athena, navigate to the Athena console as the Sales-MLScientist role. We can observe that the Sales-MLScientist role now has access to the sales-ml-data database and all the tables. In this case, there is only one table, sales-report.

Clean up

To clean up your resources, delete the following:

  • IAM roles that you may have created for the purposes of this post
  • Any LF-Tags that you created

Conclusion

In this post, we discussed the benefits of decentralized tag management and how the new Lake Formation feature helps implement this. By granting permission to producer teams’ data stewards to manage tags, organizations empower them to use their domain knowledge and capture the nuances of their data effectively. Furthermore, granting permission to data stewards enables them to take ownership of the tagging process, ensuring accuracy and relevance.

The post illustrated the various steps involved in decentralized Lake Formation tag management, such as granting permission to data stewards to create LF-Tags and use common LF-Tags. We also demonstrated how the data steward can create their own LF-Tags, associate the tags to resources, and grant permissions using tags.

We encourage you to explore the new decentralized Lake Formation tag management feature. For more details, see Lake Formation tag-based access control.


About the Authors

Ramkumar Nottath is a Principal Solutions Architect at AWS focusing on Analytics services. He enjoys working with various customers to help them build scalable, reliable big data and analytics solutions. His interests extend to various technologies such as analytics, data warehousing, streaming, data governance, and machine learning. He loves spending time with his family and friends.

Mert Hocanin is a Principal Big Data Architect at AWS within the AWS Lake Formation Product team. He has been with Amazon for over 10 years, and enjoys helping customers build their data lakes with a focus on governance on a wide variety of services. When he isn’t helping customers build data lakes, he spends his time with his family and traveling.

Extract, prepare, and analyze Salesforce.com data using Amazon AppFlow, AWS Glue DataBrew, and Amazon Athena

Post Syndicated from Ramkumar Nottath original https://aws.amazon.com/blogs/big-data/extract-prepare-and-analyze-salesforce-com-data-using-amazon-appflow-aws-glue-databrew-and-amazon-athena/

As organizations embark on their data modernization journey, big data analytics and machine learning (ML) use cases are becoming even more integral parts of business. The ease for data preparation and seamless integration with third-party data sources is of paramount importance in order to gain insights quickly and make critical business decisions faster.

AWS Glue DataBrew is a visual data preparation tool that cleans and normalizes data without writing code. This reduces the time it takes to prepare data for analytics and ML by up to 80% compared to traditional approaches to data preparation.

Software as a service (SaaS) applications play a pivotal role in organizations’ analytics pipelines. This data is essential to include when performing analytics to get insights to make better business decisions. Amazon AppFlow is a fully managed integration service that helps you transfer SaaS data to your data lake securely.

Recently, DataBrew announced native console integration with Amazon AppFlow to connect to data from applications like Salesforce, Zendesk, Slack, ServiceNow, and other SaaS applications, and AWS services like Amazon Simple Storage Service (Amazon S3) and Amazon Redshift. With native integration with Amazon AppFlow, DataBrew is addressing both the challenges with data preparation and seamless integration with SaaS applications.

Salesforce is a popular and widely used customer relationship management (CRM) platform. It lets you store and manage prospect and customer information—like contact info, accounts, leads, and sales opportunities—in one central location. You can derive a lot of useful information by combining the prospect information stored in Salesforce with other structured and unstructured data in your data lake.

In this post, we walk you through how to extract data from Salesforce.com using the native integration that DataBrew has with Amazon AppFlow, prepare the data for your analytical use cases using DataBrew, store it in Amazon S3, and query it with Amazon Athena.

Architecture overview

The following diagram represents the flow described in this post. With the visual point-and-click interface in Amazon AppFlow, you create a new flow with Salesforce as source. You can either use an existing connection to Salesforce or create a new one. In DataBrew, while creating a dataset, you can choose the Amazon AppFlow flow as one of the sources to import the data for data preparation. After you perform the data preparation steps on sample data, you can save the steps as a recipe and automate the flow by creating a DataBrew job by selecting the dataset for the source and the newly created recipe for transformation. The transformed data is published to an S3 bucket. You can use an AWS Glue crawler to catalog that data and use Athena to query the data.

The workflow includes the following steps:

  1. Create an S3 bucket for the raw and transformed data.
  2. Create a connection to Salesforce.
  3. Create a flow to extract the data from Salesforce.com.
  4. Create a dataset and project.
  5. Prepare the data and create a recipe.
  6. Create a job to pull the data from the Amazon AppFlow flow, run the transformations, and load the data in Amazon S3.
  7. Create a crawler to catalog the data.
  8. Analyze data using Athena.

Prerequisites

To implement this solution, you need the following prerequisites:

Now that we have discussed the architecture of our solution, we present the step-by-step instructions.

Create an S3 bucket

To create an S3 bucket, complete the following steps:

  1. On the Amazon S3 console, choose Create bucket.
  2. Enter a name for your bucket; for example, databrew-appflow-data-prep-<your name>.
  3. Choose Create bucket.

Create a connection to Salesforce

If you already have a Salesforce connection created in Amazon AppFlow, you can skip this step. To create a new connection, complete the following steps:

  1. On the Amazon AppFlow console, choose Connections in the navigation pane.
  2. From the list of connectors, choose Salesforce.
  3. Choose Create connection.
  4. For Connection name, enter a name (for example, sfdc-appflow).
  5. Choose Continue.
  6. You’re redirected to a sign-in screen where you can log in to your Salesforce account. If you don’t have a Salesforce account, you can sign up for a developer account.
  7. Choose Allow to allow Amazon AppFlow to access your Salesforce account.

You can now see the new connection that was created.

Create a flow in Amazon AppFlow to extract data from Salesforce.com

To create a flow in Amazon AppFlow, complete the following steps:

  1. On the Amazon AppFlow console, choose Flows in the navigation pane.
  2. Choose Create flow.
  3. On the Specify flow details page, enter a name for the flow (for example, salesforce-data).
  4. Optionally, provide a description for the flow and tags.
  5. Choose Next.
  6. On the Configure flow page, for Source name¸ choose Salesforce.
  7. Choose the connection we created in the previous step.
  8. For Choose Salesforce object, choose the object you want to work with (for this post, we choose Opportunity).
  9. For Destination name, choose Amazon S3.
  10. For Bucket details, choose the bucket you created earlier.
  11. Optionally, provide a prefix (folder) where you want the data to land within the bucket.
  12. Under Additional settings, for Data transfer preference, select Aggregate all records.
  13. For Choose how to trigger the flow¸ select Run on demand.
  14. Choose Next.
  15. On the Source to destination field mapping page, for Source field name, select the fields you want to work with and choose Map fields directly.

Alternatively, you can choose Map all fields directly to map all the fields from the object.

  1. On the Add filters page, add any filters for the data you’re pulling.
  2. On the Review and create page, review all the details and choose Create flow.
  3. After the flow is created, choose Run flow to run the flow and verify whether the flow ran successfully.

Create a dataset and project in DataBrew

To create a dataset and DataBrew project, complete the following steps:

  1. On the DataBrew console, choose Projects in the navigation pane.
  2. Choose Create project.
  3. For Project name, enter a name (for example, databrew-appflow-integration).
  4. For Select a dataset, select New dataset.
  5. For Dataset name, enter a name (for example, databrew-sfdc).
  6. From the list of sources, choose Amazon AppFlow.
  7. Select the flow you created.
  8. Under Permissions, for Role name, choose Create new IAM role.
  9. For New IAM role suffix, enter a suffix (for example, appflow-databrew).
  10. Choose Create project.

After you create the project, data is loaded to DataBrew so that you can perform data preparation activities.

Prepare data and create a recipe

With DataBrew, you can choose from over 250 pre-built transformations to automate data preparation tasks, all without the need to write any code. In this post, we only discuss a few of them. For the full list of transformations, see Recipe step and function reference.

In this step, we split the CloseDate column to CloseYear, CloseMonth, and CloseDay. Then we flag the outliers in the Amount column.

  1. Duplicate the column CloseDate by choosing the column and choosing Duplicate.
  2. For Duplicate column name, enter a name.
  3. Choose Apply.
  4. Select the column you created and on the Clean menu, choose Replace value or pattern.
  5. For Value to be replaced, select Enter custom value and enter -.
  6. Choose Apply.

This replaces – with empty values.

  1. Select the modified column and on the options menu, choose Split menu and At positions from beginning.
  2. For Position from the beginning¸ enter 4.
  3. Choose Apply.

This creates a new column with the year value.

Next, we split the column at position 2 from the beginning in CloseDate_copy_2 to extract month and day.

  1. On the options menu, choose Split column.
  2. Rename the CloseDate_copy_1 column to CloseYear and choose Apply.
  3. Repeat the steps to rename the other two newly created columns to CloseMonth and CloseDay.
  4. Select the Amount column and on the Outliers menu, choose Flag outliers.
  5. For Standard deviation threshold, enter 3.
  6. Under Outlier actions, select Flag outliers.
  7. Choose Apply.

You can see that an additional column got added and the outliers are flagged.

All the steps that we performed so far are recorded under Recipe.

  1. Under Recipe, choose Publish.
  2. For Version description, enter a description.
  3. Choose Publish.

This saves the recipe for future use.

Create a DataBrew job

To create a DataBrew job, complete the following steps:

  1. On the DataBrew console, choose Jobs in the navigation pane.
  2. Choose Create job.
  3. For Job name, enter a name (for example, databrew-appflow-job).
  4. For Select a dataset, choose the dataset we created (databrew-sfdc).
  5. For Select a recipe, choose the recipe we created (databrew-appflow-integration-recipe).
  6. In the Job output settings section, for Output to, choose Amazon S3.
  7. For S3 location, enter the S3 path for the data (for example, s3://databrew-appflow-data-prep-<your name>/processed/).
  8. For Role name, choose the role with suffix databrew-appflow-role.
  9. Choose Create and run job.

Create a crawler to catalog the data

To create your AWS Glue crawler, complete the following steps:

  1. On the AWS Glue console, choose Crawlers.
  2. Choose Add crawler.
  3. For Crawler name¸ enter a name (for example, databrew-opportunity-data).
  4. Choose Next.
  5. Under Specify crawler source type, keep the default options and choose Next.
  6. Under Add a data store, for Include path, choose the S3 bucket that we used for the processed data (for example, s3://databrew-appflow-data-prep-<your name>/processed).
  7. Choose Next.
  8. For Add another data, select No.
  9. Choose Next.
  10. Select Create an IAM role and provide a suffix for the role (for example, databrew).
  11. For Frequency, choose Run on demand.
  12. On the next page, choose Add database.
  13. Enter a database name (for example, databrew-appflow).
  14. Choose Create.
  15. For Prefix, enter opportunity_.
  16. Choose Next.
  17. Review the details and choose Finish.
  18. After the crawler is created, select it and choose Run crawler.

The crawler catalogs the data that we uploaded to Amazon S3 after processing using DataBrew.

Analyze data using Athena

When the crawler is complete, we can analyze the data with Athena.

  1. On the AWS Glue console, choose the database we created.
  2. Under Data catalog, choose Tables in databrew-appflow.

You can see a table named opportunity_processed, which points to the Amazon S3 location where the processed data was landed.

  1. Select the table name.
  2. On the Action menu, choose View data.

A pop-up may appear to let you know that you’re going to the Athena console.

  1. Choose Preview data.

If this is the first time using Athena in this account, you have to set the query result location.

  1. Run a query in Athena.

You should be able to see the data in Amazon S3.

You can perform further analysis by running more queries on the data. The following query returns the expected revenue for based on various closeyear and closemonth combinations of opportunities:

SELECT closeyear, closemonth, SUM(expectedrevenue) FROM  "AwsDataCatalog"."databrew-appflow"."opportunity_processed" 
GROUP BY  closeyear, closemonth;

Clean up

You may want to clean up the demo environment when you are done. To do so, delete the following resources that were created as part of this post:

  • S3 bucket (databrew-appflow-data-prep-<your name>)
  • Connection to Salesforce in Amazon AppFlow (sfdc-appflow)
  • Flow in Amazon AppFlow (salesforce-data)
  • Dataset (databrew-sfdc), project (databrew-appflow-integration), and job (databrew-appflow-job) in DataBrew
  • AWS Glue Data Catalog database (databrew-appflow)
  • IAM role (AWSGlueDataBrewServiceRole-appflow-databrew)

Conclusion

In this post, we walked you through how to extract data from Salesforce.com using the native integration that DataBrew has with Amazon AppFlow. We also demonstrated how to prepare the data for analytical use cases using DataBrew, operationalize the data preparation steps by creating a recipe and use that in a DataBrew job, store the job result in Amazon S3, and query it with Athena.

If you have any questions or suggestions, please leave a comment.


About the Authors

Ramkumar Nottath is a Sr. Solutions Architect at AWS focusing on Analytics services. He enjoys working with various customers to help them build scalable, reliable big data and analytics solutions. His interests extend to various technologies such as analytics, data warehousing, streaming, and machine learning. He loves spending time with his family and friends.

Srikanth Sopirala is a Principal Analytics Specialist Solutions Architect at AWS. He is a seasoned leader with over 20 years of experience, who is passionate about helping customers build scalable data and analytics solutions to gain timely insights and make critical business decisions. In his spare time, he enjoys reading, spending time with his family, and road cycling.