Post Syndicated from Sergey Simonenko original https://blog.zabbix.com/defining-flexible-problem-thresholds-with-the-new-trigger-syntax-by-sergey-simonenko-zabbix-summit-online-2021/19091/
Introduced in Zabbix 5.4, the new trigger expression syntax enables a problem detection logic that is more sophisticated and flexible than ever before. In addition to changing the syntax, the existing trigger functions have also been reworked. Many new functions have been added, redundant functions have been removed while existing functions have been improved to support many new use cases. In this blog post, we will take a look at the new trigger syntax and functions, as well as further trigger function improvements that will be added in Zabbix 6.0 LTS.
The full recording of the speech is available on the official Zabbix Youtube channel.
New syntax and functions
Changing the trigger syntax was one of the major improvements that we rolled out between Zabbix 5.0 LTS and Zabbix 6.0 LTS. The new syntax helped us get rid of multiple limitations that restricted the flexibility of the old syntax. At the same time, we were able to make the syntax more simple and intuitive, as well as unify it for usage in trigger expressions, calculated items, map labels, and more.
Let’s compare how calculated items and triggers look with the new syntax:
- Let’s look at a calculated item
avg(/host/system.cpu.util,1h)
- And compare it with a trigger expression
avg(/host/system.cpu.util,1h)>25
As you can see, both expressions look extremely similar. The only major difference is the usage of a threshold value in the trigger expression. Note that most of the functions can be used in calculated items and triggers.
Note – when you’re upgrading to Zabbix 6.0 LTS, your triggers calculated and aggregated items will be automatically converted to the new syntax!
Smart parameters
One of the major improvements brought on by the new syntax is the support of smart parameters. It is now no longer necessary to pass an exact host and item to every function. Only history and protective functions require them. This means that, for example, date and time functions like now and time don’t require a host/item reference:
- History function:
last(/host/item)=“success”
- Date and time function:
time()>=090000
Note that it is still required to have at least one function which references a host/item in the expression.
Time and time shift
While designing the new trigger syntax, we also made a decision to combine time and time shift parameters into a single parameter:
(sec|#num)<:time shift>
We can now group the time shift expression into two types: absolute time shift and relative time shift.
With relative time shift, we can add or subtract time units to analyze metrics collected during some time period. Here you can see a relative time shift for analyzing the data for one hour (1h) from the previous day (now-1d):
1h:now-1d
The absolute time periods can be recognized by the forward-slash symbol after the now, which references the current time. We then have to specify the time unit that we wish to use, like day or week (d or w). Absolute time periods analyze data based on the time interval which is used. For example, in the case of the day period, the function will analyze the data from midnight to midnight, or in the case of the week – from Monday to Sunday. Here are some examples of absolute time shifts:
- An hour one day ago:
1h:now-1d
- Yesterday
1d:now/d
- Today
1d:now/d+1d
- Last 2 days
2d:now/d+1d
- Last week
1w:now/w
- This week
1w:now/w+1w
Nested functions
The new trigger syntax also allows us to write nested functions. This means, that now we can use the returned value of one function as a parameter for another function. For example, instead of using the abschange function, which has now been removed, we can obtain an absolute value by using abs as a nested function. This way, we can obtain an absolute value for a result of another function:
abs(last(/host/item))
Similarly, we have replaced the strlen function. Now we can use the length function and obtain the length from any string value returned by another nested function:
length(find(/host/item,“pattern”))
We can also use functions such as min, max, and many other functions to obtain value from multiple nested functions. For example, here is how we can obtain a minimum value from the two resulting last values:
min(last(/host1/item),last(/host2/item))
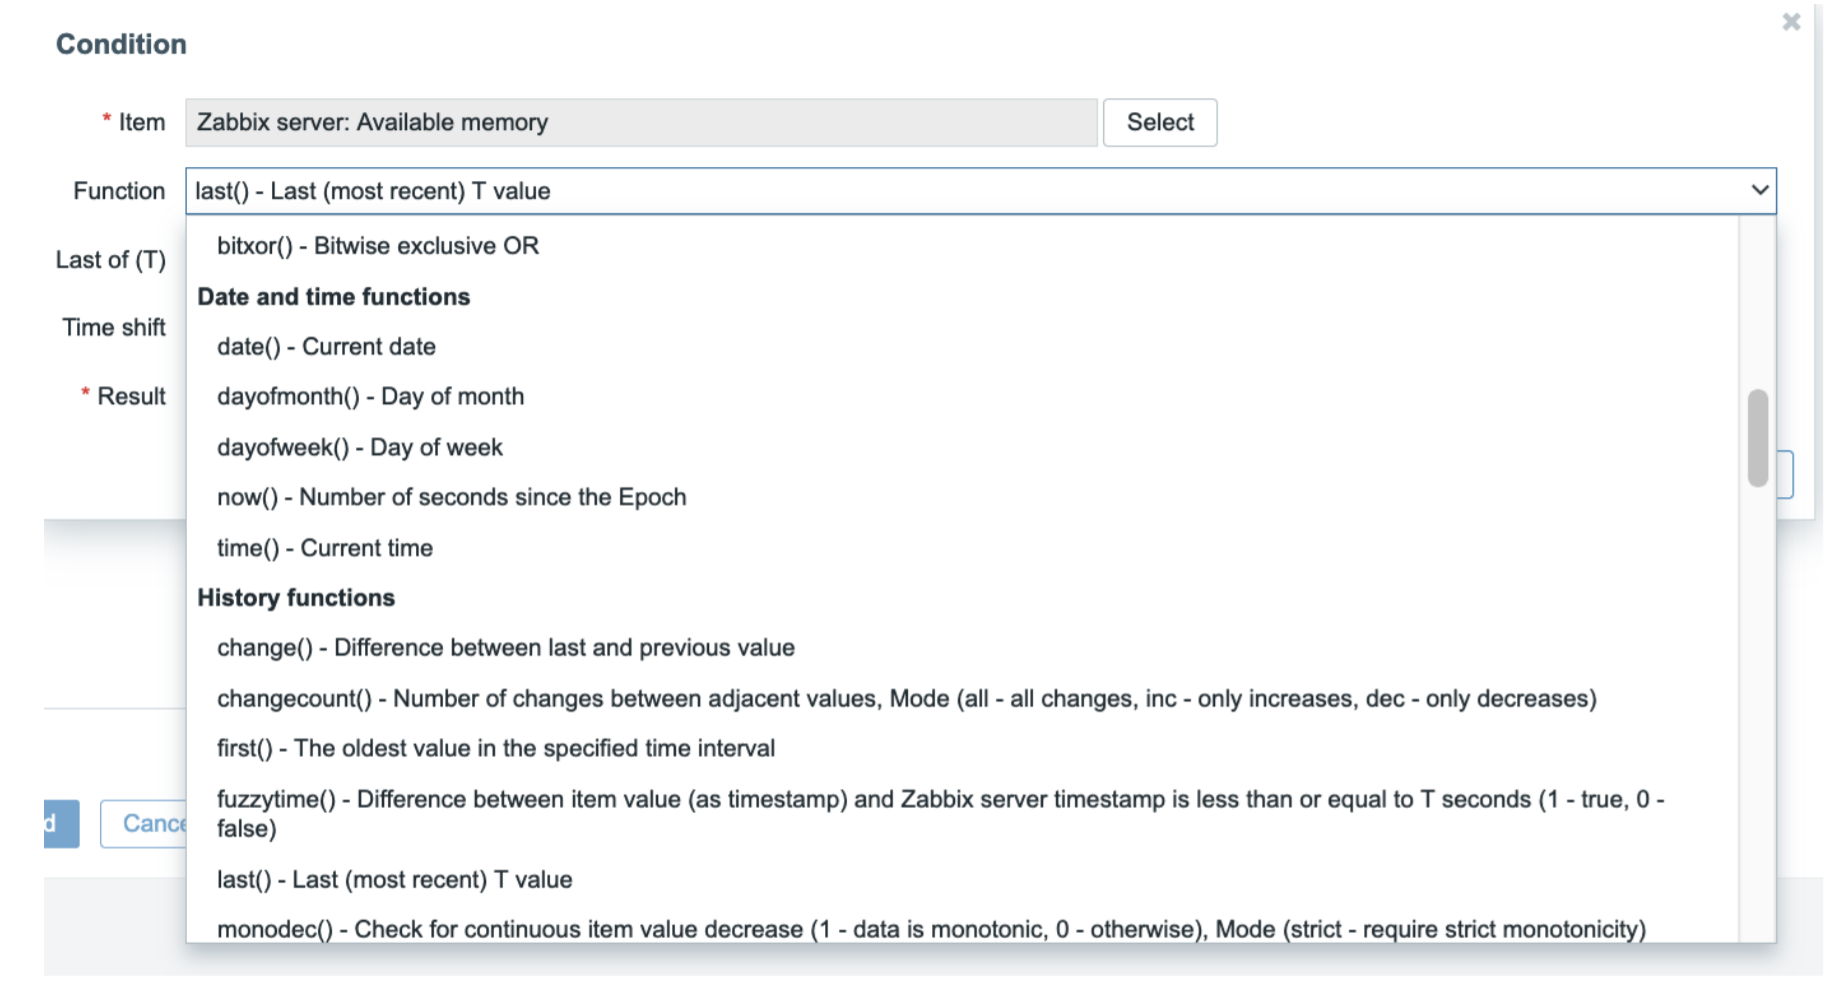
New trigger functions
Trigger functions are now grouped according to their purpose and functionality. This can be seen both in the frontend and in our documentation:
- History functions – operate with historical data
- Aggregate functions – allow to sum, find minimums, maximums and perform other aggregations on your values
- Operator functions – check if a value belongs in range/is one of the acceptable values.
- Mathematical functions – perform mathematical operations like finding absolute values, rounding your values, obtaining logarithm values, and more.
- Date and time functions like date, now, time, etc.
New string and math functions
We have greatly expanded the number of available string and math functions. Now you can find a specific character in a string, perform multiple types of trims on the value, obtain byte or bit lengths, and more:
- left, right, mid – character(s) at a given position
- insert, replace, concat – modify the string value
- trim, ltrim, rtrim – different types of trim functions
- ascii, bitlength, bytelength – obtain ascii code of the leftmost character or value length in bits or bytes
The greatly expanded set of mathematical functions enables our users to analyze different types of metrics:
- sin, tan, cos – functions for angle values
- exp, expm1 – Euler’s number of a value
- log, log10 – logarithm of a value
- rand – return a random integer
Operator functions
The operator functions used in the old syntax have been simplified. Now you can use these functions to write more compact and more readable trigger expressions:
- Detecting if the obtained value is between two values with the old trigger syntax:
{HOST:ITEM.last()}>=1 and {HOST:ITEM.last()}<=10
- Detecting if the obtained value is between two values with the new trigger syntax:
between(last(/host/item),1,10)=1
- Detecting if the obtained value is equal to a value within a set of values with the old syntax:
{HOST:ITEM.last()}=1 or {HOST:ITEM.last()}=2 or {HOST:ITEM.last()}=3…
- Detecting if the obtained value is equal to a value within a set of values with the new syntax:
in(last(/host/item),1,2,3,…)=1
New history and aggregate functions
Zabbix 6.0 LTS adds a couple of new history and aggregate functions which once again help you to define dynamic expressions in a very simple manner:
- monoinc, monodec – detect monotonic increase or decrease in a set of historical values
- Allows to detect unexpected data growth or data decrease, for example – growth in a message queue
- changecount – count the number of changes (all changes or only increases or decreases) between adjacent historical values
- rate, bucket_percentile, histogram_quantile – Functions that improve the analysis of Prometheus exporter metrics
Additional changes
Some of the redundant functions have also been removed. We observed that these functions often time caused additional confusion and clutter, so functions such as delta, diff, and prev have been removed:
- Instead of delta use:
max(/host/item, #100) - min(/host/item, #100)
- Instead of diff use:
last(/host/item) != last(/host/item, #2)
- Instead of prev use:
last(/host/item, #2)
Aggregate calculations
If you have used aggregate calculations before Zabbix 5.4, you may recall that we had a separate type of item explicitly for defining aggregate checks. This could cause some confusion, since both calculated items and aggregate checks served a similar purpose but had to be configured in different ways. For example, calculated items had a separate formula field, where the calculated item logic was performed, while the item key could be defined in an arbitrary fashion. On the other hand, in aggregate checks, the aggregation formula had to be defined in the item key itself – with strict key syntax in mind. In Zabbix 5.4, we finally solved this by removing the aggregate check item type and allowing for aggregate checks to be defined as a calculated item:
- Aggregate checks are now a part of calculated items
- Old syntax allowed to perform aggregate calculations based only on a single host group and an exact item key
- We have introduced the ability to use filters and wildcards to address multiple host groups and keys
- This was a top-voted feature request from the Zabbix community
The new syntax is not limited to a single host group for aggregate calculations. You can use tags, multiple host groups, and complex and/or logical operations with multiple clauses. For example, this is how you would calculate the average CPU load on a certain set of servers:
avg(last_foreach(/*/system.cpu.load?[group="Servers A" or group=“Servers B" or (group=“Servers C" and tag=“Importance:High")]))
Let’s deconstruct the expression below:
- We can see that this is a nested expression. The last_foreach function returns an array of values – the last value for each matching item. These values will be used to calculate the average value of our CPU load, as per the initial avg function
- You can think of the question mark as a WHERE statement in SQL. It signifies that we will try and pick up the item values from hosts in matching host groups or matching specific tags
- We are collecting CPU load values from hosts in Servers A or Servers B host groups
- We are also picking up CPU load values from the Servers C host group if the tag and tag value match Importance:High
Aggregating discovered items
The new syntax can also be extremely helpful in use cases where we use low-level discovery (LLD) to discover our entities. For the sake of an example, let’s imagine that we are discovering network interfaces. Previously, if we wanted to perform some aggregations on the discovered entities, we had to create an aggregate item that would contain information about all of the discovered items. This caused an issue when a new interface was discovered – we had to manually adjust the aggregate item.
The support of wildcards in aggregate calculations resolves this problem. Let’s look at an example:
sum(last_foreach(/*/net.if.in[*,bytes]?[group=“Customer A”]))
Instead of explicitly specifying an interface in the item key parameters, we are using a wild card – any interface discovered on hosts in the Customer A host group will be used in the aggregate calculation. This way, we will obtain the sum of incoming traffic for Customer A.
But this is just a high-level overview of the most commonly used functions and new interesting use cases. If you wish to see the full list of supported functions together with examples of how to use them – please take a look at our documentation. If you have any questions or additional use-cases that you wish to discuss, don’t hesitate and leave a comment right below this post!
The post Defining flexible problem thresholds with the new trigger syntax by Sergey Simonenko / Zabbix Summit Online 2021 appeared first on Zabbix Blog.