Post Syndicated from Sheldon Sides original https://aws.amazon.com/blogs/security/analyze-and-understand-iam-role-usage-with-amazon-detective/
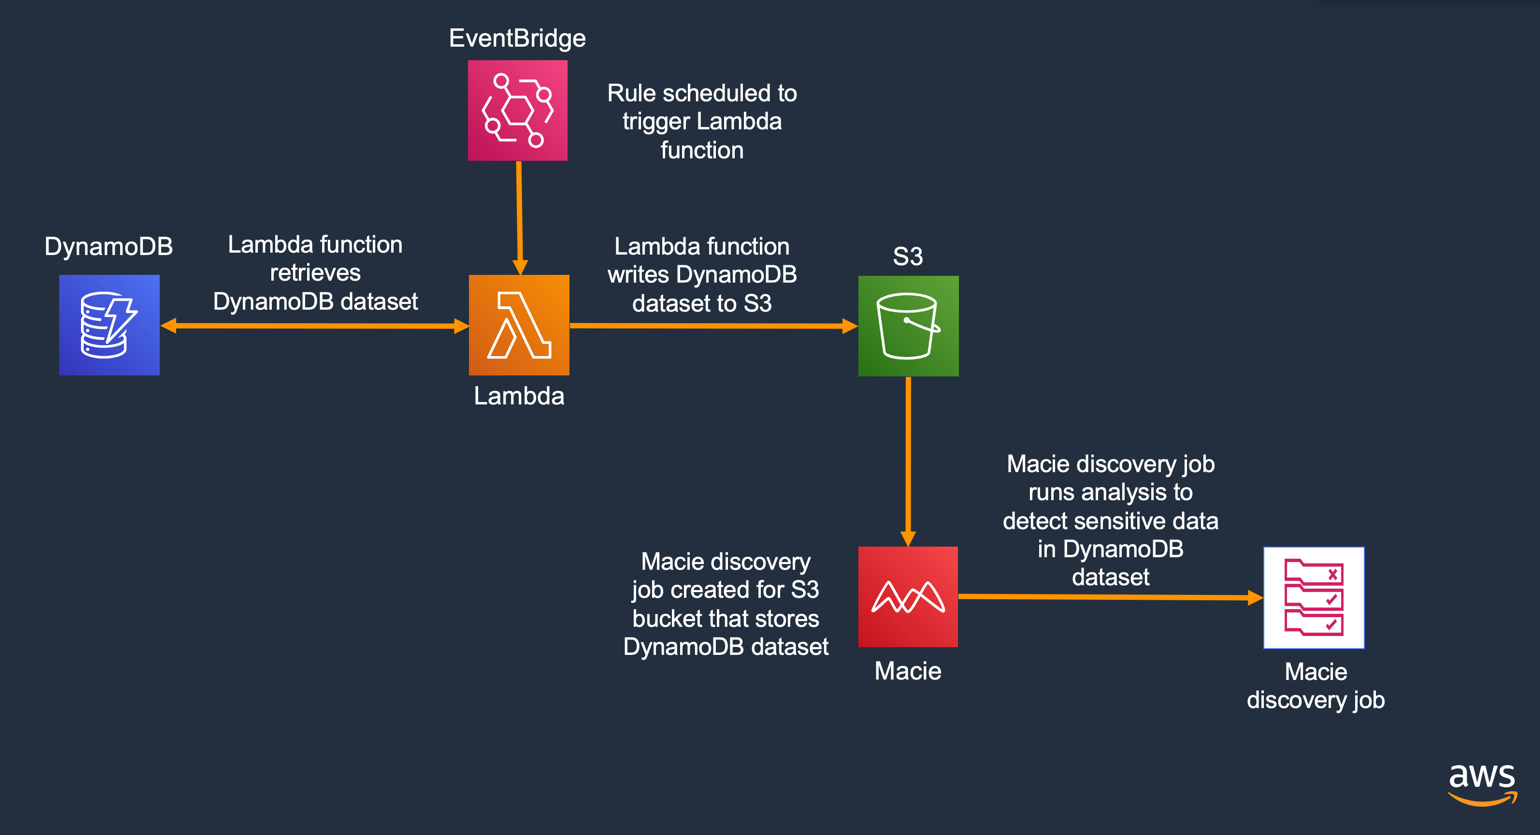
In this blog post, we’ll demonstrate how you can use Amazon Detective’s new role session analysis feature to investigate security findings that are tied to the usage of an AWS Identity and Access Management (IAM) role. You’ll learn about how you can use this new role session analysis feature to determine which Amazon Web Services (AWS) resource assumed the role that triggered a finding, and to understand the context of the activities that the resource performed when the finding was triggered. As a result of this walkthrough, you’ll gain an understanding of how to quickly ascertain anomalous identity and access behaviors. While this demonstration utilizes an Amazon GuardDuty finding as a starting point, the techniques demonstrated within this post highlight how Detective can be utilized to investigate any access behaviors that are tied to using IAM roles.
IAM roles provide a valuable mechanism that you can use to delegate access to users and services for managing and accessing your AWS resources, but using IAM roles can make it more complex to determine who performed an action. AWS CloudTrail logs do track all usage tied to IAM roles, but attributing activity to a specific resource that assumed a role requires storage of CloudTrail logs and analysis of this log telemetry. Understanding role usage through log analysis gets even more complex if cross-account role assumptions are involved, since that requires you to collate and analyze logs from multiple accounts. In some cases, permissions may allow a resource to sequentially assume a series of different roles (role chaining), further complicating the attribution of activity to a specific resource.
With its built-in, multi-account log analysis, Detective’s new role session analysis feature provides visibility into role usage, cross-account role assumptions and into any role chaining activities that may have been performed across the accounts. With this feature, you can quickly determine who or what assumed a role, regardless of whether this was a federated, IAM user or other resource. The feature shows you when roles were assumed and for how long, and helps you determine the activities that were performed during the assumption. Detective visualizes these results based upon its automatic analysis of CloudTrail logs and VPC flow log traffic that it continuously processes for enabled accounts, regardless of whether these log sources are enabled on each account.
To demonstrate this feature, we’ll investigate a “CloudTrail logging disabled” finding that is triggered by Amazon GuardDuty as a result of activity performed by a resource that has assumed an IAM role. Amazon GuardDuty is an AWS service that continuously monitors for malicious or unauthorized behavior to help protect your AWS resources, including your AWS accounts, access keys, and EC2 instances. GuardDuty identifies unusual or unauthorized activity, like crypto-currency mining, access to data stored in S3 from unusual locations, or infrastructure deployments in a region that has never been used.
Start the investigation in GuardDuty
GuardDuty issues a CloudTrailLoggingDisabled finding to alert you that CloudTrail logging has been disabled in one of your accounts. This is an important finding, because it could indicate that an attacker is attempting to hide their tracks. Since Detective receives a copy of CloudTrail traffic directly from the AWS infrastructure, Detective will continue to receive API calls that are made after CloudTrail logging is disabled.
In order to properly investigate this type of finding and determine if this is an issue that you need to be concerned about, you’ll need to answer a few specific questions:
- You’ll need to determine which user or resource disabled CloudTrail.
- You’ll need to see what other actions they performed after disabling logging.
- You’ll want to understand if their access pattern and behavior is consistent with their previous access patterns and behaviors.
Let’s take a look at a CloudTrailLoggingDisabled finding in GuardDuty as we start trying to answer these questions. When you access the GuardDuty console, a list of your recent findings is displayed. In Figure 1, a filter has been applied to display the CloudTrailLoggingDisabled finding.
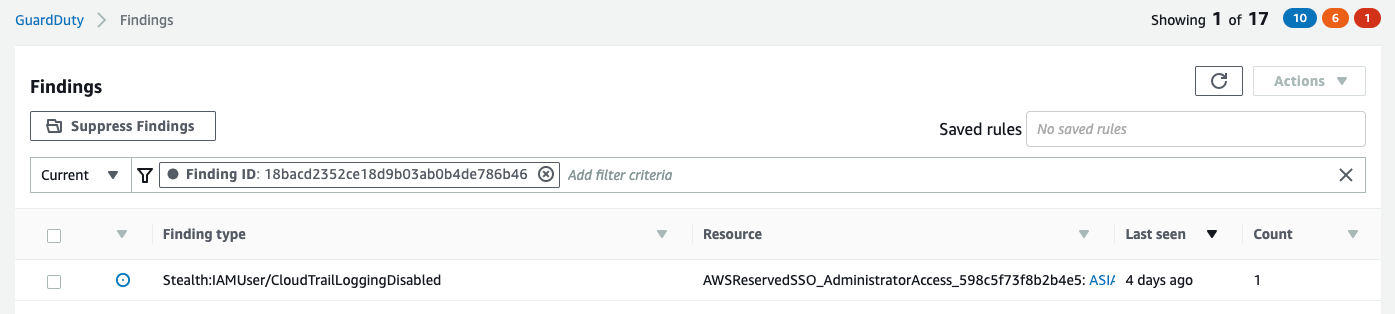
Figure 1: A GuardDuty finding showing that CloudTrail was disabled
After you select the GuardDuty finding, you can see the finding details, including some of the user information related to the finding. Figure 2 shows the Resources affected section of the finding.
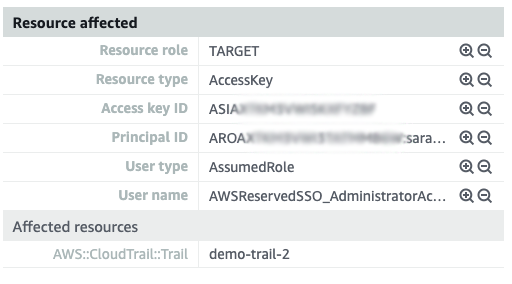
Figure 2: Viewing user data related to the GuardDuty finding
The Affected resources field indicates that the demo-trail-2 trail was where logging was disabled. You can also see that User type is set to AssumedRole and that User name contains the role AWSReservedSSO_AdministratorAccess_598c5f73f8b2b4e5. This was the role that was assumed and using which CloudTrail logging was disabled. This information can help you understand the resources this role delegates access to and the permissions it provides. You still need to identify who specifically assumed the role to disable CloudTrail logging and the activities they performed afterwards. You can use Amazon Detective to answer these questions.
Investigate the finding in Detective
In order to investigate this GuardDuty finding in Detective, you select the finding and then select Investigate in the Actions menu, as shown in Figure 3.
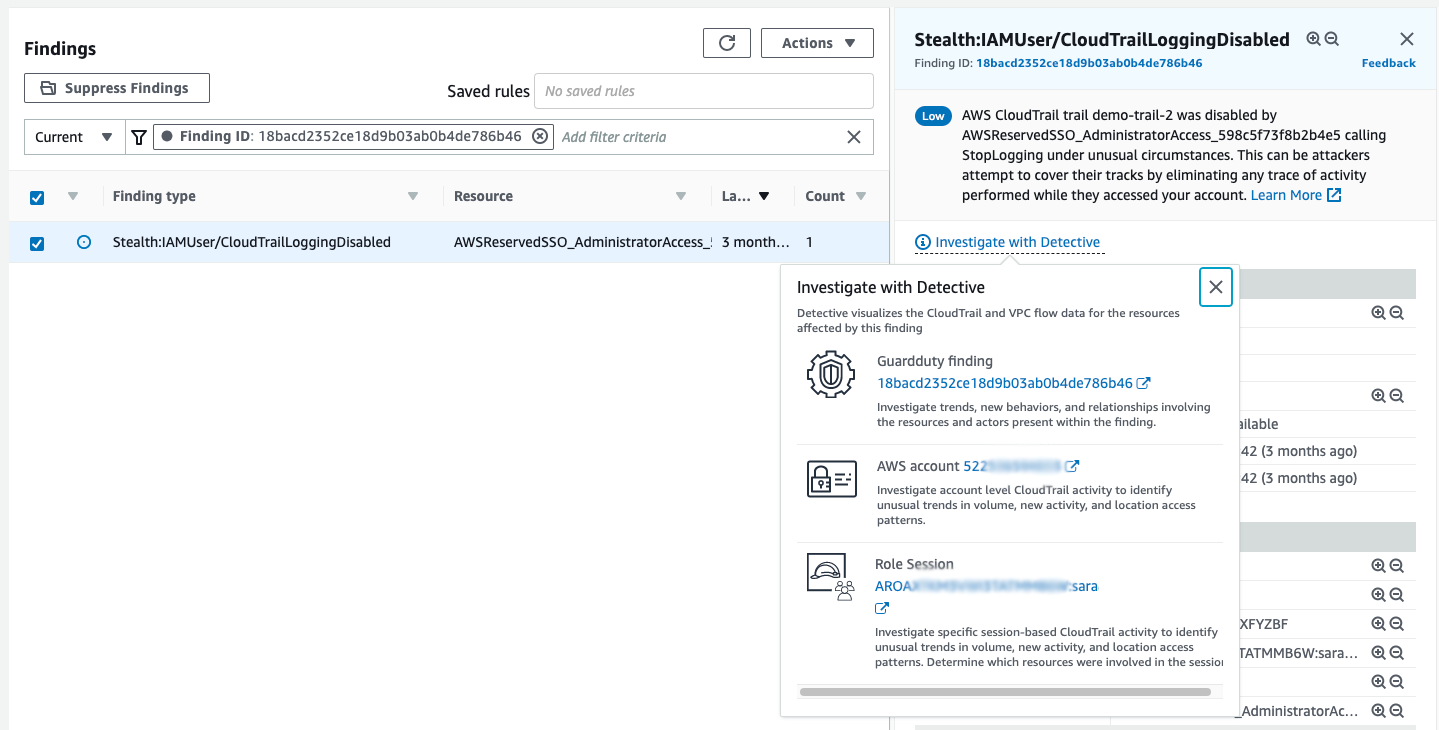
Figure 3: Choose ‘Investigate with Detective’ and select the GuardDuty finding ID on the pop-up to investigate the finding
View the finding profile page
Choosing the Investigate action for this CloudTrailLoggingDisabled finding in GuardDuty opens the finding’s profile page in the Detective console, as shown in Figure 4. Detective has the concept of a profile page, which displays summaries and analytics gleaned from CloudTrail management logs, VPC flow traffic and GuardDuty findings for AWS resources, IP addresses, and user agents. Each profile page can display up to 12 months of information for the selected resource and is intended to help an investigator review and understand the behavior of a resource, or quickly triage and delve into potential issues. Detective doesn’t require a customer to enable CloudTrail or VPC Flog logging in order to retrieve this data and provides these 12 months of visibility regardless of the customers log retention or archiving policies.
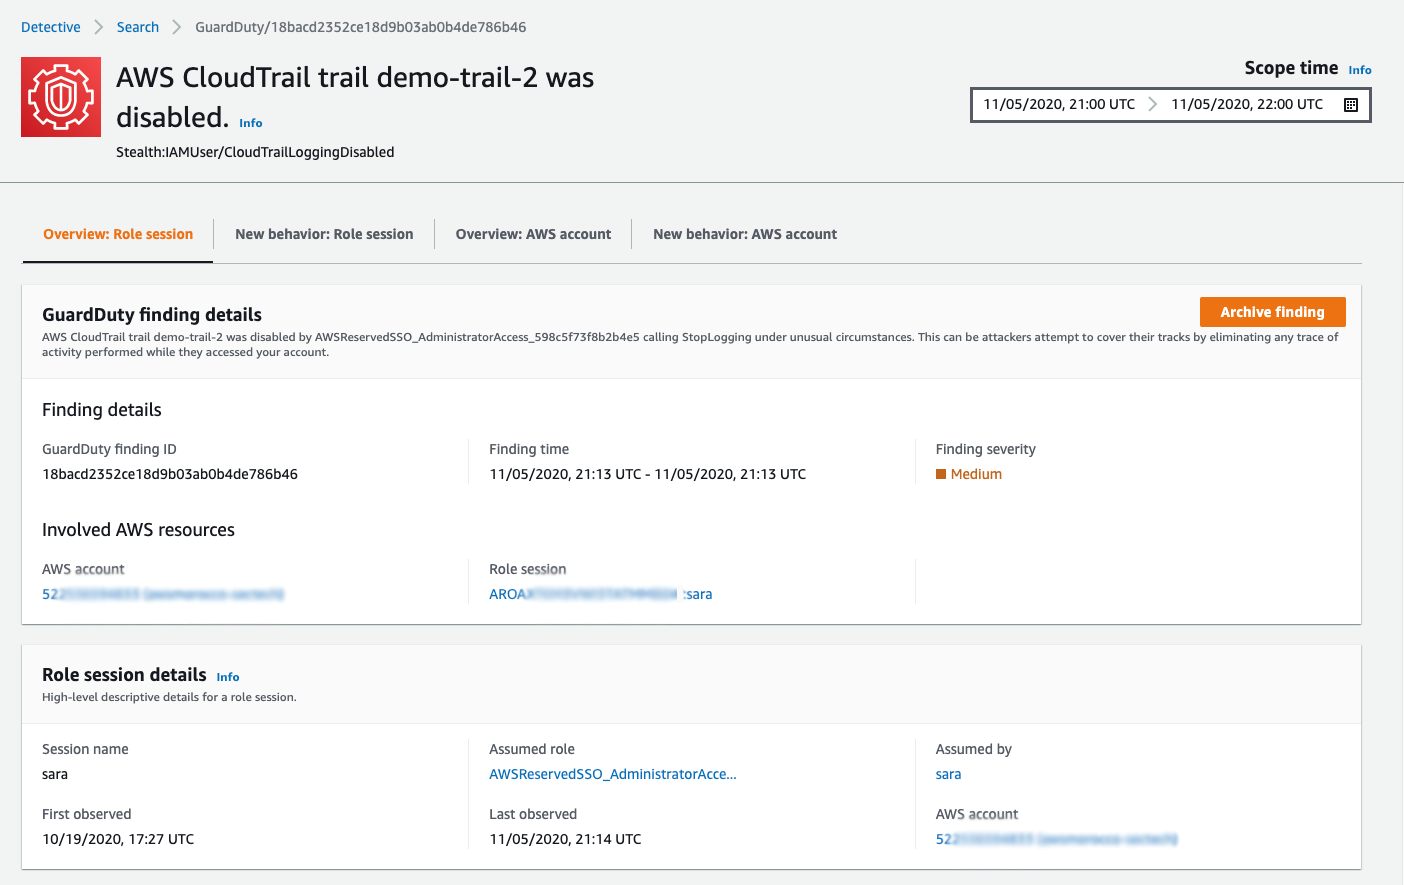
Figure 4: Viewing a GuardDuty finding in Detective
Scope time
To help focus your investigation, Detective defaults the time range and thus the displayed information in a finding profile to cover the period of time from when the finding was created through when it was last updated. In the case of this finding, the scope time covers a 1-hour period of time. You can change the scope time by choosing the calendar icon at the top right of the page, if you want to examine additional information before or after the finding was created. The defaulted scope time is sufficient for this investigation, so we can leave it as-is.
Role session overview
Detective uses tabs to group information on profile pages, and for this finding it shows the role session overview tab by default. The role session represents the activities and behavior of the resource that assumed the role tied to our finding. In this case, the role was assumed by someone with the user name sara, as shown in the Assumed by field. (We’ll assume that the user’s first name is Sara.) By analyzing the role session information in the CloudTrail logs, Detective was able to immediately identify that sara was the user who disabled CloudTrail logging and caused the finding to be triggered. You now have an answer to the question of who did this action.
Before we move to answer our other questions about what Sara did after disabling logging and whether her behavior changed, let’s discuss role sessions in more detail. Every role session has a role session name, sara in this case, and a unique role session identifier. The role session identifier is the role ID of the role assumed and the role session name, concatenated together. Best practices dictate that for a specific role that’s assumed by a specific resource, the role session name represents the user name of the IAM or federated user, or includes other useful information about the resource that assumed the role (for more information, see the Naming of individual IAM role sessions blog post). In this case, because the best practices are being followed, Detective is able to track Sara’s activities and behavior each time she assumes the AWSReservedSSO_AdministratorAccess_598c5f73f8b2b4e5 role.
Detective tracks statistics such as when a role session was first observed (October in Sara’s case, for this role), as well as the actions performed and behavioral insights such as the geolocations where Sara initiated her role assumptions. Knowing that Sara has assumed this role before is useful, because you can now assess whether her usage of the role changed during the 1-hour window of the scope time that you’re looking at now, compared to all of her previous assumptions of this role.
Review changes in Sara’s access patterns and operations
Detective tracks changes in geographical access and operations on the New behavior tab. Let’s choose the New behavior tab for the role session to see this information, as displayed in Figure 5.
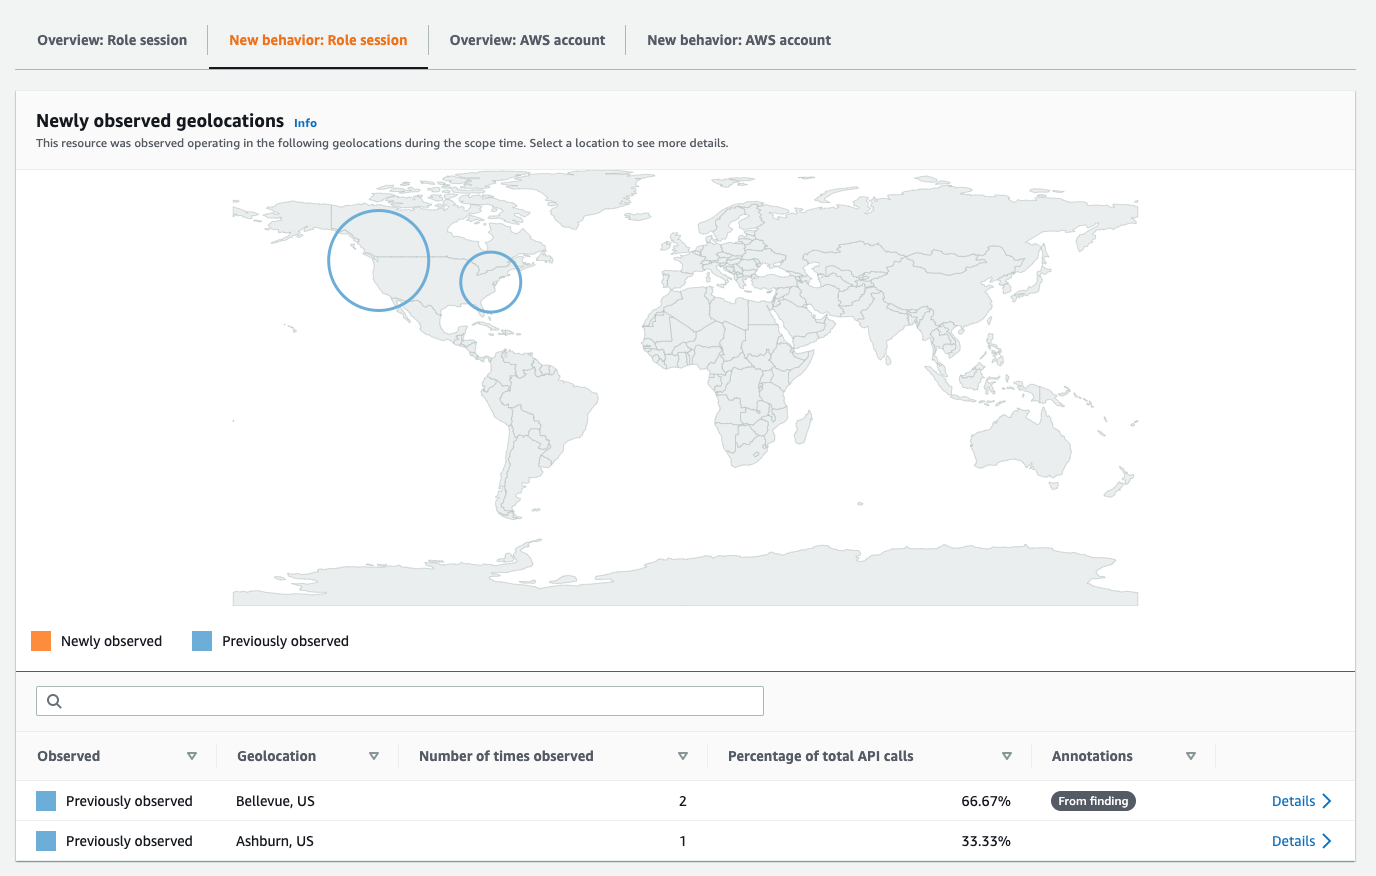
Figure 5: Viewing new role session behavior
During a security investigation, determining that access patterns have changed can be helpful in highlighting malicious activity. Since Detective tracks Sara’s assumptions of the AWSReservedSSO_AdministratorAccess_598c5f73f8b2b4e5 role, it can show the location where Sara assumed the role and whether the current assumption took place from the same location as her previous ones.
In Figure 5, you can see that Sara has a history of assuming the AWSReservedSSO_AdministratorAccess_598c5f73f8b2b4e5 role from Bellevue, WA and Ashburn, VA, since those geographies are shown in blue. If she had assumed this role from a new location, you would see the new location indicated on the map in orange. Since the API calls being made by this user are from a previously observed location, it’s very unlikely that the user’s credentials were compromised. Making this determination through a manual analysis of CloudTrail logs would have been much more time consuming.
Other information that you can gather from the New behavior role session tab includes newly observed API calls, API calls with increased volume, newly observed autonomous system organizations, and newly observed user agents. It’s useful to be able to validate that the operations Sara performed during the current scope time are relatively consistent with the operations she has performed in the past. This helps us be more certain that it was indeed Sara who was conducting this activity.
Investigate Sara’s API activity
Now that we’ve determined that Sara’s access pattern and activities are consistent with previous behavior, let’s use Detective to look further into Sara’s activity to determine if she accidentally disabled CloudTrail logging or if there was possible malicious intent behind her action.
To investigate the user’s actions
- On the finding profile page, in the dropdown list at the top of the screen, select Overview: Role Session to go back to the Overview tab for the role session.

Figure 6: Navigating to the ‘Overview: Role Session’ page
- Once you’re on the Overview tab, navigate to the Overall API call volume panel.

Figure 7: Navigating to the ‘Overall API call volume’ panel
This panel displays a chart of the successful and failed API calls that Sara has made while she assumes the AWSReservedSSO_AdministratorAccess_598c5f73f8b2b4e5 role. The chart shows a black rectangle around activities that were performed during the CloudTrail findings scope time. It also displays historical activities and shows a baseline across the chart so that you can understand how actively she uses the permissions granted to her by assuming this role.
- Choose the display details for scope time button to retrieve the details of the API calls that were invoked by Sara during the scope time, so that you can determine her actions after she disabled CloudTrail logging.

Figure 8: Displaying details based on scope time
You will now see the Overall API call volume panel expand to show you all the IP addresses, API calls, and access keys used by Sara during the scope time window of this finding.
- Choose the API method tab to see a list of all the API calls that were made.

Figure 9: Viewing the API methods called
She invoked just two API calls during this scope time: the StopLogging and AssumeRole API calls. You were already aware that Sara disabled CloudTrail logging, but you weren’t aware that she assumed another role. When a user assumes a role while they have another one assumed, this is called role chaining. Although role chaining can be used because a user needs additional permissions, it can also be used to hide activities. Because we don’t know what other actions Sara performed after assuming this second role, let’s dig further. That may shed light on why she chose to disable CloudTrail logging.


Examine chained role assumptions
To find out more about Sara’s use of role chaining, let’s look at the other role that she assumed during this role session.
To view the user’s other role
- Navigate back to the top of the finding profile page. In the Role session details panel, choose AWSReservedSSO_AdministratorAccess_598c5f73f8b2b4e5.

Figure 10: Locating the ‘Assumed role’ name
Detective displays the AWS Role profile page for this role, and you can now see the activity that has occurred across all resources that have assumed this role. In order to highlight information that’s relevant to the time frame of your investigation, Detective maintains your scope time as you move from the CloudTrailLoggingDisabled finding profile page to this role profile page.
- The goal for coming to this page is to determine which other role Sara assumed after assuming the AWSReservedSSO_AdministratorAccess_598c5f73f8b2b4e5 role, so choose the Resource interaction tab. On this tab, you will see the following three panels: Resources that assumed this role, Assumed roles, and Sessions involved.In Figure 11, you can see the Resources that assumed this role panel, which lists all the AWS resources that have assumed this role, their type (EC2 instance, federated or IAM user, IAM role), their account, and when they assumed the role for the first and last time. Sara is on this list, but Detective does not show an AWS account next to her because federated users aren’t tied to a specific account. The account field is populated for other resource types that are displayed on this panel and can be useful to understand cross-account role assumptions.

Figure 11: Viewing resources that have assumed a role
- On the same Resource Interaction tab, as you scroll down you will see the Assumed Roles panel, Figure 12, which helps you understand role chaining by listing the other roles that have been assumed by the AWSReservedSSO_AdministratorAccess_598c5f73f8b2b4e5 role. In this case, the role has assumed several other roles, including DemoRole1 during the same window of time when the CloudTrailLoggingDisabled finding occurred.

Figure 12: Viewing the roles that have been assumed
- In Figure 13, you can see the Sessions involved panel, which shows the role sessions for all the resources that have assumed this role, and role sessions where this role has assumed other roles within the current scope time. You see two role sessions with the session name sara, one where Sara assumed the AWSReservedSSO_AdministratorAccess_598c5f73f8b2b4e5 role and another where AWSReservedSSO_AdministratorAccess_598c5f73f8b2b4e5 assumed DemoRole1.

Figure 13: Viewing the role sessions this role was involved with


Now that you know that Sara also used the role DemoRole1 during her role session, let’s take a closer look at what actions she performed.
View API operations that were called within the chained role
In this step, we’ll view Sara’s activity within the DemoRole1 role, focusing on the API calls that were made.
To view the user’s activity in another role
- In the Sessions involved panel, in the Session name column, find the row where DemoRole1 is the Assumed Role value. Choose the session name in this row, sara, to go to the role session profile page.
- You will be most interested in the API methods that were called during this role session, and you can view those in the Overall API call volume panel. As shown in Figure 14, you can see that Sara has accessed DemoRole1 before, because there are calls graphed prior to the calls in our scope time.
- Choose the display details for scope time button on the Overall API call volume panel, and then choose the API method tab.

Figure 14: Viewing the role session API method calls

In Figure 14, you can see that calls were made to the DescribeInstances and RunInstances API methods. So you now know that Sara determined the type of Amazon Elastic Compute Cloud (Amazon EC2) instances that were running in your account and then successfully created an EC2 instance by calling the RunInstances API method. You can also see that successful and failed calls were made to the AttachRolePolicy API method as a part of the session. This could possibly be an attempt to elevate permissions in the account and would justify further investigation into the user’s actions.
As an investigator, you’ve determined that Sara was the user who disabled CloudTrail logging and that her access pattern was consistent with her past accesses. You’ve also determined the other actions she performed after she disabled logging and assumed a second role, but you can continue to investigate further by answering additional questions, such as:
- What did Sara do with DemoRole1 when she assumed this role in the past? Are her current activities consistent with those past activities?
- What activities are being performed across this account? Are those consistent with Sara’s activities?
By using Detective’s features that have been demonstrated in this post, you will be able to answer the questions like the ones listed above.
Summary
After you read this post, we hope you have a better understanding of the ways in which Amazon Detective collects, organizes, and presents log data to simplify your security investigations. All Detective service subscriptions include the new role session analysis capabilities. With these capabilities, you can quickly attribute activity performed under a role to a specific resource in your environment, understand cross-account role assumptions, determine role chaining behavior, and quickly see called APIs.
All customers receive a 30-day free trial when they enable Amazon Detective. See the AWS Regional Services page for all the Regions where Detective is available. To learn more, visit the Amazon Detective product page or see the additional resources at the end of this post to further expand your knowledge of Detective capabilities and features.
Additional resources
Amazon Detective overview and demo
Amazon Detective Regions, endpoints, and quotas
Naming of individual IAM role sessions
If you have feedback about this post, submit comments in the Comments section below.
Want more AWS Security how-to content, news, and feature announcements? Follow us on Twitter.