Amazon DevOps Guru is an ML powered service that makes it easy to improve an application’s operational performance and availability. By analyzing application metrics, logs, events and traces, DevOps Guru identifies behaviors that deviate from normal operating patterns and creates insights that you can use to improve your application.
At re:Invent 2021, we announced a new tagging feature in DevOps Guru. This feature allows you to organize resources into logical applications, using AWS resources tags so that you can have more control over how applications are defined. Well-defined applications enable DevOps Guru to group related anomalies together to better identify problems and to provide more meaningful recommendations. A tag is a label consisting of a user-defined key and a value. Previously, the coverage boundary consisted of an entire AWS account or specific resources defined by AWS CloudFormation stacks.
Getting Started
Define Resources to analyze using AWS resources tags
An AWS resource tag is a label that consists of a key and a value. A key-value pair can create useful grouping of resources into different applications. For DevOps Guru, you specify one tag key across all your applications. Resources with the same tag value are grouped together into a logical application. The tag key needs to be prefixed with the string “devops-guru-”. Note that the prefix string is not case sensitive. The tag value can be any value you define. The next section describes how you can use tag values to define coverage boundary for your applications.
You can add tags to your resources using the AWS service to which each resource belongs, or use the Tag Editor. To manage tags using your resource’s service, you can use the console, AWS CLI or SDK of the service.
Define Application boundary using AWS resources tag values
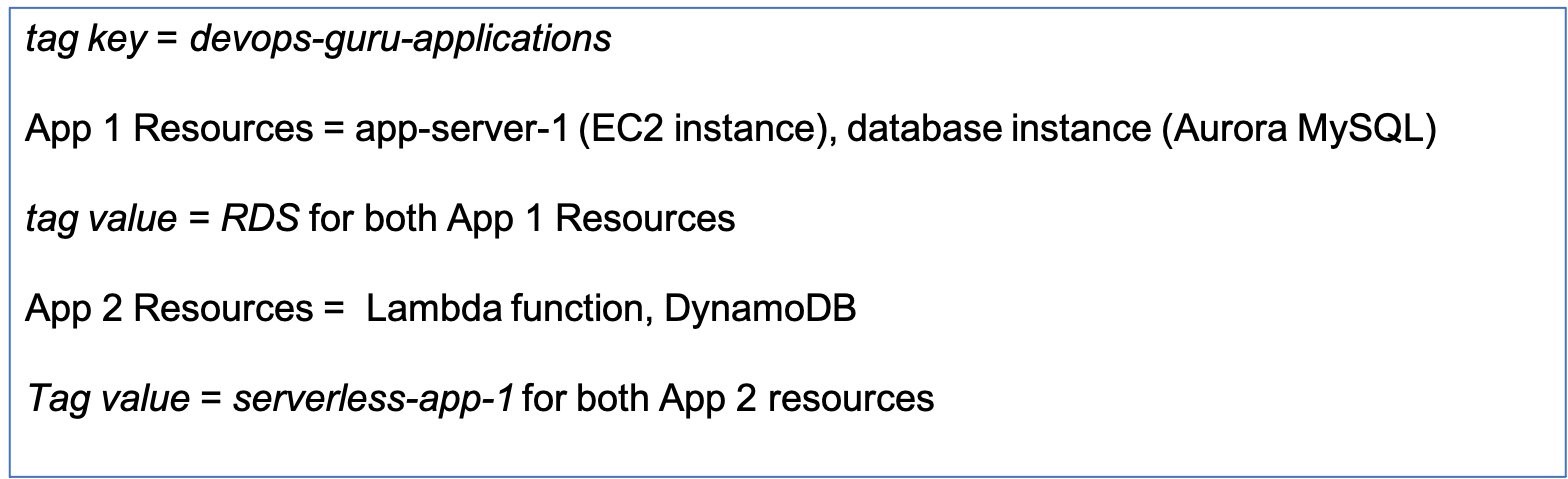
For DevOps Guru, we define an application as a group of instantiated AWS resources (Amazon EC2, AWS Lambda, Amazon RDS, etc.) that your workload is running on. You assign the same tag value to all resources that make up your application. DevOps Guru will analyze each resource separately, and will also look at metrics and events across all resources in your application to detect anomalies and generate insights. For example, see the diagram below.
App 1 consists of 2 different resources for a database application – an EC2 instance and a database instance. Assigning the same tag value of RDS to both of the resources. I have another serverless application in App 2, which has a Lambda function and a DynamoDB instance. I assign a different tag value of serverless-app-1 to both of the App 2 resources.
Example Test Scenario
I am going to create a test scenario with an application server running in an EC2 instance. The application server is connected to an Aurora MySQL-Compatible database instance. I will instrument my application to introduce a misbehaving SQL query to create a performance anomaly.
In my example below, I tagged my EC2 instance and database instance with the tag value of RDS. I am interested in detecting performance issues in my Database instance and I want DevOps Guru to provide recommendations to fix those issues.
Manage DevOpsGuru Analysis Coverage
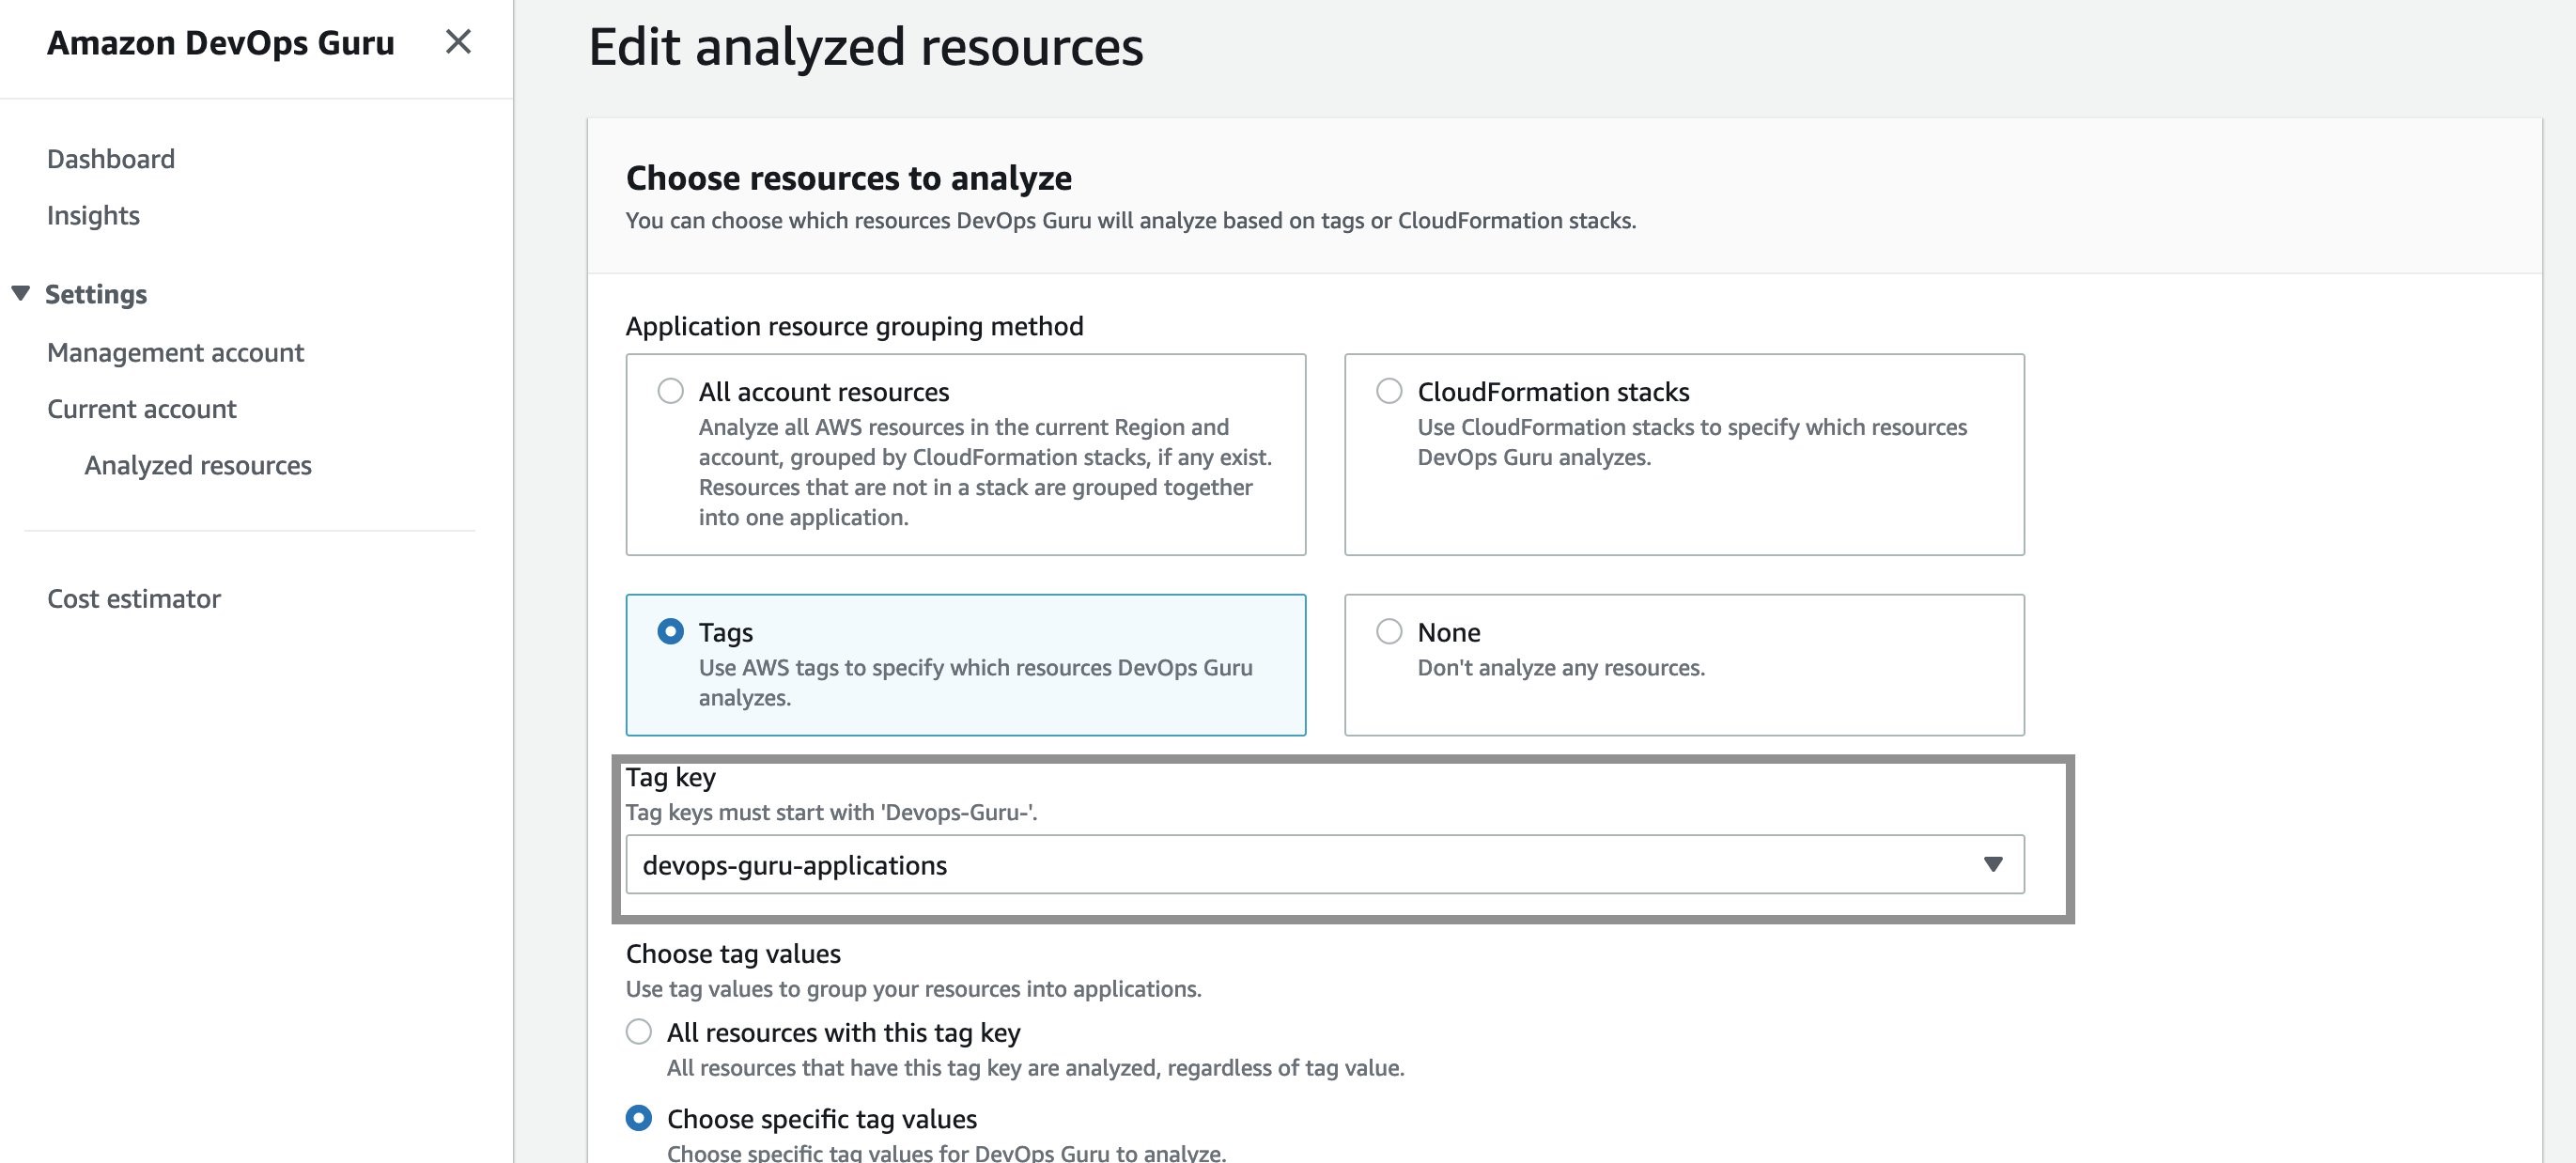
Next, I define the coverage boundary in DevOps Guru Console. In the Settings options in navigation pane, I select Analyzed resources and choose Edit.
Next, I select the “devops-guru-applications” as tag key from the dropdown menu. I am going to select RDS as the tag value, since I am interested in looking at performance issues in my Amazon Aurora database instance.
Filter insights by tags
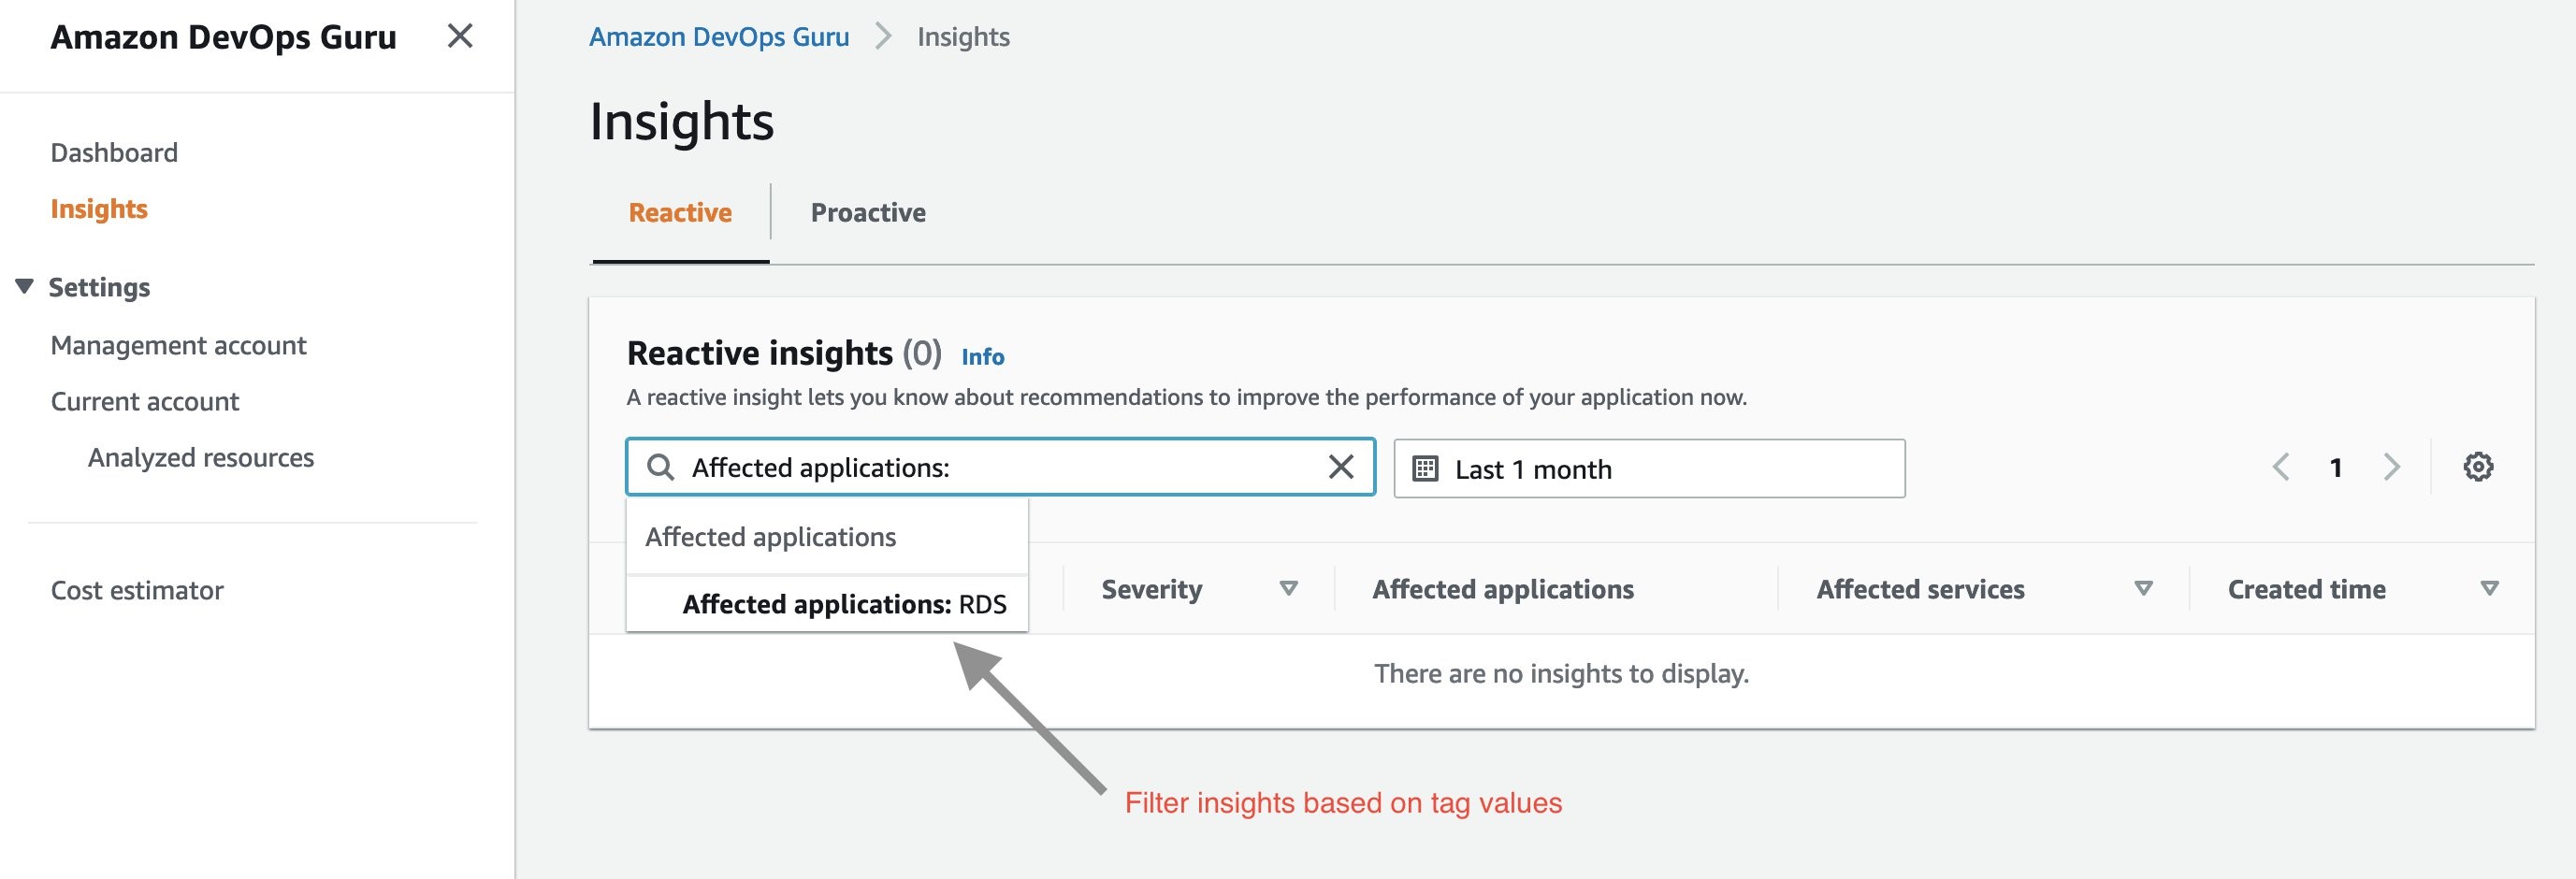
Next, I created my test scenario. Once DevOps Guru generated an insight, I am able to filter the insights by tag key or tag values. To display insights for my database instance, I select “Affected applications” from the search menu bar on insights page as shown below:
Next, I select “Affected applications” as RDS in the above dropdown menu. Below is the Insight overview screen that gets displayed.
The insights generated by DevOps Guru for my Amazon Aurora instances are enabled by Amazon DevOps Guru for RDS, a new feature we announced at re:Invent 2021. It allows developers to easily detect, diagnose, and resolve performance and operational issues in Amazon Aurora. For more information on Amazon DevOps Guru for RDS, see a related news blog written by my colleague, Marcia Villalba.
The insight summary indicates that there is high DB load, ten times above baseline. DevOps Guru for RDS uses anomaly detection on the database load (DB load) performance metric to detect issues. DB load is measured in units of Average Active Sessions (AAS). DB load measures the level of activity in your database, making it a great metric to understand the health of your database.
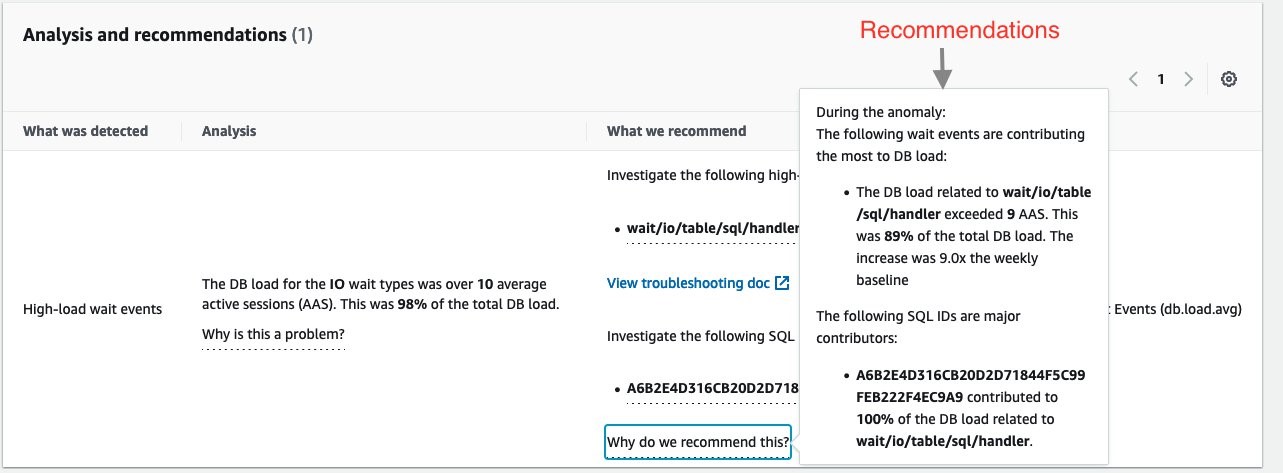
If you continue scrolling on the DevOps Guru for RDS analysis page, you can discover the cause for the problem and some recommendations to fix it. DevOps Guru for RDS detected there was a high load of wait events, and one SQL query was found to require further investigation. You can even see the exact SQL query if you click on the SQL digest IDs. The insight’s analysis and recommendation section is full of information on how to investigate further and fix the issue.
The easy-to-understand recommendations made by DevOps Guru for RDS means that as a DevOps engineer, you do not need to rely on a database administrator (DBA) or use any third party tools.
Conclusion
AWS resources tags give you one more way to specify the resource analysis coverage boundary, in addition to existing methods of an entire AWS account or specific AWS CloudFormation stacks. AWS tags allows you to better isolate the applications you want DevOps Guru to analyze. In this post, we used AWS tags to define the coverage boundary for a database application. We reduced unrelated and unnecessary resource coverage from our analysis, thereby controlling our resource analysis costs. Visit the DevOps Guru documentation to learn more about how to use tags to identify resources in your DevOps Guru applications.
Observability in a container-centric environment presents new challenges for operators due to the increasing number of abstractions and supporting infrastructure. In many cases, organizations can have hundreds of clusters and thousands of services/tasks/pods running concurrently. This post will demonstrate new features in Amazon DevOps Guru to help simplify and expand the capabilities of the operator. The features include grouping anomalies by metric and container cluster to improve context and simplify access and support for additional Amazon CloudWatch Container Insight metrics. An example of these capabilities in action would be that Amazon DevOps Guru can now identify anomalies in CPU, memory, or networking within Amazon Elastic Kubernetes Service (EKS), notifying the operators and letting them more easily navigate to the affected cluster to examine the collected data.
Amazon DevOps Guru offers a fully managed AIOps platform service that lets developers and operators improve application availability and resolve operational issues faster. It minimizes manual effort by leveraging machine learning (ML) powered recommendations. Its ML models take advantage of the expertise of AWS in operating highly available applications for the world’s largest ecommerce business for over 20 years. DevOps Guru automatically detects operational issues, predicts impending resource exhaustion, details likely causes, and recommends remediation actions.
Solution Overview
In this post, we will demonstrate the new Amazon DevOps Guru features around cluster grouping and additionally supported Amazon EKS metrics. To demonstrate these features, we will show you how to create a Kubernetes cluster, instrument the cluster using AWS Distro for OpenTelemetry, and then configure Amazon DevOps Guru to automate anomaly detection of EKS metrics. A previous blog provides detail on the AWS Distro for OpenTelemetry collector that is employed here.
Prerequisites
Install eksctl for creating Amazon Elastic Kubernetes Service Cluster
Install kubectl for managing Amazon Elastic Kubernetes Cluster
We employ the eksctl CLI tool to create an Amazon EKS. Using eksctl, you can provide details on the command line or specify a manifest file. The following manifest is used to create a single managed node using Amazon Elastic Compute Cloud (EC2), and this will be created and constrained to the specified Region via entry metadata/region and Availability Zones via the managedNodeGroups/availabilityZones entry. By default, this will create a new VPC with eight subnets.
To create an Amazon EKS cluster using eksctl and a manifest file, we use eksctl create as shown below. Note that this step will take 10 – 15 minutes to establish the cluster.
$ eksctl create cluster -f devopsguru-managed-node.yaml
2021-10-13 10:44:53 [i] eksctl version 0.69.0
…
2021-10-13 11:04:42 [✔] all EKS cluster resources for "devopsguru-eks-cluster" have been created
2021-10-13 11:04:44 [i] nodegroup "managed-ng-private" has 1 node(s)
2021-10-13 11:04:44 [i] node "<ip>.<region>.compute.internal" is ready
2021-10-13 11:04:44 [i] waiting for at least 1 node(s) to become ready in "managed-ng-private"
2021-10-13 11:04:44 [i] nodegroup "managed-ng-private" has 1 node(s)
2021-10-13 11:04:44 [i] node "<ip>.<region>.compute.internal" is ready
2021-10-13 11:04:47 [i] kubectl command should work with "/Users/<user>/.kube/config"
Once this is complete, you can use kubectl, the Kubernetes CLI, to access the managed nodes that are running.
$ kubectl get nodes
NAME STATUS ROLES AGE VERSION
<ip>.<region>.compute.internal Ready <none> 76m v1.21.4-eks-033ce7e
AWS Distro for OpenTelemetry Collector Installation
We will use AWS Distro for OpenTelemetry Collector to extract metrics from a pod running in Amazon EKS. This will collect metrics within the Kubernetes cluster and surface them to Amazon CloudWatch. We start by defining a policy to allow access. The following information comes from the post here.
Attach the CloudWatchAgentServerPolicy IAM Policy to worker node
$ kubectl get pods -l name=aws-otel-eks-ci -n aws-otel-eks
NAME READY STATUS RESTARTS AGE
aws-otel-eks-ci-jdf2w 1/1 Running 0 107m
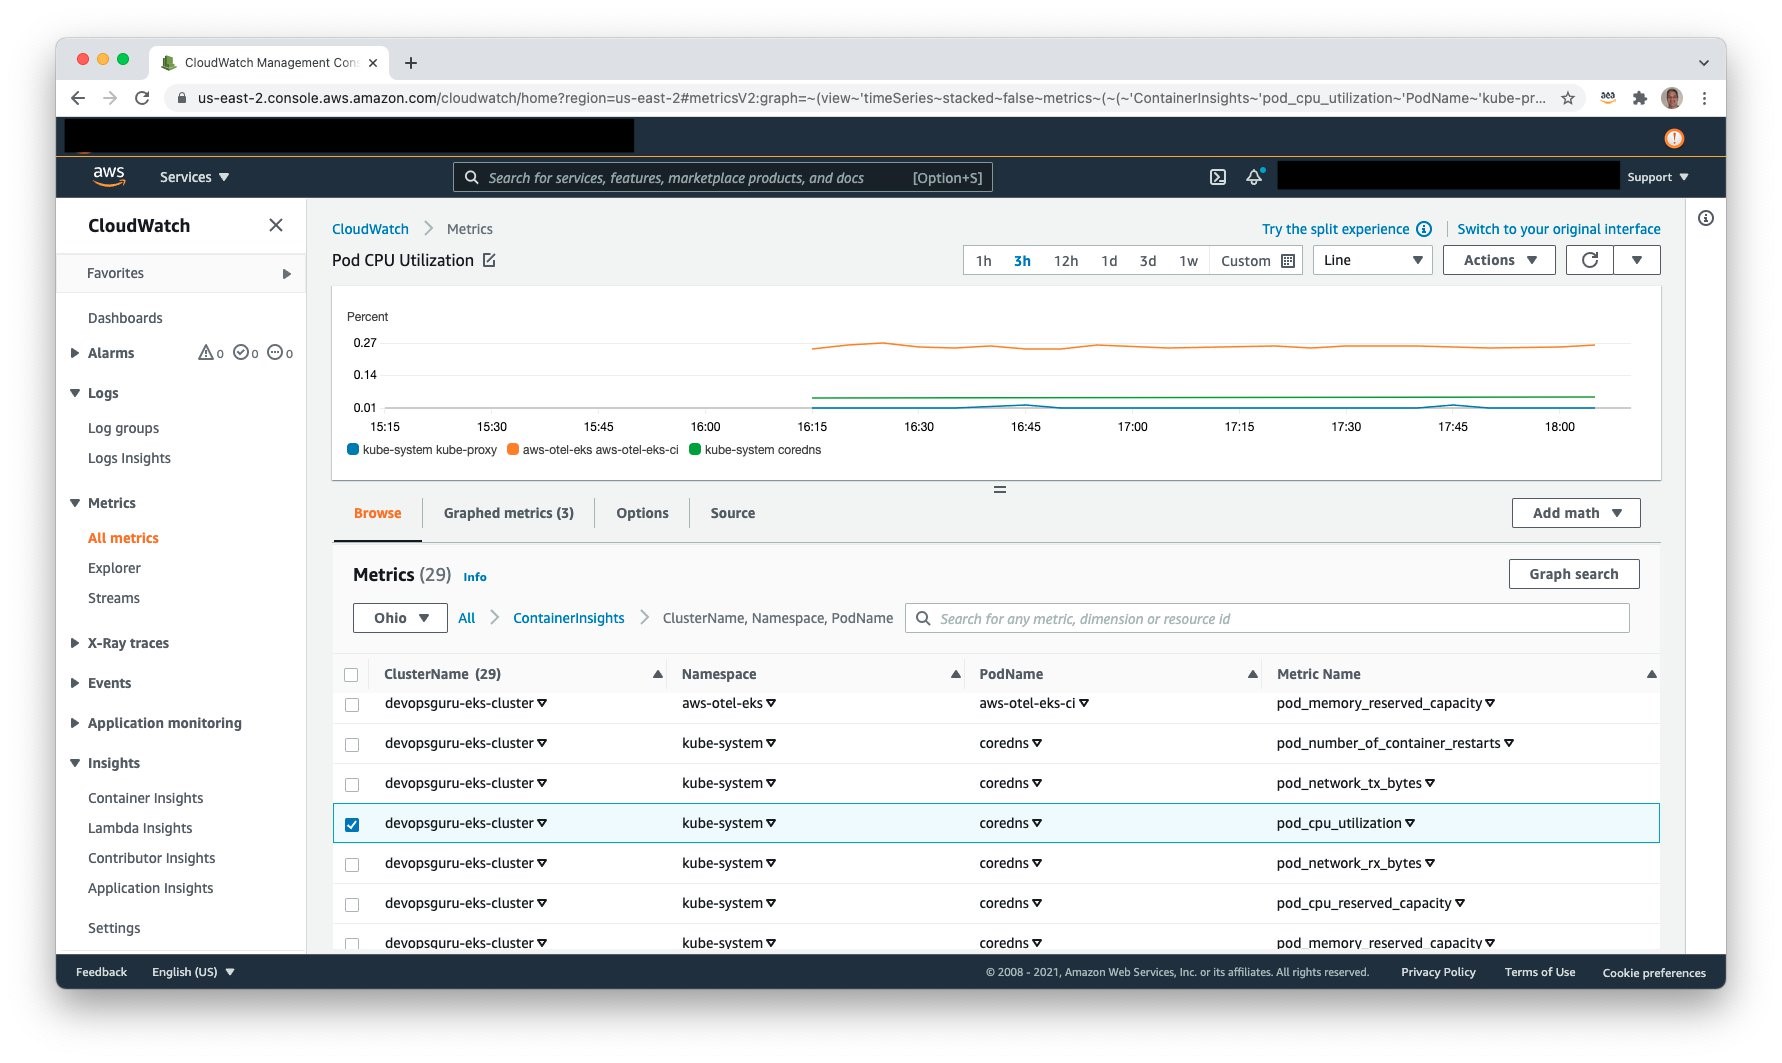
View Container Insight Metrics in Amazon CloudWatch
Access Amazon CloudWatch and select Metrics, All metrics to view the published metrics. Under Custom Namespaces, ContainerInsights is selectable. Under this, one can view metrics at the cluster, node, pod, namespace, and service granularity. The following example shows pod level metrics of CPU:
Amazon Simple Notification Service
It is necessary to allow Amazon DevOps Guru access to Amazon SNS in order for Amazon SNS to publish events. During the setup process, an Amazon SNS Topic is created, and the following resource policy is applied:
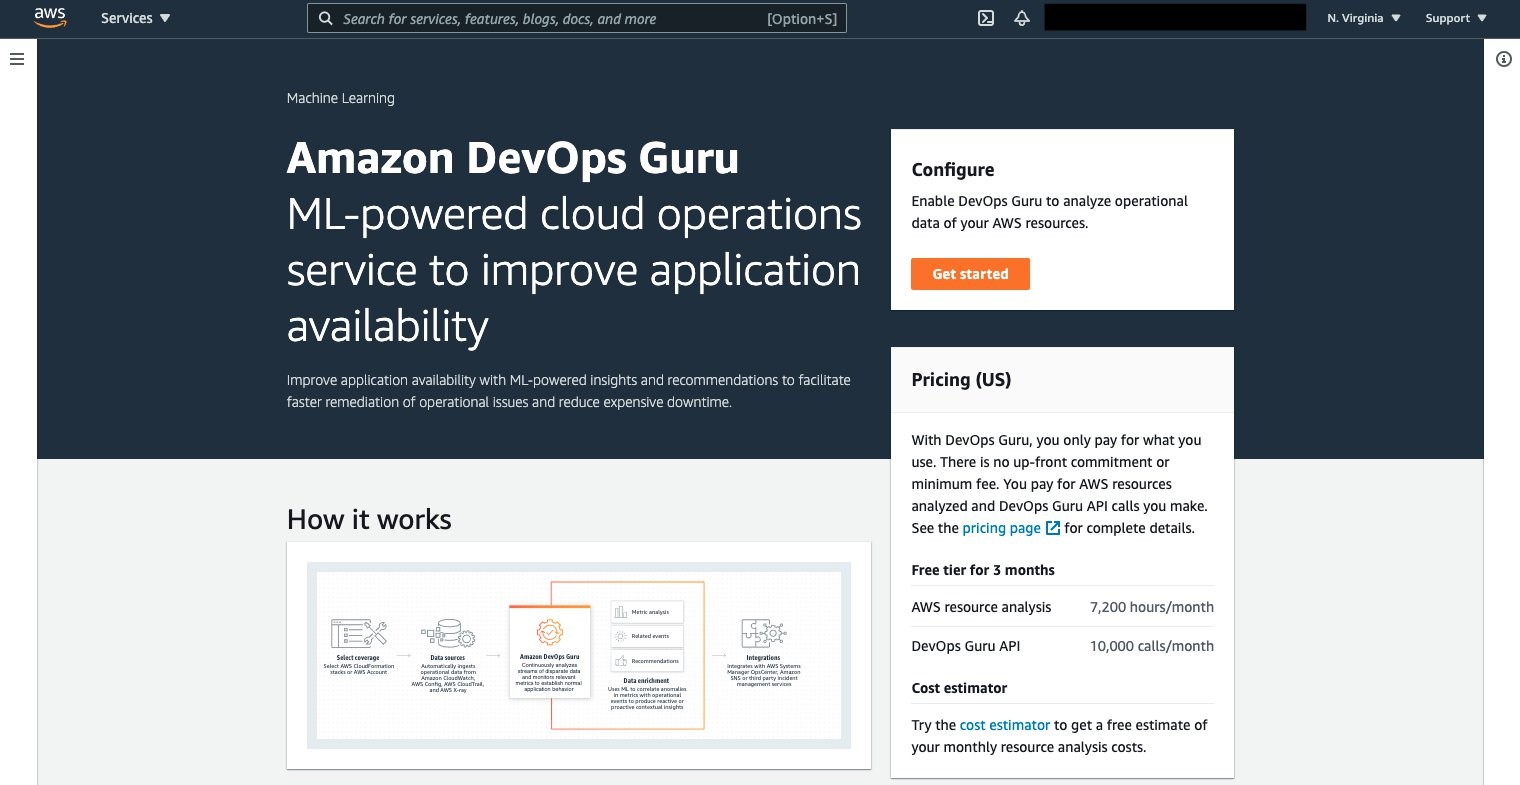
Amazon DevOps Guru can now be leveraged to monitor the Amazon EKS cluster and Managed Node Group. Select Amazon DevOps Guru, and select Get started as shown in the following figure to do this.
Once selected, the Get started console displays, letting you specify the IAM role for DevOps guru to access the appropriate resources.
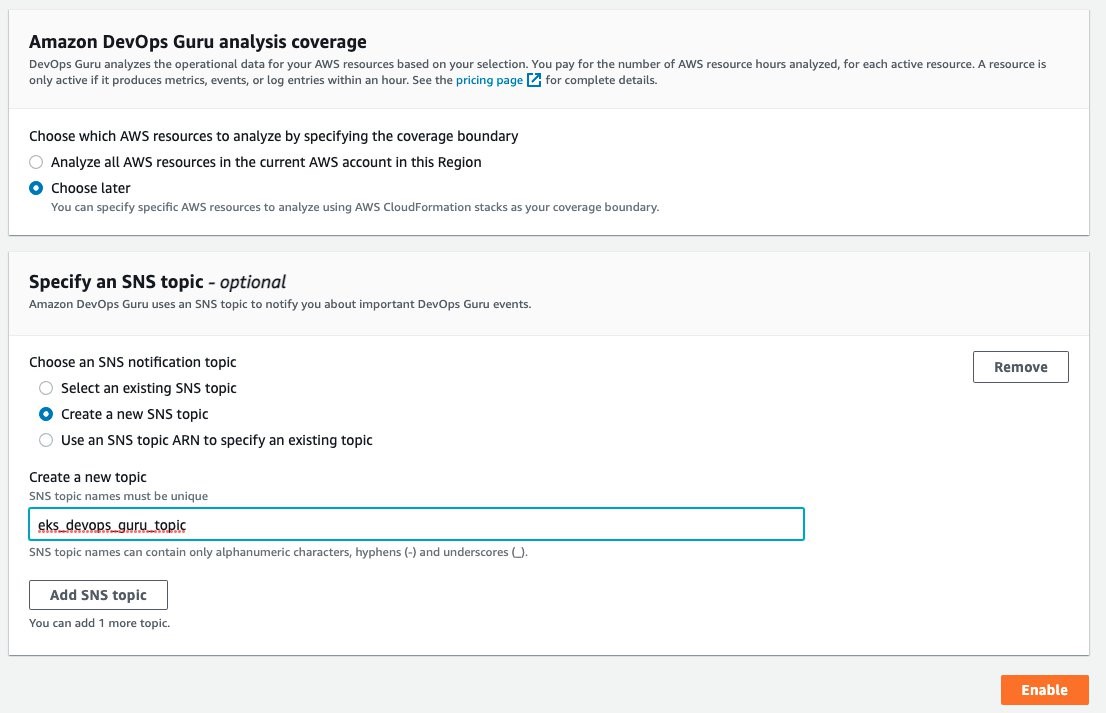
Under the Amazon DevOps Guru analysis coverage, Choose later is selected. This will let us specify the CloudFormation stacks to monitor. Select Create a new SNS topic, and provide a name. This will be used to collect notifications and allow for subscribers to then be notified. Select Enable when complete.
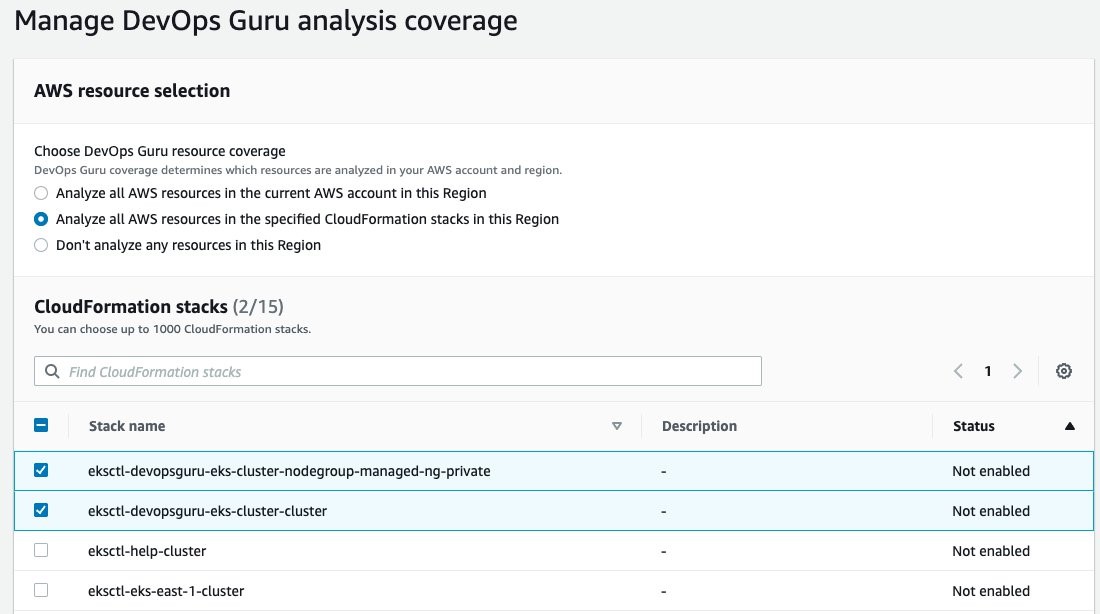
On the Manage DevOps Guru analysis coverage, select Analyze all AWS resources in the specified CloudFormation stacks in this Region. Then, select the cluster and managed node group AWS CloudFormation stacks so that DevOps Guru can monitor Amazon EKS.
Once this is selected, the display will update indicating that two CloudFormation stacks were added.
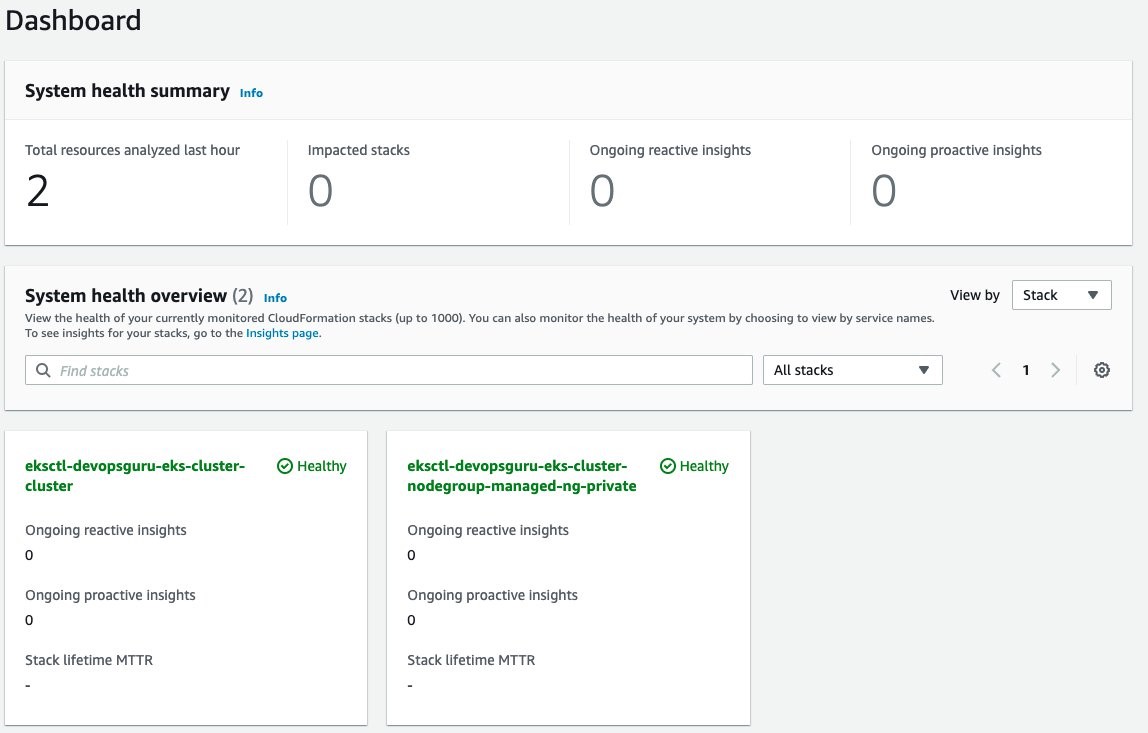
Amazon DevOps Guru will finally start analysis for those two stacks. This will take several hours to collect data and to identify normal operating conditions. Once this process is complete, the Dashboard will display that those resources have been analyzed, as shown in the following figure.
Enable Encryption on Amazon SNS Topic
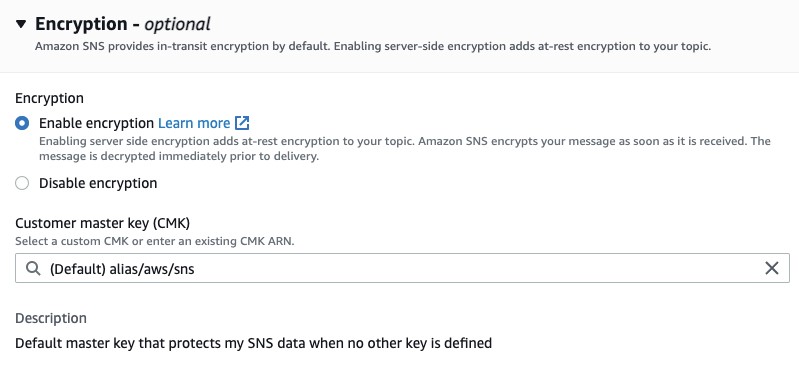
The Amazon SNS Topic created by Amazon DevOps Guru will not enable encryption by default. It is important to enable this feature to encrypt notifications at rest. Go to Amazon SNS, select the topic that is created and then Edit topic. Open the Encryption dialog box and enable encryption as shown in the following figure, specifying an alias, or accepting the default.
Deploy Sample Application on Amazon EKS To Trigger Insights
You will employ a sample application that is part of the AWS Distro for OpenTelemetry Collector to simulate failure. Using the following manifest, you will deploy a sample application that has pod resource limits for memory and CPU shares. These limits are artificially low and insufficient for the pod to run. The pod will exceed memory and will be identified for eviction by Amazon EKS. When it is evicted, it will attempt to be redeployed per the manifest requirement for a replica of one. In turn, this will repeat the process and generate memory and pod restart errors in Amazon CloudWatch. For this example, the deployment was left for over an hour, thereby causing the pod failure to repeat numerous times. The following is the manifest that you will create on the filesystem.
To deploy the application, use the following command:
$ kubectl apply -f <manifest file name>
deployment.apps/java-sample-app created
Scenario: Improved context from DevOps Guru Container Cluster Grouping and Increased Metrics
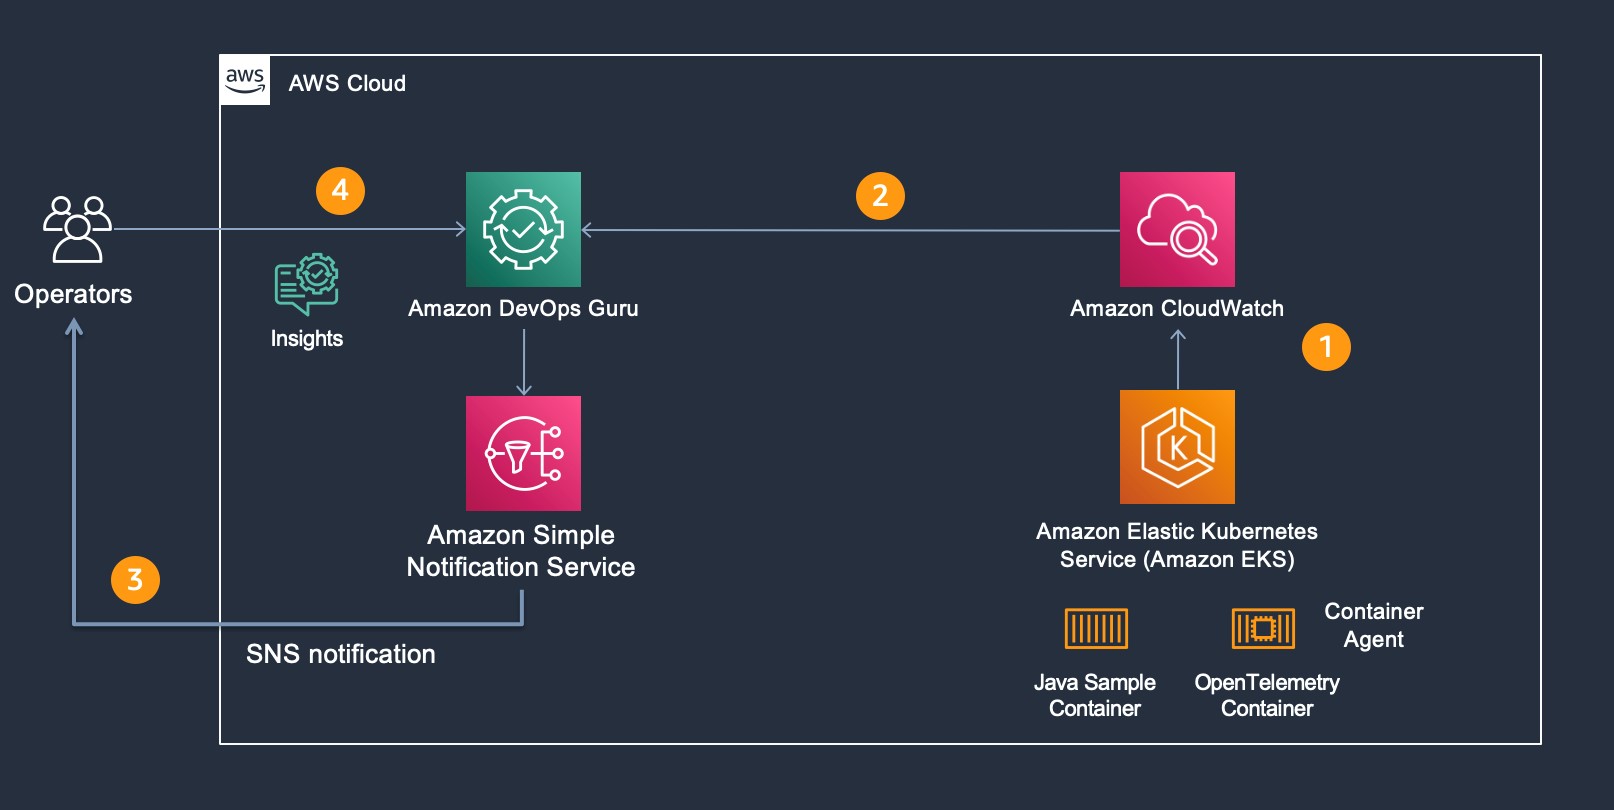
For our scenario, Amazon DevOps Guru is monitoring additional Amazon CloudWatch Container Insight Metrics for EKS. The following figure shows the flow of information and eventual notification of the operator, so that they can examine the Amazon DevOps Guru Insight. Starting at step 1, the container agent (AWS Distro for OpenTelemetry) forwards container metrics to Amazon CloudWatch. In step 2, Amazon DevOps Guru is continually consuming those metrics and performing anomaly detection. If an anomaly is detected, then this generates an Insight, thereby triggering Amazon SNS notification as shown in step 3. In step 4, the operators access Amazon DevOps Guru console to examine the insight. Then, the operators can leverage the new user interface capability displaying which cluster, namespace, and pod/service is impacted along with correlated Amazon EKS metric(s).
As part of the release, the following pod and node metrics are now tracked by DevOps Guru:
pod_number_of_container_restarts – number of times that a pod is restarted (e.g., image pull issues, container failure).
pod_memory_utilization_over_pod_limit – memory that exceeds the pod limit called out in resource memory limits.
pod_cpu_utilization_over_pod_limit – CPU shares that exceed the pod limit called out in resource CPU limits.
pod_cpu_utilization – percent CPU Utilization within an active pod.
pod_memory_utilization – percent memory utilization within an active pod.
node_network_total_bytes – total bytes over the network interface for the managed node (e.g., EC2 instance)
node_filesystem_utilization – percent file system utilization for the managed node (e.g., EC2 instance).
node_cpu_utilization – percent CPU Utilization within a managed node (e.g., EC2 instance).
node_memory_utilization – percent memory utilization within a managed node (e.g., EC2 instance).
Operator Scenario
The Kubernetes Operator in the following figure is informed of an insight via Amazon SNS. The Amazon SNS message content appears in the following code, showing the originator and information identifying the InsightDescription, InsightSeverity, name of the container metric, and the Pod / EKS Cluster:
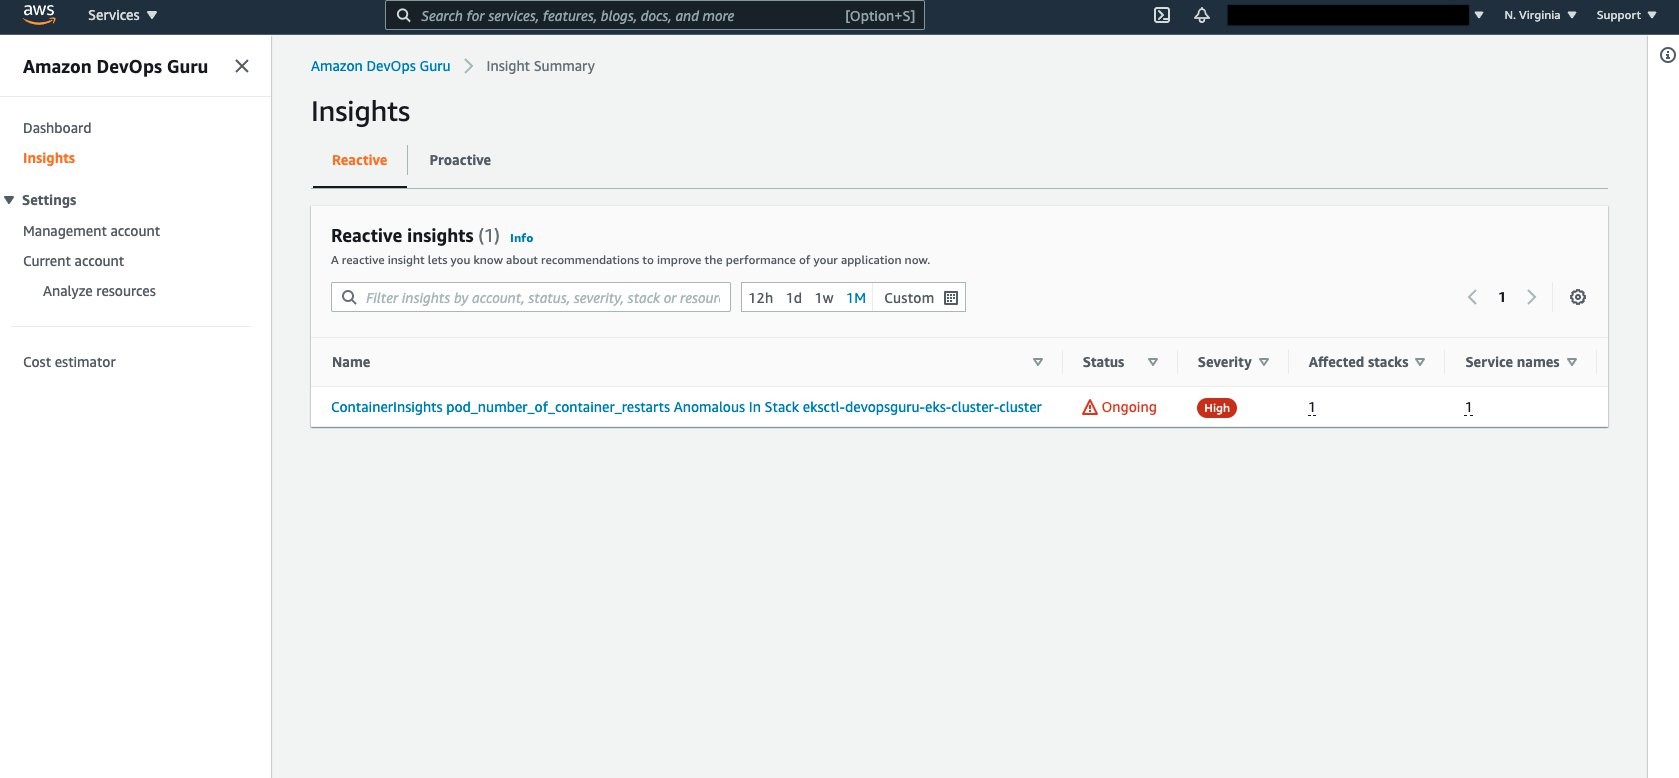
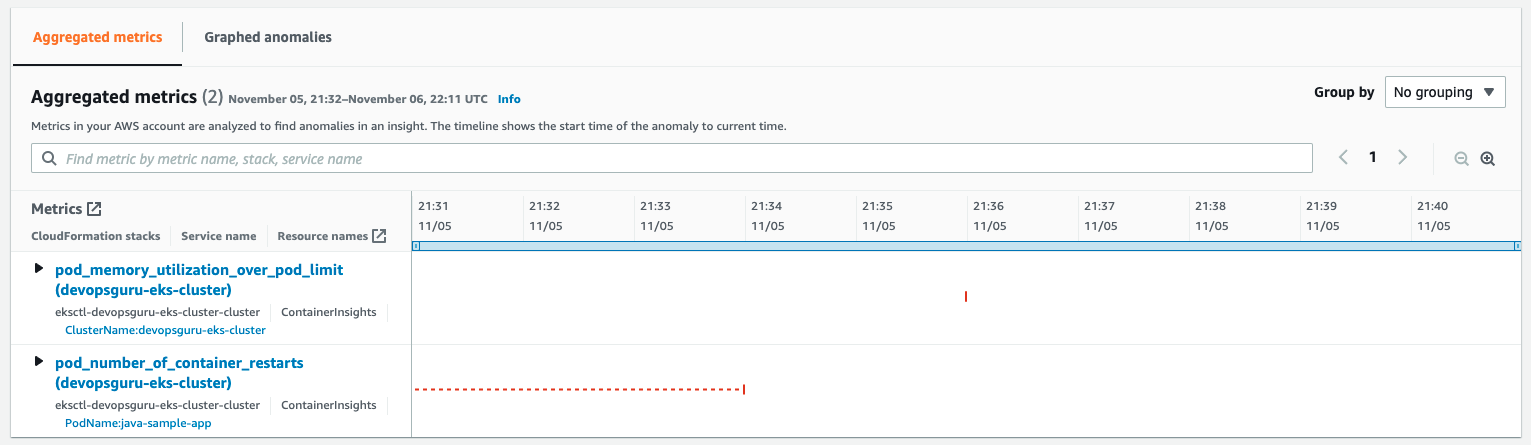
Amazon DevOps Guru Console collects the insights under the Insights selection as shown in the following figure. Select Insights to view the details.
Aggregated Metrics provides the identification of the EKS Container Metrics that have errored. In this case, pod_memory_utilization_over_pod_limit and pod_number_of_container_restarts.
Further details can be identified by selecting and expanding each insight as shown in the following figure.
Note that the display provides information around the Cluster, PodName, and Namespace. This helps operators maintaining large numbers of EKS Clusters to quickly isolate the offending Pod, its operating Namespace, and EKS Cluster to which it belongs. A search bar provides further filtering to isolate the name, stack, or service name displayed.
Cleaning Up
Follow the steps to delete the resources to prevent additional charges being posted to your account.
Amazon EKS Cluster Cleanup
Follow these steps to detach the customer managed policy and delete the cluster.
Detach customer managed policy, AWSDistroOpenTelemetryPolicy, via IAM Console.
Delete cluster using eksctl.
$ eksctl delete cluster devopsguru-eks-cluster --region <region>
2021-10-13 14:08:28 [i] eksctl version 0.69.0
2021-10-13 14:08:28 [i] using region <region>
2021-10-13 14:08:28 [i] deleting EKS cluster "devopsguru-eks-cluster"
2021-10-13 14:08:30 [i] will drain 0 unmanaged nodegroup(s) in cluster "devopsguru-eks-cluster"
2021-10-13 14:08:32 [i] deleted 0 Fargate profile(s)
2021-10-13 14:08:33 [✔] kubeconfig has been updated
2021-10-13 14:08:33 [i] cleaning up AWS load balancers created by Kubernetes objects of Kind Service or Ingress
2021-10-13 14:09:02 [i] 2 sequential tasks: { delete nodegroup "managed-ng-private", delete cluster control plane "devopsguru-eks-cluster" [async] }
2021-10-13 14:09:02 [i] will delete stack "eksctl-devopsguru-eks-cluster-nodegroup-managed-ng-private"
2021-10-13 14:09:02 [i] waiting for stack "eksctl-devopsguru-eks-cluster-nodegroup-managed-ng-private" to get deleted
2021-10-13 14:12:30 [i] will delete stack "eksctl-devopsguru-eks-cluster-cluster"
2021-10-13 14:12:30 [✔] all cluster resources were deleted
Conclusion
In the previous scenarios, demonstration of the new cluster organization and additional container metrics was performed. Both of these features further simplify and expand the ability for an operator to more easily identify issues within a container cluster when Amazon DevOps Guru detects anomalies. You can start building your own solutions that employ Amazon CloudWatch Agent / AWS Distro for OpenTelemetry Agent and Amazon DevOps Guru by reading the documentation. This provides a conceptual overview and practical examples to help you understand the features provided by Amazon DevOps Guru and how to use them.
Hundreds of thousands of customers nowadays are using Amazon Aurora because it is highly available, scalable, and durable. But as applications grow in size and complexity, it becomes more challenging for these customers to detect and resolve operational and performance issues quickly.
During last year’s re:Invent, we announced DevOps Guru, a service that uses machine learning (ML) to automatically detect and alert customers of application issues, including database problems. Today we are announcing DevOps Guru for RDS to help developers using Amazon Aurora databases to detect, diagnose, and resolve database performance issues fast and at scale. Now developers will have enough information to determine the exact cause for a database performance issue. This launch will save developers and engineers many hours of work trying to uncover and remediate the performance-related database issues.
DevOps Guru for RDS uses ML to automatically identify and analyze a wide range of performance-related database issues, such as over-utilization of host resources, database bottlenecks, or misbehavior of SQL queries. It also recommends solutions to remediate the issues it finds. To use this capability, you don’t need to be a database or ML expert.
When an issue is detected, DevOps Guru for RDS displays the finding in the DevOps Guru console and sends notifications using Amazon EventBridge or Amazon Simple Notification Service (SNS). This allows developers to automatically manage and take real-time action on the issues.
How DevOps Guru for RDS Works DevOps Guru for RDS uses anomaly detection on the database load (DB load) performance metric to detect issues. DB load is measured in units of Average Active Sessions (AAS). DB load measures the level of activity in your database, making it a great metric to understand the health of your database. If the DB load is high, this can result in performance issues. This metric can be compared to the number of virtual CPUs (vCPUs), and if the DB load is higher than that number, issues can arise.
The most useful dimensions for this metric are the wait events and the top SQL. The wait event describes what the system conditions that are currently running SQLs are waiting on. The most common reasons why a statement is waiting is that it is waiting for the CPU, waiting for a read or write, or waiting for a locked resource. The top SQL dimension shows which queries are contributing the most to DB load.
The following image is an example of a finding that DevOps Guru for RDS reported. The graph shows that from the AAS, most of them were waiting for access to a table or for CPU.
If you continue scrolling on the DevOps Guru for RDS analysis page, you can discover the cause for the problem and some recommendations to fix it. In this particular example, two problems were detected: high-load wait events and CPU capacity exceeded.
DevOps Guru for RDS looks more in-depth into these problems. First, it looks at the high-load wait events, where there were 27 AAS for the IO and CPU wait types, which is 99 percent of the total DB load.
Second, it tells us that the running tasks exceeded six processes. This database only has two vCPUs, and the recommended number of running processes should be a maximum of four (2x vCPUs). DevOps Guru for RDS also makes recommendations to fix these issues.
In another anomaly, the graph shows that there was a high load of wait events, and one SQL query was found to require further investigation. You can even see the exact SQL query if you click on the SQL digest IDs. The insight’s analysis and recommendation section is full of information on how to investigate further and fix the issue. You can get a lot of detailed information by clicking on the wait event, for example, on the wait event wait/io/table/sql/handler or in the View troubleshooting doc link.
Get started with DevOps Guru for RDS To get started with this new capability of DevOps Guru, make sure that Performance Insights is enabled for your Amazon Aurora DB instances. It supports Amazon Aurora with MySQL- and PostgreSQL-compatibility. For instructions on how to enable Performance Insights, see Enabling and disabling Performance Insights.
The next step is to enable DevOps Guru to start monitoring your AWS resources. You can specify the resources you want to be covered by DevOps Guru.
If you are already using DevOps Guru, whenever there is a new insight for an Amazon Aurora database resource, you will see it in the console.
To see the detailed database analysis, navigate to the Insight page and select the new View analysis button under the DB load aggregated metric. That button will take you to the detailed analysis by DevOps Guru for RDS.
DevOps Guru for RDS is available in all Regions where DevOps Guru is available, US East (Ohio), US East (N. Virginia), US West (Oregon), Asia Pacific (Singapore), Asia Pacific (Sydney), Asia Pacific (Tokyo), Europe (Frankfurt), Europe (Ireland), and Europe (Stockholm).
Learn more about DevOps Guru for RDS and check out the talk at AWS re:Invent “Automatically detect and resolve performance issues with Amazon DevOps Guru for RDS” (Session Id 15877).
To provide the best experiences, we use technologies like cookies to store and/or access device information. Consenting to these technologies will allow us to process data such as browsing behavior or unique IDs on this site. Not consenting or withdrawing consent, may adversely affect certain features and functions.
Functional
Always active
The technical storage or access is strictly necessary for the legitimate purpose of enabling the use of a specific service explicitly requested by the subscriber or user, or for the sole purpose of carrying out the transmission of a communication over an electronic communications network.
Preferences
The technical storage or access is necessary for the legitimate purpose of storing preferences that are not requested by the subscriber or user.
Statistics
The technical storage or access that is used exclusively for statistical purposes.The technical storage or access that is used exclusively for anonymous statistical purposes. Without a subpoena, voluntary compliance on the part of your Internet Service Provider, or additional records from a third party, information stored or retrieved for this purpose alone cannot usually be used to identify you.
Marketing
The technical storage or access is required to create user profiles to send advertising, or to track the user on a website or across several websites for similar marketing purposes.