A TURN server helps maintain connections during video calls when local networking conditions prevent participants from connecting directly to other participants. It acts as an intermediary, passing data between users when their networks block direct communication. TURN servers ensure that peer-to-peer calls go smoothly, even in less-than-ideal network conditions.
When building their own TURN infrastructure, developers often have to answer a few critical questions:
“How do we build and maintain a mesh network that achieves near-zero latency to all our users?”
“Where should we spin up our servers?”
“Can we auto-scale reliably to be cost-efficient without hurting performance?”
In April, we launched Cloudflare Calls TURN in open beta to help answer these questions. Starting today, Cloudflare Calls’ TURN service is now generally available to all Cloudflare accounts. Our TURN server works on our anycast network, which helps deliver global coverage and near-zero latency required by real time applications.
TURN solves connectivity and privacy problems for real time apps
When Internet Protocol version 4 (IPv4, RFC 791) was designed back in 1981, it was assumed that the 32-bit address space was big enough for all computers to be able to connect to each other. When IPv4 was created, billions of people didn’t have smartphones in their pockets and the idea of the Internet of Things didn’t exist yet. It didn’t take long for companies, ISPs, and even entire countries to realize they didn’t have enough IPv4 address space to meet their needs.
NATs are unpredictable
Fortunately, you can have multiple devices share the same IP address because the most common protocols run on top of IP are TCP and UDP, both of which support up to 65,535 port numbers. (Think of port numbers on an IP address as extensions behind a single phone number.) To solve this problem of IP scarcity, network engineers developed a way to share a single IP address across multiple devices by exploiting the port numbers. This is called Network Address Translation (NAT) and it is a process through which your router knows which packets to send to your smartphone versus your laptop or other devices, all of which are connecting to the public Internet through the IP address assigned to the router.
In a typical NAT setup, when a device sends a packet to the Internet, the NAT assigns a random, unused port to track it, keeping a forwarding table to map the device to the port. This allows NAT to direct responses back to the correct device, even if the source IP address and port vary across different destinations. The system works as long as the internal device initiates the connection and waits for the response.
However, real-time apps like video or audio calls are more challenging with NAT. Since NATs don’t reveal how they assign ports, devices can’t pre-communicate where to send responses, making it difficult to establish reliable connections. Earlier solutions like STUN (RFC 3489) couldn’t fully solve this, which gave rise to the TURN protocol.
TURN predictably relays traffic between devices while ensuring minimal delay, which is crucial for real-time communication where even a second of lag can disrupt the experience.
ICE to determine if a relay server is needed
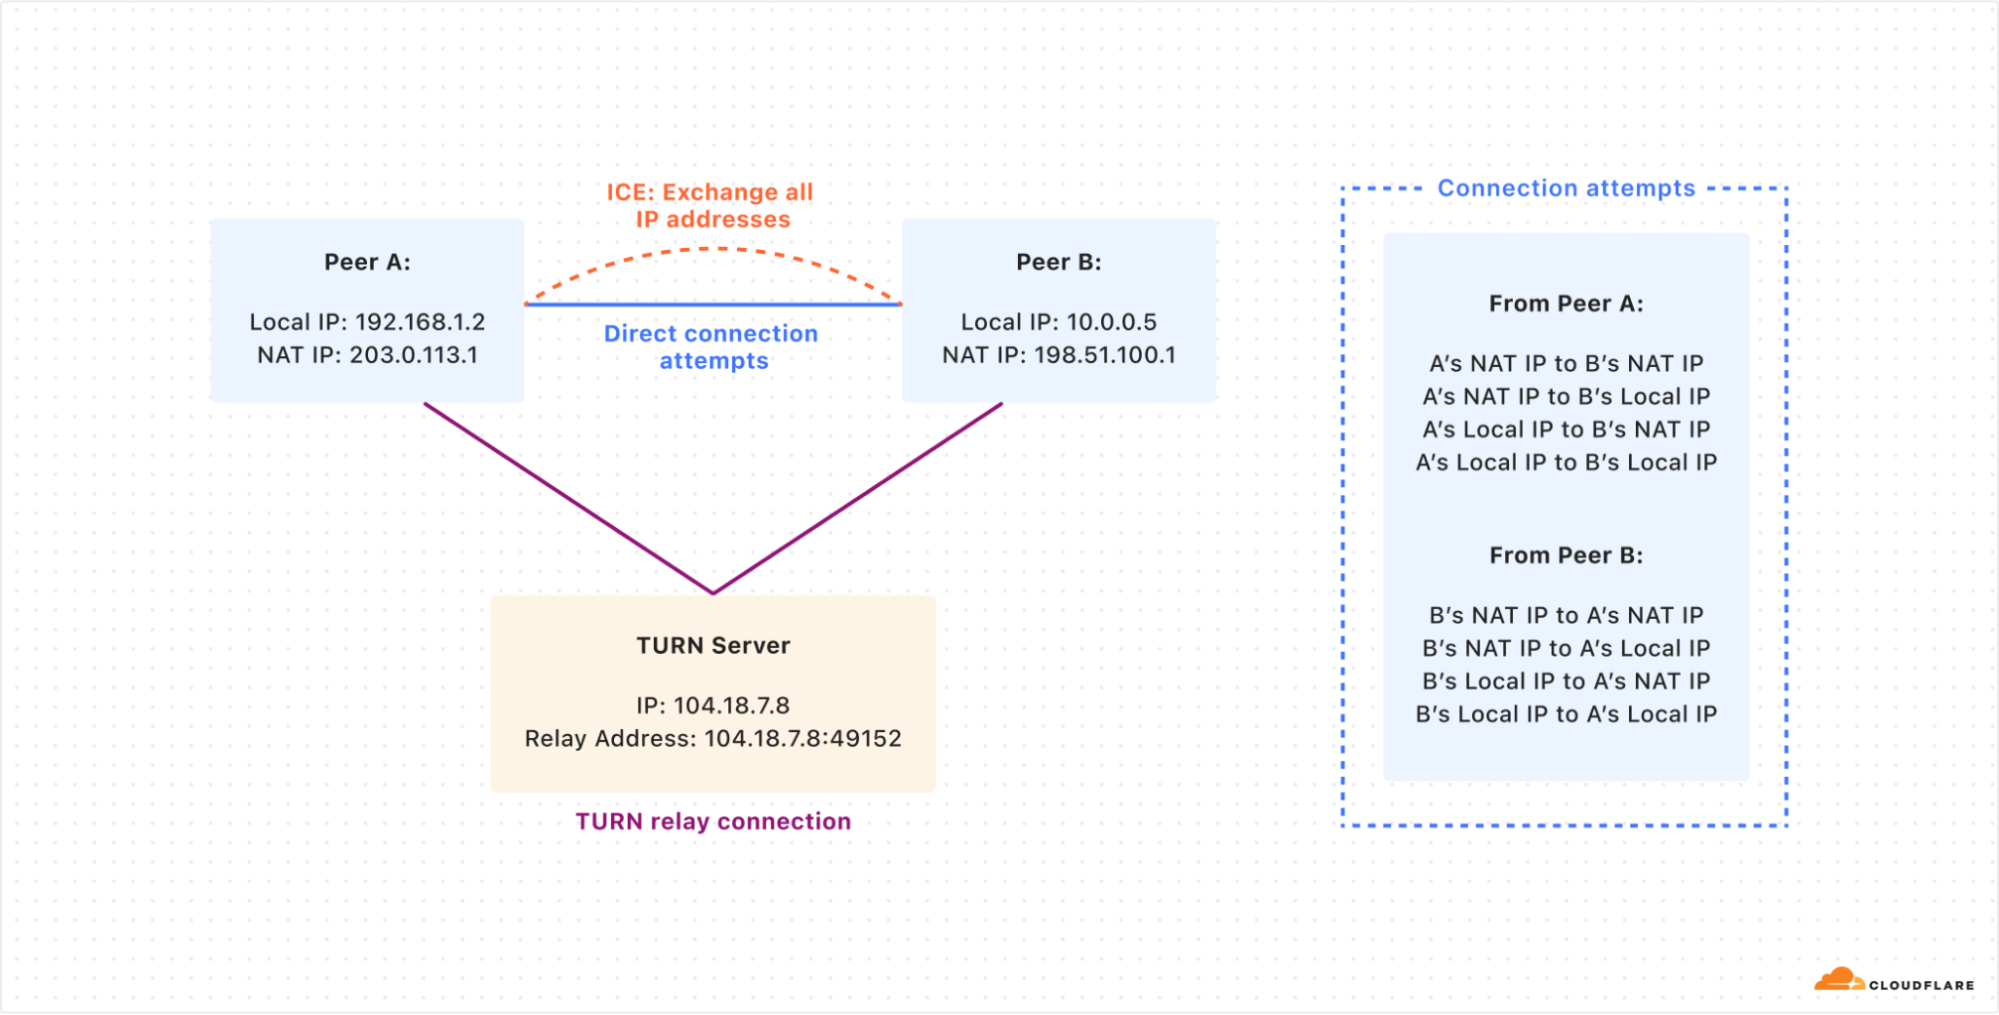
The ICE (Interactive Connectivity Establishment) protocol was designed to find the fastest communication path between devices. It works by testing multiple routes and choosing the one with the least delay. ICE determines whether a TURN server is needed to relay the connection when a direct peer-to-peer path cannot be established or is not performant enough.
How two peers (A and B) try to connect directly by sharing their public and local IP addresses using the ICE protocol. If the direct connection fails, both peers use the TURN server to relay their connection and communicate with each other.
While ICE is designed to find the most efficient connection path between peers, it can inadvertently expose sensitive information, creating privacy concerns. During the ICE process, endpoints exchange a list of all possible network addresses, including local IP addresses, NAT IP addresses, and TURN server addresses. This comprehensive sharing of network details can reveal information about a user’s network topology, potentially exposing their approximate geographic location or details about their local network setup.
The “brute force” nature of ICE, where it attempts connections on all possible paths, can create distinctive network traffic patterns that sophisticated observers might use to infer the use of specific applications or communication protocols.
TURN solves privacy problems
The threat from exposing sensitive information while using real-time applications is especially important for people that use end-to-end encrypted messaging apps for sensitive information — for example, journalists who need to communicate with unknown sources without revealing their location.
With Cloudflare TURN in place, traffic is proxied through Cloudflare, preventing either party in the call from seeing client IP addresses or associated metadata. Cloudflare simply forwards the calls to their intended recipients, but never inspects the contents — the underlying call data is always end-to-end encrypted. This masking of network traffic is an added layer of privacy.
Cloudflare is a trusted third-party when it comes to operating these types of services: we have experience operating privacy-preserving proxies at scale for our Consumer WARP product, Apple’s Private Relay, and Microsoft Edge’s Secure Network, preserving end-user privacy without sacrificing performance.
Cloudflare’s TURN is the fastest because of Anycast
Lots of real time communication services run their own TURN servers on a commercial cloud provider because they don’t want to leave a certain percentage of their customers with non-working communication. This results in additional costs for DevOps, egress bandwidth, etc. And honestly, just deploying and running a TURN server, like CoTURN, in a VPS isn’t an interesting project for most engineers.
Because using a TURN relay adds extra delay for the packets to travel between the peers, the relays should be located as close as possible to the peers. Cloudflare’s TURN service avoids all these headaches by simply running in all of the 330 cities where Cloudflare has data centers. And any time Cloudflare adds another city, the TURN service automatically becomes available there as well.
Anycast is the perfect network topology for TURN
Anycast is a network addressing and routing methodology in which a single IP address is shared by multiple servers in different locations. When a client sends a request to an anycast address, the network automatically routes the request via BGP to the topologically nearest server. This is in contrast to unicast, where each destination has a unique IP address. Anycast allows multiple servers to have the same IP address, and enables clients to automatically connect to a server close to them. This is similar to emergency phone networks (911, 112, etc.) which connect you to the closest emergency communications center in your area.
Anycast allows for lower latency because of the sheer number of locations available around the world. Approximately 95% of the Internet-connected population globally is within approximately 50ms away from a Cloudflare location. For real-time communication applications that use TURN, leads to improved call quality and user experience.
Auto-scaling and inherently global
Running TURN over anycast allows for better scalability and global distribution. By naturally distributing load across multiple servers based on network topology, this setup helps balance traffic and improve performance. When you use Cloudflare’s TURN service, you don’t need to manage a list of servers for different parts of the world. And you don’t need to write custom scaling logic to scale VMs up or down based on your traffic.
Anycast allows TURN to use fewer IP addresses, making it easier to allowlist in restrictive networks. Stateless protocols like DNS over UDP work well with anycast. This includes stateless STUN binding requests used to determine a system’s external IP address behind a NAT.
However, stateful protocols over UDP, like QUIC or TURN, are more challenging with anycast. QUIC handles this better due to its stable connection ID, which load balancers can use to consistently route traffic. However, TURN/STUN lacks a similar connection ID. So when a TURN client sends requests to the Cloudflare TURN service, the Unimog load balancer ensures that all its requests get routed to the same server within a data center. The challenges for the communication between a client on the Internet and Cloudflare services listening on an anycast IP address have been described multiple times before.
How does Cloudflare’s TURN server receive packets?
TURN servers act as relay points to help connect clients. This process involves two types of connections: the client-server connection and the third-party connection (relayed address).
The client-server connection uses published IP and port information to communicate with TURN clients using anycast.
For the relayed address, using anycast poses a challenge. The TURN protocol requires that packets reach the specific Cloudflare server handling the client connection. If we used anycast for relay addresses, packets might not arrive at the correct data center or server.
One alternative is to use unicast addresses for relay candidates. However, this approach has drawbacks, including making servers vulnerable to attacks and requiring many IP addresses.
To solve these issues, we’ve developed a middle-ground solution, previously discussed in “Cloudflare servers don’t own IPs anymore – so how do they connect to the Internet?”. We use anycast addresses but add extra handling for packets that reach incorrect servers. If a packet arrives at the wrong Cloudflare location, we forward it over our backbone to the correct datacenter, rather than sending it back over the public Internet.
This approach not only resolves routing issues but also improves TURN connection speed. Packets meant for the relay address enter the Cloudflare network as close to the sender as possible, optimizing the routing process.
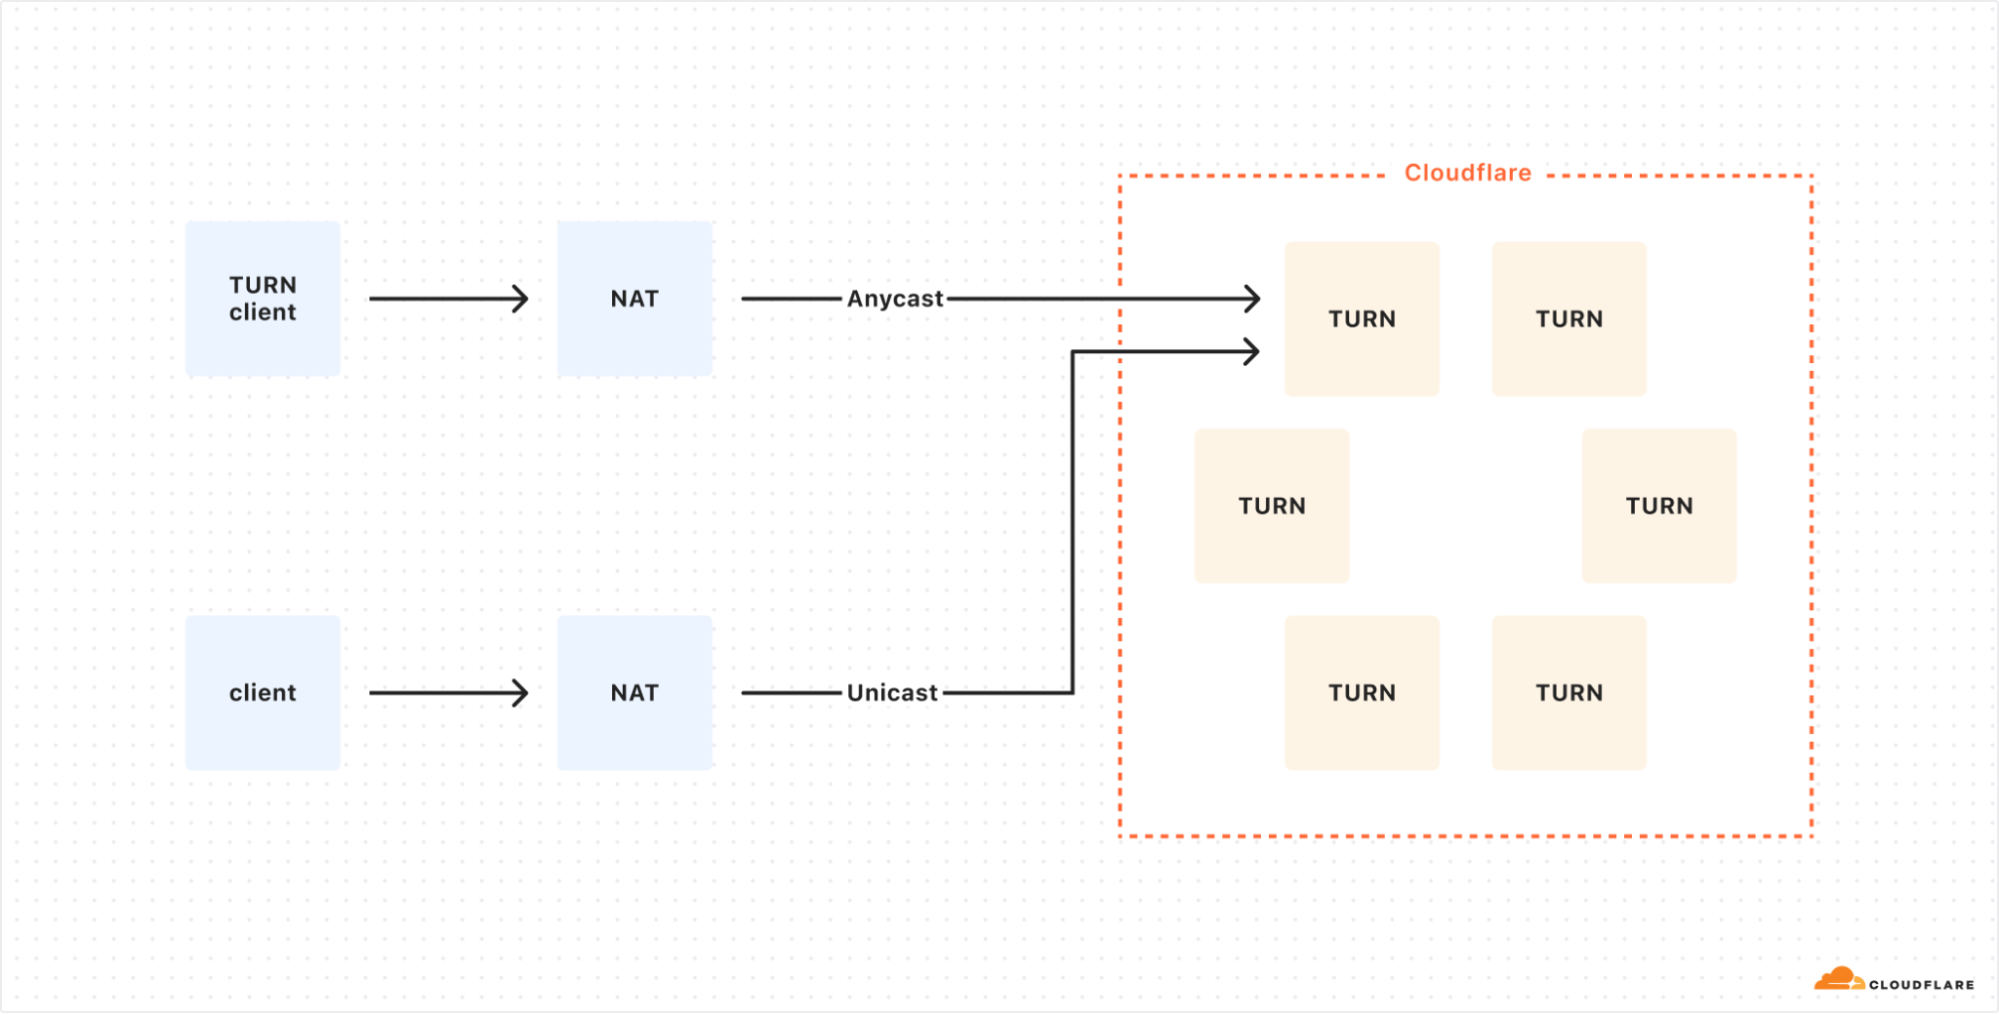
In this non-ideal setup, a TURN client connects to Cloudflare using Anycast, while a direct client uses Unicast, which would expose the TURN server to potential DDoS attacks.
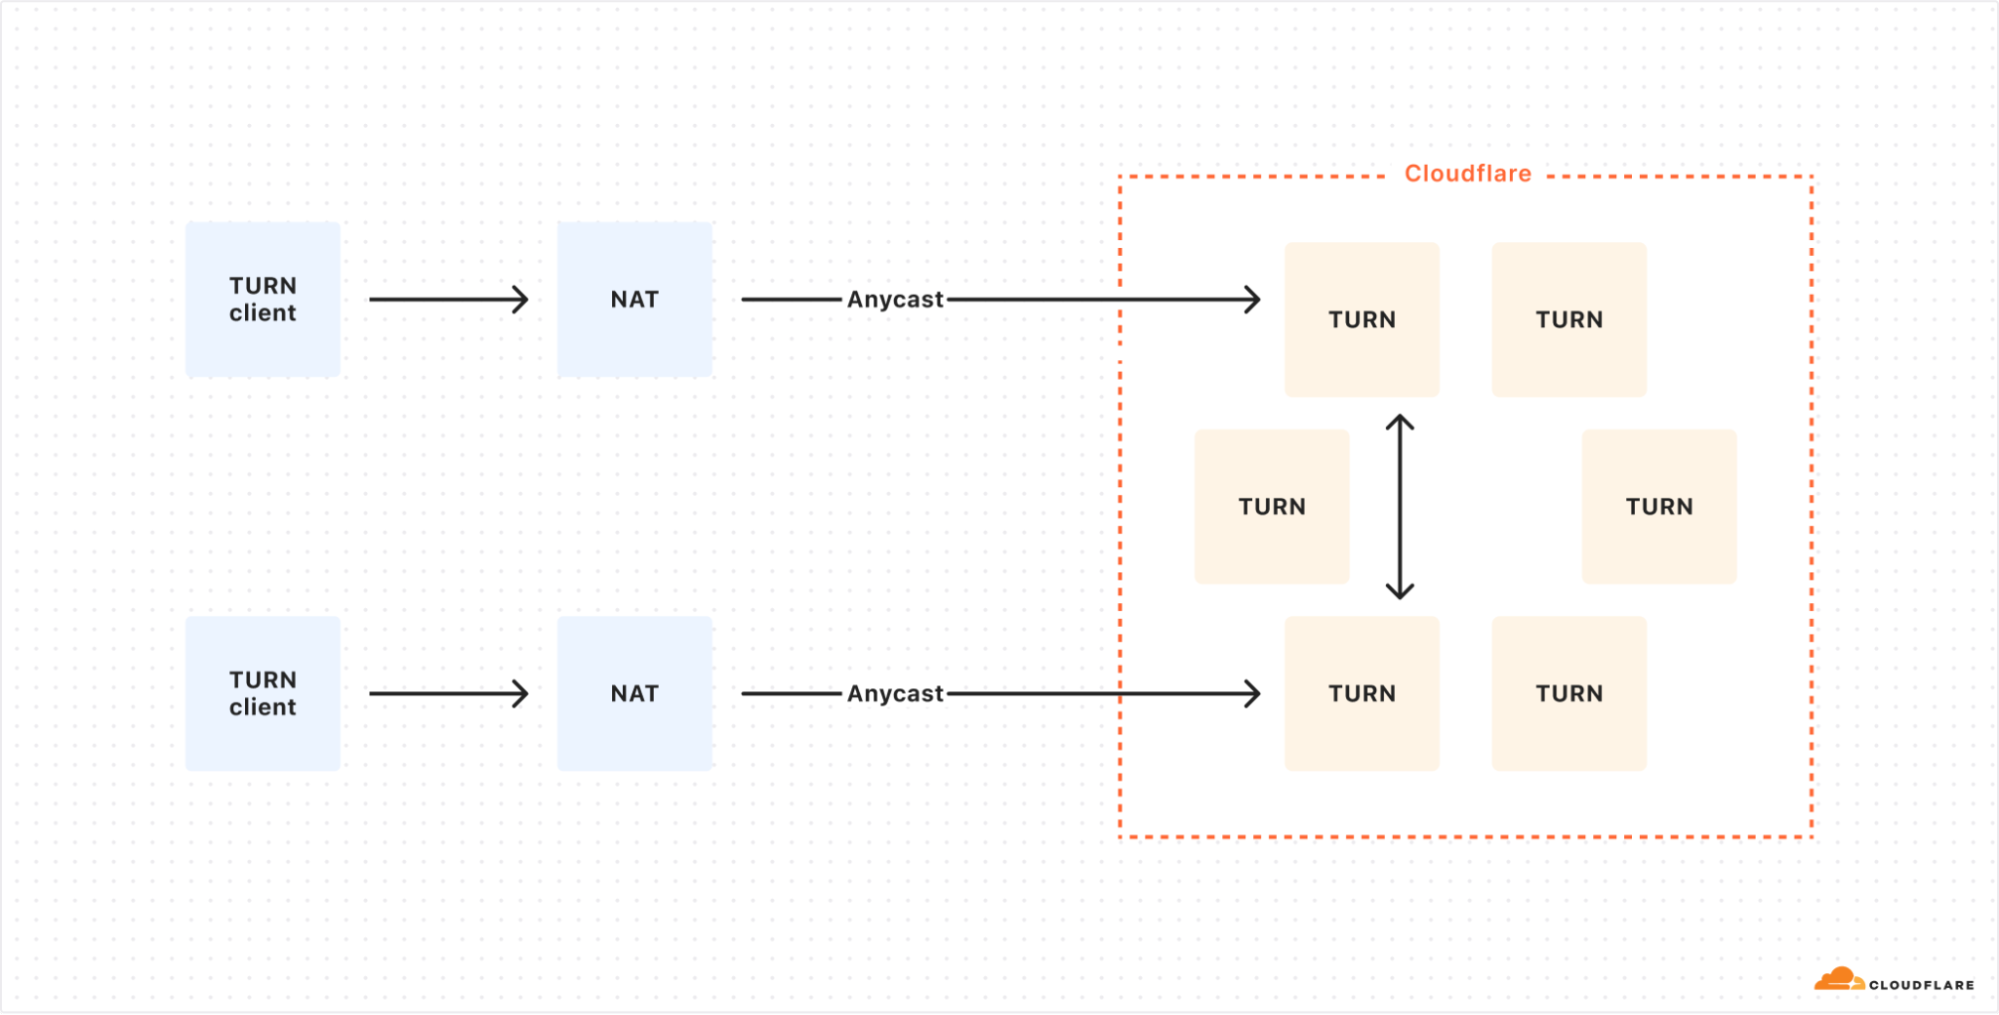
The optimized setup uses Anycast for all TURN clients, allowing for dynamic load distribution across Cloudflare’s globally distributed TURN servers.
Try Cloudflare Calls TURN today
The new TURN feature of Cloudflare Calls addresses critical challenges in real-time communication:
Connectivity: By solving NAT traversal issues, TURN ensures reliable connections even in complex network environments.
Privacy: Acting as an intermediary, TURN enhances user privacy by masking IP addresses and network details.
Performance: Leveraging Cloudflare’s global anycast network, our TURN service offers unparalleled speed and near-zero latency.
Scalability: With presence in over 330 cities, Cloudflare Calls TURN grows with your needs.
Cloudflare Calls TURN service is billed on a usage basis. It is available to self-serve and Enterprise customers alike. There is no cost for the first 1,000 GB (one terabyte) of Cloudflare Calls usage each month. It costs five cents per GB after your first terabyte of usage on self-serve. Volume pricing is available for Enterprise customers through your account team.
Switching TURN providers is likely as simple as changing a single configuration in your real-time app. To get started with Cloudflare’s TURN service, create a TURN app from your Cloudflare Calls Dashboard or read the Developer Docs.
The modern use of “cloud” arguably traces its origins to the cloud icon, omnipresent in network diagrams for decades. A cloud was used to represent the vast and intricate infrastructure components required to deliver network or Internet services without going into depth about the underlying complexities. At Cloudflare, we embody this principle by providing critical infrastructure solutions in a user-friendly and easy-to-use way. Our logo, featuring the cloud symbol, reflects our commitment to simplifying the complexities of Internet infrastructure for all our users.
This blog post provides an update about our infrastructure, focusing on our global backbone in 2024, and highlights its benefits for our customers, our competitive edge in the market, and the impact on our mission of helping build a better Internet. Since the time of our last backbone-related blog post in 2021, we have increased our backbone capacity (Tbps) by more than 500%, unlocking new use cases, as well as reliability and performance benefits for all our customers.
A snapshot of Cloudflare’s infrastructure
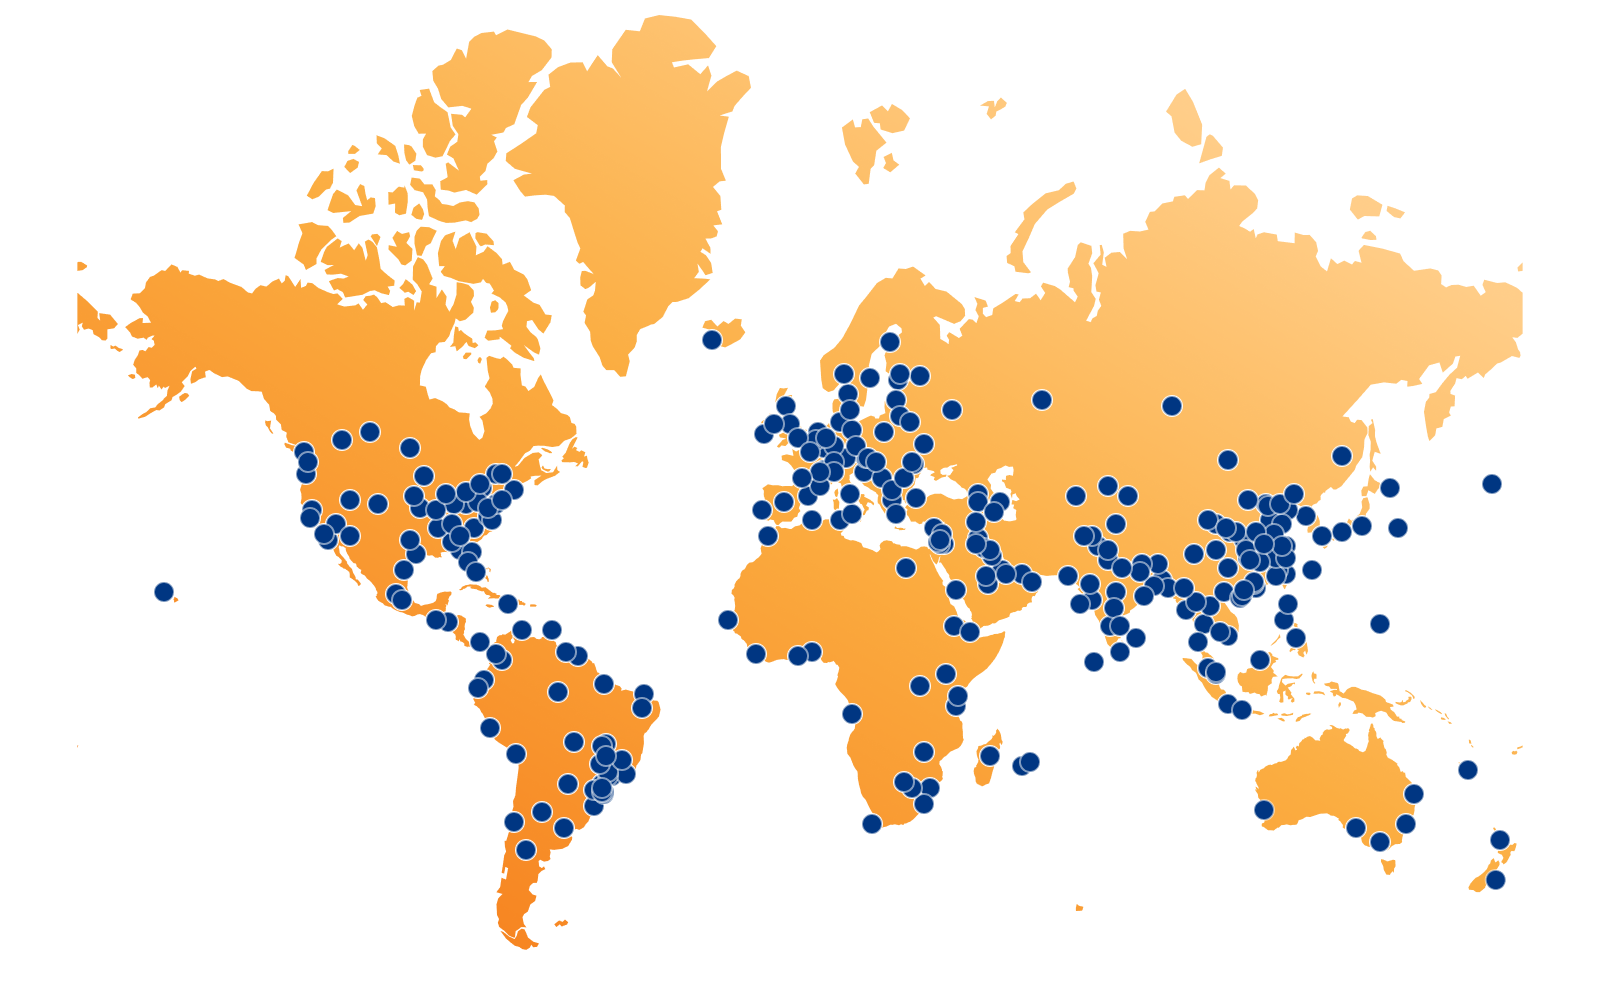
As of July 2024, Cloudflare has data centers in 330 cities across more than 120 countries, each running Cloudflare equipment and services. The goal of delivering Cloudflare products and services everywhere remains consistent, although these data centers vary in the number of servers and amount of computational power.
These data centers are strategically positioned around the world to ensure our presence in all major regions and to help our customers comply with local regulations. It is a programmable smart network, where your traffic goes to the best data center possible to be processed. This programmability allows us to keep sensitive data regional, with our Data Localization Suite solutions, and within the constraints that our customers impose. Connecting these sites, exchanging data with customers, public clouds, partners, and the broader Internet, is the role of our network, which is managed by our infrastructure engineering and network strategy teams. This network forms the foundation that makes our products lightning fast, ensuring our global reliability, security for every customer request, and helping customers comply with data sovereignty requirements.
Traffic exchange methods
The Internet is an interconnection of different networks and separate autonomous systems that operate by exchanging data with each other. There are multiple ways to exchange data, but for simplicity, we’ll focus on two key methods on how these networks communicate: Peering and IP Transit. To better understand the benefits of our global backbone, it helps to understand these basic connectivity solutions we use in our network.
Peering: The voluntary interconnection of administratively separate Internet networks that allows for traffic exchange between users of each network is known as “peering”. Cloudflare is one of the most peered networks globally. We have peering agreements with ISPs and other networks in 330 cities and across all major Internet Exchanges (IX’s). Interested parties can register to peer with us anytime, or directly connect to our network with a link through a private network interconnect (PNI).
IP transit: A paid service that allows traffic to cross or “transit” somebody else’s network, typically connecting a smaller Internet service provider (ISP) to the larger Internet. Think of it as paying a toll to access a private highway with your car.
The backbone is a dedicated high-capacity optical fiber network that moves traffic between Cloudflare’s global data centers, where we interconnect with other networks using these above-mentioned traffic exchange methods. It enables data transfers that are more reliable than over the public Internet. For the connectivity within a city and long distance connections we manage our own dark fiber or lease wavelengths using Dense Wavelength Division Multiplexing (DWDM). DWDM is a fiber optic technology that enhances network capacity by transmitting multiple data streams simultaneously on different wavelengths of light within the same fiber. It’s like having a highway with multiple lanes, so that more cars can drive on the same highway. We buy and lease these services from our global carrier partners all around the world.
Backbone operations and benefits
Operating a global backbone is challenging, which is why many competitors don’t do it. We take this challenge for two key reasons: traffic routing control and cost-effectiveness.
With IP transit, we rely on our transit partners to carry traffic from Cloudflare to the ultimate destination network, introducing unnecessary third-party reliance. In contrast, our backbone gives us full control over routing of both internal and external traffic, allowing us to manage it more effectively. This control is crucial because it lets us optimize traffic routes, usually resulting in the lowest latency paths, as previously mentioned. Furthermore, the cost of serving large traffic volumes through the backbone is, on average, more cost-effective than IP transit. This is why we are doubling down on backbone capacity in regions such as Frankfurt, London, Amsterdam, and Paris and Marseille, where we see continuous traffic growth and where connectivity solutions are widely available and competitively priced.
Our backbone serves both internal and external traffic. Internal traffic includes customer traffic using our security or performance products and traffic from Cloudflare’s internal systems that shift data between our data centers. Tiered caching, for example, optimizes our caching delivery by dividing our data centers into a hierarchy of lower tiers and upper tiers. If lower-tier data centers don’t have the content, they request it from the upper tiers. If the upper tiers don’t have it either, they then request it from the origin server. This process reduces origin server requests and improves cache efficiency. Using our backbone to transport the cached content between lower and upper-tier data centers and the origin is often the most cost-effective method, considering the scale of our network. Magic Transit is another example where we attract traffic, by means of BGP anycast, to the Cloudflare data center closest to the end user and implement our DDoS solution. Our backbone transports the clean traffic to our customer’s data center, which they connect through a Cloudflare Network Interconnect (CNI).
External traffic that we carry on our backbone can be traffic from other origin providers like AWS, Oracle, Alibaba, Google Cloud Platform, or Azure, to name a few. The origin responses from these cloud providers are transported through peering points and our backbone to the Cloudflare data center closest to our customer. By leveraging our backbone we have more control over how we backhaul this traffic throughout our network, which results in more reliability and better performance and less dependency on the public Internet.
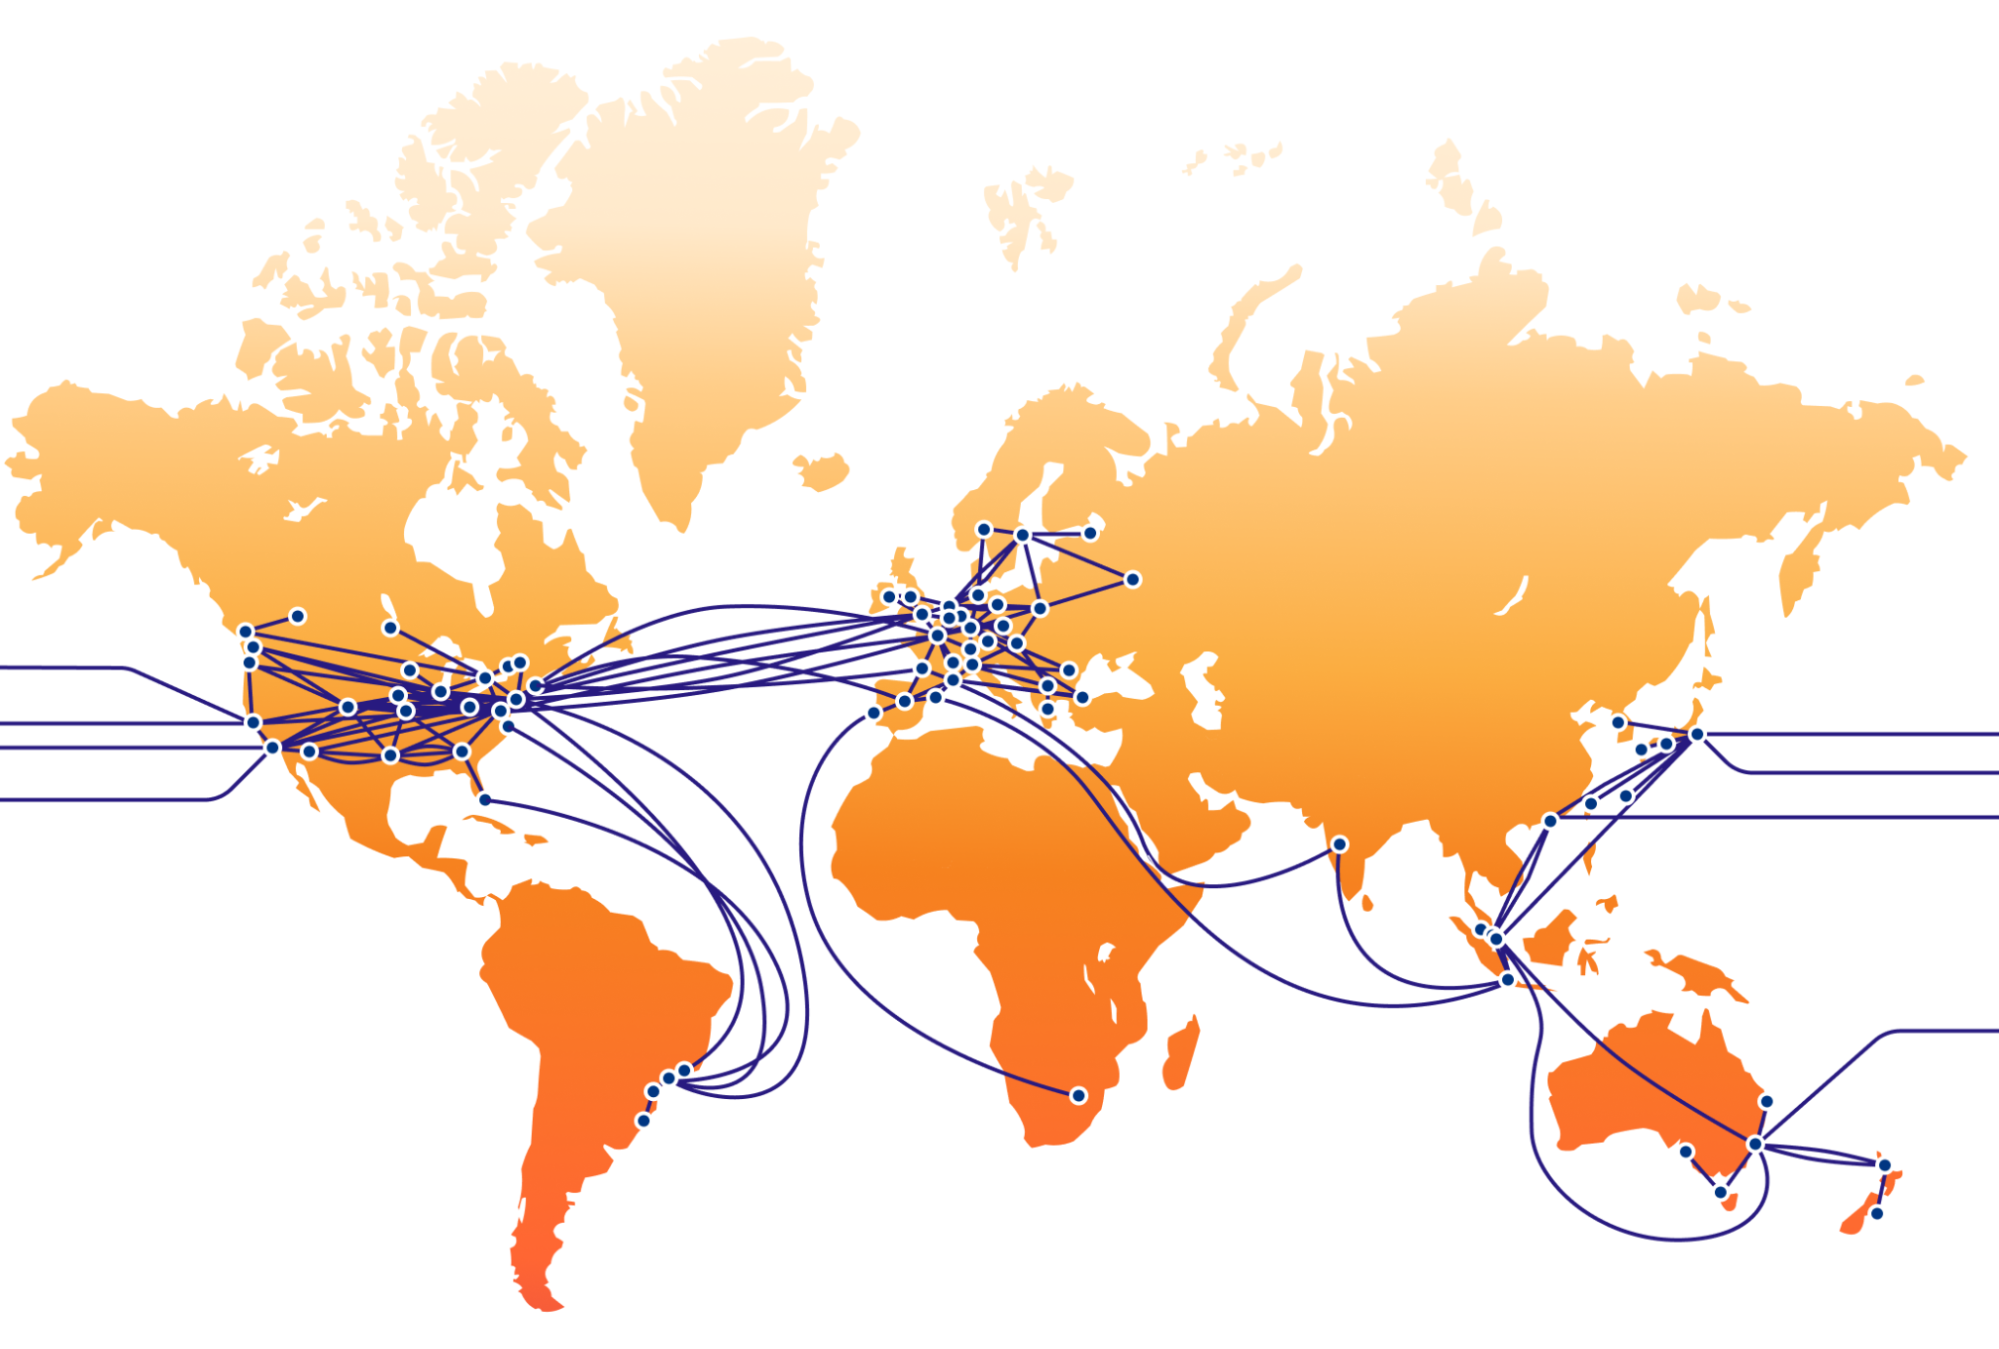
This interconnection between public clouds, offices, and the Internet with a controlled layer of performance, security, programmability, and visibility running on our global backbone is our Connectivity Cloud.
This map is a simplification of our current backbone network and does not show all paths
Expanding our network
As mentioned in the introduction, we have increased our backbone capacity (Tbps) by more than 500% since 2021. With the addition of sub-sea cable capacity to Africa, we achieved a big milestone in 2023 by completing our global backbone ring. It now reaches six continents through terrestrial fiber and subsea cables.
Building out our backbone within regions where Internet infrastructure is less developed compared to markets like Central Europe or the US has been a key strategy for our latest network expansions. We have a shared goal with regional ISP partners to keep our data flow localized and as close as possible to the end user. Traffic often takes inefficient routes outside the region due to the lack of sufficient local peering and regional infrastructure. This phenomenon, known as traffic tromboning, occurs when data is routed through more cost-effective international routes and existing peering agreements.
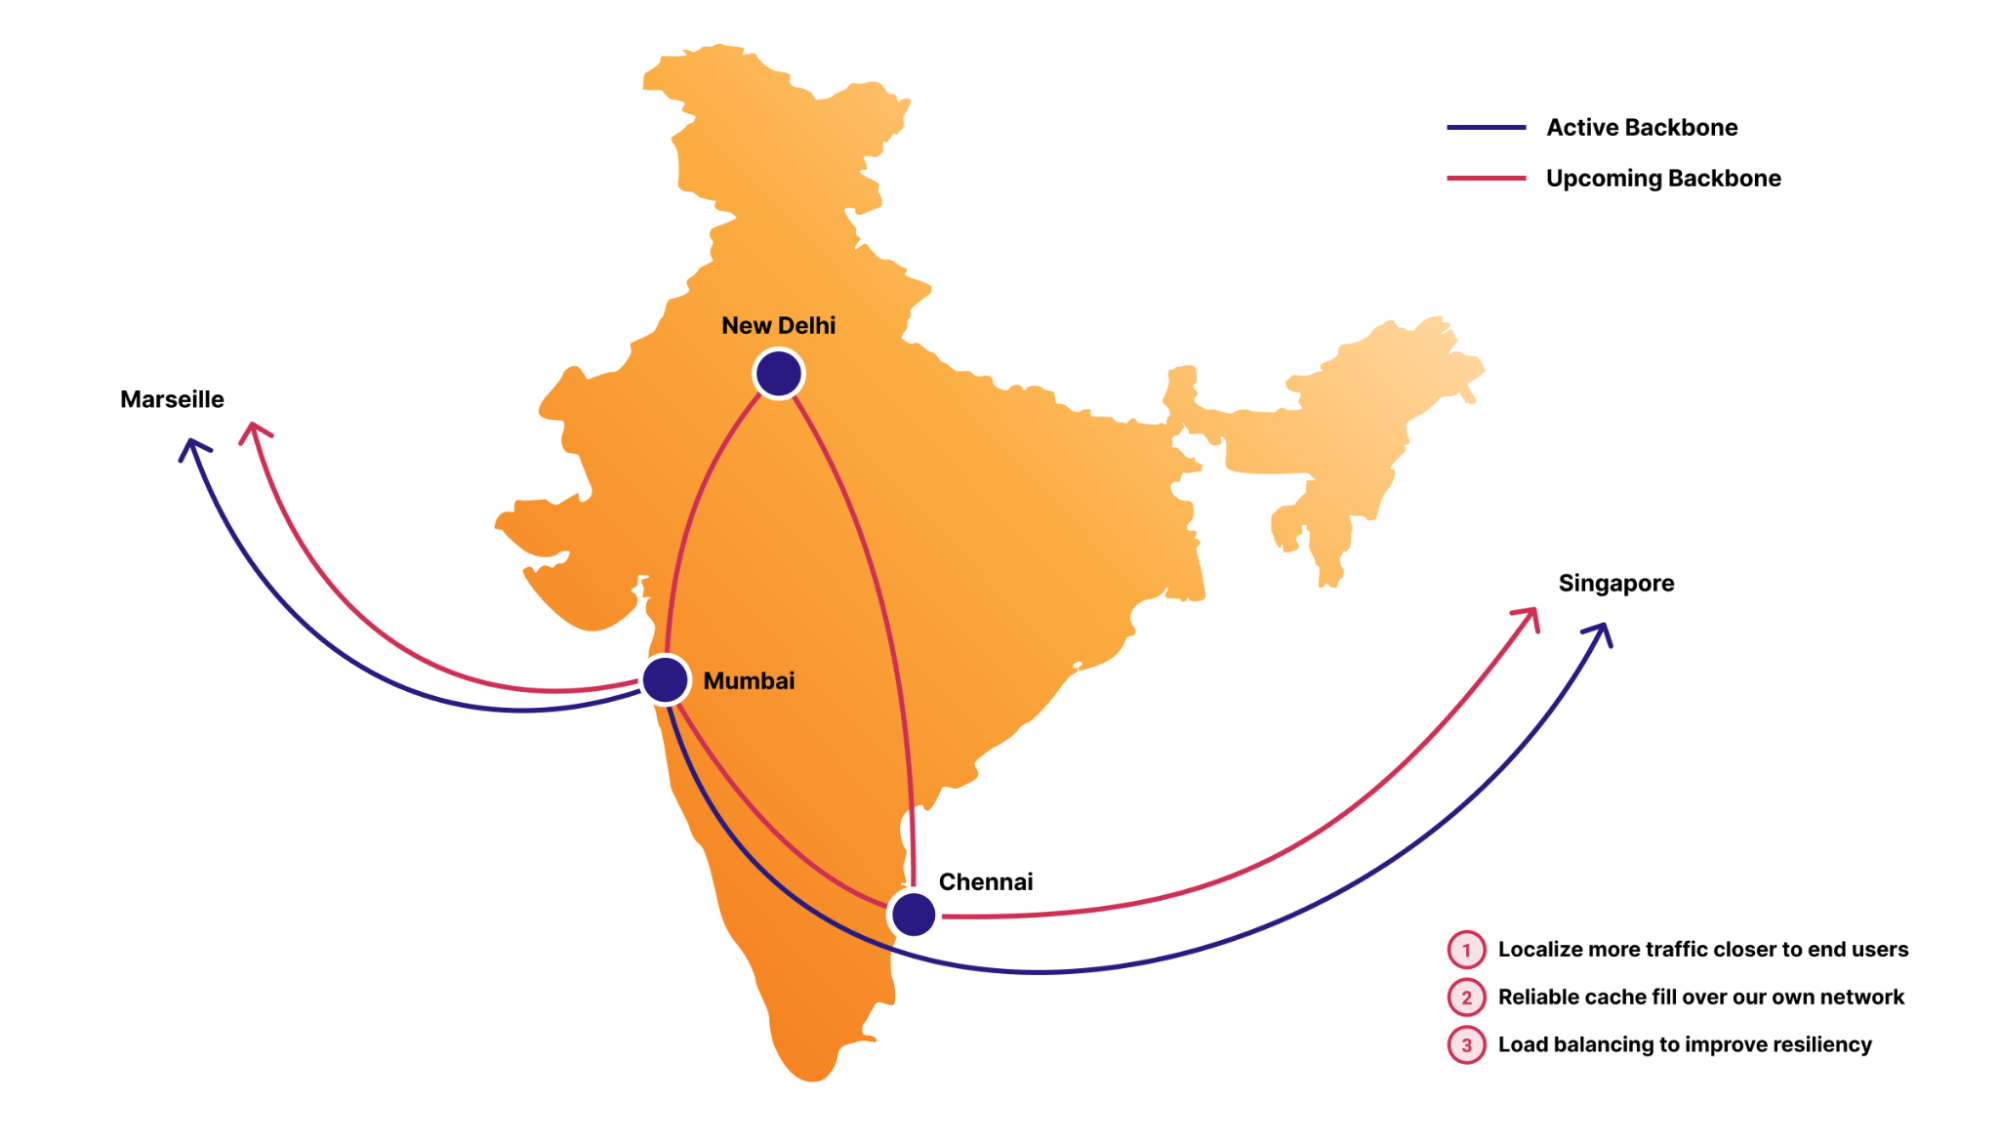
Our regional backbone investments in countries like India or Turkey aim to reduce the need for such inefficient routing. With our own in-region backbone, traffic can be directly routed between in-country Cloudflare data centers, such as from Mumbai to New Delhi to Chennai, reducing latency, increasing reliability, and helping us to provide the same level of service quality as in more developed markets. We can control that data stays local, supporting our Data Localization Suite (DLS), which helps businesses comply with regional data privacy laws by controlling where their data is stored and processed.
Improved latency and performance
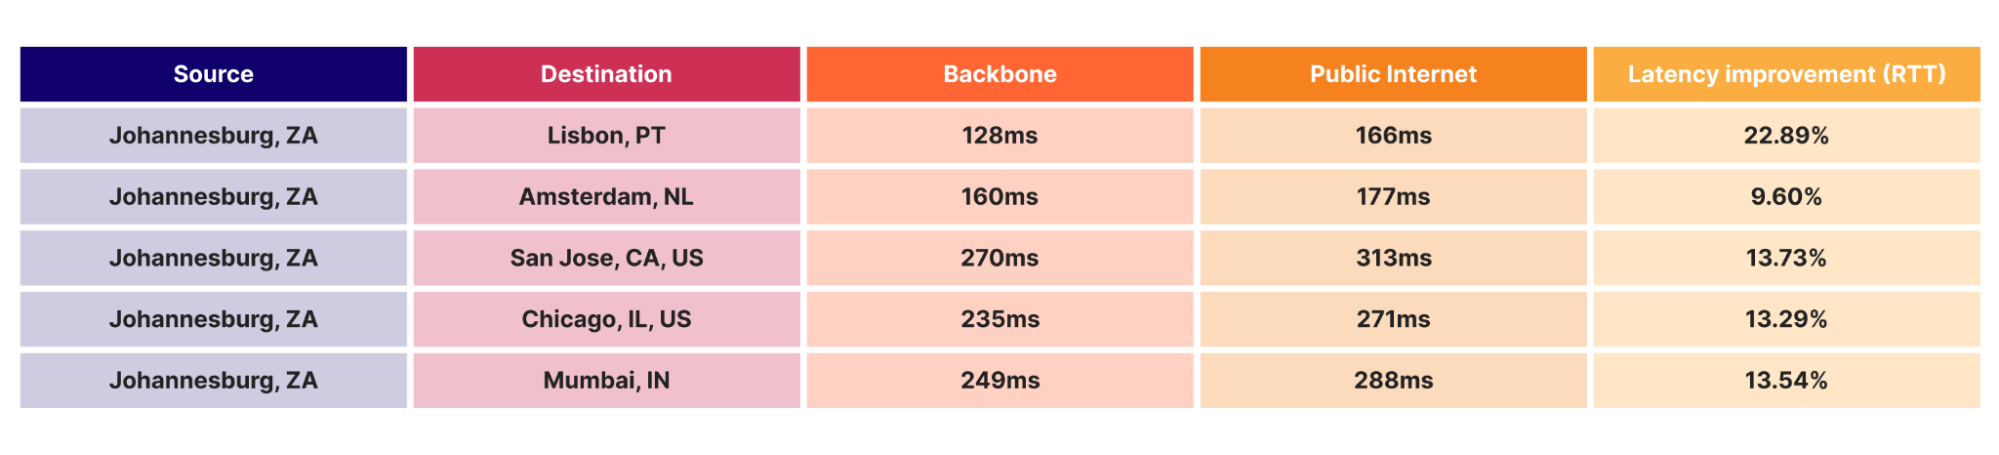
This strategic expansion has not only extended our global reach but has also significantly improved our overall latency. One illustration of this is that since the deployment of our backbone between Lisbon and Johannesburg, we have seen a major performance improvement for users in Johannesburg. Customers benefiting from this improved latency can be, for example, a financial institution running their APIs through us for real-time trading, where milliseconds can impact trades, or our Magic WAN users, where we facilitate site-to-site connectivity between their branch offices.
The table above shows an example where we measured the round-trip time (RTT) for an uncached origin fetch, from an end-user in Johannesburg to various origin locations, comparing our backbone and the public Internet. By carrying the origin request over our backbone, as opposed to IP transit or peering, local users in Johannesburg get their content up to 22% faster. By using our own backbone to long-haul the traffic to its final destination, we are in complete control of the path and performance. This improvement in latency varies by location, but consistently demonstrates the superiority of our backbone infrastructure in delivering high performance connectivity.
Traffic control
Consider a navigation system using 1) GPS to identify the route and 2) a highway toll pass that is valid until your final destination and allows you to drive straight through toll stations without stopping. Our backbone works quite similarly.
Our global backbone is built upon two key pillars. The first is BGP (Border Gateway Protocol), the routing protocol for the Internet, and the second is Segment Routing MPLS (Multiprotocol label switching), a technique for steering traffic across predefined forwarding paths in an IP network. By default, Segment Routing provides end-to-end encapsulation from ingress to egress routers where the intermediate nodes execute no route lookup. Instead, they forward traffic across an end-to-end virtual circuit, or tunnel, called a label-switched path. Once traffic is put on a label-switched path, it cannot detour onto the public Internet and must continue on the predetermined route across Cloudflare’s backbone. This is nothing new, as many networks will even run a “BGP Free Core” where all the route intelligence is carried at the edge of the network, and intermediate nodes only participate in forwarding from ingress to egress.
While leveraging Segment Routing Traffic Engineering (SR-TE) in our backbone, we can automatically select paths between our data centers that are optimized for latency and performance. Sometimes the “shortest path” in terms of routing protocol cost is not the lowest latency or highest performance path.
Supercharged: Argo and the global backbone
Argo Smart Routing is a service that uses Cloudflare’s portfolio of backbone, transit, and peering connectivity to find the most optimal path between the data center where a user’s request lands and your back-end origin server. Argo may forward a request from one Cloudflare data center to another on the way to an origin if the performance would improve by doing so. Orpheus is the counterpart to Argo, and routes around degraded paths for all customer origin requests free of charge. Orpheus is able to analyze network conditions in real-time and actively avoid reachability failures. Customers with Argo enabled get optimal performance for requests from Cloudflare data centers to their origins, while Orpheus provides error self-healing for all customers universally. By mixing our global backbone using Segment Routing as an underlay with Argo Smart Routing and Orpheus as our connectivity overlay, we are able to transport critical customer traffic along the most optimized paths that we have available.
So how exactly does our global backbone fit together with Argo Smart Routing? Argo Transit Selection is an extension of Argo Smart Routing where the lowest latency path between Cloudflare data center hops is explicitly selected and used to forward customer origin requests. The lowest latency path will often be our global backbone, as it is a more dedicated and private means of connectivity, as opposed to third-party transit networks.
Consider a multinational Dutch pharmaceutical company that relies on Cloudflare’s network and services with our SASE solution to connect their global offices, research centers, and remote employees. Their Asian branch offices depend on Cloudflare’s security solutions and network to provide secure access to important data from their central data centers back to their offices in Asia. In case of a cable cut between regions, our network would automatically look for the best alternative route between them so that business impact is limited.
Argo measures every potential combination of the different provider paths, including our own backbone, as an option for reaching origins with smart routing. Because of our vast interconnection with so many networks, and our global private backbone, Argo is able to identify the most performant network path for requests. The backbone is consistently one of the lowest latency paths for Argo to choose from.
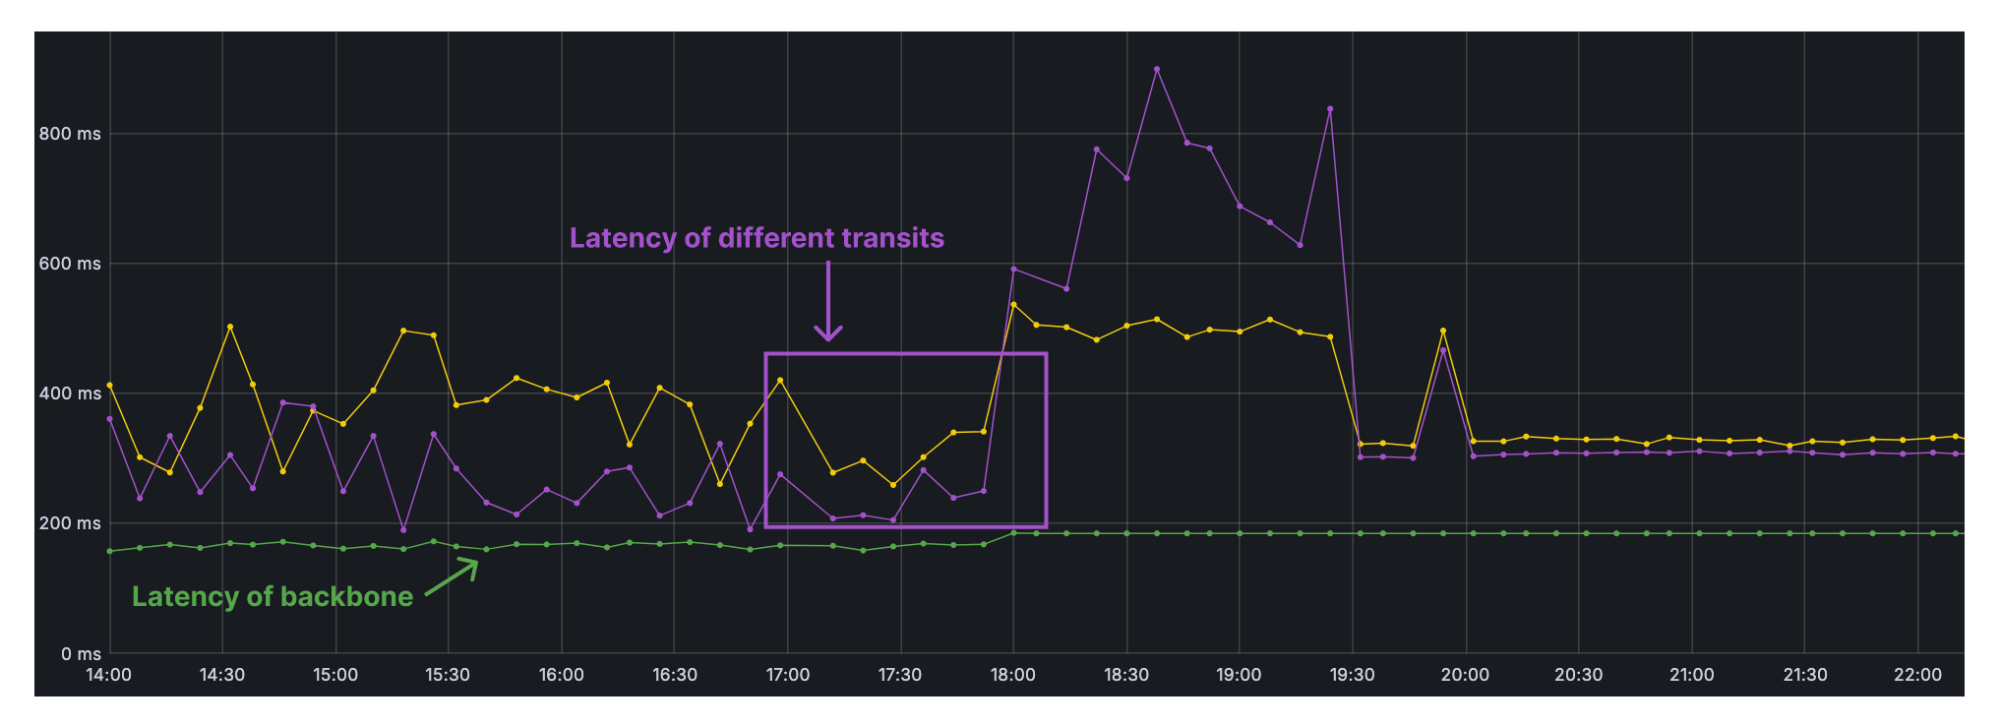
In addition to high performance, we care greatly about network reliability for our customers. This means we need to be as resilient as possible from fiber cuts and third-party transit provider issues. During a disruption of the AAE-1 (Asia Africa Europe-1) submarine cable, this is what Argo saw between Singapore and Amsterdam across some of our transit provider paths vs. the backbone.
The large (purple line) spike shows a latency increase on one of our third-party IP transit provider paths due to congestion, which was eventually resolved following likely traffic engineering within the provider’s network. We saw a smaller latency increase (yellow line) over other transit networks, but still one that is noticeable. The bottom (green) line on the graph is our backbone, where round-trip time more or less remains flat throughout the event, due to our diverse backbone connectivity between Asia and Europe. Throughout the fiber cut, we remained stable at around 200ms between Amsterdam and Singapore. There was no noticeable network hiccup as was seen on the transit provider paths, so Argo actively leveraged the backbone for optimal performance.
Call to action
As Argo improves performance in our network, Cloudflare Network Interconnects (CNIs) optimize getting onto it. We encourage our Enterprise customers to use our free CNI’s as on-ramps onto our network whenever practical. In this way, you can fully leverage our network, including our robust backbone, and increase overall performance for every product within your Cloudflare Connectivity Cloud. In the end, our global network is our main product and our backbone plays a critical role in it. This way we continue to help build a better Internet, by improving our services for everybody, everywhere.
If you want to be part of our mission, join us as a Cloudflare network on-ramp partner to offer secure and reliable connectivity to your customers by integrating directly with us. Learn more about our on-ramp partnerships and how they can benefit your business here.
Picture this: you’re at an airport, and you’re going through an airport security checkpoint. There are a bunch of agents who are scanning your boarding pass and your passport and sending you through to your gate. All of a sudden, some of the agents go on break. Maybe there’s a leak in the ceiling above the checkpoint. Or perhaps a bunch of flights are leaving at 6pm, and a number of passengers turn up at once. Either way, this imbalance between localized supply and demand can cause huge lines and unhappy travelers — who just want to get through the line to get on their flight. How do airports handle this?
Some airports may not do anything and just let you suffer in a longer line. Some airports may offer fast-lanes through the checkpoints for a fee. But most airports will tell you to go to another security checkpoint a little farther away to ensure that you can get through to your gate as fast as possible. They may even have signs up telling you how long each line is, so you can make an easier decision when trying to get through.
At Cloudflare, we have the same problem. We are located in 300 cities around the world that are built to receive end-user traffic for all of our product suites. And in an ideal world, we always have enough computers and bandwidth to handle everyone at their closest possible location. But the world is not always ideal; sometimes we take a data center offline for maintenance, or a connection to a data center goes down, or some equipment fails, and so on. When that happens, we may not have enough attendants to serve every person going through security in every location. It’s not because we haven’t built enough kiosks, but something has happened in our data center that prevents us from serving everyone.
So, we built Traffic Manager: a tool that balances supply and demand across our entire global network. This blog is about Traffic Manager: how it came to be, how we built it, and what it does now.
The world before Traffic Manager
The job now done by Traffic Manager used to be a manual process carried out by network engineers: our network would operate as normal until something happened that caused user traffic to be impacted at a particular data center.
When such events happened, user requests would start to fail with 499 or 500 errors because there weren’t enough machines to handle the request load of our users. This would trigger a page to our network engineers, who would then remove some Anycast routes for that data center. The end result: by no longer advertising those prefixes in the impacted data center, user traffic would divert to a different data center. This is how Anycast fundamentally works: user traffic is drawn to the closest data center advertising the prefix the user is trying to connect to, as determined by Border Gateway Protocol. For a primer on what Anycast is, check out this reference article.
Depending on how bad the problem was, engineers would remove some or even all the routes in a data center. When the data center was again able to absorb all the traffic, the engineers would put the routes back and the traffic would return naturally to the data center.
As you might guess, this was a challenging task for our network engineers to do every single time any piece of hardware on our network had an issue. It didn’t scale.
Never send a human to do a machine’s job
But doing it manually wasn’t just a burden on our Network Operations team. It also resulted in a sub-par experience for our customers; our engineers would need to take time to diagnose and re-route traffic. To solve both these problems, we wanted to build a service that would immediately and automatically detect if users were unable to reach a Cloudflare data center, and withdraw routes from the data center until users were no longer seeing issues. Once the service received notifications that the impacted data center could absorb the traffic, it could put the routes back and reconnect that data center. This service is called Traffic Manager, because its job (as you might guess) is to manage traffic coming into the Cloudflare network.
Accounting for second order consequences
When a network engineer removes a route from a router, they can make the best guess at where the user requests will move to, and try to ensure that the failover data center has enough resources to handle the requests — if it doesn’t, they can adjust the routes there accordingly prior to removing the route in the initial data center. To be able to automate this process, we needed to move from a world of intuition to a world of data — accurately predicting where traffic would go when a route was removed, and feeding this information to Traffic Manager, so it could ensure it doesn’t make the situation worse.
Meet Traffic Predictor
Although we can adjust which data centers advertise a route, we are unable to influence what proportion of traffic each data center receives. Each time we add a new data center, or a new peering session, the distribution of traffic changes, and as we are in over 300 cities and 12,500 peering sessions, it has become quite difficult for a human to keep track of, or predict the way traffic will move around our network. Traffic manager needed a buddy: Traffic Predictor.
In order to do its job, Traffic Predictor carries out an ongoing series of real world tests to see where traffic actually moves. Traffic Predictor relies on a testing system that simulates removing a data center from service and measuring where traffic would go if that data center wasn’t serving traffic. To help understand how this system works, let’s simulate the removal of a subset of a data center in Christchurch, New Zealand:
First, Traffic Predictor gets a list of all the IP addresses that normally connect to Christchurch. Traffic Predictor will send a ping request to hundreds of thousands of IPs that have recently made a request there.
Traffic Predictor records if the IP responds, and whether the response returns to Christchurch using a special Anycast IP range specifically configured for Traffic Predictor.
Once Traffic Predictor has a list of IPs that respond to Christchurch, it removes that route containing that special range from Christchurch, waits a few minutes for the Internet routing table to be updated, and runs the test again.
Instead of being routed to Christchurch, the responses are instead going to data centers around Christchurch. Traffic Predictor then uses the knowledge of responses for each data center, and records the results as the failover for Christchurch.
This allows us to simulate Christchurch going offline without actually taking Christchurch offline!
But Traffic Predictor doesn’t just do this for any one data center. To add additional layers of resiliency, Traffic Predictor even calculates a second layer of indirection: for each data center failure scenario, Traffic Predictor also calculates failure scenarios and creates policies for when surrounding data centers fail.
Using our example from before, when Traffic Predictor tests Christchurch, it will run a series of tests that remove several surrounding data centers from service including Christchurch to calculate different failure scenarios. This ensures that even if something catastrophic happens which impacts multiple data centers in a region, we still have the ability to serve user traffic. If you think this data model is complicated, you’re right: it takes several days to calculate all of these failure paths and policies.
Here’s what those failure paths and failover scenarios look like for all of our data centers around the world when they’re visualized:
This can be a bit complicated for humans to parse, so let’s dig into that above scenario for Christchurch, New Zealand to make this a bit more clear. When we take a look at failover paths specifically for Christchurch, we see they look like this:
In this scenario we predict that 99.8% of Christchurch’s traffic would shift to Auckland, which is able to absorb all Christchurch traffic in the event of a catastrophic outage.
Traffic Predictor allows us to not only see where traffic will move to if something should happen, but it allows us to preconfigure Traffic Manager policies to move requests out of failover data centers to prevent a thundering herd scenario: where sudden influx of requests can cause failures in a second data center if the first one has issues. With Traffic Predictor, Traffic Manager doesn’t just move traffic out of one data center when that one fails, but it also proactively moves traffic out of other data centers to ensure a seamless continuation of service.
From a sledgehammer to a scalpel
With Traffic Predictor, Traffic Manager can dynamically advertise and withdraw prefixes while ensuring that every datacenter can handle all the traffic. But withdrawing prefixes as a means of traffic management can be a bit heavy-handed at times. One of the reasons for this is that the only way we had to add or remove traffic to a data center was through advertising routes from our Internet-facing routers. Each one of our routes has thousands of IP addresses, so removing only one still represents a large portion of traffic.
Specifically, Internet applications will advertise prefixes to the Internet from a /24 subnet at an absolute minimum, but many will advertise prefixes larger than that. This is generally done to prevent things like route leaks or route hijacks: many providers will actually filter out routes that are more specific than a /24 (for more information on that, check out this blog here). If we assume that Cloudflare maps protected properties to IP addresses at a 1:1 ratio, then each /24 subnet would be able to service 256 customers, which is the number of IP addresses in a /24 subnet. If every IP address sent one request per second, we’d have to move 4 /24 subnets out of a data center if we needed to move 1,000 requests per second (RPS).
But in reality, Cloudflare maps a single IP address to hundreds of thousands of protected properties. So for Cloudflare, a /24 might take 3,000 requests per second, but if we needed to move 1,000 RPS out, we would have no choice but to move a single /24 out. And that’s just assuming we advertise at a /24 level. If we used /20s to advertise, the amount we can withdraw gets less granular: at a 1:1 website to IP address mapping, that’s 4,096 requests per second for each prefix, and even more if the website to IP address mapping is many to one.
While withdrawing prefix advertisements improved the customer experience for those users who would have seen a 499 or 500 error — there may have been a significant portion of users who wouldn’t have been impacted by an issue who still were moved away from the data center they should have gone to, probably slowing them down, even if only a little bit. This concept of moving more traffic out than is necessary is called “stranding capacity”: the data center is theoretically able to service more users in a region but cannot because of how Traffic Manager was built.
We wanted to improve Traffic Manager so that it only moved the absolute minimum of users out of a data center that was seeing a problem and not strand any more capacity. To do so, we needed to shift percentages of prefixes, so we could be extra fine-grained and only move the things that absolutely need to be moved. To solve this, we built an extension of our Layer 4 load balancer Unimog, which we call Plurimog.
A quick refresher on Unimog and layer 4 load balancing: every single one of our machines contains a service that determines whether that machine can take a user request. If the machine can take a user request then it sends the request to our HTTP stack which processes the request before returning it to the user. If the machine can’t take the request, the machine sends the request to another machine in the data center that can. The machines can do this because they are constantly talking to each other to understand whether they can serve requests for users.
Plurimog does the same thing, but instead of talking between machines, Plurimog talks in between data centers and points of presence. If a request goes into Philadelphia and Philadelphia is unable to take the request, Plurimog will forward to another data center that can take the request, like Ashburn, where the request is decrypted and processed. Because Plurimog operates at layer 4, it can send individual TCP or UDP requests to other places which allows it to be very fine-grained: it can send percentages of traffic to other data centers very easily, meaning that we only need to send away enough traffic to ensure that everyone can be served as fast as possible. Check out how that works in our Frankfurt data center, as we are able to shift progressively more and more traffic away to handle issues in our data centers. This chart shows the number of actions taken on free traffic that cause it to be sent out of Frankfurt over time:
But even within a data center, we can route traffic around to prevent traffic from leaving the datacenter at all. Our large data centers, called Multi-Colo Points of Presence (MCPs) contain logical sections of compute within a data center that are distinct from one another. These MCP data centers are enabled with another version of Unimog called Duomog, which allows for traffic to be shifted between logical sections of compute automatically. This makes MCP data centers fault-tolerant without sacrificing performance for our customers, and allows Traffic Manager to work within a data center as well as between data centers.
When evaluating portions of requests to move, Traffic Manager does the following:
Traffic Manager identifies the proportion of requests that need to be removed from a data center or subsection of a data center so that all requests can be served.
Traffic Manager then calculates the aggregated space metrics for each target to see how many requests each failover data center can take.
Traffic Manager then identifies how much traffic in each plan we need to move, and moves either a proportion of the plan, or all of the plan through Plurimog/Duomog, until we've moved enough traffic. We move Free customers first, and if there are no more Free customers in a data center, we'll move Pro, and then Business customers if needed.
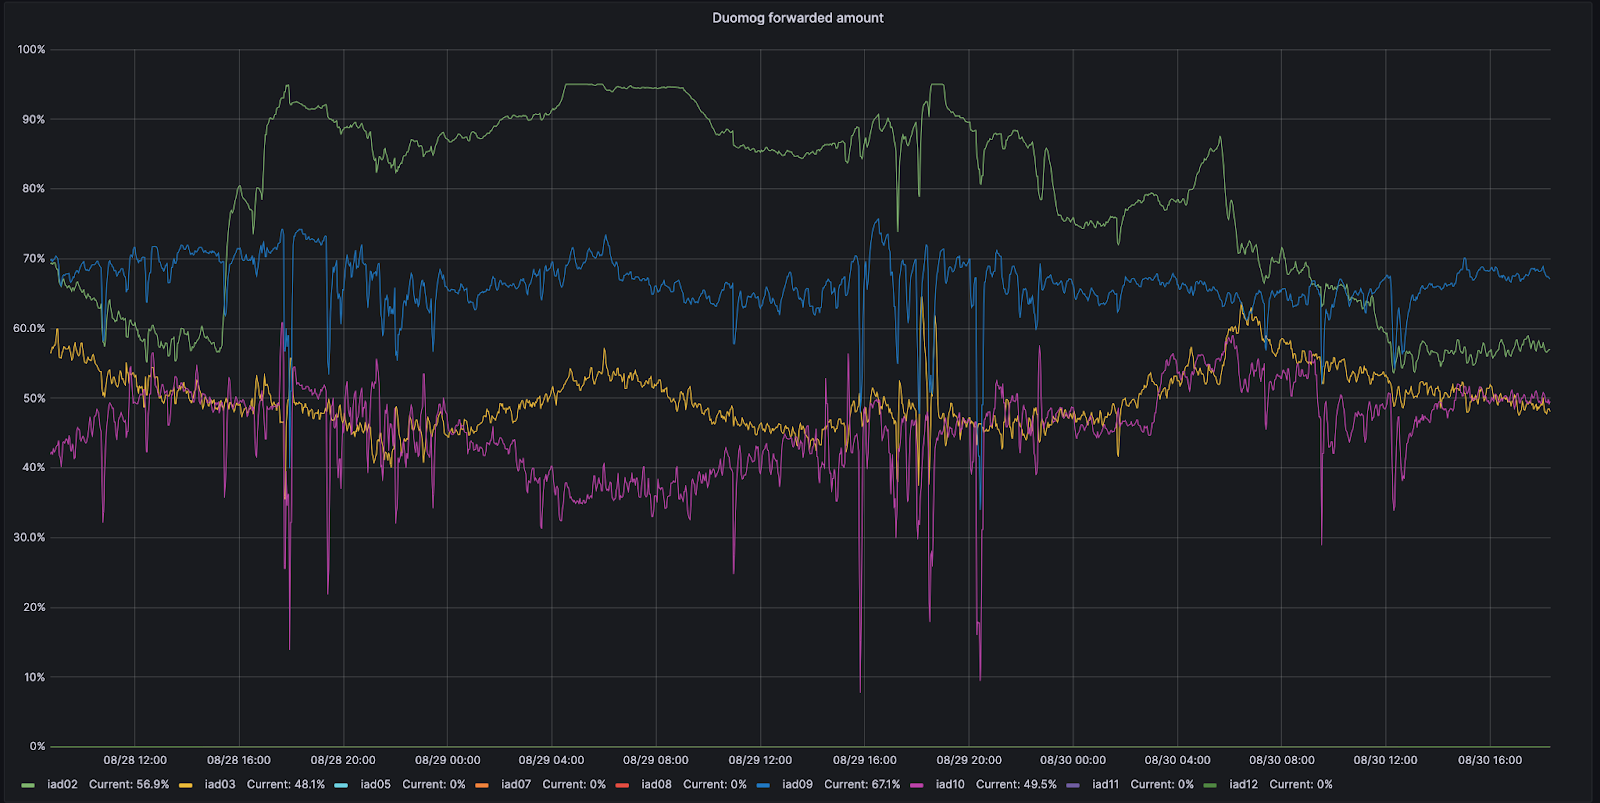
For example, let’s look at Ashburn, Virginia: one of our MCPs. Ashburn has nine different subsections of capacity that can each take traffic. On 8/28, one of those subsections, IAD02, had an issue that reduced the amount of traffic it could handle.
During this time period, Duomog sent more traffic from IAD02 to other subsections within Ashburn, ensuring that Ashburn was always online, and that performance was not impacted during this issue. Then, once IAD02 was able to take traffic again, Duomog shifted traffic back automatically. You can see these actions visualized in the time series graph below, which tracks the percentage of traffic moved over time between subsections of capacity within IAD02 (shown in green):
How does Traffic Manager know how much to move?
Although we used requests per second in the example above, using requests per second as a metric isn’t accurate enough when actually moving traffic. The reason for this is that different customers have different resource costs to our service; a website served mainly from cache with the WAF deactivated is much cheaper CPU wise than a site with all WAF rules enabled and caching disabled. So we record the time that each request takes in the CPU. We can then aggregate the CPU time across each plan to find the CPU time usage per plan. We record the CPU time in ms, and take a per second value, resulting in a unit of milliseconds per second.
CPU time is an important metric because of the impact it can have on latency and customer performance. As an example, consider the time it takes for an eyeball request to make it entirely through the Cloudflare front line servers: we call this the cfcheck latency. If this number goes too high, then our customers will start to notice, and they will have a bad experience. When cfcheck latency gets high, it’s usually because CPU utilization is high. The graph below shows 95th percentile cfcheck latency plotted against CPU utilization across all the machines in the same data center, and you can see the strong correlation:
So having Traffic Manager look at CPU time in a data center is a very good way to ensure that we’re giving customers the best experience and not causing problems.
After getting the CPU time per plan, we need to figure out how much of that CPU time to move to other data centers. To do this, we aggregate the CPU utilization across all servers to give a single CPU utilization across the data center. If a proportion of servers in the data center fail, due to network device failure, power failure, etc., then the requests that were hitting those servers are automatically routed elsewhere within the data center by Duomog. As the number of servers decrease, the overall CPU utilization of the data center increases. Traffic Manager has three thresholds for each data center; the maximum threshold, the target threshold, and the acceptable threshold:
Maximum: the CPU level at which performance starts to degrade, where Traffic Manager will take action
Target: the level to which Traffic Manager will try to reduce the CPU utilization to restore optimal service to users
Acceptable: the level below which a data center can receive requests forwarded from another data center, or revert active moves
When a data center goes above the maximum threshold, Traffic Manager takes the ratio of total CPU time across all plans to current CPU utilization, then applies that to the target CPU utilization to find the target CPU time. Doing it this way means we can compare a data center with 100 servers to a data center with 10 servers, without having to worry about the number of servers in each data center. This assumes that load increases linearly, which is close enough to true for the assumption to be valid for our purposes.
Target ratio equals current ratio:
Therefore:
Subtracting the target CPU time from the current CPU time gives us the CPU time to move:
For example, if the current CPU utilization was at 90% across the data center, the target was 85%, and the CPU time across all plans was 18,000, we would have:
This would mean Traffic Manager would need to move 1,000 CPU time:
Now we know the total CPU time needed to move, we can go through the plans, until the required time to move has been met.
What is the maximum threshold?
A frequent problem that we faced was determining at which point Traffic Manager should start taking action in a data center – what metric should it watch, and what is an acceptable level?
As said before, different services have different requirements in terms of CPU utilization, and there are many cases of data centers that have very different utilization patterns.
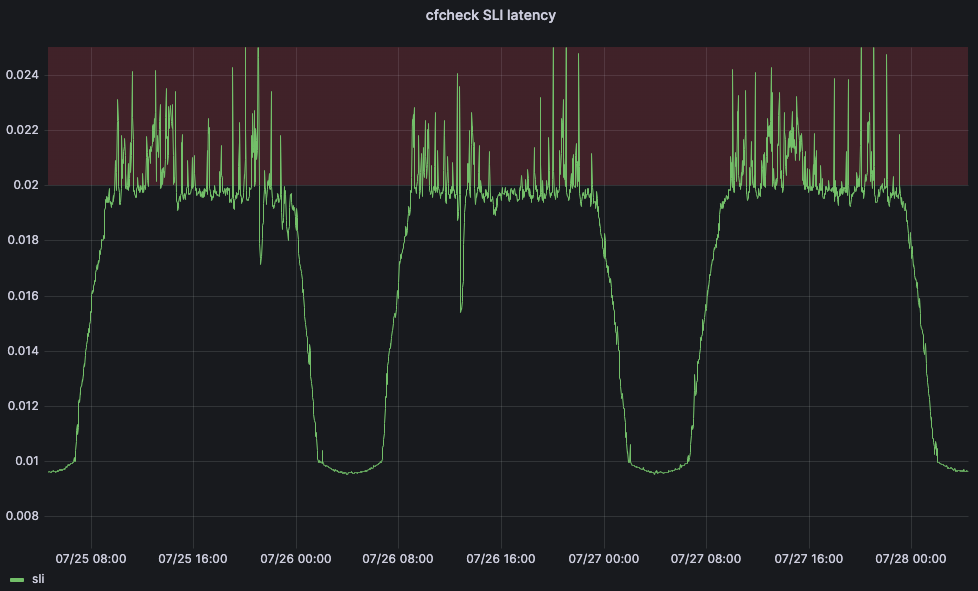
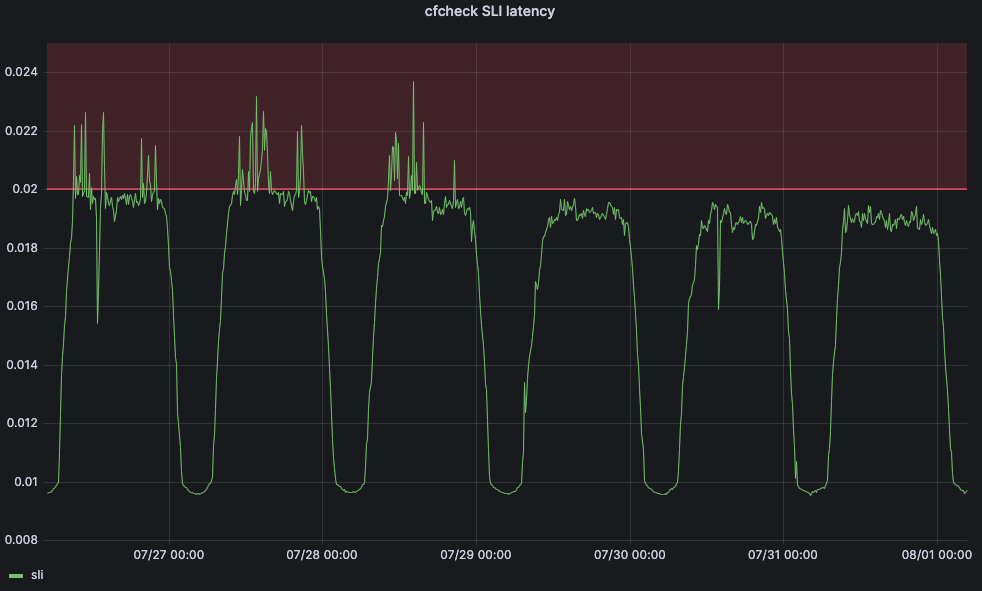
To solve this problem, we turned to machine learning. We created a service that will automatically adjust the maximum thresholds for each data center according to customer-facing indicators. For our main service-level indicator (SLI), we decided to use the cfcheck latency metric we described earlier.
But we also need to define a service-level objective (SLO) in order for our machine learning application to be able to adjust the threshold. We set the SLO for 20ms. Comparing our SLO to our SLI, our 95th percentile cfcheck latency should never go above 20ms and if it does, we need to do something. The below graph shows 95th percentile cfcheck latency over time, and customers start to get unhappy when cfcheck latency goes into the red zone:
If customers have a bad experience when CPU gets too high, then the goal of Traffic Manager’s maximum thresholds are to ensure that customer performance isn’t impacted and to start redirecting traffic away before performance starts to degrade. At a scheduled interval the Traffic Manager service will fetch a number of metrics for each data center and apply a series of machine learning algorithms. After cleaning the data for outliers we apply a simple quadratic curve fit, and we are currently testing a linear regression algorithm.
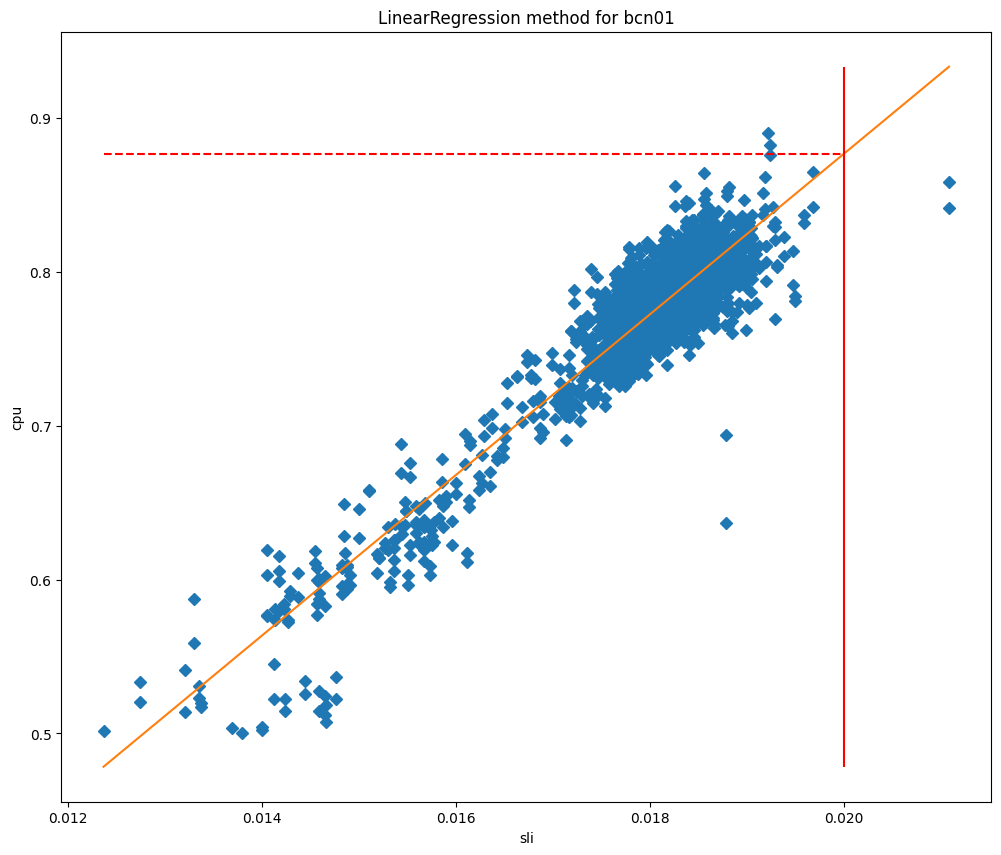
After fitting the models we can use them to predict the CPU usage when the SLI is equal to our SLO, and then use it as our maximum threshold. If we plot the cpu values against the SLI we can see clearly why these methods work so well for our data centers, as you can see for Barcelona in the graphs below, which are plotted against curve fit and linear regression fit respectively.
In these charts the vertical line is the SLO, and the intersection of this line with the fitted model represents the value that will be used as the maximum threshold. This model has proved to be very accurate, and we are able to significantly reduce the SLO breaches. Let’s take a look at when we started deploying this service in Lisbon:
Before the change, cfcheck latency was constantly spiking, but Traffic Manager wasn’t taking actions because the maximum threshold was static. But after July 29, we see that cfcheck latency has never hit the SLO because we are constantly measuring to make sure that customers are never impacted by CPU increases.
Where to send the traffic?
So now that we have a maximum threshold, we need to find the third CPU utilization threshold which isn’t used when calculating how much traffic to move – the acceptable threshold. When a data center is below this threshold, it has unused capacity which, as long as it isn’t forwarding traffic itself, is made available for other data centers to use when required. To work out how much each data center is able to receive, we use the same methodology as above, substituting target for acceptable:
Therefore:
Subtracting the current CPU time from the acceptable CPU time gives us the amount of CPU time that a data center could accept:
To find where to send traffic, Traffic Manager will find the available CPU time in all data centers, then it will order them by latency from the data center needing to move traffic. It moves through each of the data centers, using all available capacity based on the maximum thresholds before moving onto the next. When finding which plans to move, we move from the lowest priority plan to highest, but when finding where to send them, we move in the opposite direction.
To make this clearer let's use an example:
We need to move 1,000 CPU time from data center A, and we have the following usage per plan: Free: 500ms/s, Pro: 400ms/s, Business: 200ms/s, Enterprise: 1000ms/s.
We would move 100% of Free (500ms/s), 100% of Pro (400ms/s), 50% of Business (100ms/s), and 0% of Enterprise.
Nearby data centers have the following available CPU time: B: 300ms/s, C: 300ms/s, D: 1,000ms/s.
With latencies: A-B: 100ms, A-C: 110ms, A-D: 120ms.
Starting with the lowest latency and highest priority plan that requires action, we would be able to move all the Business CPU time to data center B and half of Pro. Next we would move onto data center C, and be able to move the rest of Pro, and 20% of Free. The rest of Free could then be forwarded to data center D. Resulting in the following action: Business: 50% → B, Pro: 50% → B, 50% → C, Free: 20% → C, 80% → D.
Reverting actions
In the same way that Traffic Manager is constantly looking to keep data centers from going above the threshold, it is also looking to bring any forwarded traffic back into a data center that is actively forwarding traffic.
Above we saw how Traffic Manager works out how much traffic a data center is able to receive from another data center — it calls this the available CPU time. When there is an active move we use this available CPU time to bring back traffic to the data center — we always prioritize reverting an active move over accepting traffic from another data center.
When you put this all together, you get a system that is constantly measuring system and customer health metrics for every data center and spreading traffic around to make sure that each request can be served given the current state of our network. When we put all of these moves between data centers on a map, it looks something like this, a map of all Traffic Manager moves for a period of one hour. This map doesn’t show our full data center deployment, but it does show the data centers that are sending or receiving moved traffic during this period:
Data centers in red or yellow are under load and shifting traffic to other data centers until they become green, which means that all metrics are showing as healthy. The size of the circles represent how many requests are shifted from or to those data centers. Where the traffic is going is denoted by where the lines are moving. This is difficult to see at a world scale, so let’s zoom into the United States to see this in action for the same time period:
Here you can see Toronto, Detroit, New York, and Kansas City are unable to serve some requests due to hardware issues, so they will send those requests to Dallas, Chicago, and Ashburn until equilibrium is restored for users and data centers. Once data centers like Detroit are able to service all the requests they are receiving without needing to send traffic away, Detroit will gradually stop forwarding requests to Chicago until any issues in the data center are completely resolved, at which point it will no longer be forwarding anything. Throughout all of this, end users are online and are not impacted by any physical issues that may be happening in Detroit or any of the other locations sending traffic.
Happy network, happy products
Because Traffic Manager is plugged into the user experience, it is a fundamental component of the Cloudflare network: it keeps our products online and ensures that they’re as fast and reliable as they can be. It’s our real time load balancer, helping to keep our products fast by only shifting necessary traffic away from data centers that are having issues. Because less traffic gets moved, our products and services stay fast.
But Traffic Manager can also help keep our products online and reliable because they allow our products to predict where reliability issues may occur and preemptively move the products elsewhere. For example, Browser Isolation directly works with Traffic Manager to help ensure the uptime of the product. When you connect to a Cloudflare data center to create a hosted browser instance, Browser Isolation first asks Traffic Manager if the data center has enough capacity to run the instance locally, and if so, the instance is created right then and there. If there isn’t sufficient capacity available, Traffic Manager tells Browser Isolation which the closest data center with sufficient available capacity is, thereby helping Browser Isolation to provide the best possible experience for the user.
Happy network, happy users
At Cloudflare, we operate this huge network to service all of our different products and customer scenarios. We’ve built this network for resiliency: in addition to our MCP locations designed to reduce impact from a single failure, we are constantly shifting traffic around on our network in response to internal and external issues.
But that is our problem — not yours.
Similarly, when human beings had to fix those issues, it was customers and end users who would be impacted. To ensure that you’re always online, we’ve built a smart system that detects our hardware failures and preemptively balances traffic across our network to ensure it’s online and as fast as possible. This system works faster than any person — not only allowing our network engineers to sleep at night — but also providing a better, faster experience for all of our customers.
And finally: if these kinds of engineering challenges sound exciting to you, then please consider checking out the Traffic Engineering team's open position on Cloudflare’s Careers page!
Today, we’re excited to announce support for IPsec as an on-ramp to Cloudflare One. As a customer, you should be able to use whatever method you want to get your traffic to Cloudflare’s network. We’ve heard from you that IPsec is your method of choice for connecting to us at the network layer, because of its near-universal vendor support and blanket layer of encryption across all traffic. So we built support for it! Read on to learn how our IPsec implementation is faster and easier to use than traditional IPsec connectivity, and how it integrates deeply with our Cloudflare One suite to provide unified security, performance, and reliability across all your traffic.
Using the Internet as your corporate network
With Cloudflare One, customers can connect any traffic source or destination — branch offices, data centers, cloud properties, user devices — to our network. Traffic is routed to the closest Cloudflare location, where security policies are applied before we send it along optimized routes to its destination — whether that’s within your private network or on the Internet. It is good practice to encrypt any traffic that’s sensitive at the application level, but for customers who are transitioning from forms of private connectivity like Multiprotocol Label Switching (MPLS), this often isn’t a reality. We’ve talked to many customers who have legacy file transfer and other applications running across their MPLS circuits unencrypted, and are relying on the fact that these circuits are “private” to provide security. In order to start sending this traffic over the Internet, customers need a blanket layer of encryption across all of it; IPsec tunnels are traditionally an easy way to accomplish this.
Traditional IPsec implementations
IPsec as a technology has been around since 1995, and is broadly implemented across many hardware and software platforms. Many companies have adopted IPsec VPNs for securely transferring corporate traffic over the Internet. These VPNs tend to have one of two main architectures: hub and spoke, or mesh.
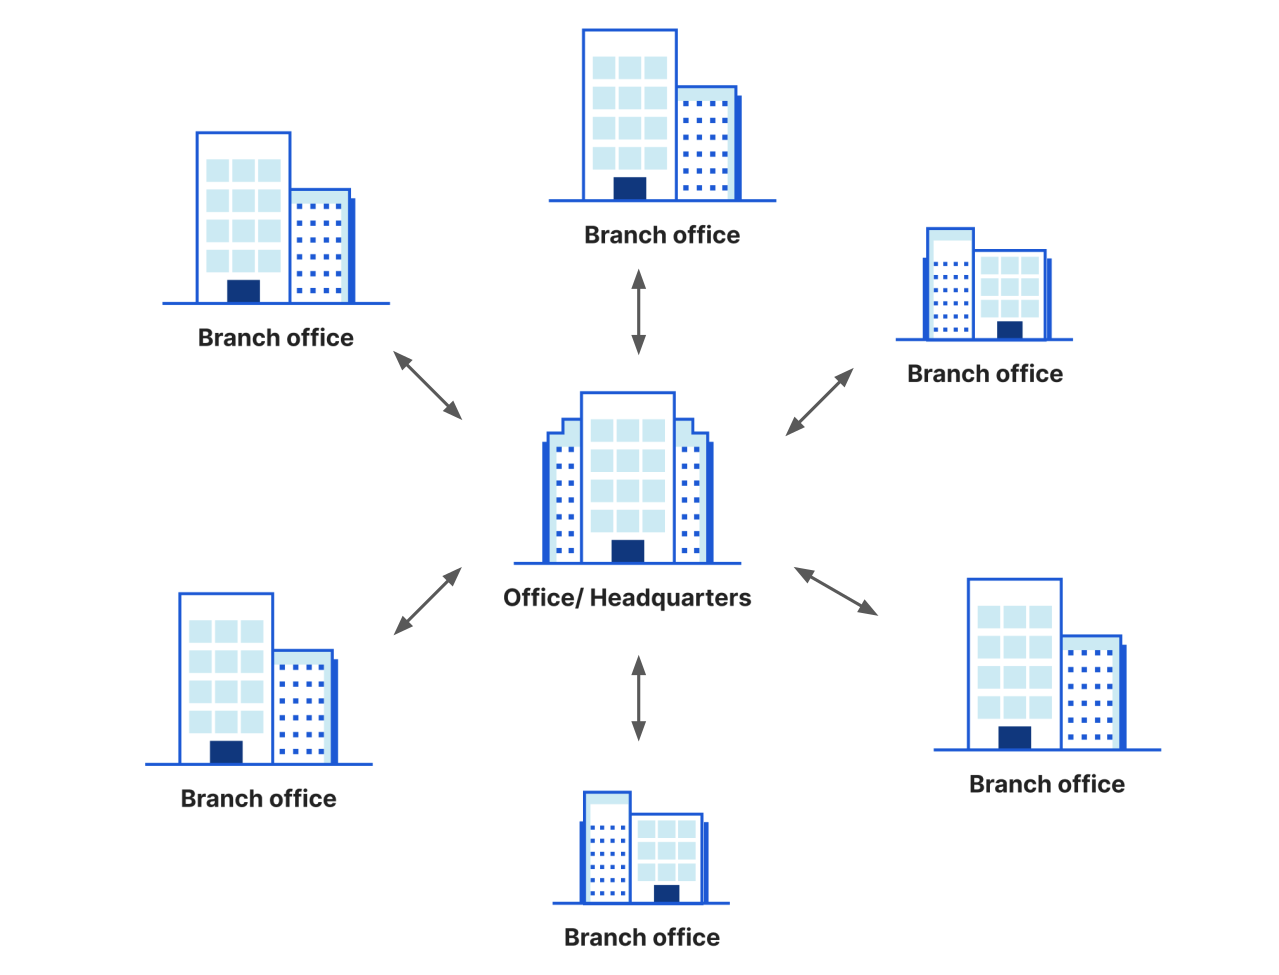
In the hub and spoke model, each “spoke” node establishes an IPsec tunnel back to a core “hub,” usually a headquarters or data center location. Traffic between spokes flows through the hub for routing and in order to have security policies applied (like by an on-premise firewall). This architecture is simple because each node only needs to maintain one tunnel to get connectivity to other locations, but it can introduce significant performance penalties. Imagine a global network with two “spokes”, one in India and another one in Singapore, but a “hub” located in the United States — traffic needs to travel a round trip thousands of miles back and forth in order to get to its destination.
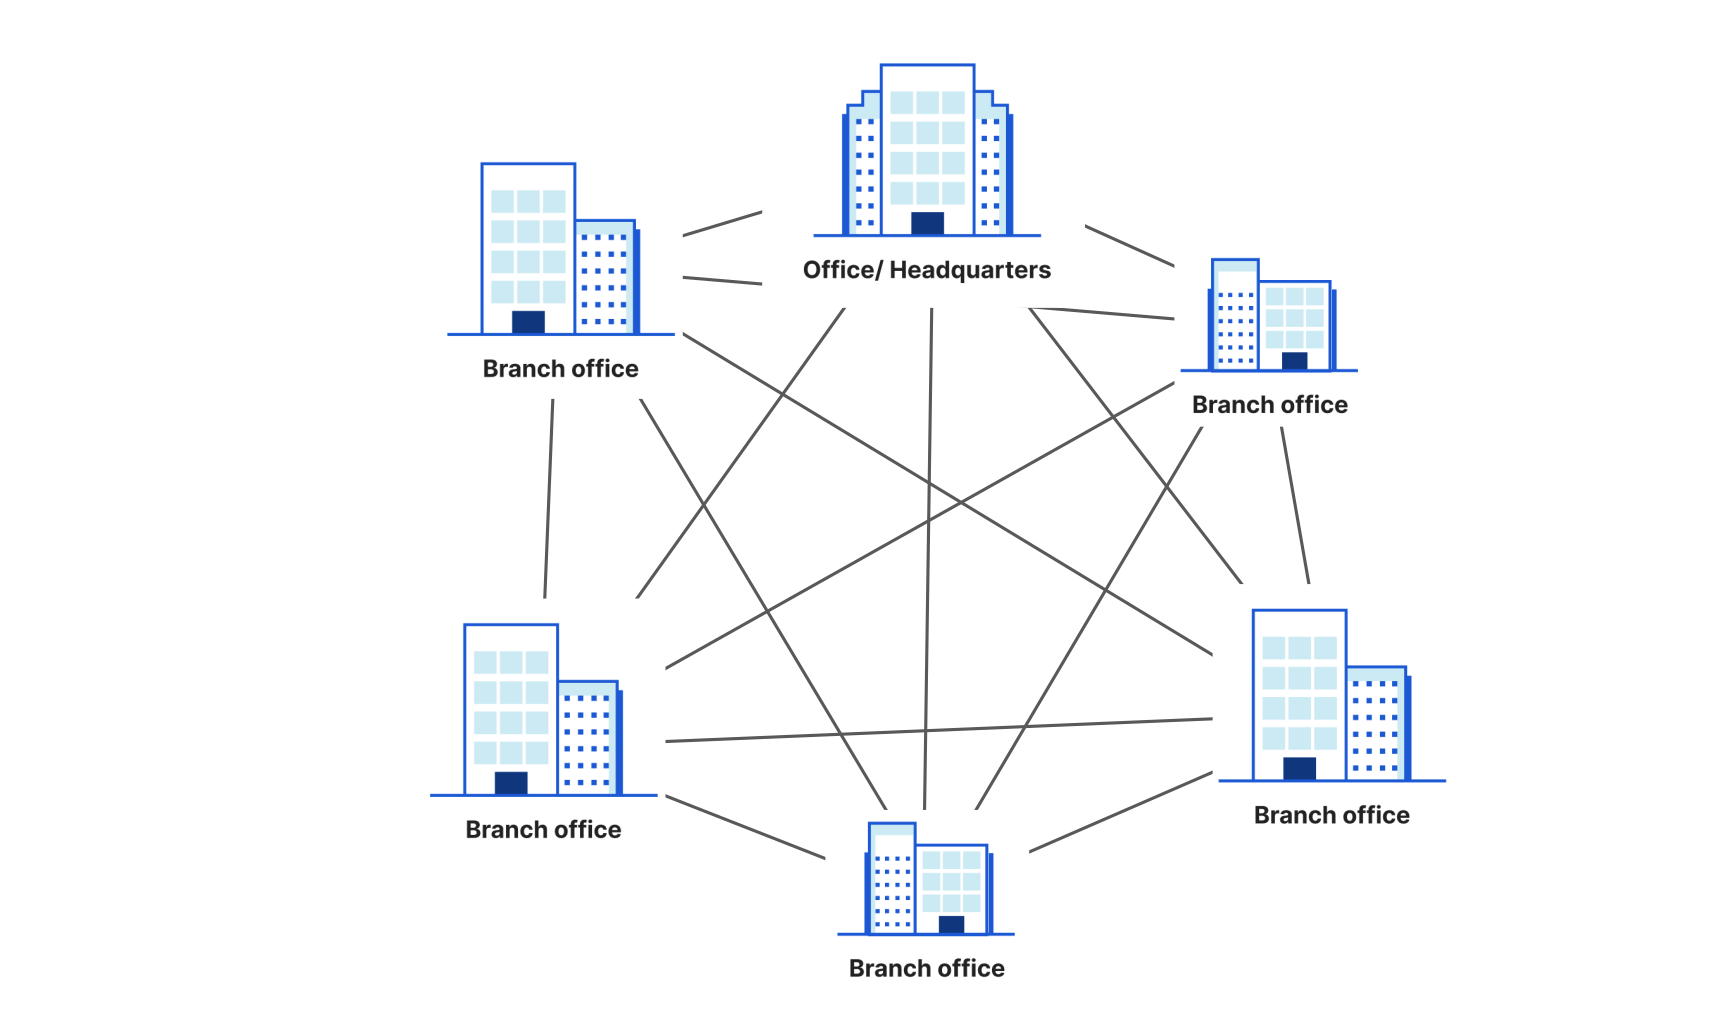
In the mesh model, every node is connected to every other node with a dedicated IPsec tunnel. This improves performance because traffic can take more direct paths, but in practice means an unmanageable number of tunnels after even a handful of locations are added.
Customers we’ve talked to about IPsec know they want it for the blanket layer of encryption and broad vendor support, but they haven’t been particularly excited about it because of the problems with existing architecture models. We knew we wanted to develop something that was easier to use and left those problems in the past, so that customers could get excited about building their next-generation network on Cloudflare. So how are we bringing IPsec out of the 90s? By delivering it on our global Anycast network: customers establish one IPsec tunnel to us and get automatic connectivity to 250+ locations. It’s conceptually similar to the hub and spoke model, but the “hub” is everywhere, blazing fast, and easy to manage.
So how does IPsec actually work?
IPsec was designed back in 1995 to provide authentication, integrity, and confidentiality for IP packets. One of the ways it does this is by creating tunnels between two hosts, encrypting the IP packets, and adding a new IP header onto encrypted packets. To make this happen, IPsec has two components working together: a userspace Internet Key Exchange (IKE) daemon and an IPsec stack in kernel-space. IKE is the protocol which creates Security Associations (SAs) for IPsec. An SA is a collection of all the security parameters, like those for authentication and encryption, that are needed to establish an IPsec tunnel.
When a new IPsec tunnel needs to be set up, one IKE daemon will initiate a session with another and create an SA. All the complexity of configuration, key negotiation, and key generation happens in a handful of packets between the two IKE daemons safely in userspace. Once the IKE Daemons have started their session, they hand off their nice and neat SA to the IPsec stack in kernel-space, which now has all the information it needs to intercept the right packets for encryption and decryption.
There are plenty of open source IKE daemons, including strongSwan, Libreswan, and Openswan, that we considered using for our IPsec implementation. These “swans” all tie speaking the IKE protocol tightly with configuring the IPsec stack. This is great for establishing point-to-point tunnels — installing one “swan” is all you need to speak IKE and configure an encrypted tunnel. But we’re building the next-generation network that takes advantage of Cloudflare’s entire global Anycast edge. So how do we make it so that a customer sets up one tunnel with Cloudflare with every single edge server capable of exchanging data on it?
Anycast IPsec: an implementation for next-generation networks
The fundamental problem in the way of Anycast IPsec is that the SA needs to be handed off to the kernel-space IPsec stack on every Cloudflare edge server, but the SA is created on only one server — the one running the IKE daemon that the customer’s IKE daemon connects to. How do we solve this problem? The first thing that needs to be true is that every server needs to be able to create that SA.
Every Cloudflare server now runs an IKE daemon, so customers can have a fast, reliable connection to start a tunnel anywhere in the world. We looked at using one of the existing “swans” but that tight coupling of IKE with the IPsec stack meant that the SA was hard to untangle from configuring the dataplane. We needed the SA totally separate and neatly sharable from the server that created it to every other server on our edge. Naturally, we built our own “swan” to do just that.
To send our SA worldwide, we put a new spin on an old trick. With Cloudflare Tunnels, a customer’s cloudflared tunnel process creates connections to a few nearby Cloudflare edge servers. But traffic destined for that tunnel could arrive at any edge server, which needs to know how to proxy traffic to the tunnel-connected edge servers. So, we built technology that enables an edge server to rapidly distribute information about its Cloudflare Tunnel connections to all other edge servers.
Fundamentally, the problem of SA distribution is similar — a customer’s IKE daemon connects to a single Cloudflare edge server’s IKE daemon, and information about that connection needs to be distributed to every other edge server. So, we upgraded the Cloudflare Tunnel technology to make it more general and are now using it to distribute SAs as part of Anycast IPsec support. Within seconds of an SA being created, it is distributed to every Cloudflare edge server where a streaming protocol applies the configuration to the kernel-space IPsec stack. Cloudflare’s Anycast IPsec benefits from the same reliability and resilience we’ve built in Cloudflare Tunnels and turns our network into one massively scalable, resilient IPsec tunnel to your network.
On-ramp with IPsec, access all of Cloudflare One
We built IPsec as an on-ramp to Cloudflare One on top of our existing global system architecture, putting the principles customers care about first. You care about ease of deployment, so we made it possible for you to connect to your entire virtual network on Cloudflare One with a single IPsec tunnel. You care about performance, so we built technology that connects your IPsec tunnel to every Cloudflare location, eliminating hub-and-spoke performance penalties. You care about enforcing security policies across all your traffic regardless of source, so we integrated IPsec with the entire Cloudflare One suite including Magic Transit, Magic Firewall, Zero Trust, and more.
IPsec is in early access for Cloudflare One customers. If you’re interested in trying it out, contact your account team today!
The collective thoughts of the interwebz
Manage Consent
To provide the best experiences, we use technologies like cookies to store and/or access device information. Consenting to these technologies will allow us to process data such as browsing behavior or unique IDs on this site. Not consenting or withdrawing consent, may adversely affect certain features and functions.
Functional
Always active
The technical storage or access is strictly necessary for the legitimate purpose of enabling the use of a specific service explicitly requested by the subscriber or user, or for the sole purpose of carrying out the transmission of a communication over an electronic communications network.
Preferences
The technical storage or access is necessary for the legitimate purpose of storing preferences that are not requested by the subscriber or user.
Statistics
The technical storage or access that is used exclusively for statistical purposes.The technical storage or access that is used exclusively for anonymous statistical purposes. Without a subpoena, voluntary compliance on the part of your Internet Service Provider, or additional records from a third party, information stored or retrieved for this purpose alone cannot usually be used to identify you.
Marketing
The technical storage or access is required to create user profiles to send advertising, or to track the user on a website or across several websites for similar marketing purposes.