Post Syndicated from João Tomé original https://blog.cloudflare.com/crawlers-click-ai-bots-training/
In 2025, Generative AI is reshaping how people and companies use the Internet. Search engines once drove traffic to content creators through links. Now, AI training crawlers — the engines behind commonly-used LLMs — are consuming vast amounts of web data, while sending far fewer users back. We covered this shift, along with related trends and Cloudflare features (like pay per crawl) in early July. Studies from Pew Research Center (1, 2) and Authoritas already point to AI overviews — Google’s new AI-generated summaries shown at the top of search results — contributing to sharp declines in news website traffic. For a news site, this means lots of bot hits, but far fewer real readers clicking through — which in turn means fewer people clicking on ads or chances to convert to subscriptions.
Cloudflare’s data shows the same pattern. Crawling by search engines and AI services surged in the first half of 2025 — up 24% year-over-year in June — before slowing to just 4% year-over-year growth in July. How is the space evolving? Which crawling purposes are most common, and how is that changing? Spoiler: training-related crawling is leading the way. In this post, we track AI and search bot crawl activity, what purposes dominate, and which platforms contribute the least referral traffic back to creators.
-
Training crawling grows: Training now drives nearly 80% of AI bot activity, up from 72% a year ago.
-
Publisher referrals drop: Google referrals to news sites fell, with March 2025 down ~9% compared to January.
-
AI & search crawling increase: Crawling rose 32% year-over-year in April 2025, before slowing to 4% year-over-year growth in July.
-
AI-only crawler shifts: OpenAI’s GPTBot more than doubled in share of AI crawling traffic (4.7% to 11.7%), Anthropic’s ClaudeBot rose (6% to ~10%), while ByteDance’s Bytespider fell from 14.1% to 2.4%.
-
Crawl-to-refer imbalance (how many pages a bot crawls per page that a user clicks back to): Anthropic increased referrals but still leads with 38,000 crawls per visitor in July (down from 286,000:1 in January). Perplexity decreased referrals in 2025 — with more crawling but fewer referrals at 194 crawls per visitor in July.
Several of the trends in this blog use Cloudflare Radar’s new AI Insights features, explained in more detail in the post: “A deeper look at AI crawlers: breaking down traffic by purpose and industry.”
Referral traffic from search is already shifting, as we noted above and as studies have shown. In our dataset of news-related customers (spanning the Americas, Europe, and Asia), Google’s referrals have been clearly declining since February 2025. This drop is unusual, since overall Internet traffic (and referrals as well) historically has only dipped during July and August — the summer months when the Northern Hemisphere is largely on break from school or work. The sharpest and least seasonal decline came in March. Despite being a 31-day month, March had almost the same referral volume as the shorter, 28-day February.

Looking at longer comparisons: March 2025 referral traffic from Google was 9% lower than January, the same drop seen in June. April was worse, down 15% compared with January.
This drop seems to coincide with some of Google’s changes. AI Overviews launched in the U.S. in May 2024, but in March 2025, Google upgraded AI Overviews with Gemini 2.0, introduced AI Mode in Labs, and expanded Overviews to more European countries. By May 2025, AI Mode rolled out broadly in the U.S. with Gemini 2.5, adding conversational search, Deep Search, and personalized recommendations.
The search-to-news site pipeline seems to be weakening, replaced in part by AI-driven results.
Looking at a daily perspective, we can also spot a clear U.S.-election-related peak in referrals from Google to the cohort of known news sites on November 5–6, 2024.

In June, we talked about search and AI crawler growth, and our picture of the trend is now more complete with more data. To focus only on AI and search crawlers, and to remove the bias of customer growth, we analyzed a fixed set of customers from specific weeks, a method we’ve also used in the Cloudflare Radar Year in Review.
What the data shows: crawling spiked twice: first in November 2024, then again between March and April 2025. April 2025 alone was up 32% compared with May 2024, the first full month where we have comparable data. After that surge, growth stabilized. In June 2025, crawling traffic was still 24% higher year-over-year, but by July the increase was down to just 4%. That shift highlights how quickly crawler activity can accelerate and then cool down.
As the chart below shows, crawling traffic rose sharply in March and April. It remained high but slightly lower in May, before starting to drop in June. The seasonal dip is similar to what we see in overall Internet traffic during the Northern Hemisphere’s summer months (August and September are often the quietest), though in the case of crawlers, this is likely due to reduced overall web activity rather than bots themselves taking a “break.” Historically, activity tends to rise again in November — as it did in 2024 for AI and search bot traffic — when people spend more time online for shopping and seasonal habits (a pattern we’ve seen in past years).

Googlebot is still the anchor, accounting for 39% of all AI and search crawler traffic, but the fastest growth now comes from AI-specific crawlers, though bots related to Amazon and ByteDance (Bytespider) have lost significant ground. GPTBot’s share grew from 4.7% in July 2024 to 11.7% in July 2025. ClaudeBot also increased, from 6% to nearly 10%, while Meta’s crawler jumped from 0.9% to 7.5%. By contrast, Amazonbot dropped from 10.2% to 5.9%, and ByteDance’s Bytespider dropped from 14.1% to just 2.4%.
The table below shows how market shares have shifted between July 2024 and July 2025:
|
Bot name |
% share July 2024 |
% share July 2025 |
Δ percentage-point change |
|
|
1 |
Googlebot |
37.5 |
39 |
1.5 |
|
2 |
GPTBot |
4.7 |
11.7 |
7 |
|
3 |
ClaudeBot |
6 |
9.9 |
3.9 |
|
4 |
Bingbot |
8.7 |
9.3 |
0.6 |
|
5 |
Meta-ExternalAgent |
0.9 |
7.5 |
6.5 |
|
6 |
Amazonbot |
10.2 |
5.9 |
-4.3 |
|
7 |
Googlebot-Image |
4.1 |
3.3 |
-0.8 |
|
8 |
Yandex |
5 |
2.9 |
-2.1 |
|
9 |
GoogleOther |
4.6 |
2.7 |
-1.8 |
|
10 |
Bytespider |
14.1 |
2.4 |
-11.6 |
|
11 |
Applebot |
1.8 |
1.5 |
-0.3 |
|
12 |
ChatGPT-User |
0.1 |
0.9 |
0.9 |
|
13 |
OAI-SearchBot |
0 |
0.9 |
0.9 |
|
14 |
Baiduspider |
0.5 |
0.5 |
0 |
|
15 |
Googlebot-Mobile |
0.2 |
0.4 |
0.2 |
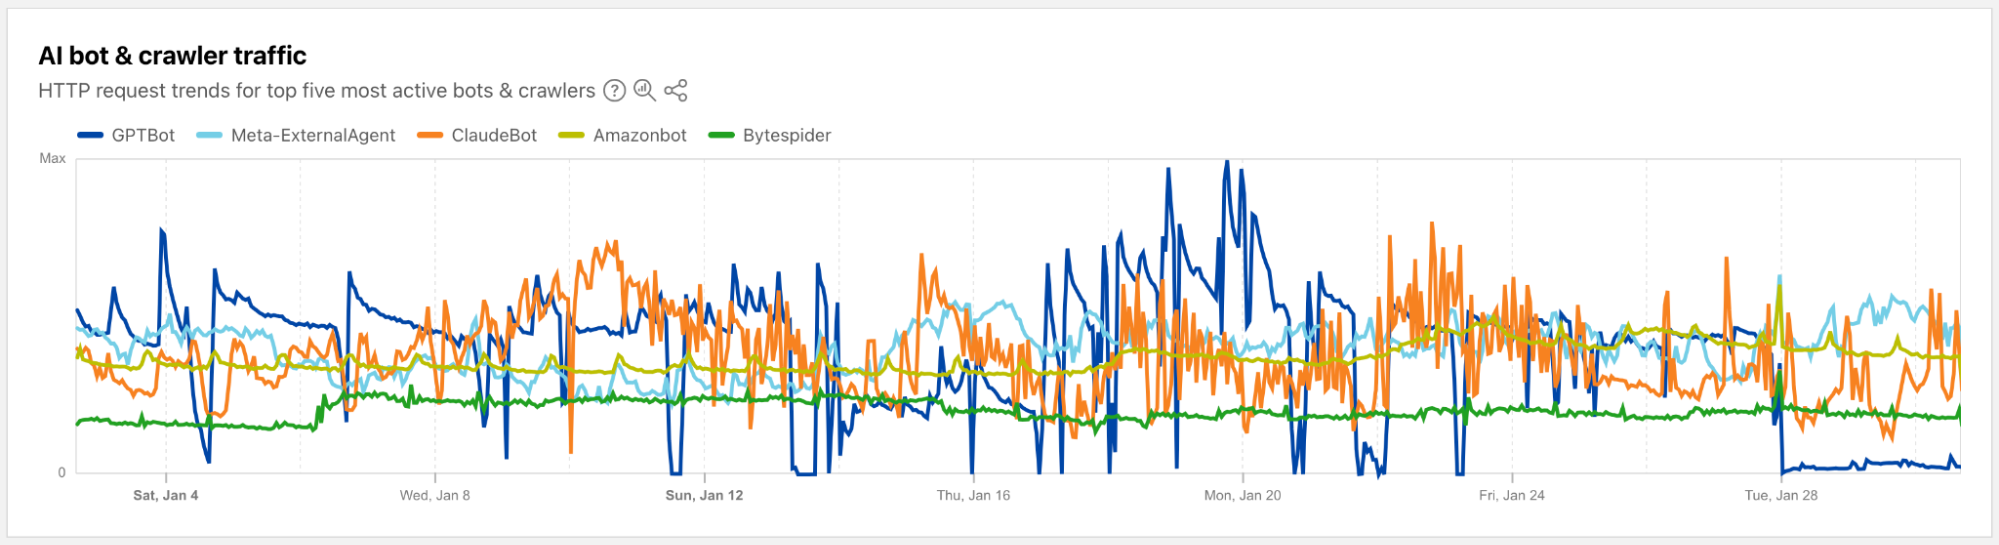
Looking only at AI bot traffic (as tracked on our Radar AI page), the trend is clear. Since January 2025, GPTBot has steadily increased its crawling volume, driven mainly by training-related activity. ClaudeBot crawling accelerated in June, while Amazonbot and Bytespider activity slowed.
The chart below shows how GPTBot surged over the past 12 months, overtaking Amazonbot and Bytespider, which both fell sharply:

A comparison between July 2024 and July 2025 makes the shift even more obvious. GPTBot gained 16 percentage points, Meta’s crawler rose by more than 15, and ClaudeBot grew by 8. On the shrinking side, Amazonbot dropped 12 percentage points and Bytespider dropped over 31 percentage points.
|
AI-only bots |
July 2024 % |
July 2025 % |
Δ percentage-point change |
|
|
1 |
GPTBot |
11.9 |
28.1 |
16.1 |
|
2 |
ClaudeBot |
15 |
23.3 |
8.3 |
|
3 |
Meta-ExternalAgent |
2.4 |
17.7 |
15.3 |
|
4 |
Amazonbot |
26.4 |
14.1 |
-12.3 |
|
5 |
Bytespider |
37.3 |
5.8 |
-31.5 |
|
6 |
Applebot |
4.9 |
3.7 |
-1.2 |
|
7 |
ChatGPT-User |
0.2 |
2.4 |
2.2 |
|
8 |
OAI-SearchBot |
0 |
2.2 |
2.2 |
|
9 |
TikTokSpider |
0 |
0.7 |
0.7 |
|
10 |
imgproxy |
0 |
0.7 |
0.7 |
|
11 |
PerplexityBot |
0 |
0.4 |
0.4 |
|
12 |
Google-CloudVertexBot |
0 |
0.3 |
0.3 |
|
13 |
AI2Bot |
0 |
0.2 |
0.2 |
|
14 |
Timpibot |
0.6 |
0.1 |
-0.5 |
|
15 |
CCBot |
0.1 |
0.1 |
0 |

We covered the functionality of these bots in our June blog post.
Training is the clear leader. (We classify purpose based on operator disclosures and industry sources, a method we explained in this AI Week blog.) Over the past 12 months, 80% of AI crawling was for training, compared with 18% for search and just 2% for user actions. In the last six months, the share for training rose further to 82%, while search dropped to 15% and user actions increased slightly to 3%.
The chart below shows how training-related crawling steadily grew over the past year, far outpacing other purposes:

The year-over-year comparison reinforces this trend. In July 2024, training accounted for 72% of AI crawling. By July 2025, it had risen to 79%. Over the same period, search fell from 26% to 17%, while user actions grew modestly from 2% to 3.2%.

The crawl-to-refer ratio measures how many pages a platform crawls compared with how often it drives users to a website. In practice, a high ratio means heavy crawling but little referral traffic. For example, for every visitor Anthropic refers back to a website, its crawlers have already visited tens of thousands of pages.
Why does this metric matter? It highlights the imbalance between how much content AI systems consume and how little traffic they return. For publishers, it can feel like giving away the raw material for free. With that in mind, here’s how different platforms compare from January to July 2025.
Anthropic remains the most crawl-heavy platform. Even after an 87% decline this year, it still crawled 38,000 pages for every referred page visit in July 2025 — the highest imbalance among major AI players. Referrals may be improving, though, after Anthropic added web search to Claude in March 2025 (initially for U.S. paid users) and expanded it globally by May to all users, including the free tier. The feature introduced direct citations with clickable URLs, creating new referral pathways.
The full dataset is below, showing January–July 2025 ratios by platform ordered by the highest ratio average:
(Note: a rising ratio means more bot crawling per human click sent back, while a falling ratio means less bot crawling per human click sent back)
Crawl-to-refer ratio (from Cloudflare Radar’s data)
|
Service |
Jan |
Feb |
Mar |
Apr |
May |
Jun |
Jul |
Average |
% Change Jan-Jul |
|
Anthropic |
286,930.1 |
271,748.2 |
121,612.7 |
130,330.2 |
114,313 |
71,282.8 |
38,065.7 |
147,754.7 |
-86.7% |
|
OpenAI |
1,217.4 |
1,774.5 |
2,217 |
1200 |
995.6 |
1,655.9 |
1,091.4 |
1,437.8 |
-10.4% |
|
Perplexity |
54.6 |
55.3 |
201.3 |
300.9 |
199.1 |
200.6 |
194.8 |
172.4 |
256.7% |
|
Microsoft |
38.5 |
44.2 |
42.3 |
43.3 |
45.1 |
42 |
40.7 |
42.3 |
5.7% |
|
Yandex |
15.5 |
13.1 |
13.1 |
15.7 |
14.7 |
15.9 |
21.4 |
15.6 |
38.3% |
|
|
3.8 |
6.3 |
14.6 |
22.5 |
16.7 |
13.1 |
5.4 |
11.8 |
43% |
|
ByteDance |
18 |
16.4 |
3.5 |
2.3 |
1.6 |
1.6 |
0.9 |
6.3 |
-95% |
|
Baidu |
0.6 |
0.7 |
0.8 |
1.5 |
1.2 |
1 |
0.9 |
1 |
44.5% |
|
DuckDuckGo |
0.1 |
0.2 |
0.2 |
0.2 |
0.3 |
0.3 |
0.3 |
0.2 |
116.3% |
Looking at the changes from January to July 2025:
-
Anthropic recorded the steepest decrease in bot to human traffic, down 86.7%. From 286,930 bots per human in January, to 38,065 bots per human in July, the change shows a dramatic increase in referrals. Despite the change, it remains by far the most crawl-heavy platform, with tens of thousands of pages still crawled for every referral.
-
Perplexity moved in the opposite direction, with bot crawling increasing +256.7% relative to human visitors; climbing from 54 bots per human in January to 195 bots per human in July. While the ratio is still far below Anthropic, the increase shows it is crawling more heavily, relative to the traffic it refers, than it did earlier.
-
OpenAI ratio dropped slightly, from 1,217 bots per human in January to 1,091 in July (-10%). The shift is smaller than Anthropic’s but suggests OpenAI is sending a bit more referral traffic relative to its crawling.
-
Microsoft stayed steady, with its ratio moving only slightly, from 38.5 bots per human in January to 40.7 in July (+6%). This consistency suggests stable behavior from Bing-linked services.
-
Yandex increased from 15.5 bots per human in January to 21.4 in July (+38%). The overall ratio is far smaller than Anthropic’s or Perplexity’s, but it shows Yandex is crawling more heavily relative to the traffic it sends back.
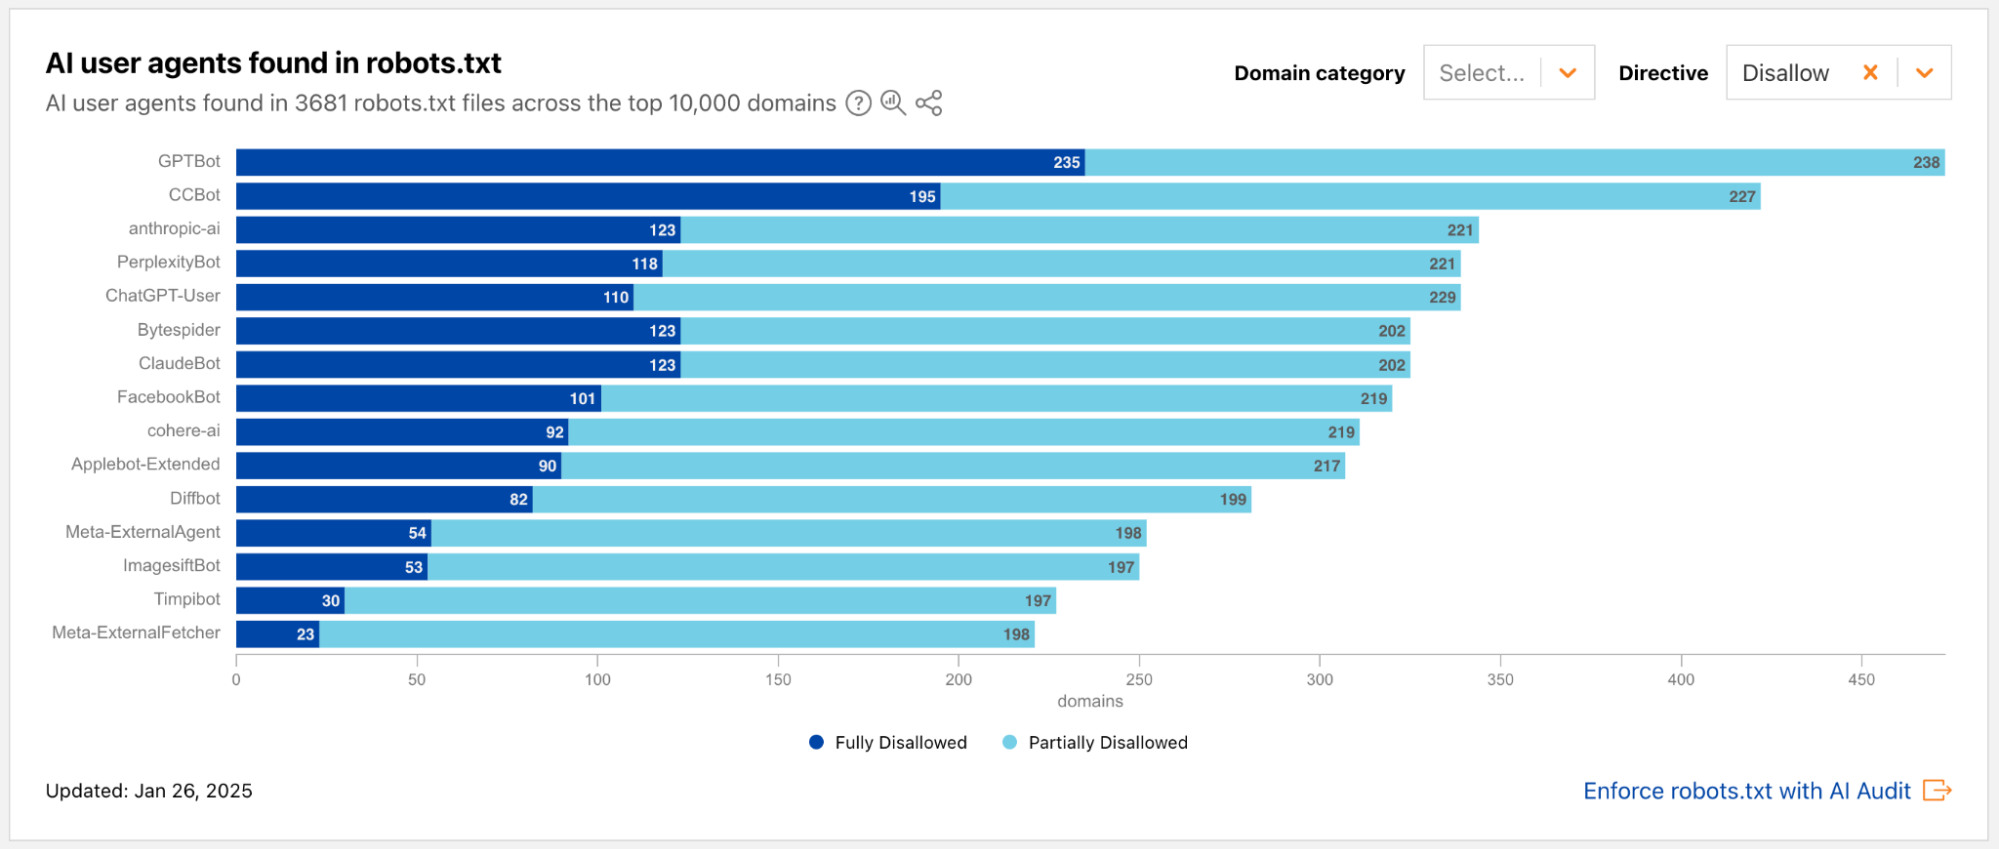
Alongside measuring crawling volumes and referral traffic (now also visible on the AI Insights page of Cloudflare Radar), it’s worth looking at whether AI operators follow good practices when deploying their bots. Cloudflare data shows that most leading AI crawlers are on our verified bots list, meaning their IP addresses match published ranges and they respect robots.txt. But adoption of newer standards like WebBotAuth — which uses cryptographic signatures in HTTP messages to confirm a request comes from a specific bot, and is especially relevant today — is still missing.
Google, Meta, and OpenAI run distinct bots for different purposes, while Anthropic lags in verification. That makes it easier for bad actors to spoof its crawler and ignore robots.txt, since without verification, it’s hard to distinguish real from fake traffic — leaving its compliance effectively unclear. (A longer list of AI bots is available here).

If training-related crawling continues to dominate while referrals stay flat, creators face a paradox: feeding AI systems without gaining traffic in return. Many want their content to appear in chatbot answers, but without monetization or cooperation, the incentive to produce quality work declines.
The Web now stands at a fork in the road. Either a new balance emerges — one where the new AI era helps sustain publishers and creators — or AI turns the open web into a one-way training set, extracting value with little flowing back.
You can learn more about some of these data trends on Cloudflare Radar’s updated AI Insights page.