On August 21, 2025, an influx of traffic directed toward clients hosted in the Amazon Web Services (AWS) us-east-1 facility caused severe congestion on links between Cloudflare and AWS us-east-1. This impacted many users who were connecting to or receiving connections from Cloudflare via servers in AWS us-east-1 in the form of high latency, packet loss, and failures to origins.
Customers with origins in AWS us-east-1 began experiencing impact at 16:27 UTC. The impact was substantially reduced by 19:38 UTC, with intermittent latency increases continuing until 20:18 UTC.
This was a regional problem between Cloudflare and AWS us-east-1, and global Cloudflare services were not affected. The degradation in performance was limited to traffic between Cloudflare and AWS us-east-1. The incident was a result of a surge of traffic from a single customer that overloaded Cloudflare’s links with AWS us-east-1. It was a network congestion event, not an attack or a BGP hijack.
We’re very sorry for this incident. In this post, we explain what the failure was, why it occurred, and what we’re doing to make sure this doesn’t happen again.
Background
Cloudflare helps anyone to build, connect, protect, and accelerate their websites on the Internet. Most customers host their websites on origin servers that Cloudflare does not operate. To make their sites fast and secure, they put Cloudflare in front as a reverse proxy.
When a visitor requests a page, Cloudflare will first inspect the request. If the content is already cached on Cloudflare’s global network, or if the customer has configured Cloudflare to serve the content directly, Cloudflare will respond immediately, delivering the content without contacting the origin. If the content cannot be served from cache, we fetch it from the origin, serve it to the visitor, and cache it along the way (if it is eligible). The next time someone requests that same content, we can serve it directly from cache instead of making another round trip to the origin server.
When Cloudflare responds to a request with the cached content, it will send the response traffic over internal Data Center Interconnect (DCI) links through a series of network equipment and eventually reach the routers that represent our network edge (our “edge routers”) as shown below:
Our internal network capacity is designed to be larger than the available traffic demand in a location to account for failures of redundant links, failover from other locations, traffic engineering within or between networks, or even traffic surges from users. The majority of Cloudflare’s network links were operating normally, but some edge router links to an AWS peering switch had insufficient capacity to handle this particular surge.
What happened
At approximately 16:27 UTC on August, 21, 2025, a customer started sending many requests from AWS us-east-1 to Cloudflare for objects in Cloudflare’s cache. These requests generated a volume of response traffic that saturated all available direct peering connections between Cloudflare and AWS. This initial saturation became worse when AWS, in an effort to alleviate the congestion, withdrew some BGP advertisements to Cloudflare over some of the congested links. This action rerouted traffic to an additional set of peering links connected to Cloudflare via an offsite network interconnection switch, which subsequently also became saturated, leading to significant performance degradation. The impact became worse for two reasons: One of the direct peering links was operating at half-capacity due to a pre-existing failure, and the Data Center Interconnect (DCI) that connected Cloudflare’s edge routers to the offsite switch was due for a capacity upgrade. The diagram below illustrates this using approximate capacity estimates:
In response, our incident team immediately engaged with our partners at AWS to address the issue. Through close collaboration, we successfully alleviated the congestion and fully restored services for all affected customers.
Timeline
Time
Description
2025-08-21 16:27 UTC
Traffic surge for single customer begins, doubling total traffic from Cloudflare to AWS
IMPACT START
2025-08-21 16:37 UTC
AWS begins withdrawing prefixes from Cloudflare on congested PNI (Private Network Interconnect) BGP sessions
2025-08-21 16:44 UTC
Network team is alerted to internal congestion in Ashburn (IAD)
2025-08-21 16:45 UTC
Network team is evaluating options for response, but AWS prefixes are unavailable on paths that are not congested due to their withdrawals
2025-08-21 17:22 UTC
AWS BGP prefixes withdrawals result in a higher amount of dropped traffic
IMPACT INCREASE
2025-08-21 17:45 UTC
Incident is raised for customer impact in Ashburn (IAD)
2025-08-21 19:05 UTC
Rate limiting of single customer causing traffic surge decreases congestion
2025-08-21 19:27 UTC
Network team additional traffic engineering actions fully resolve congestion
IMPACT DECREASE
2025-08-21 19:45 UTC
AWS begins reverting BGP withdrawals as requested by Cloudflare
2025-08-21 20:07 UTC
AWS finishes normalizing BGP prefix announcements to Cloudflare over IAD PNIs
2025-08-21 20:18 UTC
IMPACT END
When impact started, we saw a significant amount of traffic related to one customer, resulting in congestion:
This was handled by manual traffic actions both from Cloudflare and AWS. You can see some of the attempts by AWS to alleviate the congestion by looking at the number of IP prefixes AWS is advertising to Cloudflare during the duration of the outage. The lines in different colors correspond to the number of prefixes advertised per BGP session with us. The dips indicate AWS attempting to mitigate by withdrawing prefixes from the BGP sessions in an attempt to steer traffic elsewhere:
The congestion in the network caused network queues on the routers to grow significantly and begin dropping packets. Our edge routers were dropping high priority packets consistently during the outage, as seen in the chart below, which shows the queue drops for our Ashburn routers during the impact period:
The primary impact to customers as a result of this congestion would have been latency, loss (timeouts), or low throughput. We have a set of latency Service Level Objectives defined which imitate customer requests back to their origins measuring availability and latency. We can see that during the impact period, the percentage of requests whose latency fails to meet the target SLO threshold dips below an acceptable level in lock step with the packet drops during the outage:
After the congestion was alleviated, there was a brief period where both AWS and Cloudflare were attempting to normalize the prefix advertisements that had been adjusted to attempt to mitigate the congestion. That caused a long tail of latency that may have impacted some customers, which is why you see the packet drops resolve before the customer latencies are restored.
Remediations and follow-up steps
This event has underscored the need for enhanced safeguards to ensure that one customer’s usage patterns cannot negatively affect the broader ecosystem. Our key takeaways are the necessity of architecting for better customer isolation to prevent any single entity from monopolizing shared resources and impacting the stability of the platform for others, and augmenting our network infrastructure to have sufficient capacity to meet demand.
To prevent a recurrence of this issue, we are implementing a multi-phased mitigation strategy. In the short and medium term:
We are developing a mechanism to selectively deprioritize a customer’s traffic if it begins to congest the network to a degree that impacts others.
We are expediting the Data Center Interconnect (DCI) upgrades which will provide network capacity significantly above what it is today.
We are working with AWS to make sure their and our BGP traffic engineering actions do not conflict with one another in the future.
Looking further ahead, our long-term solution involves building a new, enhanced traffic management system. This system will allot network resources on a per-customer basis, creating a budget that, once exceeded, will prevent a customer’s traffic from degrading the service for anyone else on the platform. This system will also allow us to automate many of the manual actions that were taken to attempt to remediate the congestion seen during this incident.
Conclusion
Customers accessing AWS us-east-1 through Cloudflare experienced an outage due to insufficient network congestion management during an unusual high-traffic event.
We are sorry for the disruption this incident caused for our customers. We are actively making these improvements to ensure improved stability moving forward and to prevent this problem from happening again.
We constantly measure our own network’s performance against other networks, look for ways to improve our performance compared to them, and share the results of our efforts. Since June 2021, we’ve been sharing benchmarking results we’ve run against other networks to see how we compare.
In this post we are going to share the most recent updates since our last post in September, and talk about how we are getting as fast as we are.
How we stack up
Since June 2021, we’ve been taking a close look at the most reported eyeball-facing ISPs and taking actions for the specific networks where we have some room for improvement. Cloudflare was already the fastest provider for TCP Connection time at the 95th percentile for 44% of the networks around the world (we define a network as country and AS number pair). We chose this metric to show how our network helps make your websites faster by getting you to where your customers are. Taking a look at the numbers, in July 2022, Cloudflare was ranked #1 in 33% of the networks and was within 2 ms (95th percentile TCP Connection Time) or 5% of the #1 provider for 8% of the networks that we measured. For reference, our closest competitor was the fastest for 20% of networks.
As of August 30, 2023, Cloudflare was the fastest provider for 44% of networks — and was within 2 ms (95th percentile TCP Connection Time) or 5% of the fastest provider for 10% of the networks that we measured—whereas our closest competitor (Amazon Cloudfront) was the fastest for 19% of networks. As of February 15, 2024, we are still #1 in 44% of networks for 95th percentile TCP Connection Time. Let’s dig into the data.
Lightning fast
Looking at 95th percentile TCP connect times from November 18, 2023, to February 15, 2024, Cloudflare is the #1 provider in 44% of the top 1000 networks:
Our P95 TCP Connection time has been trending down since November, and we are consistently 50ms faster at P95 than our closest competitor (Amazon CloudFront):
Connect time comparisons between providers at 50th and 95th percentile
P50 Connect (ms)
P95 Connect (ms)
Cloudflare
130
579
Amazon
145
637
Google
190
772
Akamai
195
774
Fastly
189
734
These graphs show that day over day, Cloudflare was consistently the fastest provider. They also show the gaps between Cloudflare and the other competitors. When you look at the 95th percentile, Cloudflare is almost 200ms faster than Akamai across the world for connect times. This shows that our network reaches more places and allows users to get their content faster than Akamai on a consistent basis.
When we aggregate this data over the whole time period, Cloudflare is the fastest in the most networks. For that whole time span of November 18, 2023, to February 15, 2024, Cloudflare was number 1 in 73% of networks for mean TCP connection time:
Looking at a map plotting by 95th percentile TCP connect time, Cloudflare is the fastest in the most countries, and you can see this by the fact that most of the map is orange:
For comparison, here’s what the map looked like in September 2023:
These numbers show that we’re reducing the overall TCP connection time around the world while simultaneously staying ahead of the competition. Let’s talk about how we get these numbers and what we’re doing to make you even faster.
Measuring What Matters
As a quick reminder, here’s how we get the data for our measurements: when users receive a Cloudflare-branded error page, we use Real User Measurements (RUM) and fetch a small file from Cloudflare, Akamai, Amazon CloudFront, Fastly, and Google Cloud CDN. Browsers around the world report the performance of those providers from the perspective of the end-user network they are on. The goal is to provide an accurate picture of where different providers are faster, and more importantly, where Cloudflare can improve. You can read more about the methodology in the original Speed Week blog post.
Using the RUM data, we measure various performance metrics, such as TCP Connection Time, Time to First Byte (TTFB), and Time to Last Byte (TTLB), for ourselves and other providers.
If we only collect data from a browser when we return an error page, you could see how variable the data can get: if one network or website is having a problem in a certain country, that country could overreport, meaning those networks would be more highly weighted in the calculations because more users reported from that network during a given time period.
For example, if a lot of users connecting over a small Brazilian network were generating reports because their websites were throwing errors more frequently, that could make this small network look a lot bigger to us. This small network in Brazil could have as many reports as Claro, a major network in the region, despite them being totally different when you look at the number of subscribers. If we only look at the networks that report to us the most, it could cause smaller networks with fewer subscribers to be treated as more important because of point-in-time error conditions.
This phenomenon could cause the networks we look at to change week over week. Going back to the Brazil example, if the website that was throwing a bunch of errors fixed their problem, and we no longer saw measurements from that network, they may not show up as a “most reported network” depending on when we look at the data. This means that the networks we look at to consider where we are fastest are dependent on which networks are sending us the most reports at any given time, which is not optimal if we’re trying to get faster in these networks. We need to be able to get a consistent signal on these networks to understand where we’re faster and where we’re not.
We’ve addressed this issue by creating a fixed list of the networks we want to look at. We did this by looking at public stats on user population by network and then comparing that with our sample sizes by network until we identified the 1000 networks we want to examine. This ensures that day over day, the networks we look at are the same.
Now let’s talk about what makes us faster in more places than other networks: HTTP/3.
Blazing fast speeds with HTTP/3
One reason why Cloudflare is the fastest in the most networks is because we’ve been leading the charge with adoption and usage of HTTP/3 on our platform. HTTP/3 allows for faster connectivity behavior which means we can get connections established faster and get data flowing. HTTP/3 is currently used by around 31% of Internet traffic:
To show that HTTP/3 improves connection times, we looked at two different Cloudflare endpoints that these tests ran against: one with HTTP/3 enabled and one with HTTP/3 disabled. The performance difference between the two is night and day. Here’s a table showing the performance difference for 95th percentile connect time between Cloudflare zones when one zone has HTTP/3 enabled:
P50 connect (ms)
P95 connect (ms)
Cloudflare HTTP/3
130
579
Cloudflare non-HTTP/3
174
695
At P95, Cloudflare is 116 ms faster for connection times when HTTP/3 is enabled. This performance gain helps us be the fastest in the most networks.
But why does HTTP/3 help make us faster? HTTP/3 allows for faster connection setup times, which lets us take greater advantage of our global network footprint to be the fastest in the most networks. HTTP/3 is built on top of the QUIC protocol, which multiplexes UDP packets to allow for parallel streams to be sent at the same time. This means that TLS encryption can happen in parallel with connection establishment, shortening the amount of time that is needed to set up a secure connection. Paired with Cloudflare’s network that is incredibly close to end-users, this makes for significant latency reductions on user Connect times. All major browsers have HTTP/3 enabled by default, so you too can realize these latency improvements by enabling HTTP/3 on your website today.
What’s next
We’re sharing our updates on our journey to become #1 everywhere so that you can see what goes into running the fastest network in the world. From here, our plan is the same as always: identify where we’re slower, fix it, and then tell you how we’ve gotten faster.
We constantly measure our own network’s performance against other networks, look for ways to improve our performance compared to them, and share the results of our efforts. Since June 2021, we’ve been sharing benchmarking results we’ve run against other networks to see how we compare.
In this post we are going to share the most recent updates since our last post in June, and tell you about our tools and processes that we use to monitor and improve our network performance.
How we stack up
Since June 2021, we’ve been taking a close look at every single network and taking actions for the specific networks where we have some room for improvement. Cloudflare was already the fastest provider for most of the networks around the world (we define a network as country and AS number pair). Taking a closer look at the numbers; in July 2022, Cloudflare was ranked #1 in 33% of the networks and was within 2 ms (95th percentile TCP Connection Time) or 5% of the #1 provider for 8% of the networks that we measured. For reference, our closest competitor on that front was the fastest for 20% of networks.
As of August 30, 2023, Cloudflare is the fastest provider for 44% of networks—and was within 2 ms (95th percentile TCP Connection Time) or 5% of the fastest provider for 10% of the networks that we measured—whereas our closest competitor is now the fastest for 19% of networks.
Below is the change in percentage of networks in which each provider is the fastest plotted over time.
Cloudflare is maintaining our steady growth in the percentage of networks where we’re the fastest. Despite the slight tick down the past couple of months, the trendline is still positive and with a higher rate of increase than other networks.
Now that we’ve reviewed how we stack up compared to other networks, let’s dig a little more into the other metrics we use to make us the fastest.
Our tooling
To provide insight into network performance, we use Real User Measurements (RUM) and fetch a small file from Cloudflare, Akamai, Amazon CloudFront, Fastly and Google Cloud CDN. Browsers around the world report the performance of those providers from the perspective of the end-user network they are on. The goal is to provide an accurate picture of where different providers are faster, and more importantly, where Cloudflare can improve. You can read more about the methodology in the original Speed Week blog post here.
Using the RUM data, we are able to measure various performance metrics, such as TCP Connection Time, Time to First Byte (TTFB), Time to Last Byte (TTLB), for ourselves and other networks.
Let’s take a look at some of the metrics we monitor and what’s changed since our last blog in June.
The first metric we closely monitor is the percent of networks that we are ranked #1 in terms of TCP Connection Time. That's a key performance indicator that we evaluate ourselves against. This first line of the table shows that Cloudflare was ranked #1 in 45% of networks in June 2023 and 44% in August 2023. Here’s the full picture of how we looked in June versus how we look today.
Cloudflare’s rank by TCP connection time
% of networks in June 2023
% of networks in August 2023
1
45
44
2
26
24
3
16
16
4
9
10
5
4
6
Overall, these metrics align with what we saw above: Cloudflare is still the fastest provider in the most last mile networks, and while there has been slight changes in the month-to-month fluctuations, the overall trend shows us as being the fastest.
The second metric we monitor is our overall performance in each country. This gives us visibility into the countries or regions that we need to pay closer attention to and take action towards improving our performance. Those actions will be listed later. Orange indicates the countries that Cloudflare is the fastest provider based on the TCP Connection Time. Here’s how we look as of September 2023:
For comparison, this is what that map looks like from June 2023:
We’ve become faster in Iran and Paraguay, and in the few cases where we are no longer number 1, we are within 2ms of the fastest provider. In Brazil and Norway for example, we trail Fastly by only 1ms. In various countries in Africa, Amazon CloudFront pulled ahead but only by 2ms. We aim to fix that in the coming weeks and months and return to the #1 spot there also.
The third set of metrics we use are TCP Connection Time and TTLB. The number of networks where we are #1 in terms of 95th percentile TCP Connection Time is one of our key performance indicators. We actively monitor and work on improving that metric so that we are #1 in the most metrics for 95th percentile TCP Connection Time. For September 2023, we are still #1 in the most networks for TCP Connection Time, more than double the next best provider.
Provider
# of networks where the provider is fastest for 95th percentile TCP connection time
Cloudflare
826
Google
392
Fastly
348
Cloudfront
337
Akamai
52
The way we achieve these great results is by having our engineering teams constantly investigate the underlying reasons for degraded performance if there are any, and we track open work items until they are resolved.
What’s next
We’re sharing our updates on our journey to become #1 everywhere so that you can see what goes into running the fastest network in the world. From here, our plan is the same as always: identify where we’re slower, fix it, and then tell you how we’ve gotten faster.
Picture this: you’re at an airport, and you’re going through an airport security checkpoint. There are a bunch of agents who are scanning your boarding pass and your passport and sending you through to your gate. All of a sudden, some of the agents go on break. Maybe there’s a leak in the ceiling above the checkpoint. Or perhaps a bunch of flights are leaving at 6pm, and a number of passengers turn up at once. Either way, this imbalance between localized supply and demand can cause huge lines and unhappy travelers — who just want to get through the line to get on their flight. How do airports handle this?
Some airports may not do anything and just let you suffer in a longer line. Some airports may offer fast-lanes through the checkpoints for a fee. But most airports will tell you to go to another security checkpoint a little farther away to ensure that you can get through to your gate as fast as possible. They may even have signs up telling you how long each line is, so you can make an easier decision when trying to get through.
At Cloudflare, we have the same problem. We are located in 300 cities around the world that are built to receive end-user traffic for all of our product suites. And in an ideal world, we always have enough computers and bandwidth to handle everyone at their closest possible location. But the world is not always ideal; sometimes we take a data center offline for maintenance, or a connection to a data center goes down, or some equipment fails, and so on. When that happens, we may not have enough attendants to serve every person going through security in every location. It’s not because we haven’t built enough kiosks, but something has happened in our data center that prevents us from serving everyone.
So, we built Traffic Manager: a tool that balances supply and demand across our entire global network. This blog is about Traffic Manager: how it came to be, how we built it, and what it does now.
The world before Traffic Manager
The job now done by Traffic Manager used to be a manual process carried out by network engineers: our network would operate as normal until something happened that caused user traffic to be impacted at a particular data center.
When such events happened, user requests would start to fail with 499 or 500 errors because there weren’t enough machines to handle the request load of our users. This would trigger a page to our network engineers, who would then remove some Anycast routes for that data center. The end result: by no longer advertising those prefixes in the impacted data center, user traffic would divert to a different data center. This is how Anycast fundamentally works: user traffic is drawn to the closest data center advertising the prefix the user is trying to connect to, as determined by Border Gateway Protocol. For a primer on what Anycast is, check out this reference article.
Depending on how bad the problem was, engineers would remove some or even all the routes in a data center. When the data center was again able to absorb all the traffic, the engineers would put the routes back and the traffic would return naturally to the data center.
As you might guess, this was a challenging task for our network engineers to do every single time any piece of hardware on our network had an issue. It didn’t scale.
Never send a human to do a machine’s job
But doing it manually wasn’t just a burden on our Network Operations team. It also resulted in a sub-par experience for our customers; our engineers would need to take time to diagnose and re-route traffic. To solve both these problems, we wanted to build a service that would immediately and automatically detect if users were unable to reach a Cloudflare data center, and withdraw routes from the data center until users were no longer seeing issues. Once the service received notifications that the impacted data center could absorb the traffic, it could put the routes back and reconnect that data center. This service is called Traffic Manager, because its job (as you might guess) is to manage traffic coming into the Cloudflare network.
Accounting for second order consequences
When a network engineer removes a route from a router, they can make the best guess at where the user requests will move to, and try to ensure that the failover data center has enough resources to handle the requests — if it doesn’t, they can adjust the routes there accordingly prior to removing the route in the initial data center. To be able to automate this process, we needed to move from a world of intuition to a world of data — accurately predicting where traffic would go when a route was removed, and feeding this information to Traffic Manager, so it could ensure it doesn’t make the situation worse.
Meet Traffic Predictor
Although we can adjust which data centers advertise a route, we are unable to influence what proportion of traffic each data center receives. Each time we add a new data center, or a new peering session, the distribution of traffic changes, and as we are in over 300 cities and 12,500 peering sessions, it has become quite difficult for a human to keep track of, or predict the way traffic will move around our network. Traffic manager needed a buddy: Traffic Predictor.
In order to do its job, Traffic Predictor carries out an ongoing series of real world tests to see where traffic actually moves. Traffic Predictor relies on a testing system that simulates removing a data center from service and measuring where traffic would go if that data center wasn’t serving traffic. To help understand how this system works, let’s simulate the removal of a subset of a data center in Christchurch, New Zealand:
First, Traffic Predictor gets a list of all the IP addresses that normally connect to Christchurch. Traffic Predictor will send a ping request to hundreds of thousands of IPs that have recently made a request there.
Traffic Predictor records if the IP responds, and whether the response returns to Christchurch using a special Anycast IP range specifically configured for Traffic Predictor.
Once Traffic Predictor has a list of IPs that respond to Christchurch, it removes that route containing that special range from Christchurch, waits a few minutes for the Internet routing table to be updated, and runs the test again.
Instead of being routed to Christchurch, the responses are instead going to data centers around Christchurch. Traffic Predictor then uses the knowledge of responses for each data center, and records the results as the failover for Christchurch.
This allows us to simulate Christchurch going offline without actually taking Christchurch offline!
But Traffic Predictor doesn’t just do this for any one data center. To add additional layers of resiliency, Traffic Predictor even calculates a second layer of indirection: for each data center failure scenario, Traffic Predictor also calculates failure scenarios and creates policies for when surrounding data centers fail.
Using our example from before, when Traffic Predictor tests Christchurch, it will run a series of tests that remove several surrounding data centers from service including Christchurch to calculate different failure scenarios. This ensures that even if something catastrophic happens which impacts multiple data centers in a region, we still have the ability to serve user traffic. If you think this data model is complicated, you’re right: it takes several days to calculate all of these failure paths and policies.
Here’s what those failure paths and failover scenarios look like for all of our data centers around the world when they’re visualized:
This can be a bit complicated for humans to parse, so let’s dig into that above scenario for Christchurch, New Zealand to make this a bit more clear. When we take a look at failover paths specifically for Christchurch, we see they look like this:
In this scenario we predict that 99.8% of Christchurch’s traffic would shift to Auckland, which is able to absorb all Christchurch traffic in the event of a catastrophic outage.
Traffic Predictor allows us to not only see where traffic will move to if something should happen, but it allows us to preconfigure Traffic Manager policies to move requests out of failover data centers to prevent a thundering herd scenario: where sudden influx of requests can cause failures in a second data center if the first one has issues. With Traffic Predictor, Traffic Manager doesn’t just move traffic out of one data center when that one fails, but it also proactively moves traffic out of other data centers to ensure a seamless continuation of service.
From a sledgehammer to a scalpel
With Traffic Predictor, Traffic Manager can dynamically advertise and withdraw prefixes while ensuring that every datacenter can handle all the traffic. But withdrawing prefixes as a means of traffic management can be a bit heavy-handed at times. One of the reasons for this is that the only way we had to add or remove traffic to a data center was through advertising routes from our Internet-facing routers. Each one of our routes has thousands of IP addresses, so removing only one still represents a large portion of traffic.
Specifically, Internet applications will advertise prefixes to the Internet from a /24 subnet at an absolute minimum, but many will advertise prefixes larger than that. This is generally done to prevent things like route leaks or route hijacks: many providers will actually filter out routes that are more specific than a /24 (for more information on that, check out this blog here). If we assume that Cloudflare maps protected properties to IP addresses at a 1:1 ratio, then each /24 subnet would be able to service 256 customers, which is the number of IP addresses in a /24 subnet. If every IP address sent one request per second, we’d have to move 4 /24 subnets out of a data center if we needed to move 1,000 requests per second (RPS).
But in reality, Cloudflare maps a single IP address to hundreds of thousands of protected properties. So for Cloudflare, a /24 might take 3,000 requests per second, but if we needed to move 1,000 RPS out, we would have no choice but to move a single /24 out. And that’s just assuming we advertise at a /24 level. If we used /20s to advertise, the amount we can withdraw gets less granular: at a 1:1 website to IP address mapping, that’s 4,096 requests per second for each prefix, and even more if the website to IP address mapping is many to one.
While withdrawing prefix advertisements improved the customer experience for those users who would have seen a 499 or 500 error — there may have been a significant portion of users who wouldn’t have been impacted by an issue who still were moved away from the data center they should have gone to, probably slowing them down, even if only a little bit. This concept of moving more traffic out than is necessary is called “stranding capacity”: the data center is theoretically able to service more users in a region but cannot because of how Traffic Manager was built.
We wanted to improve Traffic Manager so that it only moved the absolute minimum of users out of a data center that was seeing a problem and not strand any more capacity. To do so, we needed to shift percentages of prefixes, so we could be extra fine-grained and only move the things that absolutely need to be moved. To solve this, we built an extension of our Layer 4 load balancer Unimog, which we call Plurimog.
A quick refresher on Unimog and layer 4 load balancing: every single one of our machines contains a service that determines whether that machine can take a user request. If the machine can take a user request then it sends the request to our HTTP stack which processes the request before returning it to the user. If the machine can’t take the request, the machine sends the request to another machine in the data center that can. The machines can do this because they are constantly talking to each other to understand whether they can serve requests for users.
Plurimog does the same thing, but instead of talking between machines, Plurimog talks in between data centers and points of presence. If a request goes into Philadelphia and Philadelphia is unable to take the request, Plurimog will forward to another data center that can take the request, like Ashburn, where the request is decrypted and processed. Because Plurimog operates at layer 4, it can send individual TCP or UDP requests to other places which allows it to be very fine-grained: it can send percentages of traffic to other data centers very easily, meaning that we only need to send away enough traffic to ensure that everyone can be served as fast as possible. Check out how that works in our Frankfurt data center, as we are able to shift progressively more and more traffic away to handle issues in our data centers. This chart shows the number of actions taken on free traffic that cause it to be sent out of Frankfurt over time:
But even within a data center, we can route traffic around to prevent traffic from leaving the datacenter at all. Our large data centers, called Multi-Colo Points of Presence (MCPs) contain logical sections of compute within a data center that are distinct from one another. These MCP data centers are enabled with another version of Unimog called Duomog, which allows for traffic to be shifted between logical sections of compute automatically. This makes MCP data centers fault-tolerant without sacrificing performance for our customers, and allows Traffic Manager to work within a data center as well as between data centers.
When evaluating portions of requests to move, Traffic Manager does the following:
Traffic Manager identifies the proportion of requests that need to be removed from a data center or subsection of a data center so that all requests can be served.
Traffic Manager then calculates the aggregated space metrics for each target to see how many requests each failover data center can take.
Traffic Manager then identifies how much traffic in each plan we need to move, and moves either a proportion of the plan, or all of the plan through Plurimog/Duomog, until we've moved enough traffic. We move Free customers first, and if there are no more Free customers in a data center, we'll move Pro, and then Business customers if needed.
For example, let’s look at Ashburn, Virginia: one of our MCPs. Ashburn has nine different subsections of capacity that can each take traffic. On 8/28, one of those subsections, IAD02, had an issue that reduced the amount of traffic it could handle.
During this time period, Duomog sent more traffic from IAD02 to other subsections within Ashburn, ensuring that Ashburn was always online, and that performance was not impacted during this issue. Then, once IAD02 was able to take traffic again, Duomog shifted traffic back automatically. You can see these actions visualized in the time series graph below, which tracks the percentage of traffic moved over time between subsections of capacity within IAD02 (shown in green):
How does Traffic Manager know how much to move?
Although we used requests per second in the example above, using requests per second as a metric isn’t accurate enough when actually moving traffic. The reason for this is that different customers have different resource costs to our service; a website served mainly from cache with the WAF deactivated is much cheaper CPU wise than a site with all WAF rules enabled and caching disabled. So we record the time that each request takes in the CPU. We can then aggregate the CPU time across each plan to find the CPU time usage per plan. We record the CPU time in ms, and take a per second value, resulting in a unit of milliseconds per second.
CPU time is an important metric because of the impact it can have on latency and customer performance. As an example, consider the time it takes for an eyeball request to make it entirely through the Cloudflare front line servers: we call this the cfcheck latency. If this number goes too high, then our customers will start to notice, and they will have a bad experience. When cfcheck latency gets high, it’s usually because CPU utilization is high. The graph below shows 95th percentile cfcheck latency plotted against CPU utilization across all the machines in the same data center, and you can see the strong correlation:
So having Traffic Manager look at CPU time in a data center is a very good way to ensure that we’re giving customers the best experience and not causing problems.
After getting the CPU time per plan, we need to figure out how much of that CPU time to move to other data centers. To do this, we aggregate the CPU utilization across all servers to give a single CPU utilization across the data center. If a proportion of servers in the data center fail, due to network device failure, power failure, etc., then the requests that were hitting those servers are automatically routed elsewhere within the data center by Duomog. As the number of servers decrease, the overall CPU utilization of the data center increases. Traffic Manager has three thresholds for each data center; the maximum threshold, the target threshold, and the acceptable threshold:
Maximum: the CPU level at which performance starts to degrade, where Traffic Manager will take action
Target: the level to which Traffic Manager will try to reduce the CPU utilization to restore optimal service to users
Acceptable: the level below which a data center can receive requests forwarded from another data center, or revert active moves
When a data center goes above the maximum threshold, Traffic Manager takes the ratio of total CPU time across all plans to current CPU utilization, then applies that to the target CPU utilization to find the target CPU time. Doing it this way means we can compare a data center with 100 servers to a data center with 10 servers, without having to worry about the number of servers in each data center. This assumes that load increases linearly, which is close enough to true for the assumption to be valid for our purposes.
Target ratio equals current ratio:
Therefore:
Subtracting the target CPU time from the current CPU time gives us the CPU time to move:
For example, if the current CPU utilization was at 90% across the data center, the target was 85%, and the CPU time across all plans was 18,000, we would have:
This would mean Traffic Manager would need to move 1,000 CPU time:
Now we know the total CPU time needed to move, we can go through the plans, until the required time to move has been met.
What is the maximum threshold?
A frequent problem that we faced was determining at which point Traffic Manager should start taking action in a data center – what metric should it watch, and what is an acceptable level?
As said before, different services have different requirements in terms of CPU utilization, and there are many cases of data centers that have very different utilization patterns.
To solve this problem, we turned to machine learning. We created a service that will automatically adjust the maximum thresholds for each data center according to customer-facing indicators. For our main service-level indicator (SLI), we decided to use the cfcheck latency metric we described earlier.
But we also need to define a service-level objective (SLO) in order for our machine learning application to be able to adjust the threshold. We set the SLO for 20ms. Comparing our SLO to our SLI, our 95th percentile cfcheck latency should never go above 20ms and if it does, we need to do something. The below graph shows 95th percentile cfcheck latency over time, and customers start to get unhappy when cfcheck latency goes into the red zone:
If customers have a bad experience when CPU gets too high, then the goal of Traffic Manager’s maximum thresholds are to ensure that customer performance isn’t impacted and to start redirecting traffic away before performance starts to degrade. At a scheduled interval the Traffic Manager service will fetch a number of metrics for each data center and apply a series of machine learning algorithms. After cleaning the data for outliers we apply a simple quadratic curve fit, and we are currently testing a linear regression algorithm.
After fitting the models we can use them to predict the CPU usage when the SLI is equal to our SLO, and then use it as our maximum threshold. If we plot the cpu values against the SLI we can see clearly why these methods work so well for our data centers, as you can see for Barcelona in the graphs below, which are plotted against curve fit and linear regression fit respectively.
In these charts the vertical line is the SLO, and the intersection of this line with the fitted model represents the value that will be used as the maximum threshold. This model has proved to be very accurate, and we are able to significantly reduce the SLO breaches. Let’s take a look at when we started deploying this service in Lisbon:
Before the change, cfcheck latency was constantly spiking, but Traffic Manager wasn’t taking actions because the maximum threshold was static. But after July 29, we see that cfcheck latency has never hit the SLO because we are constantly measuring to make sure that customers are never impacted by CPU increases.
Where to send the traffic?
So now that we have a maximum threshold, we need to find the third CPU utilization threshold which isn’t used when calculating how much traffic to move – the acceptable threshold. When a data center is below this threshold, it has unused capacity which, as long as it isn’t forwarding traffic itself, is made available for other data centers to use when required. To work out how much each data center is able to receive, we use the same methodology as above, substituting target for acceptable:
Therefore:
Subtracting the current CPU time from the acceptable CPU time gives us the amount of CPU time that a data center could accept:
To find where to send traffic, Traffic Manager will find the available CPU time in all data centers, then it will order them by latency from the data center needing to move traffic. It moves through each of the data centers, using all available capacity based on the maximum thresholds before moving onto the next. When finding which plans to move, we move from the lowest priority plan to highest, but when finding where to send them, we move in the opposite direction.
To make this clearer let's use an example:
We need to move 1,000 CPU time from data center A, and we have the following usage per plan: Free: 500ms/s, Pro: 400ms/s, Business: 200ms/s, Enterprise: 1000ms/s.
We would move 100% of Free (500ms/s), 100% of Pro (400ms/s), 50% of Business (100ms/s), and 0% of Enterprise.
Nearby data centers have the following available CPU time: B: 300ms/s, C: 300ms/s, D: 1,000ms/s.
With latencies: A-B: 100ms, A-C: 110ms, A-D: 120ms.
Starting with the lowest latency and highest priority plan that requires action, we would be able to move all the Business CPU time to data center B and half of Pro. Next we would move onto data center C, and be able to move the rest of Pro, and 20% of Free. The rest of Free could then be forwarded to data center D. Resulting in the following action: Business: 50% → B, Pro: 50% → B, 50% → C, Free: 20% → C, 80% → D.
Reverting actions
In the same way that Traffic Manager is constantly looking to keep data centers from going above the threshold, it is also looking to bring any forwarded traffic back into a data center that is actively forwarding traffic.
Above we saw how Traffic Manager works out how much traffic a data center is able to receive from another data center — it calls this the available CPU time. When there is an active move we use this available CPU time to bring back traffic to the data center — we always prioritize reverting an active move over accepting traffic from another data center.
When you put this all together, you get a system that is constantly measuring system and customer health metrics for every data center and spreading traffic around to make sure that each request can be served given the current state of our network. When we put all of these moves between data centers on a map, it looks something like this, a map of all Traffic Manager moves for a period of one hour. This map doesn’t show our full data center deployment, but it does show the data centers that are sending or receiving moved traffic during this period:
Data centers in red or yellow are under load and shifting traffic to other data centers until they become green, which means that all metrics are showing as healthy. The size of the circles represent how many requests are shifted from or to those data centers. Where the traffic is going is denoted by where the lines are moving. This is difficult to see at a world scale, so let’s zoom into the United States to see this in action for the same time period:
Here you can see Toronto, Detroit, New York, and Kansas City are unable to serve some requests due to hardware issues, so they will send those requests to Dallas, Chicago, and Ashburn until equilibrium is restored for users and data centers. Once data centers like Detroit are able to service all the requests they are receiving without needing to send traffic away, Detroit will gradually stop forwarding requests to Chicago until any issues in the data center are completely resolved, at which point it will no longer be forwarding anything. Throughout all of this, end users are online and are not impacted by any physical issues that may be happening in Detroit or any of the other locations sending traffic.
Happy network, happy products
Because Traffic Manager is plugged into the user experience, it is a fundamental component of the Cloudflare network: it keeps our products online and ensures that they’re as fast and reliable as they can be. It’s our real time load balancer, helping to keep our products fast by only shifting necessary traffic away from data centers that are having issues. Because less traffic gets moved, our products and services stay fast.
But Traffic Manager can also help keep our products online and reliable because they allow our products to predict where reliability issues may occur and preemptively move the products elsewhere. For example, Browser Isolation directly works with Traffic Manager to help ensure the uptime of the product. When you connect to a Cloudflare data center to create a hosted browser instance, Browser Isolation first asks Traffic Manager if the data center has enough capacity to run the instance locally, and if so, the instance is created right then and there. If there isn’t sufficient capacity available, Traffic Manager tells Browser Isolation which the closest data center with sufficient available capacity is, thereby helping Browser Isolation to provide the best possible experience for the user.
Happy network, happy users
At Cloudflare, we operate this huge network to service all of our different products and customer scenarios. We’ve built this network for resiliency: in addition to our MCP locations designed to reduce impact from a single failure, we are constantly shifting traffic around on our network in response to internal and external issues.
But that is our problem — not yours.
Similarly, when human beings had to fix those issues, it was customers and end users who would be impacted. To ensure that you’re always online, we’ve built a smart system that detects our hardware failures and preemptively balances traffic across our network to ensure it’s online and as fast as possible. This system works faster than any person — not only allowing our network engineers to sleep at night — but also providing a better, faster experience for all of our customers.
And finally: if these kinds of engineering challenges sound exciting to you, then please consider checking out the Traffic Engineering team's open position on Cloudflare’s Careers page!
Cloudflare has done several deep dives into Zero Trust performance in 2023 alone: one in January, one in March, and one for Speed Week. In each of them, we outline a series of tests we perform and then show that we’re the fastest. While some may think that this is a marketing stunt, it’s not: the tests we devised aren’t necessarily built to make us look the best, our network makes us look the best when we run the tests.
We’ve discussed why performance matters in our blogs before, but the short version is that poor performance is a threat vector: the last thing we want is for your users to turn off Zero Trust to get an experience that is usable for them. Our goal is to improve performance because it helps improve the security of your users, the security of the things that matter most to you, and enables your users to be more productive.
When we run Zero Trust performance tests, we start by measuring end-to-end latency from when a user sends a packet to when the Zero Trust proxy receives, forwards, and inspects the packet, to when the destination website processes the packet and all the way back to the user. This number, called HTTP Response, is often used in Application Services tests to measure the performance of CDNs. We use this to measure our Zero Trust services as well, but it’s not the only way to measure performance. Zscaler measures their performance through something called proxy latency, while Netskope measures theirs through a decrypted latency SLA. Some providers don’t think about performance at all!
There are many ways to view network performance. However, at Cloudflare we believe the best way to measure performance is to use end-to-end HTTP response measurements. In this blog, we’re going to talk about why end-to-end performance is the most important thing to look at, why other methods like proxy latency and decrypted latency SLAs are insufficient for performance evaluations, and how you can measure your Zero Trust performance like we do.
Let’s start at the very beginning
When evaluating performance for any scenario, the most important thing to consider is what exactly you’re supposed to be measuring. This may seem obvious, but oftentimes the things we’re evaluating don’t do a great job of actually measuring the impact users see. A great example of this is when users look at network speed tests: measuring bandwidth doesn’t accurately measure how fast your Internet connection is.
So we must ask ourselves a fundamental question: how do users interact with Zero Trust products? The answer is they shouldn’t: or they shouldn’t know they’re interacting with Zero Trust services. Users actually interact with websites and applications hosted somewhere on the Internet: maybe they’re interacting with a private instance of Microsoft Exchange, or maybe they’re accessing Salesforce in the cloud. In any case, the Zero Trust services that sit in between serve as a forward proxy: they receive the packets from the user, filter for security and access evaluations, and then send the packets along to their destination. If the services are doing their job correctly, users won’t notice their presence at all.
So when we look at Zero Trust services, we have to look at scenarios where transparency becomes opacity: when the Zero Trust services reveal themselves and result in high latency, or even application failures. In order to simulate these scenarios, we have to access sites users would access on a regular basis. If we simulate accessing those websites through a Zero Trust platform, we can look at what happens when Zero Trust is present in the request path.
Fortunately for us, we know exactly how to simulate user requests hitting websites. We have a lot of experience measuring performance for our Developer Platform, and for our Network Benchmarking analysis. By framing Zero Trust performance in the context of our other performance analysis initiatives, it’s easy to make performance better and ensure that all of our efforts are focused on making the most people as fast as possible. Just like our analyses of other Cloudflare products, this approach puts customers and users first and ensures they get the best performance.
Challenges of the open Internet
Zero Trust services naturally come at a disadvantage when it comes to performance: they automatically add an additional network hop between users and the services they’re trying to access. That’s because a forward proxy sits between the user and the public Internet to filter and protect traffic. This means that the Zero Trust service needs to maintain connectivity with end-user ISPs, maintain connectivity with cloud providers, and transit networks that connect services that send and receive most public Internet traffic. This is generally done through peering and interconnectivity relationships. In addition to maintaining all of that connectivity, there’s also the time it takes for the service to actually process rules and packet inspections. Given all of these challenges, performance management in this scenario is complex.
Some providers try to circumvent this by scoping performance down. This is essentially what Zscaler’s proxy latency and Netskope’s decrypted latency are: an attempt to remove parts of the network path that are difficult to control and only focus on the aspects of a request they can control. To be more specific, these latencies only focus on the time that a request spends on Zscaler’s or Netskope’s physical hardware. The upside of this is that it allows these providers to make some amount of guarantee in regards to latency. This line of thinking traditionally comes from trying to replace hardware firewalls and CASB services that may not process requests inline. Zscaler and Netskope are trying to prove that they can process rules and actions inline with a request and still be performant.
But as we showed with our blog back in January, the time spent on a machine in a Zero Trust network is only a small portion of the request time experienced by the end user. The majority of a requests’ time is spent on the wire between machines. When you look at performance, you need to look at it holistically and not at a single element, like on-box processing latency. So by scoping performance down to only looking at on-box processing latencies, you’re not actually looking at anything close to the full picture of performance. To be fast, providers need to look at every aspect of the network and how they function. So let’s talk about all the elements needed to make zero trust service performance better.
How do you get better Zero Trust performance?
A good way to think of Zero Trust performance is like driving on a highway. If you’re hungry and need to eat, you want to go to a place that’s close to the highway and fast. If a restaurant that serves burgers in one second is 15 minutes out of the way, it doesn’t matter how fast they serve the burgers: the time it takes to get to that restaurant isn’t worth the trip. A McDonald’s at a rest stop may take the same amount of time as the other restaurant, but is faster end-to-end. The restaurant you pick should be close to the highway AND serve food fast. Only looking at one of the two will impact your overall time if the other aspect is slow.
Based on this analogy, in addition to having good processing times, the best ways to improve Zero Trust performance are to be well peered on the last mile, be well peered with networks that host important applications, and have diverse paths on the Internet to steer traffic around should things go wrong. Let’s go over each of those and why they’re important.
Last mile peering
We’ve talked before about how getting closer to users is critical to increase performance, but here’s a quick summary: Having a Zero Trust provider that receives your packets physically close to you straightens the path your packets take between your device and what applications you’re trying to access. Because Zero Trust networking will always incur an additional hop, if that hop is inline with the path your requests to your website would normally take, the overhead your Zero Trust network incurs is minimal.
In the diagram above, you can see three connectivity models: one from a user straight to a website, one going through a generic forward proxy, and one going through Cloudflare. The length of each line is representative of the point to point latency. Based on that, you can see that the forward proxy path is longer because the two segments add up to be longer than the direct connection is. This additional travel path is referred to as a hairpin in the networking world. The goal is to keep the line between user and website as straight as possible, because that’s the shortest distance between the two.
The closer your Zero Trust provider is to you, the easier keeping the path small is to achieve. This challenge is something we’re really good at, as we’re always investing to get closer to users no matter where they are by leveraging our over 12,000 peered networks.
Cloud peering
But getting close to users is only half the battle. Once the traffic is on the Zero Trust network, it needs to be delivered to the destination. Oftentimes, those destinations are hosted in hyperscale cloud providers like Azure, Amazon Web Services, or Google Cloud. These hyperscalers are global networks with hundreds of locations for users to store data and host services. If a Zero Trust network is not well peered with all of these networks in all of the places they offer compute, that straight path starts to diverge: less than it would on the last mile, but still enough to be noticeable by end-users.
Cloudflare helps out here by being peered with these major cloud providers where they are, ensuring that the handoff between Cloudflare and the respective cloud is short and seamless. Cloudflare has peering with the major cloud providers in over 40 different metros around the world, ensuring that wherever applications may be hosted, Cloudflare is there to connect to them.
Alternative paths for everything in between
If a Zero Trust network has good connectivity on the last mile and good connectivity to the clouds, the only thing left is being able to pass traffic between the two. Having diverse network paths within the Zero Trust network is incredibly valuable for being able to shift traffic around networking issues and provide private connectivity on the Zero Trust network that is reliable and performant. Cloudflare leverages our own private backbone for this purpose, and that backbone is what helps us deliver next-level performance for all scenario types.
Getting the measurements that matter
So now that we know what scenarios we’re trying to measure and how to make them faster, how are we measuring them? The answer is elegantly simple: we make HTTP calls through our Zero Trust services and measure the Response times. When we perform our Gateway tests, we configure a client program that periodically connects to a bunch of websites commonly used by enterprises through our Zero Trust client and measure the HTTP timings to calculate HTTP response.
As we discussed before, Response is the time it takes for a user to send a packet to the Zero Trust proxy which receives, forwards, and inspects the packet, then sends it to the destination website which processes the packet and returns a response all the way back to the user. This measurement is valuable because it allows us to focus specifically on network performance and not necessarily the ability of a web application to load and render content. We don’t measure things like Largest Contentful Paint because those have dependencies on the software stack on the destination, whether the destination is fronted by a CDN and how their performance is, or even the browser making the request. We want to measure how well the Zero Trust service can deliver packets from a device to a website and back. Our current measurement methodology is focused on the time to deliver a response to the client and ignores some client side processing like browser render time (Largest Contentful Paint) and application specific metrics like UDP Video delivery.
You can do it too
Measuring performance may seem complicated, but at Cloudflare we’re trying to make it easy. Your goals of measuring user experience and our goals of providing a faster experience are perfectly aligned, and the tools we build to view performance are not only user-facing but are used internally for performance improvements. We purpose-built our Digital Experience Monitoring product to not just show where things are going wrong, but to monitor your Zero Trust performance so that you can track your user experience right alongside us. We use this data to help identify regressions and issues on our network to help ensure that you are having a good experience. With DEX, you can make tests to measure endpoints you care about just like we do in our tests, and you can see the results for HTTP Response in the Cloudflare dashboard. And the more tests you make and better visibility you get into your experience, the more you’re helping us better see Zero Trust experiences across our network and the broader Internet.
Just like everything else at Cloudflare, our performance measurements are designed with users in mind. When we measure these numbers and investigate them, we know that by making these numbers look better, we’ll improve the end-to-end experience for Zero Trust users.
In January and in March we posted blogs outlining how Cloudflare performed against others in Zero Trust. The conclusion in both cases was that Cloudflare was faster than Zscaler and Netskope in a variety of Zero Trust scenarios. For Speed Week, we’re bringing back these tests and upping the ante: we’re testing more providers against more public Internet endpoints in more regions than we have in the past.
For these tests, we tested three Zero Trust scenarios: Secure Web Gateway (SWG), Zero Trust Network Access (ZTNA), and Remote Browser Isolation (RBI). We tested against three competitors: Zscaler, Netskope, and Palo Alto Networks. We tested these scenarios from 12 regions around the world, up from the four we’d previously tested with. The results are that Cloudflare is the fastest Secure Web Gateway in 42% of testing scenarios, the most of any provider. Cloudflare is 46% faster than Zscaler, 56% faster than Netskope, and 10% faster than Palo Alto for ZTNA, and 64% faster than Zscaler for RBI scenarios.
In this blog, we’ll provide a refresher on why performance matters, do a deep dive on how we’re faster for each scenario, and we’ll talk about how we measured performance for each product.
Performance is a threat vector
Performance in Zero Trust matters; when Zero Trust performs poorly, users disable it, opening organizations to risk. Zero Trust services should be unobtrusive when the services become noticeable they prevent users from getting their job done.
Zero Trust services may have lots of bells and whistles that help protect customers, but none of that matters if employees can’t use the services to do their job quickly and efficiently. Fast performance helps drive adoption and makes security feel transparent to the end users. At Cloudflare, we prioritize making our products fast and frictionless, and the results speak for themselves. So now let’s turn it over to the results, starting with our secure web gateway.
Cloudflare Gateway: security at the Internet
A secure web gateway needs to be fast because it acts as a funnel for all of an organization’s Internet-bound traffic. If a secure web gateway is slow, then any traffic from users out to the Internet will be slow. If traffic out to the Internet is slow, users may see web pages load slowly, video calls experience jitter or loss, or generally unable to do their jobs. Users may decide to turn off the gateway, putting the organization at risk of attack.
In addition to being close to users, a performant web gateway needs to also be well-peered with the rest of the Internet to avoid slow paths out to websites users want to access. Many websites use CDNs to accelerate their content and provide a better experience. These CDNs are often well-peered and embedded in last mile networks. But traffic through a secure web gateway follows a forward proxy path: users connect to the proxy, and the proxy connects to the websites users are trying to access. If that proxy isn’t as well-peered as the destination websites are, the user traffic could travel farther to get to the proxy than it would have needed to if it was just going to the website itself, creating a hairpin, as seen in the diagram below:
A well-connected proxy ensures that the user traffic travels less distance making it as fast as possible.
To compare secure web gateway products, we pitted the Cloudflare Gateway and WARP client against Zscaler, Netskope, and Palo Alto which all have products that perform the same functions. Cloudflare users benefit from Gateway and Cloudflare’s network being embedded deep into last mile networks close to users, being peered with over 12,000 networks. That heightened connectivity shows because Cloudflare Gateway is the fastest network in 42% of tested scenarios:
Number of testing scenarios where each provider is fastest for 95th percentile HTTP Response time (higher is better)
Provider
Scenarios where this provider is fastest
Cloudflare
48
Zscaler
14
Netskope
10
Palo Alto Networks
42
This data shows that we are faster to more websites from more places than any of our competitors. To measure this, we look at the 95th percentile HTTP response time: how long it takes for a user to go through the proxy, have the proxy make a request to a website on the Internet, and finally return the response. This measurement is important because it’s an accurate representation of what users see. When we look at the 95th percentile across all tests, we see that Cloudflare is 2.5% faster than Palo Alto Networks, 13% faster than Zscaler, and 6.5% faster than Netskope.
95th percentile HTTP response across all tests
Provider
95th percentile response (ms)
Cloudflare
515
Zscaler
595
Netskope
550
Palo Alto Networks
529
Cloudflare wins out here because Cloudflare’s exceptional peering allows us to succeed in places where others were not able to succeed. We are able to get locally peered in hard-to-reach places on the globe, giving us an edge. For example, take a look at how Cloudflare performs against the others in Australia, where we are 30% faster than the next fastest provider:
Cloudflare establishes great peering relationships in countries around the world: in Australia we are locally peered with all of the major Australian Internet providers, and as such we are able to provide a fast experience to many users around the world. Globally, we are peered with over 12,000 networks, getting as close to end users as we can to shorten the time requests spend on the public Internet. This work has previously allowed us to deliver content quickly to users, but in a Zero Trust world, it shortens the path users take to get to their SWG, meaning they can quickly get to the services they need.
Previously when we performed these tests, we only tested from a single Azure region to five websites. Existing testing frameworks like Catchpoint are unsuitable for this task because performance testing requires that you run the SWG client on the testing endpoint. We also needed to make sure that all of the tests are running on similar machines in the same places to measure performance as well as possible. This allows us to measure the end-to-end responses coming from the same location where both test environments are running.
In our testing configuration for this round of evaluations, we put four VMs in 12 cloud regions side by side: one running Cloudflare WARP connecting to our gateway, one running ZIA, one running Netskope, and one running Palo Alto Networks. These VMs made requests every five minutes to the 11 different websites mentioned below and logged the HTTP browser timings for how long each request took. Based on this, we are able to get a user-facing view of performance that is meaningful. Here is a full matrix of locations that we tested from, what websites we tested against, and which provider was faster:
Endpoints
SWG Regions
Shopify
Walmart
Zendesk
ServiceNow
Azure Site
Slack
Zoom
Box
M365
GitHub
Bitbucket
East US
Cloudflare
Cloudflare
Palo Alto Networks
Cloudflare
Palo Alto Networks
Cloudflare
Palo Alto Networks
Cloudflare
West US
Palo Alto Networks
Palo Alto Networks
Cloudflare
Cloudflare
Palo Alto Networks
Cloudflare
Palo Alto Networks
Cloudflare
South Central US
Cloudflare
Cloudflare
Palo Alto Networks
Cloudflare
Palo Alto Networks
Cloudflare
Palo Alto Networks
Cloudflare
Brazil South
Cloudflare
Palo Alto Networks
Palo Alto Networks
Palo Alto Networks
Zscaler
Zscaler
Zscaler
Palo Alto Networks
Cloudflare
Palo Alto Networks
Palo Alto Networks
UK South
Cloudflare
Palo Alto Networks
Palo Alto Networks
Palo Alto Networks
Palo Alto Networks
Palo Alto Networks
Palo Alto Networks
Cloudflare
Palo Alto Networks
Palo Alto Networks
Palo Alto Networks
Central India
Cloudflare
Cloudflare
Cloudflare
Palo Alto Networks
Palo Alto Networks
Cloudflare
Cloudflare
Cloudflare
Southeast Asia
Cloudflare
Cloudflare
Cloudflare
Cloudflare
Palo Alto Networks
Cloudflare
Cloudflare
Cloudflare
Canada Central
Cloudflare
Cloudflare
Palo Alto Networks
Cloudflare
Cloudflare
Palo Alto Networks
Palo Alto Networks
Palo Alto Networks
Zscaler
Cloudflare
Zscaler
Switzerland North
netskope
Zscaler
Zscaler
Cloudflare
netskope
netskope
netskope
netskope
Cloudflare
Cloudflare
netskope
Australia East
Cloudflare
Cloudflare
netskope
Cloudflare
Cloudflare
Cloudflare
Cloudflare
Cloudflare
UAE Dubai
Zscaler
Zscaler
Cloudflare
Cloudflare
Zscaler
netskope
Palo Alto Networks
Zscaler
Zscaler
netskope
netskope
South Africa North
Palo Alto Networks
Palo Alto Networks
Palo Alto Networks
Zscaler
Palo Alto Networks
Palo Alto Networks
Palo Alto Networks
Palo Alto Networks
Zscaler
Palo Alto Networks
Palo Alto Networks
Blank cells indicate that tests to that particular website did not report accurate results or experienced failures for over 50% of the testing period. Based on this data, Cloudflare is generally faster, but we’re not as fast as we’d like to be. There are still some areas where we need to improve, specifically in South Africa, UAE, and Brazil. By Birthday Week in September, we want to be the fastest to all of these websites in each of these regions, which will bring our number up from fastest in 54% of tests to fastest in 79% of tests.
To summarize, Cloudflare’s Gateway is still the fastest SWG on the Internet. But Zero Trust isn’t all about SWG. Let’s talk about how Cloudflare performs in Zero Trust Network Access scenarios.
Instant (Zero Trust) access
Access control needs to be seamless and transparent to the user: the best compliment for a Zero Trust solution is for employees to barely notice it’s there. Services like Cloudflare Access protect applications over the public Internet, allowing for role-based authentication access instead of relying on things like a VPN to restrict and secure applications. This form of access management is more secure, but with a performant ZTNA service, it can even be faster.
Cloudflare outperforms our competitors in this space, being 46% faster than Zscaler, 56% faster than Netskope, and 10% faster than Palo Alto Networks:
Zero Trust Network Access P95 HTTP Response times
Provider
P95 HTTP response (ms)
Cloudflare
1252
Zscaler
2388
Netskope
2974
Palo Alto Networks
1471
For this test, we created applications hosted in three different clouds in 12 different locations: AWS, GCP, and Azure. However, it should be noted that Palo Alto Networks was the exception, as we were only able to measure them using applications hosted in one cloud from two regions due to logistical challenges with setting up testing: US East and Singapore.
For each of these applications, we created tests from Catchpoint that accessed the application from 400 locations around the world. Each of these Catchpoint nodes attempted two actions:
New Session: log into an application and receive an authentication token
Existing Session: refresh the page and log in passing the previously obtained credentials
We like to measure these scenarios separately, because when we look at 95th percentile values, we would almost always be looking at new sessions if we combined new and existing sessions together. For the sake of completeness though, we will also show the 95th percentile latency of both new and existing sessions combined.
Cloudflare was faster in both US East and Singapore, but let’s spotlight a couple of regions to delve into. Let’s take a look at a region where resources are heavily interconnected equally across competitors: US East, specifically Ashburn, Virginia.
In Ashburn, Virginia, Cloudflare handily beats Zscaler and Netskope for ZTNA 95th percentile HTTP Response:
95th percentile HTTP Response times (ms) for applications hosted in Ashburn, VA
AWS East US
Total (ms)
New Sessions (ms)
Existing Sessions (ms)
Cloudflare
2849
1749
1353
Zscaler
5340
2953
2491
Netskope
6513
3748
2897
Palo Alto Networks
Azure East US
Cloudflare
1692
989
1169
Zscaler
5403
2951
2412
Netskope
6601
3805
2964
Palo Alto Networks
GCP East US
Cloudflare
2811
1615
1320
Zscaler
Netskope
6694
3819
3023
Palo Alto Networks
2258
894
1464
You might notice that Palo Alto Networks looks to come out ahead of Cloudflare for existing sessions (and therefore for overall 95th percentile). But these numbers are misleading because Palo Alto Networks’ ZTNA behavior is slightly different than ours, Zscaler’s, or Netskope’s. When they perform a new session, it does a full connection intercept and returns a response from its processors instead of directing users to the login page of the application they are trying to access.
This means that Palo Alto Networks' new session response times don’t actually measure the end-to-end latency we’re looking for. Because of this, their numbers for new session latency and total session latency are misleading, meaning we can only meaningfully compare ourselves to them for existing session latency. When we look at existing sessions, when Palo Alto Networks acts as a pass-through, Cloudflare still comes out ahead by 10%.
This is true in Singapore as well, where Cloudflare is 50% faster than Zscaler and Netskope, and also 10% faster than Palo Alto Networks for Existing Sessions:
95th percentile HTTP Response times (ms) for applications hosted in Singapore
AWS Singapore
Total (ms)
New Sessions (ms)
Existing Sessions (ms)
Cloudflare
2748
1568
1310
Zscaler
5349
3033
2500
Netskope
6402
3598
2990
Palo Alto Networks
Azure Singapore
Cloudflare
1831
1022
1181
Zscaler
5699
3037
2577
Netskope
6722
3834
3040
Palo Alto Networks
GCPSingapore
Cloudflare
2820
1641
1355
Zscaler
5499
3037
2412
Netskope
6525
3713
2992
Palo Alto Networks
2293
922
1476
One critique of this data could be that we’re aggregating the times of all Catchpoint nodes together at P95, and we’re not looking at the 95th percentile of Catchpoint nodes in the same region as the application. We looked at that, too, and Cloudflare’s ZTNA performance is still better. Looking at only North America-based Catchpoint nodes, Cloudflare performs 50% better than Netskope, 40% better than Zscaler, and 10% better than Palo Alto Networks at P95 for warm connections:
Zero Trust Network Access 95th percentile HTTP Response times for warm connections with testing locations in North America
Provider
P95 HTTP response (ms)
Cloudflare
810
Zscaler
1290
Netskope
1351
Palo Alto Networks
871
Finally, one thing we wanted to show about our ZTNA performance was how well Cloudflare performed per cloud per region. This below chart shows the matrix of cloud providers and tested regions:
Fastest ZTNA provider in each cloud provider and region by 95th percentile HTTP Response
AWS
Azure
GCP
Australia East
Cloudflare
Cloudflare
Cloudflare
Brazil South
Cloudflare
Cloudflare
N/A
Canada Central
Cloudflare
Cloudflare
Cloudflare
Central India
Cloudflare
Cloudflare
Cloudflare
East US
Cloudflare
Cloudflare
Cloudflare
South Africa North
Cloudflare
Cloudflare
N/A
South Central US
N/A
Cloudflare
Zscaler
Southeast Asia
Cloudflare
Cloudflare
Cloudflare
Switzerland North
N/A
N/A
Cloudflare
UAE Dubai
Cloudflare
Cloudflare
Cloudflare
UK South
Cloudflare
Cloudflare
netskope
West US
Cloudflare
Cloudflare
N/A
There were some VMs in some clouds that malfunctioned and didn’t report accurate data. But out of 30 available cloud regions where we had accurate data, Cloudflare was the fastest ZT provider in 28 of them, meaning we were faster in 93% of tested cloud regions.
To summarize, Cloudflare also provides the best experience when evaluating Zero Trust Network Access. But what about another piece of the puzzle: Remote Browser Isolation (RBI)?
Remote Browser Isolation: a secure browser hosted in the cloud
Remote browser isolation products have a very strong dependency on the public Internet: if your connection to your browser isolation product isn’t good, then your browser experience will feel weird and slow. Remote browser isolation is extraordinarily dependent on performance to feel smooth and seamless to the users: if everything is fast as it should be, then users shouldn’t even notice that they’re using browser isolation.
For this test, we’re again pitting Cloudflare against Zscaler. While Netskope does have an RBI product, we were unable to test it due to it requiring a SWG client, meaning we would be unable to get full fidelity of testing locations like we would when testing Cloudflare and Zscaler. Our tests showed that Cloudflare is 64% faster than Zscaler for remote browsing scenarios: Here’s a matrix of fastest provider per cloud per region for our RBI tests:
Fastest RBI provider in each cloud provider and region by 95th percentile HTTP Response
AWS
Azure
GCP
Australia East
Cloudflare
Cloudflare
Cloudflare
Brazil South
Cloudflare
Cloudflare
Cloudflare
Canada Central
Cloudflare
Cloudflare
Cloudflare
Central India
Cloudflare
Cloudflare
Cloudflare
East US
Cloudflare
Cloudflare
Cloudflare
South Africa North
Cloudflare
Cloudflare
South Central US
Cloudflare
Cloudflare
Southeast Asia
Cloudflare
Cloudflare
Cloudflare
Switzerland North
Cloudflare
Cloudflare
Cloudflare
UAE Dubai
Cloudflare
Cloudflare
Cloudflare
UK South
Cloudflare
Cloudflare
Cloudflare
West US
Cloudflare
Cloudflare
Cloudflare
This chart shows the results of all of the tests run against Cloudflare and Zscaler to applications hosted on three different clouds in 12 different locations from the same 400 Catchpoint nodes as the ZTNA tests. In every scenario, Cloudflare was faster. In fact, no test against a Cloudflare-protected endpoint had a 95th percentile HTTP Response of above 2105 ms, while no Zscaler-protected endpoint had a 95th percentile HTTP response of below 5000 ms.
To get this data, we leveraged the same VMs to host applications accessed through RBI services. Each Catchpoint node would attempt to log into the application through RBI, receive authentication credentials, and then try to access the page by passing the credentials. We look at the same new and existing sessions that we do for ZTNA, and Cloudflare is faster in both new sessions and existing session scenarios as well.
Gotta go fast(er)
Our Zero Trust customers want us to be fast not because they want the fastest Internet access, but because they want to know that employee productivity won’t be impacted by switching to Cloudflare. That doesn’t necessarily mean that the most important thing for us is being faster than our competitors, although we are. The most important thing for us is improving our experience so that our users feel comfortable knowing we take their experience seriously. When we put out new numbers for Birthday Week in September and we’re faster than we were before, it won’t mean that we just made the numbers go up: it means that we are constantly evaluating and improving our service to provide the best experience for our customers. We care more that our customers in UAE have an improved experience with Office365 as opposed to beating a competitor in a test. We show these numbers so that we can show you that we take performance seriously, and we’re committed to providing the best experience for you, wherever you are.
For developers, performance is everything. If your app is slow, it will get outclassed and no one will use it. In order for your application to be fast, every underlying component and system needs to be as performant as possible. In the past, we’ve shown how our network helps make your apps faster, even in remote places. We’ve focused on how Workers provides the fastest compute, even in regions that are really far away from traditional cloud datacenters.
For Developer Week 2023, we’re going to be looking at one of the newest Cloudflare developer offerings and how it compares to an alternative when retrieving assets from buckets: R2 versus Amazon Simple Storage Service (S3). Spoiler alert: we’re faster than S3 when serving media content via public access. Our test showed that on average, Cloudflare R2 was 20-40% faster than Amazon S3. For this test, we used 95th percentile Response tests, which measures the time it takes for a user to make a request to the bucket, and get the entirety of the response. This test was designed with the goal of measuring end-user performance when accessing content in public buckets.
In this blog we’re going to talk about why your object store needs to be fast, how much faster R2 is, why that is, and how we measured it.
Storage performance is user-facing
Storage performance is critical to a snappy user experience. Storage services are used for many scenarios that directly impact the end-user experience, particularly in the case where the data stored doesn’t end up in a cache (uncacheable or dynamic content). Compute and database services can rely on storage services, so if they’re not fast, the services using them won’t be either. Even the basic content fetching scenarios that use a CDN require storage services to be fast if the asset is either uncacheable or was not cached on the request: if the storage service is slow or far away, users will be impacted by that performance. And as every developer knows, nobody remembers the nine fast API calls if the last call was slow. Users don’t care about API calls, they care about overall experience. One slow API call, one slow image, one slow anything can muck up the works and provide users with a bad experience.
Because there are lots of different ways to use storage services, we’re going to focus on a relatively simple scenario: fetching static images from these services. Let’s talk about R2 and how it compares to one of the alternatives in this scenario: Amazon S3.
Benchmarking storage performance
When looking at uncached raw file delivery for users in North America retrieving content from a bucket in Ashburn, Virginia (US-East) and examining 95th percentile Response, R2 is 38% faster than S3:
Storage Performance: Response in North America (US-East)
95th percentile (ms)
Cloudflare R2
1,262
Amazon S3
2,055
For content hosted in US-East (Ashburn, VA) and only looking at North America-based eyeballs, R2 beats S3 by 30% in response time. When we look at why this is the case, the answer lies in our closeness to users and highly optimized HTTP stacks. Let’s take a look at the TCP connect and SSL times for these tests, which are the times it takes to reach the storage bucket (TCP connect) and the time to complete TLS handshake (SSL time):
Storage Performance: Connect and SSL in North America (US-East)
95th percentile connect (ms)
95th percentile SSL (ms)
Cloudflare R2
32
59
Amazon S3
78
180
Cloudflare’s cumulative connect + SSL time is almost 1/2 of Amazon’s SSL time alone. Being able to be fast on connection establishment gives us an edge right off the bat, especially in North America where cloud and storage providers tend to optimize for performance, and connect times tend to be low because ISPs have good peering with cloud and storage providers. But this isn’t just true in North America. Let’s take a look at Europe (EMEA) and Asia (APAC), where Cloudflare also beats out AWS in 95th percentile response time when we look at eyeballs in region for both regions:
Storage Performance: Response in EMEA (EU-East)
95th percentile (ms)
Cloudflare R2
1,303
Amazon S3
1,729
Cloudflare beats Amazon by 20% in EMEA. And when you look at the SSL times, you’ll see the same trends that were present in North America: faster Connect and SSL times:
Storage Performance: Connect and SSL in EMEA (EU-East)
95th percentile connect (ms)
95th percentile SSL (ms)
Cloudflare R2
57
94
Amazon S3
80
178
Again, the separator is how optimized Cloudflare is at setting up connections to deliver content. This is also true in APAC, where objects stored in Tokyo are served about 1.5 times faster on Cloudflare than for AWS:
Storage Performance: Response in APAC (Tokyo)
95th percentile (ms)
Cloudflare R2
4,057
Amazon S3
6,850
Focus on cross-region
Up until this point, we’ve been looking at scenarios where users are accessing data that is stored in the same region as they are. But what if that isn’t the case? What if a user in Germany is accessing content in Ashburn? In those cases, Cloudflare also pulls ahead. This is a chart showing 95th percentile response times for cases where users outside the United States are accessing content hosted in Ashburn, VA, or US-East:
Storage Performance: Response for users outside of US connecting to US-East
95th percentile (ms)
Cloudflare R2
3,224
Amazon S3
6,387
Cloudflare wins again, at almost 2x faster than S3 at P95. This data shows that not only do our in-region calls win out, but we win across the world. Even if you don’t have the money to buy storage everywhere in the world, R2 can still give you world-class performance because not only is R2 faster cross-region, R2’s default no-region setup ensures your data will be close to your users as often as possible.
Testing methodology
To measure these tests, we set up over 400 Catchpoint backbone nodes embedded in last mile ISPs around the world to retrieve a 1 MB file from R2 and S3 in specific locations: Ashburn, Tokyo, and Frankfurt. We recognize that many users will store larger files than the one we tested with, and we plan to test with larger files next showing that we’re faster delivering larger files as well.
We had these 400 nodes retrieve the file uncached from each storage service every 30 minutes for four days. We configured R2 to disable caching. This allows us to make sure that we aren’t reaping any benefits from our CDN pipeline and are only retrieving uncached files from the storage services.
Finally, we had to fix where the public buckets were stored in R2 to get an equivalent test compared to S3. You may notice that when configuring R2, you aren’t able to select specific datacenter locations like you can in AWS. Instead, you can provide a location hint to a general region. Cloudflare will store data anywhere in that region.
This feature is designed to make it easier for developers to deploy storage that benefits larger ranges of users as opposed to needing to know where specific datacenters are. However, that makes performance comparisons difficult, so for this test we configured R2 to store data in those specific locations (consistent with the S3 placement) on the backend as opposed to in any location in that region to ensure we would get better apples-to-apples results.
Putting the pieces together
Storage services like R2 are only part of the equation. Developers will often use storage services in conjunction with other compute services for a complete end-to-end application experience. Previously, we performed comparisons of Workers and other compute products such as Fastly’s Compute@Edge and AWS’s Lambda@Edge. We’ve rerun the numbers, and for compute times, Workers is still the fastest compute around, beating AWS Lambda@Edge and Fastly’s Compute@Edge for end-to-end performance for Rust hard tests:
Cloudflare is faster than Fastly for both JavaScript and Rust tests, while also being faster than AWS at JavaScript, which is the only test Lambda@Edge supports
To run these tests, we perform two tests against each provider: a complex JavaScript function, and a complex Rust function. These tests run as part of our network benchmarking tests that run from real user browsers around the world. For a more in-depth look at how we collect this data for Workers scenarios, check our previous Developer Week posts.
Here are the functions for both complex functions in JavaScript and Rust:
JavaScript complex function:
function testHardBusyLoop() {
  let value = 0;
  let offset = Date.now();

  for (let n = 0; n < 15000; n++) {
    value += Math.floor(Math.abs(Math.sin(offset + n)) * 10);
  }

  return value;
}
Rust complex function:
fn test_hard_busy_loop() -> i32 {
  let mut value = 0;
  let offset = Date::now().as_millis();

  for n in 0..15000 {
    value += (((offset + n) as f64).sin().abs() * 10.0) as i32;
  }

  value
}
By combining Workers and R2, you get a much simpler developer experience and a much faster user experience than you would get with any of the competition.
Storage, sped up and simplified
R2 is a unique storage service that doesn’t require the knowledge of specific locations, has a more global footprint, and integrates easily with existing Cloudflare Developer Platform products for a simple, performant experience for both users and developers. However, because it’s built on top of Cloudflare, it comes with performance baked in, and that’s evidenced by R2 being faster than its primary alternatives.
At Cloudflare, we believe that developers shouldn’t have to think about performance, you have so many other things to think about. By choosing Cloudflare, you should be able to rest easy knowing that your application will be faster because it’s built on Cloudflare, not because you’re manipulating Cloudflare to be faster for you. And by using R2 and the rest of our developer platform, we’re happy to say that we’re delivering on our vision to make performance easy for you.
During every Innovation Week, Cloudflare looks at our network’s performance versus our competitors. In past weeks, we’ve focused on how much faster we are compared to reverse proxies like Akamai, or platforms that sell serverless compute that compares to our Supercloud, like Fastly and AWS. This week, we’d like to provide an update on how we compare to other reverse proxies as well as an update to our application services security product comparison against Zscaler and Netskope. This product is part of our Zero Trust platform, which helps secure applications and Internet experiences out to the public Internet, as opposed to our reverse proxy which protects your websites from outside users.
In addition to our previous post showing how our Zero Trust platform compared against Zscaler, we also have previously shared extensive network benchmarking results for reverse proxies from 3,000 last mile networks around the world. It’s been a while since we’ve shown you our progress towards being #1 in every last mile network. We want to show that data as well as revisiting our series of tests comparing Cloudflare Access to Zscaler Private Access and Netskope Private Access. For our overall network tests, Cloudflare is #1 in 47% of the top 3,000 most reported networks. For our application security tests, Cloudflare is 50% faster than Zscaler and 75% faster than Netskope.
In this blog we’re going to talk about why performance matters for our products, do a deep dive on what we’re measuring to show that we’re faster, and we’ll talk about how we measured performance for each product.
Why does performance matter?
We talked about it in our last blog, but performance matters because it impacts your employees’ experience and their ability to get their job done. Whether it’s accessing services through access control products, connecting out to the public Internet through a Secure Web Gateway, or securing risky external sites through Remote Browser Isolation, all of these experiences need to be frictionless.
A quick summary: say Bob at Acme Corporation is connecting from Johannesburg out to Slack or Zoom to get some work done. If Acme’s Secure Web Gateway is located far away from Bob in London, then Bob’s traffic may go out of Johannesburg to London, and then back into Johannesburg to reach his email. If Bob tries to do something like a voice call on Slack or Zoom, his performance may be painfully slow as he waits for his emails to send and receive. Zoom and Slack both recommend low latency for optimal performance. That extra hop Bob has to take through his gateway could decrease throughput and increase his latency, giving Bob a bad experience.
As we’ve discussed before, if these products or experiences are slow, then something worse might happen than your users complaining: they may find ways to turn off the products or bypass them, which puts your company at risk. A Zero Trust product suite is completely ineffective if no one is using it because it’s slow. Ensuring Zero Trust is fast is critical to the effectiveness of a Zero Trust solution: employees won’t want to turn it off and put themselves at risk if they barely know it’s there at all.
Much like Zscaler, Netskope may outperform many older, antiquated solutions, but their network still fails to measure up to a highly performant, optimized network like Cloudflare’s. We’ve tested all of our Zero Trust products against Netskope equivalents, and we’re even bringing back Zscaler to show you how Zscaler compares against them as well. So let’s dig into the data and show you how and why we’re faster in a critical Zero Trust scenario, comparing Cloudflare Access to Zscaler Private Access and Netskope Private Access.
Cloudflare Access: the fastest Zero Trust proxy
Access control needs to be seamless and transparent to the user: the best compliment for a Zero Trust solution is employees barely notice it’s there. These services allow users to cache authentication information on the provider network, ensuring applications can be accessed securely and quickly to give users that seamless experience they want. So having a network that minimizes the number of logins required while also reducing the latency of your application requests will help keep your Internet experience snappy and reactive.
Cloudflare Access does all that 75% faster than Netskope and 50% faster than Zscaler, ensuring that no matter where you are in the world, you’ll get a fast, secure application experience:
Cloudflare measured application access across ourselves, Zscaler and Netskope from 300 different locations around the world connecting to 6 distinct application servers in Hong Kong, Toronto, Johannesburg, São Paulo, Phoenix, and Switzerland. In each of these locations, Cloudflare’s P95 response time was faster than Zscaler and Netskope. Let’s take a look at the data when the application is hosted in Toronto, an area where Zscaler and Netskope should do well as it’s in a heavily interconnected region: North America.
ZT Access – Response time (95th Percentile) – Toronto
95th Percentile Response (ms)
Cloudflare
2,182
Zscaler
4,071
Netskope
6,072
Cloudflare really stands out in regions with more diverse connectivity options like South America or Asia Pacific, where Zscaler compares better to Netskope than it does Cloudflare:
When we look at application servers hosted locally in South America, Cloudflare stands out:
ZT Access – Response time (95th Percentile) – South America
95th Percentile Response (ms)
Cloudflare
2,961
Zscaler
9,271
Netskope
8,223
Cloudflare’s network shines here, allowing us to ingress connections close to the users. You can see this by looking at the Connect times in South America:
ZT Access – Connect time (95th Percentile) – South America
95th Percentile Connect (ms)
Cloudflare
369
Zscaler
1,753
Netskope
1,160
Cloudflare’s network sets us apart here because we’re able to get users onto our network faster and find the optimal routes around the world back to the application host. We’re twice as fast as Zscaler and three times faster than Netskope because of this superpower. Across all the different tests, Cloudflare’s Connect times is consistently faster across all 300 testing nodes.
In our last blog, we looked at two distinct scenarios that need to be measured individually when we compared Cloudflare and Zscaler. The first scenario is when a user logs into their application and has to authenticate. In this case, the Zero Trust Access service will direct the user to a login page, the user will authenticate, and then be redirected to their application.
This is called a new session, because no authentication information is cached or exists on the Access network. The second scenario is called an existing session, when a user has already been authenticated and that authentication information can be cached. This scenario is usually much faster, because it doesn’t require an extra call to an identity provider to complete.
We like to measure these scenarios separately, because when we look at 95th percentile values, we would almost always be looking at new sessions if we combined new and existing sessions together. But across both scenarios, Cloudflare is consistently faster in every region. Let’s go back and look at an application hosted in Toronto, where users connecting to us connect faster than Zscaler and Netskope for both new and existing sessions.
ZT Access – Response Time (95th Percentile) – Toronto
New Sessions (ms)
Existing Sessions (ms)
Cloudflare
1,276
1,022
Zscaler
2,415
1,797
Netskope
5,741
1,822
You can see that new sessions are generally slower as expected, but Cloudflare’s network and optimized software stack provides a consistently fast user experience. In scenarios where end-to-end connectivity can be more challenging, Cloudflare stands out even more. Let’s take a look at users in Asia connecting through to an application in Hong Kong.
ZT Access – Response Time (95th Percentile) – Hong Kong
New Sessions (ms)
Existing Sessions (ms)
Cloudflare
2,582
2,075
Zscaler
4,956
3,617
Netskope
5,139
3,902
One interesting thing that stands out here is that while Cloudflare’s network is hyper-optimized for performance, Zscaler more closely compares to Netskope on performance than they do to Cloudflare. Netskope also performs poorly on new sessions, which indicates that their service does not react well when users are establishing new sessions.
We like to separate these new and existing sessions because it’s important to look at similar request paths to do a proper comparison. For example, if we’re comparing a request via Zscaler on an existing session and a request via Cloudflare on a new session, we could see that Cloudflare was much slower than Zscaler because of the need to authenticate. So when we contracted a third party to design these tests, we made sure that they took that into account.
For these tests, Cloudflare configured five application instances hosted in Toronto, Los Angeles, Sao Paulo, and Hong Kong. Cloudflare then used 300 different Catchpoint nodes from around the world to mimic a browser login as follows:
User connects to the application from a browser mimicked by a Catchpoint instance – new session
User authenticates against their identity provider
User accesses resource
User refreshes the browser page and tries to access the same resource but with credentials already present – existing session
This allows us to look at Cloudflare versus all the other products for application performance for both new and existing sessions, and we’ve shown that we’re faster. As we’ve mentioned, a lot of that is due to our network and how we get close to our users. So now we’re going to talk about how we compare to other large networks and how we get close to you.
Network effects make the user experience better
Getting closer to users improves the last mile Round Trip Time (RTT). As we discussed in the Access comparison, having a low RTT improves customer performance because new and existing sessions don’t have to travel very far to get to Cloudflare’s Zero Trust network. Embedding ourselves in these last mile networks helps us get closer to our users, which doesn’t just help Zero Trust performance, it helps web performance and developer performance, as we’ve discussed in prior blogs.
To quantify network performance, we have to get enough data from around the world, across all manner of different networks, comparing ourselves with other providers. We used Real User Measurements (RUM) to fetch a 100kb file from several different providers. Users around the world report the performance of different providers. The more users who report the data, the higher fidelity the signal is. The goal is to provide an accurate picture of where different providers are faster, and more importantly, where Cloudflare can improve. You can read more about the methodology in the original Speed Week 2021 blog post here.
We are constantly going through the process of figuring out why we were slow — and then improving. The challenges we faced were unique to each network and highlighted a variety of different issues that are prevalent on the Internet. We’re going to provide an overview of some of the efforts we use to improve our performance for our users.
But before we do, here are the results of our efforts since Developer Week 2022, the last time we showed off these numbers. Out of the top 3,000 networks in the world (by number of IPv4 addresses advertised), here’s a breakdown of the number of networks where each provider is number one in p95 TCP Connection Time, which represents the time it takes for a user on a given network to connect to the provider:
Here’s what those numbers look like as of this week, Security Week 2023:
As you can see, Cloudflare has extended its lead in being faster in more networks, while other networks that previously were faster like Akamai and Fastly lost their lead. This translates to the effects we see on the World Map. Here’s what that world map looked like in Developer Week 2022:
Here’s how that world map looks today during Security Week 2023:
As you can see, Cloudflare has gotten faster in Brazil, many countries in Africa including South Africa, Ethiopia, and Nigeria, as well as Indonesia in Asia, and Norway, Sweden, and the UK in Europe.
A lot of these countries benefited from the Edge Partner Program that we discussed in the Impact Week blog. A quick refresher: the Edge Partner Program encourages last mile ISPs to partner with Cloudflare to deploy Cloudflare locations that are embedded in the last mile ISP. This improves the last mile RTT and improves performance for things like Access. Since we last showed you this map, Cloudflare has deployed more partner locations in places like Nigeria, and Saudi Arabia, which have improved performance for users in all scenarios. Efforts like the Edge Partner Program help improve not just the Zero Trust scenarios like we described above, but also the general web browsing experience for end users who use websites protected by Cloudflare.
Next-generation performance in a Zero Trust world
In a non-Zero Trust world, you and your IT teams were the network operator — which gave you the ability to control performance. While this control was comforting, it was also a huge burden on your IT teams who had to manage middle mile connections between offices and resources. But in a Zero Trust world, your network is now… well, it’s the public Internet. This means less work for your teams — but a lot more responsibility on your Zero Trust provider, which has to manage performance for every single one of your users. The better your Zero Trust provider is at improving end-to-end performance, the better an experience your users will have and the less risk you expose yourself to. For real-time applications like authentication and secure web gateways, having a snappy user experience is critical.
A Zero Trust provider needs to not only secure your users on the public Internet, but it also needs to optimize the public Internet to make sure that your users continuously stay protected. Moving to Zero Trust doesn’t just reduce the need for corporate networks, it also allows user traffic to flow to resources more naturally. However, given your Zero Trust provider is going to be the gatekeeper for all your users and all your applications, performance is a critical aspect to evaluate to reduce friction for your users and reduce the likelihood that users will complain, be less productive, or turn the solutions off. Cloudflare is constantly improving our network to ensure that users always have the best experience, through programs like the Edge Partner Program and constantly improving our peering and interconnectivity. It’s this tireless effort that makes us the fastest Zero Trust provider.
Realizing the goals of Zero Trust is a journey: moving from a world of static networking and hardware concepts to organization-based access and continuous validation is not a one-step process. This challenge is never more real than when dealing with IP addresses. For years, companies on the Internet have built hardened systems based on the idea that only users with certain IP addresses can access certain resources. This implies that IP addresses are tied with identity, which is a kluge and can actually open websites up to attack in some cases. For large companies with many origins and applications that need to be protected in a Zero Trust model, it’s important to be able to support their transition to Zero Trust using mTLS, Access, or Tunnel. To make the transition some organizations may need dedicated IP addresses.
Today we’re introducing Cloudflare Aegis: dedicated IPs that we use to send you traffic. This allows you to lock down your services and applications at an IP level and build a protected environment that is application aware, protocol aware, and even IP-aware. Aegis is available today through Early Access for Enterprise customers, and you can talk to your account team if you want to learn more about it.
We’re going to talk about what Aegis is, give an example of how customers are using it today to secure their networks and services, and talk about how it can integrate with existing products and services to help protect you on your Zero Trust journey. But before we get into what Aegis is, let’s talk about why we built it.
Protecting your services at scale
Cloudflare protects your networks and services from attackers and improves your application performance, but protecting your origin on its own is still an important challenge that must be tackled. To help, Cloudflare built mTLS support and enforcement in conjunction with API Shield, Cloudflare Access, and Cloudflare Tunnel to help enforce a zero trust approach to security: the only entities who can access your origins are ones with the proper certificates, which are configured in Cloudflare and revalidated on a regular basis. Bad traffic is explicitly blocked because the networks and services are set up to only receive encrypted, authenticated traffic.
While mTLS and Access are great for protecting networks and applications regardless of what IP addresses are being used, it isn’t always feasible to deploy at large scale in a short amount of time, especially if you haven’t already configured it for every application or service you build. For some customers who have hundreds, maybe even thousands of applications or services protected behind Cloudflare, adding mTLS or Access for every single origin is a significant task. Some customers might have an additional problem: they can’t keep track of every service so they don’t know where to put mTLS configurations. Enforcing good security behavior can take years in this case, and may have a long tail of unprotected origins that can leave customers vulnerable to potential attacks through spoofing Cloudflare IPs and gaining access to customer networks and user data.
How does Cloudflare Aegis protect you?
What our customers want to be able to do is lock down their entire network by getting dedicated egress IPs from Cloudflare: a small list of IP addresses that Cloudflare uses to send traffic which are reserved only for them which they can configure in their L3 firewalls and block everything else. By ensuring that only a single customer’s traffic will use those dedicated IP addresses, customers have essentially bought blanket protection for their network and give them an additional layer of security for their networks and applications once mTLS is set up. To outline how Cloudflare Aegis might help protect a customer, let’s consider Blank Bank, a fictional customer.
Blank Bank has about 900 applications and services scattered across different instances using a mix of on-premise equipment and cloud services. Blank Bank relies on Cloudflare for L7 services like CDN, DDoS, WAF, and Bot Management, but does not implement mTLS to any of their origins today. During a recent security audit, Blank Bank was told that all new feature development would stop until they were able to secure all of their applications and services to prevent outside traffic from reaching any of the services behind Cloudflare. The audit found that existing services did not implement sufficient security measure at the application, and allowlisting Cloudflare IPs was not enough to secure the services because potential attackers could use Workers to access Blank Bank services outside the prescribed APIs and data flows. Blank Bank was told to apply security precautions as soon as possible. But adding mTLS to each of their 900 applications and services could take years as each service must be configured individually, and they want to keep improving their service now.
Cloudflare Aegis helps solve this problem by scoping the number of IPs we use to talk to Blank Bank from millions down to one: the private egress IP we allocated for them and only them. This IP address ensures that the only traffic that should be reaching Blank Bank servers comes from an IP meant for only Blank Bank traffic: no other Cloudflare customer attempting to reach Blank Bank will have this IP address. Furthermore, this IP is not publicly listed making it harder for an attacker to figure out what IP Cloudflare is using to speak to Blank Bank. With this, Blank Bank can restrict their network Access Control Lists (ACLs) to only allow traffic coming from this IP into their network. Here’s how their network firewall looks before Aegis:
After getting an Aegis IP, they can completely lock down their firewalls to only allow traffic from the Aegis IP that is reserved for them:
Simply by making a change of egress IP, we’ve been able to better protect Blank Bank’s entire network, ensuring they can keep developing new features and improving their already stellar customer experience, while keeping their endpoints safe until they are able to deploy mTLS to every single origin they need to.
Every sword needs a shield
Cloudflare Aegis pairs really well with any of our products to provide heightened application security and protection while allowing you to get things done. Let’s talk about how it can work with some of our products to improve security posture, such as Cloudflare Access, Cloudflare Network Interconnect, and Cloudflare Workers.
Cloudflare Access + CNI
Cloudflare Aegis works really well with Access and CNI to provide a completely secure application access framework that doesn’t even use the public Internet. Access provides the authorization security and caching to ensure that your policies are always being enforced from beyond the application’s server. Aegis ensures that all requests for your application come through a dedicated IP that we assign you. And finally, Cloudflare Network Interconnect provides the private path from Cloudflare over to your application, where you can apply L3 firewall policies to completely protect your network and applications.
This set up of protecting the path to your services sounds a lot like another product we offer: Cloudflare Tunnel. Cloudflare Tunnel encrypts and protects traffic from Cloudflare to an origin network by installing a daemon on the server-side machines. In terms of goals of protecting the origin network by creating private network concepts, Tunnel and this set up are very much comparable. However, some customers might not necessarily want to expose the public endpoints that Tunnel requires. This setup can protect your origin servers without needing to expose anything to the public Internet. This setup is also easier to configure from an application point of view: you don’t need to configure JWT or install Tunnel on your origin: you can configure a firewall policy instead. This makes setting up Access across an organization very easy.
Workers
Aegis and Workers (and the rest of our developer platform) pair incredibly well together. Whenever our developer platform needs to access your services, when paired with Aegis, they’ll use dedicated IPs. This allows your network to be extra protected and ensure that only the Workers you assign will access your endpoints.
Shields up
Many people view the Internet like the wild west, where anything can happen. Attackers can DDoS origins, and they can spoof IP addresses and pretend to be someone else. But with Cloudflare Aegis, you get an extra shield to protect your origin network so that attackers can’t get in. The IPs that you receive traffic from are reserved only for you and no one else, ensuring that the only users that access your network are the ones that you want to access it, and come through those IP addresses.
If you’re interested in better locking down your networks and applications with Cloudflare Aegis, reach out to your account team today to get started and give yourself a shield you can use to defend yourself.
We are thrilled to introduce an innovative new approach to secure hosted applications via Cloudflare Access without the need for any installed software or custom code on your application server. But before we dive into how this is possible, let’s review why Access previously required installed software or custom code on your application server.
Protecting an application with Access
Traditionally, companies used a Virtual Private Network (VPN) to access a hosted application, where all they had to do was configure an IP allowlist rule for the VPN. However, this is a major security threat because anyone on the VPN can access the application, including unauthorized users or attackers.
We built Cloudflare Access to replace VPNs and provide the option to enforce Zero Trust policies in hosted applications. Access allows you to verify a user’s identity before they even reach the application. By acting as a proxy in front of your application’s hostname (e.g. app.example.com), Cloudflare enables strong verification techniques such as identity, device posture, hardkey MFA, and more. All without having to directly add SSO or Authentication logic directly into your applications.
However, since Access enforces at a hostname level, there is still a potential for bypass – the origin server IP address. This means that if someone knows your origin server IP address, they can bypass Access and directly interact with the target application. Seems scary, right? Luckily, there are proven solutions to prevent an origin IP attack.
Cloudflare Tunnel creates a secure, outbound-only tunnel from your origin server to Cloudflare, with no origin IP address. This means that the only inbound traffic to your origin is coming from Cloudflare. However, it does require a daemon to be installed in your origin server’s network.
JWT Validation
JWT validation, on the other hand, prevents requests coming from unauthenticated sources by issuing a JWT when a user successfully authenticates. Application software can then be modified to check any inbound HTTP request for the Access JWT. The Access JWT uses signature-based verification to ensure that it cannot be easily spoofed by malicious users. However, modifying the logic of legacy hosted applications can be cumbersome or even impossible, making JWT validation a limited option for some.
Protecting an application without installed or custom software
And now, the exciting news – our new approach to protect Access applications from bypass without any installed software or code modifications! We achieve this using Cloud Network Interconnect (CNI) and a new Cloudflare product called Aegis.
In this blog, we’ll explore the benefits of using Access, CNI, and Aegis together to protect and optimize your applications. This offers a better way to securely connect your on-premise or cloud infrastructure to the Cloudflare network, as well as manage access to your applications and resources. All without having to install additional software.
Cloudflare Access
Cloudflare Access is a cloud-based identity and access management solution that allows users to secure access to their applications and resources. With Access, users can easily set up single sign-on (SSO) and multi-factor authentication (MFA) to protect against unauthorized access.
Many companies use Access today to protect their applications. However, since Access is based on an application’s hostname, there is still a possibility that security controls are bypassed by going straight to an application’s IP address. The solution to this is using Cloudflare Tunnels and JWT validation, to ensure that any request to the application server is legitimate and coming directly from Cloudflare.
Both Cloudflare Tunnels and JWT validation require additional software (e.g. cloudflared) or code customization in the application itself. This takes time and requires ongoing monitoring and maintenance.
Cloudflare Network Interconnect
Cloudflare Network Interconnect (CNI) enables users to securely connect their on-premises or cloud infrastructure to the Cloudflare network. Until recently, direct network connections were a cumbersome and manual process. Cloud CNI allows users to manage their own direct connections of their infrastructure and Cloudflare.
Cloudflare peers with over 11,500 networks directly and is located in over 285 cities which means there are many opportunities for direct connections with a company’s own private network. This can massively reduce latency of requests between an application server and Cloudflare, leading to a better application user experience.
Aegis
Cloudflare Aegis allows a customer to define a reliable IP address for traffic from Cloudflare to their own infrastructure. With Aegis it is assured that the assigned IP address is coming only from Cloudflare and for traffic associated with a specific account. This means that a company can configure their origin applications to verify all inbound requests are coming from the known IP. You can read more about Aegis here.
Access + CNI and Aegis
With CNI and Aegis, the only configuration required is an allowlist rule based on the inbound IP address. Cloudflare takes care of the rest and ensures that all requests are verified by Access (and other security products like DDoS and Web Application Firewall). All without requiring software or application code modification!
This is a different approach from traditional IP allowlists for VPNs because you can still enforce Zero Trust policies on the inbound request. Plus, Cloudflare has logic in place to ensure that the Aegis IP address can only be used by Cloudflare services.
Hosting your own infrastructure and applications can be a powerful way to have complete control and customization over your online presence. However, one of the challenges of hosting your own infrastructure is providing secure access to your applications and resources.
Traditionally, users have relied on virtual private networks (VPNs) or private circuits to provide secure access to their applications. While these solutions can be effective, they can also be complex to set up and maintain, and may not offer the same level of security and performance as newer solutions.
How it works
An application can be secured behind Access if its hostname is configured in Cloudflare. That hostname can be pointed to either a Cloudflare Tunnel, Load Balancer or direct IP Address. An application can then be configured to enforce specific security policies like identity provider group, hard key MFA, device posture and more.
However, the network path that the application takes can be different and Cloudflare Network Interconnect allows for a completely private path from Cloudflare to your application. For example, Cloudflare Tunnel implicitly assumes that the network path between Cloudflare and your application is using the public Internet. Cloudflare Tunnel encrypts your traffic over the public Internet and ensures that your connection to Cloudflare is secure. But the public Internet is still a concern for a lot of people, who don’t want to harden their service to the public Internet at all.
What if you implicitly knew that your connection was secure because nobody else was using it? That’s what Cloudflare Network Interconnect allows you to guarantee: private, performant connectivity back to Cloudflare.
By configuring Access and CNI together, you get protected application access over a private link. Cloudflare Aegis provides a dedicated IP that allows you to apply network-level firewall policies to ensure that your solution is completely airgapped: no one can access your application but Cloudflare-protected Access calls that come from their own dedicated IP address.
Even if somebody could access your application over the CNI, they would get blocked by your firewall because they didn’t go through Access. This provides security at Layer 7 and Layer 3: at the application and the network.
Getting started
Access, Cloud CNI and Aegis are generally available to all Enterprise customers. If you would like to learn more about protecting and accelerating your private applications, please reach out to your account team for more information and how to enable your account.
You’re visiting your family for the holidays and you connect to the WiFi, and then notice Netflix isn’t loading as fast as it normally does. You go to speed.cloudflare.com, fast.com, speedtest.net, or type “speed test” into Google Chrome to figure out if there is a problem with your Internet connection, and get something that looks like this:
If you want to see what that looks like for you, try it yourself here. But what do those numbers mean? How do those numbers relate to whether or not your Netflix isn’t loading or any of the other common use cases: playing games or audio/video chat with your friends and loved ones? Even network engineers find that speed tests are difficult to relate to the user experience of… using the Internet..
Amazingly, speed tests have barely changed in nearly two decades, even though the way we use the Internet has changed a lot. With so many more people on the Internet, the gaps between speed tests and the user’s experience of network quality are growing. The problem is so important that the Internet’s standards organization is paying attention, too.
From a high-level, there are three grand network test challenges:
Finding ways to efficiently and accurately measure network quality, and convey to end-users if and how the quality affects their experience.
When a problem is found, figuring out where the problem exists, be it the wireless connection, or one many cables and machines that make up the Internet.
Understanding a single user’s test results in context of their neighbors’, or archiving the results to, for example, compare neighborhoods or know if the network is getting better or worse.
Cloudflare is excited to announce a new Aggregated Internet Measurement (AIM) initiative to help address all three challenges. AIM is a new and open format for displaying Internet quality in a way that makes sense to end users of the Internet, around use cases that demand specific types of Internet performance while still retaining all of the network data engineers need to troubleshoot problems on the Internet. We’re excited to partner with Measurement Lab on this project and store all of this data in a publicly available repository that you can access to analyze the data behind the scores you see on your speed test page.
What is a speed test?
A speed test is a point-in-time measurement of your Internet connection. When you connect to any speed test, it typically tries to fetch a large file (important for video streaming), performs a packet loss test (important for gaming), measures jitter (important for video/VoIP calls), and latency (important for all Internet use cases). The goal of this test is to measure your Internet connection’s ability to perform basic tasks.
There are some challenges with this approach that start with a simple observation: At the “network-layer” of the Internet that moves data and packets around, there are three and only three measures that can be directly observed. They are,
available bandwidth, sometimes known as “throughput;
packet loss, which has to happen but not too much; and
latency, often referred to as the round-trip time (RTT).
These three attributes are tightly interwoven. In particular, the portion of available bandwidth that a user actually achieves (throughput) is directly affected by loss and latency. Your computer uses loss and latency to decide when to send a packet, or not. Some loss and latency is expected, even needed! Too much of either, and bandwidth starts to fall.
These are simple numbers, but their relationship is far from simple. Think about all the ways to add two numbers to equal as much as one-hundred, x + y ≤ 100. If x and y are just right, then they add to one hundred. However, there are many combinations of x and y that do. Worse is that if either x or y or both are a little wrong, then they add to less than one-hundred. In this example, x and y are loss and latency, and 100 is the available bandwidth.
There are other forces at work, too, and these numbers do not tell the whole story. But they are the only numbers that are directly observable. Their meaning and the reasons they matter for diagnosis are important, so let’s discuss each one of those in order and how Aggregated Internet Measurement tries to solve each of these.
What do the numbers in a speed test mean?
Most speed tests will run and produce the numbers you saw above: bandwidth, latency, jitter, and packet loss. Let’s break down each of these numbers one by one to explain what they mean:
Bandwidth
Bandwidth is the maximum throughput/capacity over a communication link. The common analogy used to define bandwidth is if your Internet connection is a highway, bandwidth is how many lanes the highway has and cars that fit on it. Bandwidth has often been called “speed” in the past because Internet Service Providers (ISPs) measure speed as the amount of time it takes to download a large file, and having more bandwidth on your connection can make that happen faster.
Packet loss
Packet loss is exactly what it sounds like: some packets are sent from a source to a destination, but the packets are not received by the destination. This can be very impactful for many applications, because if information is lost in transit en route to the receiver, it an e ifiult fr te recvr t udrsnd wt s bng snt (it can be difficult for the receiver to understand what is being sent).
Latency
Latency is the time it takes for a packet/message to travel from point A to point B. At its core, the Internet is composed of computers sending signals in the form of electrical signals or beams of light over cables to other computers. Latency has generally been defined as the time it takes for that electrical signal to go from one computer to another over a cable or fiber. Therefore, it follows that one way to reduce latency is to shrink the distance the signals need to travel to reach their destination.
There is a distinction in latency between idle latency and latency under load. This is because there are queues at routers and switches that store data packets when they arrive faster than they can be transmitted. Queuing is normal, by design, and keeps data flowing correctly. However, if the queues are too big, or when other applications behave very differently from yours, the connection can feel slower than it actually is. This event is called bufferbloat.
In our AIM test we look at idle latency to show you what your latency could be, but we also collect loaded latency, which is a better reflection of what your latency is during your day-to-day Internet experience.
Jitter
Jitter is a special way of measuring latency. It is the variance in latency on your Internet connection. If jitter is high, it may take longer for some packets to arrive, which can impact Internet scenarios that require content to be delivered in real time, such as voice communication.
A good way to think about jitter is to think about a commute to work along some route or path. Latency, alone, asks “how far am I from the destination measured in time?” For example, the average journey on a train is 40 minutes. Instead of journey time, jitter asks, “how consistent is my travel time?” Thinking about the commute, a jitter of zero means the train always takes 40 minutes. However, if the jitter is 15 then, well, the commute becomes a lot more challenging because it could take anywhere from 25 to 55 minutes.
But even if we understand these numbers, for all that they might tell us what is happening, they are unable to tell us where something is happening.
Is Wi-Fi or my Internet connection the problem?
When you run a speed test, you’re not just connecting to your ISP, you’re also connecting to your local network which connects to your ISP. And your local network may have problems of its own. Take a speed test that has high packet loss and jitter: that generally means something on the network could be dropping packets. Normally, you would call your ISP, who will often say something like “get closer to your Wi-Fi access point or get an extender”.
This is important — Wi-Fi uses radio waves to transmit information, and materials like brick, plaster, and concrete can interfere with the signal and make it weaker the farther away you get from your access point. Mesh Wi-Fi appliances like Nest Wi-Fi and Eero periodically take speed tests from their main access point specifically to help detect issues like this. So having potential quick solutions for problems like high packet loss and jitter and giving that to users up front can help users better ascertain if the problem is related to their wireless connection setup.
While this is true for most issues that we see on the Internet, it often helps if network operators are able to look at this data in aggregate in addition to simply telling users to get closer to their access points. If your speed test went to a place where your network operator could see it and others in your area, network engineers may be able to proactively detect issues before users report them. This not only helps users, it helps network providers as well, because fielding calls and sending out technicians for issues due to user configuration are expensive in addition to being time-consuming.
This is one of the goals of AIM: to help solve the problem before anyone picks up a phone. End users can get a series of tips that will help them understand what their Internet connection can and can’t do and how they can improve it in an easy-to-read format, and network operators can get all the data they need to detect last mile issues before anyone picks up a phone, saving time and money. Let’s talk about how that can work with a real example.
An example from real life
When you get a speed test result, the numbers you get can be confusing. This is because you may not understand how those numbers combine to impact your Internet experience. Let’s talk about a real life example and how that impacts you.
Say you work in a building with four offices and a main area that looks like this:
You have to make video calls to your clients all day, and you sit in the office the farthest away from the wireless access point. Your calls are dropping constantly, and you’re having an awful experience. When you run a speed test from your office, you see this result:
Metric
Far away from access point
Close to access point
Download Bandwidth
21.8 Mbps
25.7 Mbps
Upload Bandwidth
5.66 Mbps
5.26 Mbps
Unloaded Latency
19.6 ms
19.5 ms
Jitter
61.4 ms
37.9 ms
Packet Loss
7.7%
0%
How can you make sense of these? A network engineer would take a look at the high jitter and the packet loss and think “well this user probably needs to move closer to the router to get a better signal”. But you may take a look at these results and have no idea, and have to ask a network engineer for help, which could lead to a call to your ISP, wasting the time and money of everyone. But you shouldn’t have to consult a network engineer to figure out if you need to move your Wi-Fi access point, or if your ISP isn’t giving her a good experience.
Aggregated Internet Measurement assigns qualitative assessments to the numbers on your speed test to help you make sense of these numbers. We’ve created scenario-specific scores, which is a singular qualitative value that is calculated on a scenario level: we calculate different quality scores based on what you’re trying to do. To start, we’ve created three AIM scores: Streaming, Gaming, and WebChat/RTC. Those scores weigh each metric differently based on what Internet conditions are required for the application to run successfully.
The AIM scoring rubric assigns point values to your connection based on the tests. We’re releasing AIM with a “weighted score,” in which the point values are calculated based on what metrics matter the most in those scenarios. These point scores aren’t designed to be static, but to evolve based on what application developers, network operators, and the Internet community discover about how different performance characteristics affect application experience for each scenario — and it’s one more reason to post the data to M-Lab, so that the community can help design and converge on good scoring mechanisms.
Here is the full rubric and each of the point values associated with the metrics today:
Metric
0 points
5 points
10 points
20 points
30 points
50 points
Loss Rate
> 5%
< 5%
< 1%
Jitter
> 20 ms
< 20ms
< 10ms
Unloaded latency
> 100ms
< 50ms
< 20ms
< 10ms
Download Throughput
< 1Mbps
< 10Mbps
< 50Mbps
< 100Mbps
< 1000Mbps
Upload Throughput
< 1Mbps
< 10Mbps
< 50Mbps
< 100Mbps
< 1000Mbps
Difference between loaded and unloaded latency
> 50ms
< 50ms
< 20ms
< 10ms
And here’s a quick overview of what values matter and how we calculate scores for each scenario:
To calculate each score, we take the point values from your speed test and calculate that out of the total possible points for that scenario. So based on the result, we can give your Internet connection a judgment for each scenario: Bad, Poor, Average, Good, and Great. For example, for Video calls, packet loss, jitter, unloaded latency, and the difference between loaded and unloaded latency matter when determining whether your Internet quality is good for video calls. We add together the point values derived from your speed test values, and we get a score that shows how far away from the perfect video call experience your Internet quality is. Based on your speed test, here are the AIM scores from your office far away from the access point:
Metric
Result
Streaming Score
25/70 pts (Average)
Gaming Score
15/40 pts (Poor)
RTC Score
15/50 pts (Average)
So instead of saying “Your bandwidth is X and your jitter is Y”, we can say “Your Internet is okay for Netflix, but poor for gaming, and only average for Zoom”. In this case, moving the Wi-Fi access point to a more centralized location turned out to be the solution, and turned your AIM scores into this:
Metric
Result
Streaming Score
45/70 pts (Good)
Gaming Score
35/40 pts (Great)
RTC Score
35/50 pts (Great)
You can even see these results on the Cloudflare speed test today as a Network Quality Score:
In this particular case, there was no call required to the ISP, and no network engineers were consulted. Simply moving the access point closer to the middle of the office improved the experience for everyone, and no one needed to pick up the phone, providing a more seamless experience for everyone.
AIM takes the metrics that network engineers care about, and it translates them into a more human-readable metric that’s based on the applications you are trying to use. Aggregated data is anonymously stored in a public repository (in compliance with our privacy policy), so that your ISP can actually look up speed tests in your metro area and that use your ISP and get the underlying data to help translate user complaints into something that is actionable by network engineers. Additionally, policymakers and researchers can examine the aggregate data to better understand what users in their communities are experiencing to help lobby for better Internet quality.
Working conditions
Here’s an interesting question: When you run a speed test, where are you connecting to, and what is the Internet like at the other end of the connection? One of the challenges that speed tests often face is that the servers you run your test against are not the same servers that run or protect your websites. Because of this, the network paths your speed test may take to the host on the other side may be vastly different, and may even be optimized to serve as many speed tests as possible. This means that your speed test is not actually testing the path that your traffic normally takes when it’s reaching the applications you normally use. The tests that you ran are measuring a network path, but it’s not the network path you use on a regular basis.
Speed tests should be run under real-world network conditions that reflect how people use the Internet, with multiple applications, browser tabs, and devices all competing for connectivity. This concept of measuring your Internet connection using application-facing tools and doing so while your network is being used as much as possible is called measuring under working conditions. Today, when speed tests run, they make entirely new connections to a website that is reserved for testing network performance. Unfortunately, day-to-day Internet usage isn’t done on new connections to dedicated speed test websites. This is actually by design for many Internet applications, which rely on reusing the same connection to a website to provide a better performing experience to the end-user by eliminating costly latency incurred by establishing encryption, exchanging of certificates, and more.
AIM is helping to solve this problem in several ways. The first is that we’ve implemented all of our tests the same way our applications would, and measure them under working conditions. We measure loaded latency to show you how your Internet connection behaves when you’re actually using it. You can see it on the speed test today:
The second is that we are collecting speed test results against endpoints that you use today. By measuring speed tests against Cloudflare and other sites, we are showing end user Internet quality against networks that are frequently used in your daily life, which gives a better idea of what actual working conditions are.
AIM database
We’re excited to announce that AIM data is publicly available today through a partnership with Measurement Lab (M-Lab), and end-users and network engineers alike can parse through network quality data across a variety of networks. M-Lab and Cloudflare will both be calculating AIM scores derived from their speed tests and putting them into a shared database so end-users and network operators alike can see Internet quality from as many points as possible across a multitude of different speed tests.
For just a sample of what we’re seeing, let’s take a look at a visual we’ve made using this data plotting scores from only Cloudflare data per scenario in Tokyo, Japan for the first week of October:
Based on this, you can see that out of the 5,814 speed tests run, 50.7% of those users had a good streaming quality, but 48.2% were only average. Gaming is hard in Tokyo as 39% of users had a poor gaming experience, but most users had a pretty average-to-decent RTC experience. Let’s take a look at how that compares to some of the other cities we see:
City
Average Streaming Score
Average Gaming Score
Average RTC Score
Tokyo
31
13
16
New York
33
13
17
Mumbai
25
13
16
Dublin
32
14
18
Based on our data, we can see that most users do okay for video streaming except for Mumbai, which is a bit behind. Users generally have a pretty bad gaming experience due to high latency, but their RTC apps do slightly better, being generally average in all the locales.
Collaboration with M-Lab
M-Lab is an open, Internet measurement repository whose mission is to measure the Internet, save the data, and make it universally accessible and useful. In addition to providing free and open access to the AIM data for network operators, M-Lab will also be giving policymakers, academic researchers, journalists, digital inclusion advocates, and anyone who is interested access to the data they need to make important decisions that can help improve the Internet.
In addition to already being an established name in open sharing of Internet quality data to policymakers and academics, M-Lab already provides a “speed” test called Network Diagnostic Test (NDT) that is the same speed test you run when you type “speed test” into Google. By partnering with M-Lab, we are getting Aggregated Internet Measurement metrics from many more users. We want to partner with other speed tests as well to get the complete picture of how Internet quality is mapped across the world for as many users as possible. If you measure Internet performance today, we want you to join us to help show users what their Internet is really good for.
A bright future for Internet quality
We’re excited to put this data together to show Internet quality across a variety of tests and networks. We’re going to be analyzing this data and improving our scoring system, even open-sourcing it so that you can see how we are using speed test measurements to score Internet quality across a variety of different applications and even implement AIM yourself. Eventually we’re going to put our AIM scores in the speed test alongside all the tests you see today so that you can finally get a better understanding of what your Internet is good for.
If you’re running a speed test today, and you’re interested in partnering with us to help gather data on how users experience Internet quality, reach out to us and let’s work together to help make the Internet better.
Figuring out what your Internet is good for shouldn’t require you to become a networking expert; that’s what we’re here for. With AIM and our collaborators at MLab, we want to be able to tell you what your Internet can do and use that information to help make the Internet better for everyone.
For CIOs, networking is a hard process that is often made harder. Corporate networks have so many things that need to be connected and each one of them needs to be connected differently: user devices need managed connectivity through a Secure Web Gateway, offices need to be connected using the public Internet or dedicated connectivity, data centers need to be managed with their own private or public connectivity, and then you have to manage cloud connectivity on top of it all! It can be exasperating to manage connectivity for all these different scenarios and all their privacy and compliance requirements when all you want to do is enable your users to access their resources privately, securely, and in a non-intrusive manner.
Cloudflare helps simplify your connectivity story with Cloudflare One. Today, we’re excited to announce that we support direct cloud interconnection with our Cloudflare Network Interconnect, allowing Cloudflare to be your one-stop shop for all your interconnection needs.
Customers using IBM Cloud, Google Cloud, Azure, Oracle Cloud Infrastructure, and Amazon Web Services can now open direct connections from their private cloud instances into Cloudflare. In this blog, we’re going to talk about why direct cloud interconnection is important, how Cloudflare makes it easy, and how Cloudflare integrates direct cloud connection with our existing Cloudflare One products to bring new levels of security to your corporate networks built on top of Cloudflare.
Privacy in a public cloud
Public cloud compute providers are built on the idea that the compute power they provide can be used by anyone: your cloud VM and my cloud VM can run next to each other on the same machine and neither of us will know. The same is true for bits on the wire going in and out of these clouds: your bits and my bits may flow on the same wire, interleaved with each other, and neither of us will know that it’s happening.
The abstraction and relinquishment of ownership is comforting in one way but can be terrifying in another: neither of us need to run a physical machine and buy our own connectivity, but we have no guarantees about how or where our data and compute lives except that it lives in a datacenter with millions of other users.
For many enterprises, this isn’t acceptable: enterprises need compute that can only be accessed by them. Maybe the compute in the cloud is storing payment data that can’t be publicly accessible, and must be accessed through a private connection. Maybe the cloud customer has compliance requirements due to government restrictions that require the cloud not be accessible to the public Internet. Maybe the customer simply doesn’t trust public clouds or the public Internet and wants to limit exposure as much as possible. Customers want a private cloud that only they can access: a virtual private cloud, or a VPC.
To help solve this problem and ensure that only compute owners can access cloud compute that needs to stay private, clouds developed private cloud interconnects: direct cables from clouds to their customers. You may know them by their product names: AWS calls theirs DirectConnect, Azure calls theirs ExpressRoute, Google Cloud calls theirs Cloud Interconnect, OCI calls theirs FastConnect, and IBM calls theirs Direct Link. By providing private cloud connectivity to the customer datacenter, clouds satisfy the chief pain points for their customers: providing compute in a private manner. With these private links, VPCs are only accessible from the corporate networks that they’re plugged into, providing air-gapped security while allowing customers to turn over operations and maintenance of the datacenters to the clouds.
Privacy on the public Internet
But while VPCs and direct cloud interconnection have solved the problem of infrastructure moving to the cloud, as corporate networks move out of on-premise deployments, the cloud brings a completely new challenge: how do I keep my private cloud connections if I’m getting rid of my corporate network that connects all my resources together?
Let’s take an example company that connects a data center, an office, and an Azure instance together. Today, this company may have remote users that connect to applications hosted in either the datacenter, the office, or the cloud instance. Users in the office may connect to applications in the cloud, and all of it today is managed by the company. To do this, they may employ VPNs that tunnel the remote users into the data center or office before accessing the necessary applications. The office and data center are often connected through MPLS lines that are leased from connectivity providers. And then there’s the private IBM instance that is connected via IBM Direct Link. That’s three different connectivity providers for CIOs to manage, and we haven’t even started talking about access policies for the internal applications, firewalls for the cross-building network, and implementing MPLS routing on top of the provider underlay.
Cloudflare One helps simplify this by allowing companies to insert Cloudflare as the network for all the different connectivity options. Instead of having to run connections between buildings and clouds, all you need to do is manage your connections to Cloudflare.
WARP manages connectivity for remote users, Cloudflare Network Interconnect provides the private connectivity from data centers and offices to Cloudflare, and all of that can be managed with Access policies for policing applications and Magic WAN to provide the routing that gets your users where they need to go. When we released Cloudflare One, we were able to simplify the connectivity story to look like this:
Before, users with private clouds had to either expose their cloud instances to the public Internet, or maintain suboptimal routing by keeping their private cloud instances connected to their data centers instead of directly connecting to Cloudflare. This means that these customers have to maintain their private connections directly to their data centers, which adds toil to a solution that is supposed to be easier:
Now that CNI supports cloud environments, this company can open a private cloud link directly into Cloudflare instead of into their data center. This allows the company to use Cloudflare as a true intermediary between all of their resources, and they can rely on Cloudflare to manage firewalls, access policies, and routing for all of their resources, trimming the number of vendors they need to manage for routing down to one: just Cloudflare!
Once everything is directly connected to Cloudflare, this company can manage their cross-resource routing and firewalls through Magic WAN, they can set their user policies directly in Access, and they can set egress policies out to the public Internet through any one of Cloudflare’s 250+ data centers through Gateway. All the offices and clouds talk to each other on a hermetically sealed network with no public access or publicly shared peering links, and most importantly, all of these security and privacy efforts are done completely transparently to the user.
So let’s talk about how we can get your cloud connected to us.
Quick cloud connectivity
The most important thing with cloud connectivity is how easy it should be: you shouldn’t have to spend lots of time waiting for cross-connects to come up, get LOAs, monitor light levels and do all the things that you would normally do when provisioning connectivity. Getting connected from your cloud provider should be cloud-native: you should just be able to provision cloud connectivity directly from your existing portals and follow the existing steps laid out for direct cloud connection.
That’s why our new cloud support makes it even easier to connect with Cloudflare. We now support direct cloud connectivity with IBM, AWS, Azure, Google Cloud, and OCI so that you can provision connections directly from your cloud provider into Cloudflare like you would to a datacenter. Moving private connections to Cloudflare means you don’t have to maintain your own infrastructure anymore, Cloudflare becomes your infrastructure, so you don’t have to worry about ordering cross-connects into your devices, getting LOAs, or checking light levels. To show you how easy this can be, let’s walk through an example of how easy this is using Google Cloud.
The first step to provisioning connectivity in any cloud is to request a connection. In Google Cloud, you can do this by selecting “Private Service Connection” in the VPC network details:
That will allow you to select a partner connection or a direct connection. In Cloudflare’s case, you should select a partner connection. Follow the instructions to select a connecting region and datacenter site, and you’ll get what’s called a connection ID, which is used by Google Cloud and Cloudflare to identify the private connection with your VPC:
You’ll notice in this screenshot that it says you need to configure the connection on the partner side. In this case, you can take that key and use it to automatically provision a virtual connection on top of an already existing link. The provisioning process consists of five steps:
Assigning unique VLANs to your connection to ensure a private connection
Assigning unique IP addresses for a BGP point-to-point connection
Provisioning a BGP connection on the Cloudflare side
Passing this information back to Google Cloud and creating the connection
Accepting the connection and finishing BGP provisioning on your VPC
All of these steps are performed automatically in seconds so that by the time you get your IP address and VLANs, Cloudflare has already provisioned our end of the connection. When you accept and configure the connection, everything will be ready to go, and it’s easy to start privately routing your traffic through Cloudflare.
Now that you’ve finished setting up your connection, let’s talk about how private connectivity to your cloud instances can integrate with all of your Cloudflare One products.
Private routing with Magic WAN
Magic WAN integrates extremely well with Cloud CNI, allowing customers to connect their VPCs directly to the private network built with Magic WAN. Since the routing is private, you can even advertise your private address spaces reserved for internal routing, such as your 10.0.0.0/8 space.
Previously, your cloud VPC needed to be publicly addressable. But with Cloud CNI, we assign a point-to-point IP range, and you can advertise your internal spaces back to Cloudflare and Magic WAN will route traffic to your internal address spaces!
Secure authentication with Access
Many customers love Cloudflare Tunnel in combination with Access for its secure paths to authentication servers hosted in cloud providers. But what if your authentication server didn’t need to be publicly accessible at all? With Access + Cloud CNI, you can connect your authentication services to Cloudflare and Access will route all your authentication traffic through the private path back to your service without needing the public Internet.
Manage your cloud egress with Gateway
While you may want to protect your cloud services from ever being accessed by anyone not on your network, sometimes your cloud services need to talk out to the public Internet. Luckily for you, Gateway has you covered and with Cloud CNI you can get a private path to Cloudflare which will manage all of your egress policies, ensuring that you can carefully watch your cloud service outbound traffic from the same place you monitor all other traffic leaving your network.
Cloud CNI: safe, performant, easy
Cloudflare is committed to making zero trust and network security easy and unobtrusive. Cloud CNI is another step towards ensuring that your network is as easy to manage as everything else so that you can stop focusing on how to build your network, and start focusing on what goes on top of it.
If you’re interested in Cloud CNI, contact us today to get connected to a seamless and easy Zero Trust world.
Every Innovation Week, Cloudflare looks at our network’s performance versus our competitors. In past weeks, we’ve focused on how much faster we are compared to reverse proxies like Akamai, or platforms that sell edge compute that compares to our Supercloud, like Fastly and AWS. For CIO Week, we want to show you how our network stacks up against competitors that offer forward proxy services. These products are part of our Zero Trust platform, which helps secure applications and Internet experiences out to the public Internet, as opposed to our reverse proxy which protects your websites from outside users.
We’ve run a series of tests comparing our Zero Trust services with Zscaler. We’ve compared our ZT Application protection product Cloudflare Access against Zscaler Private Access (ZPA). We’ve compared our Secure Web Gateway, Cloudflare Gateway, against Zscaler Internet Access (ZIA), and finally our Remote Browser Isolation product, Cloudflare Browser Isolation, against Zscaler Cloud Browser Isolation. We’ve found that Cloudflare Gateway is 58% faster than ZIA in our tests, Cloudflare Access is 38% faster than ZPA worldwide, and Cloudflare Browser Isolation is 45% faster than Zscaler Cloud Browser Isolation worldwide. For each of these tests, we used 95th percentile Time to First Byte and Response tests, which measure the time it takes for a user to make a request, and get the start of the response (Time to First Byte), and the end of the response (Response). These tests were designed with the goal of trying to measure performance from an end-user perspective.
In this blog we’re going to talk about why performance matters for each of these products, do a deep dive on what we’re measuring to show that we’re faster, and we’ll talk about how we measured performance for each product.
Why does performance matter?
Performance matters because it impacts your employees’ experience and their ability to get their job done. Whether it’s accessing services through access control products, connecting out to the public Internet through a Secure Web Gateway, or securing risky external sites through Remote Browser Isolation, all of these experiences need to be frictionless.
Say Anna at Acme Corporation is connecting from Sydney out to Microsoft 365 or Teams to get some work done. If Acme’s Secure Web Gateway is located far away from Anna in Singapore, then Anna’s traffic may go out of Sydney to Singapore, and then back into Sydney to reach her email. If Acme Corporation is like many companies that require Anna to use Microsoft Outlook in online mode, her performance may be painfully slow as she waits for her emails to send and receive. Microsoft 365 recommends keeping latency as low as possible and bandwidth as high as possible. That extra hop Anna has to take through her gateway could decrease throughput and increase her latency, giving Anna a bad experience.
In another example, if Anna is connecting to a hosted, protected application like Jira to complete some tickets, she doesn’t want to be waiting constantly for pages to load or to authenticate her requests. In an access-controlled application, the first thing you do when you connect is you log in. If that login takes a long time, you may get distracted with a random message from a coworker or maybe will not want to tackle any of the work at all. And even when you get authenticated, you still want your normal application experience to be snappy and smooth: users should never notice Zero Trust when it’s at its best.
If these products or experiences are slow, then something worse might happen than your users complaining: they may find ways to turn off the products or bypass them, which puts your company at risk. A Zero Trust product suite is completely ineffective if no one is using it because it’s slow. Ensuring Zero Trust is fast is critical to the effectiveness of a Zero Trust solution: employees won’t want to turn it off and put themselves at risk if they barely know it’s there at all.
Services like Zscaler may outperform many older, antiquated solutions, but their network still fails to measure up to a highly performant, optimized network like Cloudflare’s. We’ve tested all of our Zero Trust products against Zscaler’s equivalents, and we’re going to show you that we’re faster. So let’s dig into the data and show you how and why we’re faster in three critical Zero Trust scenarios, starting with Secure Web Gateway: comparing Cloudflare Gateway to Zscaler Internet Access (ZIA).
Cloudflare Gateway: a performant secure web gateway at your doorstep
A secure web gateway needs to be fast because it acts as a funnel for all of an organization’s Internet-bound traffic. If a secure web gateway is slow, then any traffic from users out to the Internet will be slow. If traffic out to the Internet is slow, then users may be prompted to turn off the Gateway, putting the organization at risk of attack.
But in addition to being close to users, a performant web gateway needs to also be well-peered with the rest of the Internet to avoid slow paths out to websites users want to access. Remember that traffic through a secure web gateway follows a forward proxy path: users connect to the proxy, and the proxy connects to the websites users are trying to access. Therefore, it behooves the proxy to be well-connected to ensure that the user traffic can get where it needs to go as fast as possible.
When comparing secure web gateway products, we pitted the Cloudflare Gateway and WARP client against Zscaler Internet Access (ZIA), which performs the same functions. Fortunately for Cloudflare users, Gateway and Cloudflare’s network is not only embedded deep into last mile networks close to users, but is also one of the most well peered networks in the world. We use our most peered network to be 55% faster than ZIA for Gateway user scenarios. Below is a box plot showing the 95th percentile response time for Cloudflare, Zscaler, and a control set that didn’t use a gateway at all:
Secure Web Gateway – Response Time
95th percentile (ms)
Control
142.22
Cloudflare
163.77
Zscaler
365.77
This data shows that not only is Cloudflare much faster than Zscaler for Gateway scenarios, but that Cloudflare is actually more comparable to not using a secure web gateway at all rather than Zscaler.
To best measure the end-user Gateway experience, we are looking at 95th percentile response time from the end-user: we’re measuring how long it takes for a user to go through the proxy, have the proxy make a request to a website on the Internet, and finally return the response. This measurement is important because it’s an accurate representation of what users see.
When we measured against Zscaler, we had our end user client try to access five different websites: a website hosted in Azure, a Cloudflare-protected Worker, Google, Slack, and Zoom: websites that users would connect to on a regular basis. In each of those instances, Cloudflare outperformed Zscaler, and in the case of the Cloudflare-protected Worker, Gateway even outperformed the control for 95th percentile Response time. Here is a box plot showing the 95th percentile responses broken down by the different endpoints we queried as a part of our tests:
No matter where you go on the Internet, Cloudflare’s Gateway outperforms Zscaler Internet Access (ZIA) when you look at end-to-end response times. But why are we so much faster than Zscaler? The answer has to do with something that Zscaler calls proxy latency.
Proxy latency is the amount of time a user request spends on a Zscaler machine before being sent to its destination and back to the user. This number completely excludes the time it takes a user to reach Zscaler, and the time it takes Zscaler to reach the destination and restricts measurement to the milliseconds Zscaler spends processing requests.
Zscaler’s latency SLA says that 95% of your requests will spend less than 100 ms on a Zscaler device. Zscaler promises that the latency they can measure on their edge, not the end-to-end latency that actually matters, will be 100ms or less for 95% of user requests. You can even see those metrics in Zscaler’s Digital Experience to measure for yourself. If we can get this proxy latency from Zscaler logs and compare it to the Cloudflare equivalent, we can see how we stack up to Zscaler’s SLA metrics. While we don’t yet have those metrics exposed to customers, we were able to enable tracing on Cloudflare to measure the Cloudflare proxy latency.
The results show that at the 95th percentile, Zscaler was exceeding their SLA, and the Cloudflare proxy latency was 7ms. Furthermore, when our proxy latency was 100ms (meeting the Zscaler SLA), their proxy latencies were over 10x ours. Zscaler’s proxy latency accounts for the difference in performance we saw at the 95th percentile, being anywhere between 140-240 ms slower than Cloudflare for each of the sites. Here are the Zscaler proxy latency values at different percentiles for all sites tested, and then broken down by each site:
Zscaler Internet Access (ZIA)
P90 Proxy Latency (ms)
P95 Proxy Latency (ms)
P99 Proxy Latency (ms)
P99.9 Proxy Latency (ms)
P99.957 Proxy Latency (ms)
Global
06.0
142.0
625.0
1,071.7
1,383.7
Azure Site
97.0
181.0
458.5
1,032.7
1,291.3
Zoom
206.0
254.2
659.8
1,297.8
1,455.4
Slack
118.8
186.2
454.5
1,358.1
1,625.8
Workers Site
97.8
184.1
468.3
1,246.2
1,288.6
Google
13.7
100.8
392.6
848.9
1,115.0
At the 95th percentile, not only were their proxy latencies out of SLA, those values show the difference between Zscaler and Cloudflare: taking Zoom as an example, if Zscaler didn’t have the proxy latency, they would be on-par with Cloudflare and the control. Cloudflare’s equivalent of proxy latency is so small that using us is just like using the public Internet:
Cloudflare Gateway
P90 Proxy Latency (ms)
P95 Proxy Latency (ms)
P99 Proxy Latency (ms)
P99.9 Proxy Latency (ms)
P99.957 Proxy Latency (ms)
Global
5.6
7.2
15.6
32.2
101.9
Tubes Test
6.2
7.7
12.3
18.1
19.2
Zoom
5.1
6.2
9.6
25.5
31.1
Slack
5.3
6.5
10.5
12.5
12.8
Workers
5.1
6.1
9.4
17.3
20.5
Google
5.3
7.4
12.0
26.9
30.2
The 99.957 percentile may seem strange to include, but it marks the percentile at which Cloudflare’s proxy latencies finally exceeded 100ms. Cloudflare’s 99.957 percentile proxy latency is even faster than Zscaler’s 90th percentile proxy latency. Even on the metric Zscaler cares about and holds themselves accountable for despite proxy latency not being the metric customers care about, Cloudflare is faster.
Getting this view of data was not easy. Existing testing frameworks like Catchpoint are unsuitable for this task because performance testing requires that you run the ZIA client or the WARP client on the testing endpoint. We also needed to make sure that the Cloudflare test and the Zscaler test are running on similar machines in the same place to measure performance as good as possible. This allows us to measure the end-to-end responses coming from the same location where both test environments are running:
In our setup, we put three VMs in the cloud side by side: one running Cloudflare WARP connecting to our Gateway, one running ZIA, and one running no proxy at all as a control. These VMs made requests every three minutes to the five different endpoints mentioned above and logged the HTTP browser timings for how long each request took. Based on this, we are able to get a user-facing view of performance that is meaningful.
A quick summary so far: Cloudflare is faster than Zscaler when we’re protecting users from the public Internet through a secure web gateway from an end-user perspective. Cloudflare is even faster than Zscaler according to Zscaler’s small definition of what performance through a secure web gateway means. But let’s take a look at scenarios where you need access for specific applications through Zero Trust access.
Cloudflare Access: the fastest Zero Trust proxy
Access control needs to be seamless and transparent to the user: the best compliment for a Zero Trust solution is employees barely notice it’s there. Services like Cloudflare Access and Zscaler Private Access (ZPA) allow users to cache authentication information on the provider network, ensuring applications can be accessed securely and quickly to give users that seamless experience they want. So having a network that minimizes the number of logins required while also reducing the latency of your application requests will help keep your Internet experience snappy and reactive.
Cloudflare Access does all that 38% faster than Zscaler Private Access (ZPA), ensuring that no matter where you are in the world, you’ll get a fast, secure application experience:
ZT Access – Time to First Byte (Global)
95th Percentile (ms)
Cloudflare
849
Zscaler
1,361
When we drill into the data, we see that Cloudflare is consistently faster everywhere around the world. For example, take Tokyo, where Cloudflare’s 95th percentile time to first byte times are 22% faster than Zscaler:
ZT Access – 95th Percentile Time to First Byte (Chicago)
New Sessions (ms)
Existing Sessions (ms)
Cloudflare
1,032
293
Zscaler
1,373
338
When we evaluate Cloudflare against Zscaler for application access scenarios, we are looking at two distinct scenarios that need to be measured individually. The first scenario is when a user logs into their application and has to authenticate. In this case, the Zero Trust Access service will direct the user to a login page, the user will authenticate, and then be redirected to their application.
This is called a new session, because no authentication information is cached or exists on the Access network. The second scenario is called an existing session, when a user has already been authenticated and that authentication information can be cached. This scenario is usually much faster, because it doesn’t require an extra call to an identity provider to complete.
We like to measure these scenarios separately, because when we look at 95th percentile values, we would almost always be looking at new sessions if we combined new and existing sessions together. But across both scenarios, Cloudflare is consistently faster in every region. Here’s how this data looks when you take a location Zscaler is more likely to have good peering in: users in Chicago, IL connecting to an application hosted in US-Central.
ZT Access – 95th Percentile Time to First Byte (Chicago)
New Sessions (ms)
Existing Sessions (ms)
Cloudflare
1,032
293
Zscaler
1,373
338
Cloudflare is faster overall there as well. Here’s a histogram of 95th percentile response times for new connections overall:
You’ll see that Cloudflare’s network really gives a performance boost on login, helping find optimal paths back to authentication providers to retrieve login details. In this test, Cloudflare never takes more than 2.5 seconds to return a login response, but half of Zscaler’s 95th percentile responses are almost double that, at around four seconds. This would suggest that Zscaler’s network isn’t peered as well, which causes latency early on. But it may also suggest that Zscaler may do better when the connection is established and everything is cached. But on an existing connection, Cloudflare still comes out ahead:
Zscaler and Cloudflare do match up more evenly at lower latency buckets, but Cloudflare’s response times are much more consistent, and you can see that Zscaler has half of their responses which take almost a second to load. This further highlights how well-connected we are: because we’re in more places, we provide a better application experience, and we don’t have as many edge cases with high latency and poor application performance.
We like to separate these new and existing sessions because it’s important to look at similar request paths to do a proper comparison. For example, if we’re comparing a request via Zscaler on an existing session and a request via Cloudflare on a new session, we could see that Cloudflare was much slower than Zscaler because of the need to authenticate. So when we contracted a third party to design these tests, we made sure that they took that into account.
For these tests, Cloudflare contracted Miercom, a third party who performed a set of tests that was intended to replicate an end-user connecting to a resource protected by Cloudflare or Zscaler. Miercom set up application instances in 12 locations around the world, and devised a test that would log into the application through various Zero Trust providers to access certain content. The test methodology is described as follows, but you can look at the full report from Miercom detailing their test methodology here:
User connects to the application from a browser mimicked by a Catchpoint instance – new session
User authenticates against their identity provider
User accesses resource
User refreshes the browser page and tries to access the same resource but with credentials already present – existing session
This allows us to look at Cloudflare versus Zscaler for application performance for both new and existing sessions, and we’ve shown that we’re faster. We’re faster in secure web gateway scenarios too.
But what if you want to access resources on the public Internet and you don’t have a ZT client on your device? To do that, you’ll need remote browser isolation.
Cloudflare Browser Isolation: your friendly neighborhood web browser
Remote browser isolation products have a very strong dependency on the public Internet: if your connection to your browser isolation product isn’t good, then your browser experience will feel weird and slow. Remote browser isolation is extraordinarily dependent on performance to feel smooth and seamless to the users: if everything is fast as it should be, then users shouldn’t even notice that they’re using browser isolation. For this test, we’re pitting Cloudflare Browser Isolation against Zscaler Cloud Browser Isolation.
Cloudflare once again is faster than Zscaler for remote browser isolation performance. Comparing 95th percentile time to first byte, Cloudflare is 45% faster than Zscaler across all regions:
ZT RBI – Time to First Byte (Global)
95th Percentile (ms)
Cloudflare
2,072
Zscaler
3,781
When you compare the total response time or the ability for a browser isolation product to deliver a full response back to a user, Cloudflare is still 39% faster than Zscaler:
ZT RBI – Time to First Byte (Global)
95th Percentile (ms)
Cloudflare
2,394
Zscaler
3,932
Cloudflare’s network really shines here to help deliver the best user experience to our customers. Because Cloudflare’s network is incredibly well-peered close to end-user devices, we are able to drive down our time to first byte and response times, helping improve the end-user experience.
To measure this, we went back to Miercom to help get us the data we needed by having Catchpoint nodes connect to Cloudflare Browser Isolation and Zscaler Cloud Browser Isolation across the world from the same 14 locations and had devices simulating clients try to reach applications through the browser isolation products in each locale. For more on the test methodology, you can refer to that same Miercom report, linked here.
Next-generation performance in a Zero Trust world
In a non-Zero Trust world, you and your IT teams were the network operator — which gave you the ability to control performance. While this control was comforting, it was also a huge burden on your IT teams who had to manage middle mile connections between offices and resources. But in a Zero Trust world, your network is now… well, it’s the public Internet. This means less work for your teams — but a lot more responsibility on your Zero Trust provider, which has to manage performance for every single one of your users. The better your Zero Trust provider is at improving end-to-end performance, the better an experience your users will have and the less risk you expose yourself to. For real-time applications like authentication and secure web gateways, having a snappy user experience is critical.
A Zero Trust provider needs to not only secure your users on the public Internet, but it also needs to optimize the public Internet to make sure that your users continuously stay protected. Moving to Zero Trust doesn’t just reduce the need for corporate networks, it also allows user traffic to flow to resources more naturally. However, given your Zero Trust provider is going to be the gatekeeper for all your users and all your applications, performance is a critical aspect to evaluate to reduce friction for your users and reduce the likelihood that users will complain, be less productive, or turn the solutions off. Cloudflare is constantly improving our network to ensure that users always have the best experience, and this comes not just from routing fixes, but also through expanding peering arrangements and adding new locations. It’s this tireless effort that makes us the fastest Zero Trust provider.
Check out our compare page for more detail on how Cloudflare’s network architecture stacks up against Zscaler.
One of the many magical things about the Internet is that it doesn’t have a country. The Internet doesn’t go through customs, it doesn’t need a visa, and it doesn’t speak any one language. To reach the world’s greatest information innovation, a user – no matter what country they’re in – only needs a device with a connection. The Internet will take care of the rest. At Cloudflare, part of our role is to make sure every person on the planet with an Internet connection has a good experience, whether they’re in a next-generation market or a current-gen market. In this blog we’re going to talk about how we define next-generation markets, how we help people in these markets get faster access to the websites and applications they use on a daily basis, and how we make it easy for developers to deploy services geographically close to users in next-generation markets.
What are next-generation markets?
Next-generation markets are the future of the Internet. Not only are there billions of people who will use the Internet more, as affordable access increases, but the trends in application development already point towards the mobile-first, sometimes mobile-only, way of providing content and services. The Internet may look different (more desktop-centric) in the so-called Global North or countries the IMF defines as Advanced Economies, but those differences will shrink as application developers build products for all markets, not just current-generation markets. We call these markets next-generation markets as opposed to using the IMF or World Bank definitions because we want to classify markets by how users interact with the Internet as opposed to how their governments interact with the global economy. Compared to North America and Europe, where users access the Internet through a combination of desktop computers and mobile devices, users in next-generation markets access the Internet via mobile devices 50% of the time or more, sometimes even as high as 80%. Some examples of these markets are China, India, Indonesia, Thailand, and countries in Africa and the Middle East.
Most of this traffic is also using HTTP/S, which is the industry standard for secure, performant, reliable communication on the Internet. HTTP/S is used broadly across the Internet about 88% of the time. Countries and regions that have a higher percentage of mobile users will also have a higher percentage of traffic over HTTP/S, as shown in the table below. For example, countries in Africa and APJC use HTTP/S more than any other protocol, beating all other regions. By contrast, in North America, more traffic uses older protocols like SMTP, FTP, or RTMP.
Region
% of traffic that is HTTP/S
Africa (AFR)
92%
Asia Pacific, Japan, and China (APJC)
92%
Western North America (WNAM)
90%
Eastern North America (ENAM)
89%
Oceania (OC)
89%
Eastern Europe (EEUR)
88%
Middle East (ME)
85%
Western Europe (WEUR)
83%
South America (SAM)
64%
The prevalence of mobile Internet connections is also represented by the types of applications developers are building in these regions: local models of popular applications designed specifically for local users in mind. For example, ecommerce companies like Carousell and ticketing companies like BookMyShow rely on mobile and app-based users for most of their business that is unique to the region they’re based in. Getting more broad, apps like Instagram and TikTok famously do not have web or desktop-based applications, and they encourage users to be mobile-only. These markets are next-generation because most of their users are using mobile devices and applications like Carousell, which are designed for a mobile, performant Internet.
In these markets there are two groups who have similar concerns but are different enough that we need to address them separately: users, and the application developers who build the apps for users. They both want one thing: to be fast. But being fast manifests itself in slightly different ways for users versus application developers. Let’s talk about each group and how Cloudflare helps solve their problems.
Next-generation users
Users in these markets care about observed experience: they want real-time interaction with their applications. This is no different from what users in other markets expect from the Internet, but achieving this is much harder over mobile networks, which tend to have higher latency, loss, and lower bandwidth.
Another challenge in next-generation markets is, roughly speaking, how geographically dispersed Internet connectivity is. Imagine you are sending a message to someone on the other side of a park, but you have to play telephone: the only way you can send the message is by telling someone next to you, and they tell it to the person next to them, and so on and so forth until the message reaches the other side of the park. That may look a little something like this:
If you’ve ever played Telephone, you know that this is optimistic: even when someone is right next to you, it’s unlikely that they’ll be able to get all the message you’re trying to send. But let’s say that the optimistic case is real: in this above scenario, you’re able to transmit the message between people end-to-end across the park. Now let’s say you take half of those people away, meaning that everyone who’s sending the message needs to shout twice as far. That’s when things can start to get a little more garbled:
In this case, the receiver of the message didn’t hear the message properly the first time, and asked for the sender to yell it again. This process, called retransmission, reduces the amount of data that can be sent at once over the Internet. Retransmission rates depend on the cellular density of wireless networks, the light signal of fiber optic cables, and on the broader Internet, the number of hops between the end user and the website or receiver of the connection.
Retransmission rates are impacted by something called packet loss, when some packets don’t make it to the receiver end due to things like poor signal transmission, or errors on devices in the path between sender and receiver. When packet loss occurs, protocols on the Internet like the Transmission Control Protocol (TCP) will reduce the amount of data that can be transmitted over the connection. The amount of data that can be sent at one time is called the congestion window, and the protocol will shrink the congestion window to help preserve the connection until TCP is sure that the connection won’t drop packets again. This process of shrinking the congestion window is called backoff, and the congestion window will shrink exponentially when packet loss is first detected, and then will increase linearly over time. This means that connections and networks with high retransmission rates can seriously impact how users interact with websites and applications on the Internet.
The Edge Partner Program gets us closer to users
Since most users in next-generation markets are mobile, getting closer to users is paramount for a fast experience. Mobile devices tend to be slower because interference with the radio waves can often add additional instability to the Internet connection, which can lead to poor performance. In next generation markets, there could be added challenges from issues like power consumption: if a power grid can’t support large radio towers, smaller ones with a smaller range are required, which can further add instability, increase retransmission, and add latency.
However, in addition to challenges in the local network, there’s another challenge with interconnecting these networks to the rest of the Internet. Networks in next-generation markets may not be able to reach as many peering points as larger networks and may need to optimize their peering by going into Internet Exchanges that have denser connectivity with more networks, even if they’re farther away. For example, places like Frankfurt, London, and Singapore are especially useful for interconnecting a large amount of networks in a few Internet Exchanges in regions like the Middle East, Africa, and Asia respectively.
The downside for end-users is that in order to connect to the Internet and the sites they care about, networks in these markets have to go a long way to get to the rest of the Internet. For content that is cacheable, meaning it doesn’t change often, sending requests for data (and the response) across oceans and continents is a poor use of Internet capacity. Worse, it leads to problems like congestion, retransmission, and packet loss, which in turn cause poor performance.
One area where we see latency directly impact Internet performance is in TLS, or Transport Layer Security. TLS ensures that an end-user interaction with an application is private. When TLS is established, it performs a three-way handshake that requires the end user to initiate a connection, the server to respond, and the end-user to acknowledge the response before any data can be sent. The farther away an end-user is from a website or CDN that performs this handshake, the longer it will take, and the worse performance will be:
Getting close to users often improves not just end-user performance, but the basic stability of an Internet experience on the network. Cloudflare helps solve this through our Edge Partner Program (EPP), which allows ISPs to integrate their networks physically and locally with Cloudflare, bringing us as close as possible to their users. When we embed a Cloudflare node in an ISP, we shorten the physical distance between end-users and Cloudflare, and by extension, the amount of time end-users’ data requests spend on the backbone of the Internet. Over the past four years, 80% of our 107 new cities have been in next-generation markets to help improve our cached and dynamic performance.
Another additional benefit of having the content and services delivered close to end users: we can use our network intelligence to route traffic out of your last mile network and where it needs to go, helping improve the user experience out to the rest of the Internet as well. On average, Argo Smart Routing helps improve dynamic and uncached content performance by over 30%, which is especially valuable if the content users need to fetch is far away from their devices.
Now that we’ve talked about why the Edge Partner Program is important and how it can theoretically help users, let’s talk about one set of those deployments in Saudi Arabia to show you how it actually helps users.
Edge Partner Program in Saudi Arabia
A great example of a place that can benefit greatly from the Edge Partner Program is Saudi Arabia, a country whose closest peering to Cloudflare was previously in Frankfurt. As we mentioned above, for many countries in the Middle East, Frankfurt is where these networks choose to peer with other networks despite Frankfurt being over 5,300 km away from Riyadh.
But by landing Cloudflare network hardware in the mobile network Mobily, we were able to improve median RTT by over 50% for their users. Before our deployment, end users on Mobily had a median RTT of 131ms via Frankfurt. Once we added three sites in Dammam, Riyadh, and Jeddah on this network, Mobily users saw a huge decrease in latency, to the point where the median RTT (131ms) before these deployments now became around the 85th percentile afterwards. Before, one out of every two requests took longer than 131ms, while afterward almost every request (85% of them) took less than that time. So users in Saudi Arabia get a faster path to the sites and services they care about through their ISP and Cloudflare. Everyone wins.
Staying local also helps reduce retransmission and the amount of data that has to be sent over these networks. Consider two data centers: one of our largest data centers in Los Angeles, California, and one of those new data centers in Jeddah, Saudi Arabia. Los Angeles takes traffic from all over the world: from places like China, Indonesia, Australia, as well as locally in the Los Angeles area. Take a look at the average retransmission rate for connections coming into Los Angeles from all over the world:
The average rate is quite high for Los Angeles, mostly due to users from all places like China, Indonesia, Taiwan, South Korea, and Japan coming to Los Angeles for their websites. But if you take a look at Jeddah, you’ll see a different story:
Users in Jeddah have a much lower, more constant retransmission rate because users on Mobily are terminating their connections closer to their devices. By being embedded in Mobily’s network, we decrease the number of hops that are needed and also make the hops that travel over less reliable paths shorter. Initial requests are more likely to succeed the first time and don’t need multiple tries to succeed.
WARP in next-generation markets
Cloudflare WARP is a great privacy-preserving tool for users in any market to help ensure a privacy-first, performant path to the Internet. While users around the world can use WARP, users in next-generation markets are ahead of the curve when it comes to WARP adoption. Here are the total year-to-date WARP downloads from the Apple App Store:
We’ve recently made changes to add WARP support to more Edge Partner locations, which provides a faster, more private experience to these locations. Now even more WARP users can see better performance in more locations.
WARP pairs well with the Cloudflare network to ensure a fast, private Internet experience. In a growing number of networks in next-generation markets, WARP users will connect to Cloudflare in the same location as their ISP before going out to the rest of the Internet. If the websites they are trying to connect to are protected by Cloudflare, then they get a fast path to the websites they care about through Cloudflare. If not, then the users can still get sent out through Cloudflare to the websites they need while preserving their privacy throughout the connection.
Next-generation developers
Let’s say you’re an app developer in Muscat, Oman, trying to make a new shopping app specific to your market. To compete with other existing apps, you not only need a differentiator, but you need an in-app performance experience that is on par with your competitors while also being able to deliver your service and make money. Global shopping apps offer a real-time browsing experience that your regional app also needs to meet, or beat. If outside competitors have a faster shopping app than you, it doesn’t really matter if your app is “the Amazon of Oman” if actual Amazon is faster in the country.
But in next-generation markets, performance is often a differentiator between their applications and incumbent applications — often because incumbent apps tend to not perform as well in these markets. This is often because incumbent applications will host using cloud providers that may not offer services in-region. For example, users in the APJC region may often see their traffic get sent to Hong Kong, Singapore, or even Los Angeles because that is the closest cloud datacenter to them. So when you’re making “the Amazon of Indonesia” and you need your app to be faster than Amazon’s in Indonesia, having your application be as local as possible to your users will help realize your app’s appeal: a specialized, high-performance experience for Indonesian users.
It’s worth noting that many cloud locations do offer local options for developers: if you’re in Oman, there is a local cloud datacenter to you where you can host your service. But most startup and smaller businesses built in next-generation markets will opt to host their app in larger, farther away locations to optimize for cost.
For example, localizing in the Middle East can be very costly compared to farther away options. Developers in the Middle East may be able to save 30% or more on their monthly data transfer costs simply by moving to Frankfurt; a region that is farther away from their users but is cheaper for them to serve out of. Application developers are constantly trying to balance cost with user experience, and may make some tradeoffs for user experience that allow them to optimize costs in the short term. So even though Cloudflare-protected developers are taking advantage of the local peering from the Edge Partner Program, developers in Oman may end up sending their users to Frankfurt anyways because that’s where they chose to host their services to save costs. In many cases, this is a tradeoff developers in these markets have to make: making your service slightly less performant to enable it to run more cheaply.
Cloudflare Workers in country
Luckily for these developers, Cloudflare’s developer platform allows application developers to build a distributed application that runs right where their users are, so they don’t have to choose between performance and cost savings. Taking the Saudi Arabia case, users on Mobily now get their traffic terminated locally in Jeddah. This is okay from an end-to-end perspective because it means that Cloudflare gets to find the fastest path through the Internet using technologies like Argo Smart Routing which will help them save 30% on their Time to First Byte if their users have to go out of the country. But what if users didn’t ever have to leave Jeddah at all?
By moving applications to Cloudflare, you can push more and more of your applications to these data centers in next-generation markets, ensuring that users get a better experience in-country. For example, let’s consider the same comparison data we used to evaluate ourselves versus Lambda@Edge during our Developer Week performance tests. The purpose of this comparison is to show how far your users have to travel if you’re hosting application compute on Cloudflare versus on AWS. When you compare us versus Lambda@Edge, we have a significant advantage for P95 TCP Connection time in next-generation markets. This chart and table below show that in Africa and Asia Cloudflare Workers is about 3x as fast as Lambda@Edge from AWS:
P95 Connect (ms) Africa
Asia
Lambda JS
358
330
Cloudflare JS
104
111
95th percentile TCP connect time (ms)
This means that operations and functions that get built into Cloudflare get executed closer to the user, ensuring better end-to-end performance. The Lambda@Edge scenarios are bad enough on their own, but consider that not everything can be done in Lambda@Edge and may need to reach AWS instances that may sit even farther away than the AWS edge. Cloudflare’s supercloud looks especially attractive because we allow you to build everything you need in an application entirely local to end-users. This helps ensure next-generation markets see the same performance as the rest of the world for the applications they care about.
Making everyone faster everywhere
Cloudflare helps users in next-generation markets get connected to the Internet faster, get connected to the Internet more privately, and helps their applications get closer to where they are. Through initiatives like our Edge Partner Program, we can help bring applications closer to users in next-generation markets, and through our powerful developer platform, we can ensure that applications built for these markets have world-class performance.
If you’re an application developer, and you haven’t yet tried out our powerful developer platform and all it can do, try it today!
If you’re a network operator, and you want to have Cloudflare in your network to help bring a next-level experience to your users, check out our Edge Partner Program and let’s get connected.
Users in next-generation markets are the future of the Internet: they are how we expect most people on the Internet to act in the future. Cloudflare is uniquely positioned to ensure that all of these users and developers can have the Internet experience they expect.
Cloudflare is building the fastest network in the world. But we don’t want you to just take our word for it. To demonstrate it, we are continuously testing ourselves versus everyone else to make sure we’re the fastest. Since it’s Developer Week, we wanted to provide an update on how our Workers products perform against the competition, as well as our overall network performance.
Earlier this year, we compared ourselves to Fastly’s Compute@Edge and overall we were faster. This time, not only did we repeat the tests, but we also added AWS Lambda@Edge to help show how we stack up against more and more competitors. The summary: we offer the fastest developer platform on the market. Let’s talk about how we build our network to help make you faster, and then we’ll get into how that translates to our developer platform.
Latest update on network performance
We have two updates on data: a general network performance update, and then data on how Workers compares with Compute@Edge and Lambda@Edge.
To quantify global network performance, we have to get enough data from around the world, across all manner of different networks, comparing ourselves with other providers. We used Real User Measurements (RUM) to fetch a 100kB file from different providers. Users around the world report the performance of different providers. The more users who report the data, the higher fidelity the signal is. The goal is to provide an accurate picture of where different providers are faster, and more importantly, where Cloudflare can improve. You can read more about the methodology in the original Speed Week blog post here.
During Cloudflare One Week (June 2022), we shared that we were faster in more of the most reported networks than our competitors. Out of the top 3,000 networks in the world (by number of IPv4 addresses advertised), here’s a breakdown of the number of networks where each provider is number one in p95 TCP Connection Time, which represents the time it takes for a user on a given network to connect to the provider. This data is from Cloudflare One Week (June 2022):
Here is what the distribution looks like for the top 3,000 networks for Developer Week (November 2022):
In addition to being the fastest across popular networks, Cloudflare is also committed to being the fastest provider in every country.
Using data on the top 3,000 networks from Cloudflare One Week (June 2022), here’s what the world map looks like (Cloudflare is in orange):
And here’s what the world looks like while looking at the top 3,000 networks for Developer Week (November 2022):
Cloudflare became #1 in more countries in Europe and Asia, specifically Russia, Ukraine, Kazakhstan, India, and China, further delivering on our mission to be the fastest network in the world. So let’s talk about how that network helps power the Supercloud to be the fastest developer platform around.
How we’re comparing developer platforms
It’s been six months since we published our initial tests, but here’s a quick refresher. We make comparisons by measuring time to connect to the network, time spent completing requests, and overall time to respond. We call these numbers connect, wait, and response. We’ve chosen these numbers because they are critical components of a request that need to be as fast as possible in order for users to see a good experience. We can reduce the connect times by peering as close as possible to the users. We can reduce the wait times by optimizing code execution to be as fast as possible. If we optimize those two processes, we’ve optimized the response, which represents the end-to-end latency of a request.
Test methodology
To measure connect, wait, and response, we perform three tests against each provider: a simple no-op JavaScript function, a complex JavaScript function, and a complex Rust function. We don’t do a simple Rust function because we expect it to take almost no time at all, and we already have a baseline for end-to-end functionality in the no-op JavaScript function since many providers will often compile both down to WebAssembly.
Here are the functions for each of them:
JavaScript no-op:
async function getErrorResponse(event, message, status) {
  return new Response(message, {status: status, headers: {'Content-Type': 'text/plain'}});
}
JavaScript hard function:
function testHardBusyLoop() {
  let value = 0;
  let offset = Date.now();

  for (let n = 0; n < 15000; n++) {
    value += Math.floor(Math.abs(Math.sin(offset + n)) * 10);
  }

  return value;
}
Rust hard function:
fn test_hard_busy_loop() -> i32 {
  let mut value = 0;
  let offset = Date::now().as_millis();

  for n in 0..15000 {
    value += (((offset + n) as f64).sin().abs() * 10.0) as i32;
  }

  value
}
We’re trying to test how good each platform is at optimizing compute in addition to evaluating how close each platform is to end-users. However, for this test, we did not run a Rust test on Lambda@Edge because it did not natively support our Rust function without uploading a WASM binary that you compile yourself. Since Lambda@Edge does not have a true first-class developer platform and tooling to run Rust, we decided to exclude the Rust scenarios for Lambda@Edge. So when we compare numbers for Lambda@Edge, it will only be for the JavaScript simple and JavaScript hard tests.
Measuring Workers performance from real users
To collect data, we use two different methods: one from a third party service called Catchpoint, and a second from our own network performance benchmarking tests. First, we used Catchpoint to gather a set of data from synthetic probes. Catchpoint is an industry standard “synthetic” testing tool, and measurements collected from real users distributed around the world. Catchpoint is a monitoring platform that has around 2,000 total endpoints distributed around the world that can be configured to fetch specific resources and time for each test. Catchpoint is useful for network providers like us as it provides a consistent, repeatable way to measure end-to-end performance of a workload, and delivers a best-effort approximation for what a user sees.
Catchpoint has backbone nodes that are embedded in ISPs around the world. That means that these nodes are plugged into ISP routers just like you are, and the traffic goes through the ISP network to each endpoint they are monitoring. These can approximate a real user, but they will never truly replicate a real user. For example, the bandwidth for these nodes is 100% dedicated for platform monitoring, as opposed to your home Internet connection, where your Internet experience will be a mixed bag of different use cases, some of which won’t talk to Workers applications at all.
For this new test, we chose 300 backbone nodes that are embedded in last mile ISPs around the world. We filtered out nodes in cloud providers, or in metro areas with multiple transit options, trying to remove duplicate paths as much as possible.
We cross-checked these tests with our own data set, which is collected from users connecting to free websites when they are served 1xxx error pages, just like how we collect data for global network performance. When a user sees this error page, that page that will execute these tests as a part of rendering and upload performance metrics on these calls to Cloudflare.
We also changed our test methodology to use paid accounts for Fastly, Cloudflare, and AWS.
Workers vs Compute@Edge vs Lambda@Edge
This time, let’s start off with the response times to show how we’re doing end-to-end:
Test
95th percentile response (ms)
Cloudflare JavaScript no-op
479
Fastly JavaScript no-op
634
AWS JavaScript no-op
1,400
Cloudflare JavaScript hard
471
Fastly JavaScript hard
683
AWS JavaScript hard
1,411
Cloudflare Rust hard
472
Fastly Rust hard
638
We’re fastest in all cases. Now let’s look at connect times, which show us how fast users connect to the compute platform before doing any actual compute:
Test
95th percentile connect (ms)
Cloudflare JavaScript no-op
82
Fastly JavaScript no-op
94
AWS JavaScript no-op
295
Cloudflare JavaScript hard
82
Fastly JavaScript hard
94
AWS JavaScript hard
297
Cloudflare Rust hard
79
Fastly Rust hard
94
Note that we don’t expect these times to differ based on the code being run, but we extract them from the same set of tests, so we’ve broken them out here.
But what about wait times? Remember, wait times represent time spent computing the request, so who has optimized their platform best? Again, it’s Cloudflare, although Fastly still has a slight edge on the hard Rust test (which we plan to beat by further optimization):
Test
95th percentile wait (ms)
Cloudflare JavaScript no-op
110
Fastly JavaScript no-op
122
AWS JavaScript no-op
362
Cloudflare JavaScript hard
115
Fastly JavaScript hard
178
AWS JavaScript hard
367
Cloudflare Rust hard
125
Fastly Rust hard
122
To verify these results, we compared the Catchpoint results to our own data set. Here is the p95 TTFB for the JavaScript and Rust hard loops for Fastly, AWS, and Cloudflare from our data:
Cloudflare is faster on JavaScript and Rust calls. These numbers also back up the slight compute advantage for Fastly on Rust calls.
The big takeaway from this is that in addition to Cloudflare being faster for the time spent processing requests in nearly every test, Cloudflare’s network and performance optimizations as a whole set us apart and make our Workers platform even faster for everything. And, of course, we plan to keep it that way.
Your application, but faster
Latency is an important component of the user experience, and for developers, being able to ensure their users can do things as fast as possible is critical for the success of an application. Whether you’re building applications in Workers, D1, and R2, hosting your documentation in Pages, or even leveraging Workers as part of your SaaS platform, having your code run in the SuperCloud that is our global network will ensure that your users see the best experience they possibly can.
Our network is hyper-optimized to make your code as fast as possible. By using Cloudflare’s network to run your applications, you can focus on making the best possible application possible and rest easy knowing that Cloudflare is providing you the best user experience possible. This is because Cloudflare’s developer platform is built on top of the world’s fastest network. So go out and build your dreams, and know that we’ll make your dreams as fast as they can possibly be.
In 2018, we launched the Cloudflare Peering Portal, which allows network operators to see where your traffic is coming from and to identify the best possible places to interconnect with Cloudflare. We’re excited to announce that we’ve made it even easier to interconnect with Cloudflare through this portal by removing Cloudflare-specific logins and allowing users to request sessions in the portal itself!
We’re going to walk through the changes we’ve made to make peering easier, but before we do that, let’s talk a little about peering: what it is, why it’s important, and how Cloudflare is making peering easier.
What is peering and why is it important?
Put succinctly, peering is the act of connecting two networks together. If networks are like towns, peering is the bridges, highways, and streets that connect the networks together. There are lots of different ways to connect networks together, but when networks connect, traffic between them flows to their destination faster. The reason for this is that peering reduces the number of Border Gateway Protocol (BGP) hops between networks.
What is BGP?
For a quick refresher, Border Gateway Protocol (or BGP for short) is a protocol that propagates instructions on how networks should forward packets so that traffic can get from its origin to its destination. BGP provides packets instructions on how to get from one network to another by indicating which networks the packets need to go through to get to the destination, prioritizing the paths with the smallest number of hops between origin and destination. BGP sees networks as Autonomous Systems (AS), and each AS has its own number. For example, Cloudflare’s ASN is 13335.
In the example below, AS 1 is trying to send packets to AS 3, but there are two possible paths the packets can go:
The BGP decision algorithm will select the path with the least number of hops, meaning that the path the packets will take is AS 1 → AS 2 → AS 3.
When two networks peer with each other, the number of networks needed to connect AS 1 and AS 3 is reduced to one, because AS 1 and AS 3 are directly connected with each other. But “connecting with” another network can be kind of vague, so let’s be more specific. In general, there are three ways that networks can connect with other networks: directly through Private Network Interconnects (PNI), at Internet Exchanges (IX), and through transit networks that connect with many networks.
Private Network Interconnect
A private network interconnect (PNI) sounds complicated, but it’s really simple at its core: it’s a cable connecting two networks to each other. If networks are in the same datacenter facility, it’s often easy for these two networks to connect and by doing so over a private connection, they can get dedicated bandwidth to each other as well as reliable uptime. Cloudflare has a product called Cloudflare Network Interconnect (CNI) that allows other networks to directly connect their networks to Cloudflare in this way.
Internet Exchanges
An Internet exchange (IX) is a building that specifically houses many networks in the same place. Each network gets one or more ports, and plugs into what is essentially a shared switch so that every network has the potential to interconnect. These switches are massive and house hundreds, even thousands of networks. This is similar to a PNI, but instead of two networks directly connecting to each other, thousands of networks connect to the same device and establish BGP sessions through that device.
Fabienne Serriere: An optical patch panel of the AMS-IX Internet exchange point, in Amsterdam, Netherlands. CC BY-SA 3.0
At Internet Exchanges, traffic is generally exchanged between networks free of charge, and it’s a great way to interconnect a network with other networks and save money on bandwidth between networks.
Transit networks
Transit networks are networks that are specifically designed to carry packets between other networks. These networks peer at Internet Exchanges and directly with many other networks to provide connectivity for your network without having to get PNIs or IX presence with networks. This service comes at a price, and may impact network performance as the transit network is an intermediary hop between your network and the place your traffic is trying to reach. Transit networks aren’t peering, but they do peering on your behalf.
No matter how you may decide to connect your network to Cloudflare, we have an open peering policy, and strongly encourage you to connect your networks directly to Cloudflare. If you’re interested, you can get started by going through the Cloudflare Peering Portal, which has now been made even easier. But let’s take a second to talk about why peering is so important.
Why is peering important?
Peering is important on the Internet for three reasons: it distributes traffic across many networks reducing single points of failure of the Internet, it often reduces bandwidth prices on the Internet making overall costs lower, and it improves performance by removing network hops. Let’s talk about each of those benefits.
Peering improves the overall uptime of the Internet by distributing traffic across multiple networks, meaning that if one network goes down, traffic from your network will still be able to reach your users. Compare that to connecting to a transit network: if the transit network has an issue, your network will be unreachable because that network was the only thing connecting your network to the rest of the Internet (unless you decide to pay multiple transit providers). With peering, any individual network failure will not completely impact the ability for your users to reach your network.
Peering helps reduce your network bandwidth costs because it distributes the cost you pay an Internet Exchange for a port across all the networks you interconnect with at the IX. If you’re paying \$1000/month for a port at an IX, and you’re peered with 100 networks there, you’re effectively paying \$10/network, as opposed to paying \$1000/month to connect to one transit network. Furthermore, many networks including Cloudflare have open peering policies and settlement free peering, which means we don’t charge you to send traffic to us or the other way round, making peering even more economical.
Peering also improves performance for Internet traffic by bringing networks closer together, reducing the time it takes for a packet to go from one network to another. The more two networks peer with each other, the more physical places on the planet they can exchange traffic directly, meaning that users everywhere see better performance.
Here’s an example. Janine is trying to order food from Acme Food Services, a site protected by Cloudflare. She lives in Boston and connects to Cloudflare via her ISP. Acme Food Services has their origin in Boston as well, so for Janine to see the fastest performance, her ISP should connect to Cloudflare in Boston and then Cloudflare should route her traffic directly to the Acme origin in Boston. Unfortunately for Janine, her ISP doesn’t peer with Cloudflare in Boston, but instead peers with Cloudflare in New York: meaning that when Janine connects to Acme, her traffic is going through her ISP to New York before it reaches Cloudflare, and then all the way back to Boston to the Acme origins!
But with proper peering, we can ensure that traffic is routed over the fastest possible path to ensure Janine connects to Cloudflare in Boston and everything stays local:
Fortunately for Janine, Cloudflare peers with over 10,000 networks in the world in over 275 locations, so high latency on the network is rare. And every time a new network peers with us, we help make user traffic even faster. So now let’s talk about how we’ve made peering even easier.
Cloudflare, along with many other networks, rely on PeeringDB as a source of truth for which networks are present on the Internet. PeeringDB is a community-maintained database of all the networks that are present on the Internet and what datacenter facilities and IXs they are present at, as well as what IPs are used for peering at each public location. Many networks, including Cloudflare, require you to have an account on PeeringDB before you can initiate a peering session with their network.
You can now use that same PeeringDB account to log into the Cloudflare Peering Portal directly, saving you the need to make a specific Cloudflare Peering Portal account.
When you log into the Cloudflare Peering Portal, simply click on the PeeringDB login button and enter your PeeringDB credentials. Cloudflare will then use this login information to determine what networks you are responsible for and automatically load data for those networks.
From here you can see all the places your network exchanges traffic with Cloudflare. You can see all the places you currently have direct peering with us, as well as locations for potential peering: places you could peer with us but currently don’t. Wouldn’t it be great if you could just click a button and configure a peering session with Cloudflare directly from that view? Well now you can!
Requesting sessions in the Peering Portal
Starting today, you can now request peering sessions with Cloudflare at Internet Exchanges right from the peering portal, making it even easier to get connected with Cloudflare. When you’re looking at potential peering sessions in the portal, you’ll now see a button that will allow you to verify your peering information is correct, and if it is to proceed with a peering request:
Once you click that button, a ticket will go immediately to our network team to configure a peering session with you using the details already provided in PeeringDB. Our network team looks at whether we already have existing connections with your network at that location, and also what the impact to your Internet traffic will be if we peer with you there. Once we’ve evaluated these variables, we’ll proceed to establish a BGP session with you at the location and inform you via email that you’ve already provided via PeeringDB. Then all you have to do is accept the BGP sessions, and you’ll be exchanging traffic with Cloudflare!
Peer with Cloudflare today!
It has never been easier to peer with Cloudflare, and our simplified peering portal will make it even easier to get connected. Visit our peering portal today and get started on the path of faster, cheaper connectivity to Cloudflare!
In September 2021, we shared extensive benchmarking results of 1,000 networks all around the world. The results showed that on a range of tests (TCP connection time, time to first byte, time to last byte), and on different measures (p95, mean), Cloudflare was the fastest provider in 49% of the top 1,000 networks around the world.
Since then, we’ve expanded our testing to cover not just 1,000 but 3,000 networks, and we’ve worked to continuously improve performance, with the ultimate goal of being the fastest everywhere and an intermediate goal to grow the number of networks where we’re the fastest by at least 10% every Innovation Week. We met that goal Platform Week May 2022), and we’re carrying the work over to Cloudflare One Week (June 2022).
We’re excited to share that Cloudflare has the fastest provider in 1,290 of the top 3,000 most reported networks, up from 1,280 even one month ago during Platform Week.
Measuring what matters
To quantify global network performance, we have to get enough data from around the world, across all manner of different networks, comparing ourselves with other providers. We use Real User Measurements (RUM) to fetch a 100kB file from different providers. Users around the world report the performance of different providers.
The more users who report the data, the higher fidelity the signal is. The goal is to provide an accurate picture of where different providers are faster, and more importantly, where Cloudflare can improve. You can read more about the methodology in the original Speed Week blog post here.
Latest data on network performance
Here’s how the breakdown of the fastest networks looked during Platform Week (May 2022):
Here’s how that graph looks now during Cloudflare One Week (June 2022):
In addition to being the fastest across popular networks, Cloudflare is also committed to being the fastest provider in every country.
Here’s how the map of the fastest provider by country looked during Platform Week (May 2022):
And here’s how that map looks during Cloudflare One Week (June 2022):
Cloudflare became faster in more Eastern European countries during this time specifically.
Network performance in a Zero Trust world
A zero trust provider needs to not only secure your users on the public Internet, but it also needs to optimize the public Internet. Moving to Zero Trust doesn’t just reduce the need for corporate networks, it also allows user traffic to flow to resources more naturally.
However, given your Zero Trust provider is going to be the gatekeeper for all your users and all your applications, performance is a critical aspect to evaluate Cloudflare is constantly improving our network to ensure that users always have the best experience, and this comes not just from routing fixes, but also through expanding peering arrangements and adding new locations.
This tireless effort helps make us faster in more networks than anyone else, and allows us to deliver all of our services with high performance that customers expect. We know many organizations are just starting their Zero Trust journey, and that a priority of that project is to improve user experience, and we’re excited to keep obsessing over the performance in our network to make sure your teams have a seamless experience in any location.
Interested in learning more about how our Zero Trust products benefit from these improvements? Check out the full roster of our announcements from Cloudflare One Week.
In September 2021, we shared extensive benchmarking results of 1,000 networks all around the world. The results showed that on a range of tests (TCP connection time, time to first byte, time to last byte), and on different measures (p95, mean), Cloudflare was the fastest provider in 49% of networks around the world. Since then, we’ve worked to continuously improve performance, with the ultimate goal of being the fastest everywhere and an intermediate goal to grow the number of networks where we’re the fastest by at least 10% every Innovation Week. We met that goal during Security Week (March 2022), and we’re carrying the work over to Platform Week (May 2022).
We’re excited to update you on the latest results, but before we do: after running with this benchmark for nine months, we’ve also been looking for ways to improve the benchmark itself — to make it even more representative of speeds in the real world. To that end, we’re expanding our measured networks from 1,000 to 3,000, to give an even more accurate sense of real world performance across the globe.
In terms of results: using the old benchmark of 1,000 networks, we’re the fastest in 69% of them. In this new expanded view of 3,000 networks, we’re the fastest in 42% of them. We’ve demonstrated a consistent ability to improve our performance against what we measure, and we’re excited to optimize our performance and lift our ranking in these smaller networks all around the world.
In addition to sharing a general update on where our network performance stands, we’re also sharing updated performance metrics on our Workers platform (given that it’s Platform Week!). We’ve done an extensive benchmark of Cloudflare Workers vs Fastly’s Compute@Edge.
We’ve got the results below, but before we get to that, we want to spend a bit of time on our revamped measurements.
Revamped measurements
A few months ago, we discussed the performance of Cloudflare Workers, as compared to other similar offerings out there. We compared our performance to Fastly’s Compute@Edge, showing that Workers was significantly faster.
After we published our results, there were questions and suggestions on how to improve our testing methodology (including sharing more detail about where and how we ran the tests). As we re-ran tests for this iteration, we made some small changes, and also worked to address the suggestions from the community. Let’s talk about what’s changed and why.
Measuring what matters
To quantify global network performance, we have to get enough data from around the world, across all manner of different networks, comparing ourselves with other providers. We used Real User Measurements (RUM) to fetch a 100kB file from different providers. Users around the world report the performance of different providers. The more users who report the data, the higher fidelity the signal is. The goal is to provide an accurate picture of where different providers are faster, and more importantly, where Cloudflare can improve. You can read more about the methodology in the original Speed Week blog post here.
In the process of quantifying network performance, it became clear where we needed to expand our scope in measuring performance. After Security Week, we were fastest in 71% of networks, and we decided that we wanted to expand the pool of networks from the top 1,000 most reported networks to the top 3,000 most reported networks.
We’ve shown the graph detailing the number of networks where Cloudflare is #1 in network performance, but from here on out, we will only be showing this graph in percentages of networks where we are number one out of 100%, since the denominator will be changing going forward as we set ourselves harder and harder challenges.
Benchmarking for everyone
At the time we published our earlier set of benchmarks, we had an unnecessary “no benchmarking” clause in our Terms of Service. It has since been removed. It’s been a while since we’ve worried about such things, and the clause lived past its intended life in our ToS.
We’ve done the work to show where we are the fastest provider, and it’s important that everyone else be able to validate that independently. We’re also confident that well run benchmarks will only help further improve performance for Workers, other Cloudflare products, and the Internet as a whole. Game on.
Measuring Workers performance from real users
To run our tests, we used Catchpoint, an industry standard “synthetic” testing tool, and measurements collected from real users distributed around the world. Catchpoint is a monitoring platform that has around 2,000 total endpoints distributed around the world that can be configured to fetch specific resources and time each test. Catchpoint is useful for network providers like us as it provides a consistent, repeatable way to measure end-to-end performance of a workload, and delivers a best-effort approximation for what a user sees.
Catchpoint has a series of backbone nodes that are embedded in ISPs around the world. That means that these nodes are plugged into ISP routers just like you are, and the traffic goes through the ISP network to each endpoint they are monitoring. These can approximate a real user, but they will never truly approximate a real user. For example, the bandwidth for these nodes is 100% dedicated for platform monitoring, as opposed to your home Internet connection, where your Internet experience will be a mixed bag of different use cases, some of which won’t talk to Workers applications at all.
For this new test, we chose 300 backbone nodes that are embedded in last mile ISPs around the world. We filtered out nodes in cloud providers, or in metro areas with multiple transit options, trying to remove duplicate paths as much as possible.
We cross-checked these tests with our own data set, which is collected from users connecting to free websites when they are served 1xxx error pages, similar to how we collect data for global network performance. When a user sees this error page, that page will contain a call that will execute these tests and upload performance metrics on these calls to Cloudflare. Users would run these calls independently of the error page, ensuring that Cloudflare did not get a head start in these tests.
We also changed our test methodology to use paid accounts for both Fastly and Cloudflare.
Changing the numbers we look at
For this new test, we decided to look at Wait time in addition to Time to First Byte. Time to First Byte is the time it takes for a web server to establish a connection, fetch the content, and deliver the first byte of a response to a user, and Wait time is the time the client spends waiting for the server to send back that first byte after the connection is established. We are using this particular measurement to look at the actual time it takes for the server to compute the request on the machine. Wait time is a subcomponent of TTFB, and contains the machine processing time, the time it takes the server to give the response to the socket to be sent back to the user, and the time it takes the response to reach the user. There could be latency in passing the request to the socket on the machine, but we measured the actual time it took the server to send the request for all tests and found it to be zero:
So we would calculate the wait time as the amount of time spent on the box plus the time it took the server to send the packet over the wire to the client.
However, others have noted that using Time to First Byte to measure performance of serverless computing solutions could potentially be misleading because user performance measurements can be influenced by more than just the time spent computing functions on the machine. For example, things like the time to connect to the server, DNS resolution, and cache times can impact Time to First Byte. Time to connect to the server (connect) can be impacted by how well peered a network is (or how poorly). DNS resolution can be impacted by client behavior, local DNS behavior, or by the performance of the provider’s DNS. Cache times can be driven by the performance of the cache on the server itself.
We agree that it is difficult to tease out computing time from Time to First Byte. To look at that particular aspect of serverless computing, we look at Wait, which is a value that contains the least amount of variables: we aren’t caching anything during our tests, DNS isn’t part of the wait time, and the only thing impacting Wait aside from the time spent on the machine is the Connect time.
However, since we’re trying to measure the end user experience and not just the amount of time spent on a server, we want to use both the Wait and TTFB so that we can show the time spent both on the server and how that impacts end-to-end performance.
What’s in the test?
For our test this time around, we decided to measure three things: a simple JavaScript function like last time, a complex JavaScript function, and a complex Rust function. Here are the functions for each of them:
async function getErrorResponse(event, message, status) {
  return new Response(message, {status: status, headers: {'Content-Type': 'text/plain'}});
}
function testHardBusyLoop() {
  let value = 0;
  let offset = Date.now();

  for (let n = 0; n < 15000; n++) {
    value += Math.floor(Math.abs(Math.sin(offset + n)) * 10);
  }

  return value;
}
fn test_hard_busy_loop() -> i32 {
  let mut value = 0;
  let offset = Date::now().as_millis();

  for n in 0..15000 {
    value += (((offset + n) as f64).sin().abs() * 10.0) as i32;
  }

  value
}
The goals of each of these tests is simple: test the ability of Workers and Compute@Edge to perform compute actions.
Latest update on network performance
We have two updates on data: a general network performance update, and then data on how Workers compares with Compute@Edge.
At Security Week (March 2022), we shared that we were faster in more of the most reported networks than our competitors. Out of the top 1,000 networks in the world (by number of IPv4 addresses advertised), here’s a breakdown of how many providers are number one in p95 TCP Connection Time, which represents the time it takes for a user to connect to the provider. This data is from Security Week (March 2022):
Recognizing that we are now looking at different numbers of networks, here is what the distribution looks like for the top 3,000 networks for Platform Week (May 2022):
In addition to being the fastest across popular networks, Cloudflare is also committed to being the fastest provider in every country.
Using data on the top 1,000 networks from Full Stack Week (March 2022), here’s what the world map looks like:
And here’s what the world looks like while looking at the top 3,000 networks:
Cloudflare became #1 in more countries in Africa and Europe, some of which previously did not have enough samples to officially be counted to one provider or another.
Workers vs Compute@Edge
Moving on from general network results, what does performance look like when comparing serverless compute products across providers — in this case, Cloudflare Workers performance to Compute@Edge? Looking at the Catchpoint data, the first thing we noticed was Cloudflare is faster than Fastly in all tests at the 95th percentile for Time to First Byte:
Test
95th percentile TTFB (ms)
Cloudflare JS no-op
469
Fastly JS no-op
596
Cloudflare JS hard
481
Fastly JS hard
631
Cloudflare Rust hard
493
Fastly Rust hard
577
Cloudflare is significantly faster at all tests compared to Fastly. But let’s dig into why that is. Looking at p95 Wait, we can see that Cloudflare does have an edge in most tests related to compute on-box:
Test
95th Percentile Wait (ms)
Cloudflare JS no-op
123
Fastly JS no-op
123
Cloudflare JS hard
136
Fastly JS hard
170
Cloudflare Rust hard
160
Fastly Rust hard
121
Looking at the Wait times, you can see that Cloudflare does have a significant edge in on-box performance, except in Rust, where Fastly claims their workloads are the most optimized. This data backs up that claim. But why is Fastly so much slower on Time to First Byte? The answer lies in the rest of the request. While latency spent in compute matters, it only matters in conjunction with the rest of the network performance. And Cloudflare has an advantage over Fastly in Connect times and SSL establishment times:
Test
95th Percentile Connect (ms)
95th Percentile SSL (ms)
Cloudflare JS no-op
81
289
Fastly JS no-op
88
293
Cloudflare JS hard
81
286
Fastly JS hard
88
291
Cloudflare Rust hard
81
288
Fastly Rust hard
88
295
Cloudflare’s hyper-optimized web stack allows us to process all requests faster, meaning that Workers code gets started faster. Having that extra head start in Connect and SSL allows us to further increase the distance between us and Compute@Edge.
To verify these results, we compared the Catchpoint results to our own data set. Here is the p95 TTFB for the JavaScript and Rust hard loops for both Fastly and Cloudflare from our data:
As you can see, Cloudflare is faster on JavaScript and Rust calls. And when you look at wait time, you will see that outside of Catchpoint results, Cloudflare even beats Fastly in the Rust hard tests:
The big takeaway from this is that in addition to Cloudflare being faster for the time spent processing requests, Cloudflare’s network and performance optimizations as a whole set us apart and make our Workers platform even faster.
A fast network makes for a faster developer platform
Cloudflare’s commitment to building the fastest network allows us to deliver unparalleled performance for all applications, including our developer tools. Whether it’s by accelerating Cloudflare Pages performance by hosting on every single Cloudflare server, or by deploying Workers in 275 cities without developers needing to configure a thing, Cloudflare’s developer tools are all built on top of Cloudflare’s global network. We’re committed to making our network faster so that our developer products are as performant as they could possibly be.
And it’s not just the developer platform. Cloudflare runs an integrated and optimized stack that includes DDoS protection, WAF, rate limiting, bot management, caching, SSL, smart routing, and more. By having a single software stack we are able to offer the widest range of features while ensuring that performance (no matter which of our products you use) remains excellent. We don’t want you to have to compromise performance to get security or vice versa.
As part of the recently passed Infrastructure Investment and Jobs Act (Infrastructure Act) in the United States, Congress asked the Federal Communications Commission (FCC) to finalize rules that would require broadband Internet access service providers (ISPs) display a “label” that provides consumers with a simple layout that discloses prices, introductory rates, data allowances, broadband performance, management practices, and more.
A sample Broadband Nutrition Facts from the original 2016 FCC proposal.
While the idea of a label is not new (the original design dates from 2016), its inclusion in the Infrastructure Act has reinvigorated the effort to provide consumers with information sufficient to enable them to make informed choices when purchasing broadband service. The FCC invited the public to submit comments on the existing label, and explain how the Internet has changed since 2016. We’re sharing Cloudflare’s comments here as well to call attention to this opportunity to make essential information accessible, accurate, and transparent to the consumer. We encourage you to read our full comments. (All comments, from Cloudflare and others, are available for public consumption on the FCC website.)
The Internet, 6 years ago
Six years can change a lot of things, and the Internet is no exception. For example, Tiktok barely existed as a company at the start of 2016; now it is the most popular site in the world. The global population that uses the Internet increased from 3.4 billion people in 2016 to 5.2 billion in 2021, which represents a growth of 52%. According to Statista, users in 2015 spent around 5.5 hours with digital media; now users spend almost 8 hours with digital media. The amount of data consumed on the Internet in 2021 was 79 zettabytes, which is a number that is expected to more than double in only two years. Users are more dependent on the Internet now than ever before.
Users being more dependent on the Internet has been amplified during the pandemic. According to Pew Research, 90% of American adults say the Internet has been essential or important for them personally during the coronavirus outbreak. Forty percent of American adults say they used digital technology or the Internet in new or different ways compared with before the beginning of the outbreak. A home broadband connection is no longer primarily for recreation, but a necessity for equitable access to education, healthcare, and as of 2020, it’s now even essential for many employment opportunities.
With that dependency, though, comes a higher expectation of quality. In 2016, users were more tolerant of poor performance: they were just happy if their Internet worked. Furthermore, applications were typically less latency sensitive: things like VoIP and video chats were less prevalent than they are today. Nowadays, however, video chats are almost ubiquitous: we use them at work and at home with increasing frequency. If these applications are slow or perform poorly, it’s hugely impactful to the user experience. We think of it as “our Internet cutting out,” and we lose the engagement with whomever we’re talking to.
Our increased dependence on the Internet has in turn increased our expectations for good Internet performance.
Your Internet should be graded on performance
Because the Internet has become more focused on performance in 2022, we believe that your Internet providers should disclose to you how good they are at providing a good experience for these applications that are now mission critical.
Previously, performance was measured by bandwidth, or the size of the pipe between you and what you want to access. However, bandwidth is much more widely available today than it was six years ago. Median download throughput increased from 39 Mbps in 2016 to 194 Mbps in 2021. This increase in throughput has opened up new uses of home Internet connections, and new opportunities to look holistically at the Quality of Experience (QoE) of home broadband. We believe that metrics beyond bandwidth such as latency and jitter (the variance in latency) have grown appreciably in importance and that should be reflected in policy going forward.
Transparency into broadband Internet performance isn’t just important to consumers, though. With more and more enterprises relying on the Internet to reach both customers and also employees, it has become a foundational part of the American economy. So many businesses rely on Cloudflare because they want their digital assets delivered to customers, partners, and employees quickly. Enterprises want to secure their network with our cloud because our edge services are physically close to users and can be reached with low latency. Performance is no longer a luxury — it is increasingly a necessity.
The FCC defined latency in 2016 as “the time it takes for a data packet to travel from one point to another in a network.” While technically true, the vagueness of this definition presents certain issues. The latency between two points could be arbitrary, or as is the case with current speed tests, measuring a path that is never traversed by consumers in daily Internet usage. To put it succinctly: we don’t know what is being measured or whether what’s measured reflects reality.
While there is ambiguity about what latency ISPs would show on their broadband label, Cloudflare, and other content providers, can see latency from the other side – from our edge servers that are serving websites to consumers. What we see is that rural states have higher latency than more dense states.
Figure 1: 50th percentile TCP Connect Time (ms) to Major Content Delivery Networks
As an example, Cloudflare offers a browser isolation product that runs a web browser in our cloud, an application that is extremely sensitive to latency. To achieve these latencies, we’ve connected directly with 10,000 distinct networks across more than 270 global data center locations. We estimate that 95% of Internet users globally can reach Cloudflare-protected websites and services in under 50 milliseconds.
So while Cloudflare supports the FCC’s effort to increase understanding of cost and privacy of Internet Service Provider offerings and wants the labels to be expedited to provide real consumer value, we have suggestions to significantly augment the labels to provide a better view of how your Internet does at providing services to you. Standardizing technical measurements across the Internet is a big topic, and in some cases we suggest the FCC build stakeholder consensus on additional future changes to the label.
For the broadband performance section of the label, we recommended:
Renaming “download speed” (and “upload”) to “throughput,” “bandwidth”, or “capacity.” We can’t deny “speed” has become conversationally interchangeable with throughput, but they aren’t the same. As the Internet continues to grow, “speed” will mean how fast the Internet is, which will be measured in latency and overall quality of service, not just throughput. The latter is simply the amount of bits a connection can handle in the downstream direction at any given time.
Adding “jitter” to the label. With the pandemic-driven rise of video conferencing, jitter —the variation, or stability, of latency in an Internet connection—has become a common cause of issues. Found yourself saying “my Internet is cutting out” or “am I frozen? Oh, I’m back”? That’s likely jitter.
Add methodological transparency and work towards standards for how latency, jitter, and packet loss are measured. Consumers should be able to make apples-to-apples comparisons between ISP offerings, but to do that, a standard in how ISPs measure these numbers is needed. Rather than a hasty mandate from the FCC, our suggestion is to take the time to engage stakeholders on the best approaches.
The end goal of these recommendations is to make sure that standards on performance match the experiences users have on the Internet. Today, speed tests and other forms of Internet measurement often query endpoints that are embedded into ISP networks that don’t see any traffic beyond measurements, and this can produce misleading results that may lead users to think that their Internet experience is better than it actually is. If your measurements don’t follow the same paths and are treated the same as normal Internet traffic, your measurements will look better. We believe that performance measurements should closely approximate the user experience, so that you have the complete picture of how your Internet is performing.
Disclosing Network Management
However, network performance isn’t only about how well your provider takes bits from your device to where they need to go. Sometimes network performance can be impacted by network management techniques. Providers may institute techniques like traffic shaping, which will slow down traffic to and from specific high-bandwidth sites to ensure that other sites don’t see congestion and degraded performance. Other providers may implement bandwidth caps, where specific users who consume lots of data may be slowed down if they exceed a threshold, a technique commonly used for mobile networks.
To help address these issues, we recommended including policy level line-items in the network management section instead of merely a yes-or-no answer. For example, if an ISP slows traffic after a certain amount of data has been consumed in a month, that information should be accessible on the label itself.
Privacy Disclosures
For the privacy section of the label, our recommendation is that a link to a dense and rarely-read ISP privacy policy is not sufficient transparency into how an ISP will use subscribers’ data. We recommended a privacy section that gives consumers insight into:
Collection and retention of information: The label should indicate whether the ISP collects and retains any information beyond what is strictly necessary to provide services to the subscriber, including web browsing history and location data, as well as how long that information is retained.
Use of information: The label should indicate whether data collected by the ISP is used for purposes other than what is strictly necessary to provide the broadband service to the consumer, such as for advertising.
Sharing of information: The label should indicate whether the ISP shares or sells the data collected, including location or browsing information data, with third parties.
Opt out: The label should indicate whether the ISP provides options to opt-out of data use and sharing (whether the ISP receives consideration for such sharing).
Security of information: The label should indicate whether the ISP provider has technical mechanisms in place to secure data from unauthorized access, including whether it encrypts metadata about a consumer’s browsing habits, and mechanisms in place to report breaches.
We also suggested that the FCC make the data presented in the label accessible in a machine-readable format for researchers and consumers.
The Internet is built on users
We commend Congress for including broadband nutrition labels in the Infrastructure Investment and Jobs Act, and the FCC for moving quickly to implement the labels. The current broadband label, the product of years of work, will be a significant improvement over what we have now – nothing.
However, we don’t believe that the labels should stop there. While the labels from 2016 go a long way towards providing clarity into how much money users pay for their Internet and create a good standard for pricing, the Internet and the way people interact with it is so different now than it was six years ago. We need to ensure that we are representing the user experience to its fullest, as this will ensure that our Internet experience can continue to improve over the next six years and beyond.
Almost a year ago, we shared extensive benchmarking results of last mile networks all around the world. The results showed that on a range of tests (TCP connection time, time to first byte, time to last byte), and on different measures (p95, mean), Cloudflare was the fastest provider in 49% of networks around the world. Since then, we’ve worked to continuously improve performance towards the ultimate goal of being the fastest everywhere. We set a goal to grow the number of networks where we’re the fastest by 10% every Innovation Week. We met that goal last year, and we’re carrying the work over to 2022.
Today, we’re proud to report we are the fastest provider in 71% of the top 1,000 most reported networks around the world. Of course, we’re not done yet, but we wanted to share the latest results and explain how we did it.
Measuring what matters
To quantify network performance, we have to get enough data from around the world, across all manner of different networks, comparing ourselves with other providers. We used Real User Measurements (RUM) to fetch a 100kb file from several different providers. Users around the world report the performance of different providers. The more users who report the data, the higher fidelity the signal is. The goal is to provide an accurate picture of where different providers are faster, and more importantly, where Cloudflare can improve. You can read more about the methodology in the original Speed Week blog post here.
In the process of quantifying network performance, it became clear where we were not the fastest everywhere. After Full Stack Week, we found 596 country/network pairs where we were more than 100ms behind the leading provider (where a country/network pair is defined as the performance of a network within a particular country).
We are constantly going through the process of figuring out why we were slow — and then improving. The challenges we faced were unique to each network and highlighted a variety of different issues that are prevalent on the Internet. We’re going to deep dive into a couple of networks, and show how we diagnosed and then improved performance.
But before we do, here are the results of our efforts since Full Stack Week.
*Performance is defined by p95 TCP connection time across top 1,000 networks in the world by number of IPv4 addresses advertised
*Performance is defined by p95 TCP connection time across top 1,000 networks in the world by number of IPv4 addresses advertised
Curing congestion in Canada
In the spirit of Security Week, we want to highlight how a Magic Transit (Cloudflare’s network layer DDoS security) customer’s network problems provided line of sight into their internal congestion issues, and how our network was able to mitigate the problem in the short term.
One Magic Transit customer saw congestion in Canada due to insufficient peering with the Internet at key interconnection points. Congestion for customers means bad performance for users: for games, it can lead to lag and jittery gameplay, for video streaming, it can lead to buffering and poor resolution, and for video/VoIP applications, it can lead to calls dropping, garbled video/voice, and sections of calls missing entirely. Fixing congestion in this case means improving the way this customer connects to the rest of the Internet to make the user experience better for both the customer and users.
When customers connect to the Internet, they can do so in several ways: through an ISP that connects to other networks, through an Internet Exchange which houses many different providers interconnecting at a singular point, or point-to-point connections with other providers.
In the case of this customer, they had direct connections to other providers and to Internet exchanges. They ran out of bandwidth with their point-to-point connections, meaning that they had too much traffic for the size of the links they had bought, which meant that the excess traffic had to go over Internet Exchanges that were out of the way, creating suboptimal network paths which increased latency.
We were able to use our network to help solve this problem. In the short term, we spread the traffic away from the congestion points. This removed hairpins to immediately improve the user experience. This restored service for this customer and all of their users.
Then, we went into action by accelerating previously planned upgrades of all of our Internet Exchange (IX) ports across Canada to ensure that we had enough capacity to handle them, even though the congestion wasn’t happening on our network. Finally, we reached out to the customer’s provider and quickly set up direct peering with them in Canada to provide direct interconnection close to the customer, so that we could provide them with a much better Internet experience. These actions made us the fastest provider on networks in Canada as well.
Keeping traffic in Australia
Next, we turn to a network that had poor performance in Australia. Users for that network were going all the way out of the country before going to Cloudflare. This created what is called a network hairpin. A network hairpin is caused by suboptimal connectivity in certain locations, which can cause users to traverse a network path that takes longer than it should. This hairpin effect made Cloudflare one of the slower providers for this network in Australia.
To fix this, Cloudflare set up peering with this network in Sydney, and this allowed traffic from this network to go to Cloudflare within the country the network was based in. This reduced our connection time from 65ms to 45ms, catapulting us to be the #1 provider for this network in the region.
Update on Full Stack Week
All of this work and more has helped us optimize our network even further. At Full Stack Week, we announced that we were faster in more of the most reported networks than our competitors. Out of the top 1,000 networks in the world (by number of IPv4 addresses advertised), here’s a breakdown of how many providers are number 1 in p95 TCP Connection Time, which represents the time it takes for a user to connect to the provider. This data is from Full Stack Week (November 2021):
As of Security Week, we improved our position to be faster in 19 new networks:
Cloudflare is also committed to being the fastest provider in every country. This is a world map using the data that was to show the countries with the fastest network provider during Full Stack Week (November 2021):
Here’s how the map of the world looks during Security Week (March 2022):
We moved to number 1 in all of South America, more countries in Africa, the UK, Sweden, Iceland, and also more countries in the Asia Pacific region.
A fast network means fast security products
Cloudflare’s commitment to building the fastest network allows us to deliver unparalleled performance for all applications, including our security applications. There’s an adage in the industry that you have to sacrifice performance for security, but Cloudflare believes that you should be able to have your security and performance without having to sacrifice either. We’ve unveiled a ton of awesome new products and features for Security Week and all of them are built on top of our lightning-fast network. That means that all of these products will continue to get faster as we relentlessly pursue our goal of being the fastest network everywhere.
The collective thoughts of the interwebz
Manage Consent
To provide the best experiences, we use technologies like cookies to store and/or access device information. Consenting to these technologies will allow us to process data such as browsing behavior or unique IDs on this site. Not consenting or withdrawing consent, may adversely affect certain features and functions.
Functional
Always active
The technical storage or access is strictly necessary for the legitimate purpose of enabling the use of a specific service explicitly requested by the subscriber or user, or for the sole purpose of carrying out the transmission of a communication over an electronic communications network.
Preferences
The technical storage or access is necessary for the legitimate purpose of storing preferences that are not requested by the subscriber or user.
Statistics
The technical storage or access that is used exclusively for statistical purposes.The technical storage or access that is used exclusively for anonymous statistical purposes. Without a subpoena, voluntary compliance on the part of your Internet Service Provider, or additional records from a third party, information stored or retrieved for this purpose alone cannot usually be used to identify you.
Marketing
The technical storage or access is required to create user profiles to send advertising, or to track the user on a website or across several websites for similar marketing purposes.


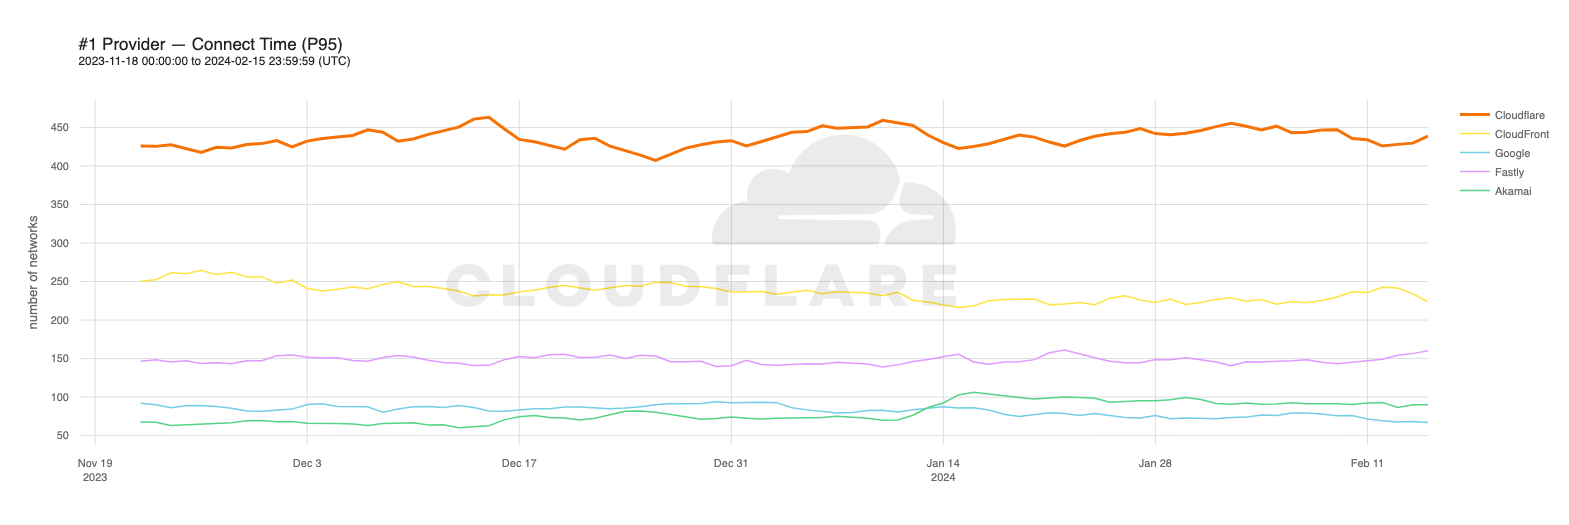
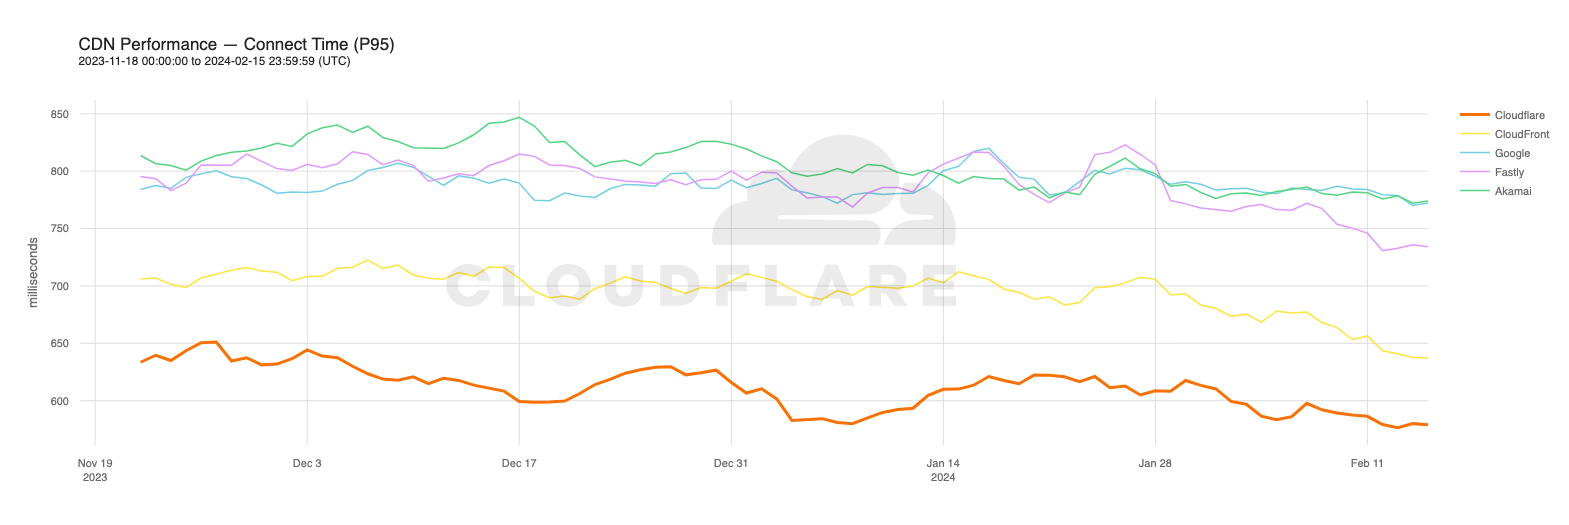
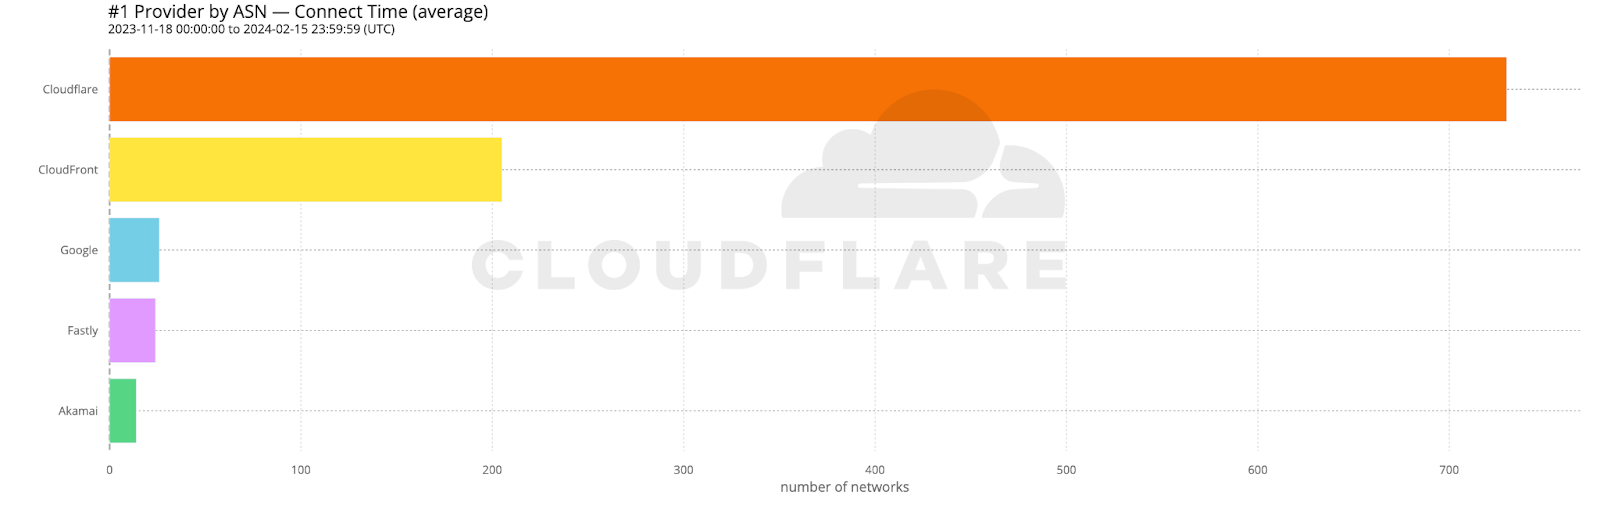
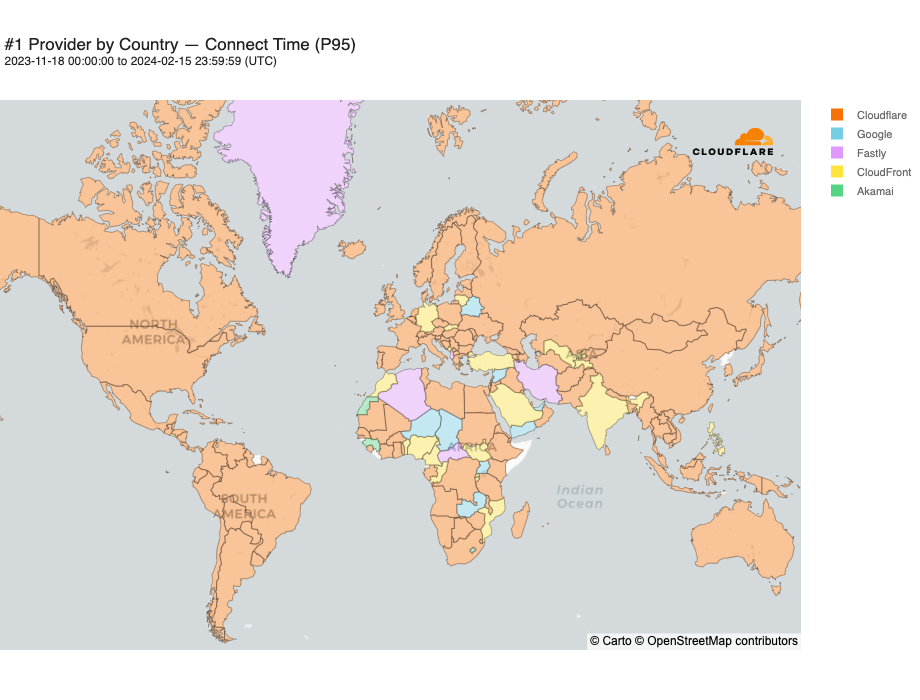
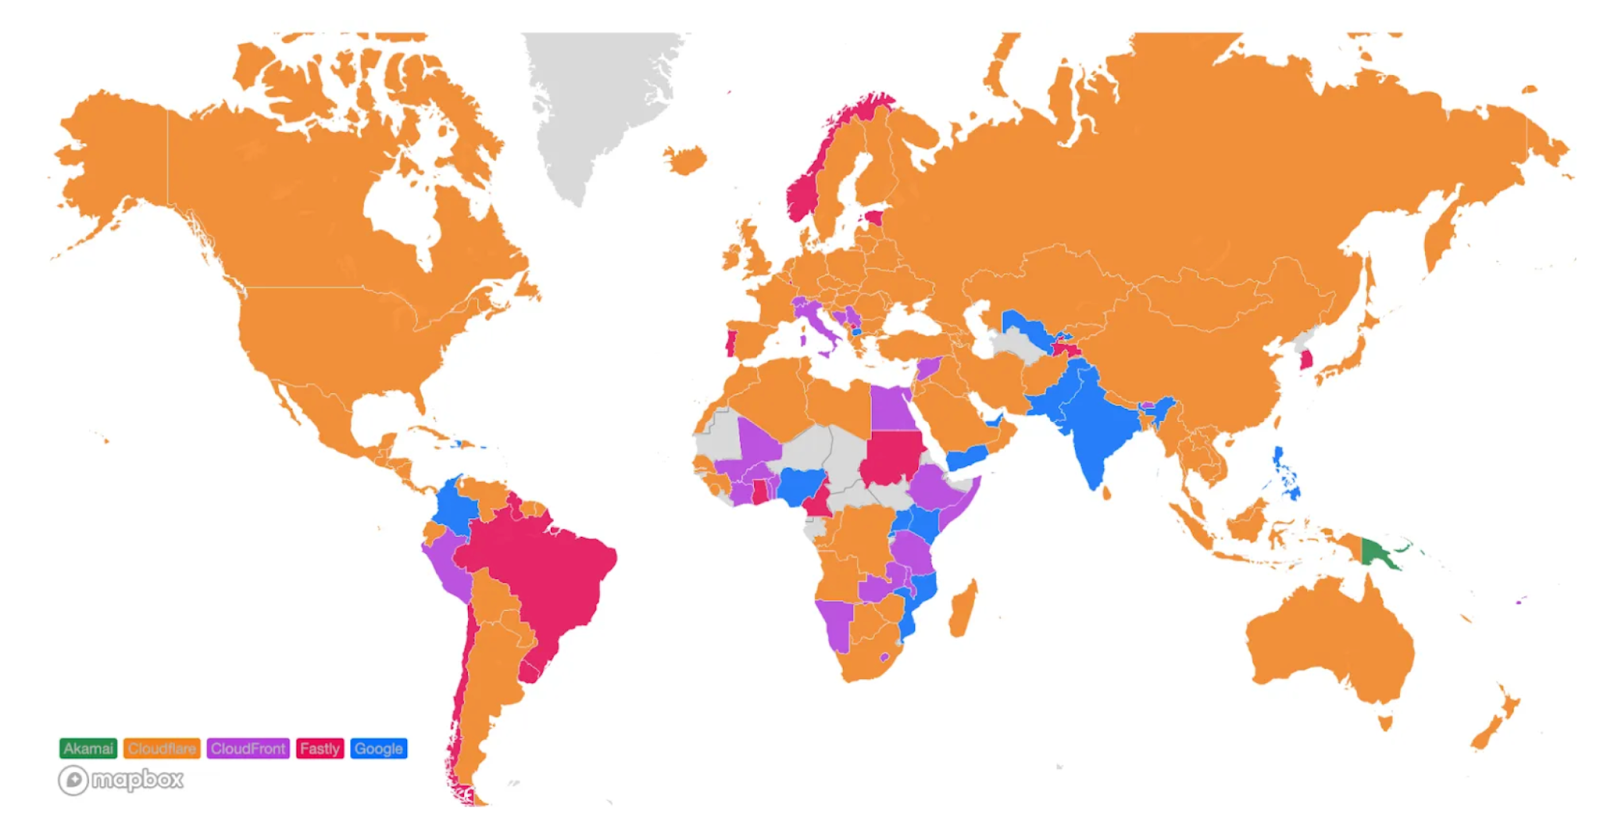
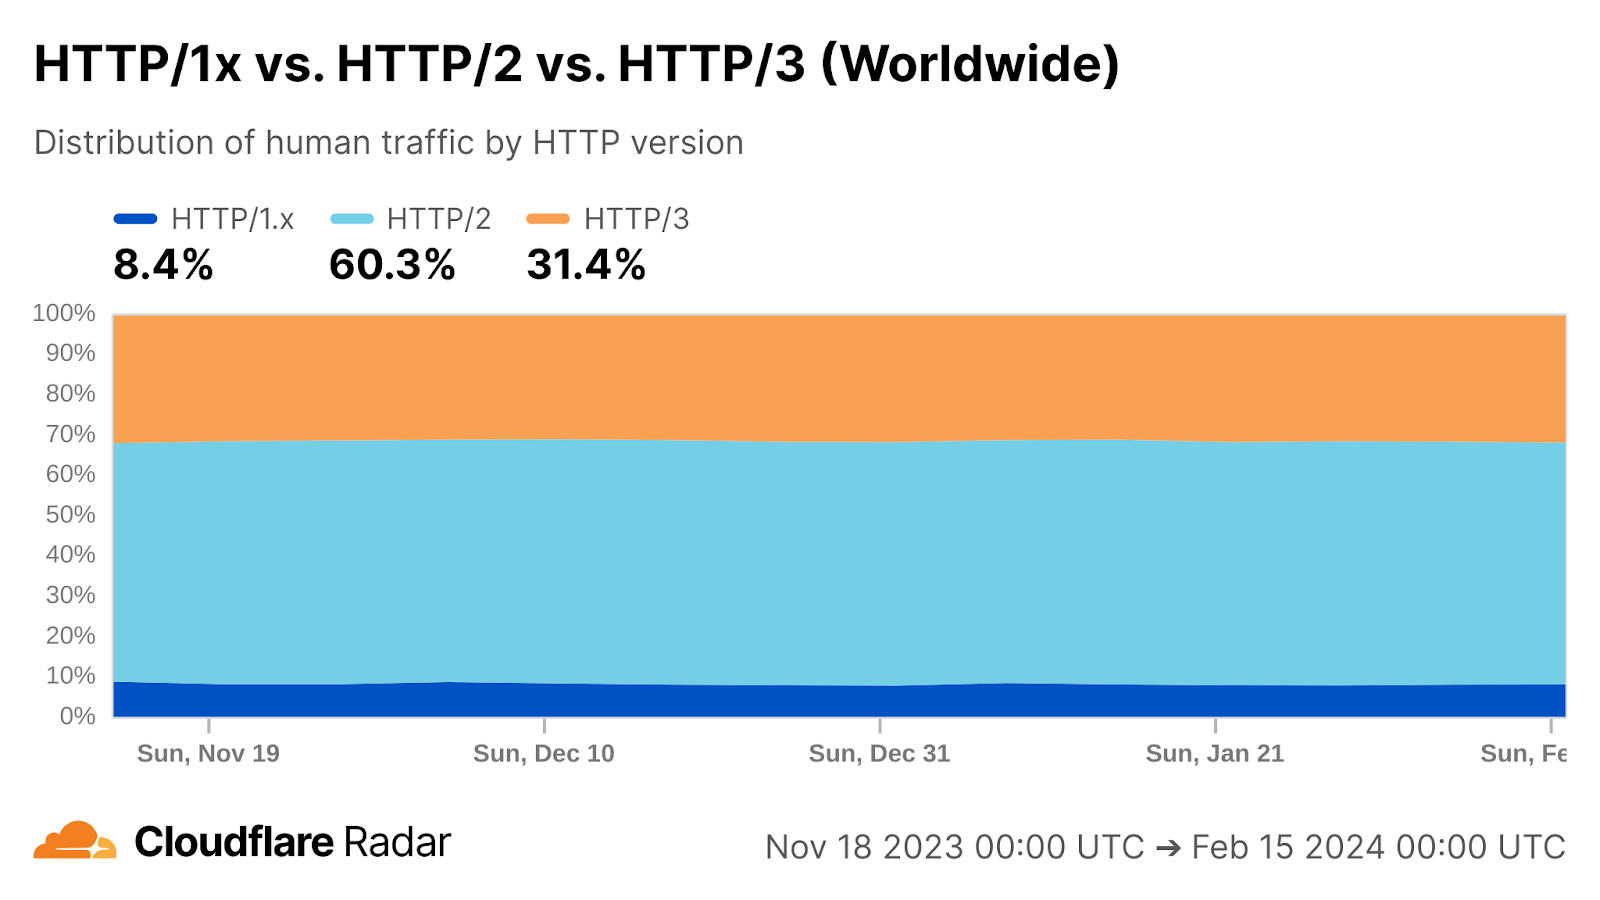

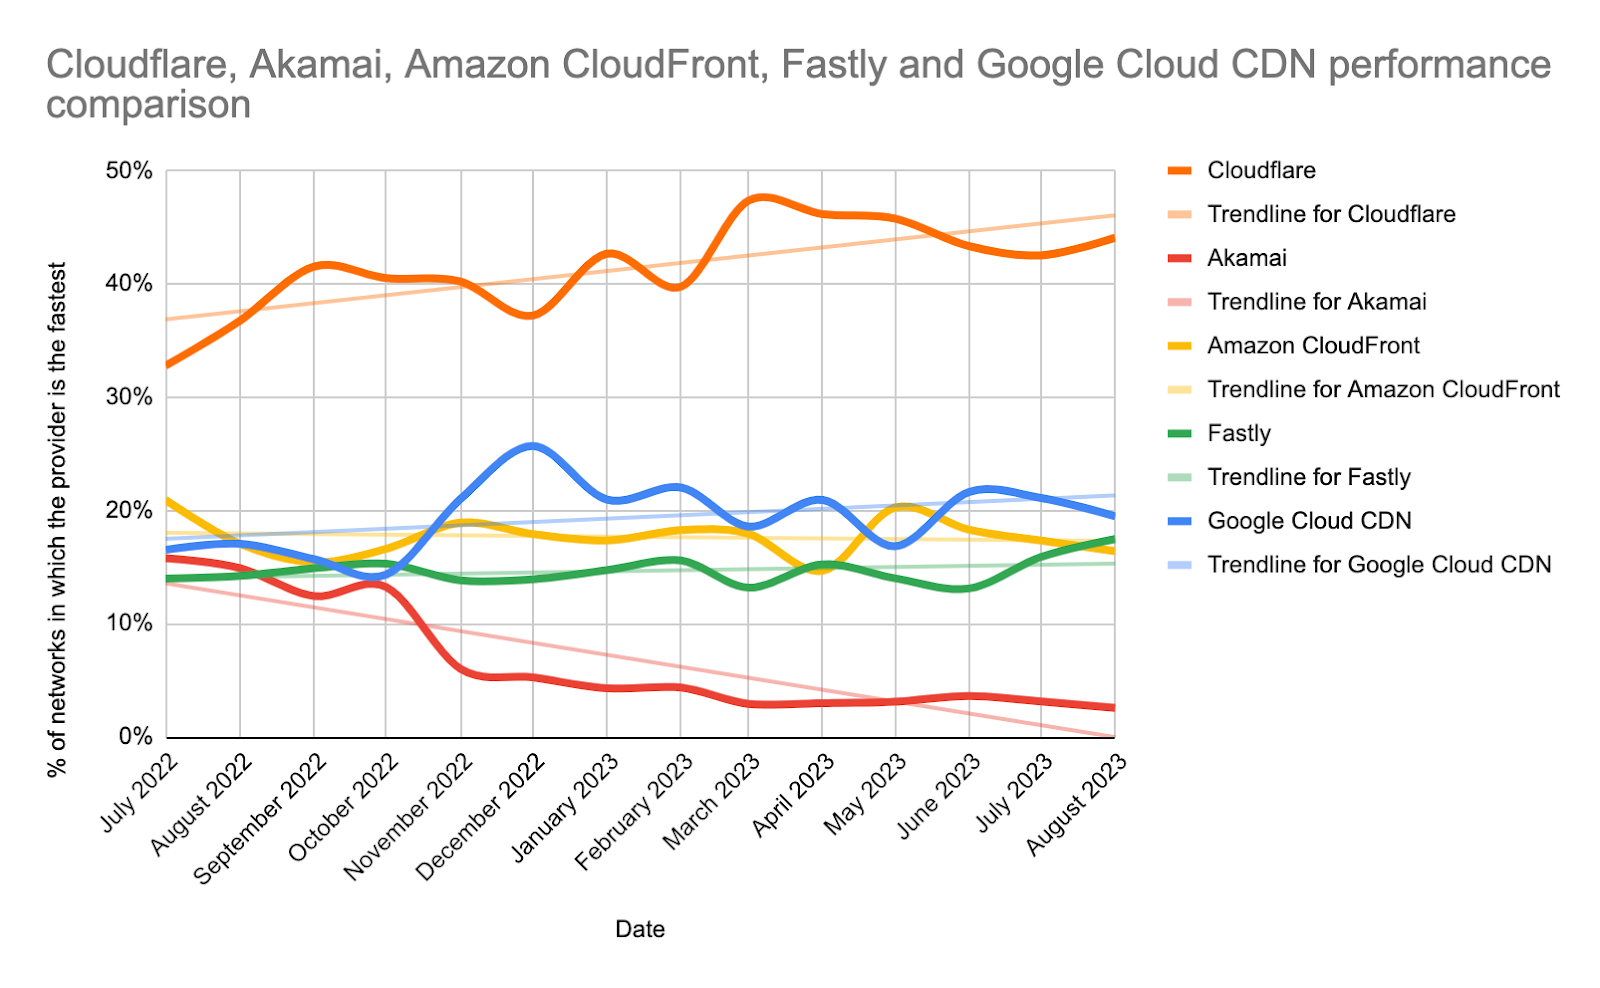
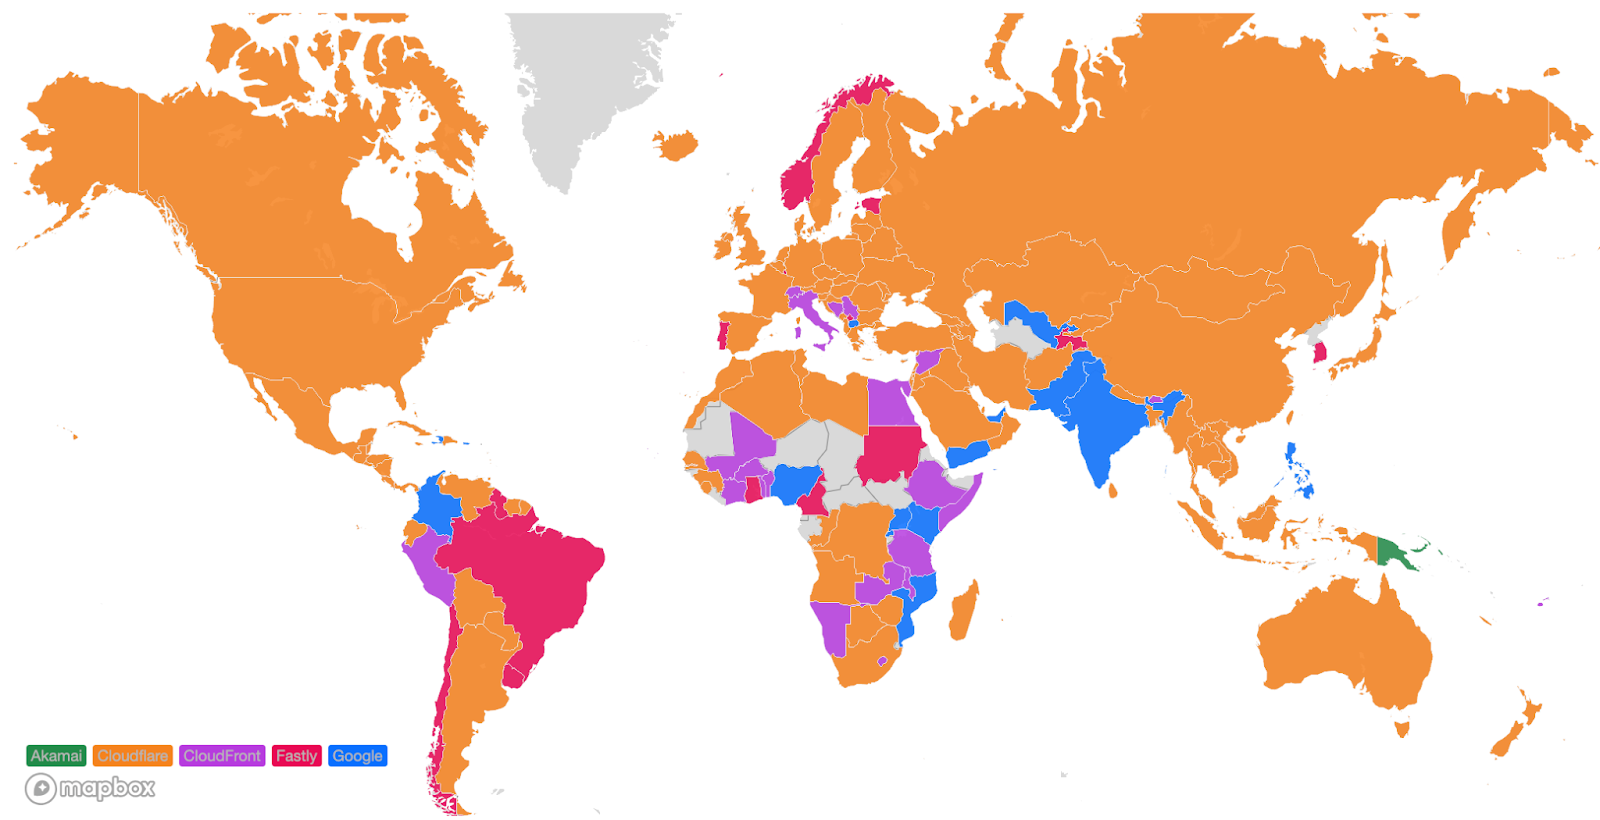
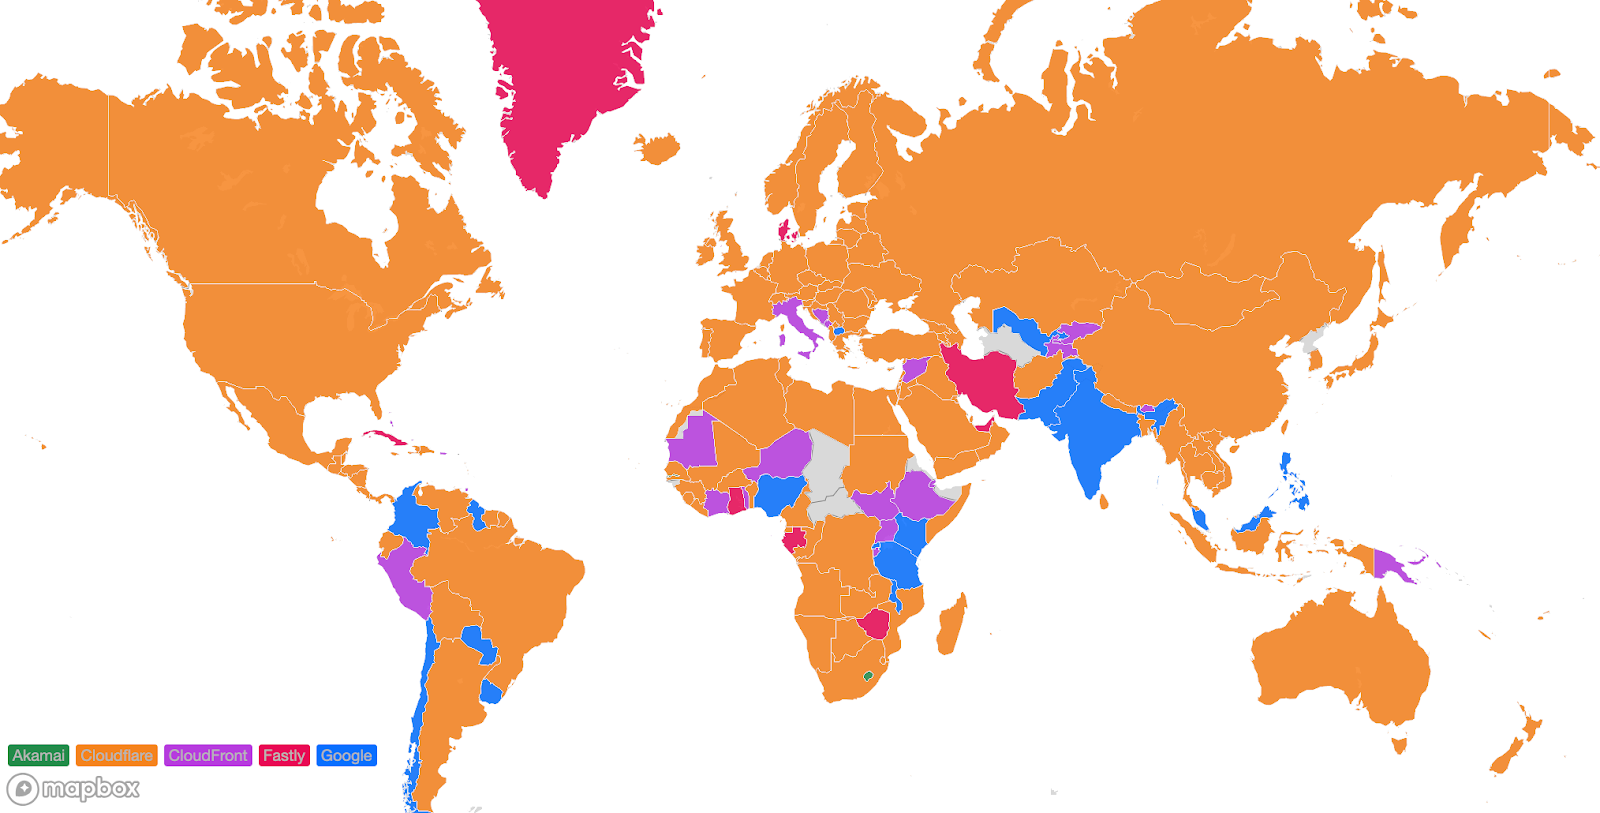
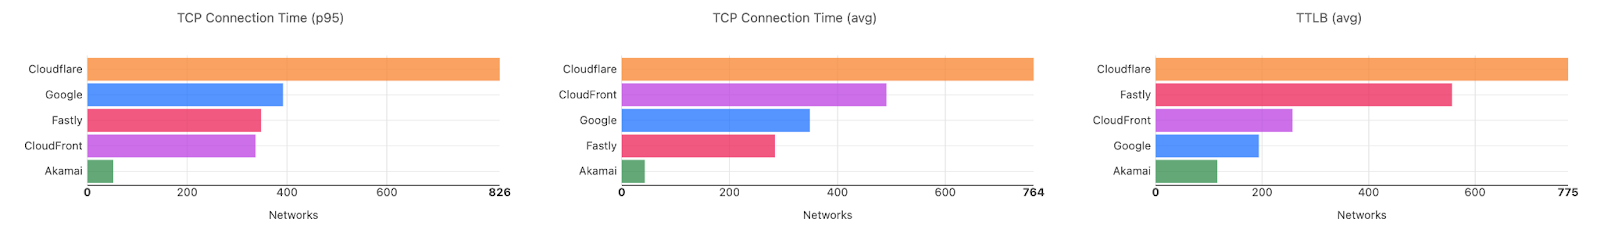


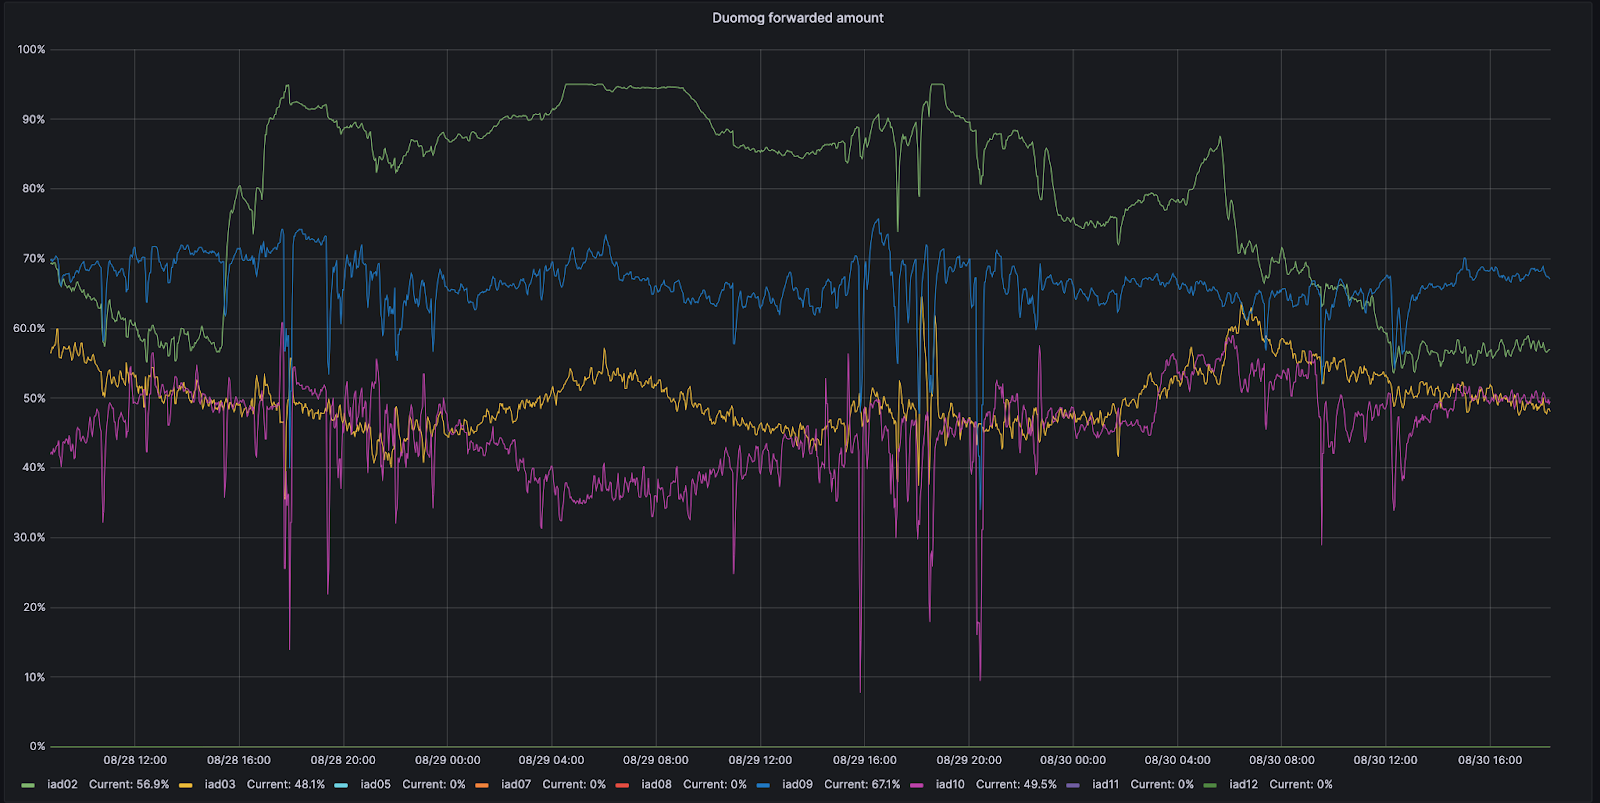


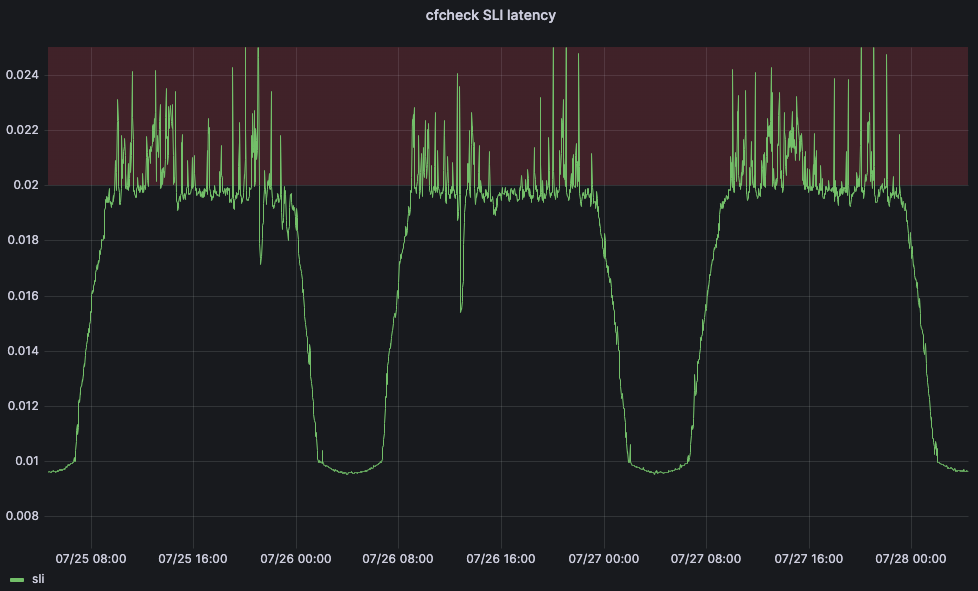

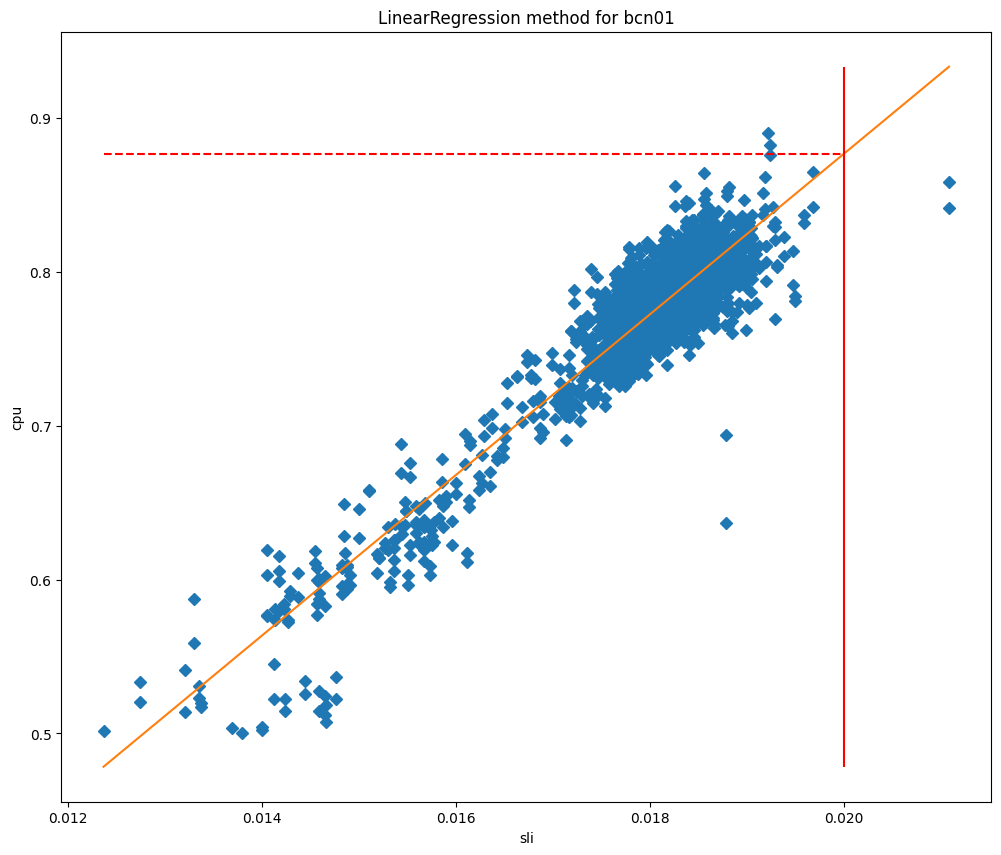
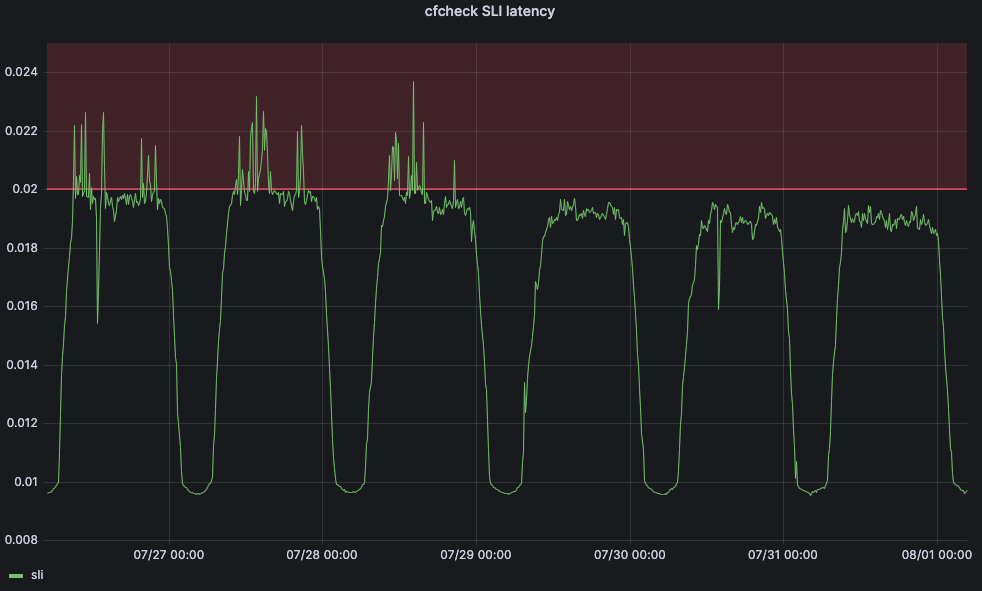


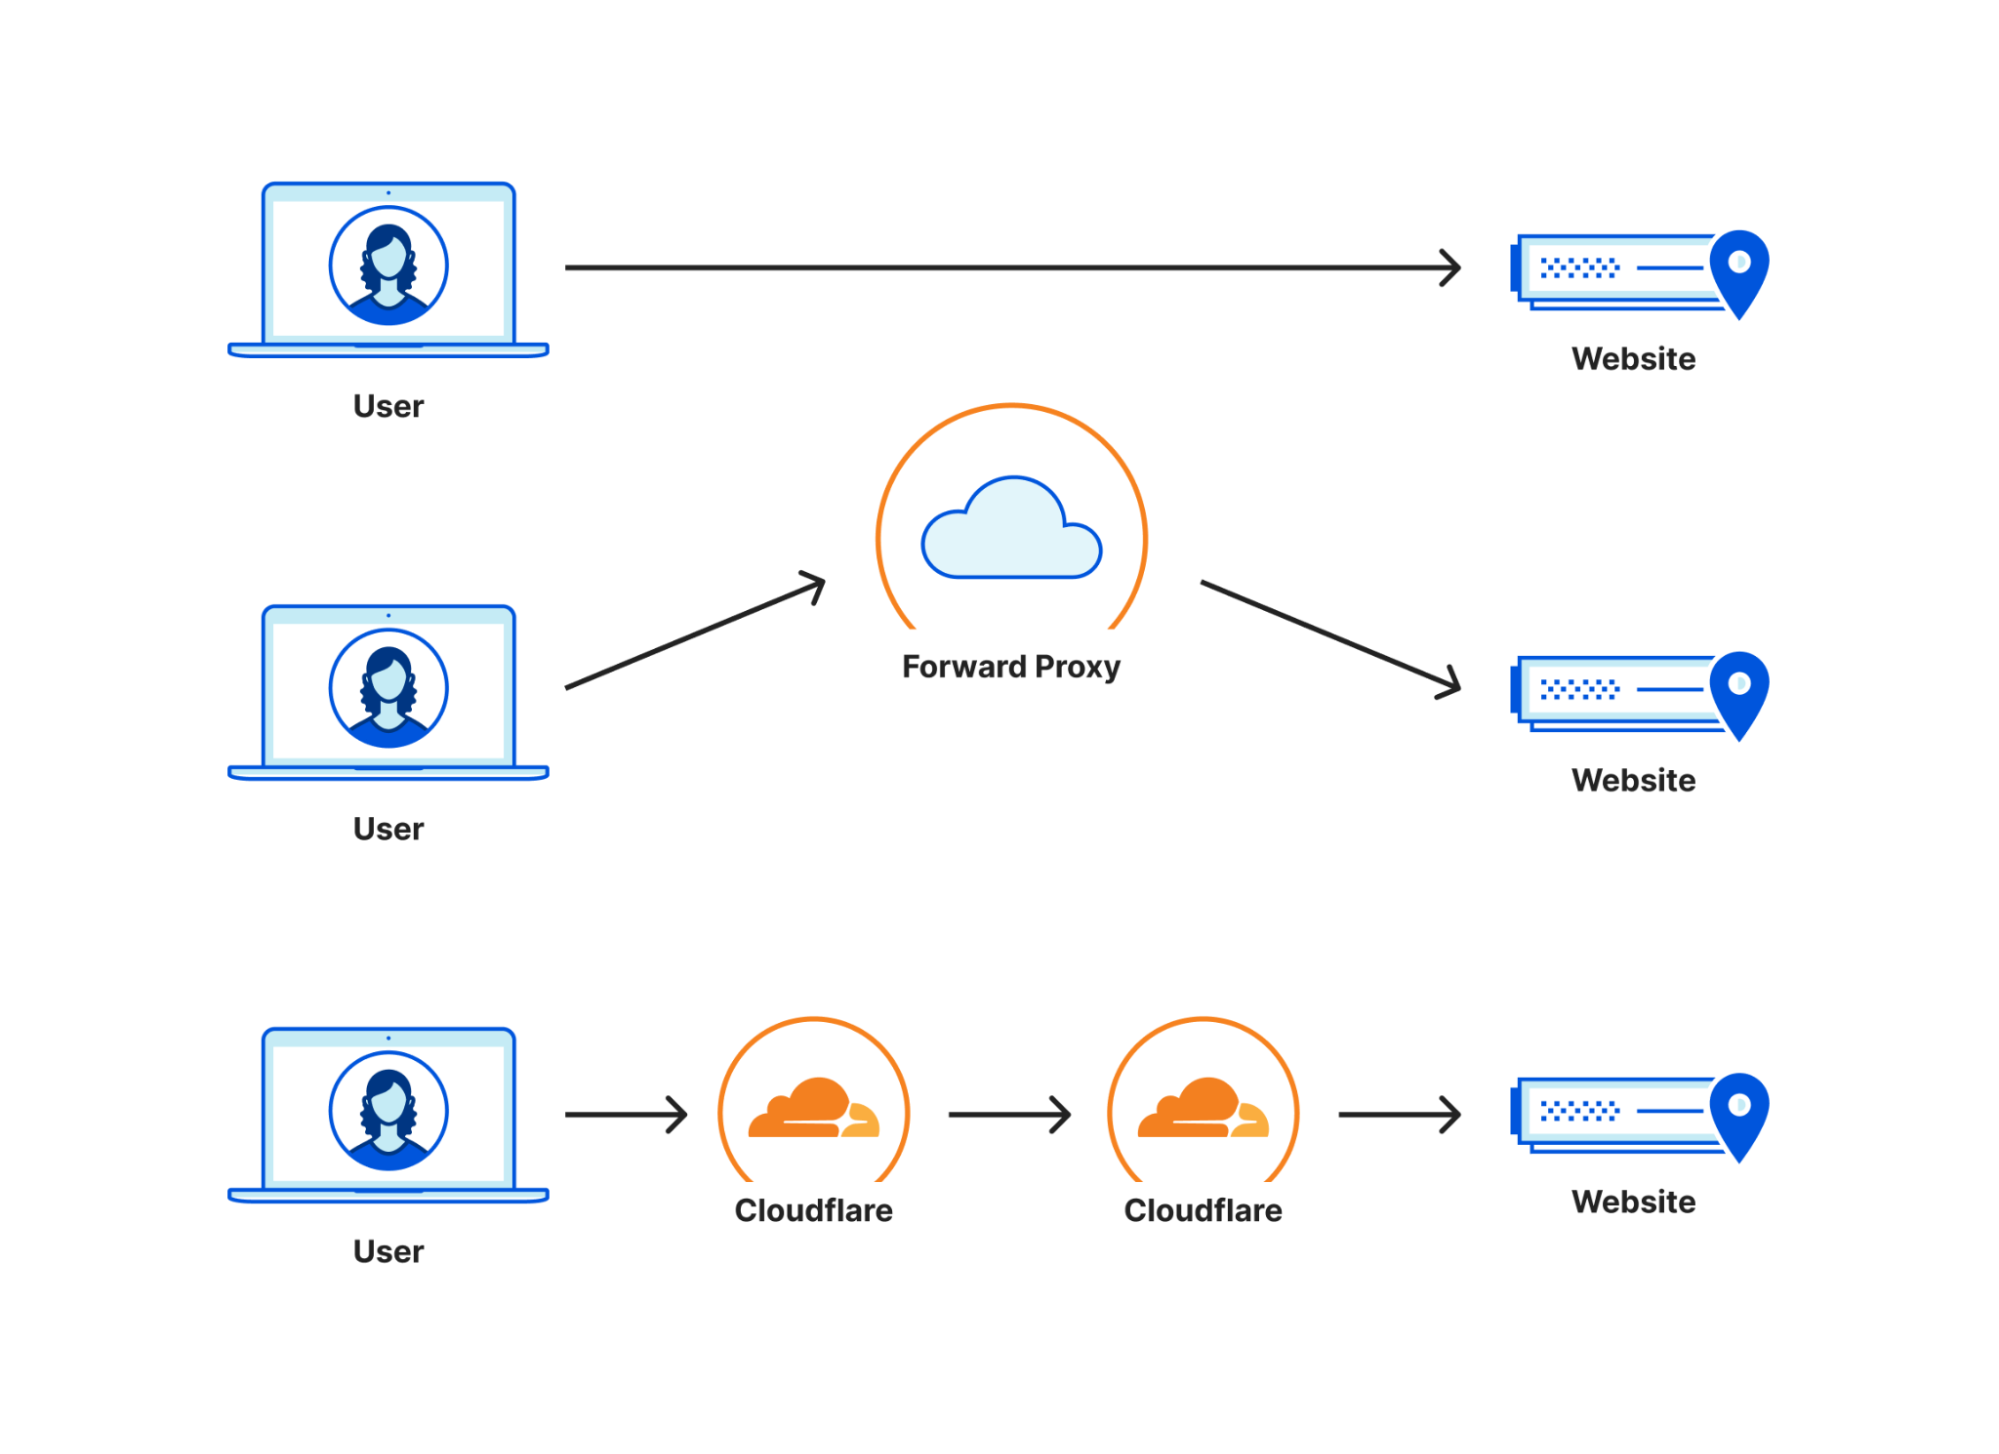

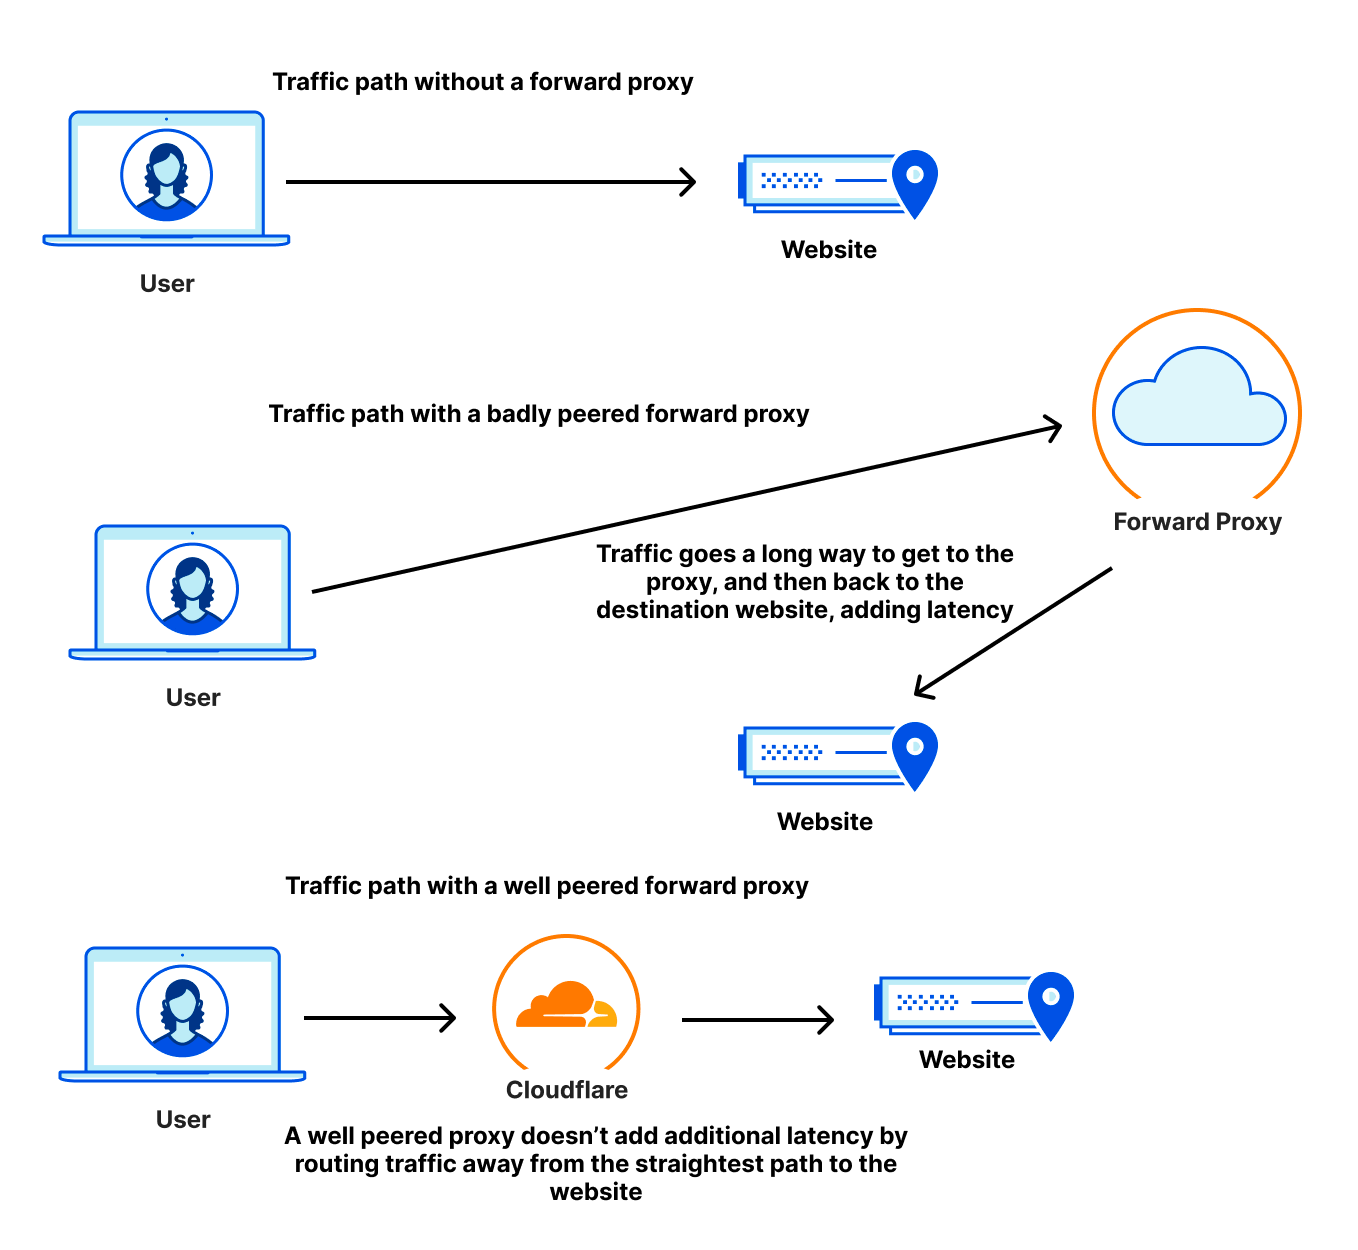
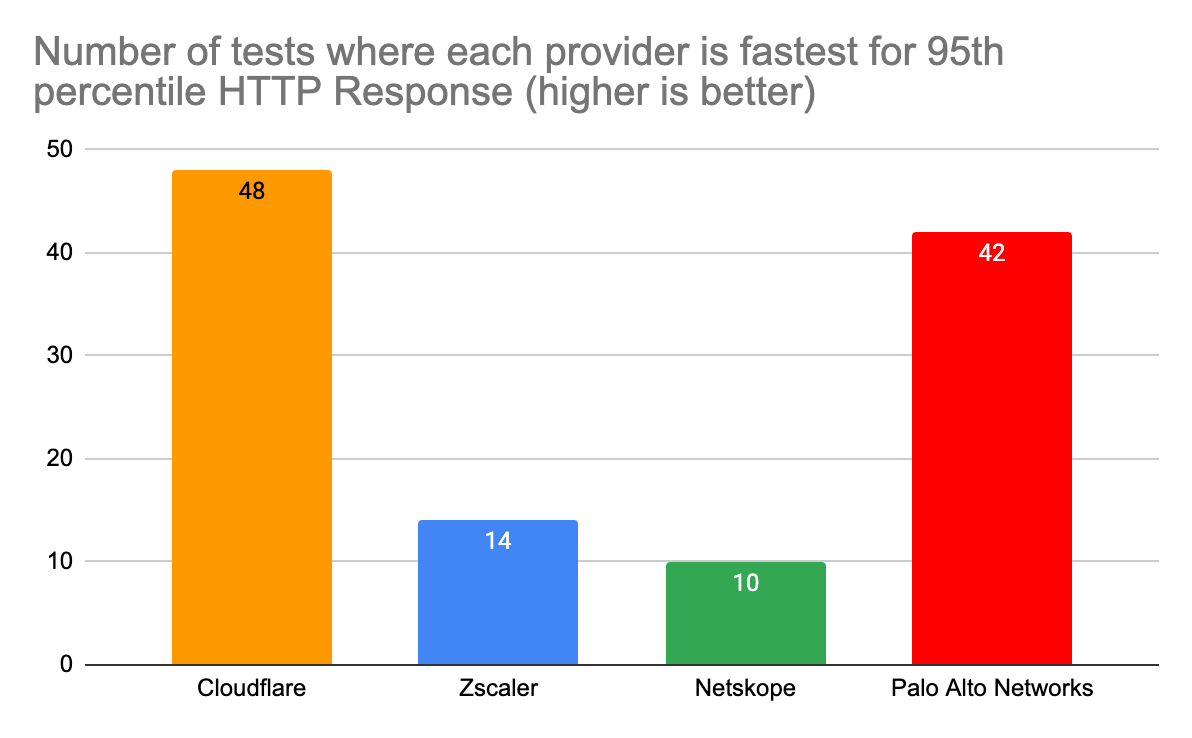
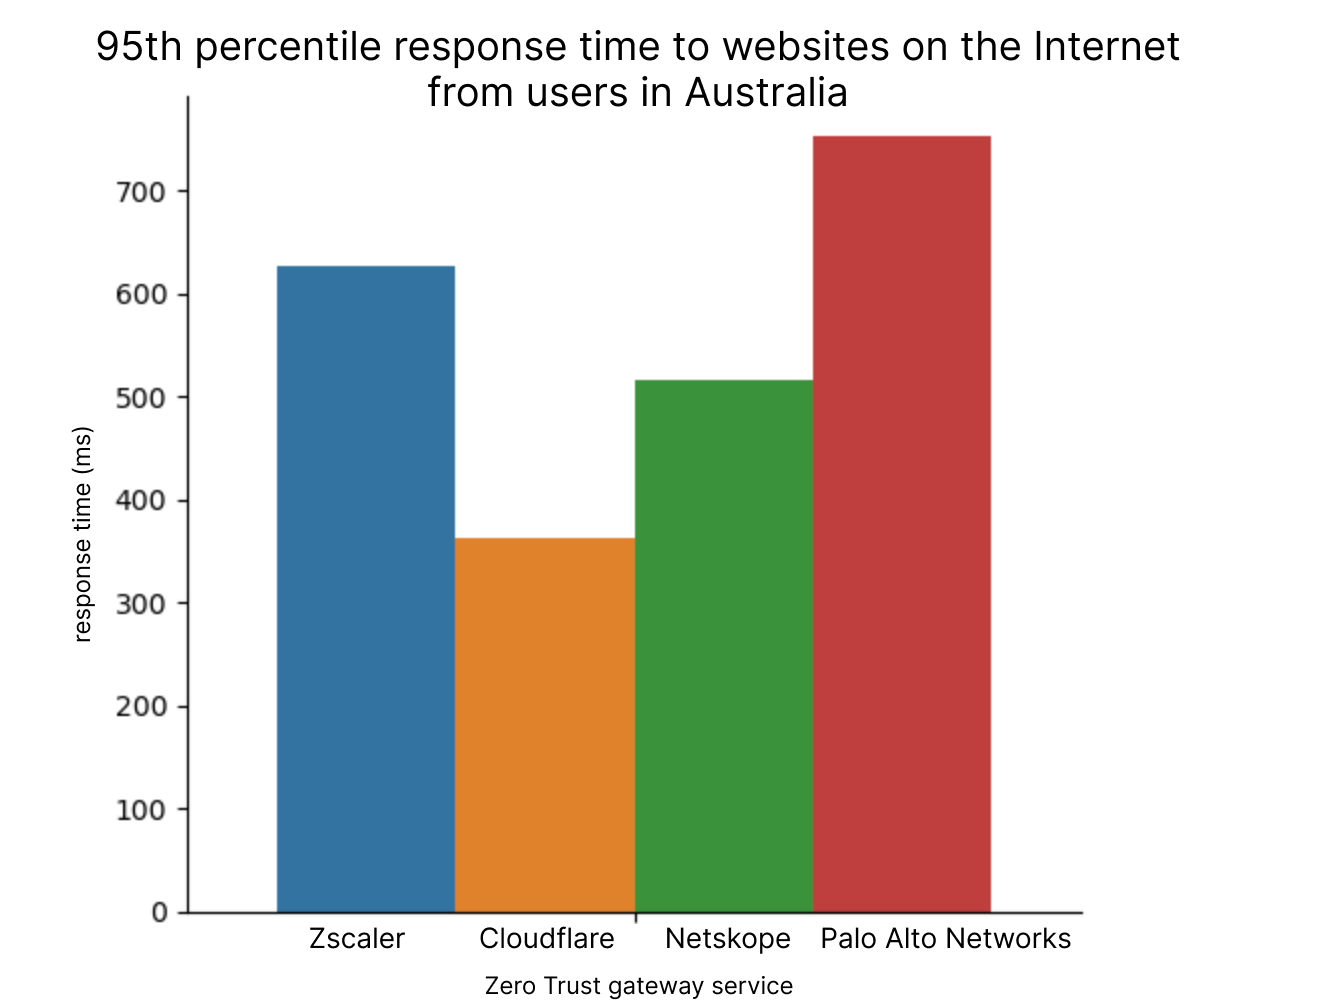
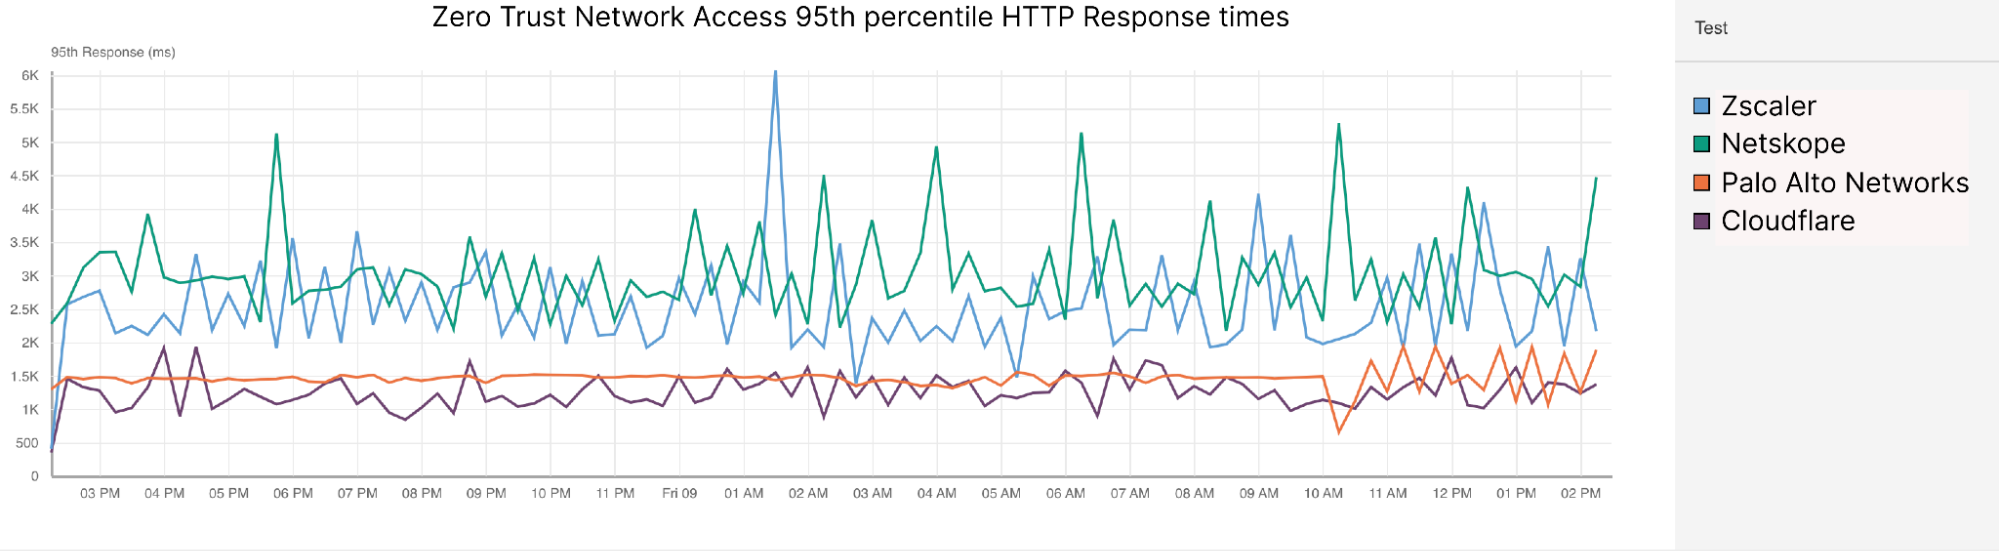
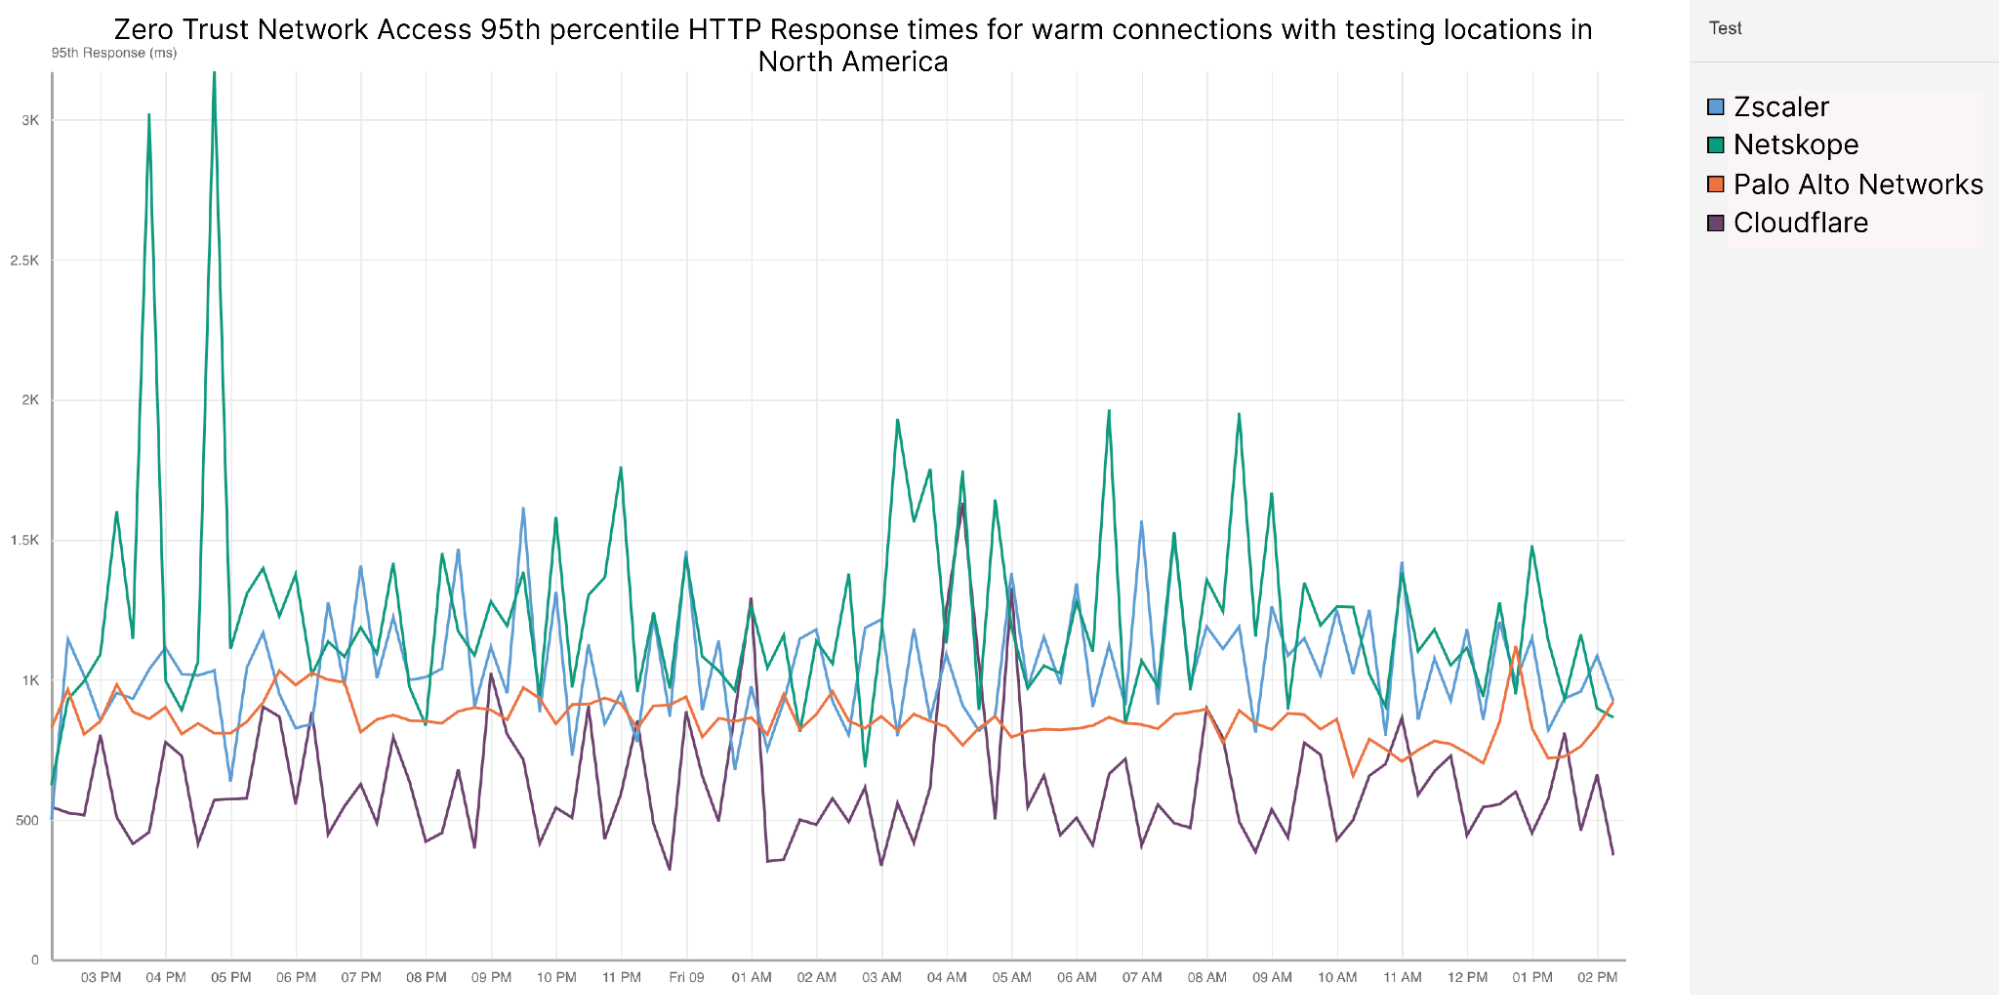

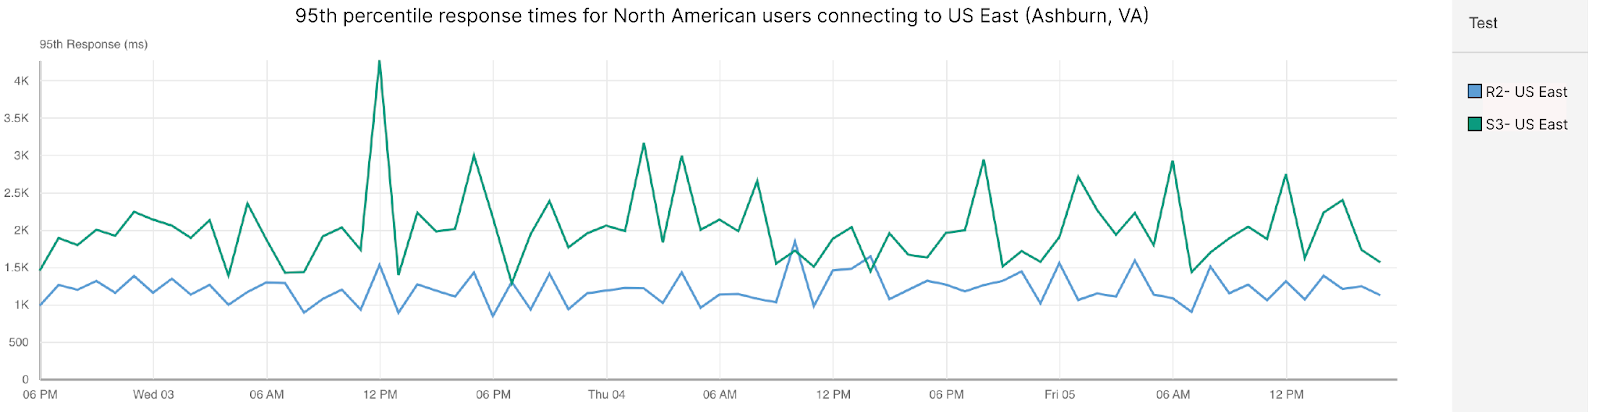
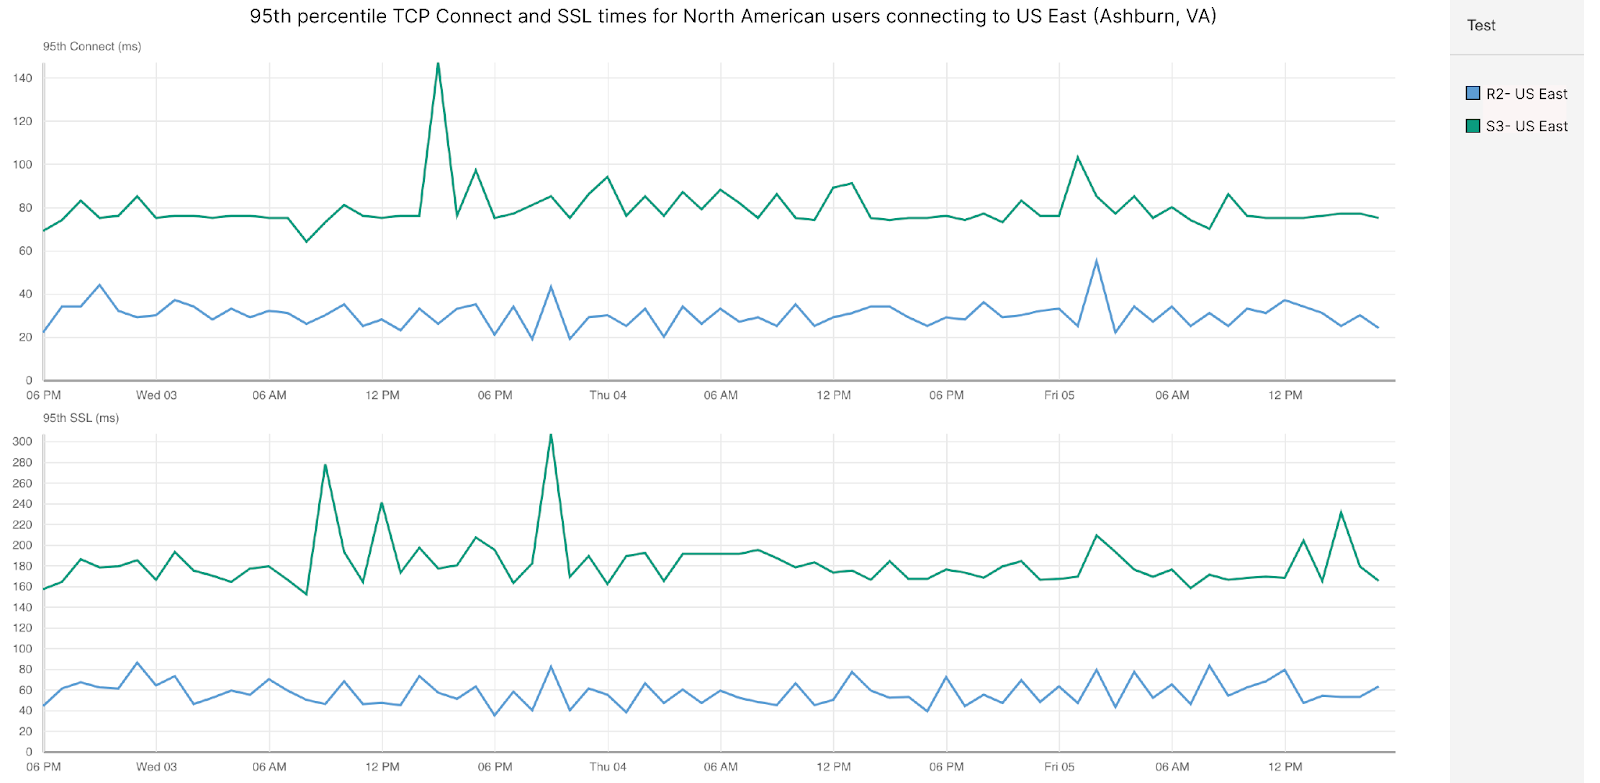
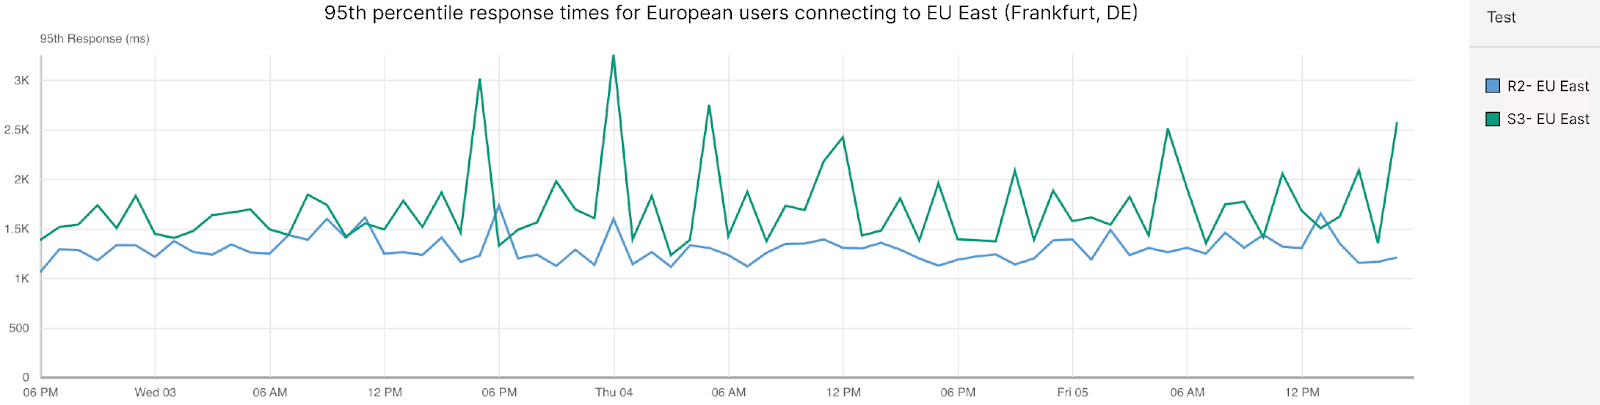
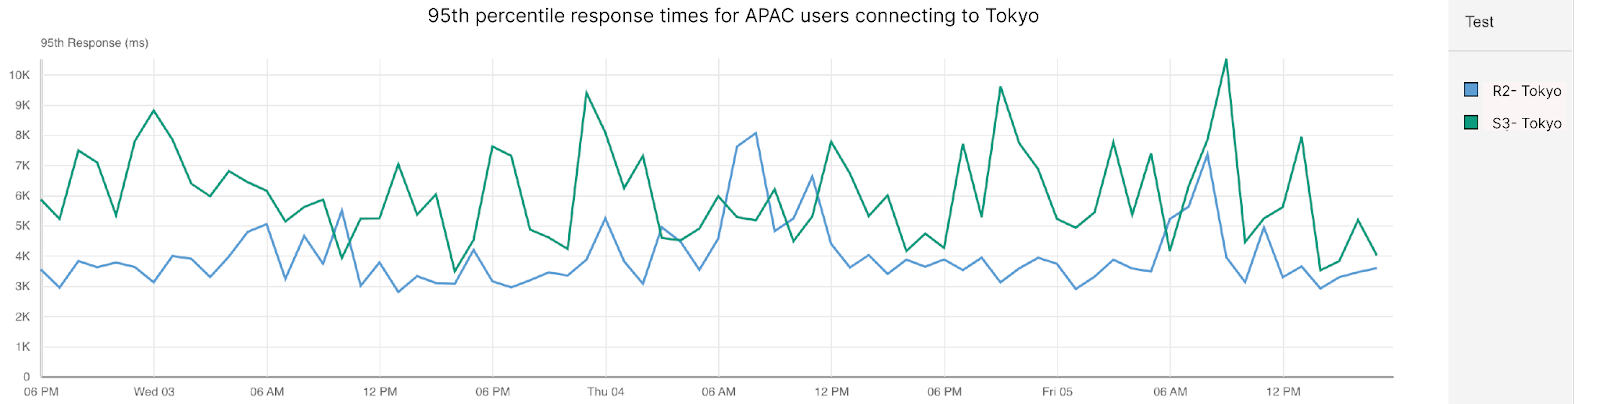
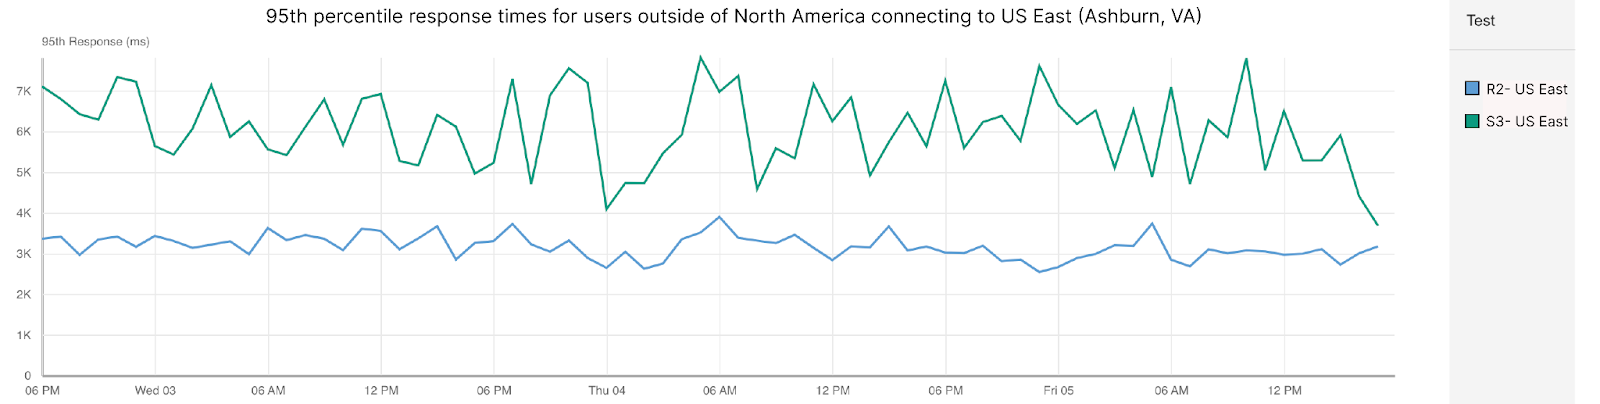
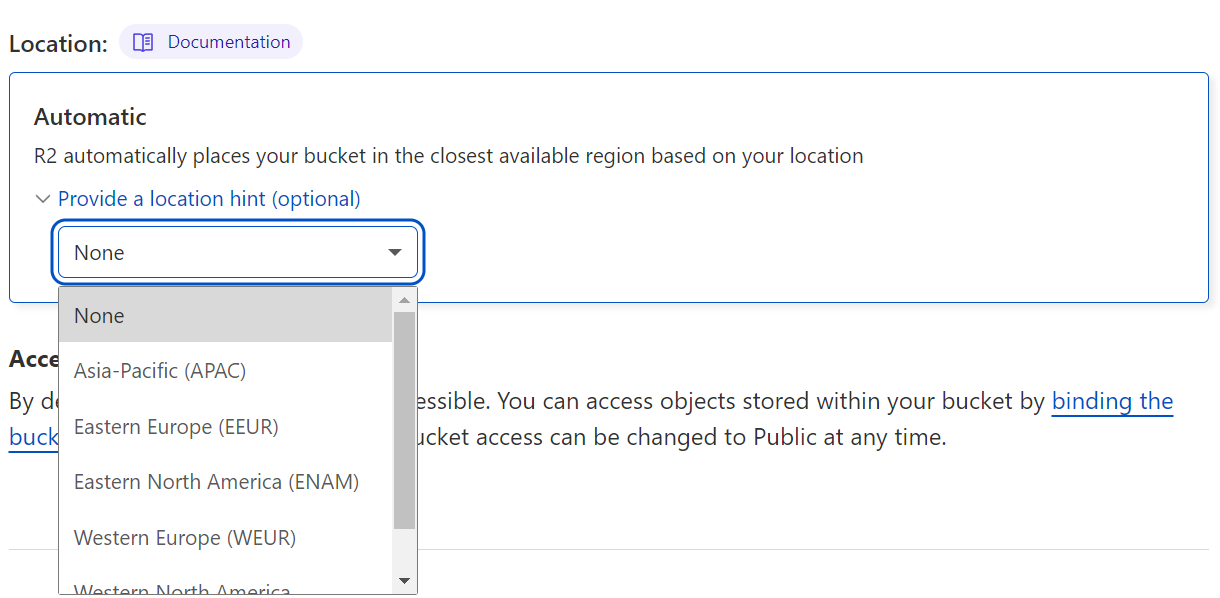
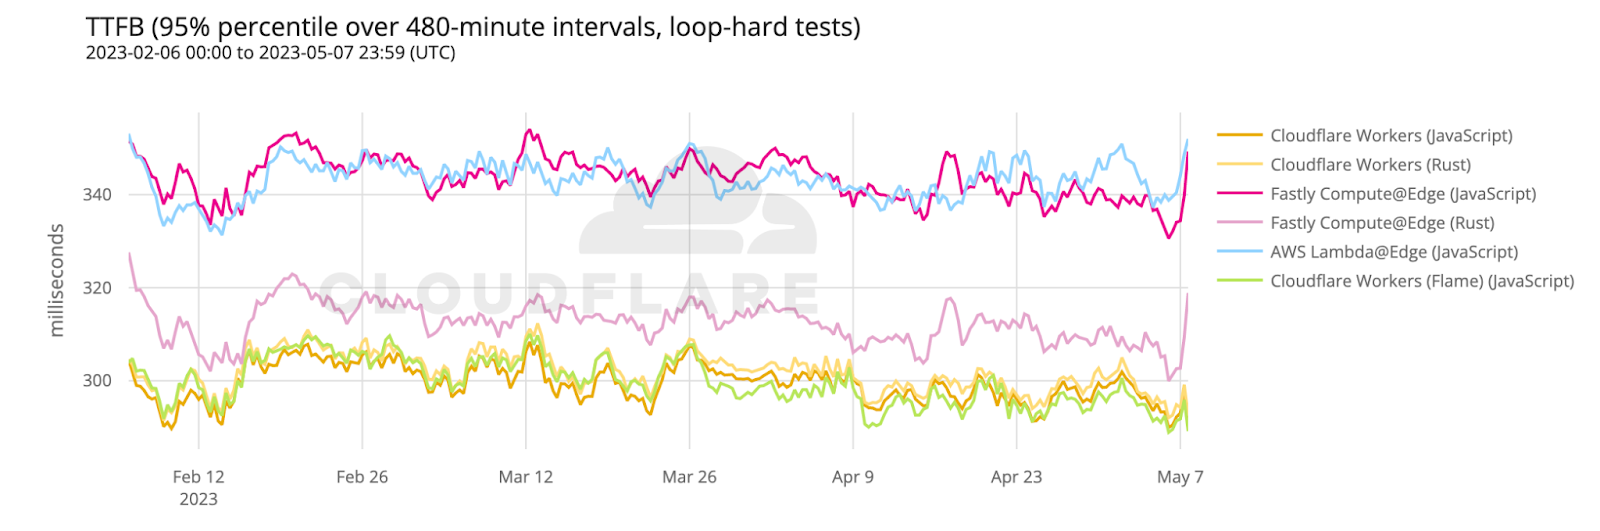


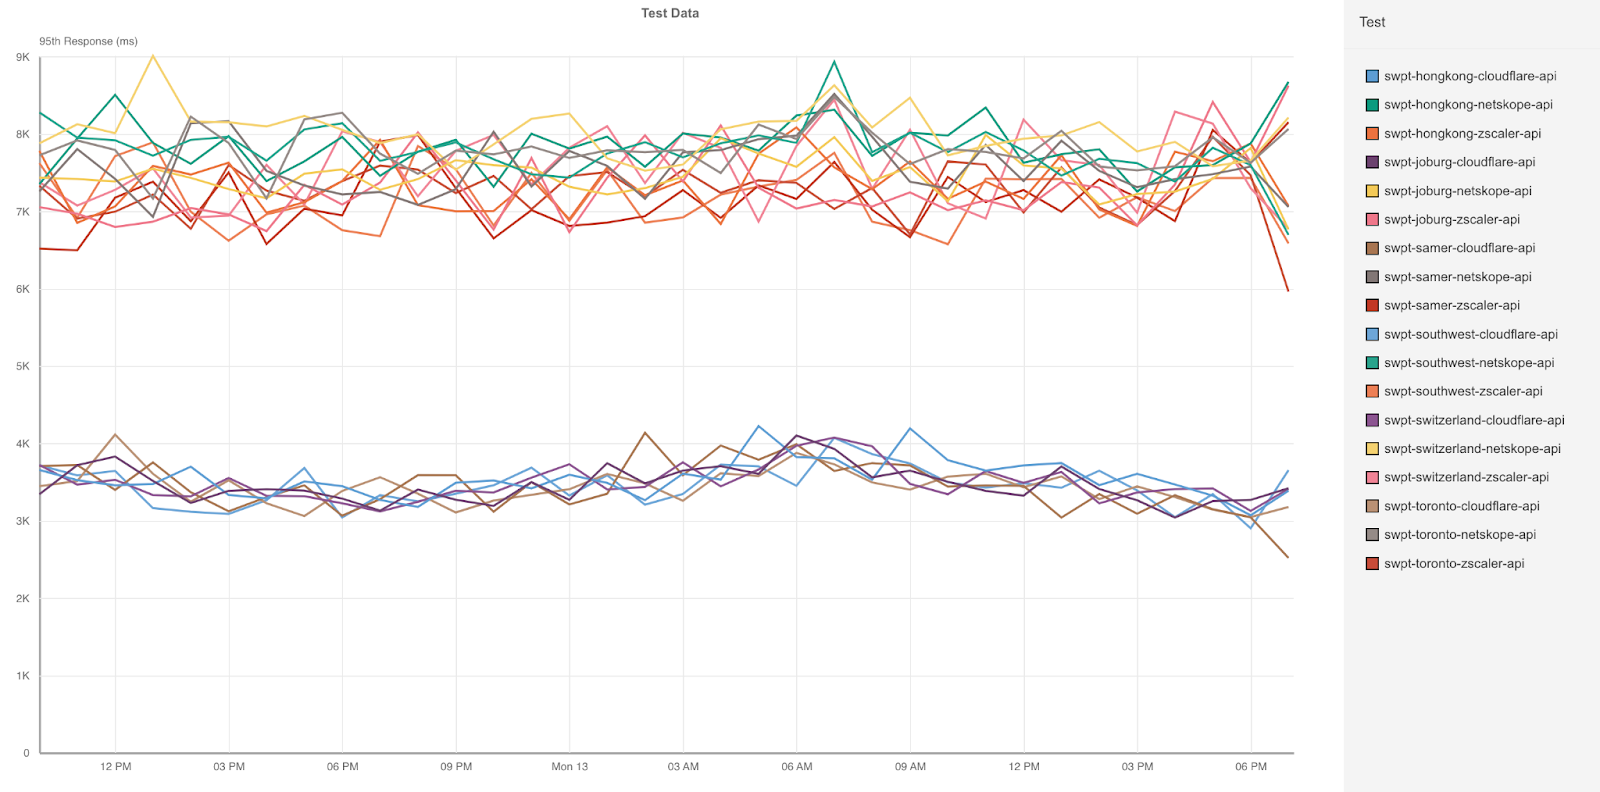
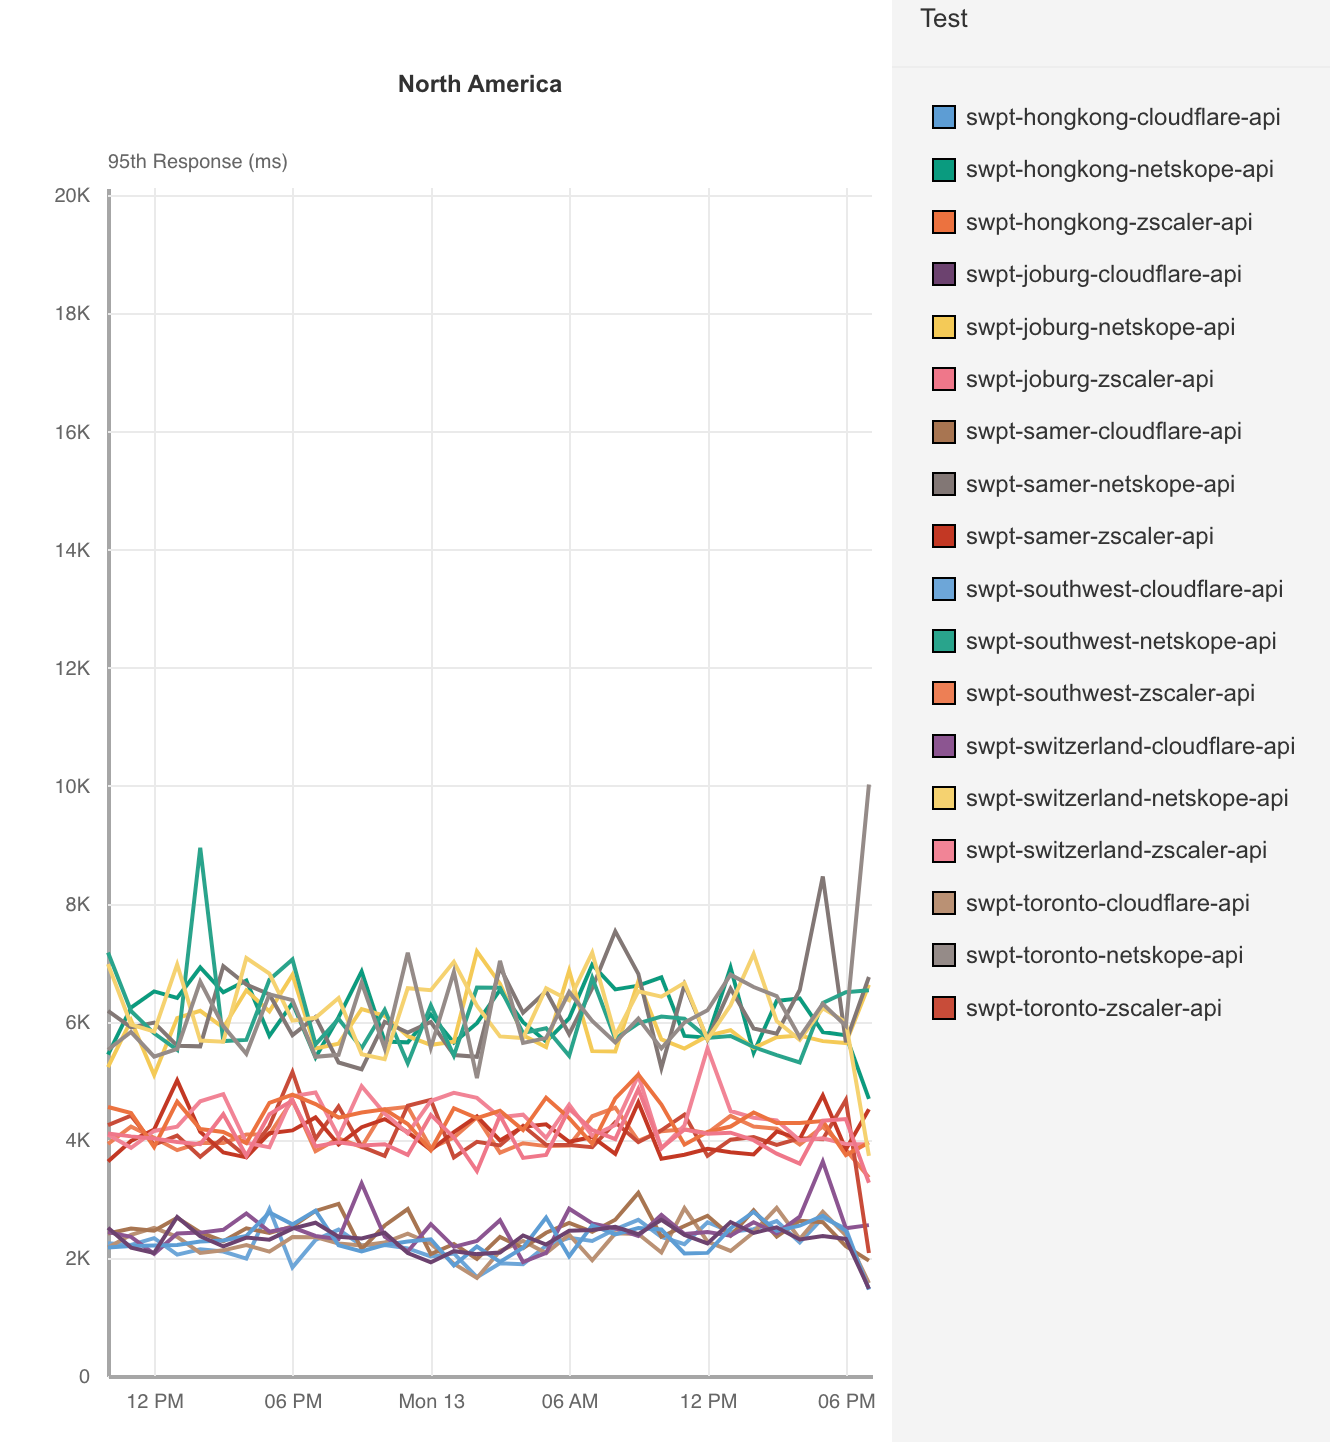
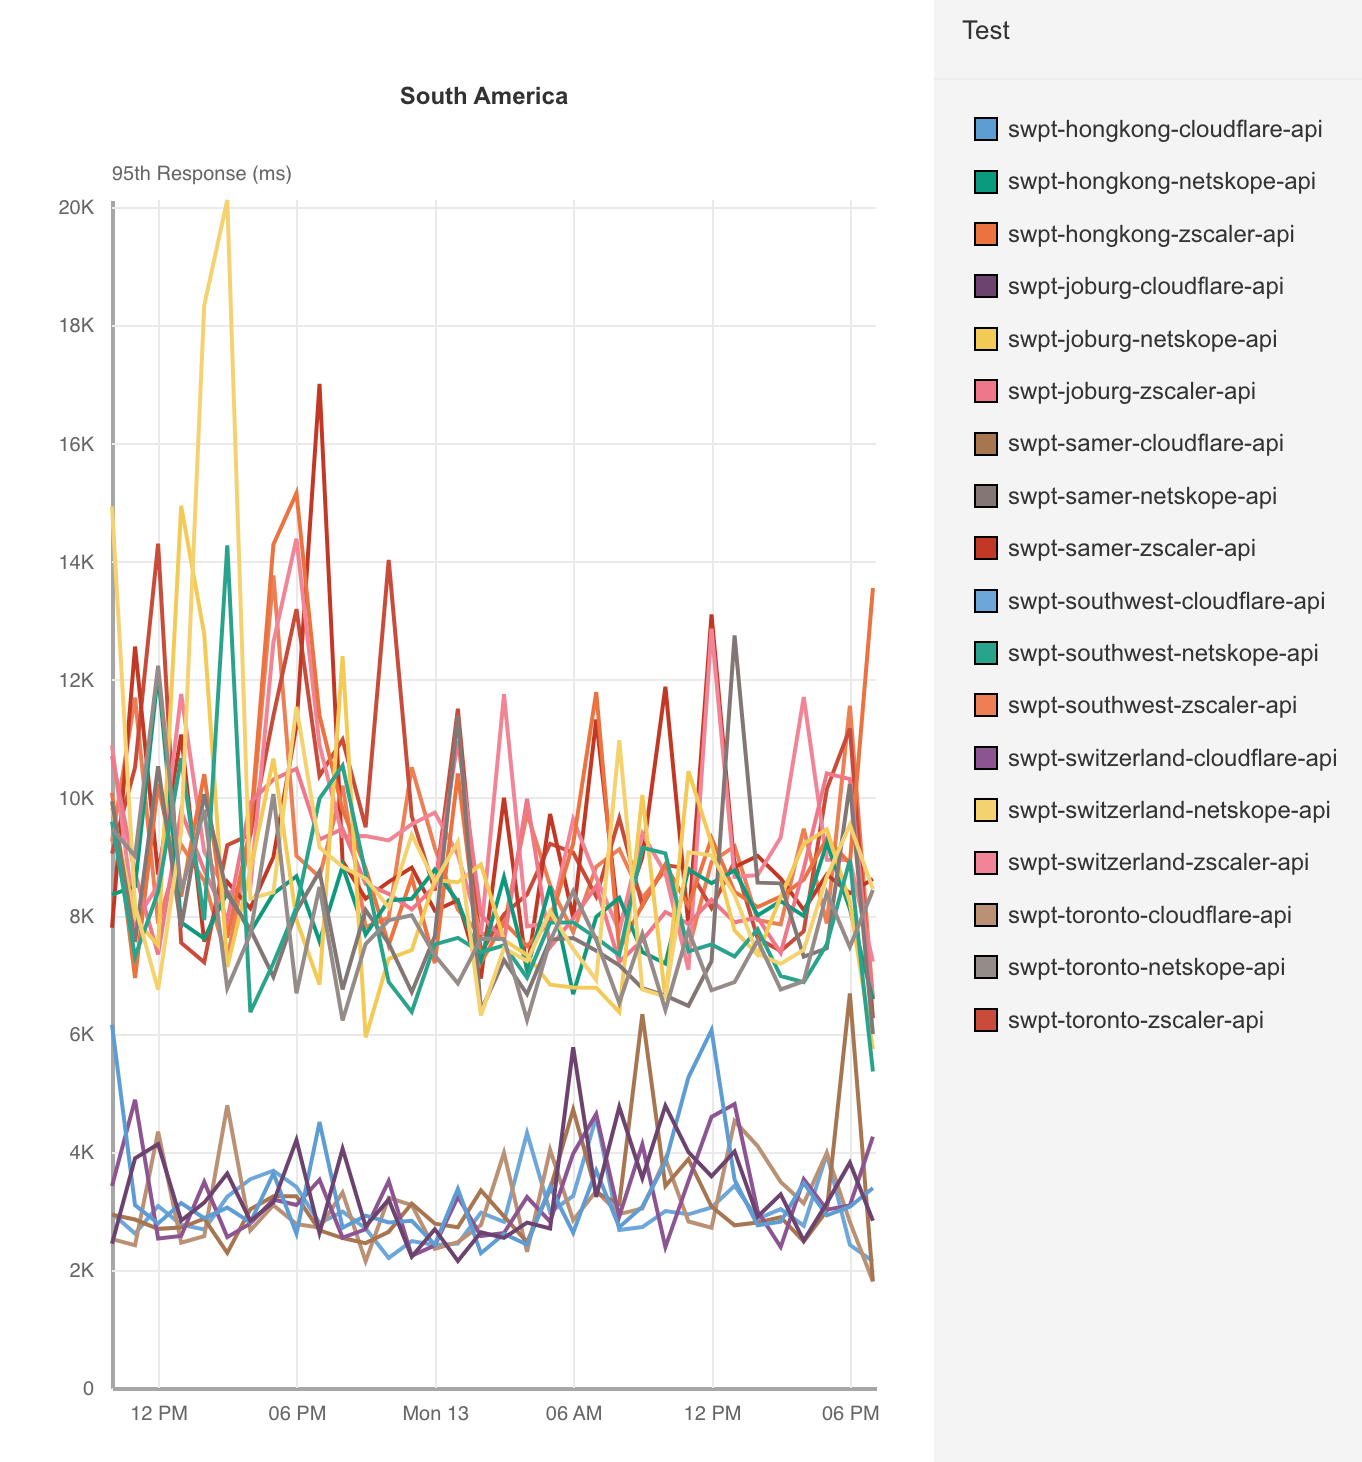
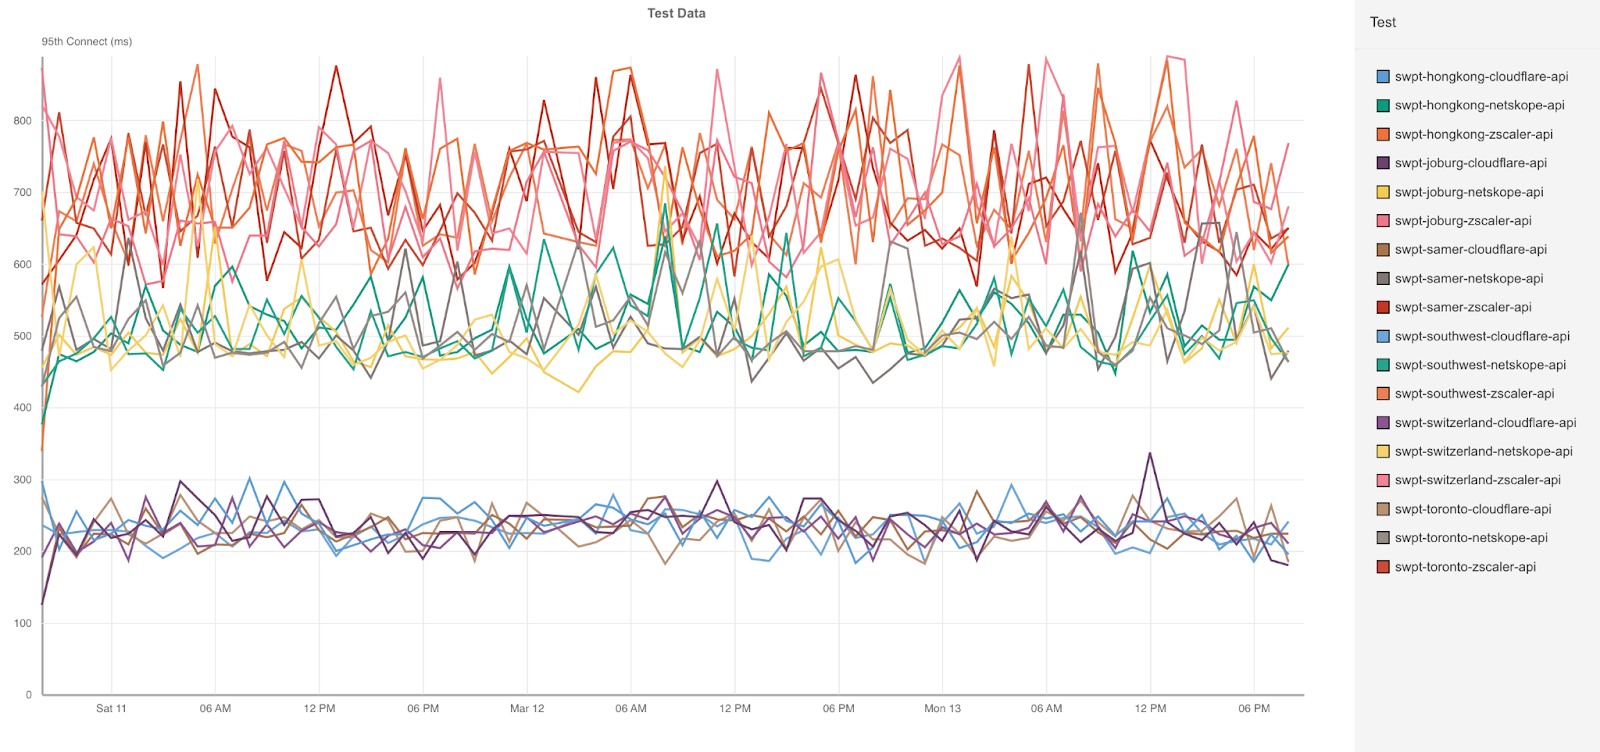
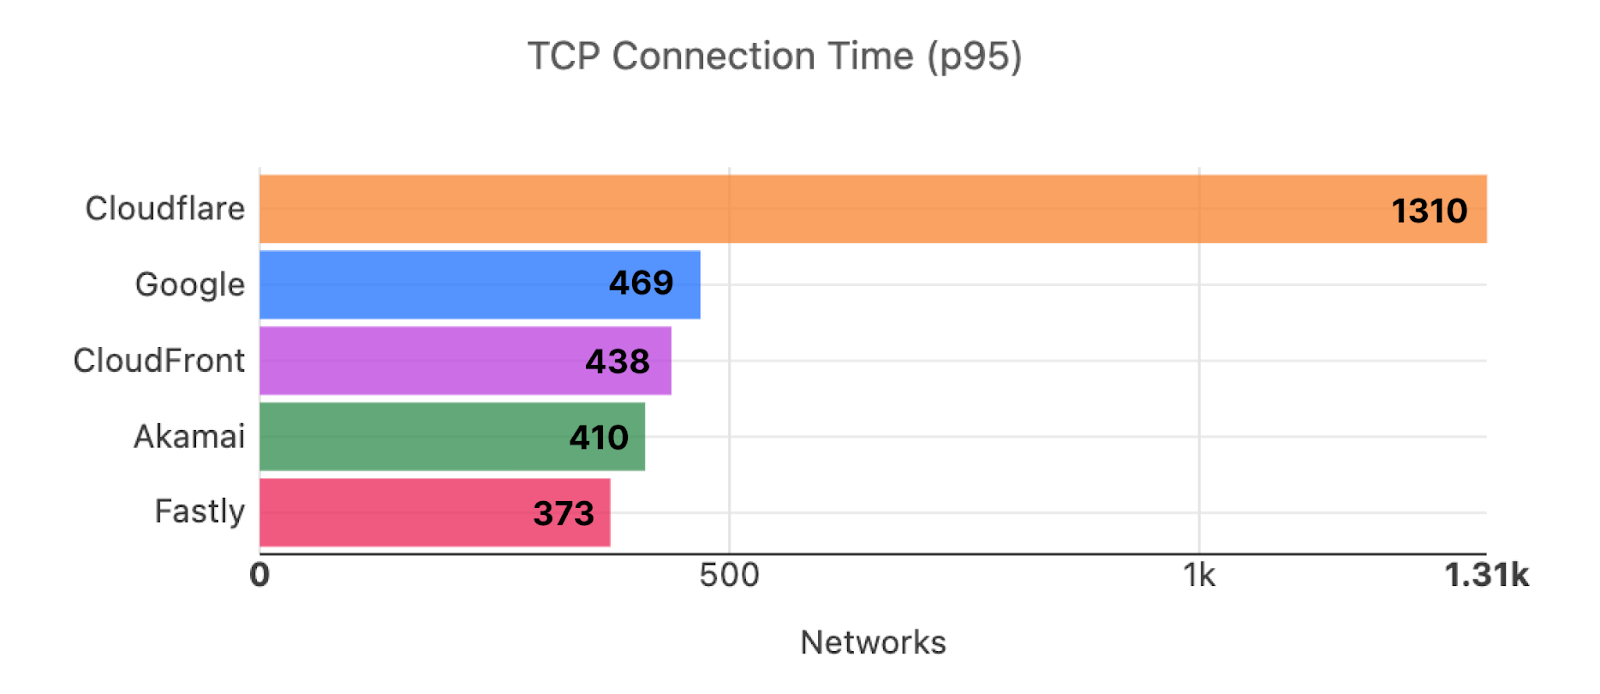
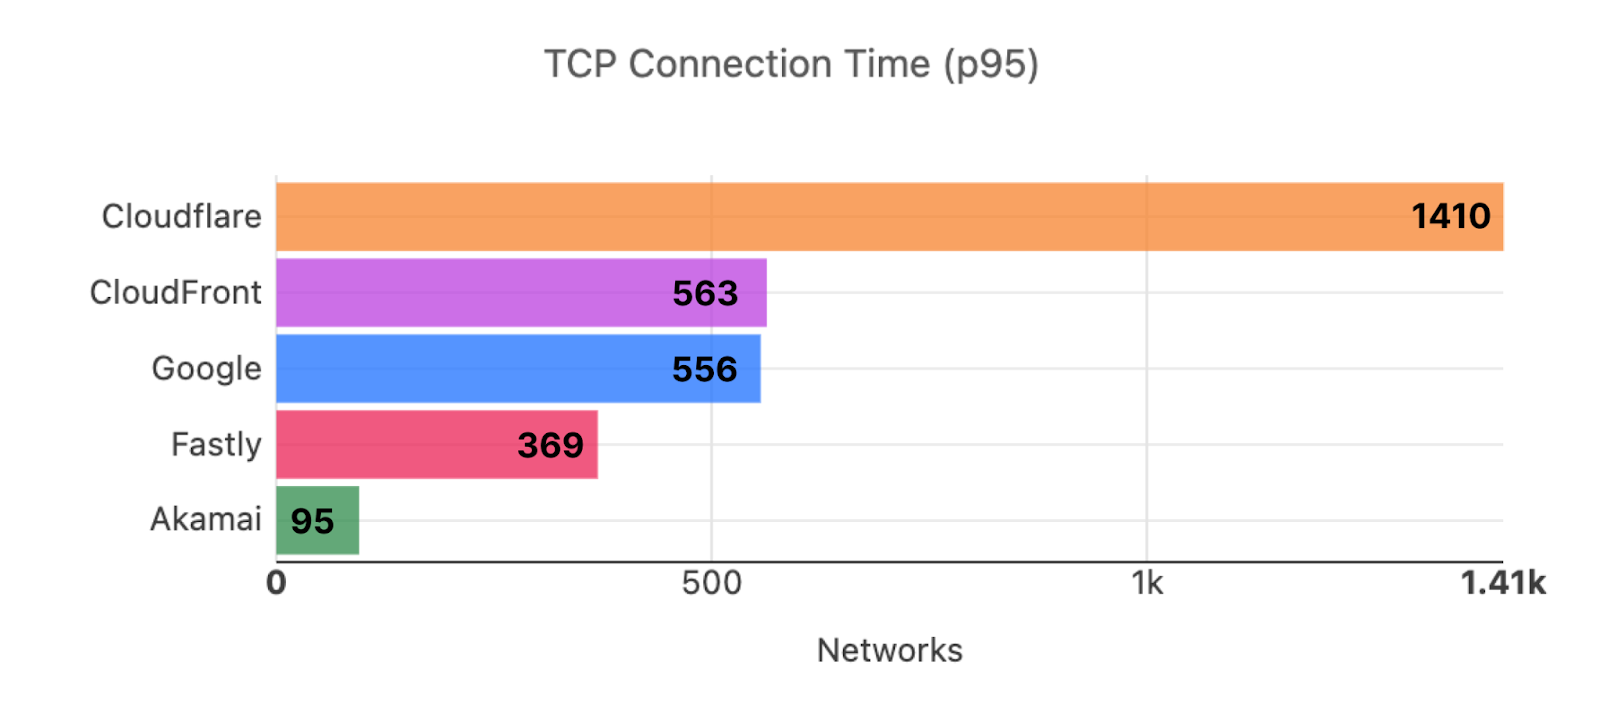

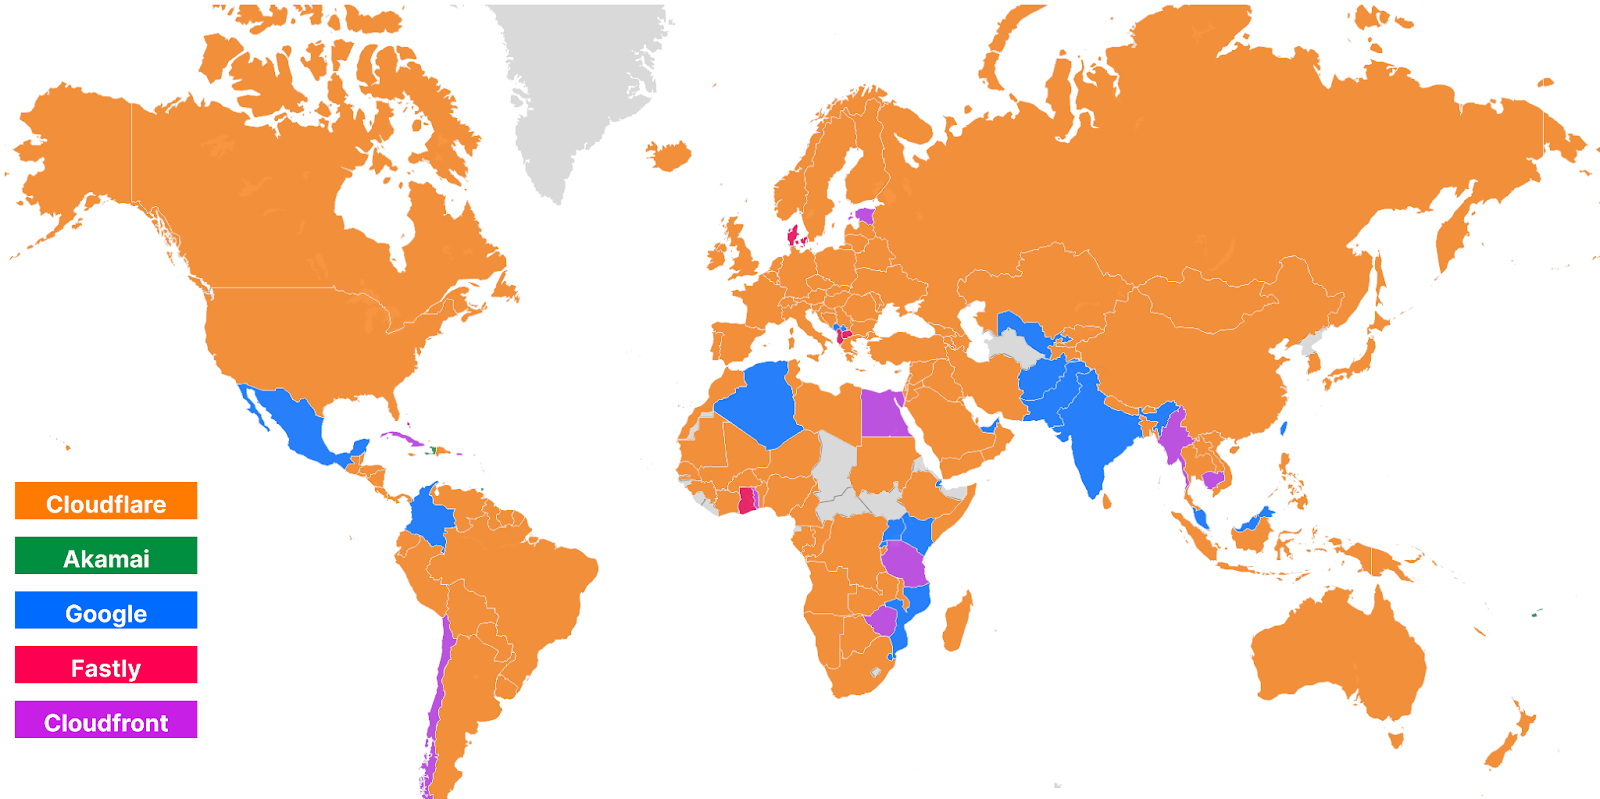

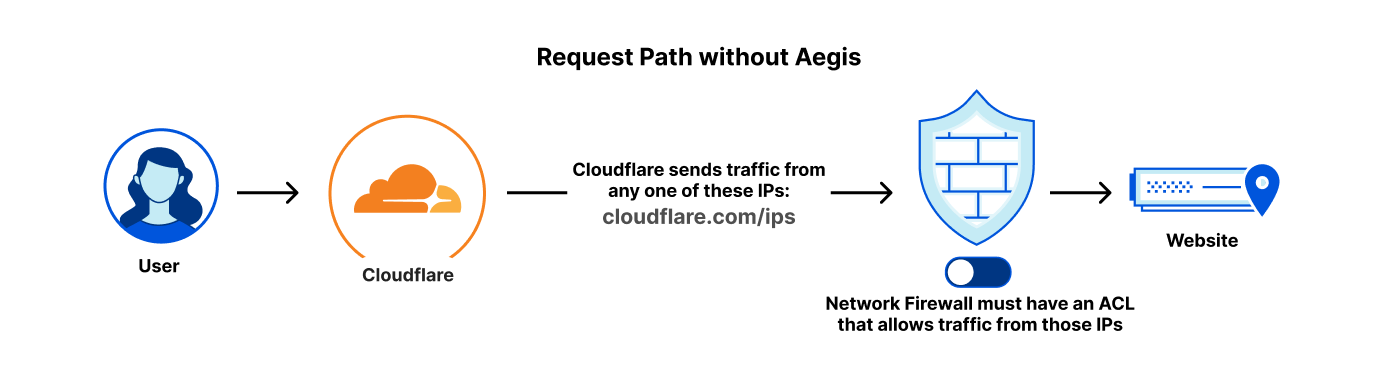
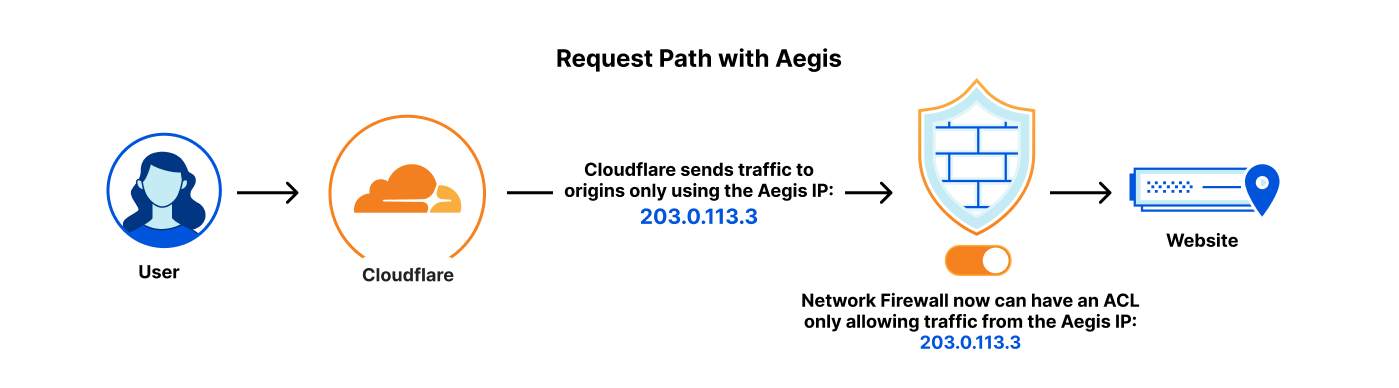


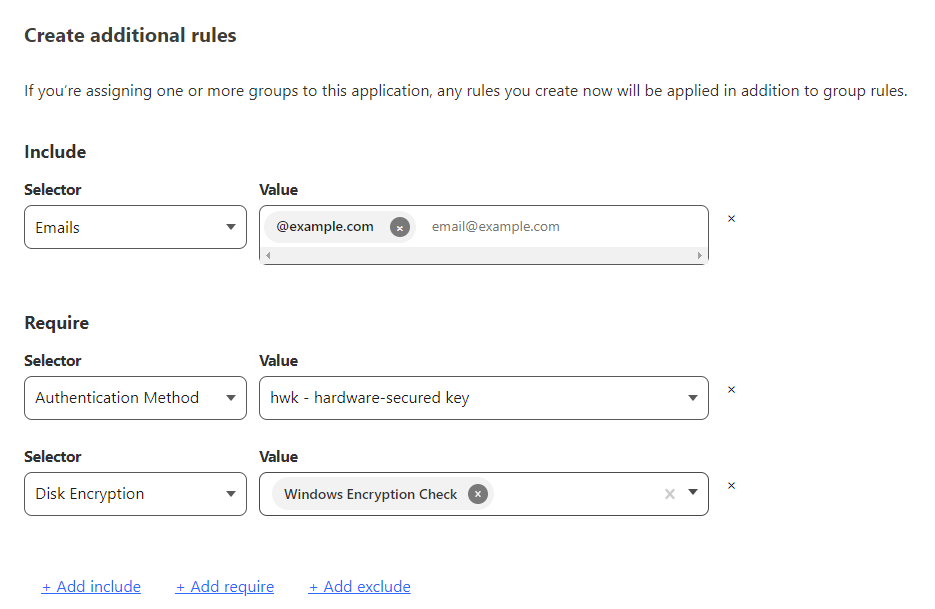
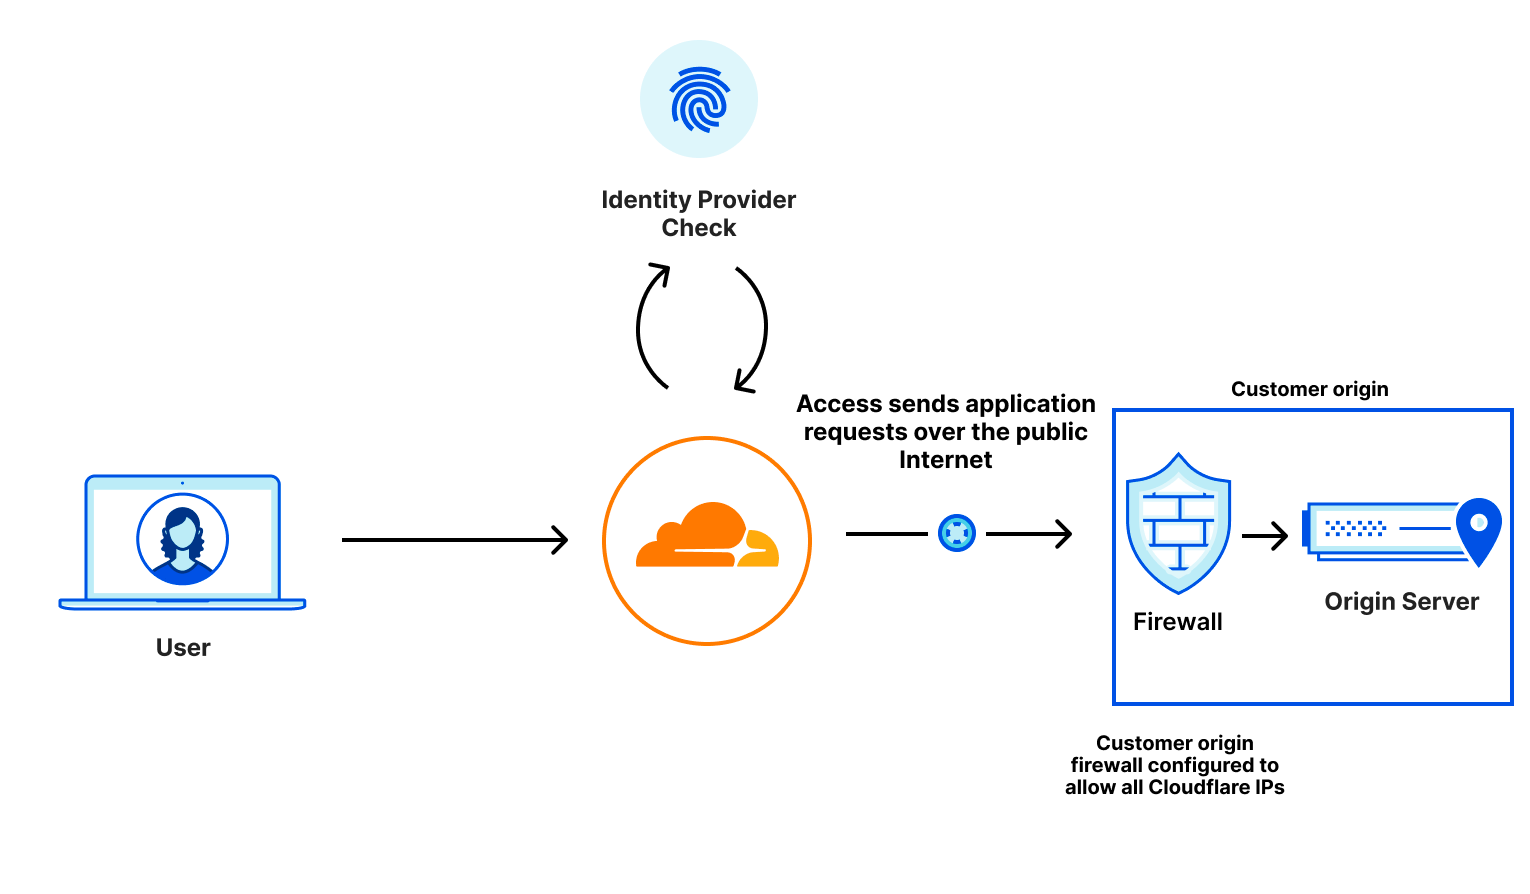
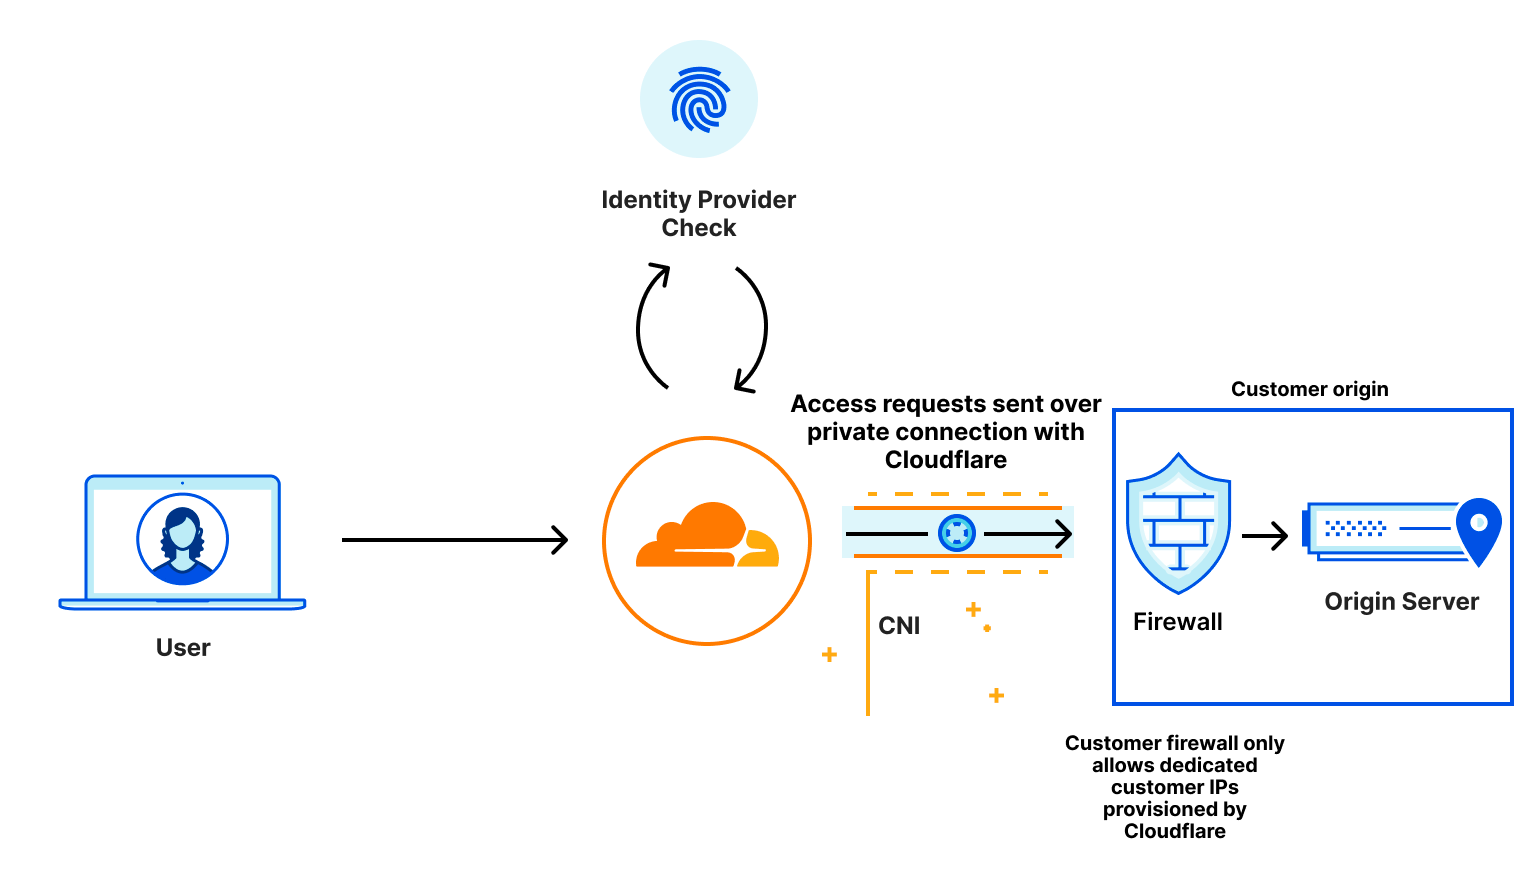


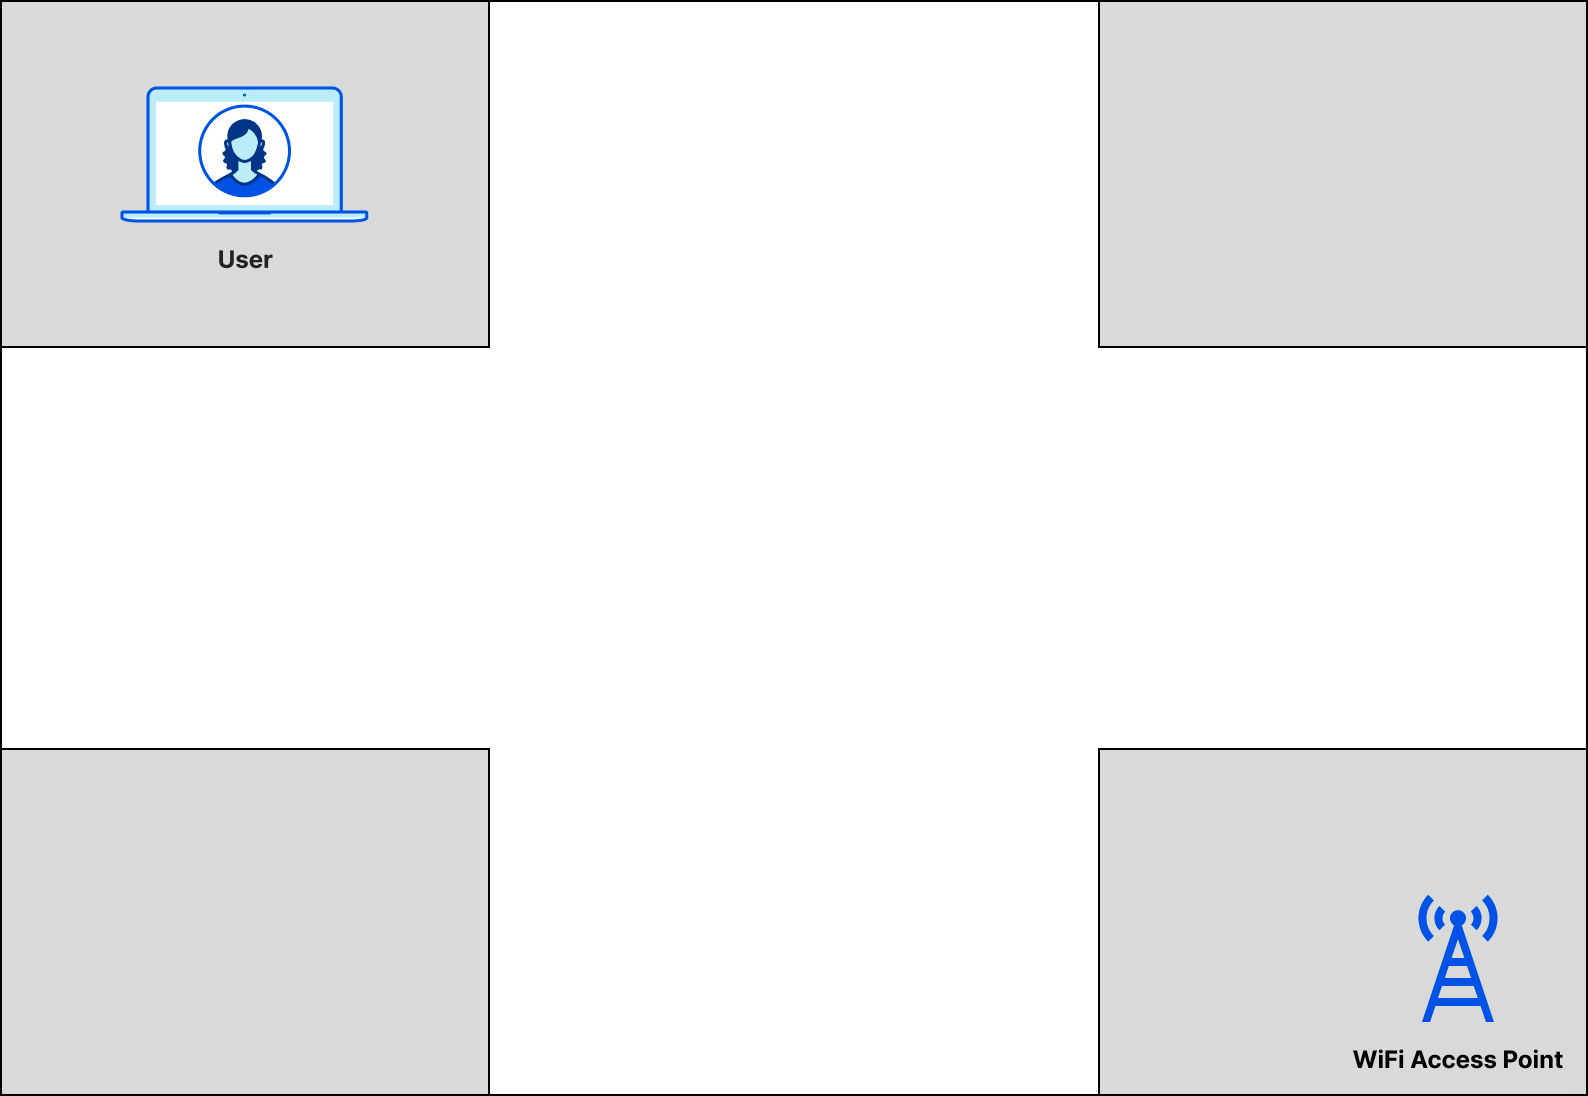
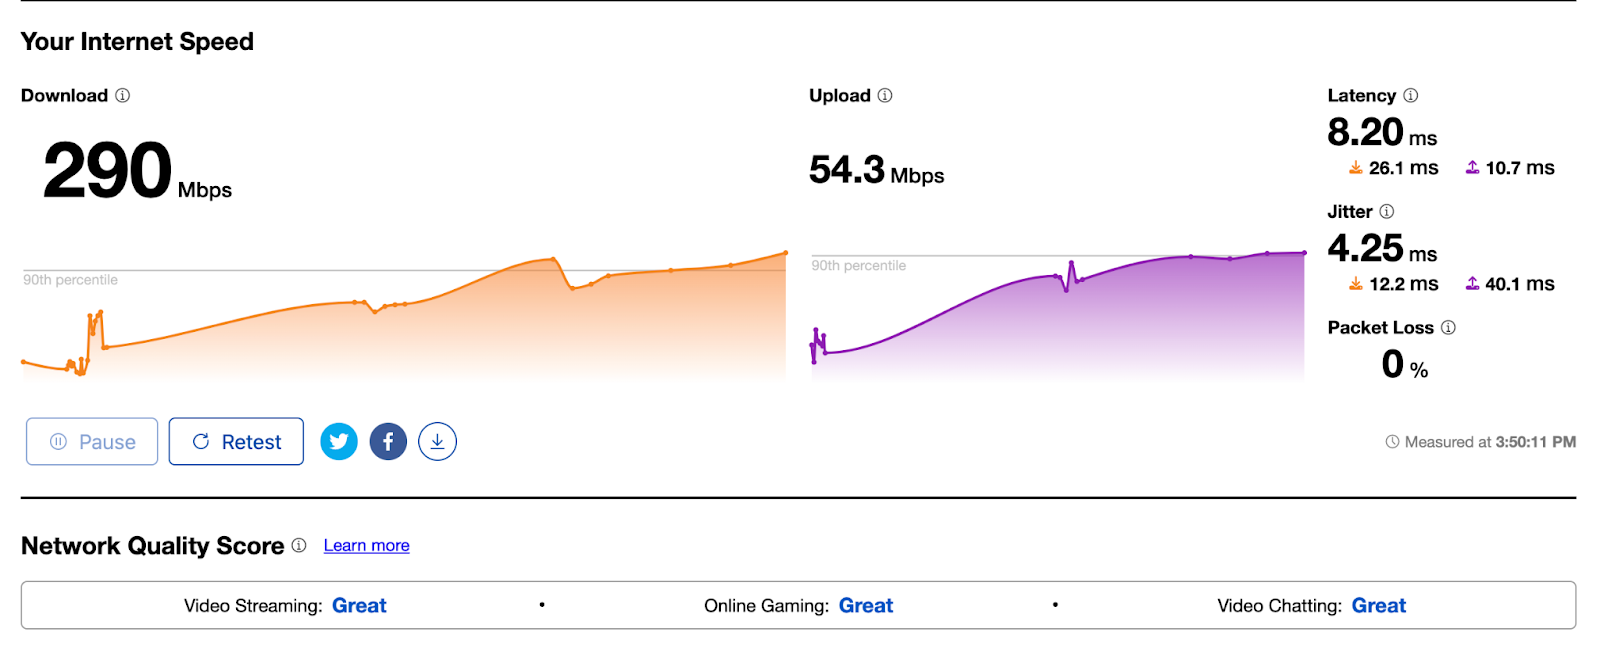
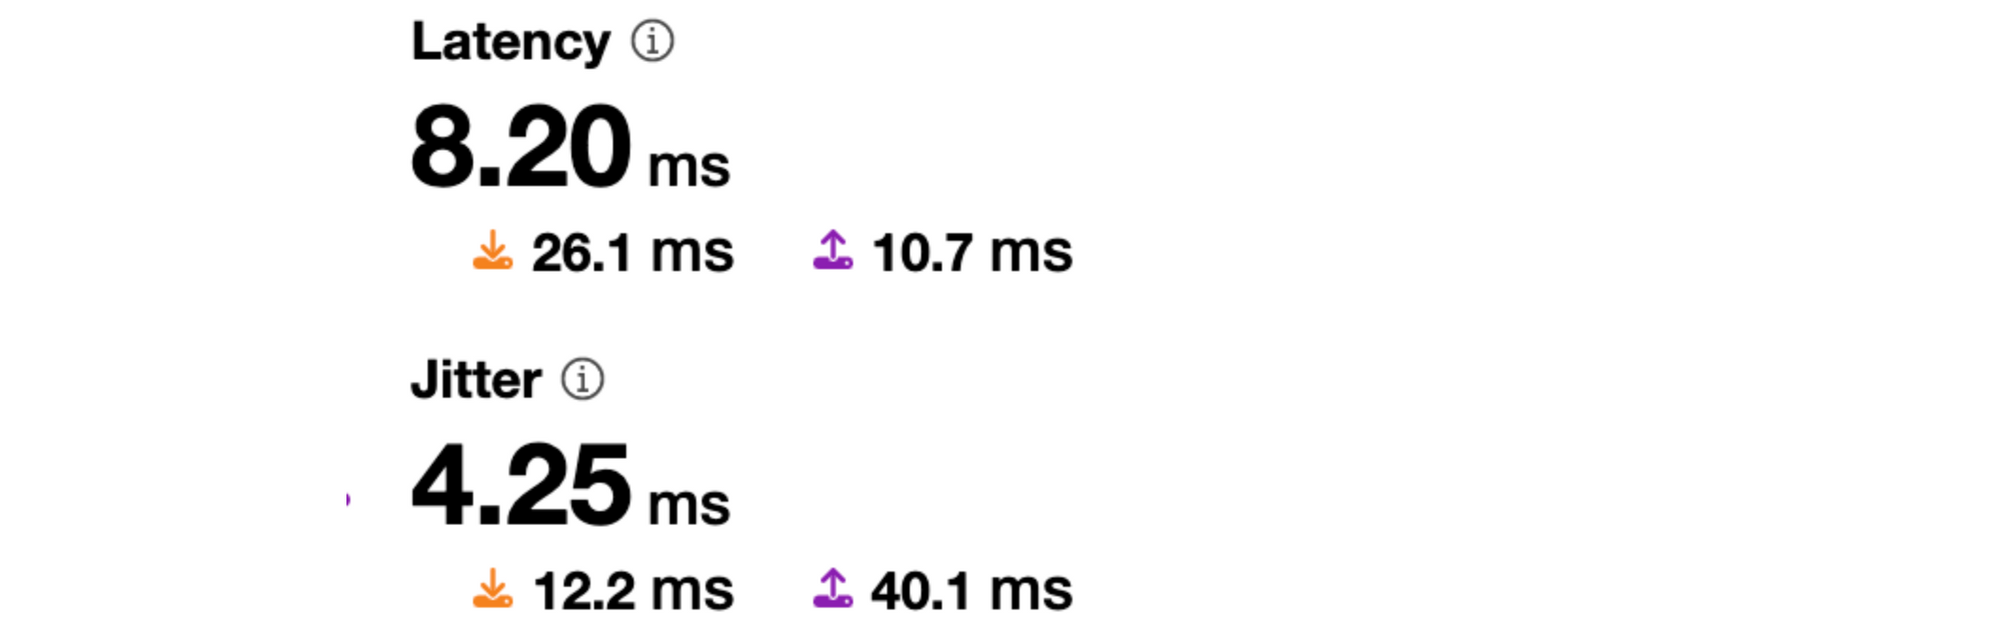
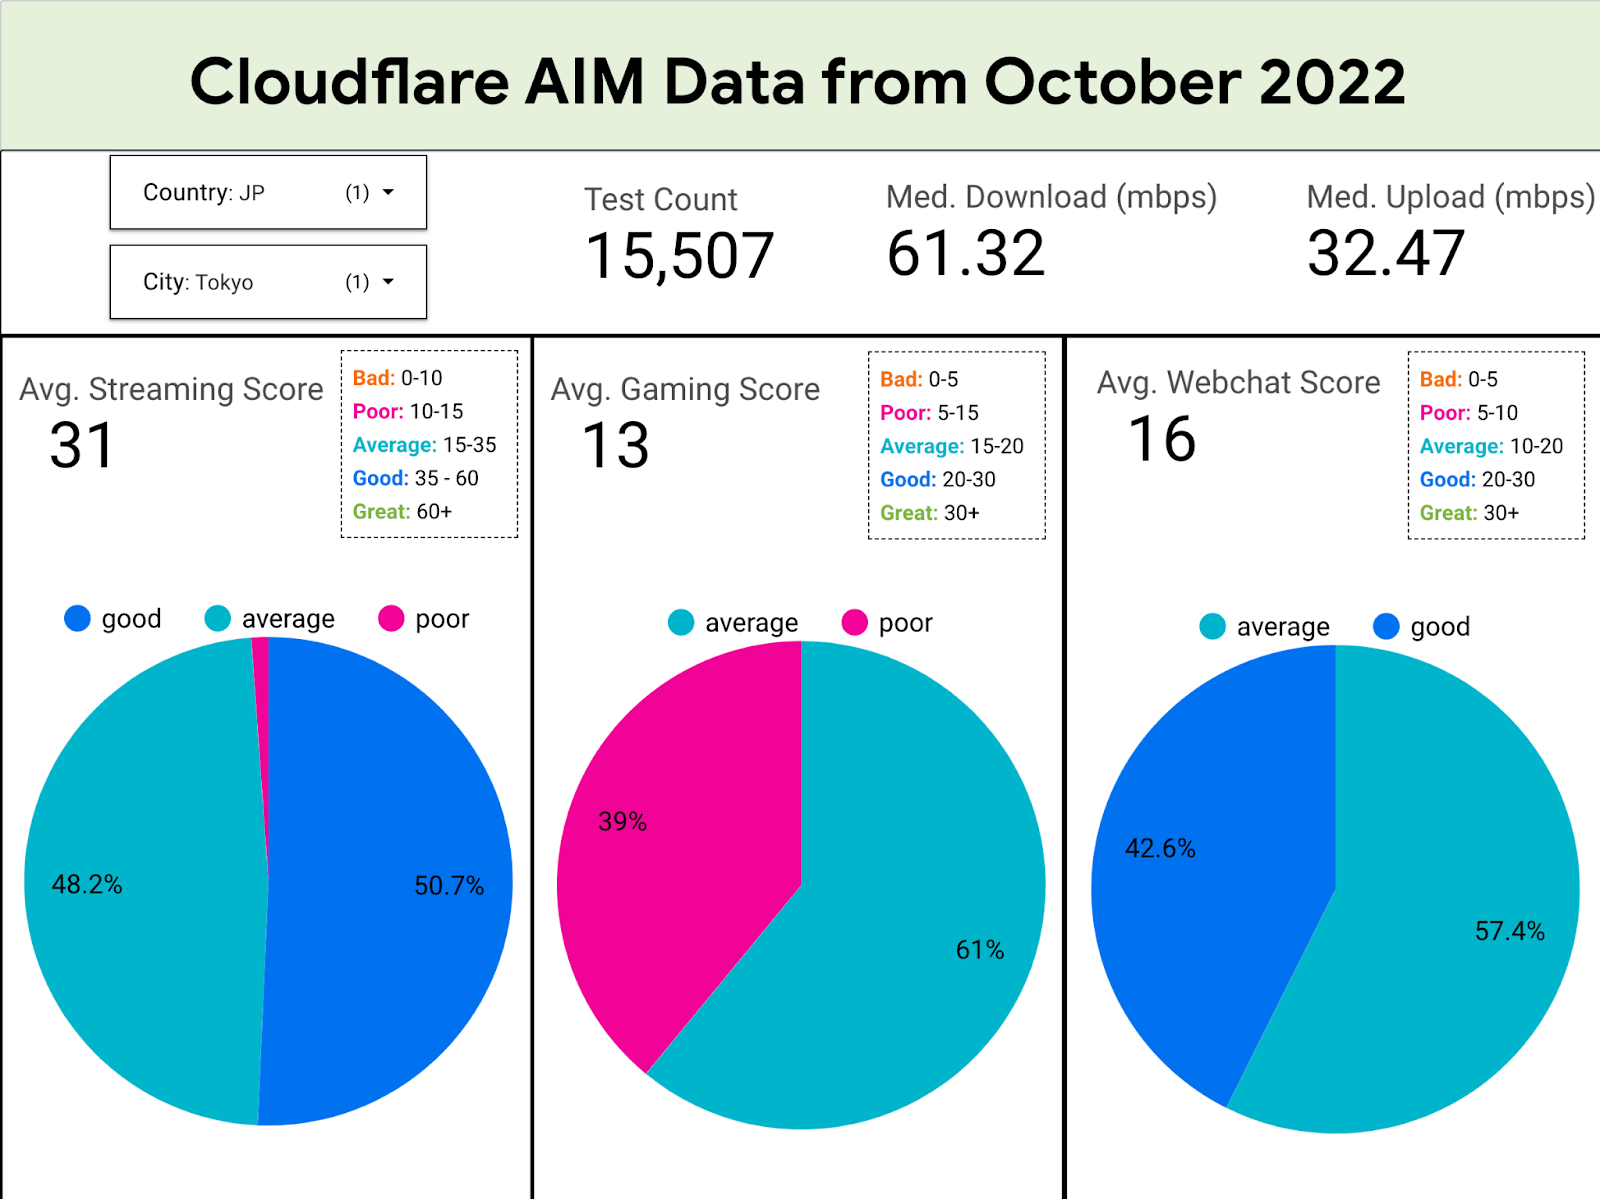

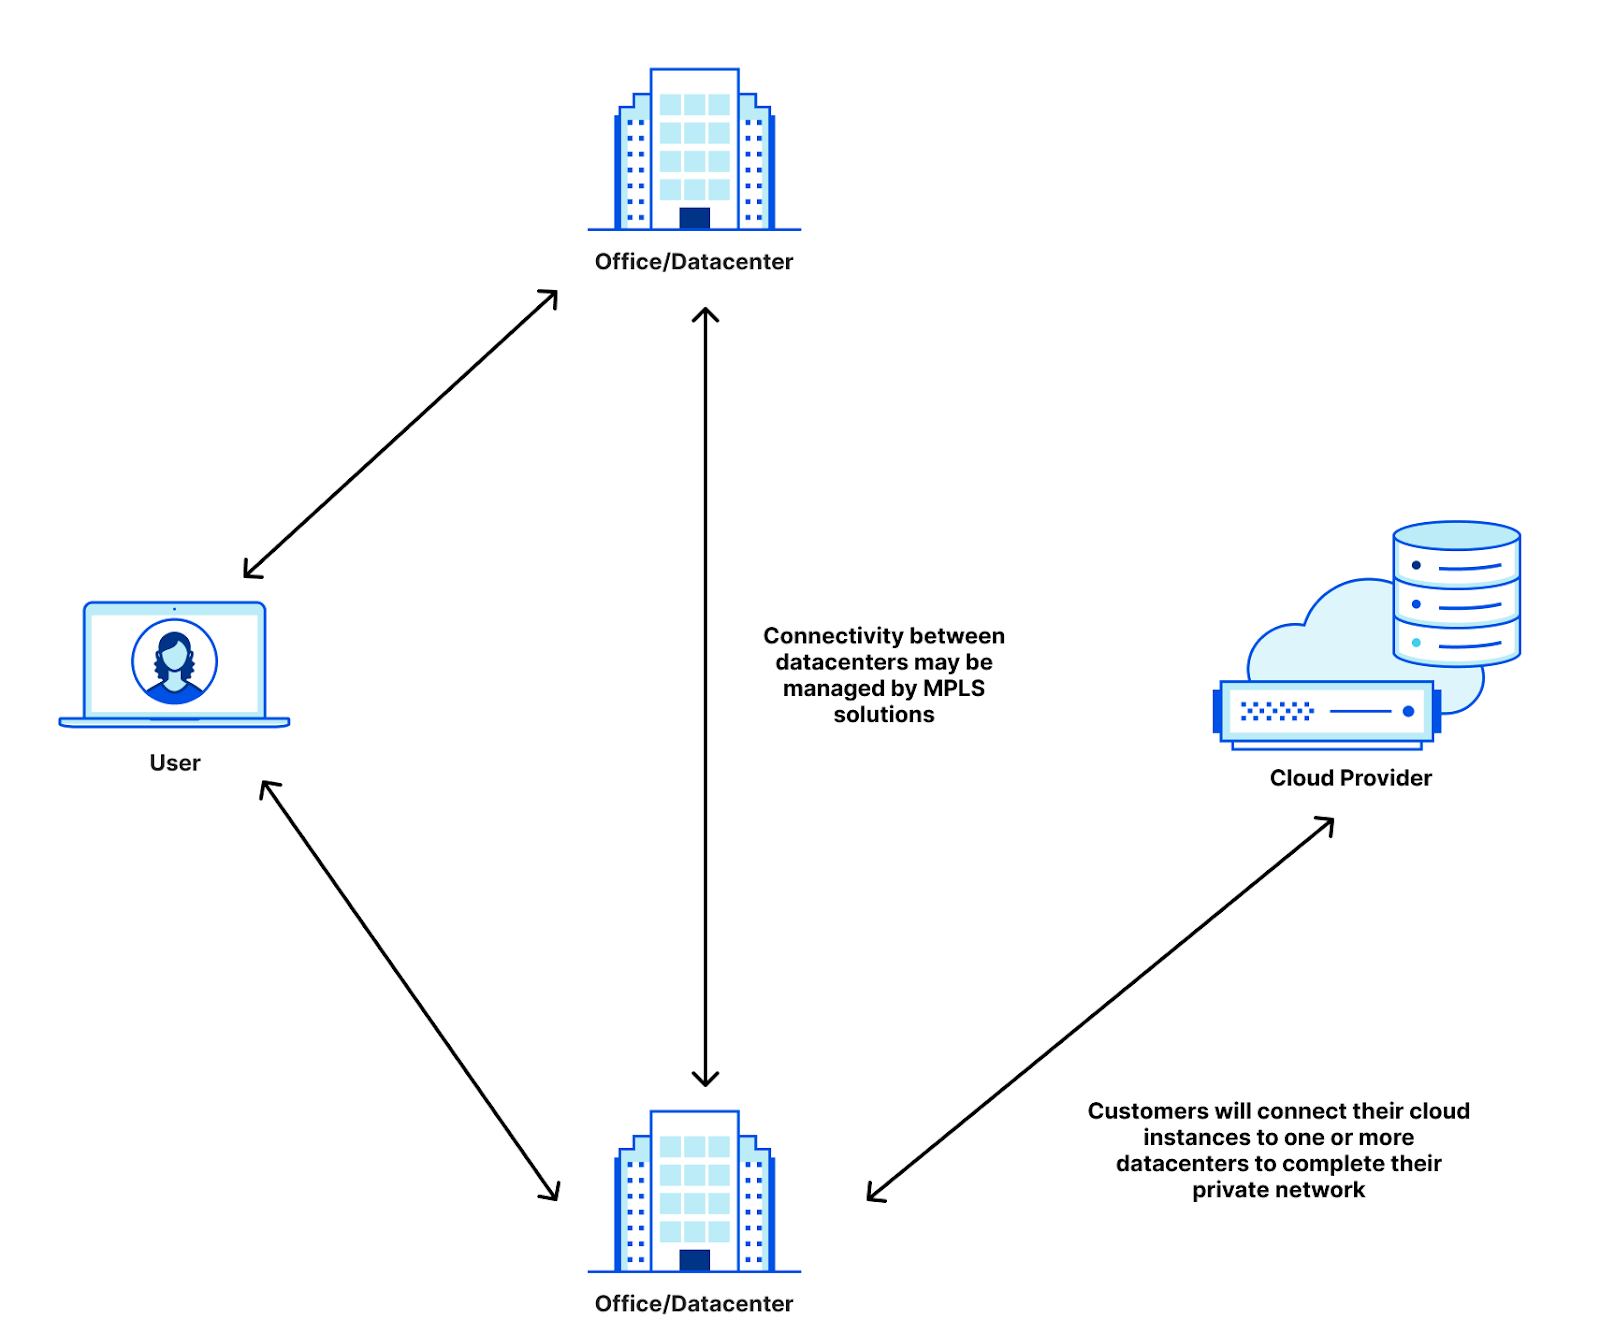
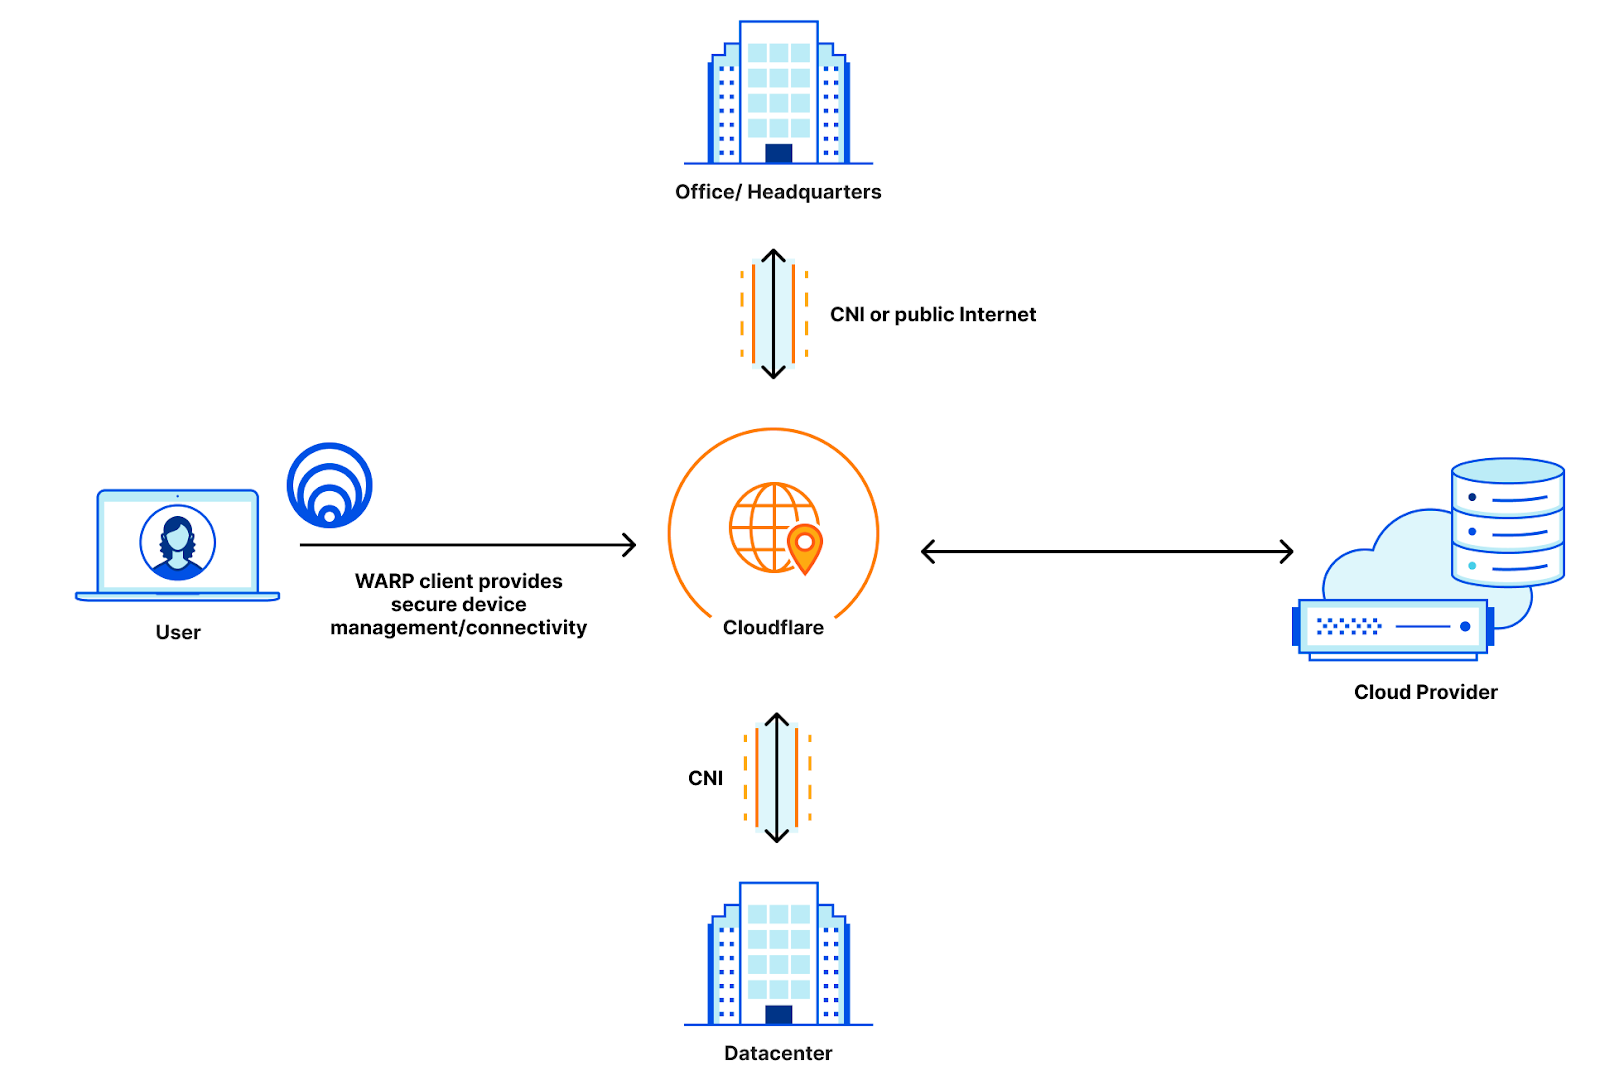
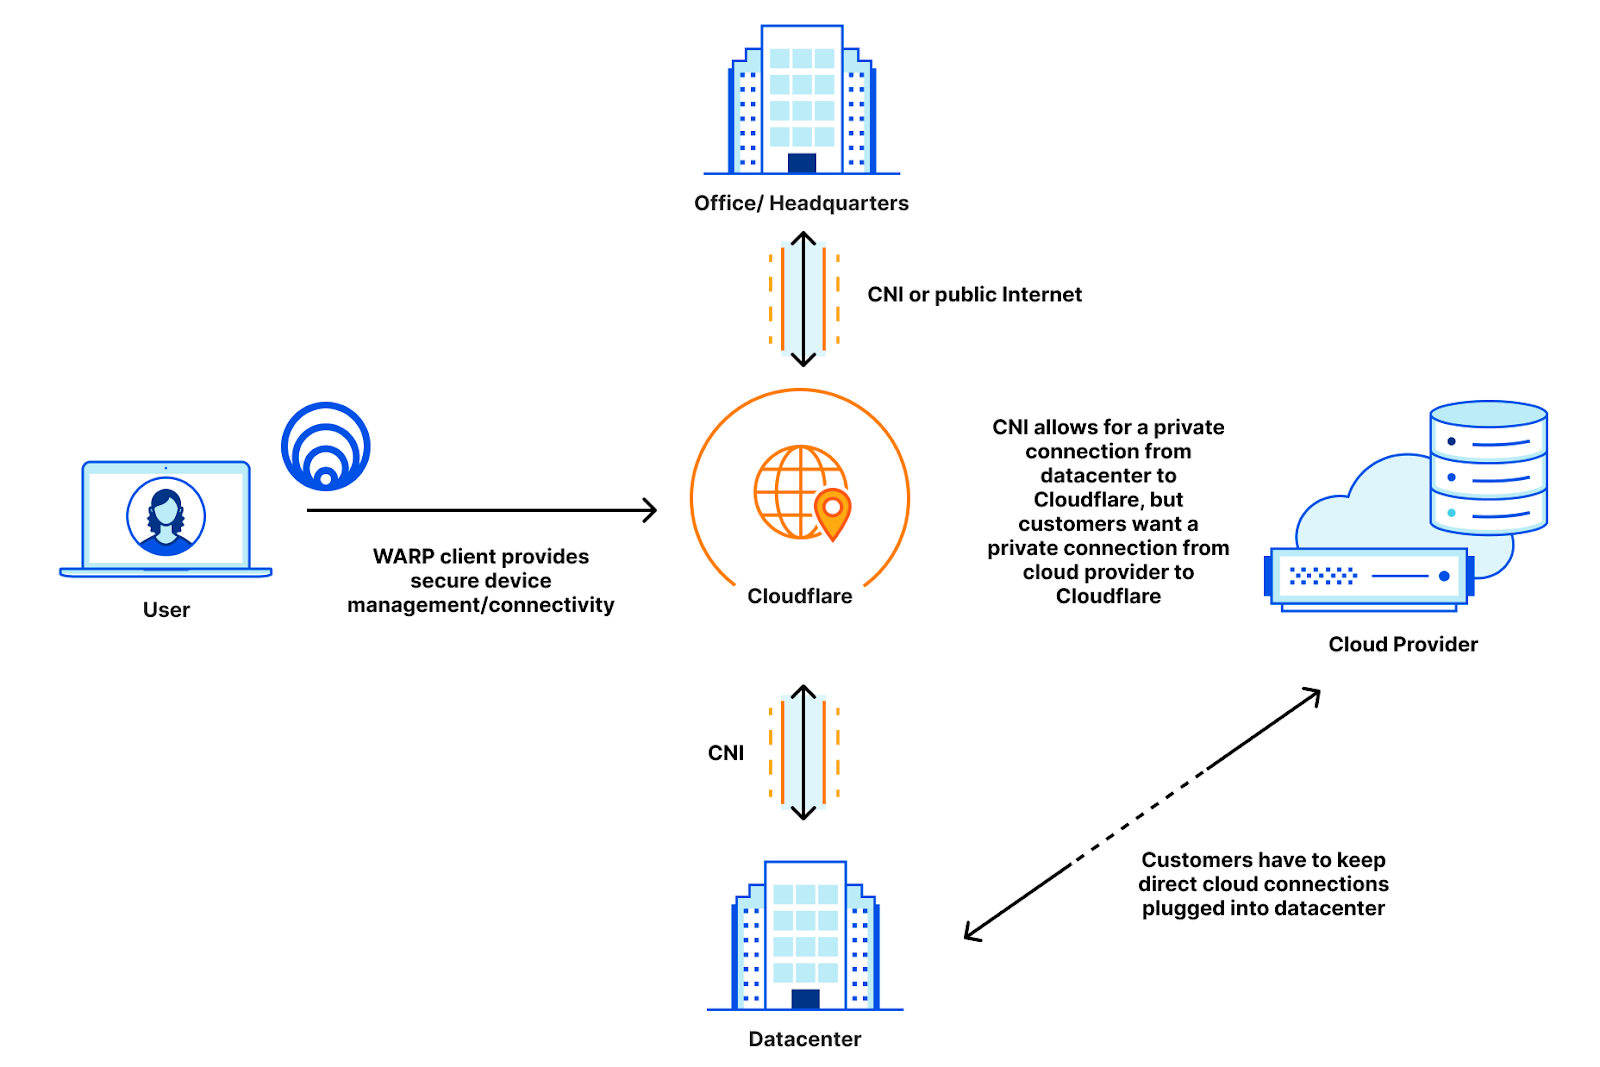
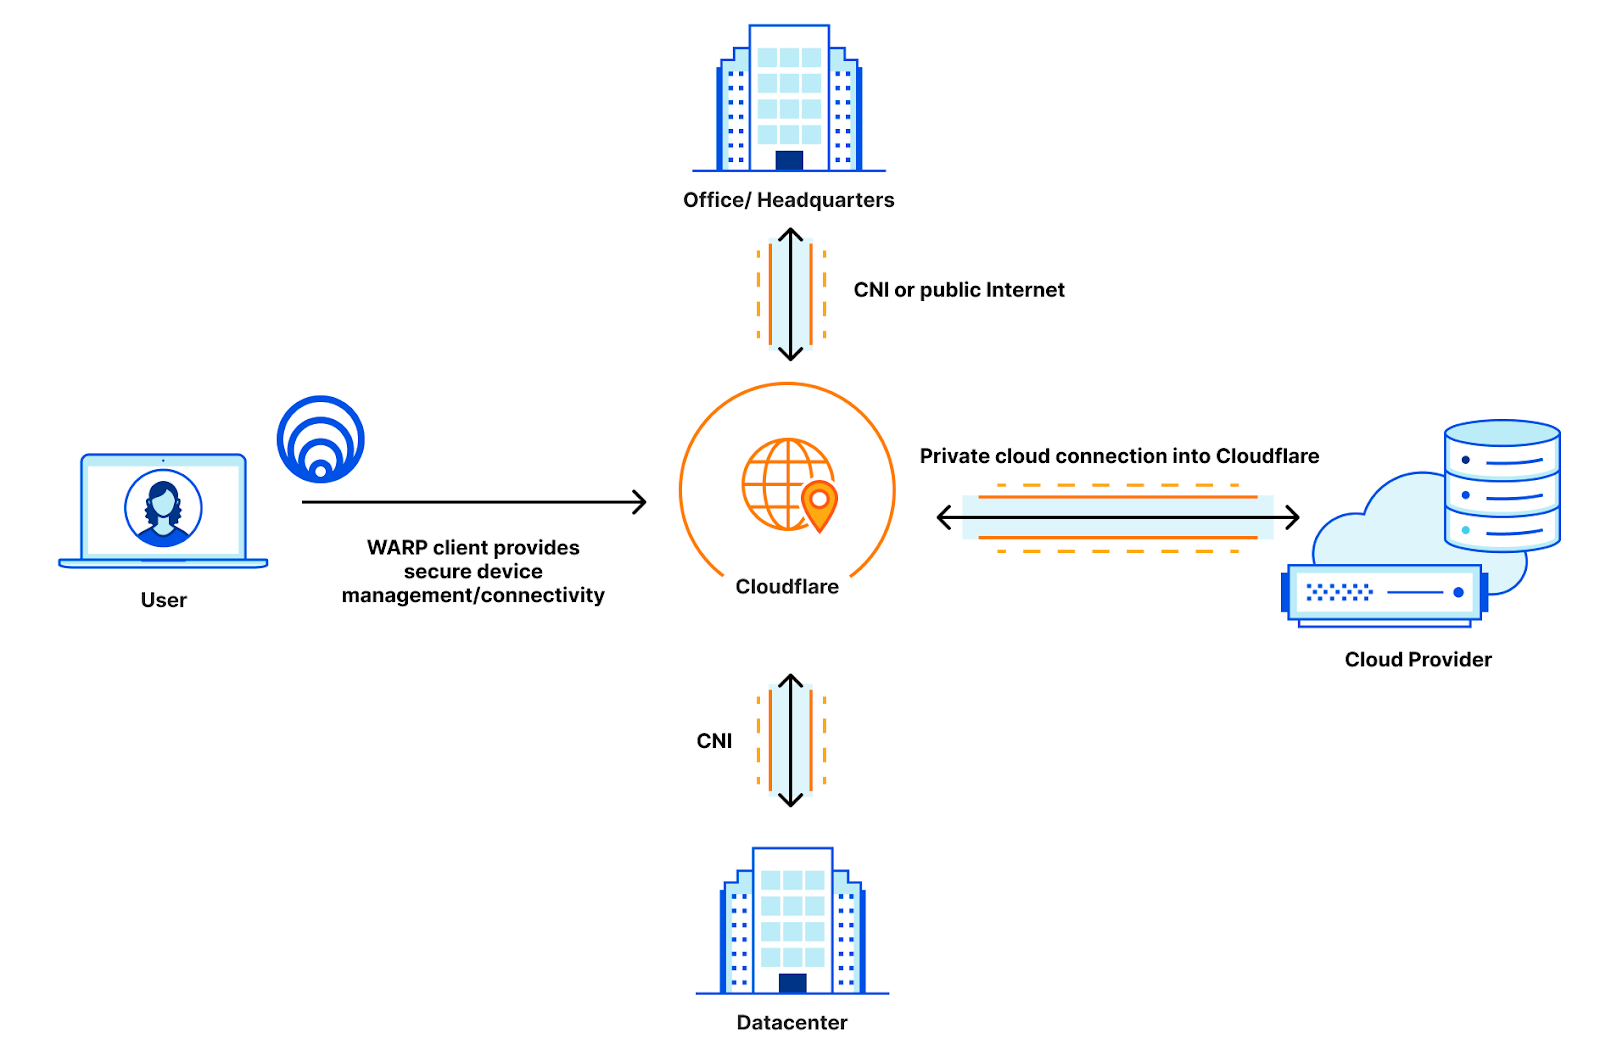
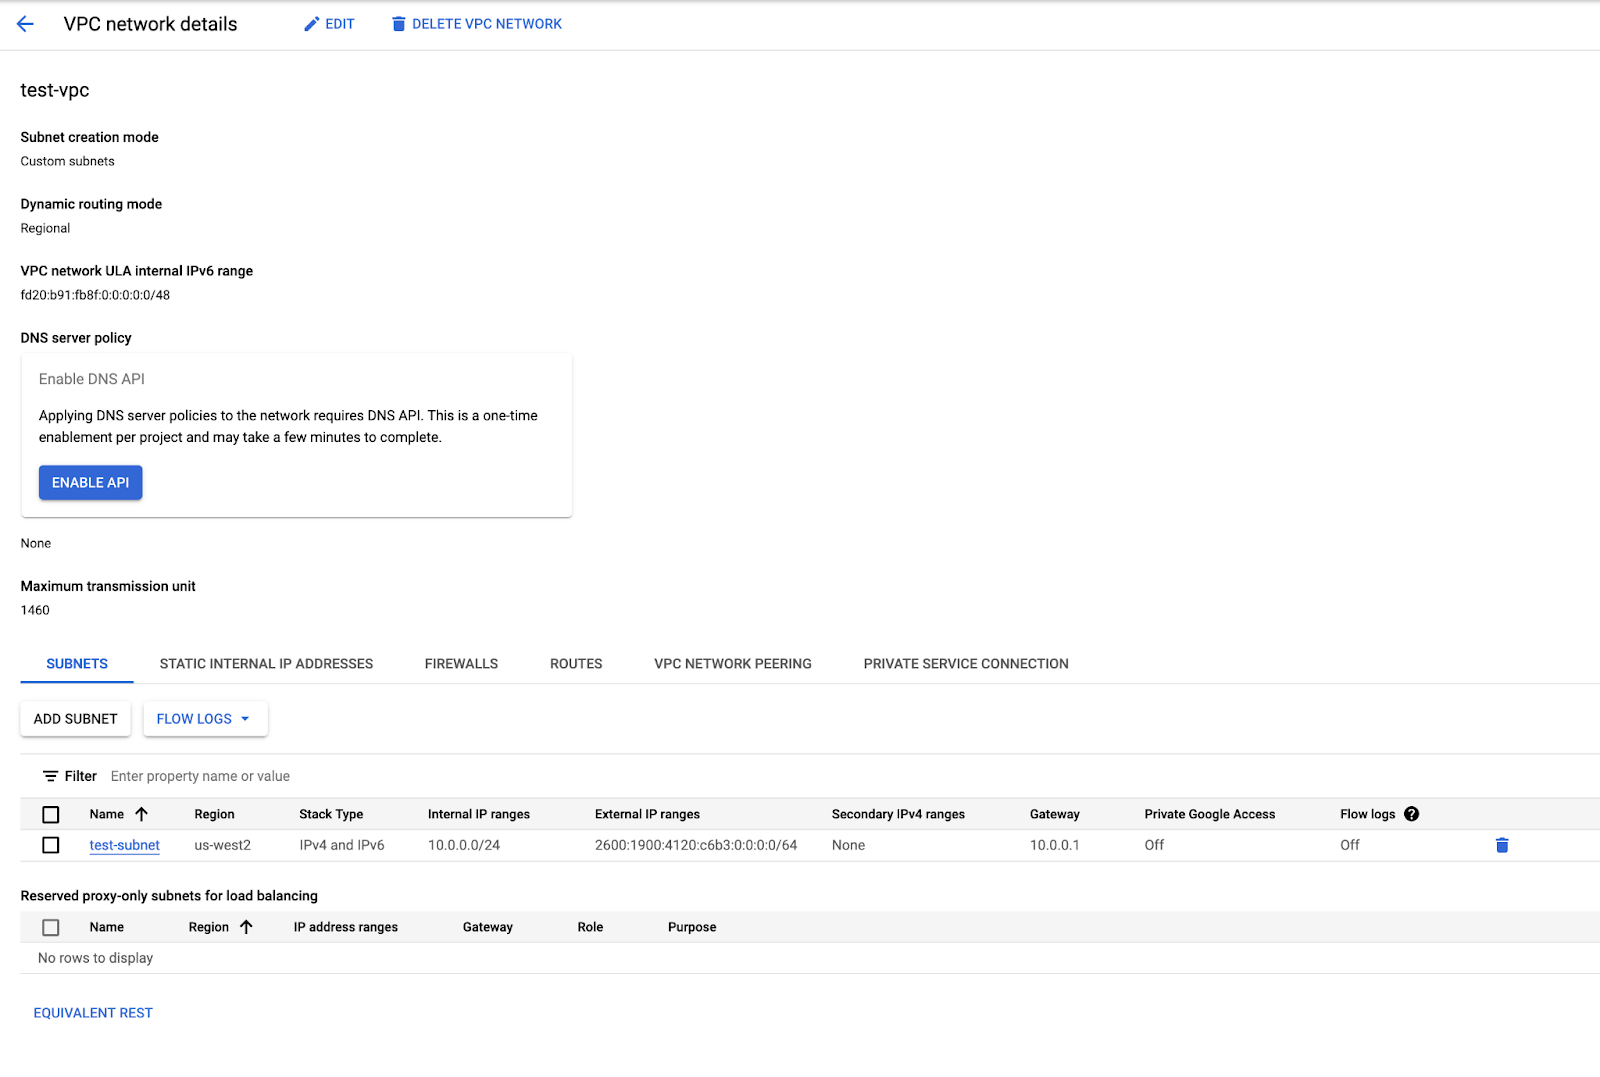
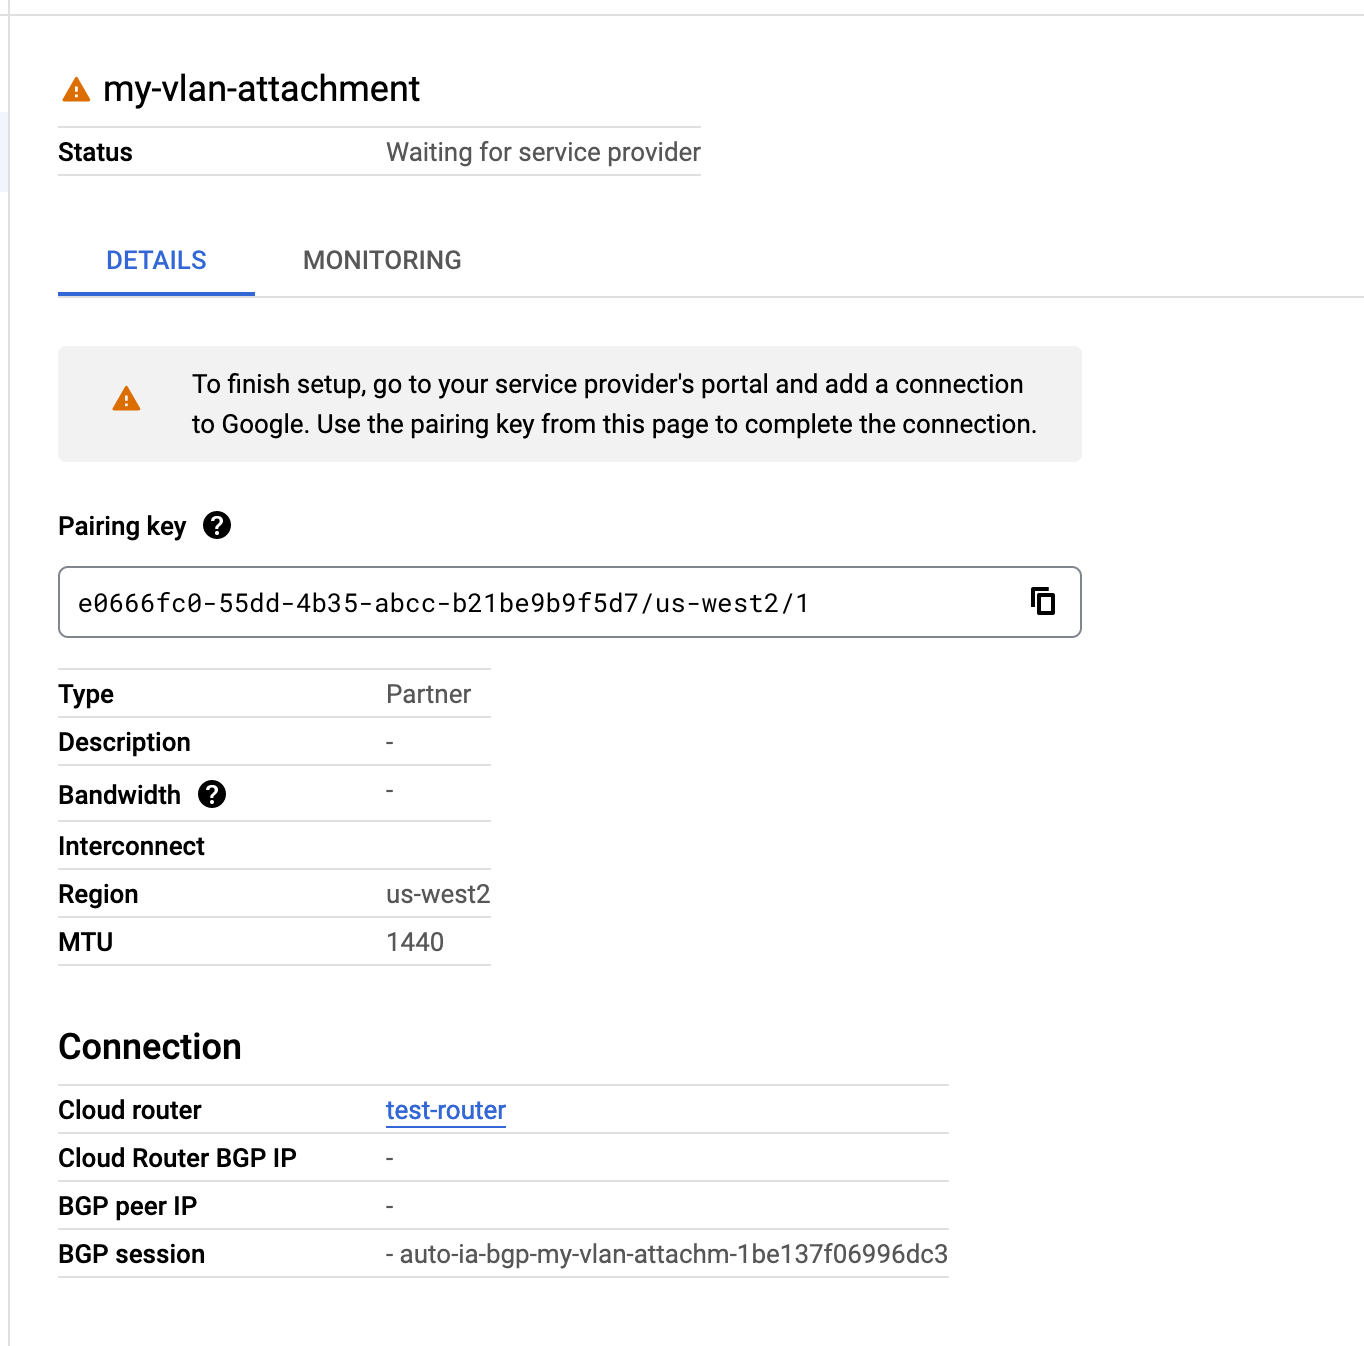


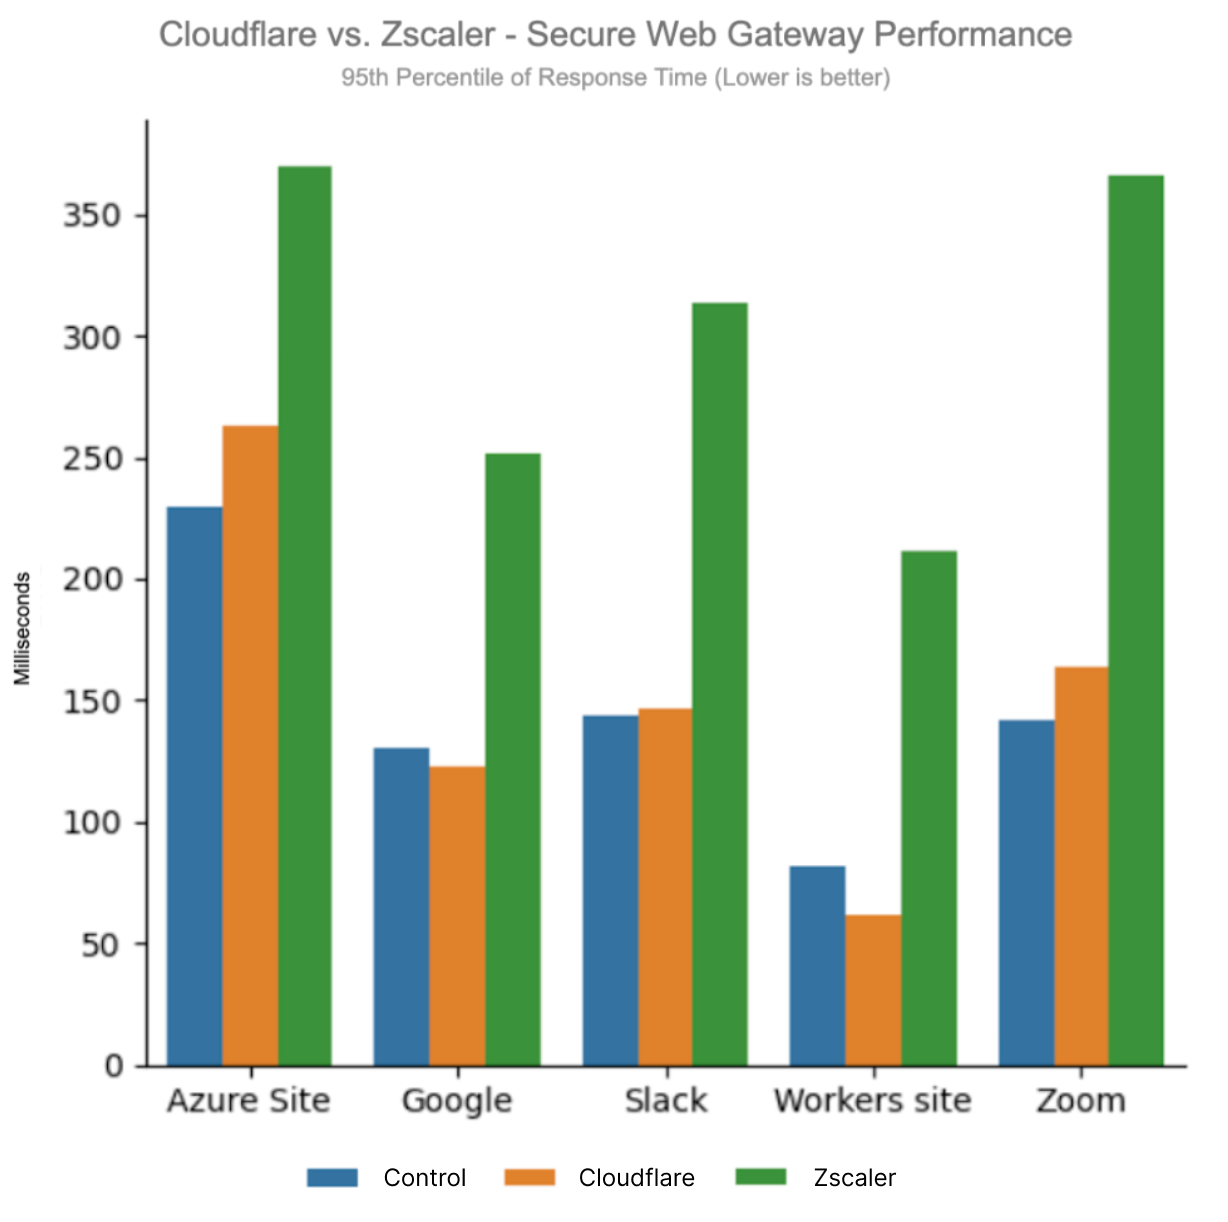
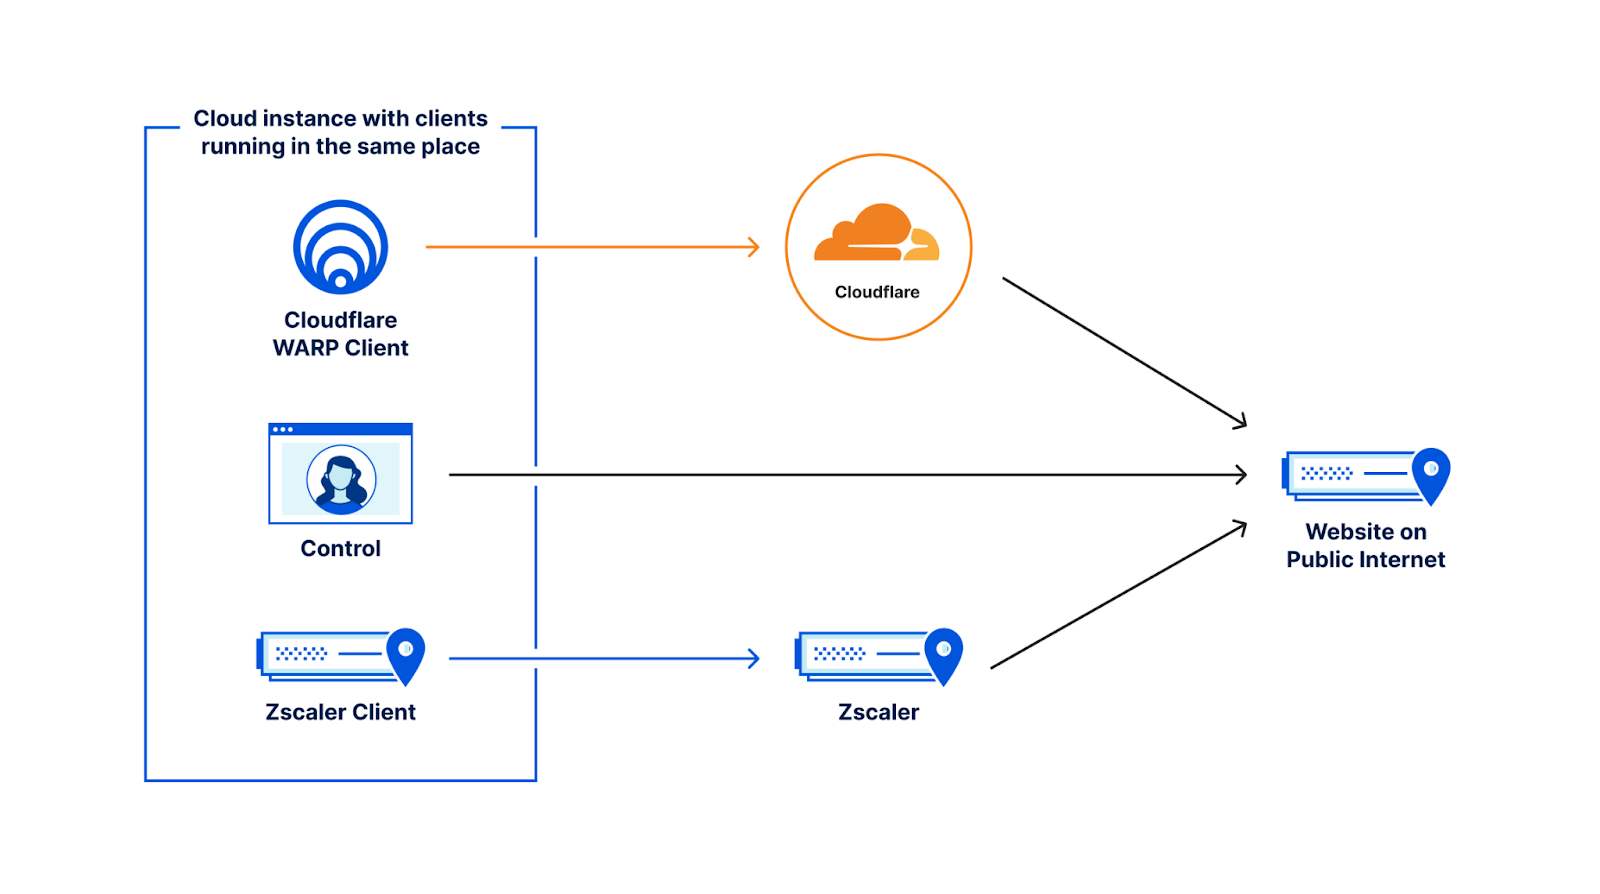

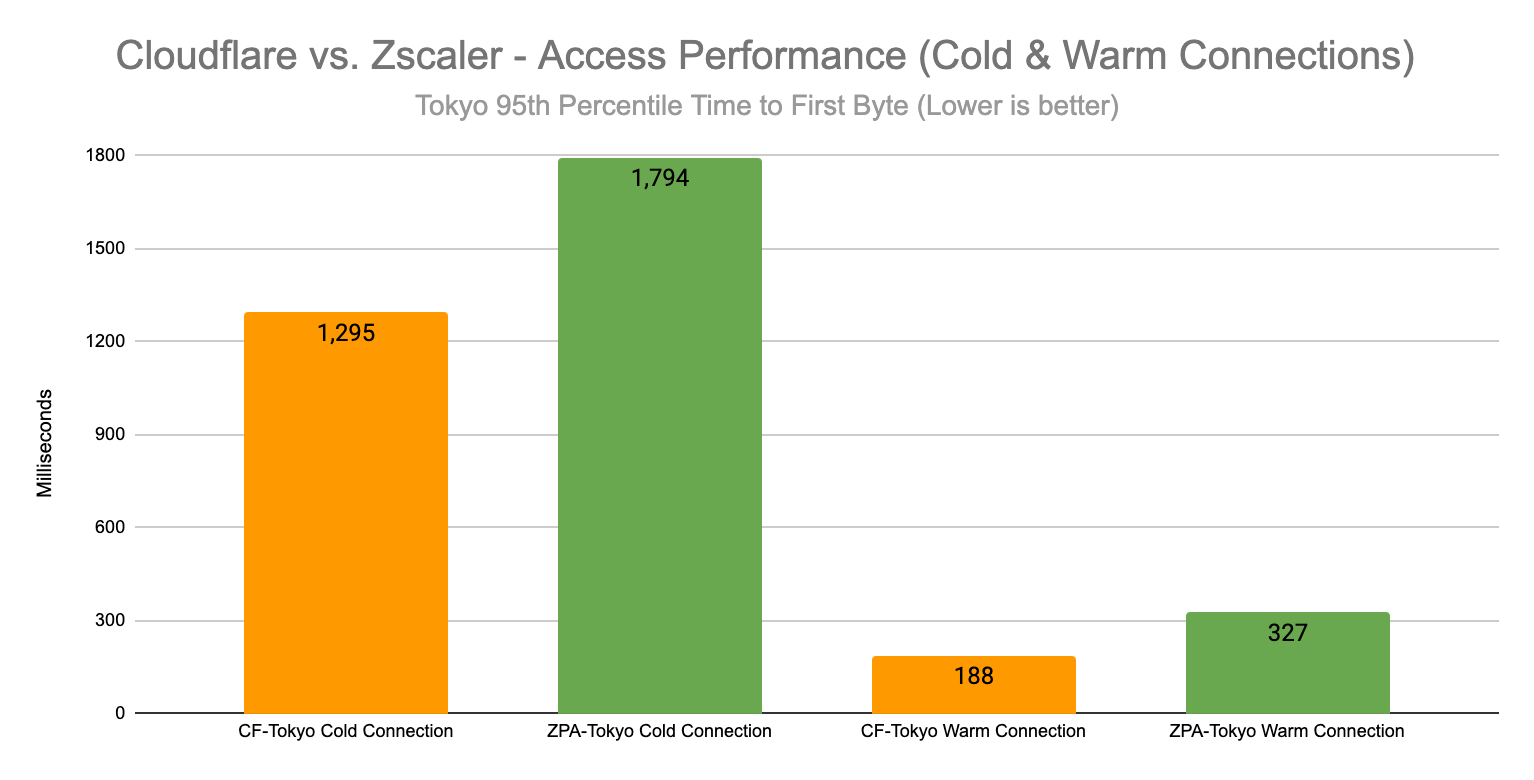
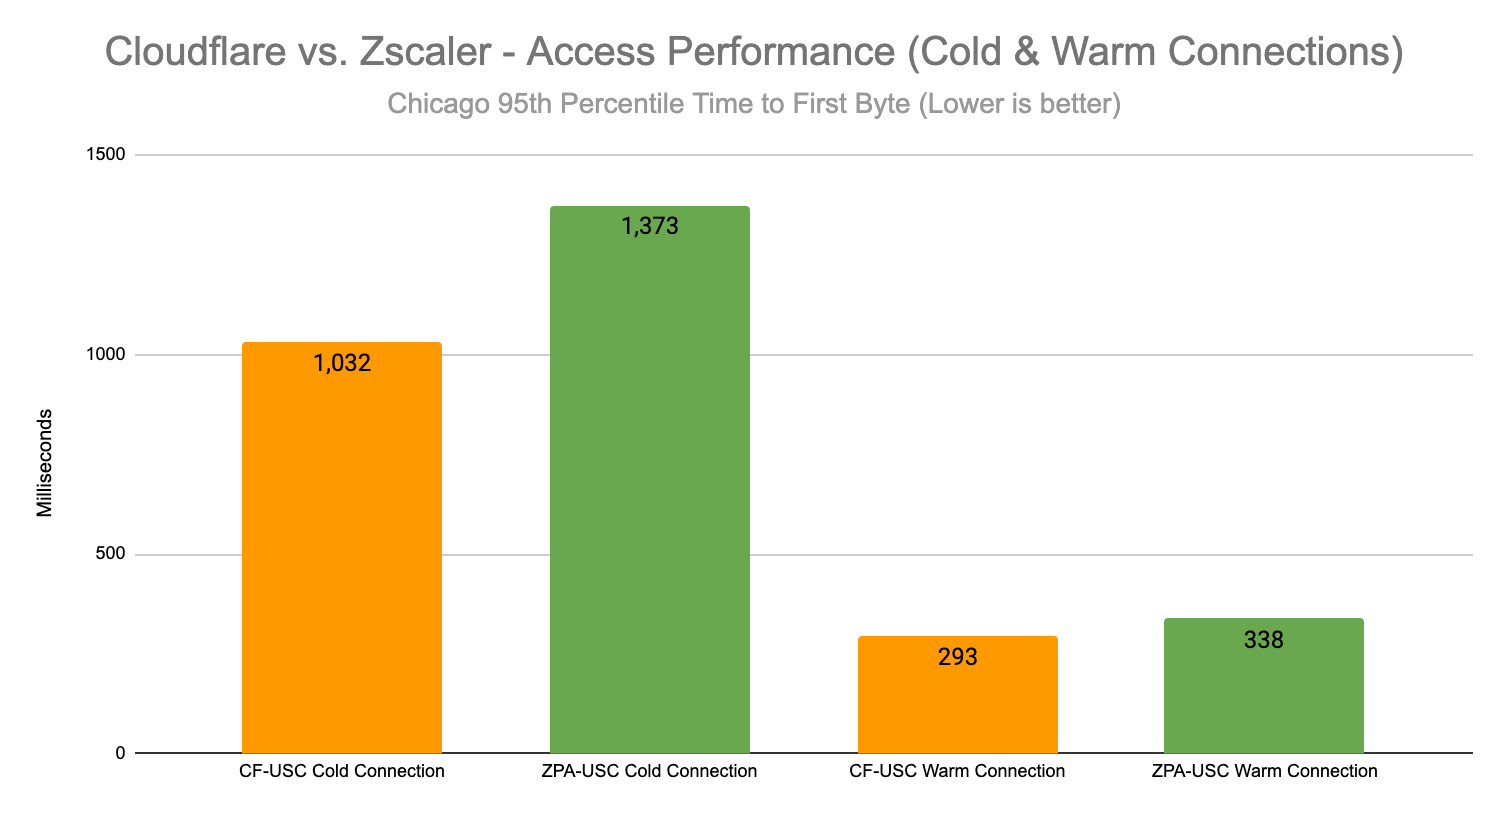
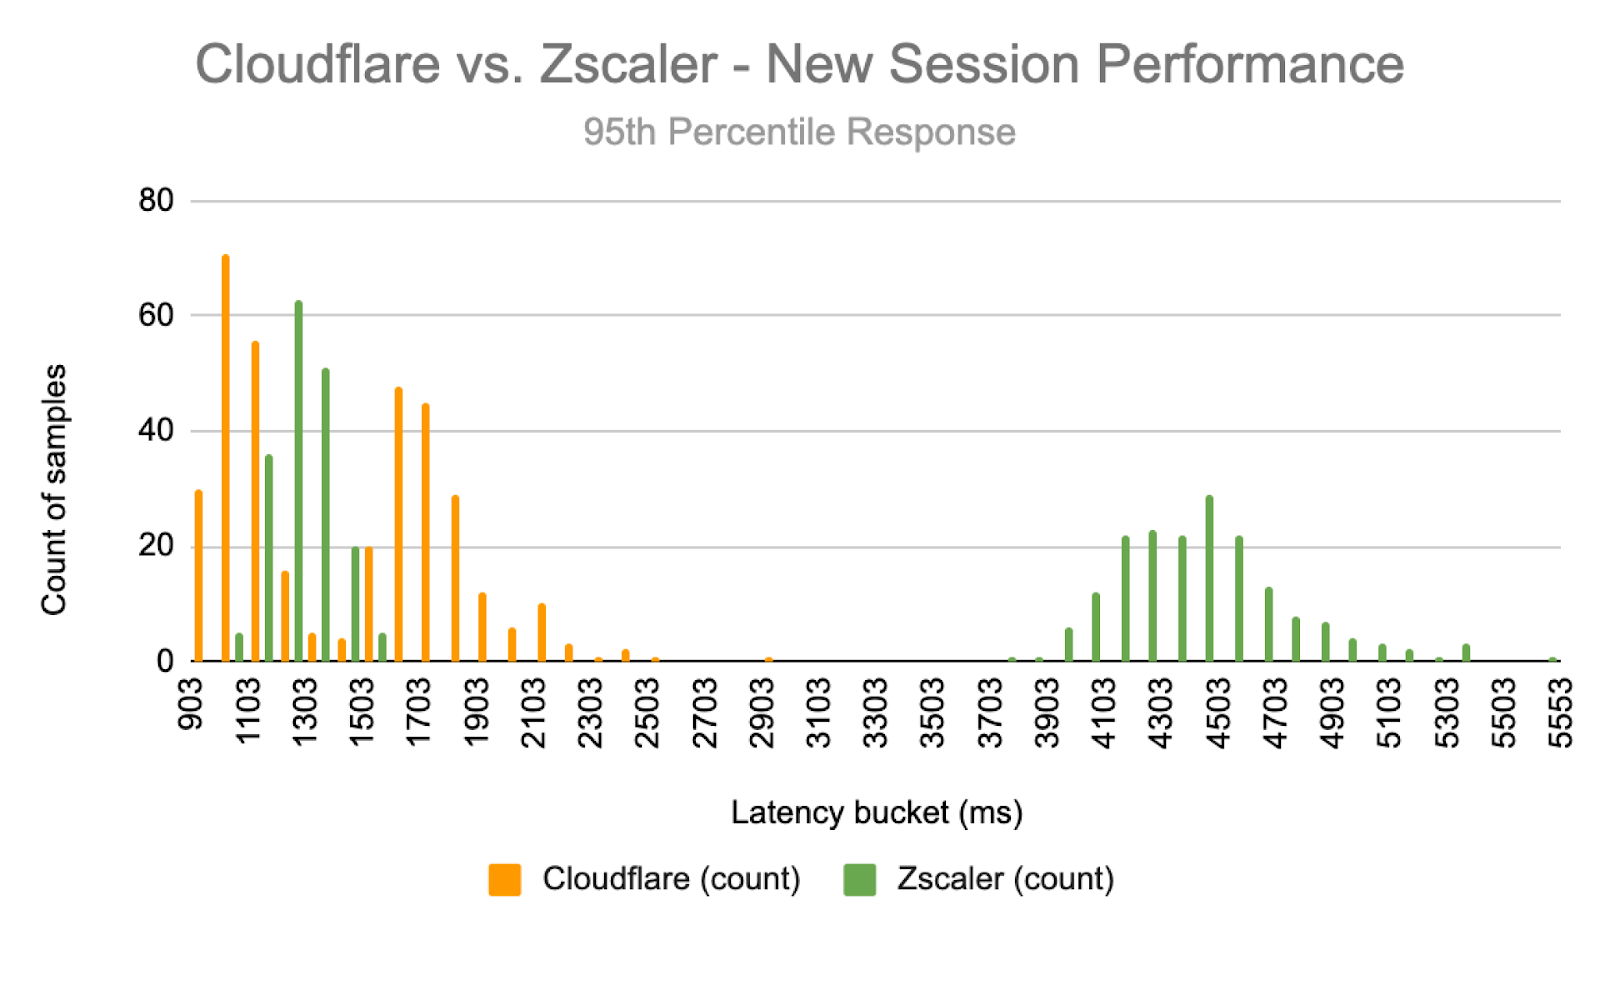
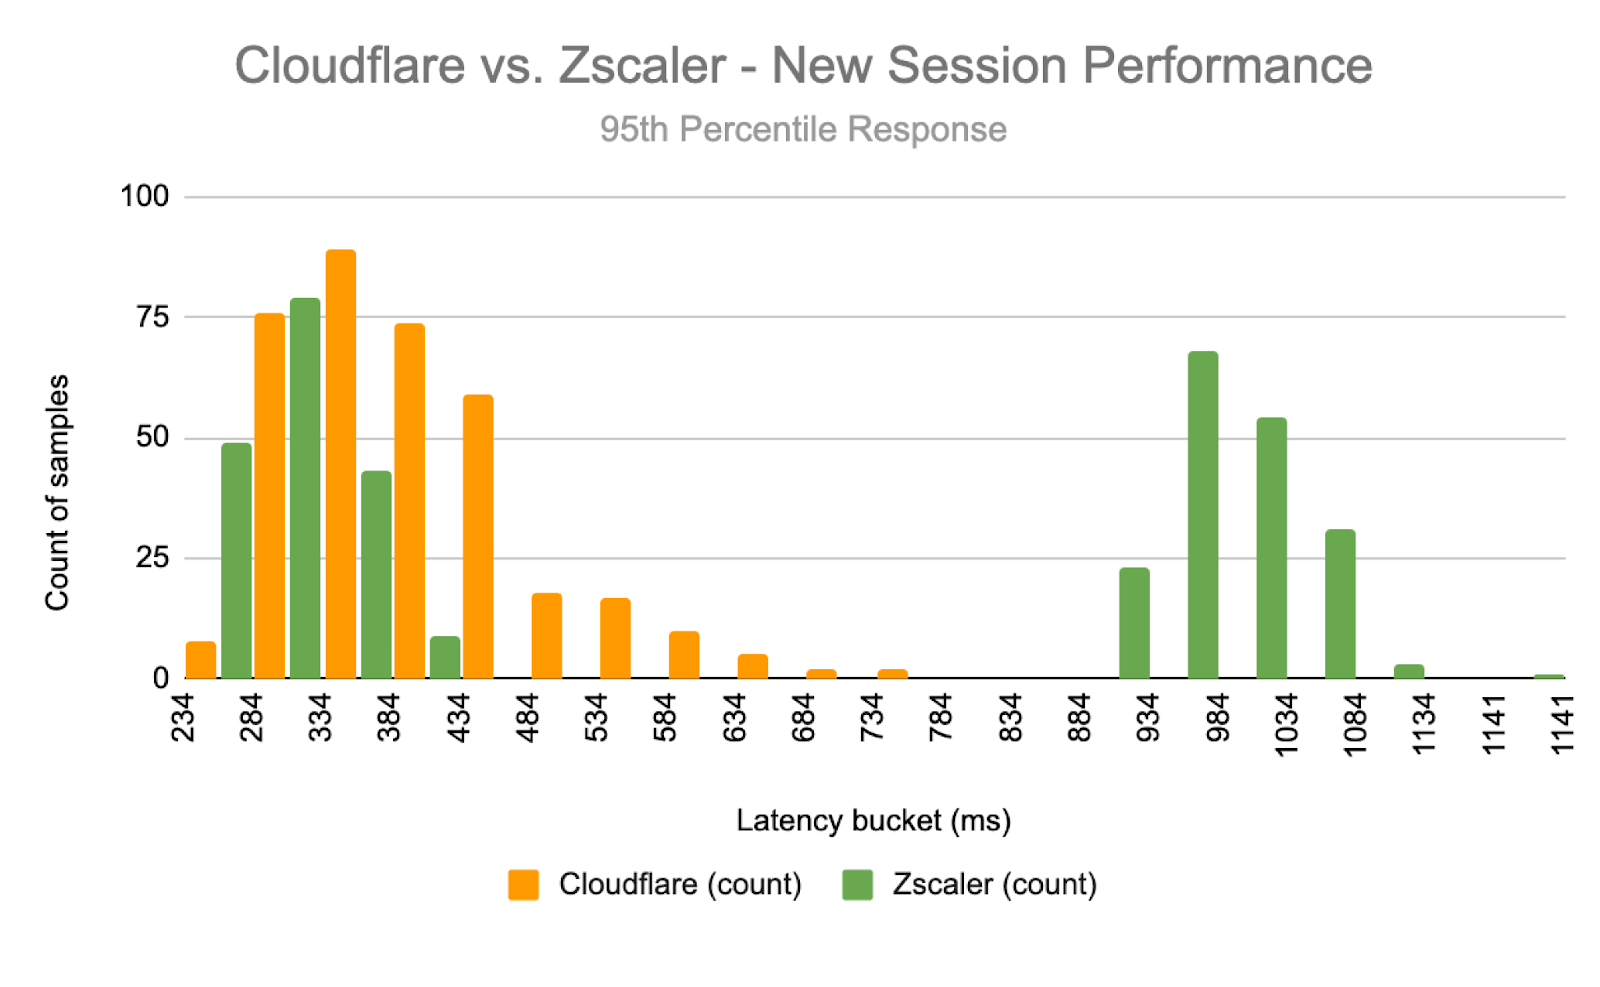
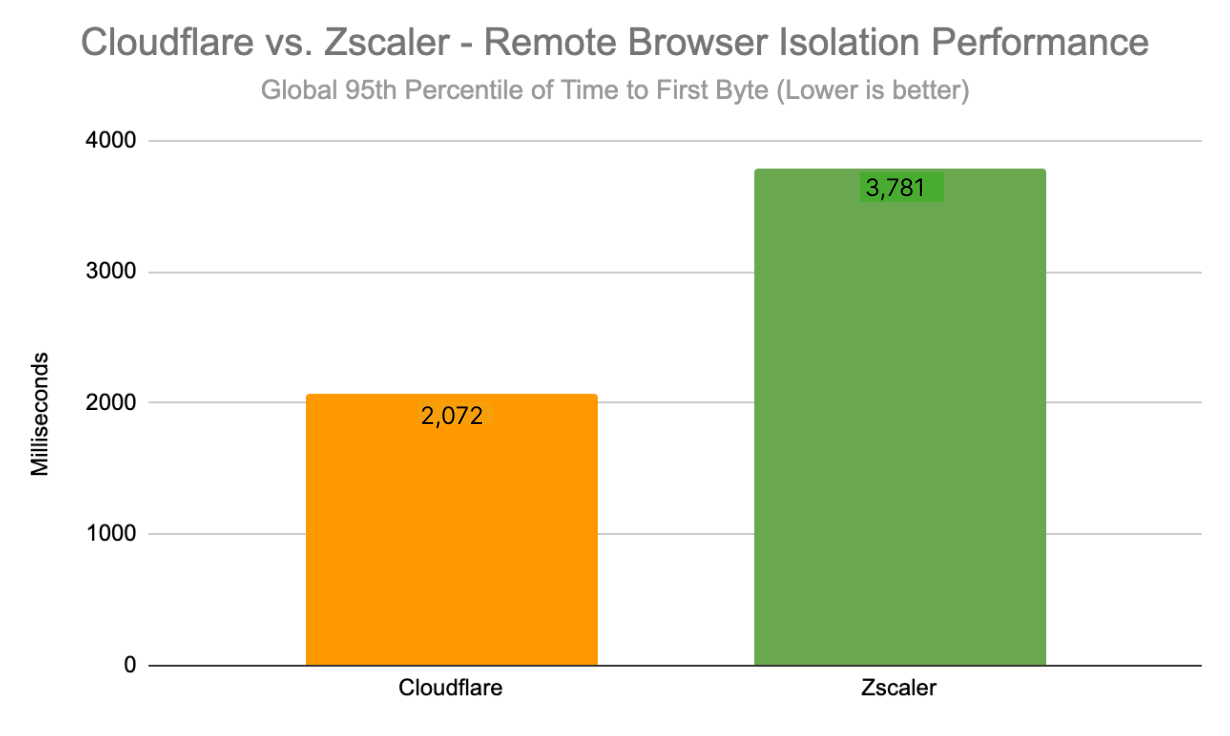
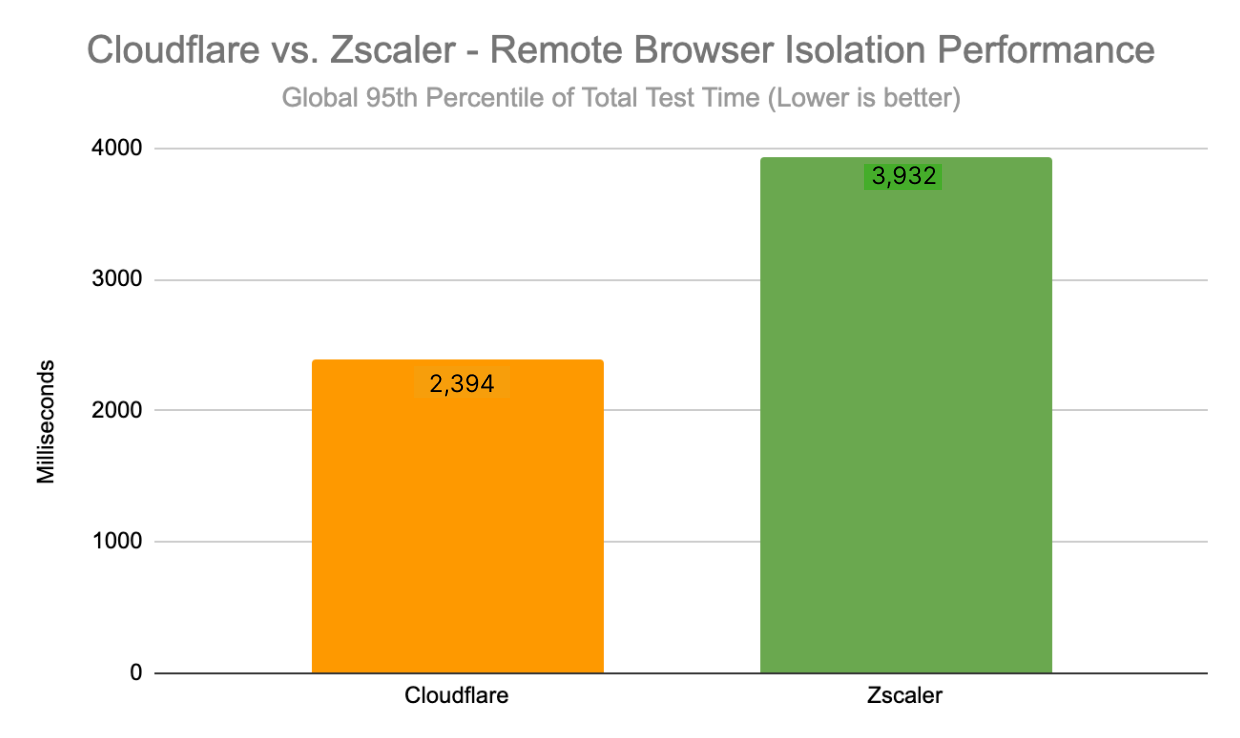


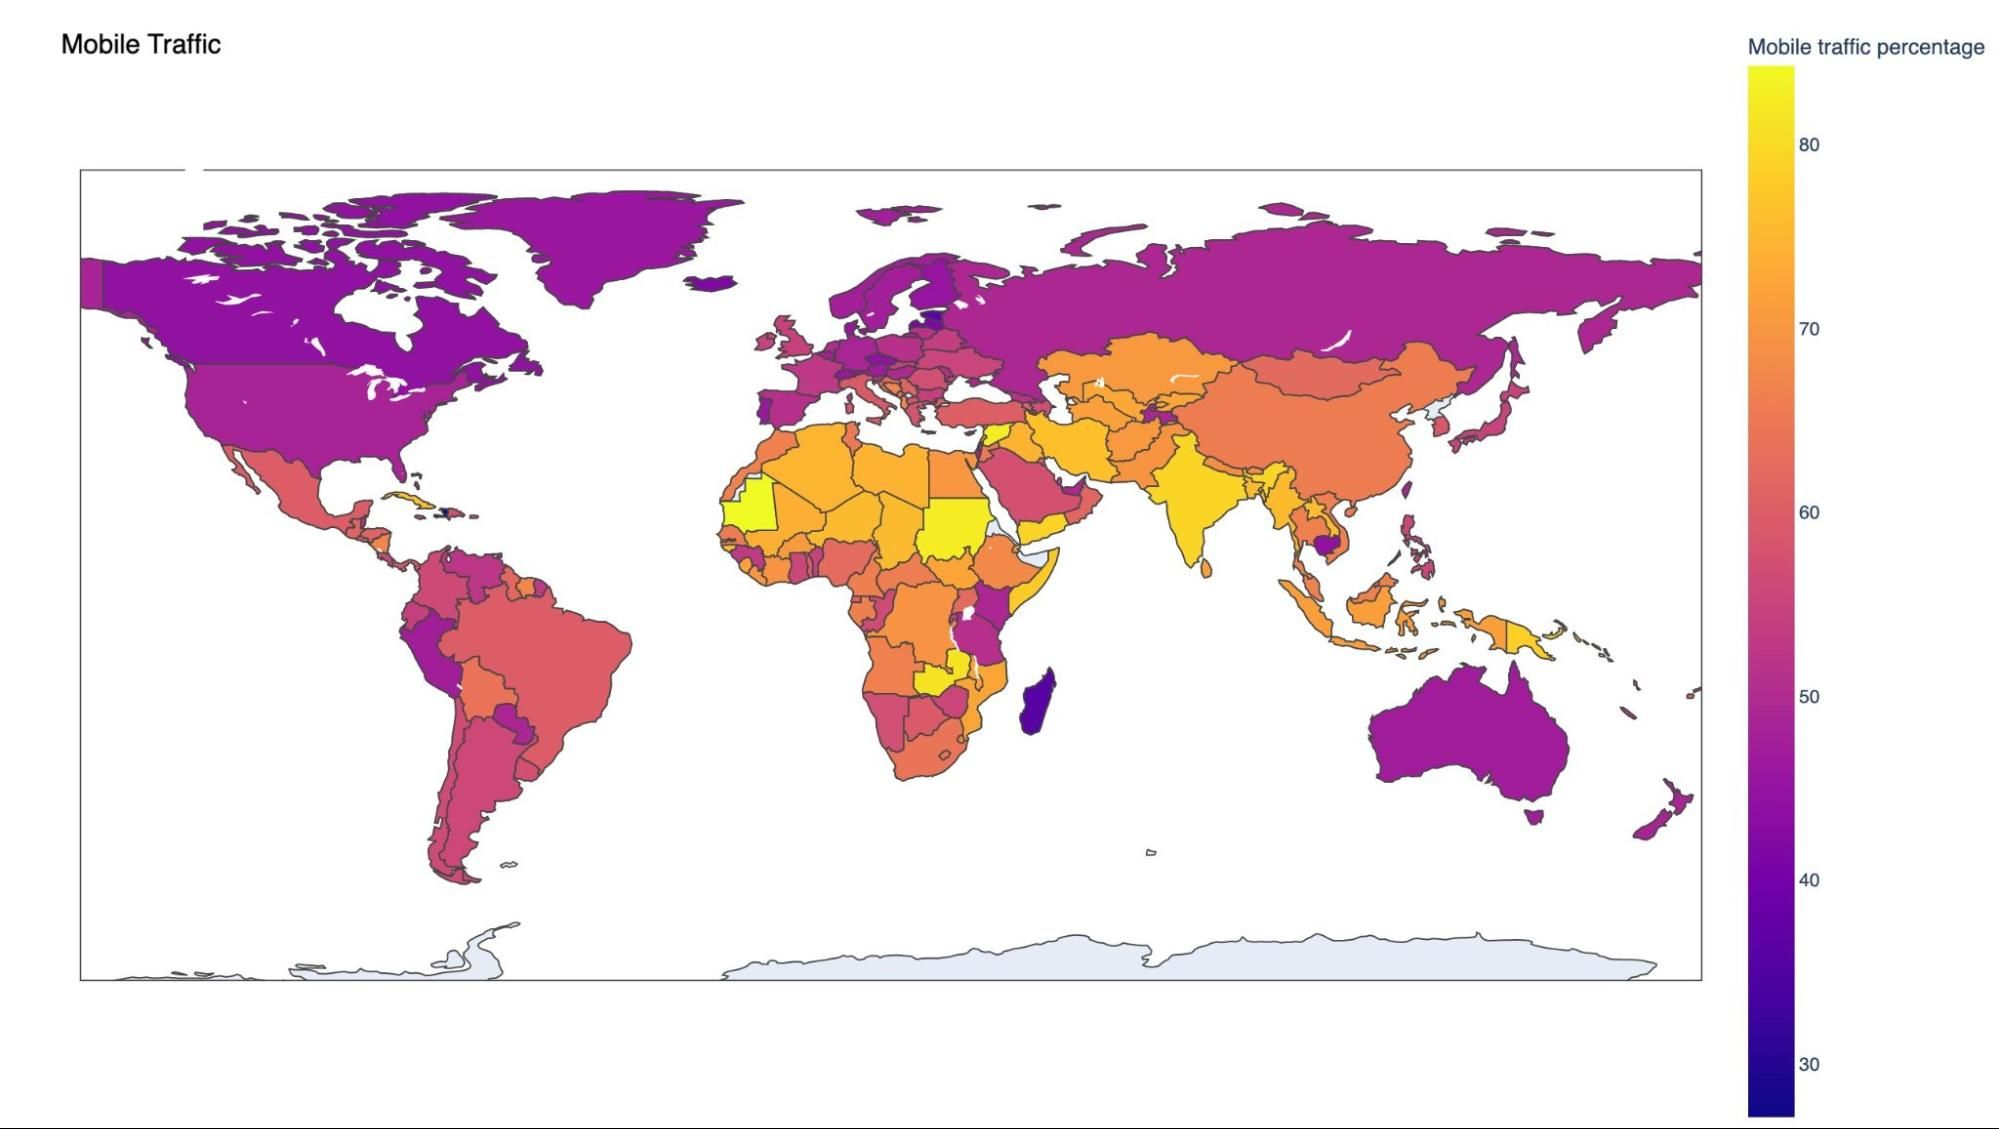
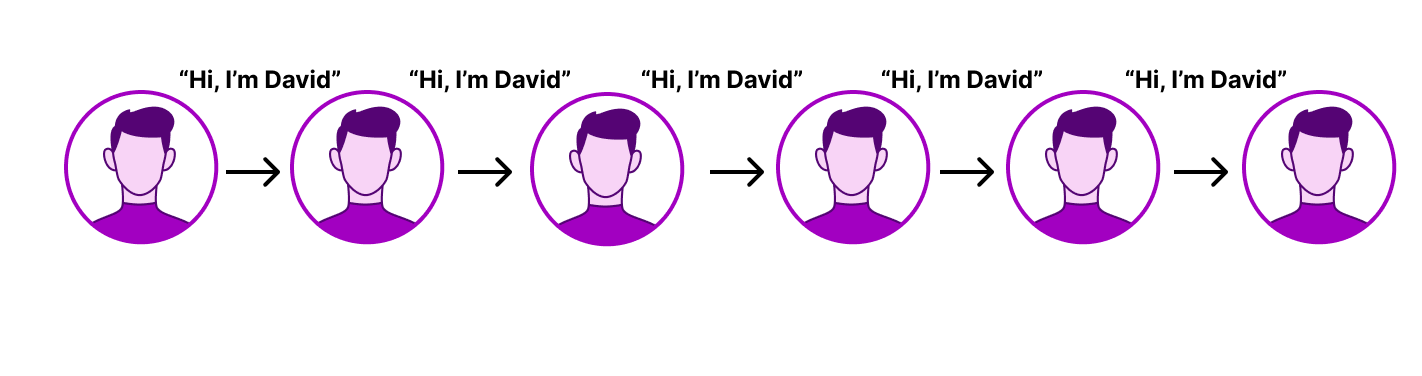
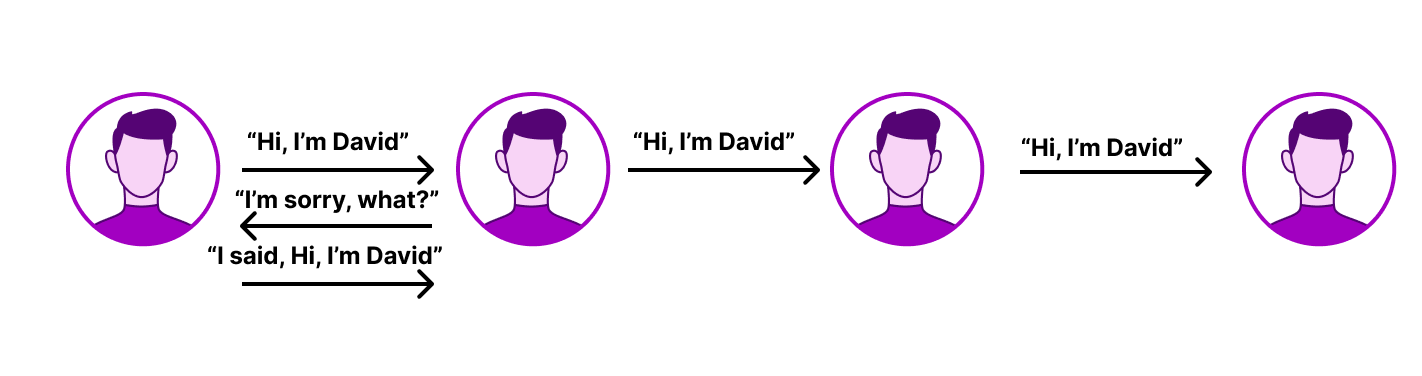
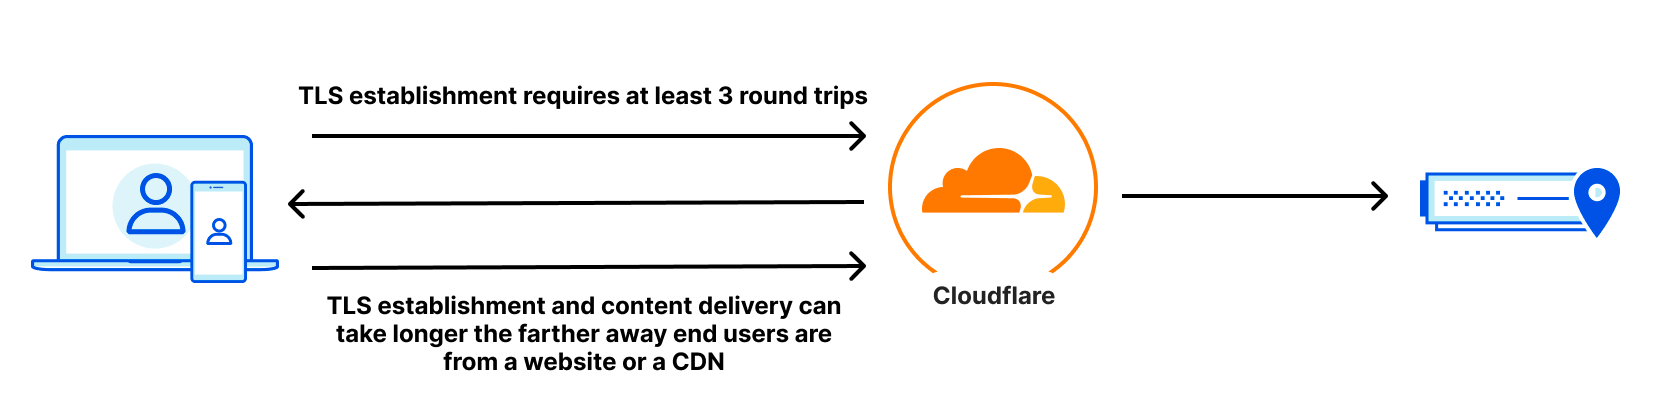
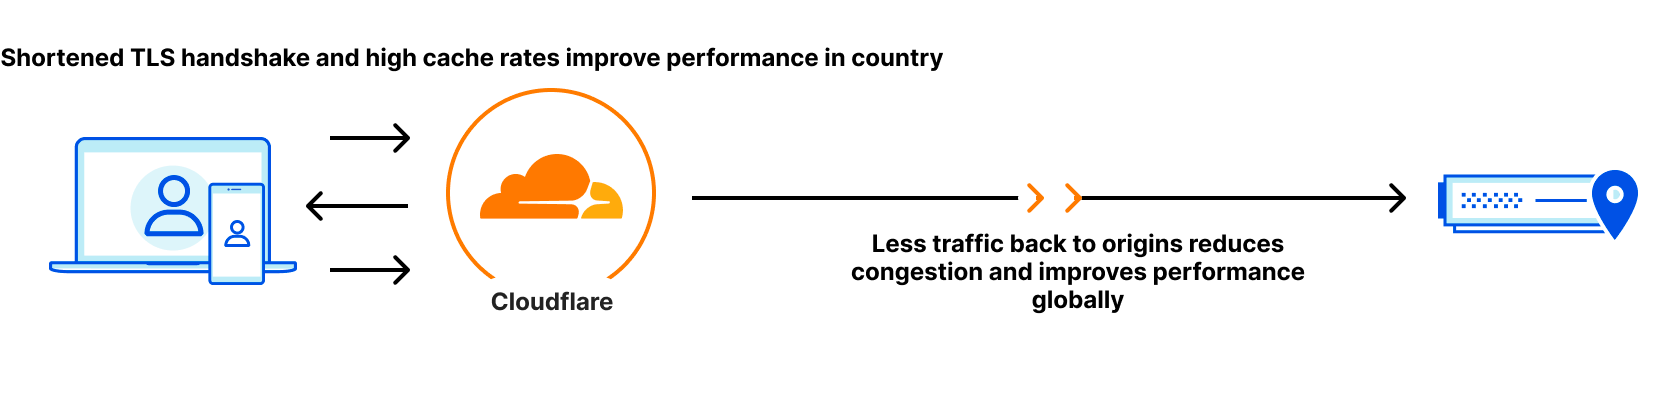
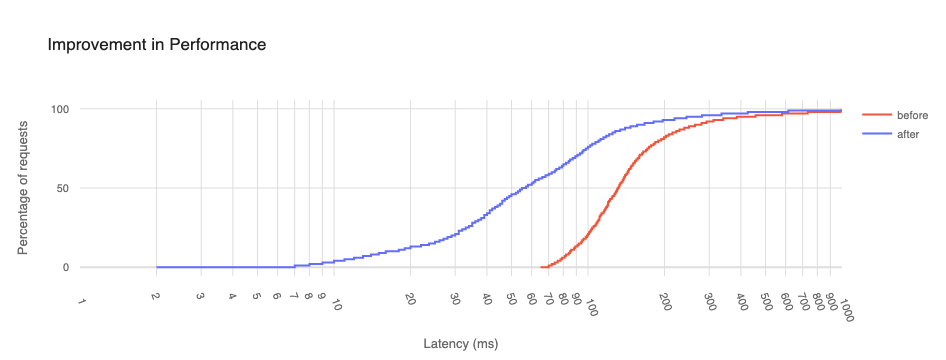
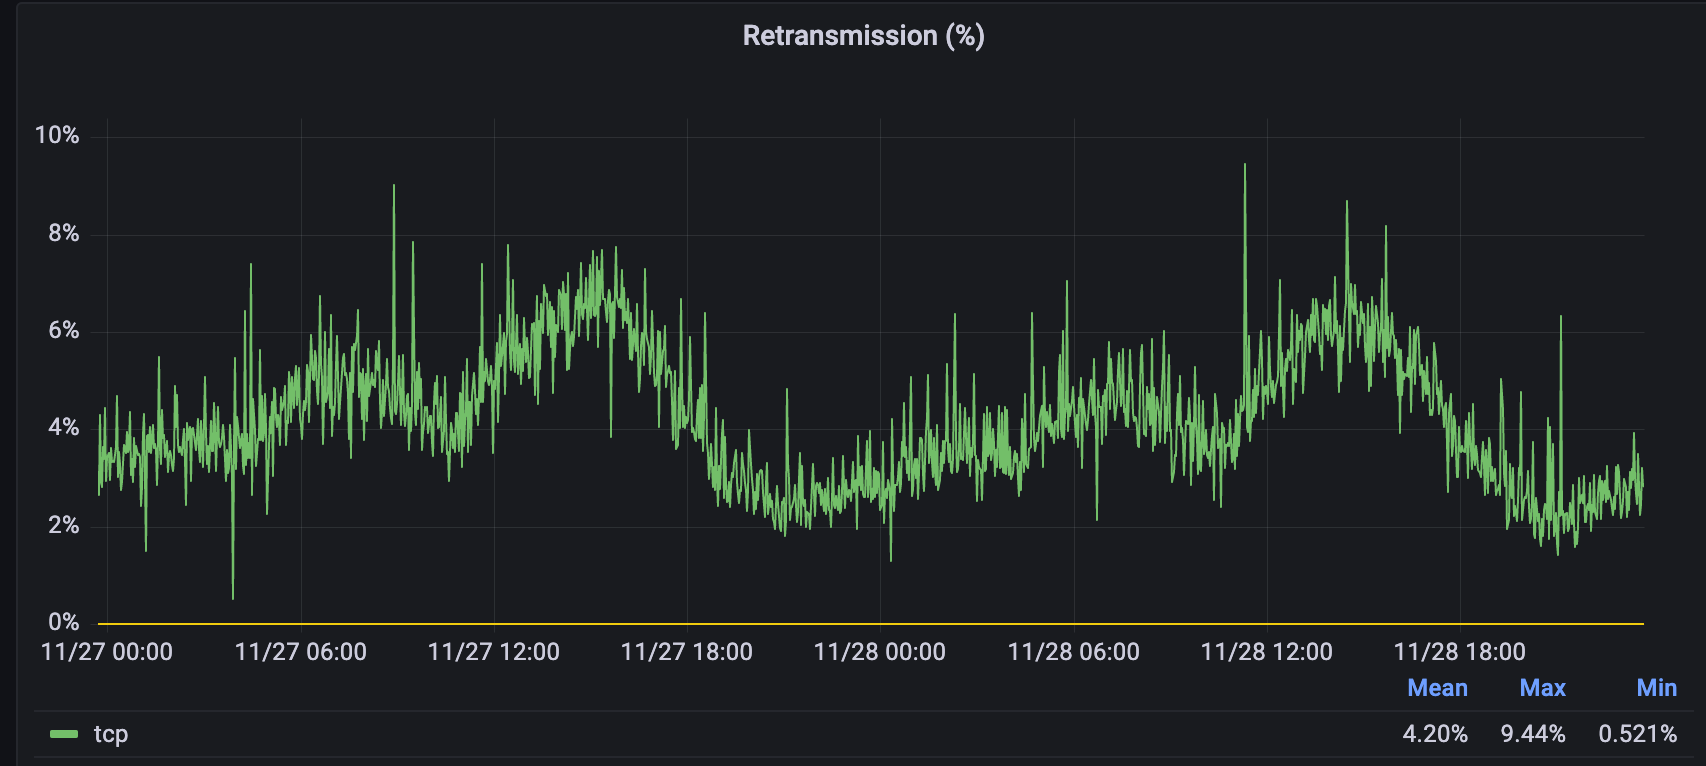
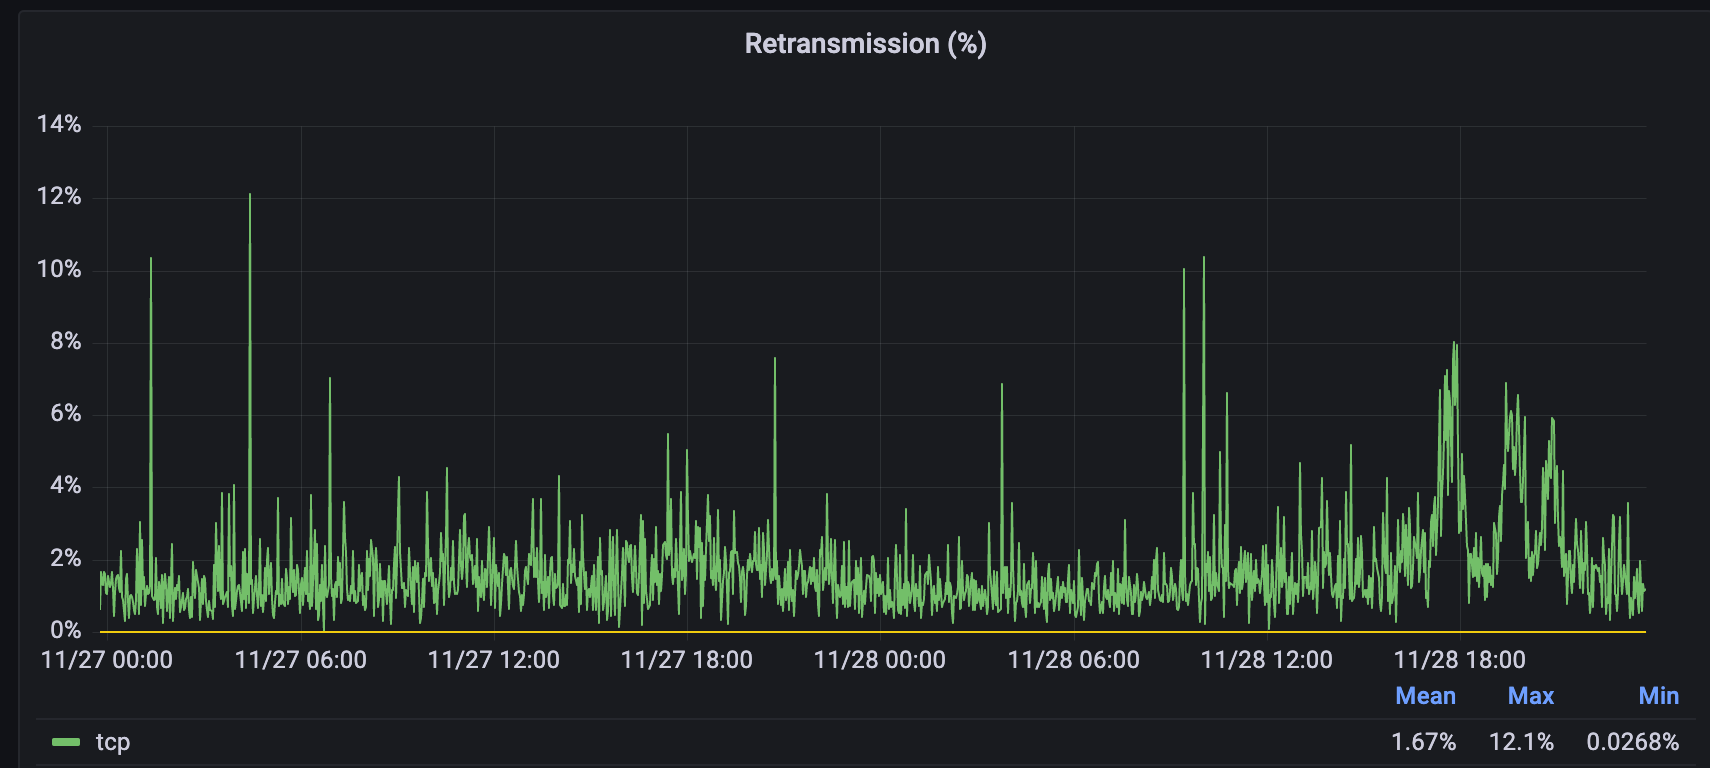
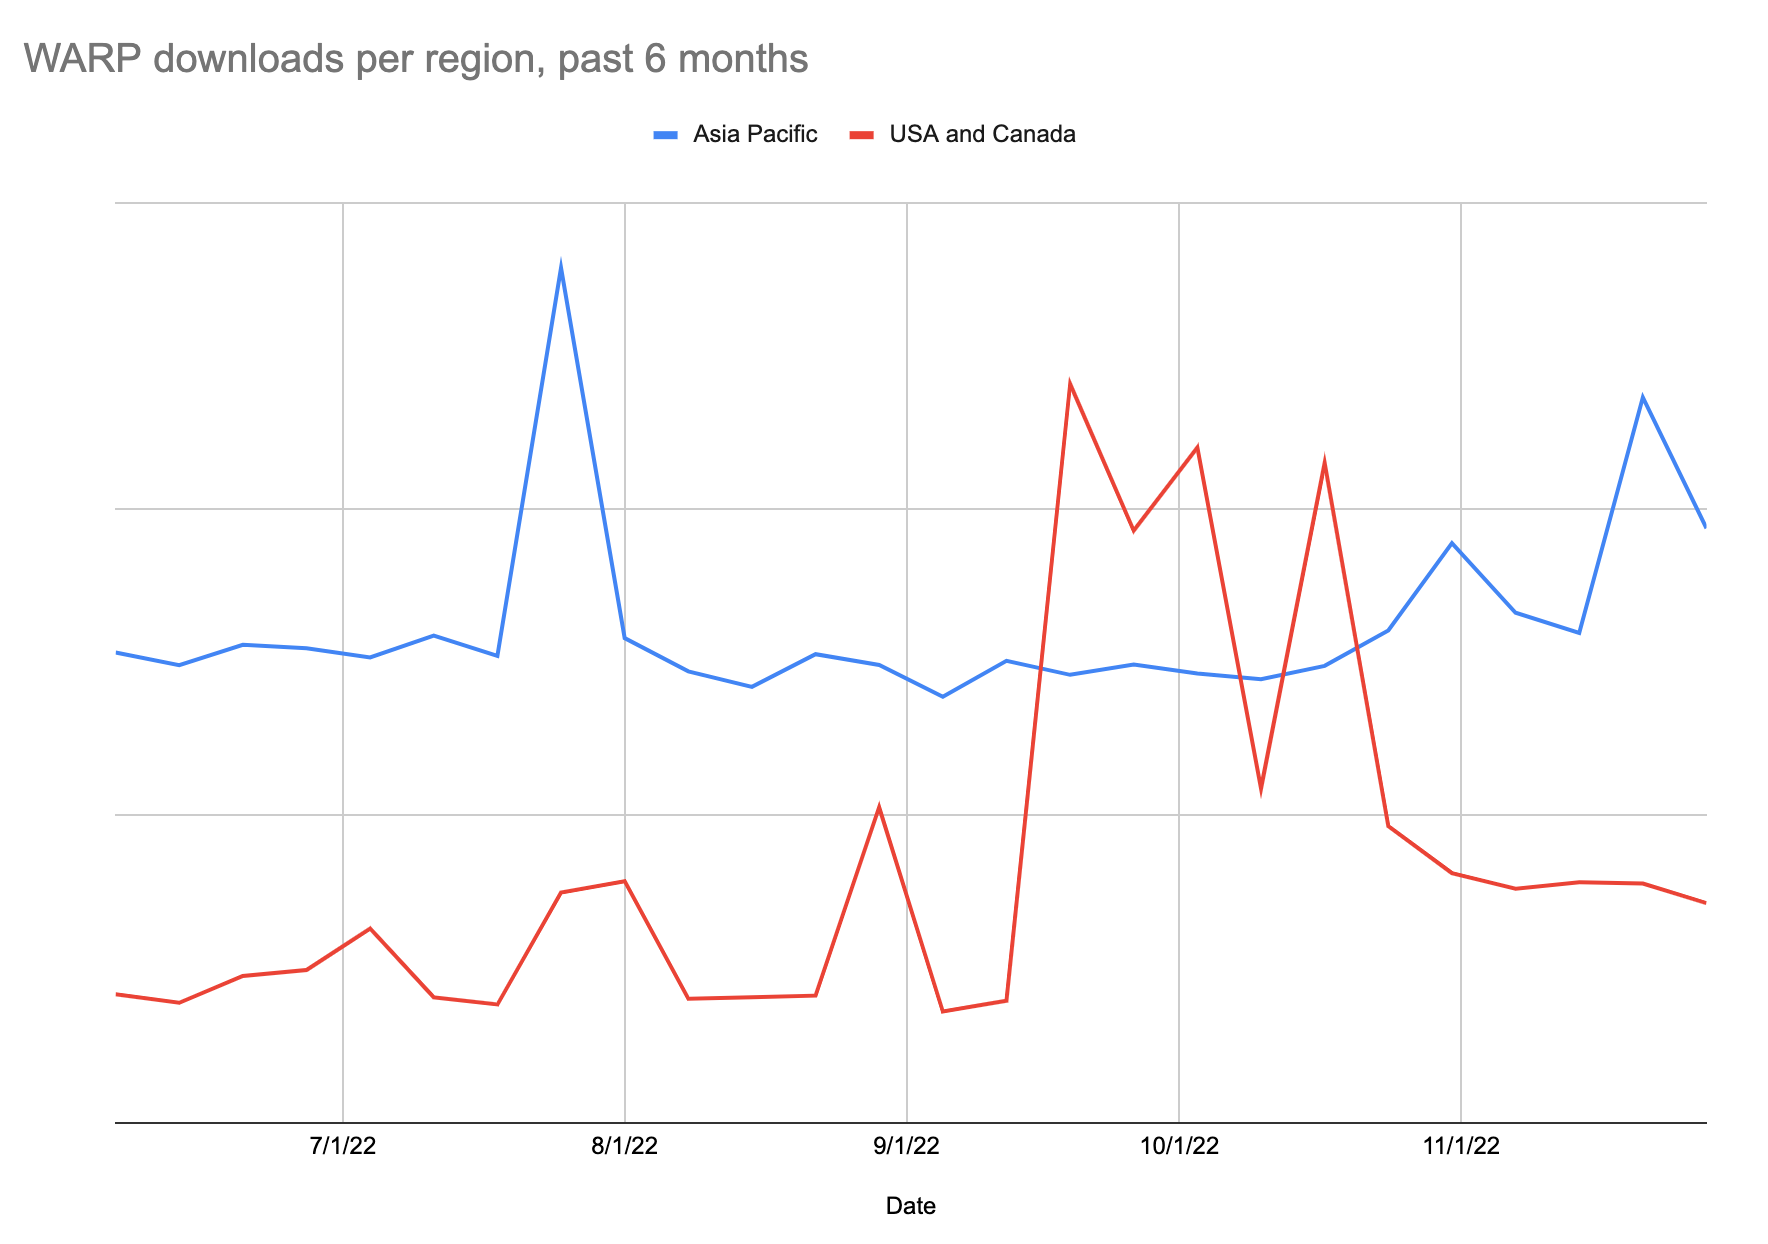
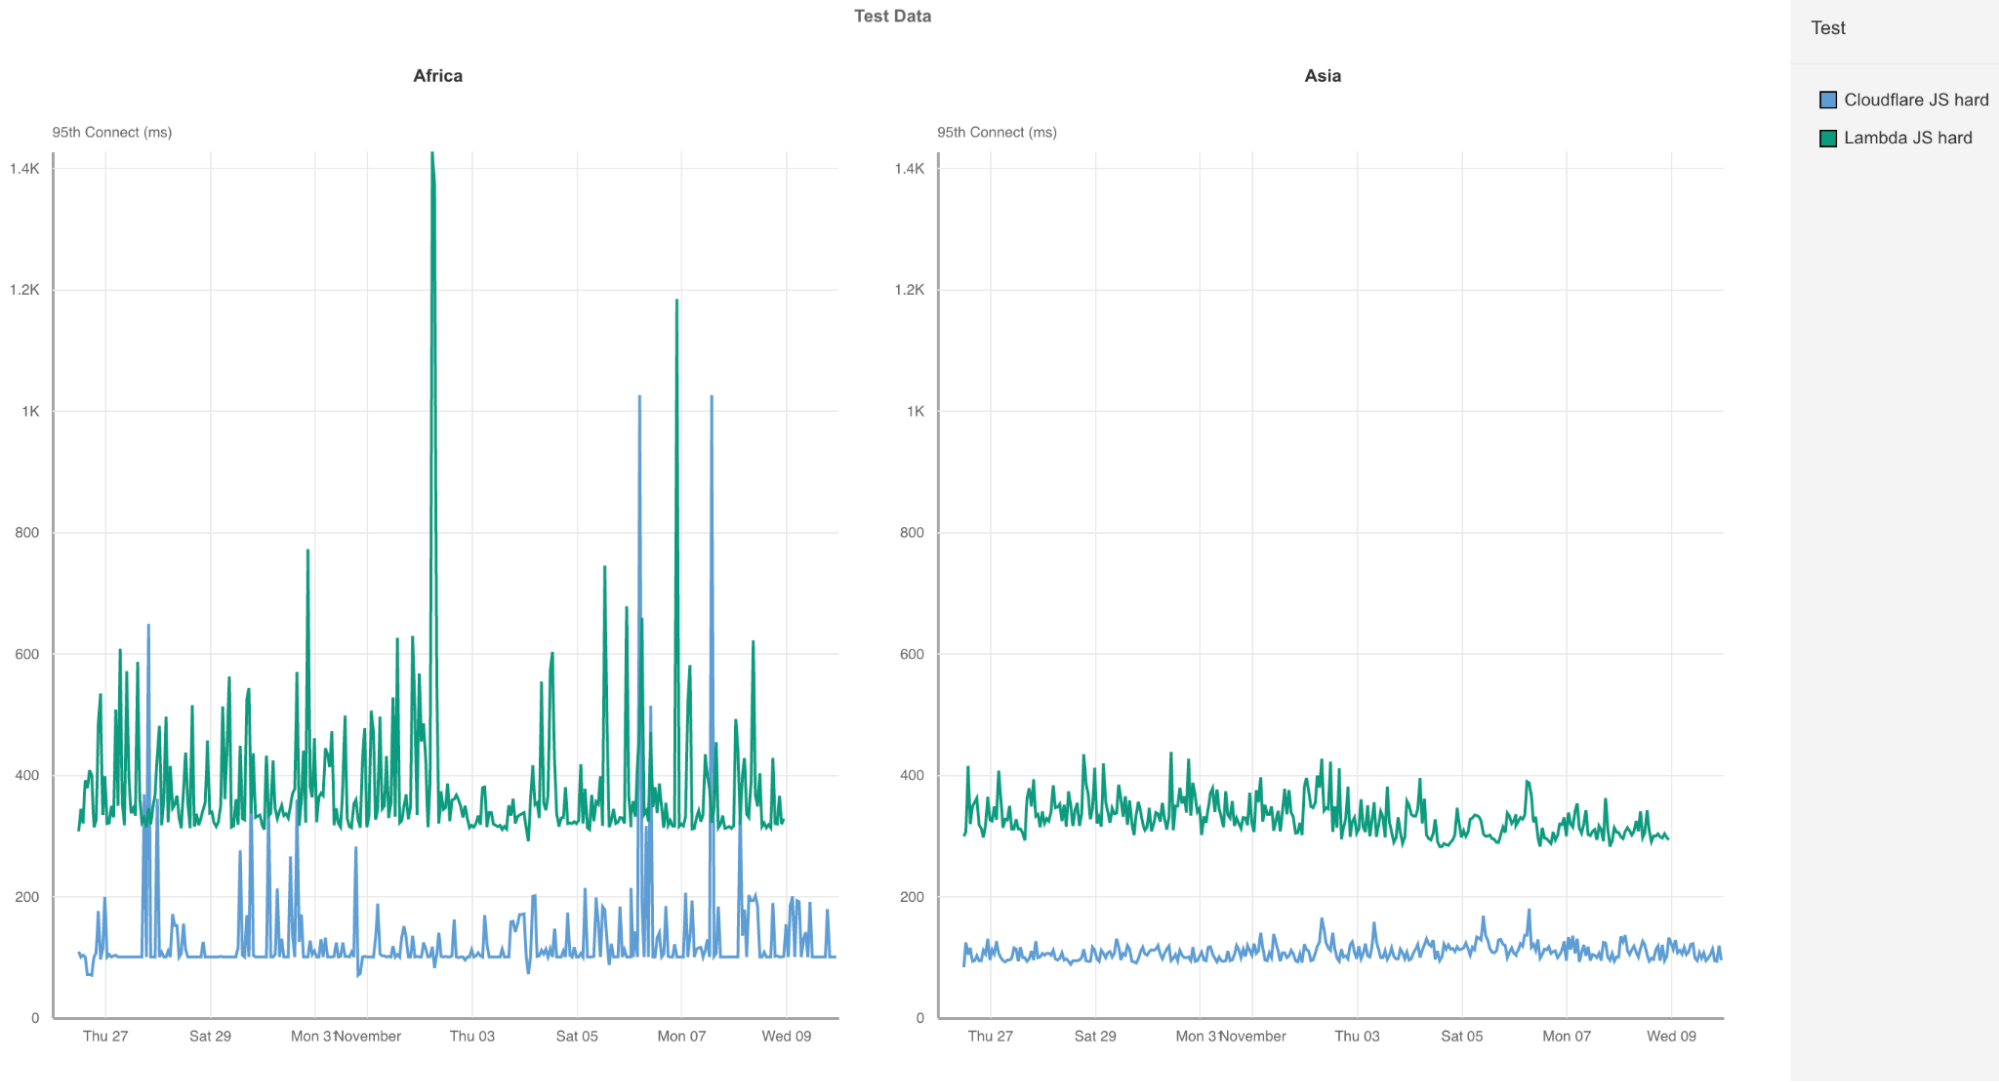


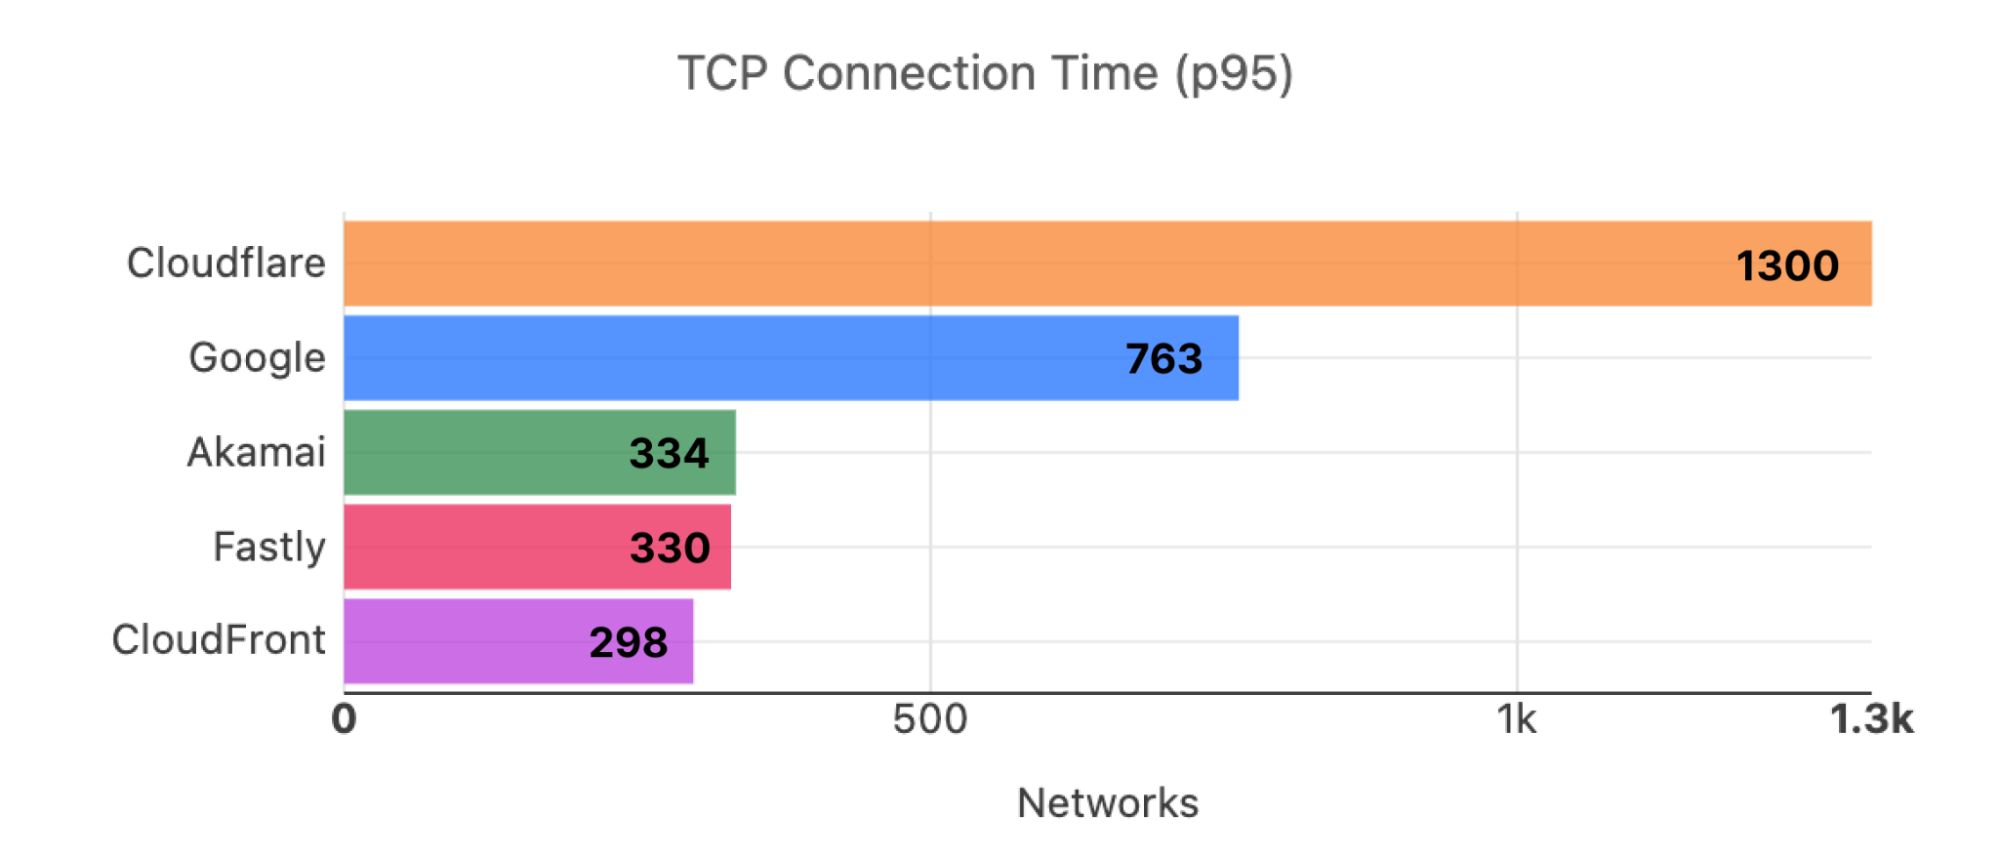

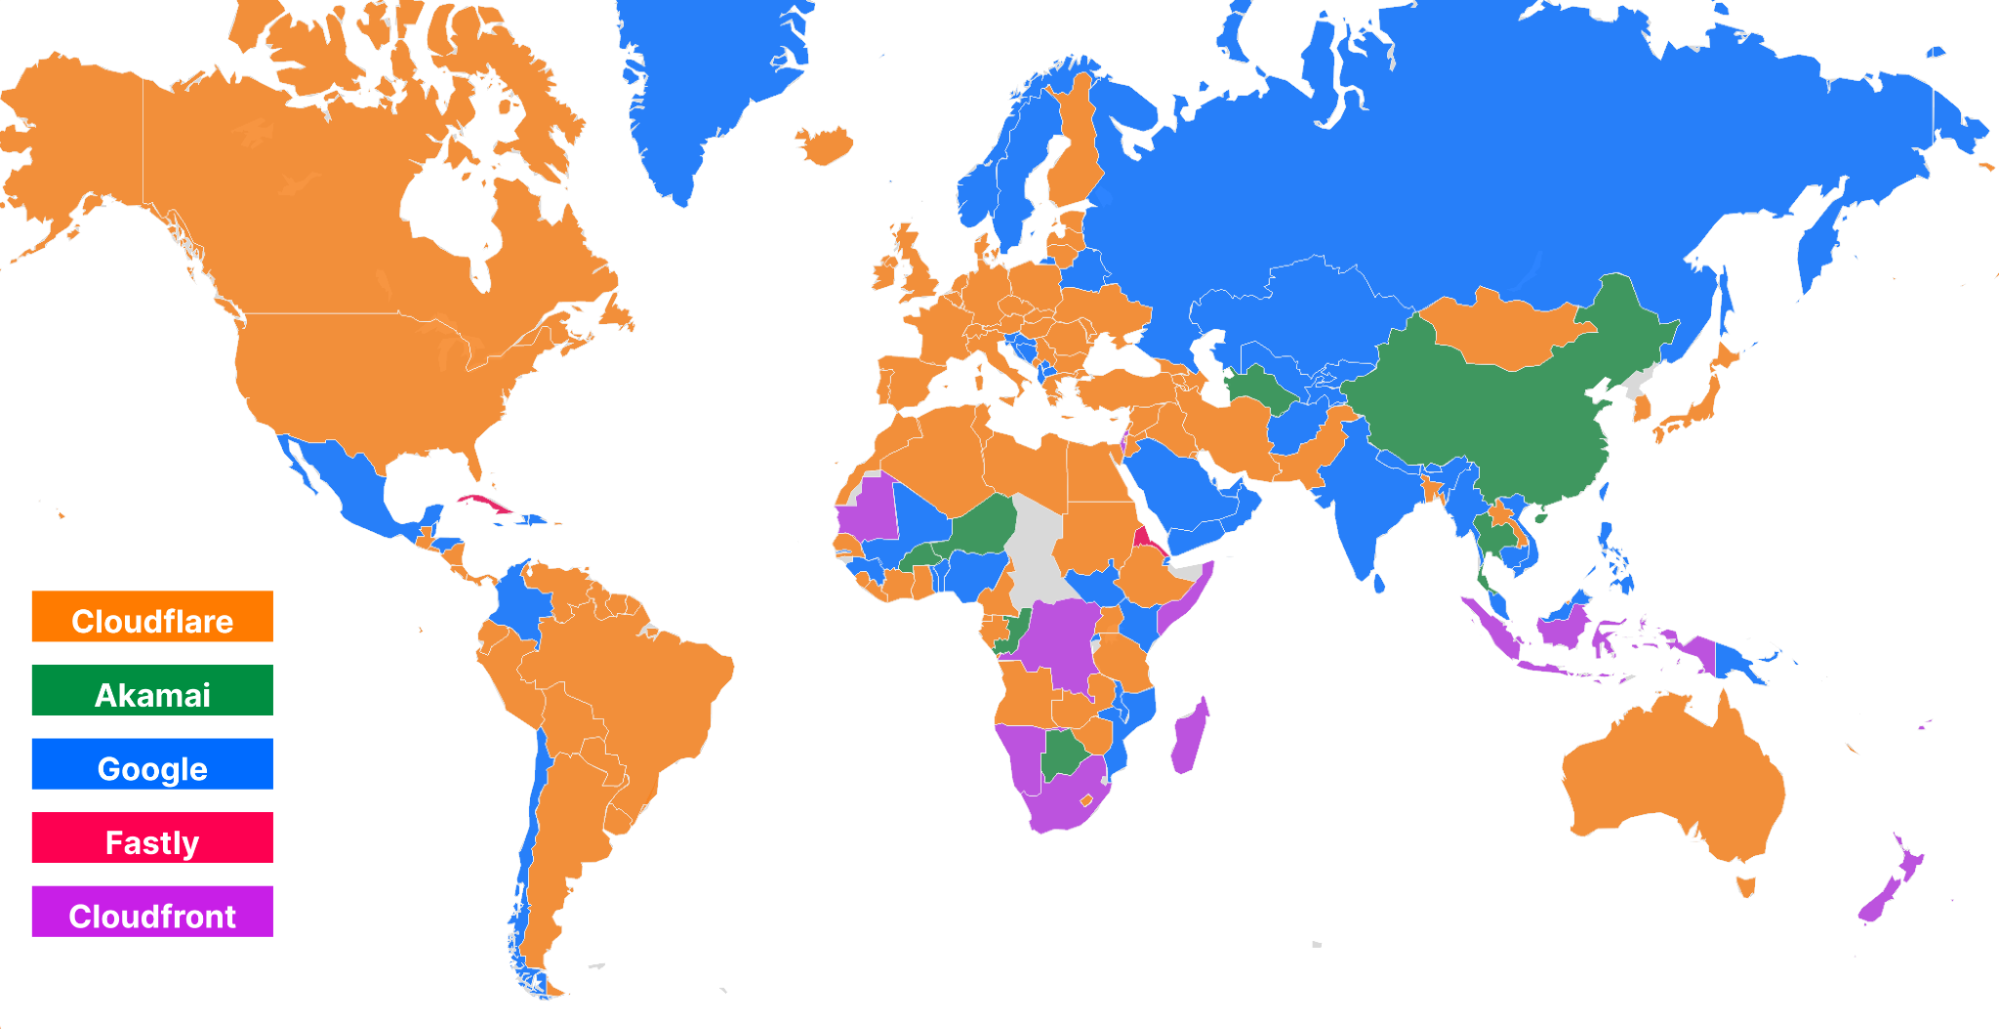
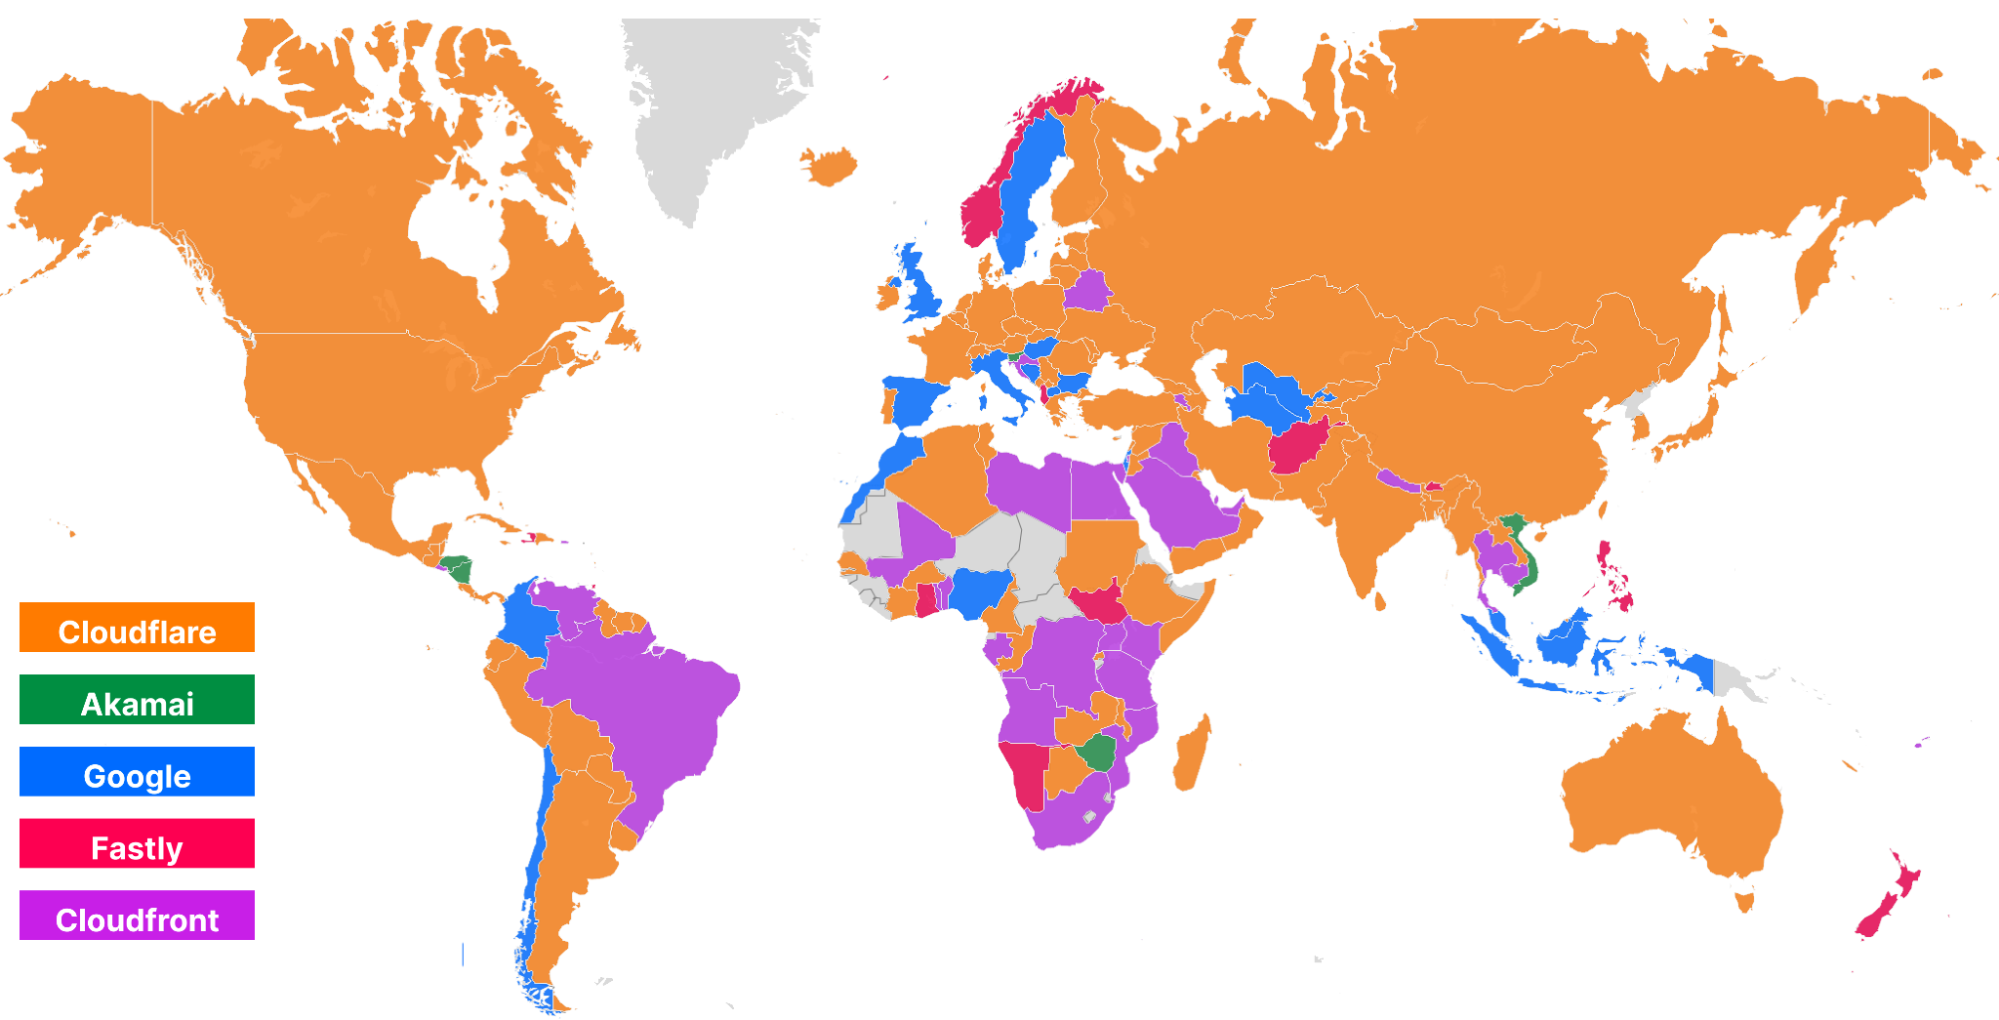
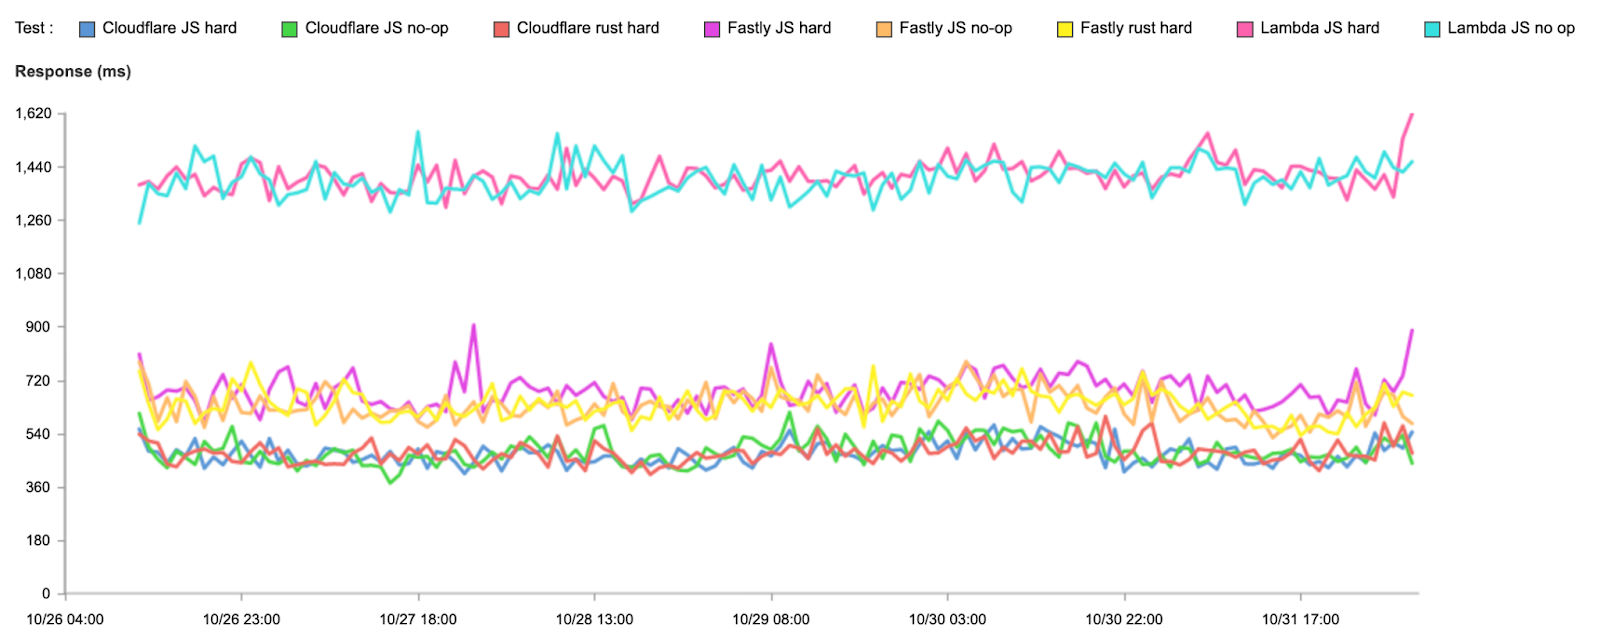
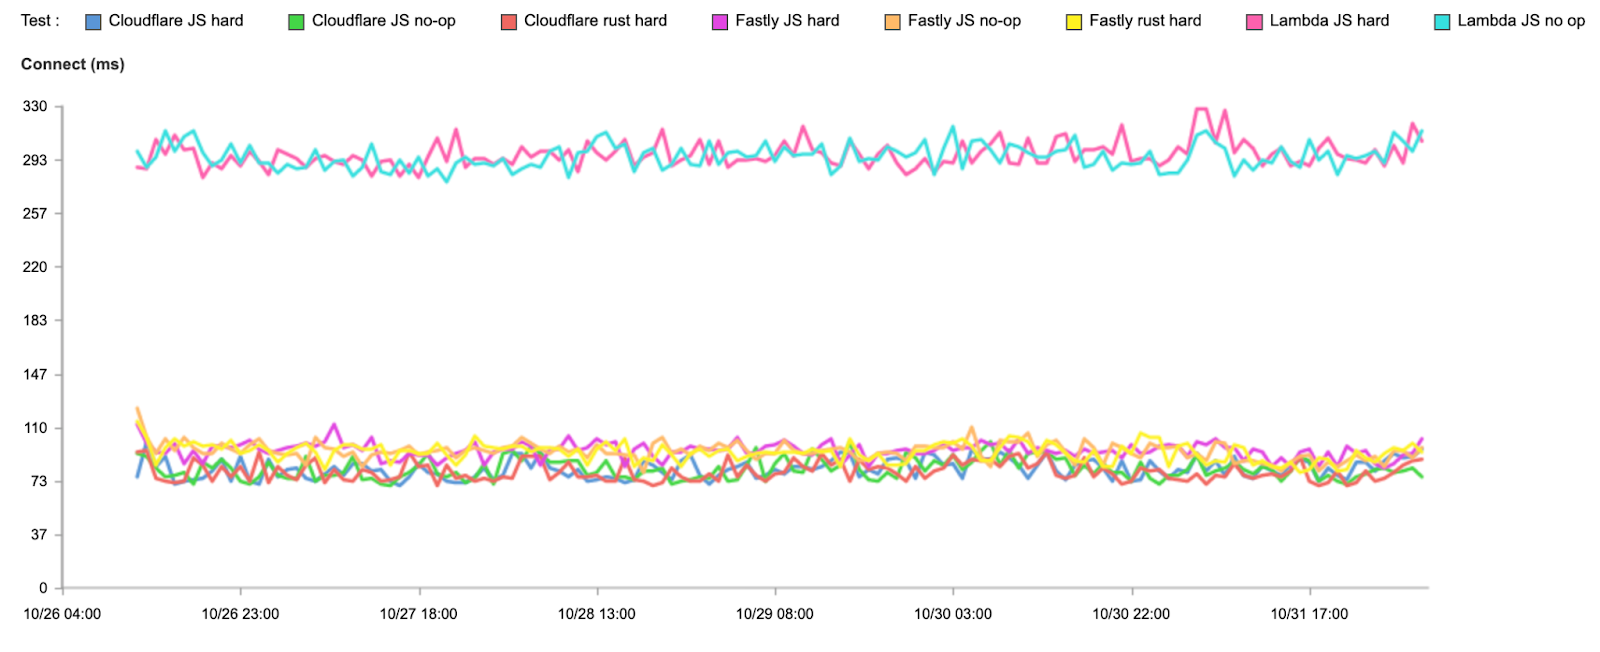
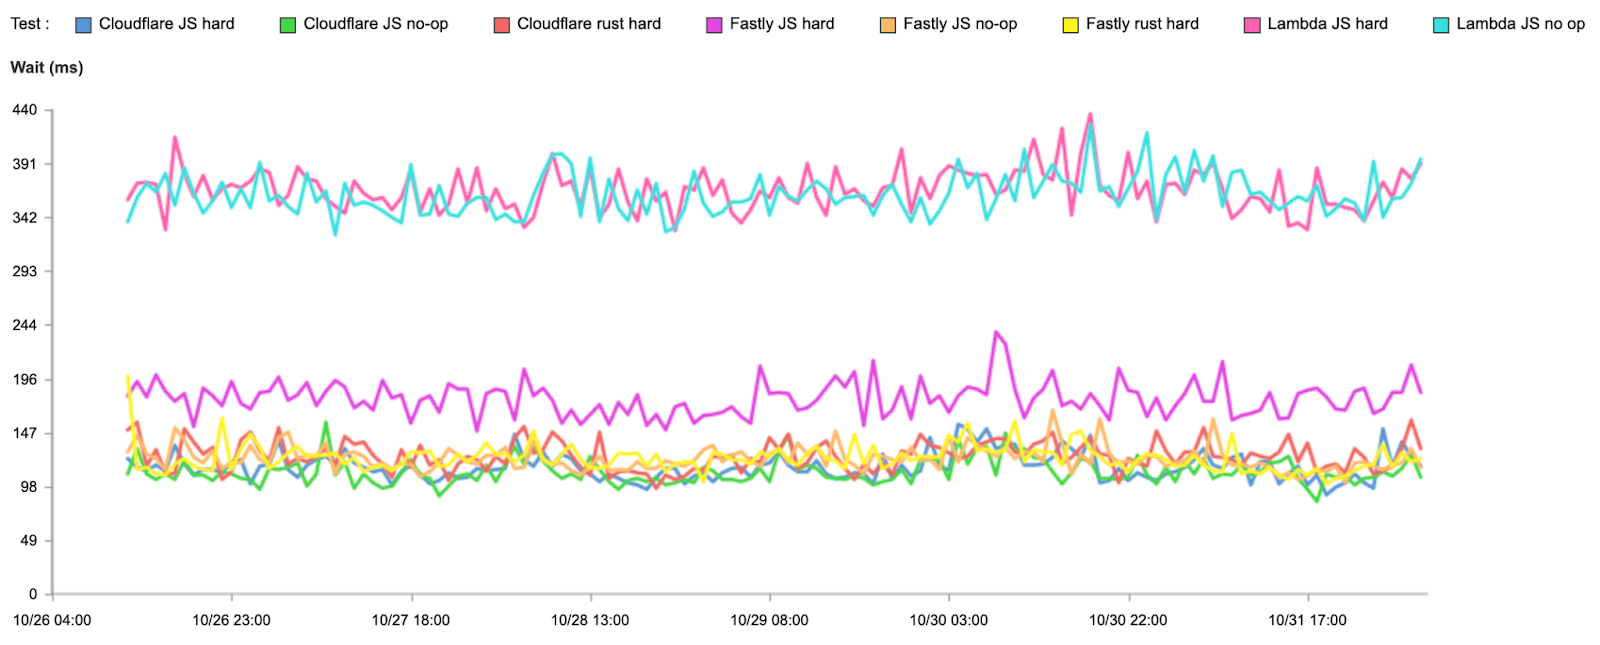
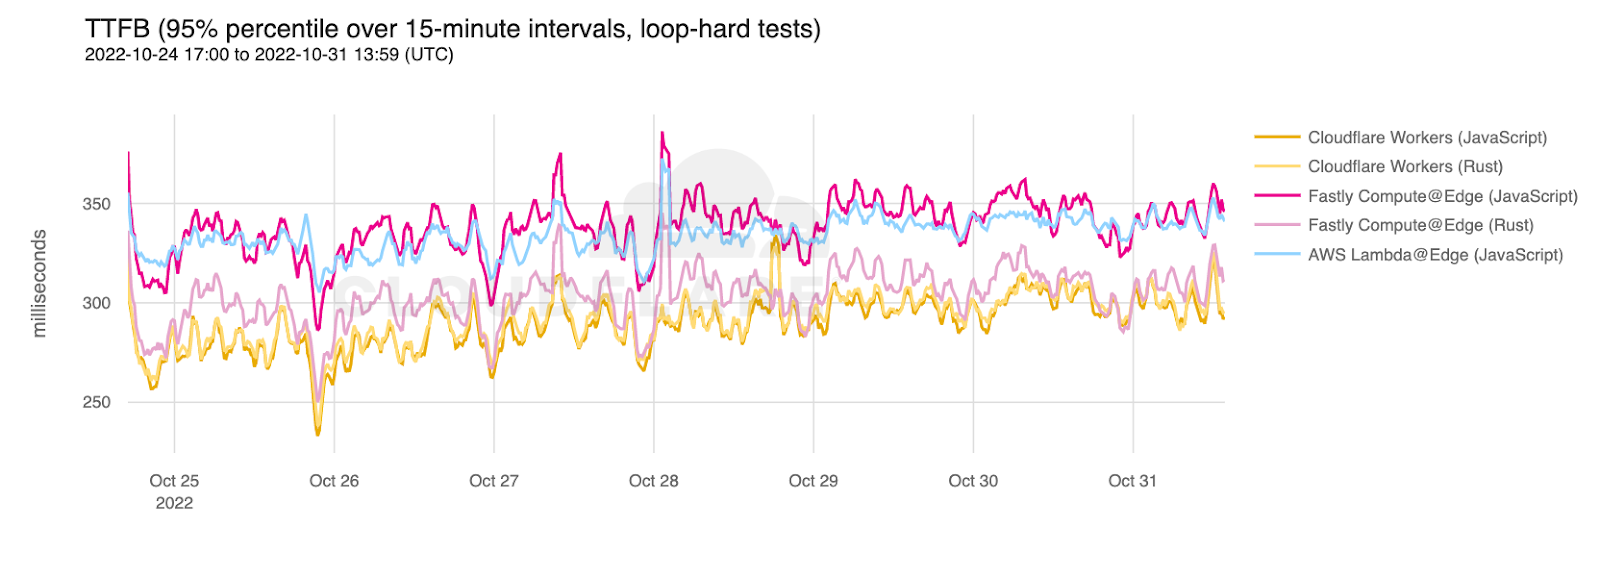

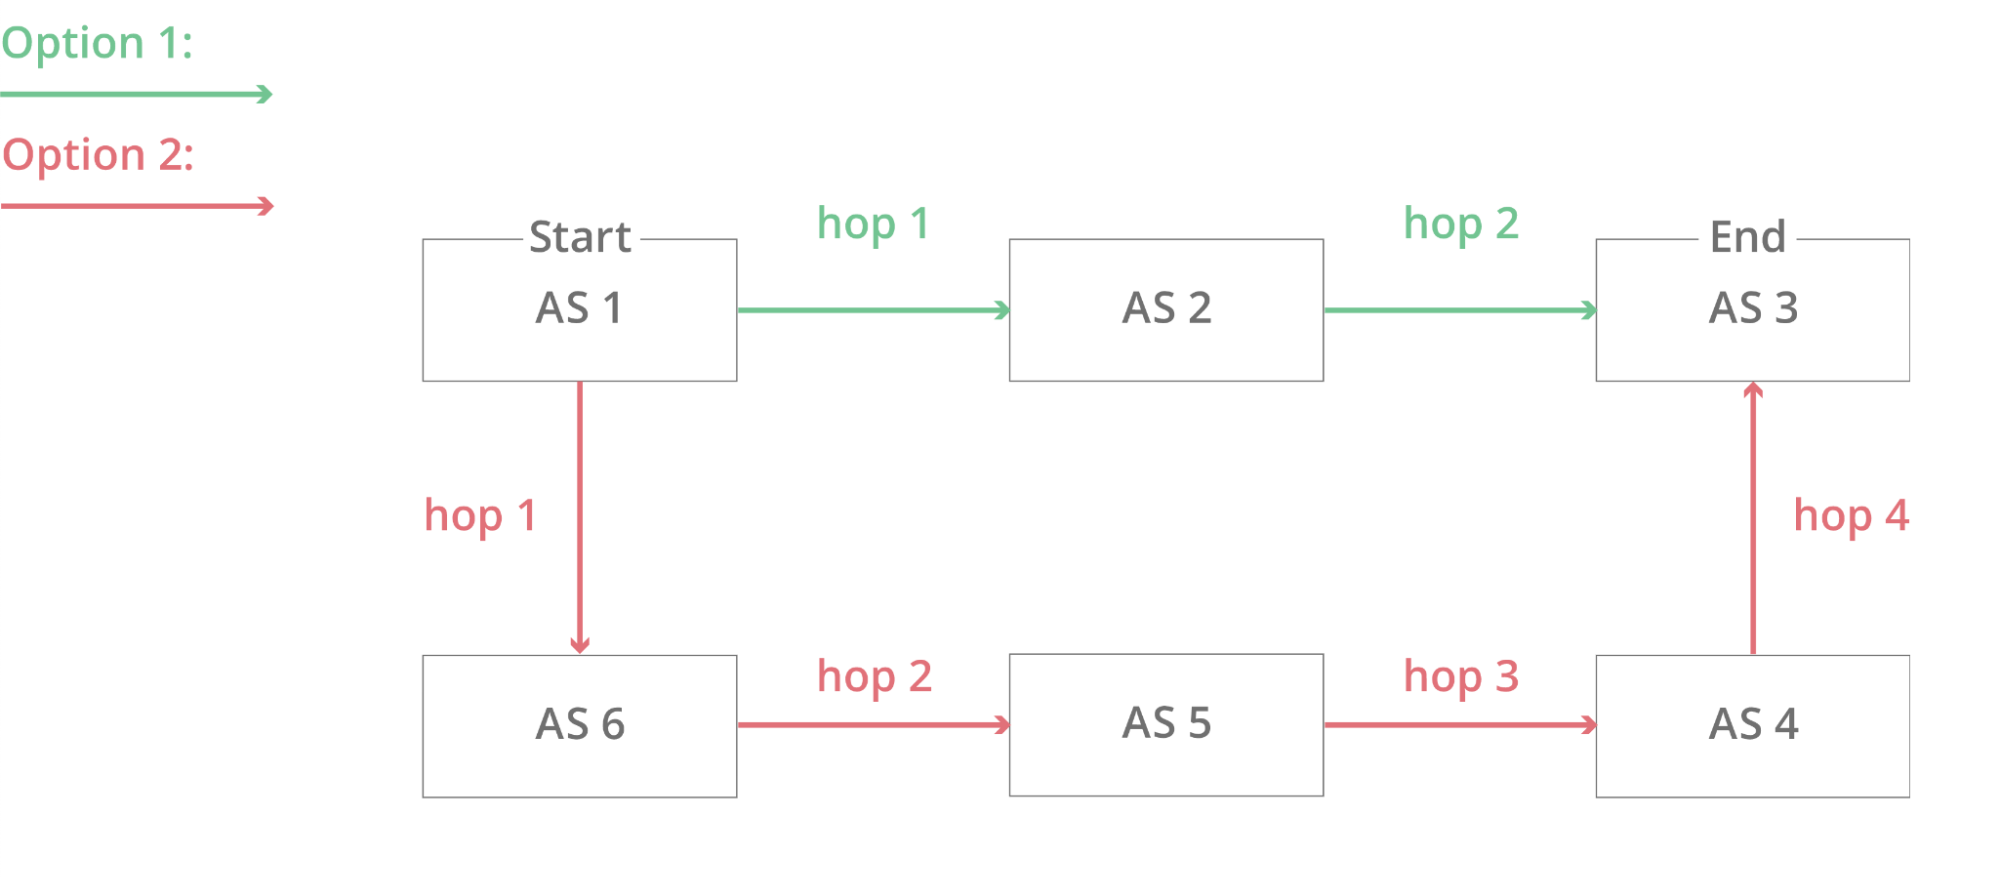
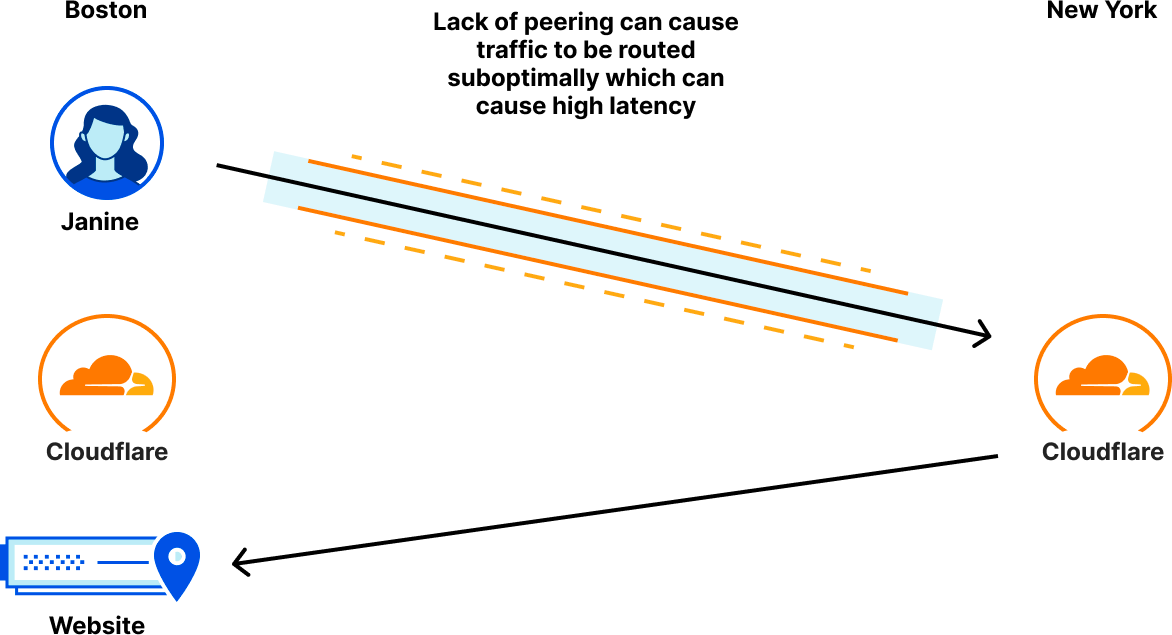
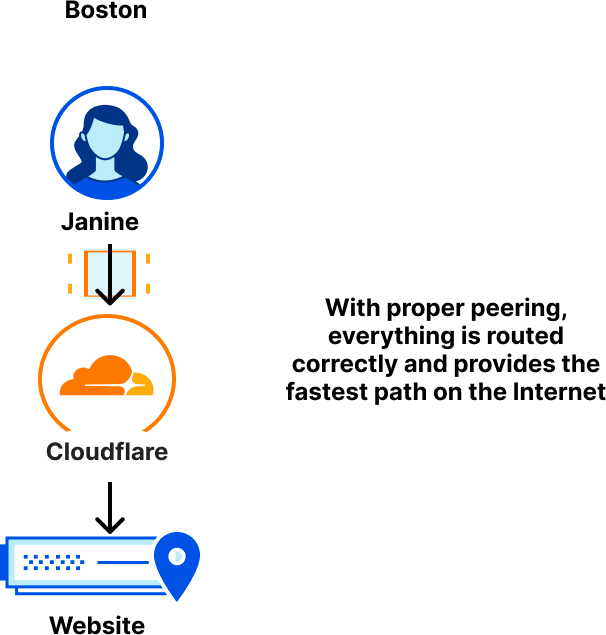
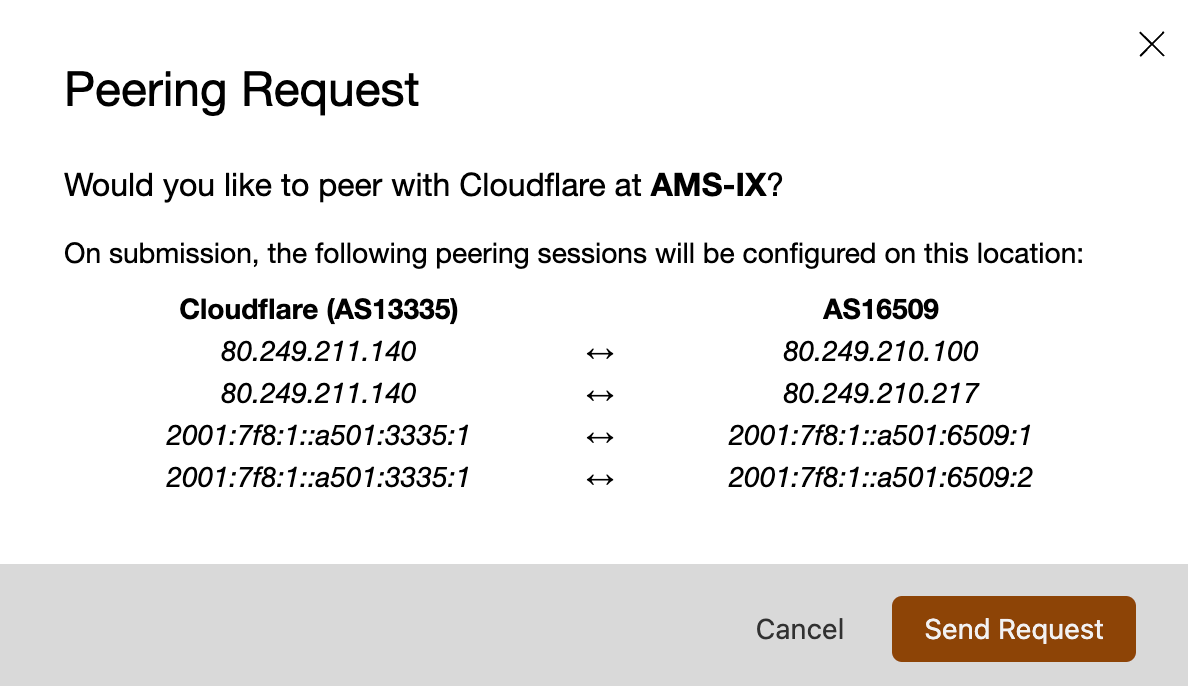

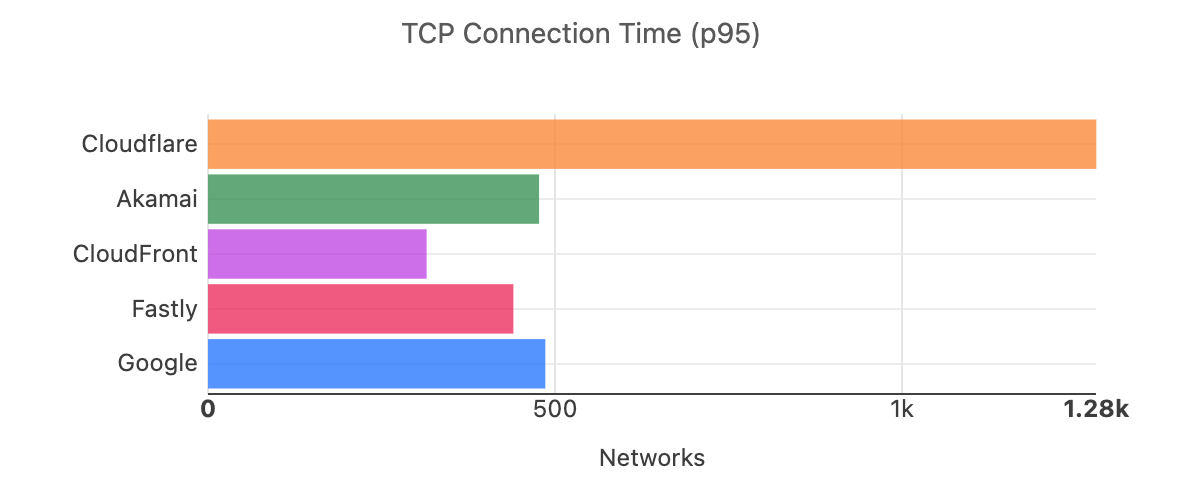
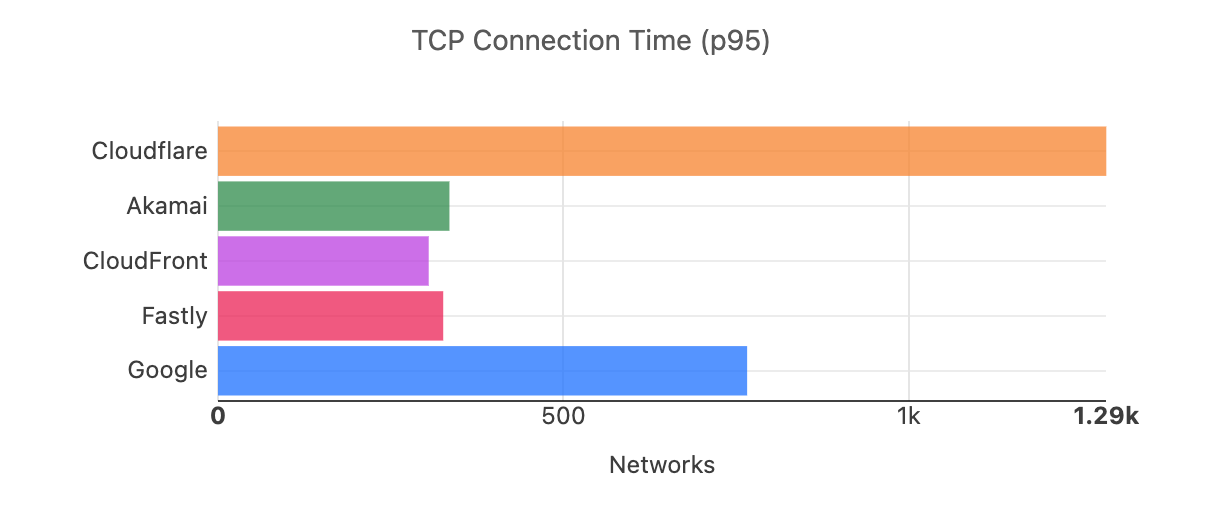
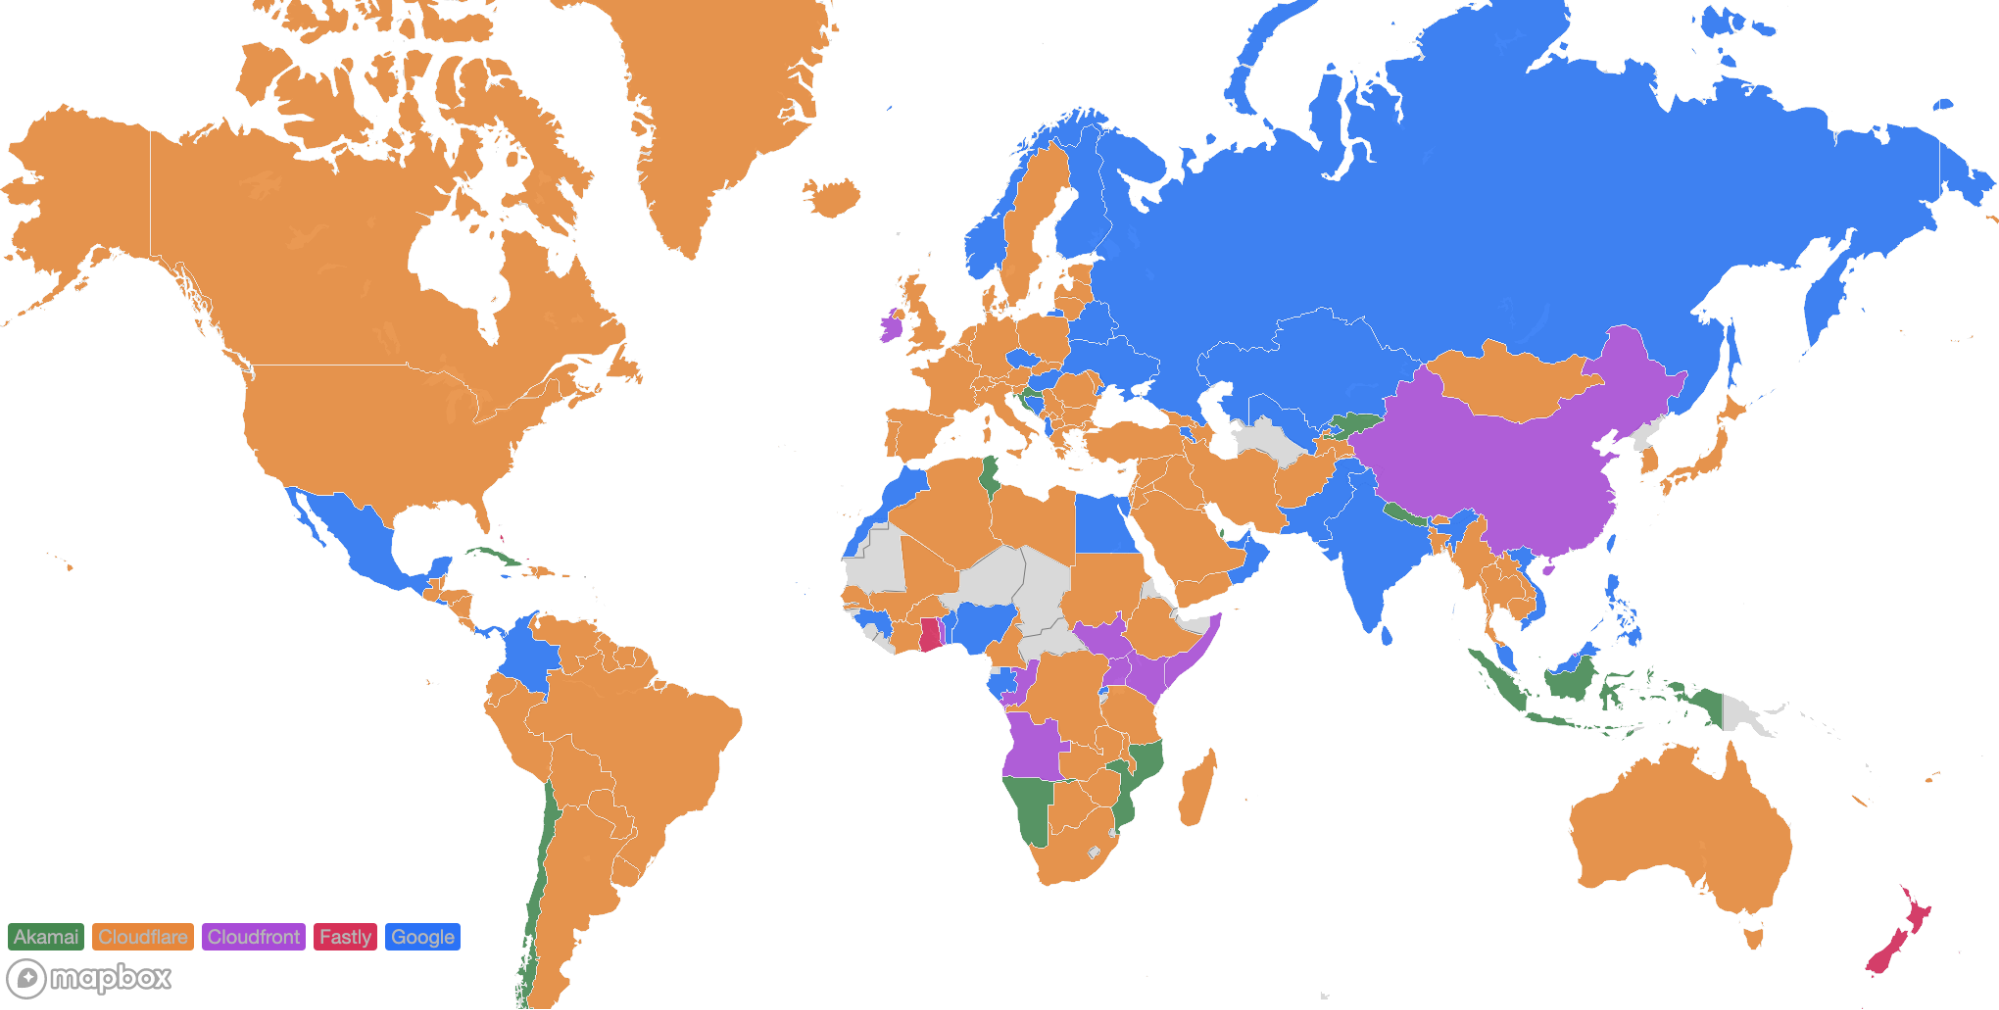
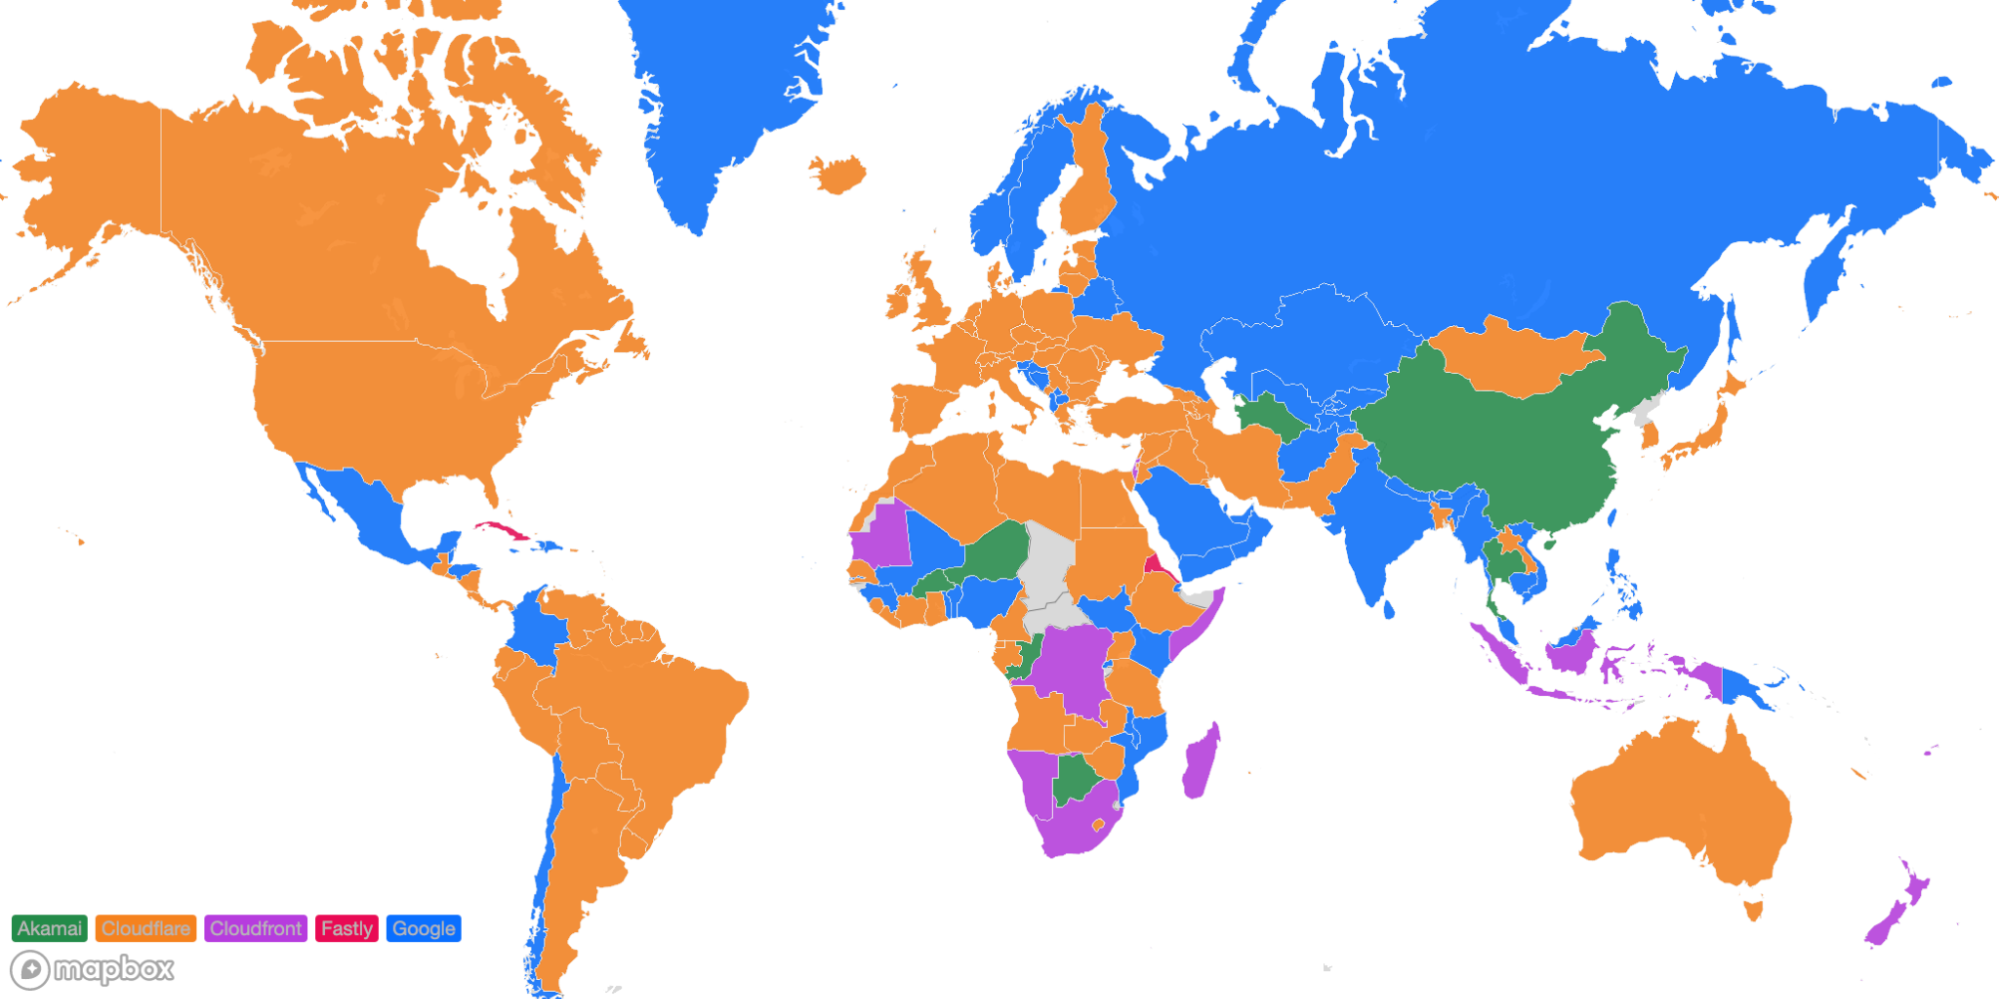


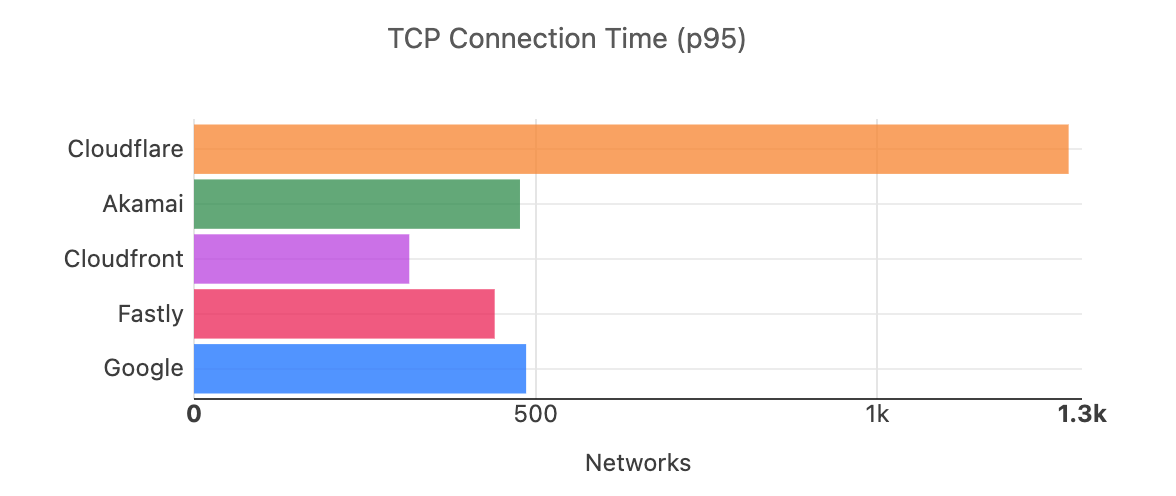

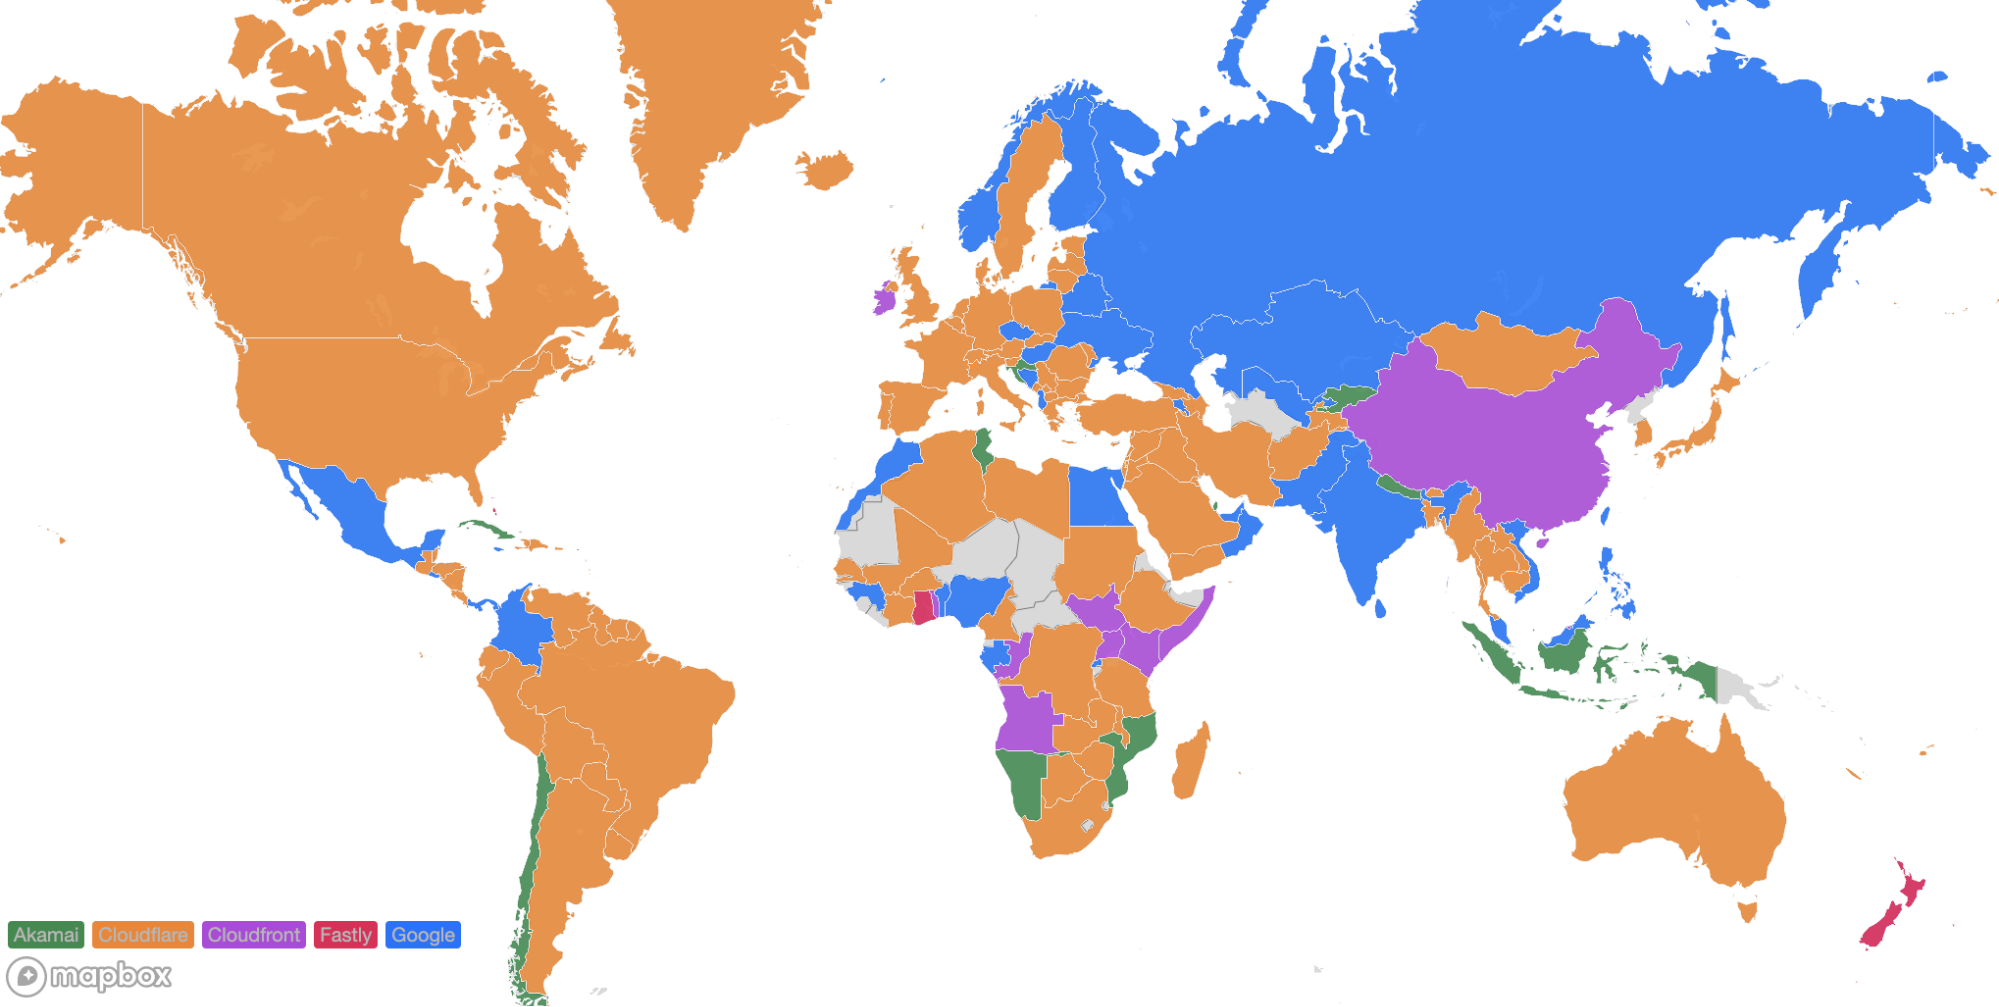
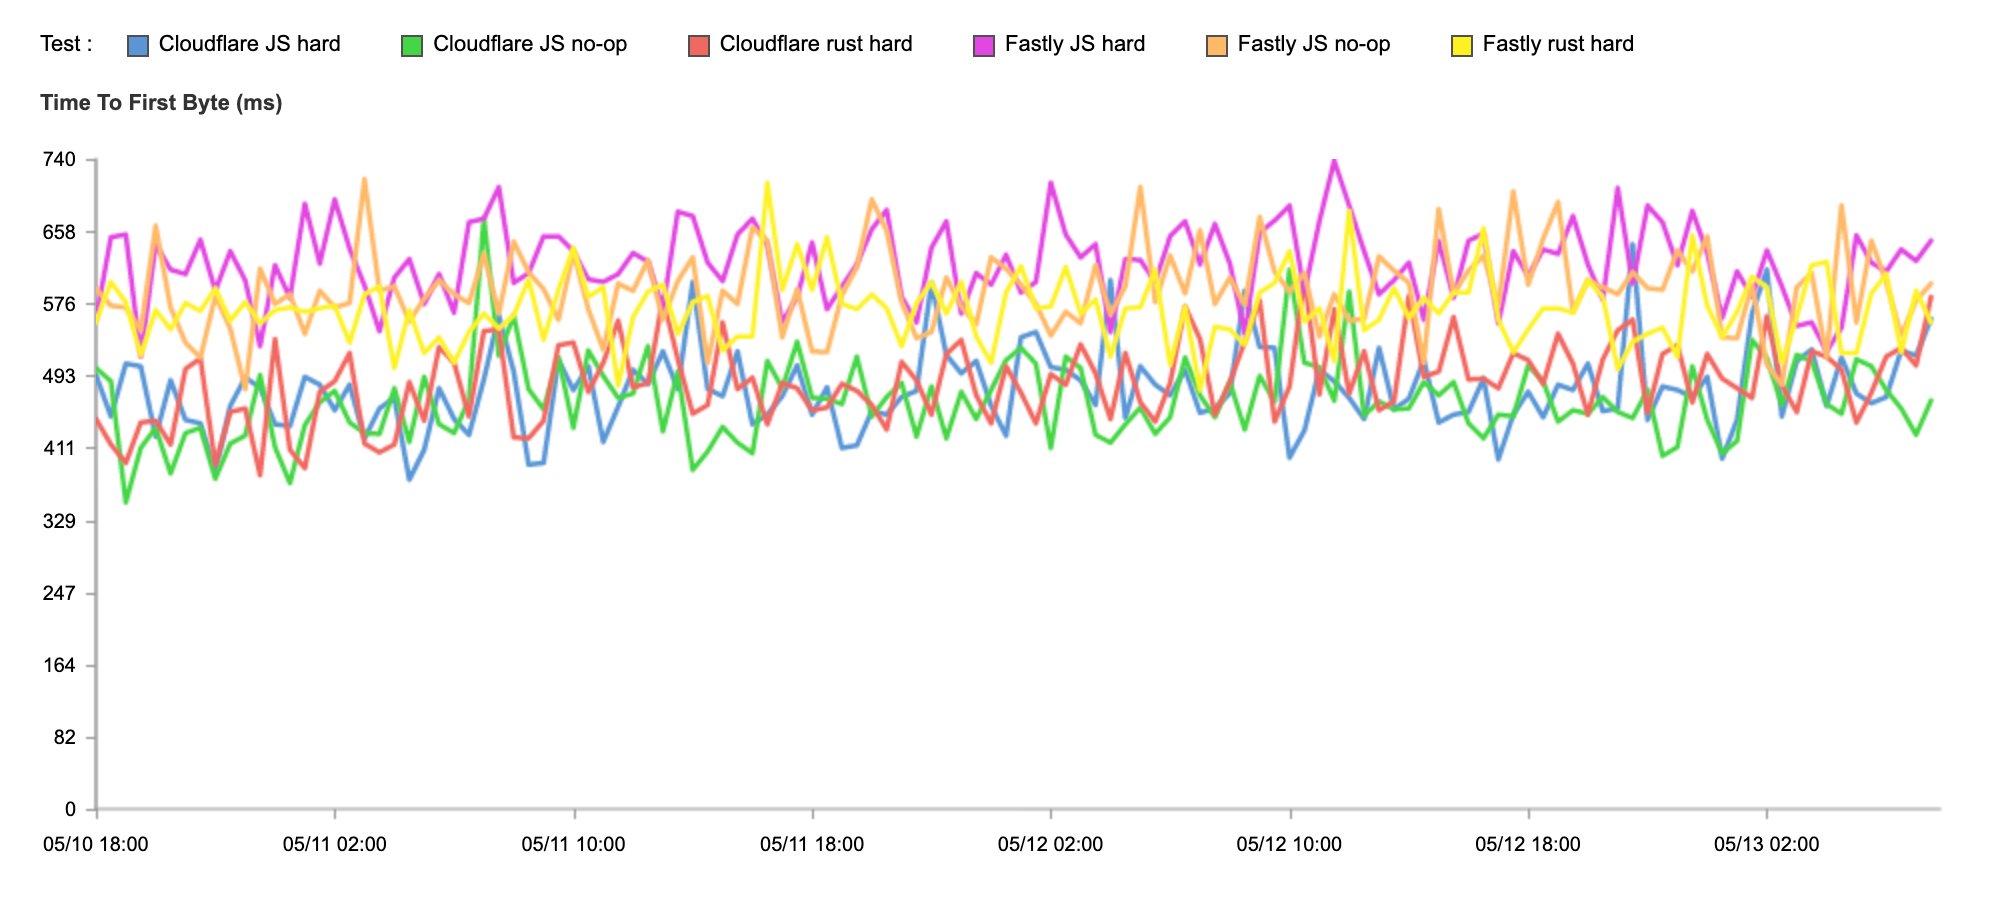
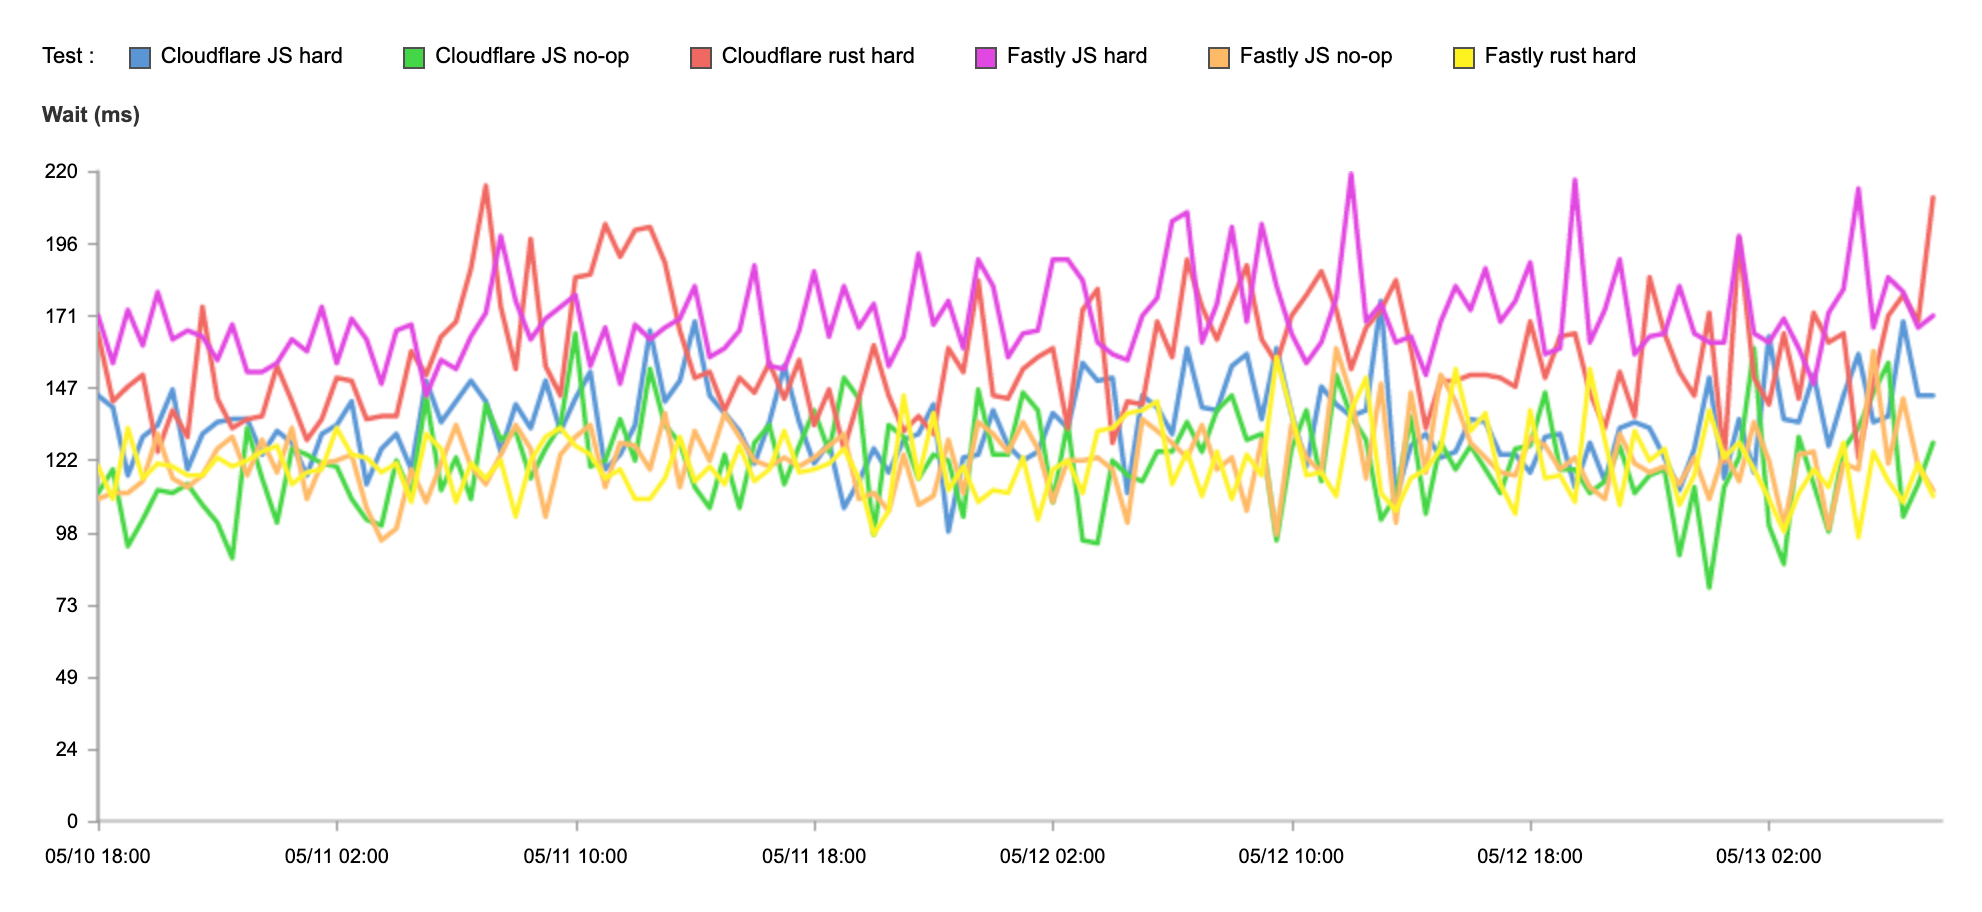
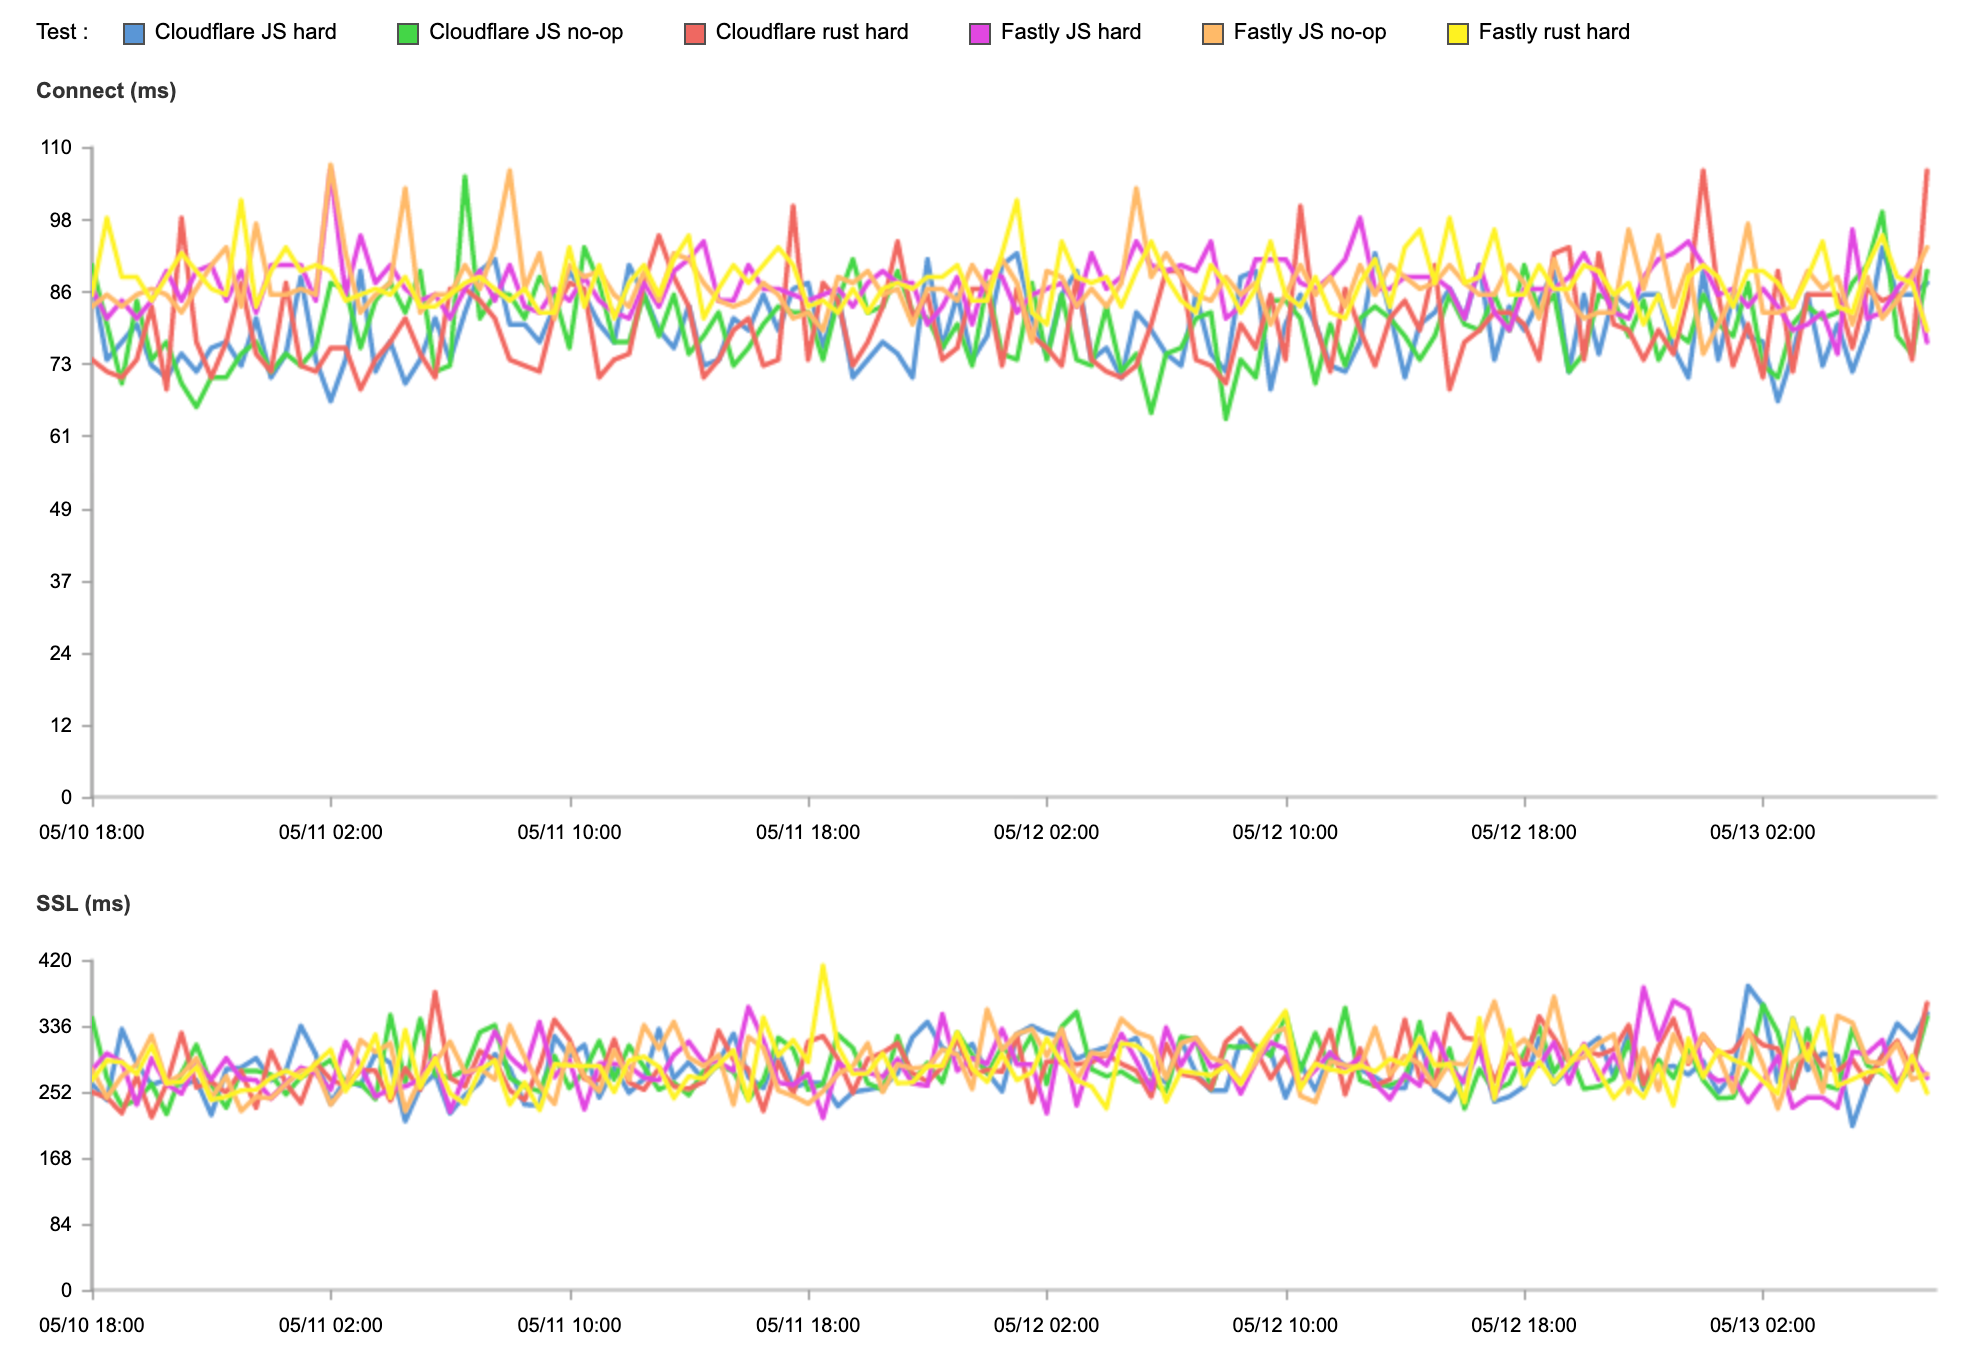
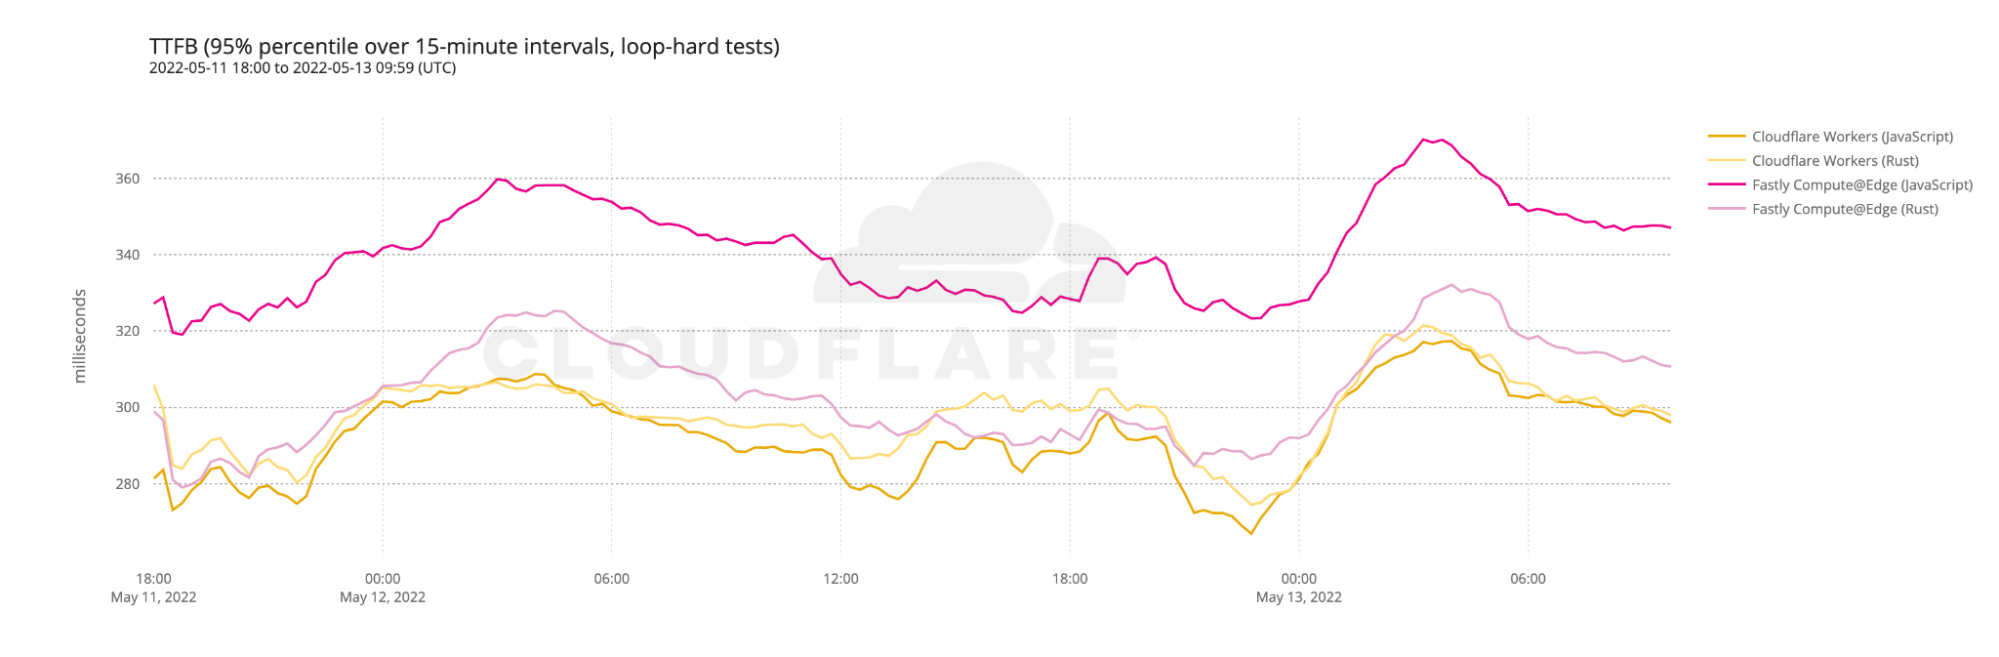
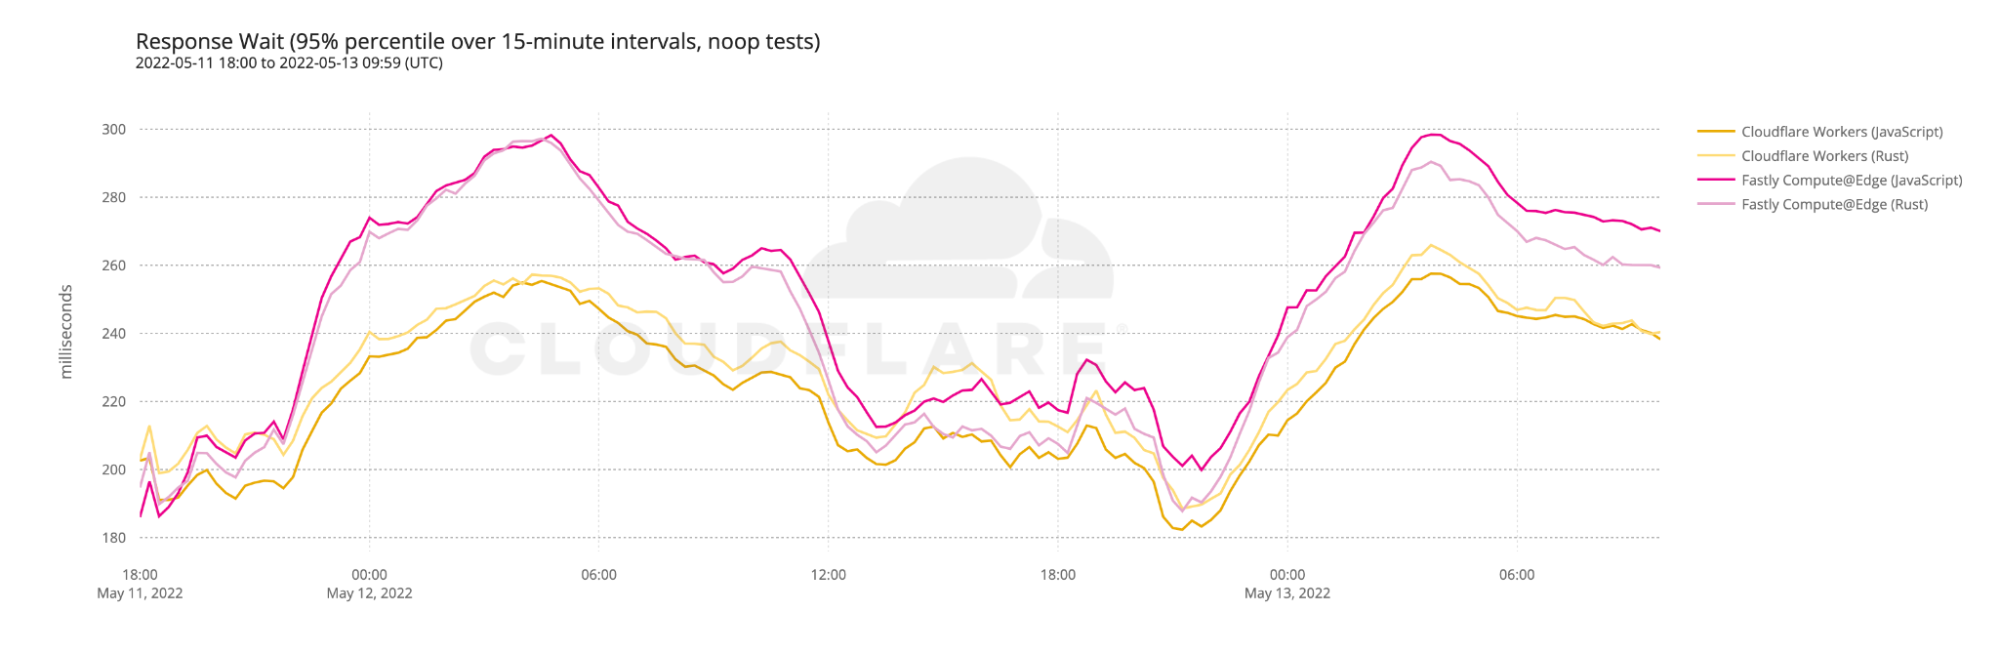


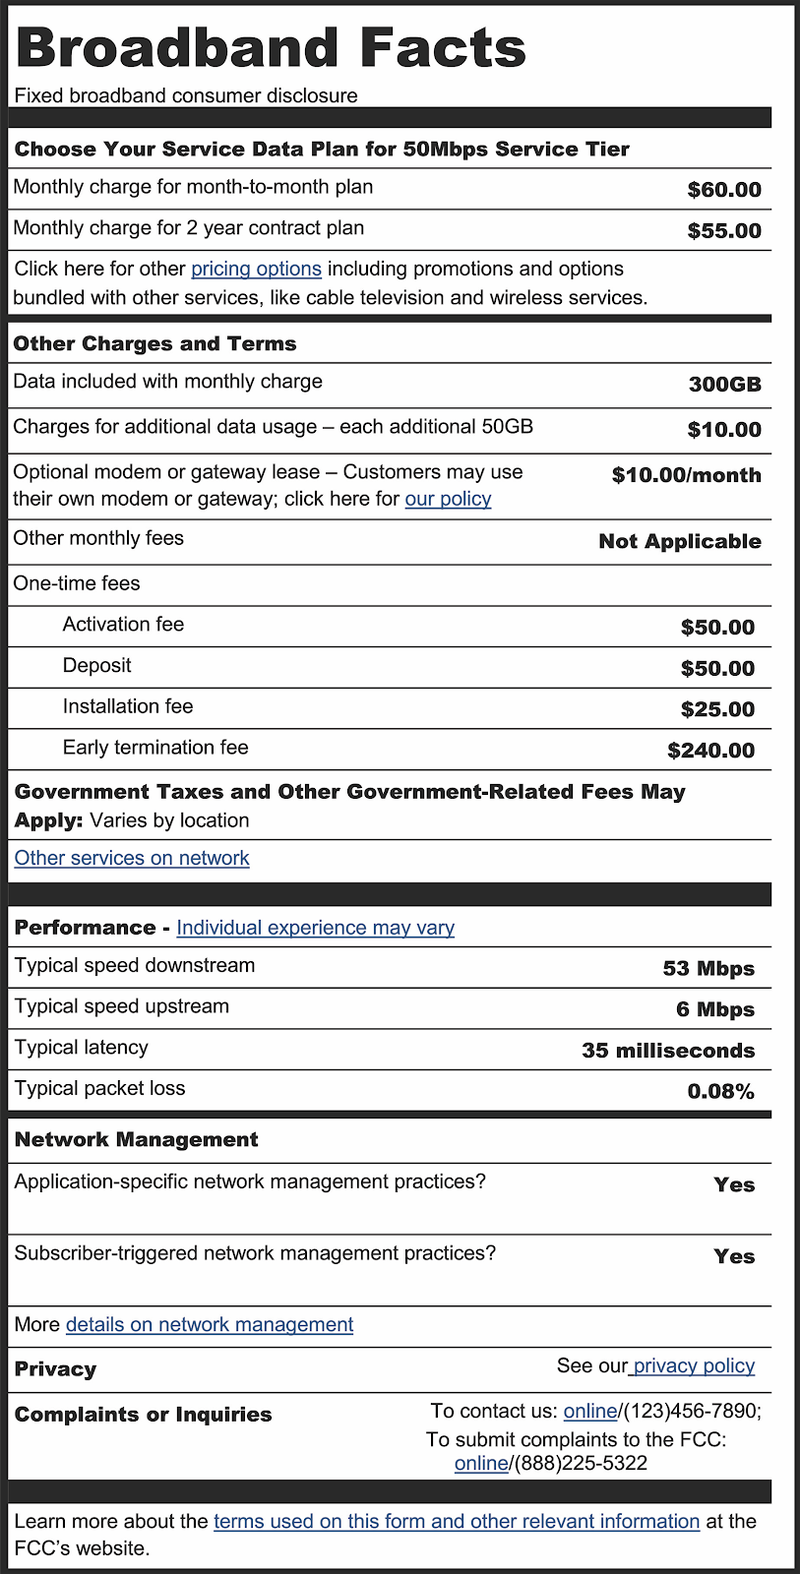
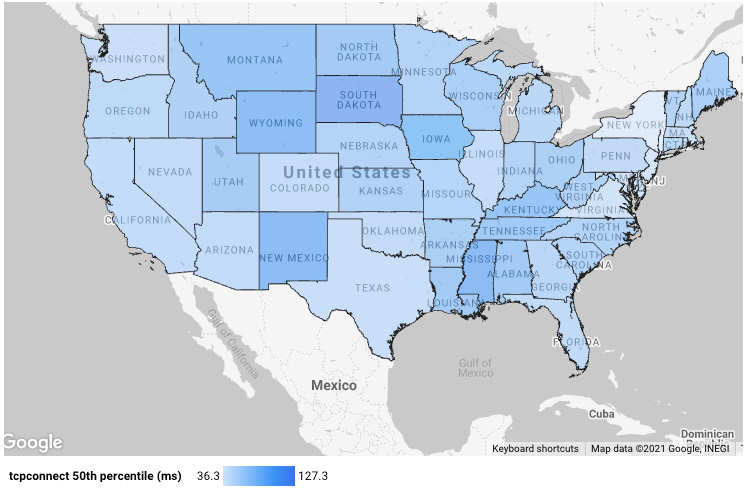

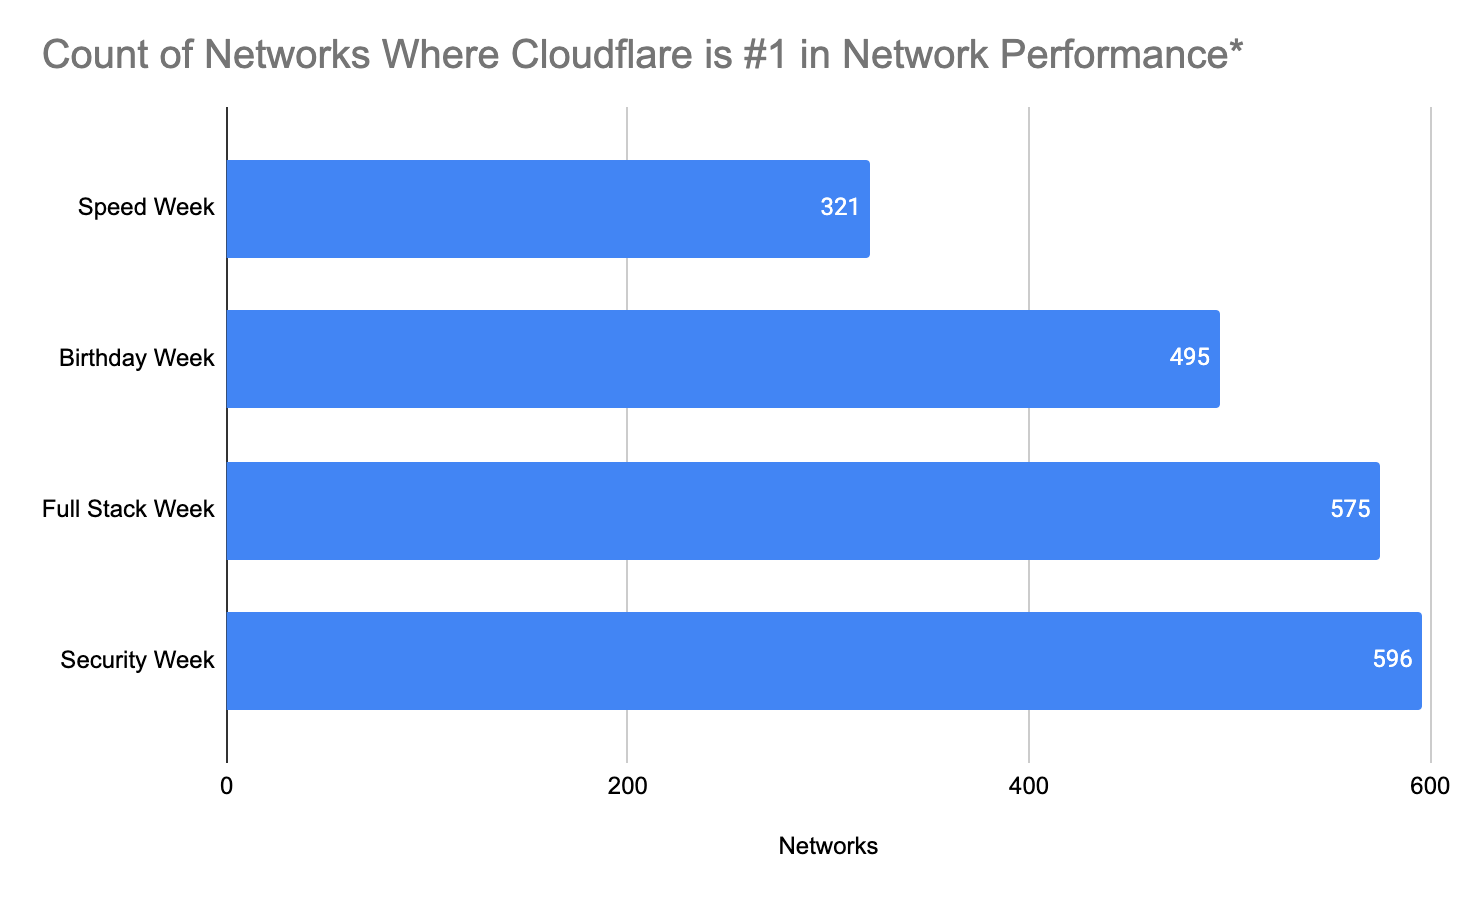
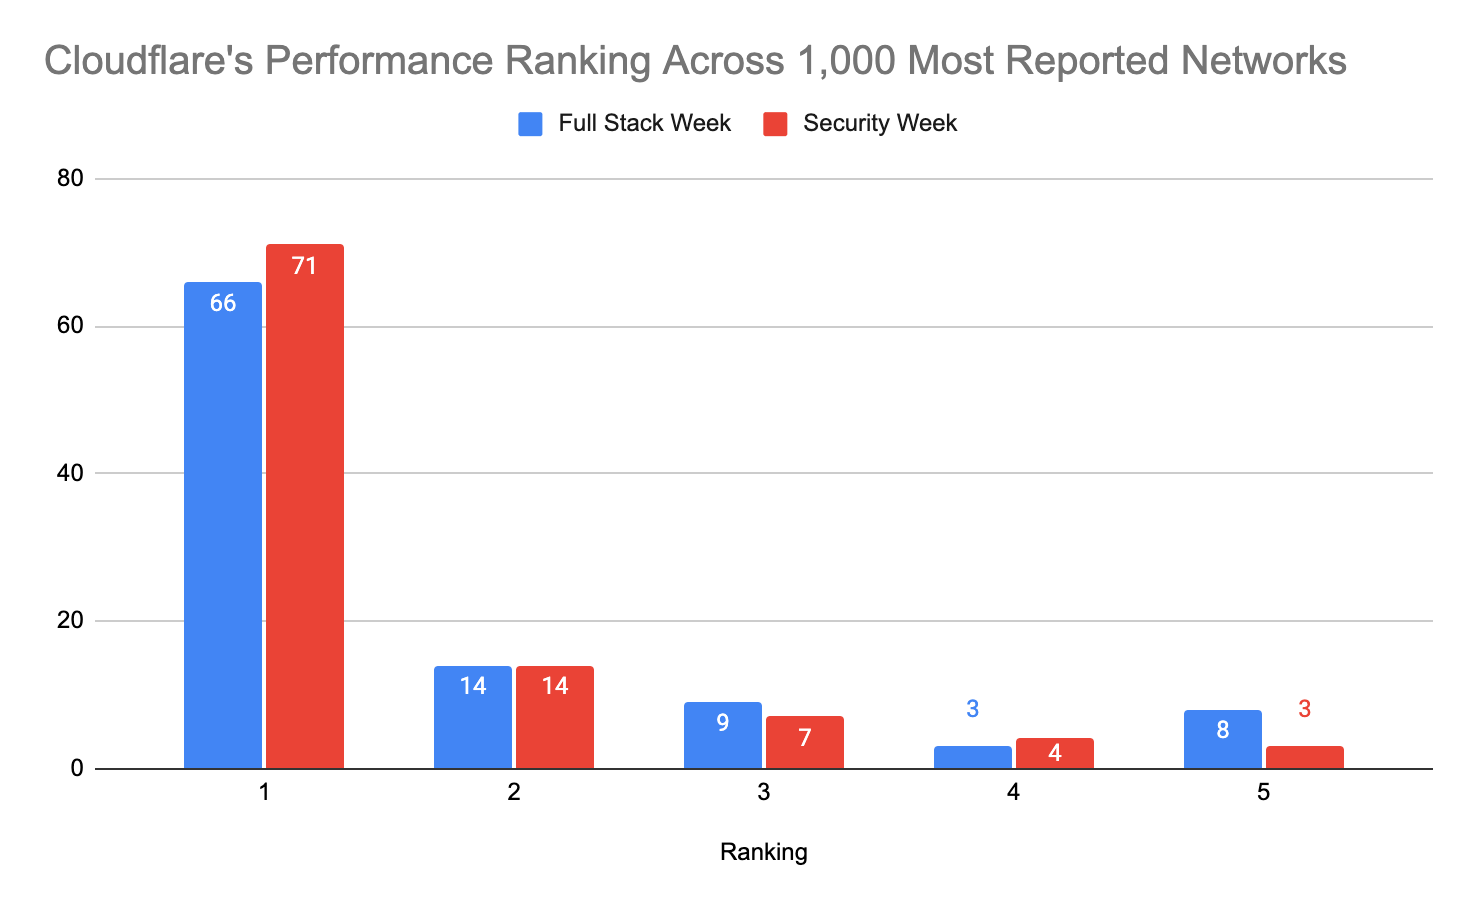
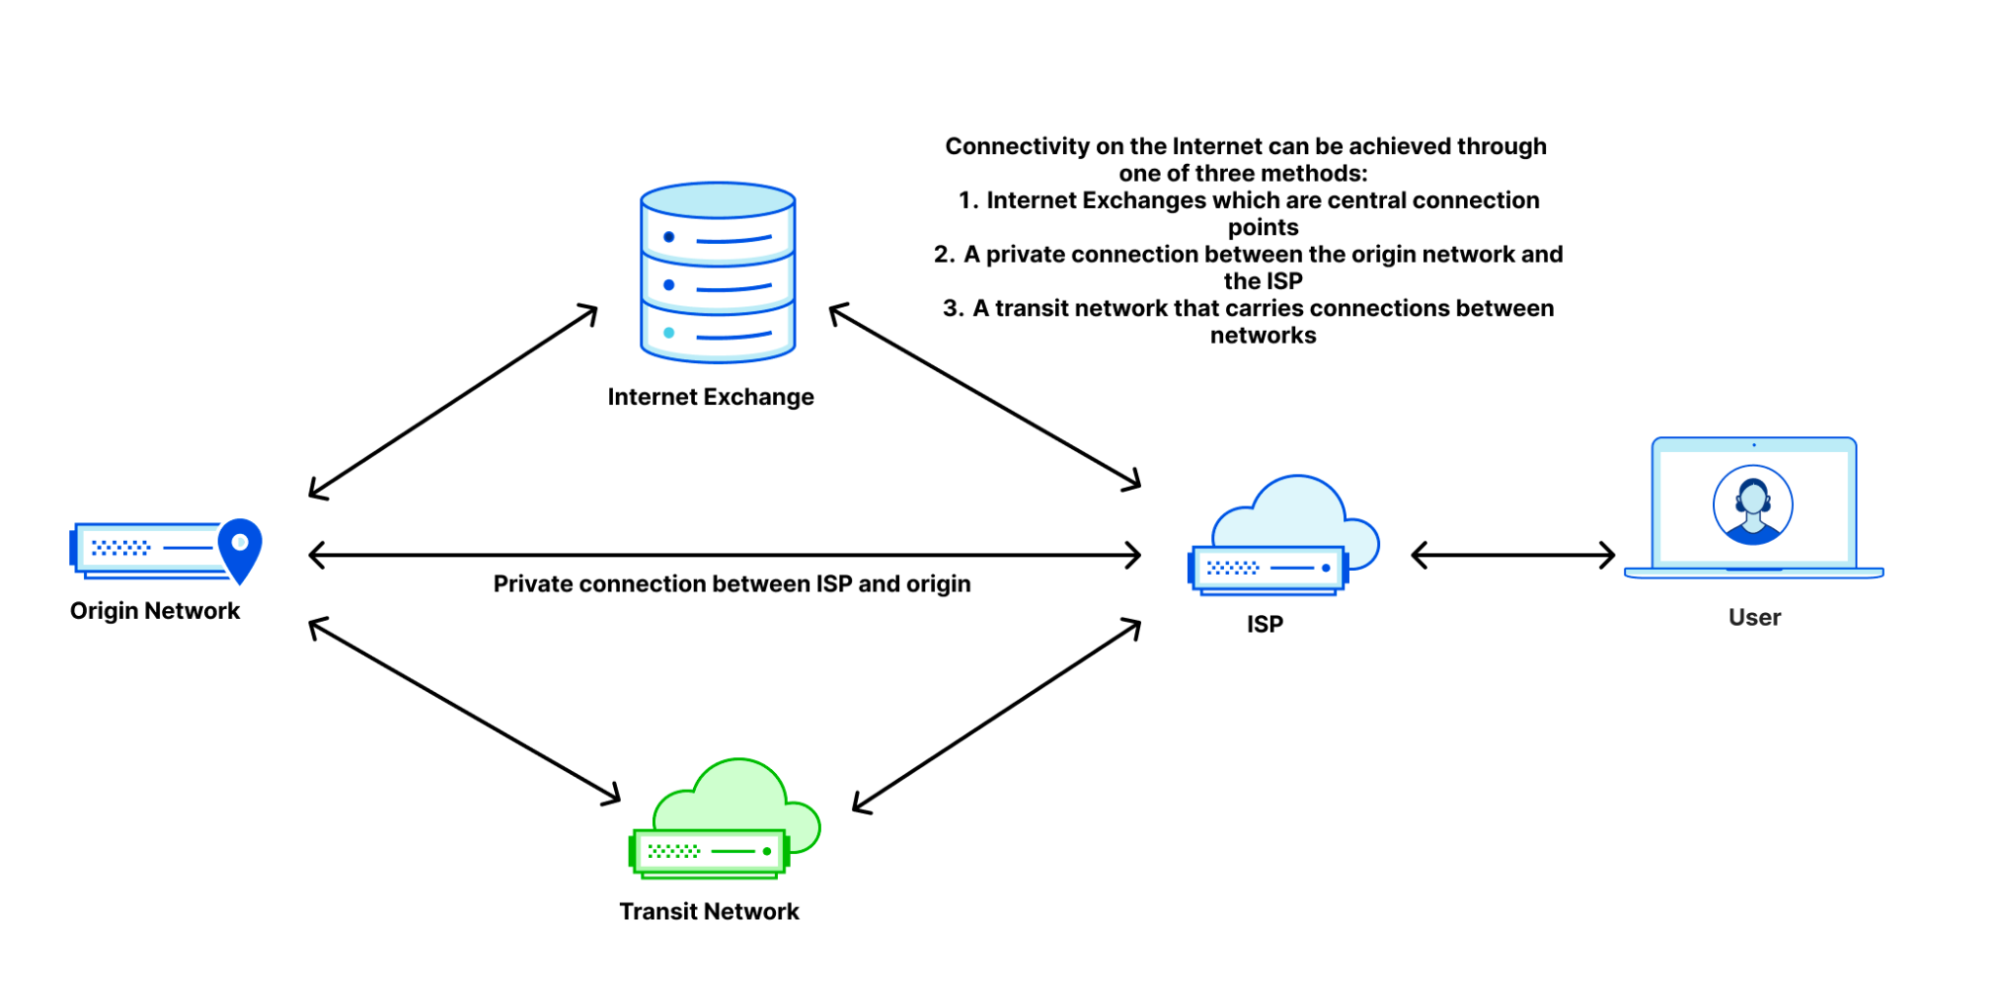
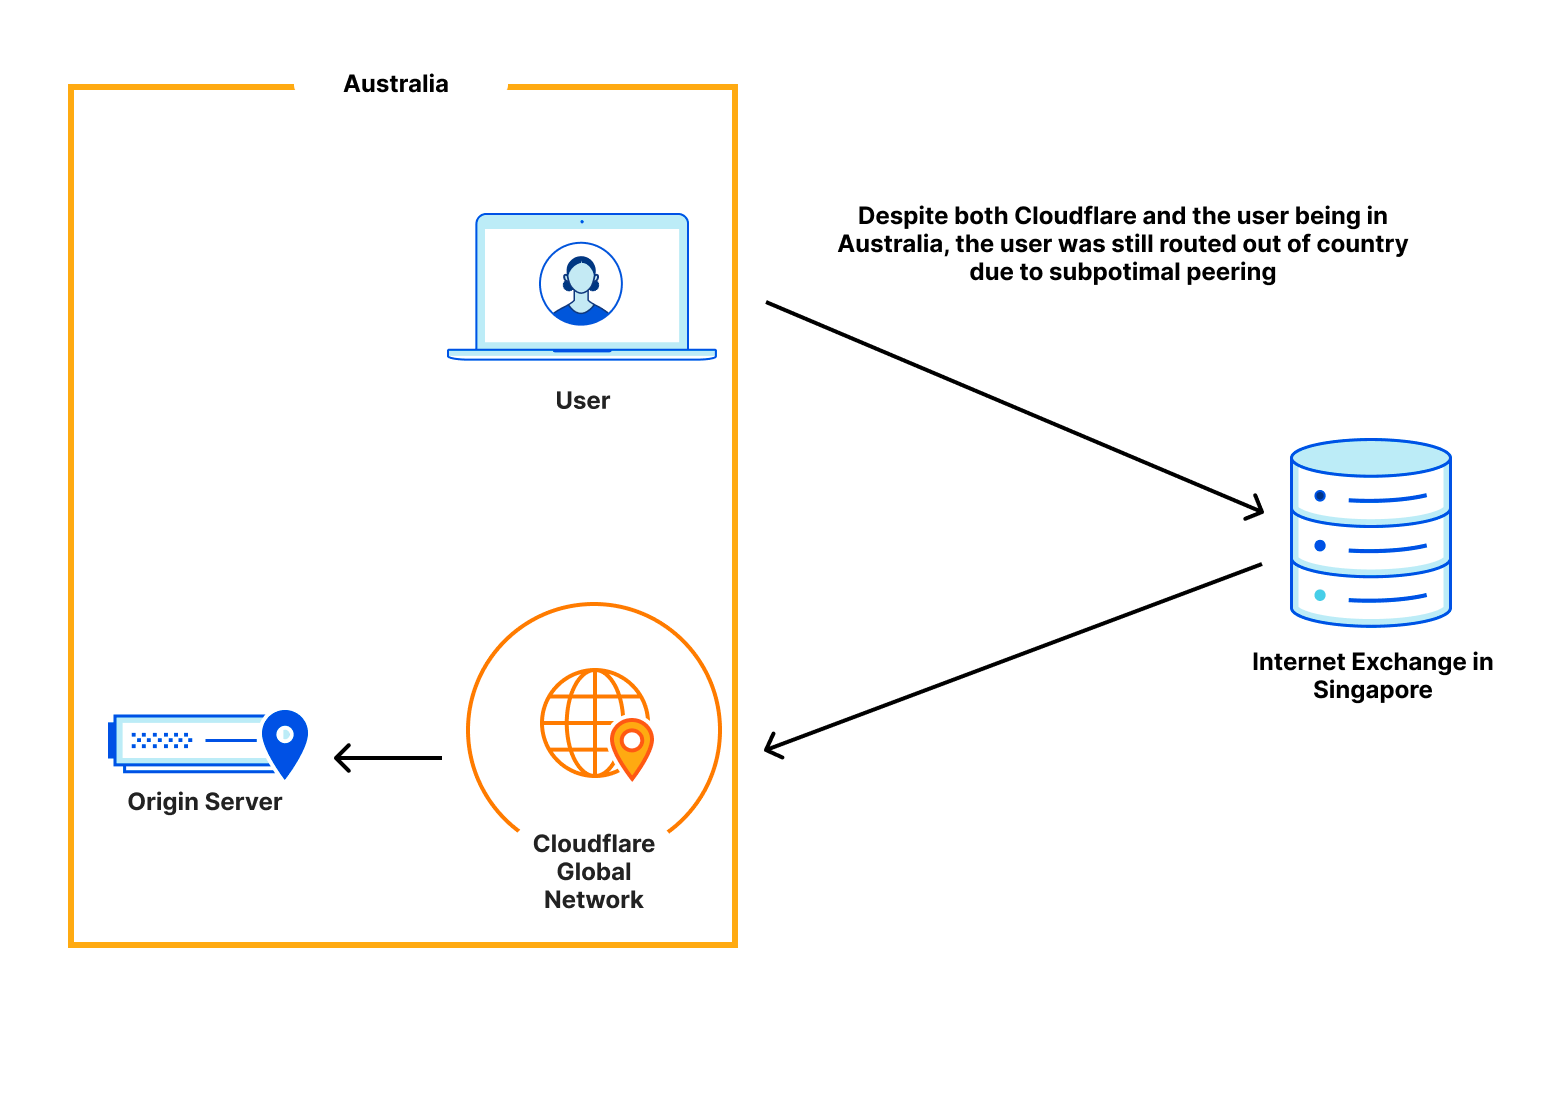
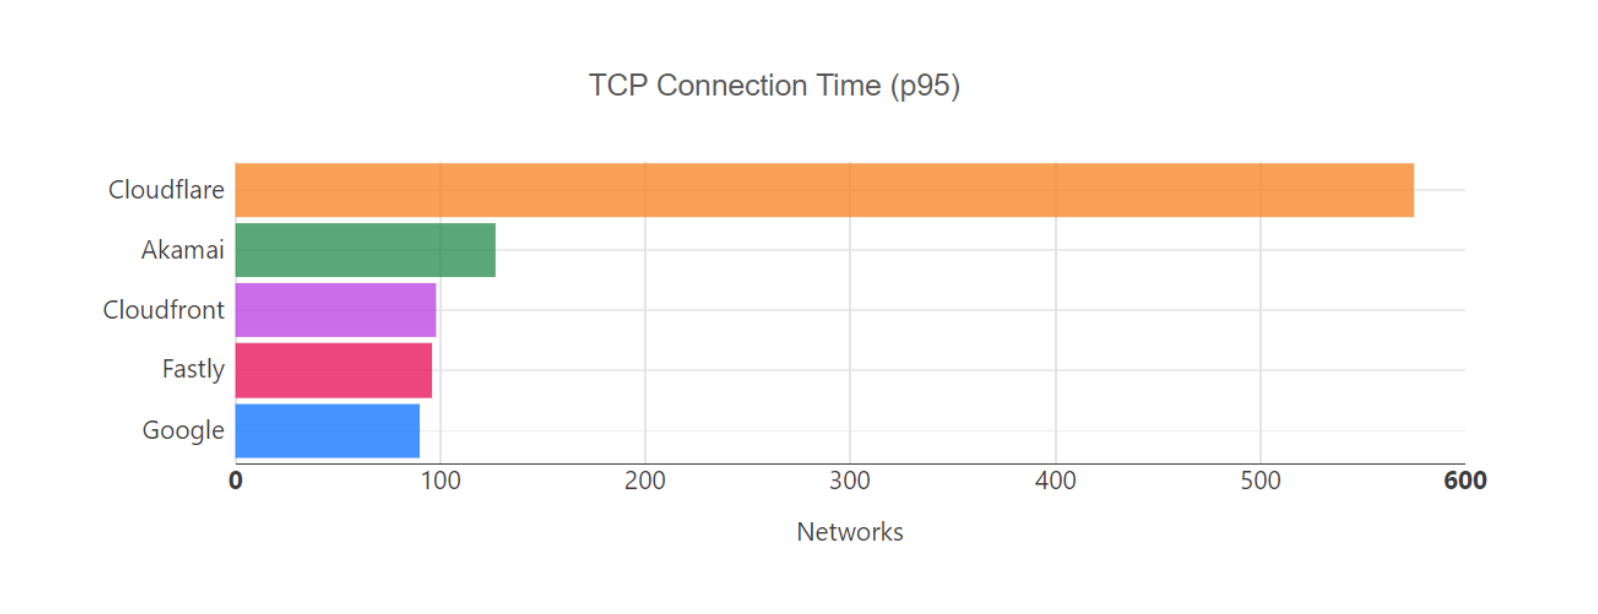
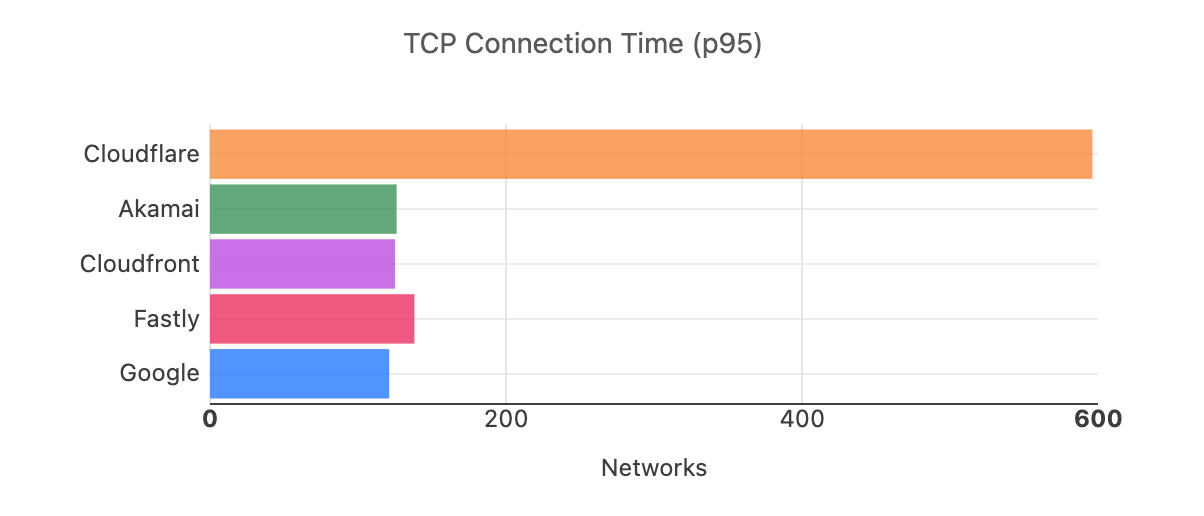
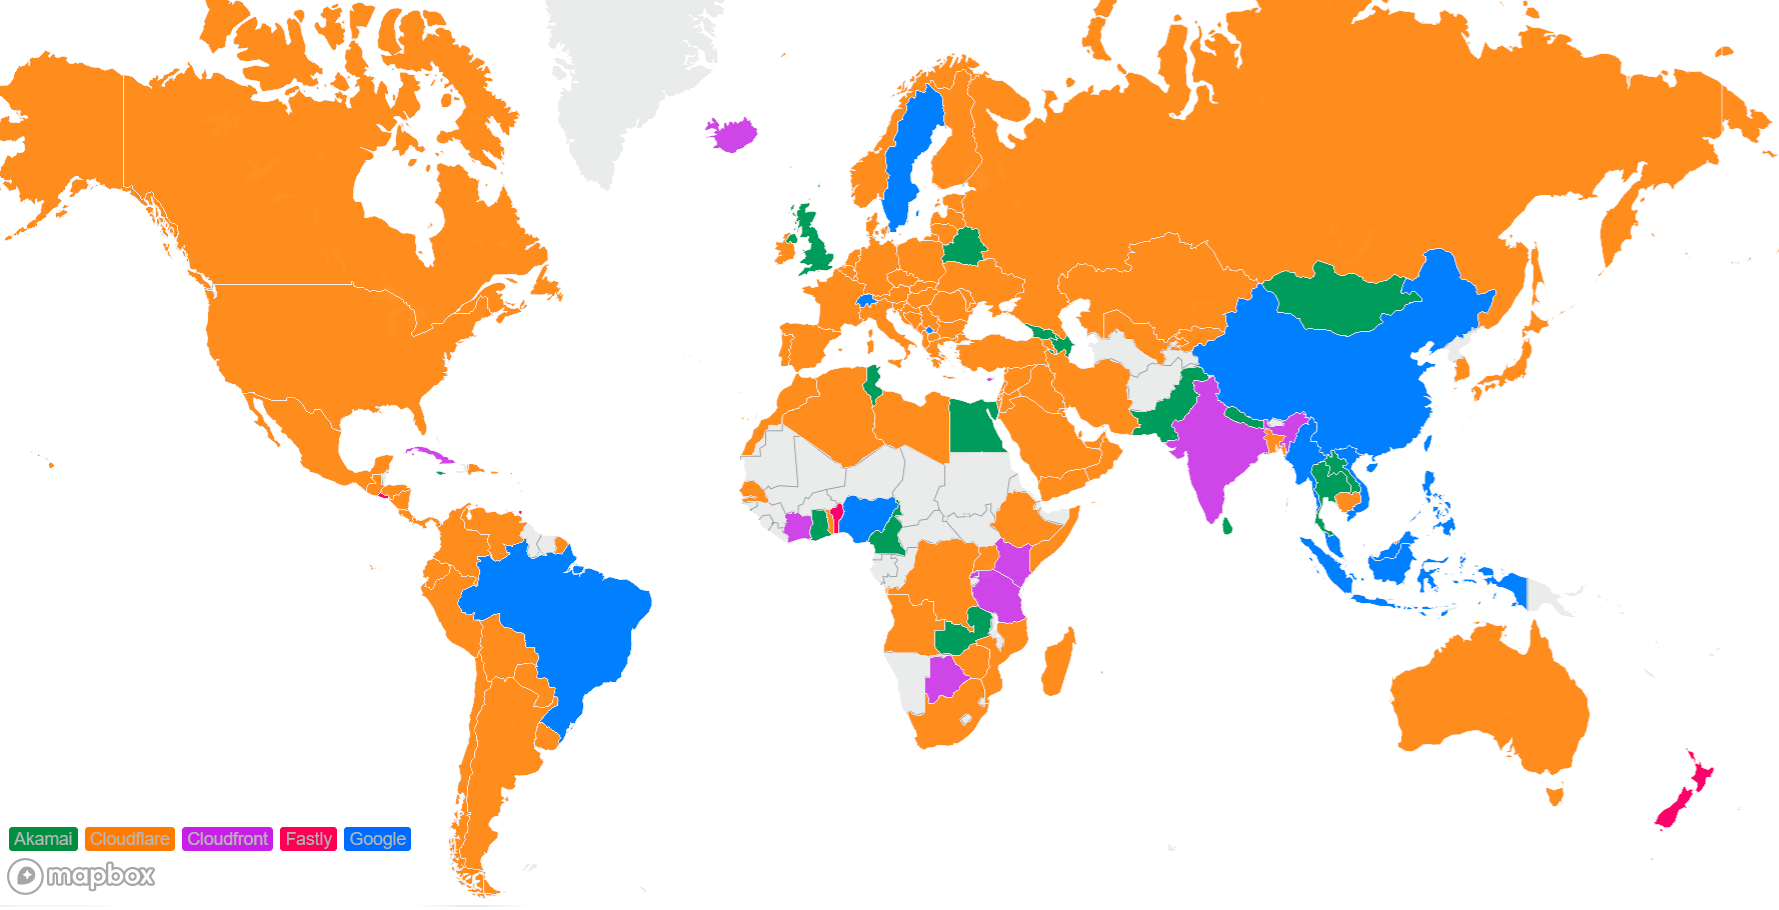
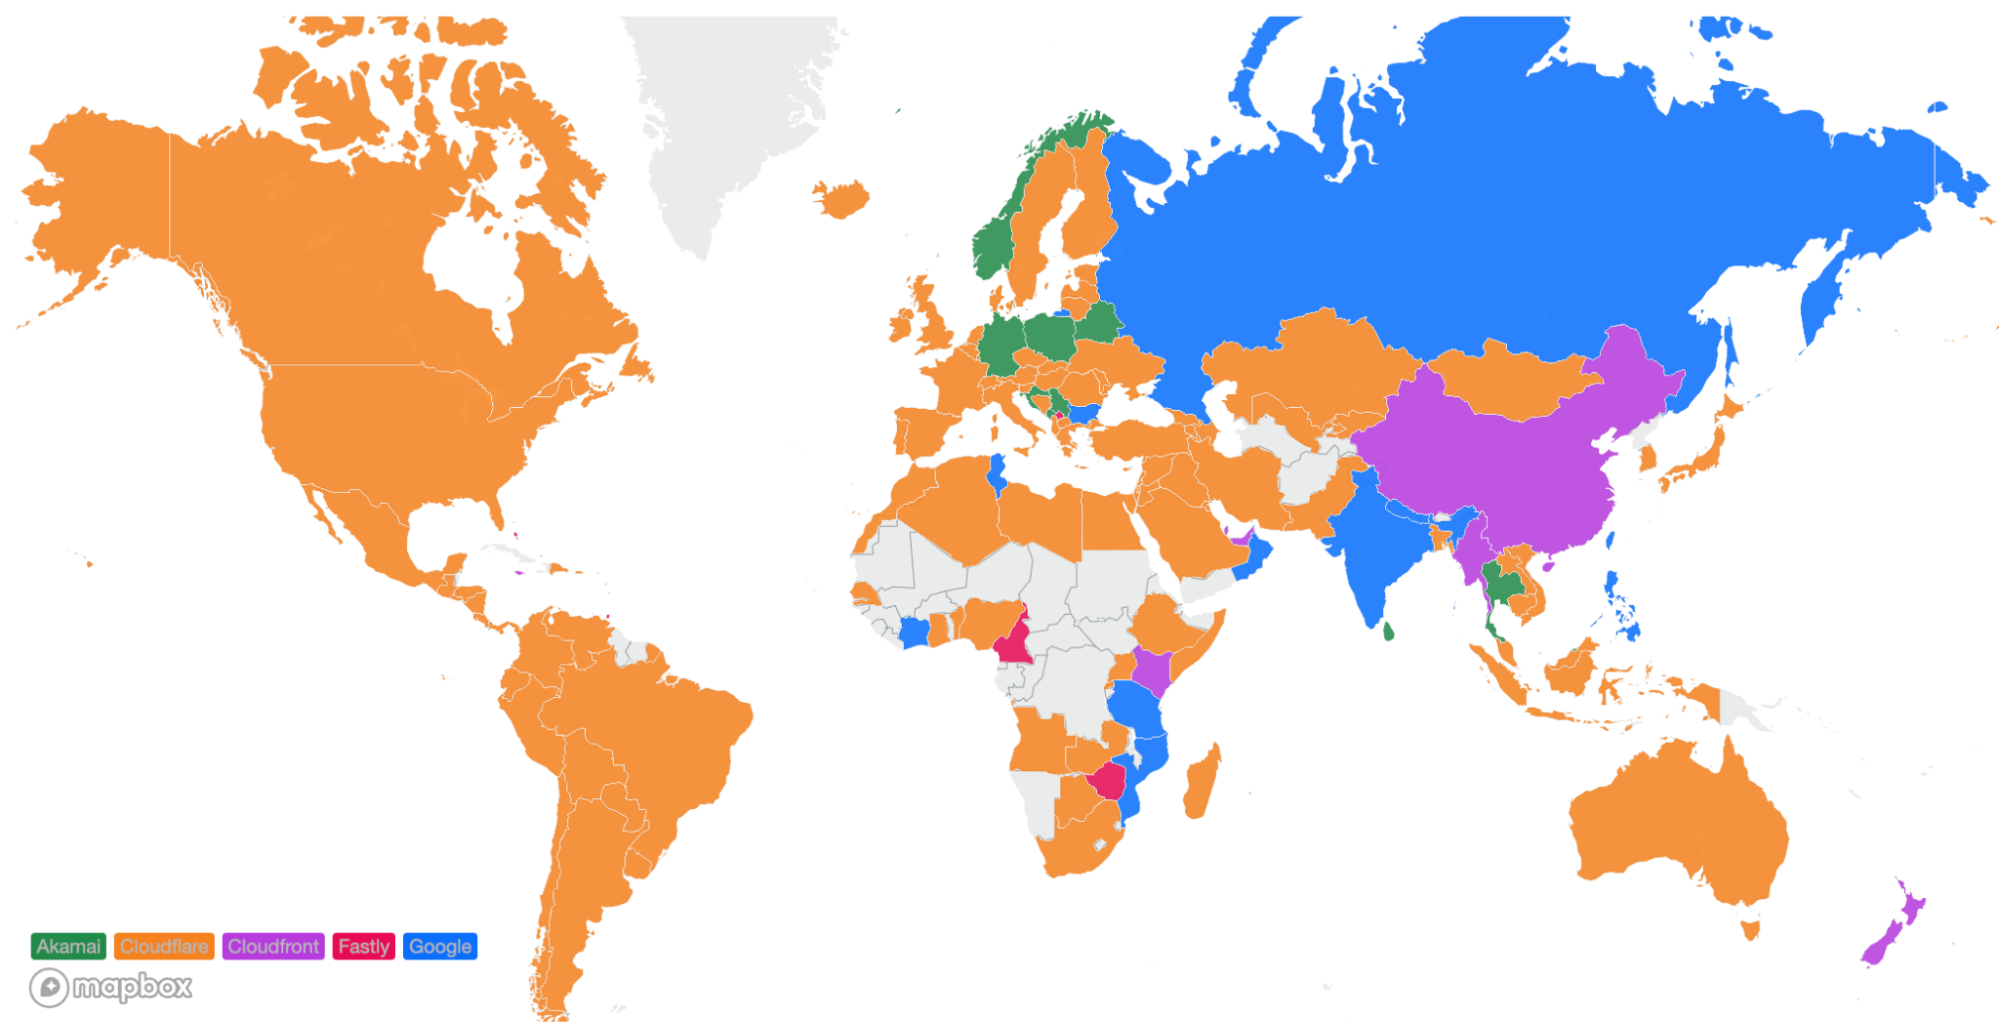
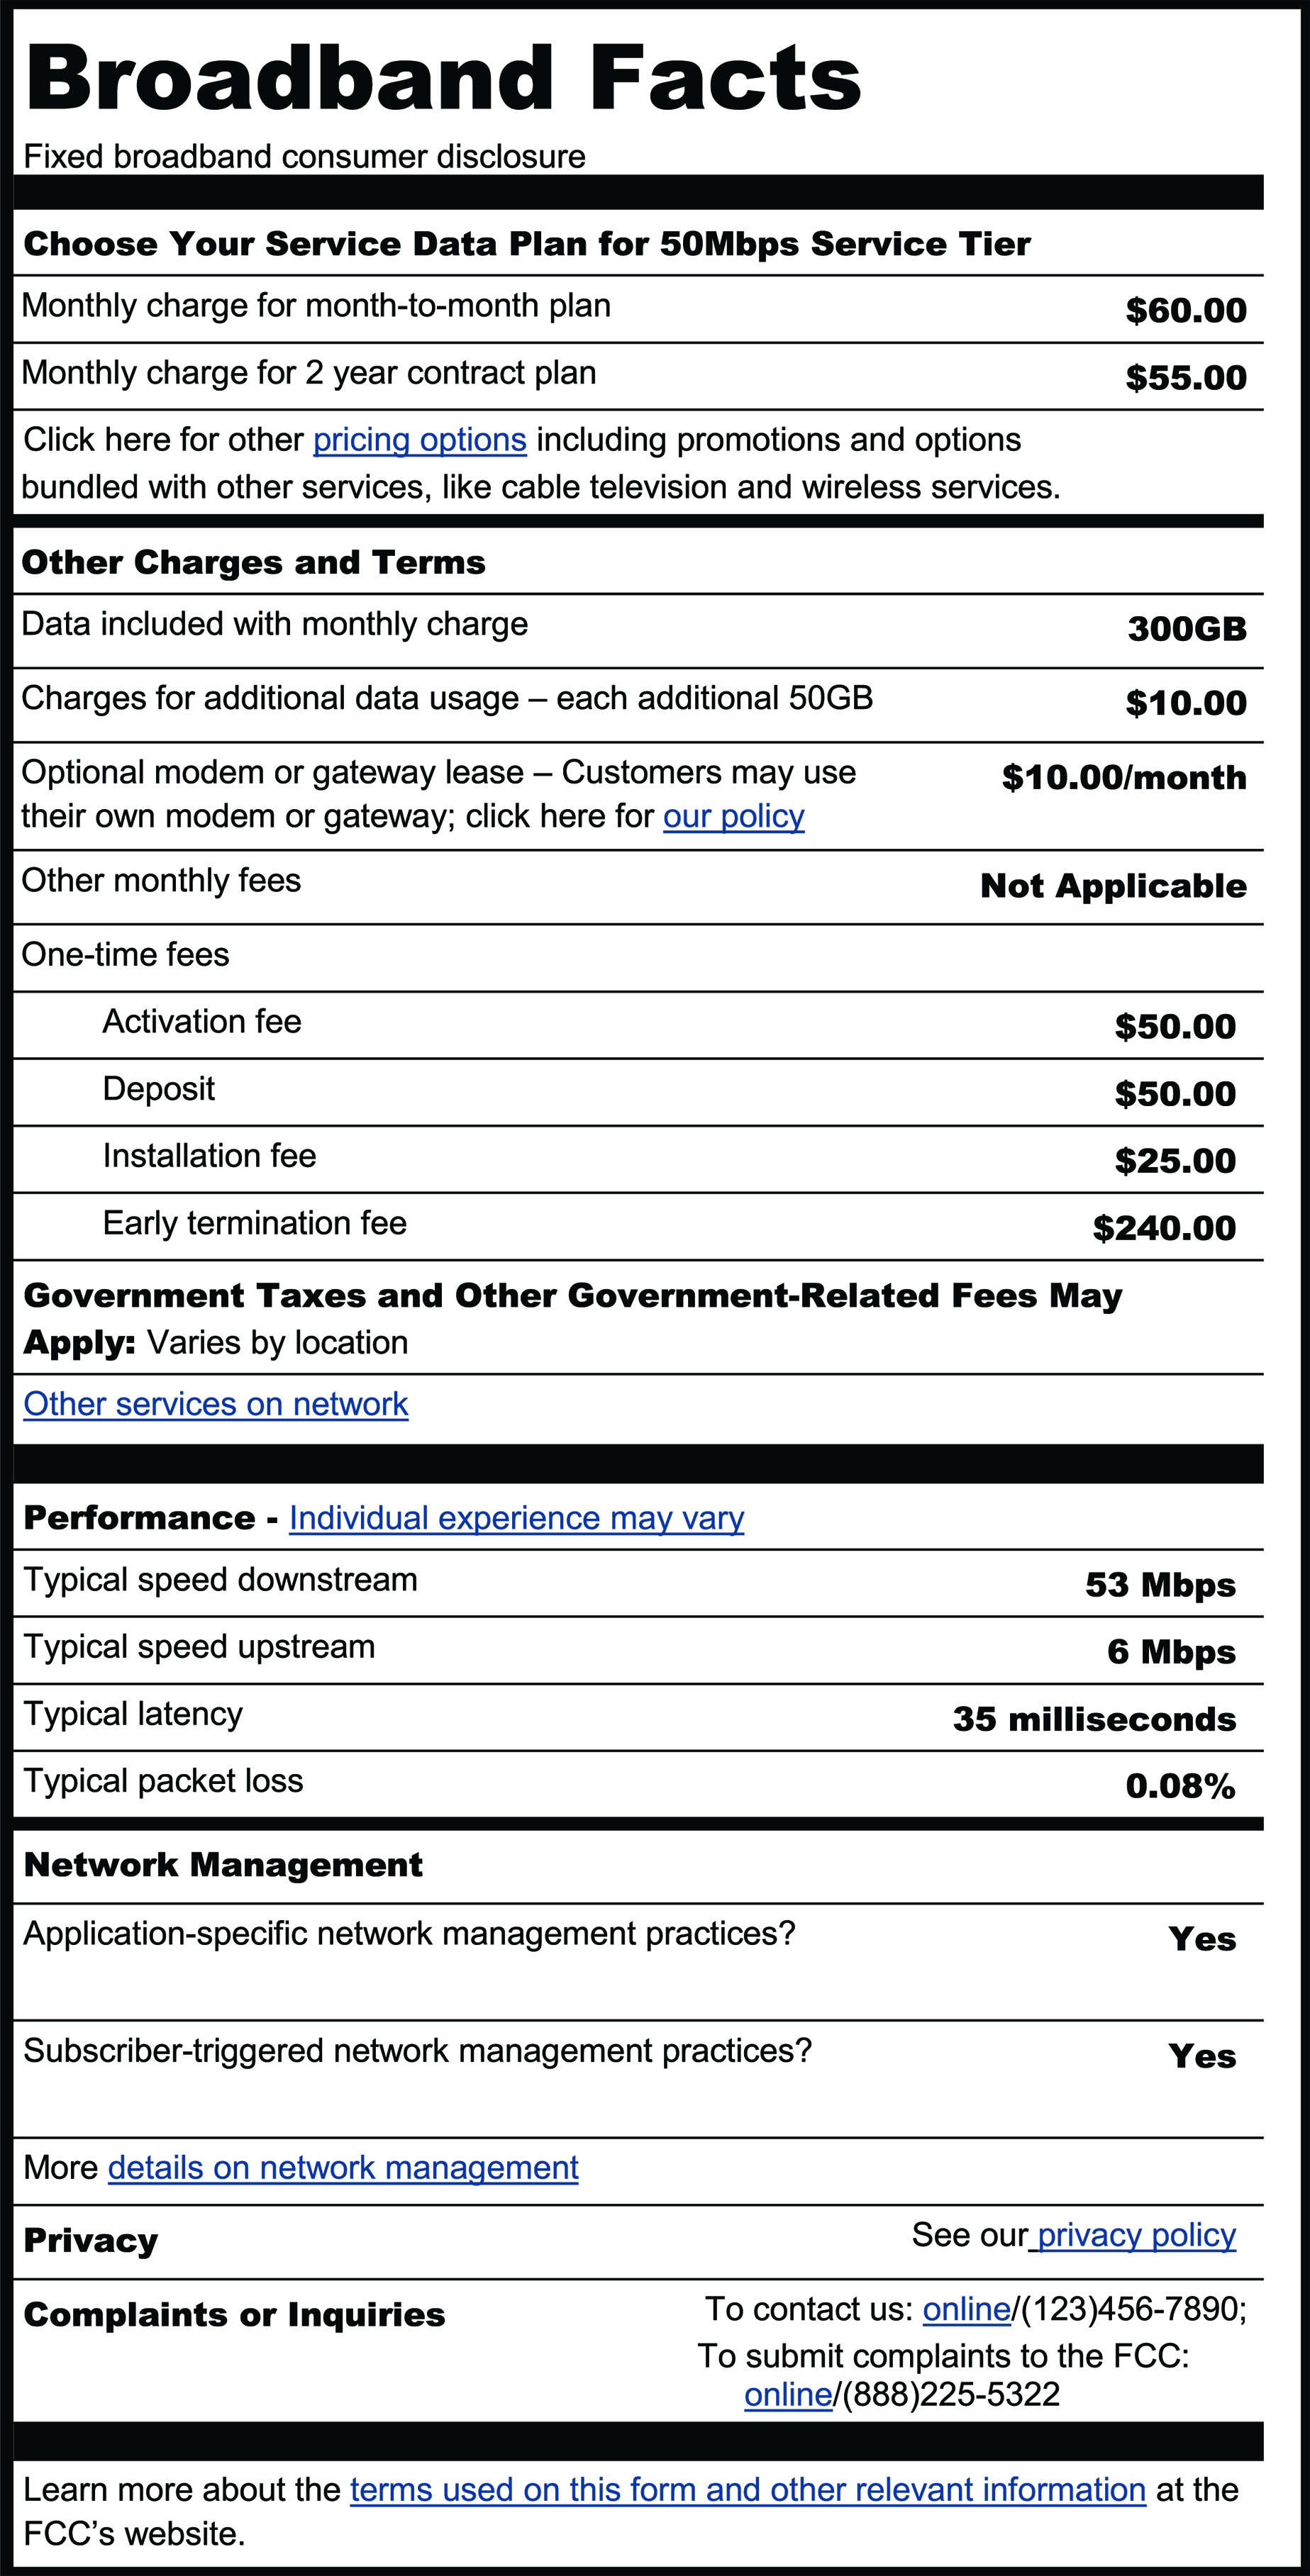