If you’re an IT professional for a state, local government, or educational institution or you’re a reseller serving those entities, you know firsthand how complex and time consuming procurement can truly be. Onboarding a cloud storage provider that meets both your needs and your organization’s procurement requirements is a challenge. And the need for affordable and secure data storage has never been greater—an incredible 79% of educational institutions reported being hit with ransomware in the past year.
Today, choosing Backblaze as your preferred cloud storage provider just got a lot easier. Backblaze is now available to purchase via Carahsoft’s National Association of State Procurement Officials (NASPO) ValuePoint contract.
The contract addition enables Carahsoft, The Trusted Government IT Solutions Provider®, and Backblaze to provide cloud storage solutions to participating states, local governments, and educational institutions. The contract also comes on the heels of Backblaze’s inclusion on Carahsoft’s NYOGS- and OMNIA-approved vendor lists.
What Is the NASPO ValuePoint Contract?
NASPO ValuePoint is a cooperative purchasing program that facilitates public procurement solicitations and agreements using a lead-state model, which means one state or organization takes the lead on soliciting proposals on behalf of others and working with a sourcing team to evaluate responses and choose a vendor. By leveraging the leadership and expertise of all states and the collective purchasing power of their public entities, NASPO ValuePoint delivers the highest valued, reliable, and competitively sourced contracts, offering public entities outstanding pricing.
Benefits to Customers
As a state, local government, or educational institution, you get a number of benefits by purchasing Backblaze through Carahsoft’s ValuePoint contract, including:
Simplified Procurement: You don’t have to go through the hassle of setting up your own contracts or negotiating prices. You can just use the NASPO ValuePoint contract, and that hard work is already taken care of.
Cost Savings: Because the ValuePoint contract covers lots of states and organizations, services are purchased in bulk, which usually means cheaper prices.
Time Savings: You save time researching suppliers or going through a long bidding process. You can just choose from the options already approved under the contract.
Quality Assurance: The contract usually has strict standards for its offerings, ensuring that you as a customer get access to quality products and services.
Benefits for Resellers
Resellers who are not currently listed on the NASPO ValuePoint Contract can still reap the benefits as well (and if you’re already listed, even better). By purchasing Backblaze through Carahsoft, you will gain:
Access to a Larger Market: Resellers can sell Backblaze to multiple states or organizations without having to negotiate separate contracts each time. This means more potential cloud customers.
Streamlined Sales Process: You don’t have to spend as much time and effort trying to win individual contracts. Now that Backblaze is on the NASPO ValuePoint Contract, you’re pre-approved to sell B2 Cloud Storage and Computer Backup to all participating entities.
Increased Credibility: With Backblaze being part of a trusted contract like NASPO ValuePoint, you can enhance your reputation and credibility in the cloud market, potentially attracting more customers.
Stable Revenue Stream: Having a contract with multiple states or organizations provides a more stable and predictable revenue stream for you as a reseller, as you have access to a broader customer base.
Making It Easier to Provision Backblaze
As a public sector agency, you face some of the greatest challenges when it comes to affordably protecting and using your data given ransomware attacks and budget constraints. Carahsoft’s NASPO program cuts through this complexity with cooperative purchasing, resulting in more favorable terms and conditions and competitive pricing.
Previously, it was hard for many state, local, educational and government institutions to benefit from the affordability and reliability that Backblaze provides. Now, Backblaze’s addition to Carahsoft’s NASPO contract streamlines procurement of B2 Cloud Storage and Backblaze Computer Backup—speeding up your acquisition timeline.
The availability of the Backblaze portfolio to NASPO members strengthens our partnership by aligning with Government procurement processes and expanding Backblaze’s reach in the Public Sector market. It is critical we support the Government as they work to modernize their cloud data storage systems to meet the demands of an increasingly digital era. By collaborating with Backblaze and our reseller partners, we can continue to expand and improve agency access to the affordable, cutting-edge solutions they need to achieve mission success.
—John Rentz, MultiCloud Team Lead, Carahsoft
How to Purchase Backblaze via Carahsoft
Backblaze’s offerings are available through Carahsoft’s NASPO ValuePoint Master Agreement #AR2472 and OMNIA Partners Contract #R191902. To purchase, reach out to your preferred reseller or contact the Backblaze team. For more information about the NASPO ValuePoint Master Agreement, contact the Carahsoft team at [email protected].
More About Carahsoft
Carahsoft Technology Corp. is The Trusted Government IT Solutions Provider®, supporting public sector organizations across federal, state and local government agencies and education and healthcare markets. As the Master Government Aggregator® for our vendor partners, Carahsoft delivers solutions for multicloud, cybersecurity, DevSecOps, big data, artificial intelligence, open source, customer experience and engagement, and more.
When it comes to content creation, every second you can spend honing your craft counts. Which means things like disaster recovery planning are often overlooked—they’re tasks that easily get bumped to the bottom of every to-do list. Yet, the consequences of data loss or downtime can be huge, affecting everything from marketing strategy to viewer engagement.
For years, LTO tape has been a staple in disaster recovery (DR) plans for media teams that focus on everything from sports teams to broadcast news to TV and film production. Using an on-premises network attached storage (NAS) backed up to LTO tapes stored on-site, occasionally with a second copy off-site, is the de facto DR strategy for many. And while your off-site backup may be in a different physical location, more often than not, it’s the same city and still vulnerable to some of the same threats.
As in all areas of business, the key to a successful DR plan is preparation. Having a solid DR plan in place can be the difference between bouncing back swiftly or facing downtime. Today, I’ll lay out some of the challenges media teams face with disaster recovery and share some of the most cost-effective and time-efficient solutions.
Disaster Recovery Challenges
Let’s dive into some potential issues media teams face when it comes to disaster recovery.
Insufficient Resources
It’s easy to deprioritize disaster recovery when you’re facing budgetary constraints. You’re often faced with a trade-off: protect your data assets or invest in creating more. You might have limited NAS or LTO capacity, so you’re constantly evaluating what is worthy of protecting. Beyond cost, you might also be facing space limitations where investing in more infrastructure means not just shouldering the price of new tapes or drives, but also building out space to house them.
Simplicity vs. Comprehensive Coverage: Keeping Up With Scale
We’ve all heard the saying “keep it simple, stupid.” But sometimes you sacrifice adequate coverage for the sake of simplicity. Maybe you established a disaster recovery plan early on, but haven’t revisited it as your team scaled. Broadcasting and media management can quickly become complex, involving multiple departments, facilities, and stakeholders. If you haven’t revisited your plan, you may have gaps in your readiness to respond to threats.
As media teams grow and evolve, their disaster recovery needs may also change, meaning disaster recovery backups should be easy, automated, and geographically distanced.
The LTO Fallacy
No matter how well documented your processes may be, it’s inevitable that any process that requires a physical component is subject to human error. And managing LTO tapes is nothing if not a physical process. You’re manually inserting LTO tapes into an LTO deck to perform a backup. You’re then physically placing that tape and its replicas in the correct location in your library. These processes have a considerable margin of error; any deviation from an established procedure compromises the recovery process.
Additionally, LTO components—the decks and the tapes themselves—age like any other piece of equipment. And ensuring that all appropriate staff members are adequately trained and aware of any nuances of the LTO system becomes crucial in understanding the recovery process. Achieving consistent training across all levels of the organization and maintaining hardware can be challenging, leading to gaps in preparedness.
Embracing Cloud Readiness
As a media team faced with the challenges outlined above, you need solutions. Enter cloud readiness. Cloud-based storage offers unparalleled scalability, flexibility, and reliability, making it ideal for safeguarding media for teams large and small. By leveraging the power of the cloud, media teams can ensure seamless access to vital information from any location, at any time. Whether it’s raw footage, game footage, or final assets, cloud storage enables rapid recovery and minimal disruption in the event of a disaster.
Cloud Storage Considerations for Media Teams
Migrating to a cloud-based disaster recovery model requires careful planning and consideration. Here are some key factors for sports teams to keep in mind:
Data Security: Content security is becoming more and more of a top priority with many in the media space concerned about footage leakage and the growing monetization of archival content. Ensure your cloud provider employs robust security measures like encryption, and verify compliance with industry standards to maintain data privacy, especially if your media content involves sensitive or confidential information.
Cost Efficiency: Given the cost of NAS servers, LTO tapes, and external hard drives, scaling on-premises solutions indefinitely is not always the best solution. Extending your storage to the cloud makes scaling easy, but it’s not without its own set of considerations. Evaluate the cost structure of different cloud providers, considering factors like storage capacity, data transfer costs, and retention minimums.
Geospatial Redundancy: Driving LTO tapes to different locations or even shipping them to secure sites can become a logistical nightmare. When data is stored in the cloud, it not only can be accessed from anywhere but the replication of that data across geographic locations can be automated. Consider the geographical locations of the cloud servers to ensure optimal accessibility for your team, minimizing latency and providing a smooth user experience.
Interoperability: With data securely stored in the cloud it becomes instantly accessible to not only users but across different systems, platforms, and applications. This facilitates interoperability with applications like cloud media asset managers (MAMs) or cloud editing solutions and even simplifies media distribution. When choosing a cloud provider, consider APIs and third-party integrations that might enhance the functionality of your media production environment.
Testing and Training: Testing and training are paramount in disaster recovery to ensure a swift and effective response when crises strike. Rigorous testing identifies vulnerabilities, fine-tunes procedures, and validates recovery strategies. Simulated scenarios enable teams to practice and refine their roles, enhancing coordination and readiness. Regular training instills confidence and competence, reducing downtime during actual disasters. By prioritizing testing and training, your media team can bolster resilience, safeguard critical data, and increase the likelihood of a seamless recovery in the face of unforeseen disasters.
Cloud Backup in Action
For Trailblazer Studios, a leading media production company, satisfying internal and external backup requirements led to a complex and costly manual system of LTO tape and spinning disk drive redundancies. They utilized Backblaze’s cloud storage to streamline their data recovery processes and enhance their overall workflow efficiency.
Backblaze is our off-site production backup. The hope is that we never need to use it, but it gives us peace of mind.
—Kevin Shattuck, Systems Administrator, Trailblazer Studios
The Road Ahead
As media continues to embrace digital transformation, the need for robust disaster recovery solutions has never been greater. By transitioning away from on-premises solutions like LTO tape and embracing cloud readiness, organizations can future-proof their operations and ensure uninterrupted production. And, while cloud readiness creates a more secure foundation for disaster recovery, having data in the cloud creates a pathway into the future teams can take advantage of a wave of cloud tools designed to foster productivity and efficiency.
With the right strategy in place, media teams can turn potential disasters into mere setbacks, while taking advantage of their new cloud centric posterity maintaining their competitive edge.
It’s easy to open a data center, right? All you have to do is connect a bunch of hard drives to power and the internet, find a building, and you’re off to the races.
Well, not exactly. Building and using one Storage Pod is quite a bit different than managing exabytes of data. As the world has grown more connected, the demand for data centers has grown—and then along comes artificial intelligence (AI), with processing and storage demands that amp up the need even more.
That, of course, has real-world impacts, and we’re here to chat about why. Today we’re going to talk about power, one of the single biggest costs to running a data center, how it has impacts far beyond a simple utility bill, and what role temperature plays in things.
How Much Power Does a Data Center Use?
There’s no “normal” when it comes to the total amount of power a data center will need, as data centers vary in size. Here are a few figures that can help us get us on the same page about scale:
The largest data center market in the world is in Northern Virginia in the United States and it has a 2,552 megawatt capacity. (By the way: 1MW = 1 million watts. For context, one megawatt is enough energy to power about 200 American homes for a year.)
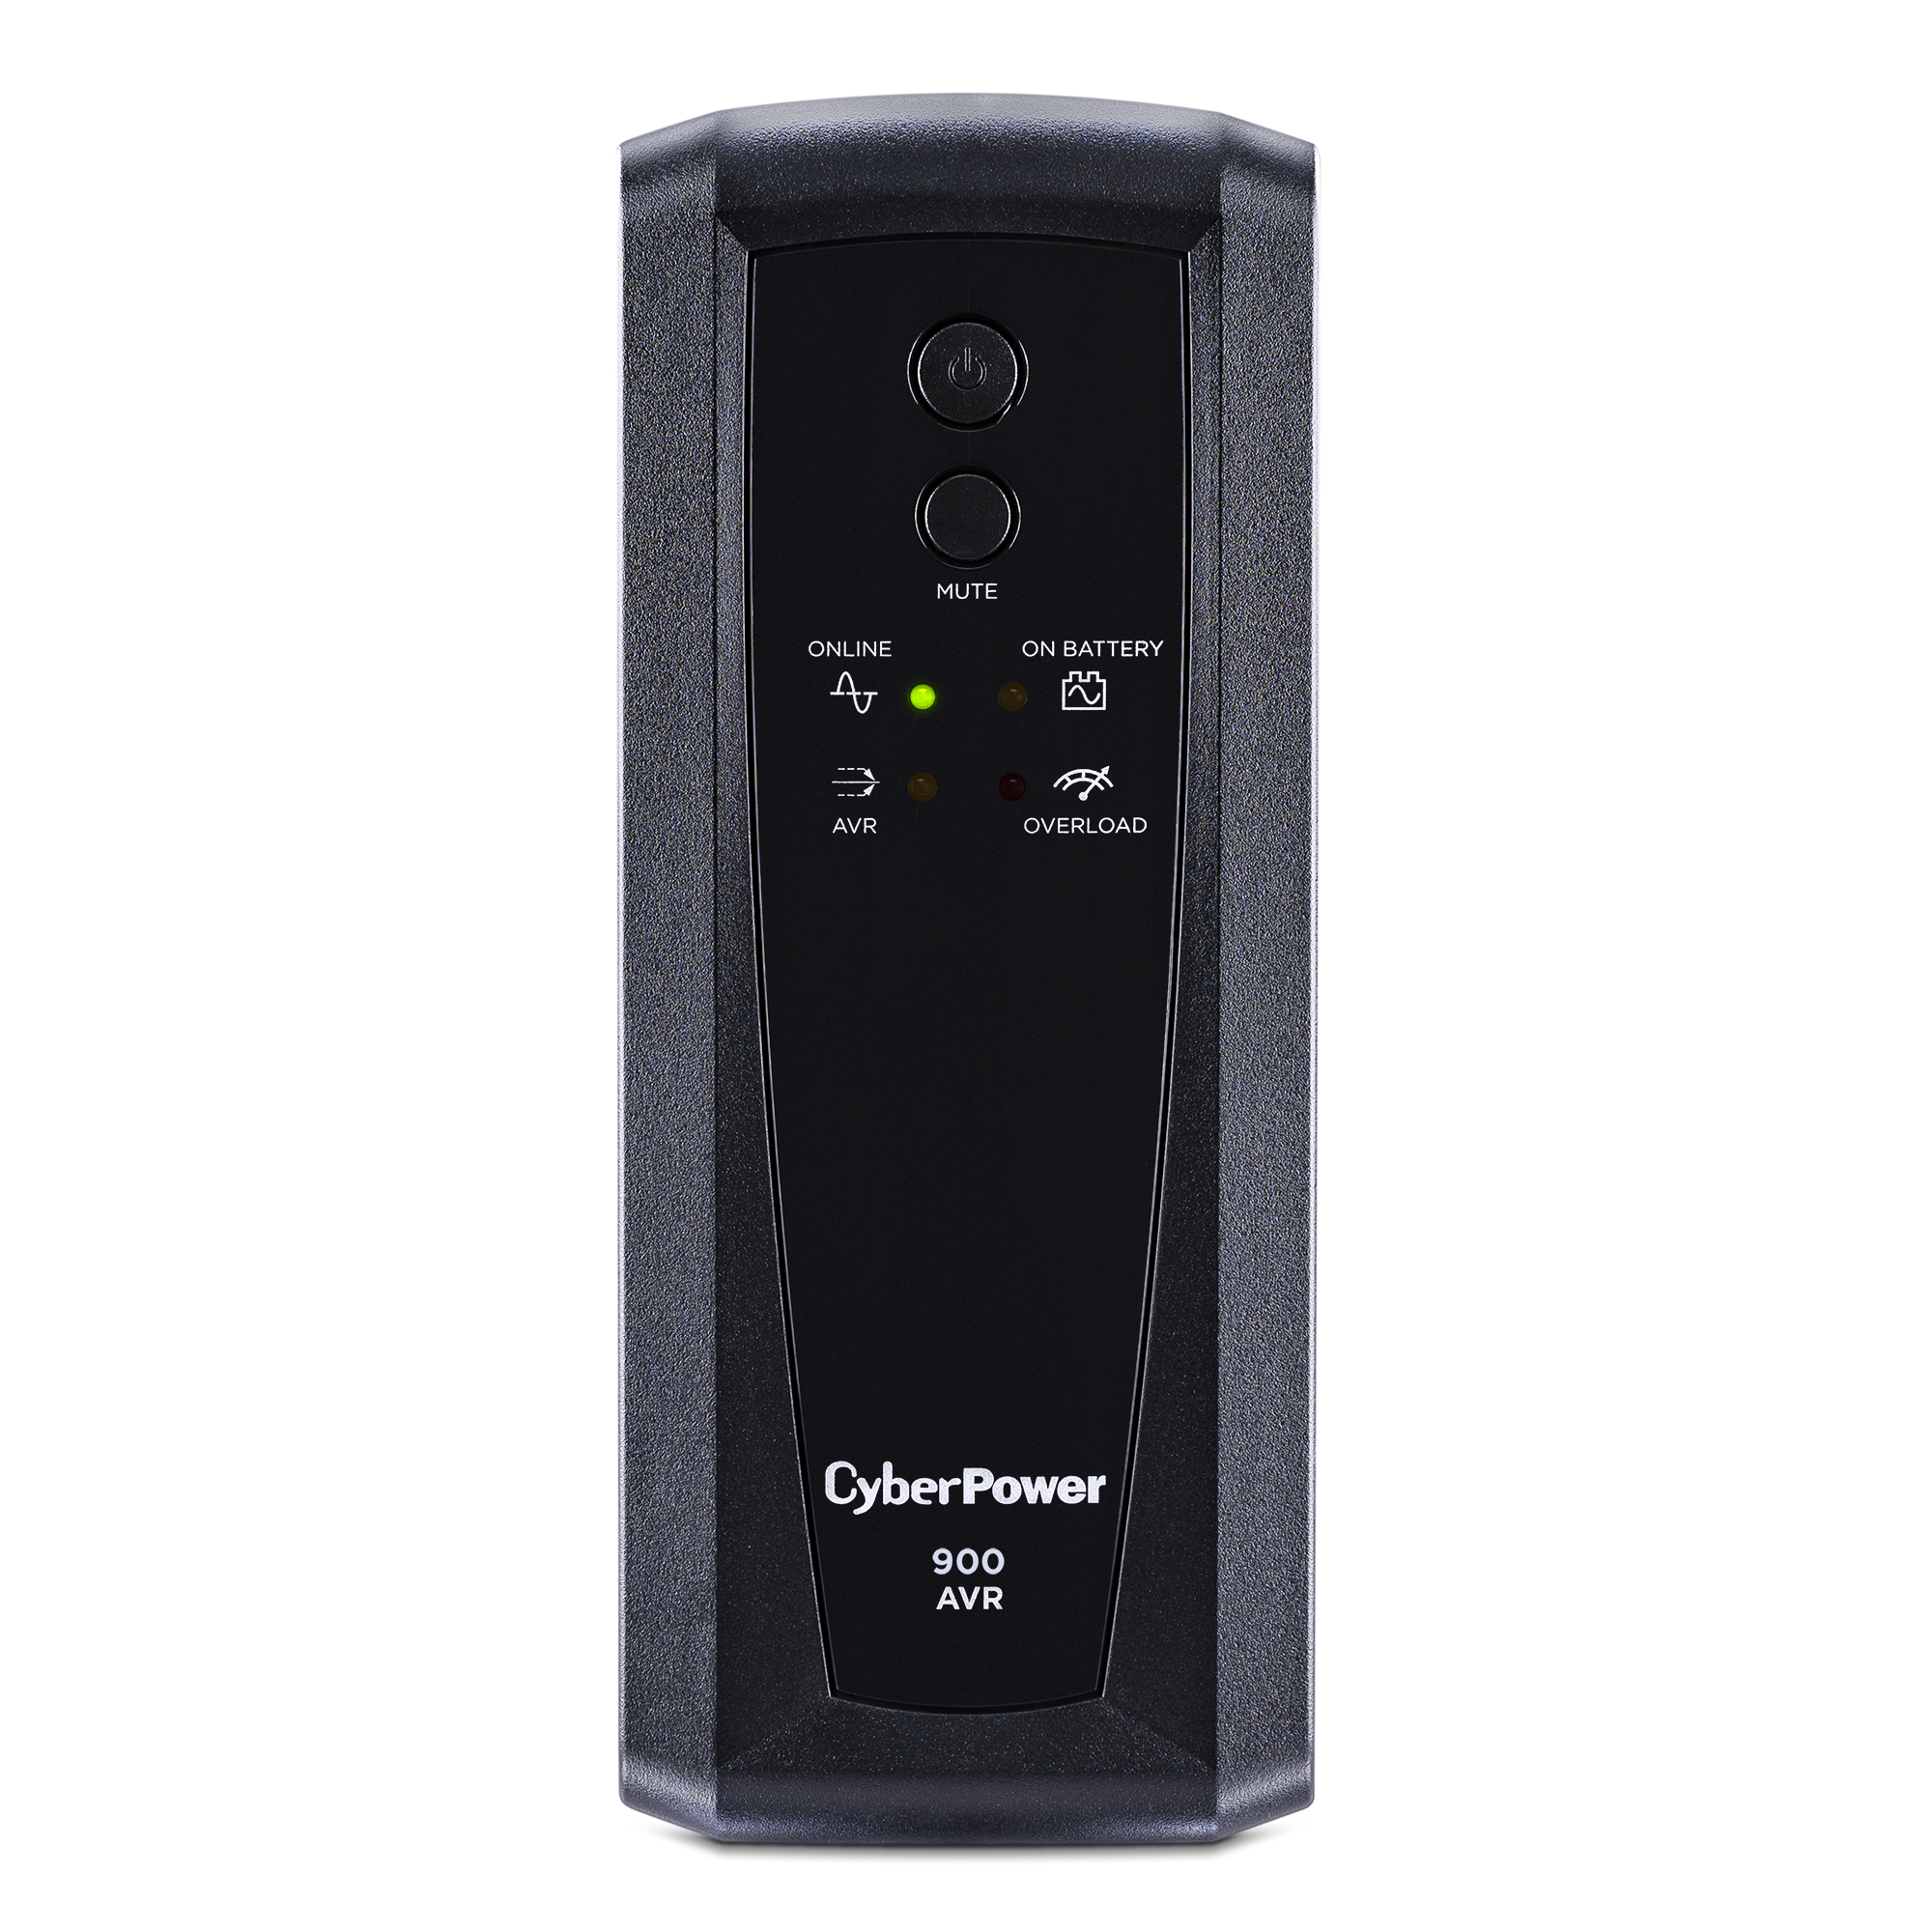
The goal of a data center is to be always online. That means that there are redundant systems of power—so, what comes in from the grid as well as generators and high-tech battery systems like uninterruptible power supplies (UPS)—running 24 hours a day to keep servers storing and processing data and connected to networks. In order to keep all that equipment running well, they need to stay in a healthy temperature (and humidity) range, which sounds much, much simpler than it is.
Measuring Power Usage
One of the most popular metrics for tracking power efficiency in data centers is power usage effectiveness (PUE), which is the ratio of the total amount of energy used by a data center to the energy delivered to computing equipment.
Note that this metric divides power usage into two main categories: what you spend keeping devices online (which we’ll call “IT load” for shorthand purposes), and “overhead”, which is largely comprised of the power dedicated to cooling your data center down.
There are valid criticisms of the metric, including that improvements to IT load will actually make your metric worse: You’re being more efficient about IT power, but your overhead stays the same—so less efficiency even though you’re using less power overall. Still, it gives companies a repeatable way to measure against themselves and others over time, including directly comparing seasons year to year, so it’s a widely adopted metric.
Calculating your IT load is a relatively predictable number. Manufacturers tell you the wattage of your device (or you can calculate it based on your device’s specs), then you take that number and plan for it being always online. The sum of all your devices running 24 hours a day is your IT power spend.
Any time you’re using power, you’re creating heat. So the first thing you consider is always your IT load. You don’t want your servers overtaxed—most folks agree that you want to run at about 80% of capacity to keep things kosher—but you also don’t want to have a bunch of servers sitting around idle when you return to off-peak usage. Even at rest, they’re still consuming power.
So, the methodology around temperature mitigation always starts at power reduction—which means that growth, IT efficiencies, right-sizing for your capacity, and even device provisioning are an inextricable part of the conversation. And, you create more heat when you’re asking an electrical component to work harder—so, more processing for things like AI tasks means more power and more heat.
And, there are a number of other things that can compound or create heat: the types of drives or processors in the servers, the layout of the servers within the data center, people, lights, and the ambient temperature just on the other side of the data center walls.
Brief reminder that servers look like this:
Only most of them aren’t as beautifully red as ours.
When you’re building a server, fundamentally what you’re doing is shoving a bunch of electrical components in a box. Yes, there are design choices about those boxes that help mitigate temperature, but just like a smaller room heating up more quickly than a warehouse, you are containing and concentrating a heat source.
We humans generate heat and need lights to see, so the folks who work in data centers have to be taken into account when considering the overall temperature of the data center. Check out these formulas or this nifty calculator for rough numbers (with the caveat that you should always consult an expert and monitor your systems when you’re talking about real data centers):
Heat produced by people = maximum number of people in the facility at one time x 100
Heat output of lighting = 2.0 x floor area in square feet or 21.53 x floor area in square meters
Also, your data center exists in the real world, and we haven’t (yet) learned to control the weather—so you also have to factor in fighting the external temperature when you’re bringing things back to ideal conditions. That’s led to a movement towards building data centers in new locations. It’s important to note that there are other reasons you might not want to move, however, including network infrastructure.
Accounting for people and the real world also means that there will be peak usage times, which is to say that even in a global economy, there are times when more people are asking to use their data (and their dryers, so if you’re reliant on a consumer power grid, you’ll also see the price of power spike). Aside from the cost, more people using their data = more processing = more power.
How Is Temperature Mitigated in Data Centers?
Cooling down your data center with fans, air conditioners, and water also uses power (and generates heat). Different methods of cooling use different amounts of power—water cooling in server doors vs. traditional high-capacity air conditioners, for example.
Talking about real numbers here gets a bit tricky. Data centers aren’t a standard size. As data centers get larger, the environment gets more complex, expanding the potential types of problems, while also increasing the net benefit of changes that might not have a visible impact in smaller data centers. It’s like any economy of scale: The field of “what is possible” is wider; rewards are bigger, and the relationship between change vs. impact is not linear. Studies have shown that creating larger data centers creates all sorts of benefits (which is an article in and of itself), and one of those specific benefits is greater power efficiency.
Most folks talk about the impact of different cooling technologies in a comparative way, i.e., we saw a 30% reduction in heat. And, many of the methods of mitigating temperature are about preventing the need to use power in the first place. For that reason, it’s arguably more useful to think about the total power usage of the system. In that context, it’s useful to know that a single fan takes x amount of power and produces x amount of heat, but it’s more useful to think of them in relation to the net change on the overall temperature bottom line. With that in mind, let’s talk about some tactics data centers use to reduce temperature.
Customizing and Monitoring the Facility
One of the best ways to keep temperature regulated in your data center is to never let it get hotter than it needs to be in the first place, and every choice you make contributes to that overall total. For example, when you’re talking about adding or removing servers from your pool, that reduces your IT power consumption and affects temperature.
There are a whole host of things that come down to data centers being a purpose-built space, and most of them have to do with ensuring healthy airflow based on the system you’ve designed to move hot air out and cold air in.
No matter what tactics you’re using, monitoring your data center environment is essential to keeping your system healthy. Some devices in your environment will come with internal indicators, like SMART stats on drives, and, of course, folks also set up sensors that connect to a central monitoring system. Even if you’ve designed a “perfect” system in theory, things change over time, whether you’re accounting for adding new capacity or just dealing with good old entropy.
Here’s a non-inclusive list of some of ways data centers customize their environments:
Raised Floors: This allows airflow or liquid cooling under the server rack in addition to the top, bottom, and sides.
Containment, or Hot and Cold Rows: The strategy here is to keep the hot side of your servers facing each other and the cold parts facing outward. That means that you can create a cyclical air flow with the exhaust strategically pulling hot air out of hot space, cooling it, then pushing the cold air over the servers.
Calibrated Vector Cooling: Basically, concentrated active cooling measures in areas you know are going to be hotter. This allows you to use fewer resources by cooling at the source of the heat instead of generally cooling the room.
Cable Management: Keeping cords organized isn’t just pretty, it also makes sure you’re not restricting airflow.
Blanking Panels: This is a fancy way of saying that you should plug up the holes between devices.
Why not both? Most data centers end up using a combination of air and water based cooling at different points in the overall environment. And, other liquids have led to some very exciting innovations. Let’s go into a bit more detail.
Air-Based Cooling
Air based cooling is all about understanding air flow and using that knowledge to extract hot air and move cold air over your servers.
Air-based cooling is good up to a certain temperature threshold—about 20 kilowatts (kW) per rack. Newer hardware can easily reach 30kw or higher, and high processing workloads can take that even higher. That said, air-based cooling has benefitted by becoming more targeted, and people talk about building strategies based on room, row, or rack.
From here, it’s actually a pretty easy jump into water-based cooling. Water and other liquids are much better at transferring heat than air, about 50 to 1,000 times more, depending on the liquid you’re talking about. And, lots of traditional “air” cooling methods run warm air through a compressor (like in an air conditioner), which stores cold water and cools off the air, recirculating it into the data center. So, one fairly direct combination of this is the evaporative cooling tower:
Obviously water and electricity don’t naturally blend well, and one of the main concerns of using this method is leakage. Over time, folks have come up with some good, safe methods, designed around effectively containing the liquid. This increases the up-front cost, but has big payoffs for temperature mitigation. You find this methodology in rear door heat exchangers, which create a heat exchanger in—you guessed it—the rear door of a server, and direct-to-chip cooling, which contains the liquid into a plate, then embeds that plate directly in the hardware component.
So, we’ve got a piece of hardware, a server rack—the next step is the full data center turning itself into a heat exchange, and that’s when you get Nautilus—a data center built over a body of water.
(Other) Liquid-Based Cooling, or Immersion Cooling
With the same sort of daring thought process of the people who said, “I bet we can fly if we jump off this cliff with some wings,” somewhere along the way, someone said, “It would cool down a lot faster if we just dunked it in liquid.” Liquid-based cooling utilizes dielectric liquids, which can safely come in contact with electrical components. Single phase immersion uses fluids that don’t boil or undergo a phase change (think: similar to an oil), while two phase immersion uses liquids that boil at low temperatures, which releases heat by converting to a gas.
You’ll see components being cooled this way either in enclosed chassis, which can be used in rack-style environments, in open baths, which require specialized equipment, or a hybrid approach.
How Necessary Is This?
Let’s bring it back: we’re talking about all those technologies efficiently removing heat from a system because hotter environments break devices, which leads to downtime. And, we want to use efficient methods to remove heat because it means we can ask our devices to work harder without having to spend electricity to do it.
Recently, folks have started to question exactly how cool data centers need to be. Even allowing a few more degrees of tolerance can make a huge difference to how much time and money you spend on cooling. Whether it has longer term effects on the device performance is questionable—manufacturers are fairly opaque about data around how these standards are set, though exceeding recommended temperatures can have other impacts, like voiding device warranties.
Power, Infrastructure, Growth, and Sustainability
But the simple question of “Is it necessary?” is definitely answered “yes,” because power isn’t infinite. And, all this matters because improving power usage has a direct impact on both cost and long-term sustainability. According to a recent MIT article, the data centers now have a greater carbon footprint than the airline industry, and a single data center can consume the same amount of energy as 50,000 homes.
Let’s contextualize that last number, because it’s a tad controversial. The MIT research paper in question was published in 2022, and that last number is cited from “A Prehistory of the Cloud” by Tung-Hui Hu, published in 2006. Beyond just the sheer growth in the industry since 2006, data centers are notoriously reticent about publishing specific numbers when it comes to these metrics—Google didn’t release numbers until 2011, and they were founded in 1998.
Based on our 1MW = 200 homes metric the number from the MIT article number represents 250MW. One of the largest data centers in the world has a 650MW capacity. So, while you can take that MIT number with a grain of salt, you should also pay attention to market reports like this one—the aggregate numbers clearly show that power availability and consumption is one of the biggest concerns for future growth.
So, we have less-than-ideal reporting and numbers, and well-understood environmental impacts of creating electricity, and that brings us to the complicated relationship between the two factors. Costs of power have gone up significantly, and are fairly volatile when you’re talking about non-renewable energy sources. International agencies report that renewable energy sources are now the cheapest form of energy worldwide, but the challenge is integrating renewables into existing grids. While the U.S. power grid is reliable (and the U.S. accounts for half of the world’s hyperscale data center capacity), the Energy Department recently announced that the network of transmission lines may need to expand by more than two-thirds to carry that data nationwide—and invested $1.3 billion to make that happen.
What’s Next?
It’s easy to say, “It’s important that data centers stay online,” as we sort of glossed over above, but the true importance becomes clear when you consider what that data does—it keeps planes in the air, hospitals online, and so many other vital functions. Downtime is not an option, which leads us full circle to our introduction.
We (that is, we, humans) are only going to build more data centers. Incremental savings in power have high impact—just take a look at Google’s demand response initiative, which “shift[s] compute tasks and their associated energy consumption to the times and places where carbon-free energy is available on the grid.”
Which is all to say: this is an exciting time for innovation in the cloud, and many of the opportunities are happening below the surface, so to speak. Understanding how the fundamental principles of physics and compute work—now more than ever—is a great place to start thinking about what the future holds and how it will impact our world, technologically, environmentally, and otherwise. And, data centers sit at the center of that “hot” debate.
We all have things we want to protect, and if you’re responsible for physically or virtually protecting a business from all types of threats, you probably have some kind of system in place to monitor your physical space. If you’ve ever dealt with video surveillance footage, you know managing it can be a monumental task. Ensuring the safety and security of monitored spaces relies on collecting, storing, and analyzing large amounts of data from cameras, sensors, and other devices. The requirements to back up and retain footage to support investigations are only getting more stringent. Anyone dealing with surveillance data, whether in business or security, needs to ensure that surveillance data is not only backed up, but also protected and accessible.
The Importance of Backing Up Video Surveillance Footage
Backup storage plays a critical part in maintaining the security of video surveillance footage. Here’s why it’s so important:
Risk Reduction: Without backup storage, surveillance system data stored on a single hard drive or storage device is susceptible to crashes, corruption, or theft. Having a redundant copy ensures that critical footage is not lost in case of system failures or data corruption.
Fast Recovery: Video surveillance systems rely on continuous recording to monitor and record all activities. In the event of system failures, backup storage enables swift recovery, minimizing downtime and ensuring uninterrupted surveillance.
Compliance and Legal Requirements: Many industries, including security, have legal obligations to retain surveillance footage for a specified duration. Backup storage ensures compliance with these requirements and provides evidence when needed.
Verification and Recall: Backup recordings allow you to verify actions, recall events, and keep track of activities. Having access to historical footage is valuable for potential investigations and future decision making.
Each piece of information about video surveillance requirements will affect how much space your video files take up and, consequently, your storage requirements. Let’s walk through each of these general requirements so you don’t end up underestimating how much backup storage you’ll need.
Video Surveillance Storage Considerations
When you’re implementing a backup strategy for video surveillance, there are several factors that can impact your choices. The number and resolution of cameras, frame rates, retention periods, and more can influence how you design your backup storage system. Consider the following factors when thinking about how much storage you’ll need for your video surveillance footage:
Placement and Coverage: When it comes to video surveillance camera placement, strategic positioning is crucial for optimal security and regulatory compliance. Consider ground floor doors and windows, main stairs or hallways, common areas, and driveways. Install cameras both inside and outside entry points. Generally, the wider the field of view, the fewer cameras you’ll likely need overall. The FBI provides extensive recommendations for setting up your surveillance system properly.
Resolution: The resolution determines the clarity of the video footage, which is measured in the number of pixels (px). A higher resolution means more pixels and a sharper image. While there’s no universal minimum for admissible surveillance footage, a resolution of 480 x 640 px is recommended. However, mandated minimums can differ based on local regulations and specific use cases. Note that some regulations may not provide a minimum resolution requirement, and some minimum requirements may not meet the intended purpose of surveillance. Often, it’s better to go with a camera that can record at a higher resolution than the mandated minimum.
Frame Rate: All videos are made up of individual frames. A higher frame rate—measured in frames per second (FPS)—means a smoother, less clunky image. This is because there are more frames being packed into each second. Like your cameras’ resolution, there are no universal requirements specified by regulations. However, it’s better to go with a camera that can record at a higher FPS so that you have more images to choose from if there’s ever an open investigation.
Recording Length: Surveillance cameras are required to run all day, every day, which requires a lot of storage. To help reduce the instance of storing videos that aren’t of interest, some cameras can come with artificial intelligence (AI) tools that will only record footage when it identifies something of interest, such as movement or a vehicle. But if you’re protecting a business with heavy activity, this use of AI may be moot.
Retention Length: Video surveillance retention requirements can vary significantly based on local, state, and federal regulations. These laws dictate how long companies must store their video surveillance footage. For example, medical marijuana dispensaries in Ohio require 24/7 security video to be retained for a minimum of six months, and the footage must be made available to the licensing board upon request. The required length can be prolonged even further if a piece of footage is required for an ongoing investigation. Additionally, backing up your video footage (i.e., saving a copy of it in another area) is different from archiving it for long-term use. You’ll want to be sure that you select a storage system that helps you meet those requirements—more on that later.
Each point on this list affects how much storage capacity you need. More cameras mean more footage being generated, which means more video files. Additionally, a higher resolution and frame rate mean larger file sizes. Multiply this by the round-the-clock operation of surveillance cameras and the required retention length, and you’ll likely have more video data than you know what to do with.
Scoping Video Surveillance Storage: An Example
To illustrate how much footage you can expect to collect, it can be helpful to see an example of how a given business’s video surveillance may operate. Note that this example may not apply to you specifically. You should review your local area’s regulations and consult with an industry professional to make sure you are compliant.
Let’s say that you need to install surveillance cameras for a bank. Customers enter through the lobby and wait for the next available bank teller to assist them at a teller station. No items are put on display, only the exchange of paper and cash between the teller and the customer. Only authorized employees are allowed within the teller area. After customers complete their transactions, they walk back through the lobby area and exit via the building’s front entry.
As an estimate, let’s say you need at least 10 cameras around your building: one for the entrance; another for the lobby; eight more to cover the general back area, including the door to the teller terminals, the teller terminals themselves, the door to the safe, and inside of the safe; and, of course, one for the room where the surveillance equipment is housed. You may need more than 10 to cover the exterior of your building plus your ATM and drive through banking, but for the sake of an example, we’ll leave it at 10.
Now, suppose all your cameras record at 1080p resolution (1920 x 1080 px), 15 FPS, and a color depth of 14 bits (basically, how many colors the camera captures). For one 24 hour recording on one camera, you’re looking at 4.703 terabytes (TB). Over 30 days of storage, this can grow to 141.1TB. In other words, if the average person today needs a 2TB hard disk for their PC, it will take more than 70 PCs to hold all the information from just one camera.
How Cloud Storage Can Help Back Up Surveillance Footage
Backing up surveillance footage is essential for ensuring data security and accountability. It provides a reliable record of events, aids in investigations, and helps prevent wrongdoing by acting as a deterrent. But the right backup strategy is key to preserving your footage.
The 3-2-1 backup strategy is an accepted foundational structure that recommends keeping three copies of all important data (one primary copy and two backup copies) on two different media types (to diversify risk) and storing at least one copy off-site. With surveillance data utilizing high-capacity data storage systems, adhering to the 3-2-1 rule is important in order to access footage in case of an investigation. The 3-2-1 rule mitigates single points of failure, enhances data availability, and protects against corruption. By adhering to this rule, you increase the resilience of your surveillance footage, making it easier to recover even in unexpected events or disasters.
Having an on-site backup copy is a great start for the 3-2-1 backup strategy, but having an off-site backup is a key component in having a complete backup strategy. Having a backup copy in the cloud provides an easy to maintain, reliable off-site copy, safeguarding against a host of potential data losses including:
Natural Disasters: If your business is harmed by a natural disaster, the devices you use for your primary storage or on-site backup may be damaged, resulting in a loss of data.
Tampering and Theft: Even if someone doesn’t try to steal or manipulate your surveillance footage, an employee can still move, change, or delete files accidentally. You’ll need to safeguard footage with propersecurity protocols, such as authorization codes, data immutability, and encryption keys. These protocols may require constant, professional, and IT administration and maintenance that are often automatically built into the cloud.
Lack of Backup and Archive Protocols: Unless your primary storage source uses specialized software to automatically save copies of your footage or move them to long-term storage, any of your data may be lost.
The cloud has transformed backup strategies and made it easy to ensure the integrity of large data sets, like surveillance footage. Here’s how the cloud helps achieve the 3-2-1 back strategy affordably:
Scalability: With the cloud, your backup storage space is no longer limited to what servers you can afford. The cloud provider will continue to build and deploy new servers to keep up with customer demand, meaning you can simply rent out the storage space and pay for more as needed.
Reliability: Most cloud providers share information on their durability and reliability and are heavily invested in building systems and processes to mitigate the impact of failures. Their systems are built to be fault-tolerant.
Security: Cloud providers protect data you store with them with enterprise-grade security measures and offer features like access controls and encryption to allow users the ability to better protect their data.
Affordability: Cloud storage helps you use your storage budgets effectively by not paying to provision and maintain physical off-site backup locations yourself.
Disaster Recovery: If unexpected disasters occur, such as natural disasters, theft, or hardware failure, you’ll know exactly where your data lives in the cloud and how to restore it so you can get back up and running quickly.
Compliance: By adhering to a set of standards and regulations cloud solutions meet compliance requirements to ensure data stored and managed in the cloud is protected and used responsibly.
Protect The Footage You Invested In to Protect Yourself
No matter the size, operation, or location of your business, it’s critical to remain compliant with all industry laws and regulations—especially when it comes to surveillance. Protect your business by partnering with a cloud provider that understands your unique business requirements, offering scalable, reliable, and secure services at a fraction of the cost compared with other platforms.
As a leading specialized cloud provider, Backblaze B2 Cloud Storage can secure your surveillance footage for both primary backup and long-term protection. B2 offers a range of security options—from encryption to Object Lock to Cloud Replication and access management controls—to help you protect your data and achieve industry compliance.Learn more about Backblaze B2 for surveillance data or contact our Sales Team today.
In today’s bandwidth-intensive world, latency is an important factor that can impact performance and the end-user experience for modern cloud-based applications. For many CTOs, architects, and decision-makers at growing small and medium sized businesses (SMBs), understanding and reducing latency is not just a technical need but also a strategic play.
Latency, or the time it takes for data to travel from one point to another, affects everything from how snappy or responsive your application may feel to content delivery speeds to media streaming. As infrastructure increasingly relies on cloud object storage to manage terabytes or even petabytes of data, optimizing latency can be the difference between success and failure.
Let’s get into the nuances of latency and its impact on cloud storage performance.
Upload vs. Download Latency: What’s the Difference?
In the world of cloud storage, you’ll typically encounter two forms of latency: upload latency and download latency. Each can impact the responsiveness and efficiency of your cloud-based application.
Upload Latency
Upload latency refers to the delay when data is sent from a client or user’s device to the cloud. Live streaming applications, backup solutions, or any application that relies heavily on real-time data uploading will experience hiccups if upload latency is high, leading to buffering delays or momentary stream interruptions.
Download Latency
Download latency, on the other hand, is the delay when retrieving data from the cloud to the client or end user’s device. Download latency is particularly relevant for content delivery applications, such as on demand video streaming platforms, e-commerce, or other web-based applications. Reducing download latency, creating a snappy web experience, and ensuring content is swiftly delivered to the end user will make for a more favorable user experience.
Ideally, you’ll want to optimize for latency in both directions, but, depending on your use case and the type of application you are building, it’s important to understand the nuances of upload and download latency and their impact on your end users.
Decoding Cloud Latency: Key Factors and Their Impact
When it comes to cloud storage, how good or bad the latency is can be influenced by a number of factors, each having an impact on the overall performance of your application. Let’s explore a few of these key factors.
Network Congestion
Like traffic on a freeway, packets of data can experience congestion on the internet. This can lead to slower data transmission speeds, especially during peak hours, leading to a laggy experience. Internet connection quality and the capacity of networks can also contribute to this congestion.
Geographical Distance
Often overlooked, the physical distance from the client or end user’s device to the cloud origin store can have an impact on latency. The farther the distance from the client to the server, the farther the data has to traverse and the longer it takes for transmission to complete, leading to higher latency.
Infrastructure Components
The quality of infrastructure, including routers, switches, and cables, may affect network performance and latency numbers. Modern hardware, such as fiber-optic cables, can reduce latency, unlike outdated systems that don’t meet current demands. Often, you don’t have full control over all of these infrastructure elements, but awareness of potential bottlenecks may be helpful, guiding upgrades wherever possible.
Technical Processes
TCP/IP Handshake: Connecting a client and a server involves a handshake process, which may introduce a delay, especially if it’s a new connection.
DNS Resolution: Latency can be increased by the time it takes to resolve a domain name to its IP address. There is a small reduction in total latency with faster DNS resolution times.
Data routing: Data does not necessarily travel a straight line from its source to its destination. Latency can be influenced by the effectiveness of routing algorithms and the number of hops that data must make.
Reduced latency and improved application performance are important for businesses that rely on frequently accessing data stored in cloud storage. This may include selecting providers with strategically positioned data centers, fine-tuning network configurations, and understanding how internet infrastructure affects the latency of their applications.
Minimizing Latency With Content Delivery Networks (CDNs)
Further reducing latency in your application may be achieved by layering a content delivery network (CDN) in front of your origin storage. CDNs help reduce the time it takes for content to reach the end user by caching data in distributed servers that store content across multiple geographic locations. When your end-user requests or downloads content, the CDN delivers it from the nearest server, minimizing the distance the data has to travel, which significantly reduces latency.
Backblaze B2 Cloud Storage integrates with multiple CDN solutions, including Fastly, Bunny.net, and Cloudflare, providing a performance advantage. And, Backblaze offers the additional benefit of free egress between where the data is stored and the CDN’s edge servers. This not only reduces latency, but also optimizes bandwidth usage, making it cost effective for businesses building bandwidth intensive applications such as on demand media streaming.
To get slightly into the technical weeds, CDNs essentially cache content at the edge of the network, meaning that once content is stored on a CDN server, subsequent requests do not need to go back to the origin server to request data.
This reduces the load on the origin server and reduces the time needed to deliver the content to the user. For companies using cloud storage, integrating CDNs into their infrastructure is an effective configuration to improve the global availability of content, making it an important aspect of cloud storage and application performance optimization.
Case Study: Musify Improves Latency and Reduces Cloud Bill by 70%
To illustrate the impact of reduced latency on performance, consider the example of music streaming platform Musify. By moving from Amazon S3 to Backblaze B2 and leveraging the partnership with Cloudflare, Musify significantly improved its service offering. Musify egresses about 1PB of data per month, which, under traditional cloud storage pricing models, can lead to significant costs. Because Backblaze and Cloudflare are both members of the Bandwidth Alliance, Musify now has no data transfer costs, contributing to an estimated 70% reduction in cloud spend. And, thanks to the high cache hit ratio, 90% of the transfer takes place in the CDN layer, which helps maintain high performance, regardless of the location of the file or the user.
Latency Wrap Up
As we wrap up our look at the role latency plays in cloud-based applications, it’s clear that understanding and strategically reducing latency is a necessary approach for CTOs, architects, and decision-makers building many of the modern applications we all use today. There are several factors that impact upload and download latency, and it’s important to understand the nuances to effectively improve performance.
Additionally, Backblaze B2’s integrations with CDNs like Fastly, bunny.net, and Cloudflare offer a cost-effective way to improve performance and reduce latency. The strategic decisions Musify made demonstrate how reducing latency with a CDN can significantly improve content delivery while saving on egress costs, and reducing overall business OpEx.
For additional information and guidance on reducing latency, improving TTFB numbers and overall performance, the insights shared in “Cloud Performance and When It Matters” offer a deeper, technical look.
If you’re keen to explore further into how an object storage platform may support your needs and help scale your bandwidth-intensive applications, read more about Backblaze B2 Cloud Storage.
Cloud drives like Google Drive, Dropbox, Box, and OneDrive have become the go-to data management solution for countless individuals and organizations. Their appeal lies in the initial free storage offering, user-friendly interface, robust file-sharing, and collaboration tools, making it easier to access files from anywhere with an internet connection.
However, recent developments in the cloud drives space have posed significant challenges for businesses and organizations. Both Google and Microsoft, leading providers in this space, have announced the discontinuation of their unlimited storage plans.
Additionally, it’s essential to note that cloud drives, which are primarily sync services, do not offer comprehensive data protection. Today, we’re exploring how organizations can recognize the limitations of cloud drives and strategize accordingly to safeguard their data without breaking the bank.
Attention Higher Ed
Higher education institutions have embraced platforms like Google Drive, Dropbox, Box, and OneDrive to store vast amounts of data—sometimes reaching into the petabytes. With unlimited plans out the window, they now face the dilemma of either finding alternative storage solutions or deleting data to avoid steep fees. In fact, the education sector reported the highest rates of ransomware attacks with 80% of secondary education providers and 79% of higher education providers hit by ransomware in 2023. If you manage IT for a
Sync vs. Backup: Why Cloud Drives Fall Short on Full Data Security
Cloud Sync
Cloud drives offer users an easy way to store and protect files online, and it might seem like these services back up your data. But, they don’t. These services sync (short for “synchronize”) files or folders on your computer to your other devices running the same application, ensuring that the same and most up-to-date information is merged across each device.
The “live update” feature of cloud drives is a double-edged sword. On one hand, it ensures you’re always working on the latest version of a document. On the other, if you need to go back to a specific version of a file from two weeks ago, you might be out of luck unless you’ve manually saved that version elsewhere.
Another important item to note is that if cloud drives are shared with others, often they can make changes to the content which can result in the data changing or being deleted and without notifying other users. With the complexity of larger organizations, this presents a potential vulnerability, even with well-meaning users and proactive management of drive permissions.
Cloud Backup
Unlike cloud sync tools, backup solutions are all about historical data preservation. They utilize block-level backup technology, which offers granular protection of your data. After an initial full backup, these systems only save the incremental changes that occur in the dataset. This means if you need to recover a file (or an entire system) as it existed at a specific point in time, you can do so with precision. This approach is not only more efficient in terms of storage space but also crucial for data recovery scenarios.
For organizations where data grows exponentially but is also critically important and sensitive, the difference between sync and backup is a crucial divide between being vulnerable and being secure. While cloud drives offer ease of access and collaboration, they fall short in providing the comprehensive data protection that comes from true backup solutions, highlighting the need to identify the gap and choose a solution that better fits your data storage and security goals. A full-scale backup solution will typically include backup software like Veeam, Commvault, and Rubrik, and a storage destination for that data. The backup software allows you to configure the frequency and types of backups, and the backup data is then stored on-premises and/or off-premises. Ideally, at least one copy is stored in the cloud, like Backblaze B2, to provide true off-site, geographically distanced protection.
Lack of Protection Against Ransomware
Ransomware payments hit a record high $1 billion in 2023. It shouldn’t be news to anyone in IT that you need to defend against the evolving threat of ransomware with immutable backups now more than ever. However, cloud drives fall short when it comes to protecting against ransomware.
The Absence of Object Lock
Object Lock serves as a digital vault, making data immutable for a specified period. It creates a virtual air gap, protecting data from modification, manipulation, or deletion, effectively shielding it from ransomware attacks that seek to encrypt files for ransom. Unfortunately, most cloud drives do not incorporate this technology.
Without Object Lock, if a piece of data or a document becomes infected with ransomware before it’s uploaded to the cloud, the version saved on a cloud drive can be compromised as well. This replication of infected files across the cloud environment can escalate a localized ransomware attack into a widespread data disaster.
Other Security Shortcomings
Beyond the absence of Object Lock, cloud drives may also lag in other critical security measures. While many offer some level of encryption, the robustness of this encryption and its effectiveness in protecting data at reset and in transit can vary significantly. Additionally, the implementation of 2FA and other access control measures is not always standard. These gaps in security protocols can leave the door open for unauthorized access and data breaches.
Navigating the Shared Responsibility Model
The shared responsibility model of cloud computing outlines who is responsible for what when it comes to cloud security. However, this model often leads to a sense of false security. Under this model, cloud drives typically take responsibility for the security “of” the cloud, including the infrastructure that runs all of the services offered in the cloud. On the other hand, the customers are responsible for security “in” the cloud. This means customers must manage the security of their own data.
What’s the difference? Let’s use an example. If a user inadvertently uploads a ransomware-infected file to a cloud drive, the service might protect the integrity of the cloud infrastructure, ensuring the malware doesn’t spread to other users. However, the responsibility to prevent the upload of the infected file in the first place, and managing its consequences, falls directly on the user. In essence, while cloud drives provide a platform for storing your data, relying solely on them without understanding the nuances of the shared responsibility model could leave gaps in your data protection strategy.
It’s also important to understand that Google, Microsoft, and Dropbox may not back up your data as often as you’d like, in the format you need, or provide timely, accessible recovery options.
The Limitations of Cloud Drives in Computer Failures
Cloud drives, such as iCloud, Google Drive, Dropbox, and OneDrive, synchronize your files across multiple devices and the cloud, ensuring that the latest version of a file is accessible from anywhere. However, this synchronization does not equate to a full backup of your computer’s data. In the event of a computer failure, only the files you’ve chosen to sync would be recoverable. Other data stored on the computer (but not in the sync folder) would be lost.
While some cloud drives offer versioning, which allows you to recover previous versions of files, this features are often limited in scope and time. It’s not designed to recover all types of files after a hardware failure, which a comprehensive backup solution would allow.
Additionally, users often have to select which folders of files are synchronized, potentially overlooking important data. This selective sync means that not all critical information is protected automatically, unlike with a backup solution that can be set to automatically back up all data.
The Challenges of Data Sprawl in Cloud Drives
Cloud drives make it easy to provision storage for a wide array of end users. From students and faculty in education institutions to teams in corporations, the ease with which users can start storing data is unparalleled. However, this convenience comes with its own set of challenges—and one of the most notable culprits is data sprawl.
Data sprawl refers to the rapid expansion and scattering of data without a cohesive management strategy. It is the accumulation of vast amounts of data to the point where organizations no longer know what data they have or what is happening with that data. Organizations often struggle to get a clear picture of who is storing what, how much space it’s taking up, and whether certain data remains accessed or has become redundant. This can lead to inefficient use of storage resources, increased costs, and potential security risks as outdated or unnecessary information piles up. The lack of sophisticated tools within cloud drive platforms for analyzing and understanding storage usage can significantly complicate data governance and compliance efforts.
The Economic Hurdles of Cloud Drive Pricing
The pricing structure of cloud drive solutions present a significant barrier to achieving both cost efficiency and operational flexibility. The sticker price is only the tip of the iceberg, especially for sprawling organizations like higher education institutions or large enterprises with unique challenges that make the standard pricing models of many cloud drive services less than ideal. Some of the main challenges are:
User-Based Pricing: Cloud drive platforms base their pricing on the number of users, an approach that quickly becomes problematic for large institutions and businesses. With staff and end user turnover, predicting the number of active users at any given time can be a challenge. This leads to overpaying for unused accounts or constantly adjusting pricing tiers to match the current headcount, both of which are administrative headaches.
The High Cost of Scaling: The initial promise of free storage tiers or low-cost entry points fades quickly as institutions hit their storage limits. Beyond these thresholds, prices can escalate dramatically, making budget planning a nightmare. This pricing model is particularly problematic for businesses where data is continually growing. As these data sets expand, the cost to store them grows exponentially, straining already tight budgets.
Limitations of Storage and Users: Most cloud drive platforms come with limits on storage capacity and a cap on the number of users. Upgrading to higher tier plans to accommodate more users or additional storage can be expensive. This often forces organizations into a cycle of constant renegotiation and plan adjustments.
We’re Partial to an Alternative: Backblaze
While cloud drives excel in collaboration and file sharing, they often fall short in delivering the comprehensive data security and backup that businesses and organizations need. However, you are not without options. Cloud storage platforms like Backblaze B2 Cloud Storage secure business and educational data and budgets with immutable, set-and-forget, off-site backups and archives at a fraction of the cost of legacy providers. And, with Universal Data Migration, you can move large amounts of data from cloud drives or any other source to B2 Cloud Storage at no cost to you.
For those who appreciate the user-friendly interfaces of services like Dropbox or Google Drive, Backblaze provides integrations that deliver comparable front-end experiences for ease of use without compromising on security. However, if your priority lies in securing data against threats like ransomware, you can integrate Backblaze B2 with popular backup tools including Veeam, Rubrik, and Commvault, for immutable, virtually air-gapped backups to defend against cyber threats. Backblaze also offers free egress for up to three times your data stored—or unlimited free egress between many of our compute or CDN partners—which means you don’t have to worry about the costs of downloading data from the cloud when necessary.
Beyond Cloud Drives: A Secure, Cost-Effective Approach to Data Storage
In summary, cloud drives offer robust file sharing and collaboration tools, yet businesses and organizations looking for a more secure, reliable, and cost-effective data storage solution have options. By recognizing the limitations of cloud drives and by leveraging the advanced capabilities of cloud backup services, organizations can not only safeguard their data against emerging threats but also ensure it remains accessible and within budget.
Folks, it’s an understatement to say that the explosion of AI has been a wild ride. And, like any new, high-impact technology, the market initially floods with new companies. The normal lifecycle, of course, is that money is invested, companies are built, and then there will be winners and losers as the market narrows. Exciting times.
That said, we thought it was a good time to take you back to the practical side of things. One of the most pressing questions these days is how businesses may want to use AI in their existing or future processes, what options exist, and which strategies and tools are likely to survive long term.
We can’t predict who will sink or swim in the AI race—we might be able to help folks predict drive failure, but the Backblaze Crystal Ball () is not on our roadmap—so let’s talk about what we know. Things will change over time, and some of the tools we’ve included on this list will likely go away. And, as we fully expect all of you to have strong opinions, let us know what you’re using, which tools we may have missed, and why we’re wrong in the comments section.
Tools Businesses Can Implement Today (and the Problems They Solve)
As AI has become more accessible, we’ve seen it touted as either standalone tools or incorporated into existing software. It’s probably easiest to think about them in terms of the problems they solve, so here is a non-inclusive list.
The Large Language Model (LLM) “Everything Bot”
LLMs are useful in generative AI tasks because they work largely on a model of association. They intake huge amounts of data, use that to learn associations between ideas and words, and then use those learnings to perform tasks like creating copy or natural language search. That makes them great for a generalized use case (an “everything bot”) but it’s important to note that it’s not the only—or best—model for all AI/ML tasks.
These generative AI models are designed to be talked to in whatever way suits the querier best, and are generally accessed via browser. That’s not to say that the models behind them aren’t being incorporated elsewhere in things like chat bots or search, but that they stand alone and can be identified easily.
ChatGPT
In many ways, ChatGPT is the tool that broke the dam. It’s a large language model (LLM) whose multi-faceted capabilities were easily apparent and translatable across both business and consumer markets. Never say it came from nowhere, however: OpenAI and Microsoft Azure have been in cahoots for years creating the tool that (ahem) broke the internet.
Google Gemini, née Google Bard
It’s undeniable that Google has been on the front lines of AI/ML for quite some time. Some experts even say that their networks are the best poised to build a sustainable AI architecture. So why is OpenAI’s ChatGPT the tool on everyone’s mind? Simply put, Google has had difficulty commercializing their AI product—until, that is, they announced Google Gemini, and folks took notice. Google Gemini represents a strong contender for the type of function that we all enjoy from ChatGPT, powered by all the infrastructure and research they’re already known for.
Machine Learning (ML)
ML tasks cover a wide range of possibilities. When you’re looking to build an algorithm yourself, however, you don’t have to start from ground zero. There are robust, open source communities that offer pre-trained models, community support, integration with cloud storage, access to large datasets, and more.
TensorFlow: TensorFlow was originally developed by Google for internal research and production. It supports various programming languages like C++, Python, and Java, and is designed to scale easily from research to development.
PyTorch: PyTorch, on the other hand, is built for rapid prototyping and experimentation, and is primarily built for Python. That makes the learning curve for most devs much shorter, and lots of folks will layer it with Keras for additional API support (without sacrificing the speed and lower-level control of PyTorch).
Given the amount of flexibility in having an open source library, you see all sorts of things being built. A photo management company might grab a facial recognition algorithm, for instance, or use another to help order the parameters and hyperparameters of the algorithm. Think of it like wanting to build a table, but making the hammer and nails instead of purchasing your own.
Building Products With AI
You may also want or need to invest more resources—maybe you want to add AI to your existing product. In that scenario, you might hire an AI consultant to help you design, build, and train the algorithm, buy processing power from CoreWeave or Google, and store your data on-premises or in cloud storage.
In reality, most companies will likely do a mix of things depending on how they operate and what they offer. The biggest thing I’m trying to get at by presenting these scenarios, however, is that most people likely won’t set up their own large scale infrastructure, instead relying on inference tools. And, there’s something of a distinction to be made between whether you’re using tools designed to create efficiencies in your business versus whether you’re creating or incorporating AI/ML into your products.
Data Analytics
Without being too contentions, data analytics is one of the most powerful applications of AI/ML. While we measly humans may still need to provide context to make sense of the identified patterns, computers are excellent at identifying them more quickly and accurately than we could ever dream. If you’re looking to crunch serious numbers, these two tools will come in handy.
Snowflake: Snowflake is a cloud-based data as a service (DaaS) company that specializes in data warehouses, data lakes, and data analytics. They provide a flexible, integration-friendly platform with options for both developing your own data tools or using built-out options. Loved by devs and business leaders alike, Snowflake is a powerhouse platform that supports big names and diverse customers such as AT&T, Netflix, Capital One, Canva, and Bumble.
Looker: Looker is a business intelligence (BI) platform powered by Google. It’s a good example of a platform that takes the core functionalities of a product we’re already used to and layering on AI to make them more powerful. So, while BI platforms have long had robust data management and visualization capabilities, they can now do things like use natural language search or get automated data insights.
Development and Security
It’s no secret that one of the biggest pain points in the world of tech is having enough developers and having enough high quality ones, at that. It’s pushed the tech industry to work internationally, driven the creation of coding schools that train folks within six months, and compelled people to come up with codeless or low-code platforms that users of different skill levels can use. This also makes it one of the prime opportunities for the assistance of AI.
GitHub Copilot: Even if you’re not in tech or working as a developer, you’ve likely heard of GitHub. Started in 2007 and officially launched in 2008, it’s a bit hard to imagine coding before it existed as the de facto center to find, share, and collaborate on code in a public forum. Now, they’re responsible for GitHub Copilot, which allows devs to generate code with a simple query. As with all generative tools, however, users should double check for accuracy and bias, and make sure to consider privacy, legal, and ethical concerns while using the tool.
Customer Experience and Marketing
Customer relationship management (CRM) tools assist businesses in effectively communicating with their customers and audiences. You use them to glean insights as broadly as trends in how you’re finding and converting leads to customers, or as granular as a single users’ interactions with marketing emails. A well-honed CRM means being able to serve your target and existing customers effectively.
Hubspot and Salesforce Einstein: Two of the largest CRM platforms on the market, these tools are designed to make everything from email to marketing emails to lead scoring to customer service interactions easy. AI has started popping up in almost every function offered, including social media post generation, support ticket routing, website personalization suggestions, and more.
Operations, Productivity, and Efficiency
These kinds of tools take onerous everyday tasks and make them easy. Internally, these kinds of tools can represent massive savings to your OpEx budget, letting you use your resources more effectively. And, given that some of them also make processes external to your org easier (like scheduling meetings with new leads), they can also contribute to new and ongoing revenue streams.
Loom: Loom is a specialized tool designed to make screen recording and subsequent video editing easy. Given how much time it takes to make video content, Loom’s targeting of this once-difficult task has certainly saved time and increased collaboration. Loom includes things like filler word and silence removal, auto-generating chapters with timestamps, summarizing the video, and so on. All features are designed for easy sharing and ingesting of data across video and text mediums.
Calendly: Speaking of collaboration, remember how many emails it used to take to schedule a meeting, particularly if the person was external to your company? How about when you were working a conference and wanted to give a new lead an easy way to get on your calendar? And, of course, there’s the joy of managing multiple inboxes. (Thanks, Calendly. You changed my life.) Moving into the AI future, Calendly is doing similar small but mighty things: predicting your availability, detecting time zones, automating meeting schedules based on team member availability or round robin scheduling, cancellation insights, and more.
Slack: Ah, Slack. Business experts have been trying for years to summarize the effect it’s had on workplace communication, and while it’s not the only tool on the market, it’s definitely a leader. Slack has been adding a variety of AI functions to its platform, including the ability to summarize channels, organize unreads, search and summarize messages—and then there’s all the work they’re doing with integrations rumored to be on the horizon, like creating meeting invite suggestions purely based on your mentioning “putting time on the calendar” in a message.
Creative and Design
Like coding and developer tools, creative of all kinds—image, video, copy—has long been a resource intensive task. These skills are not traditionally suited to corporate structures, and measuring whether one brand or another is better or worse is a complex process, though absolutely measurable and important. Generative AI, again like above, is giving teams the ability to create first drafts, or even train libraries, and then move the human oversight to a higher, more skilled, tier of work.
Adobe and Figma: Both Adobe and Figma are reputable design collaboration tools. Though a merger was recently called off by both sides, both are incorporating AI to make it much, much easier to create images and video for all sorts of purposes. Generative AI means that large swaths of canvas can be filled by a generative tool that predicts background, for instance, or add stock versions of things like buildings with enough believability to fool a discerning eye. Video tools are still in beta, but early releases are impressive, to say the least. With the preview of OpenAI’s text-to-video model Sora making waves to the tune of a 7% drop in Adobe’s stock, video is the space to watch at the moment.
Jasper and Copy.ai: Just like image generation above, these bots are also creating usable copy for tasks of all kinds. And, just like all generative tools, AI copywriters deliver a baseline level of quality best suited to some human oversight. As time goes on, how much oversight remains to be seen.
Tools for Today; Build for Tomorrow
At the end of this roundup, it’s worth noting that there are plenty of tools on the market, and we’ve just presented a few of the bigger names. Honestly, we had trouble narrowing the field of what to include so to speak—this very easily could have been a much longer article, or even a series of articles that delved into things we’re seeing within each use case. As we talked about in AI 101: Do the Dollars Make Sense? (and as you can clearly see here), there’s a great diversity of use cases, technological demands, and unexplored potential in the AI space—which means that companies have a variety of strategic options when deciding how to implement AI or machine learning.
Most businesses will find it easier and more in line with their business goals to adopt software as a service (SaaS) solutions that are either sold as a whole package or integrated into existing tools. These types of tools are great because they’re almost plug and play—you can skip training the model and go straight to using them for whatever task you need.
But, when you’re a hyperscaler and you’re talking about building infrastructure to support the processing and storage demands of the AI future, it’s a different scenario than when other types of businesses are talking about using or building an AI tool or algorithm specific to your business’ internal strategy or products. We’ve already seen that hyperscalers are going for broke in building data centers and processing hubs, investing in companies that are taking on different parts of the tech stack, and, of course, doing longer-term research and experimentation as well.
So, with a brave new world at our fingertips—being built as we’re interacting with it—the best thing for businesses to remember is that periods of rapid change offer opportunity, as long as you’re thoughtful about implementation. And, there are plenty of companies creating tools that make it easy to do just that.
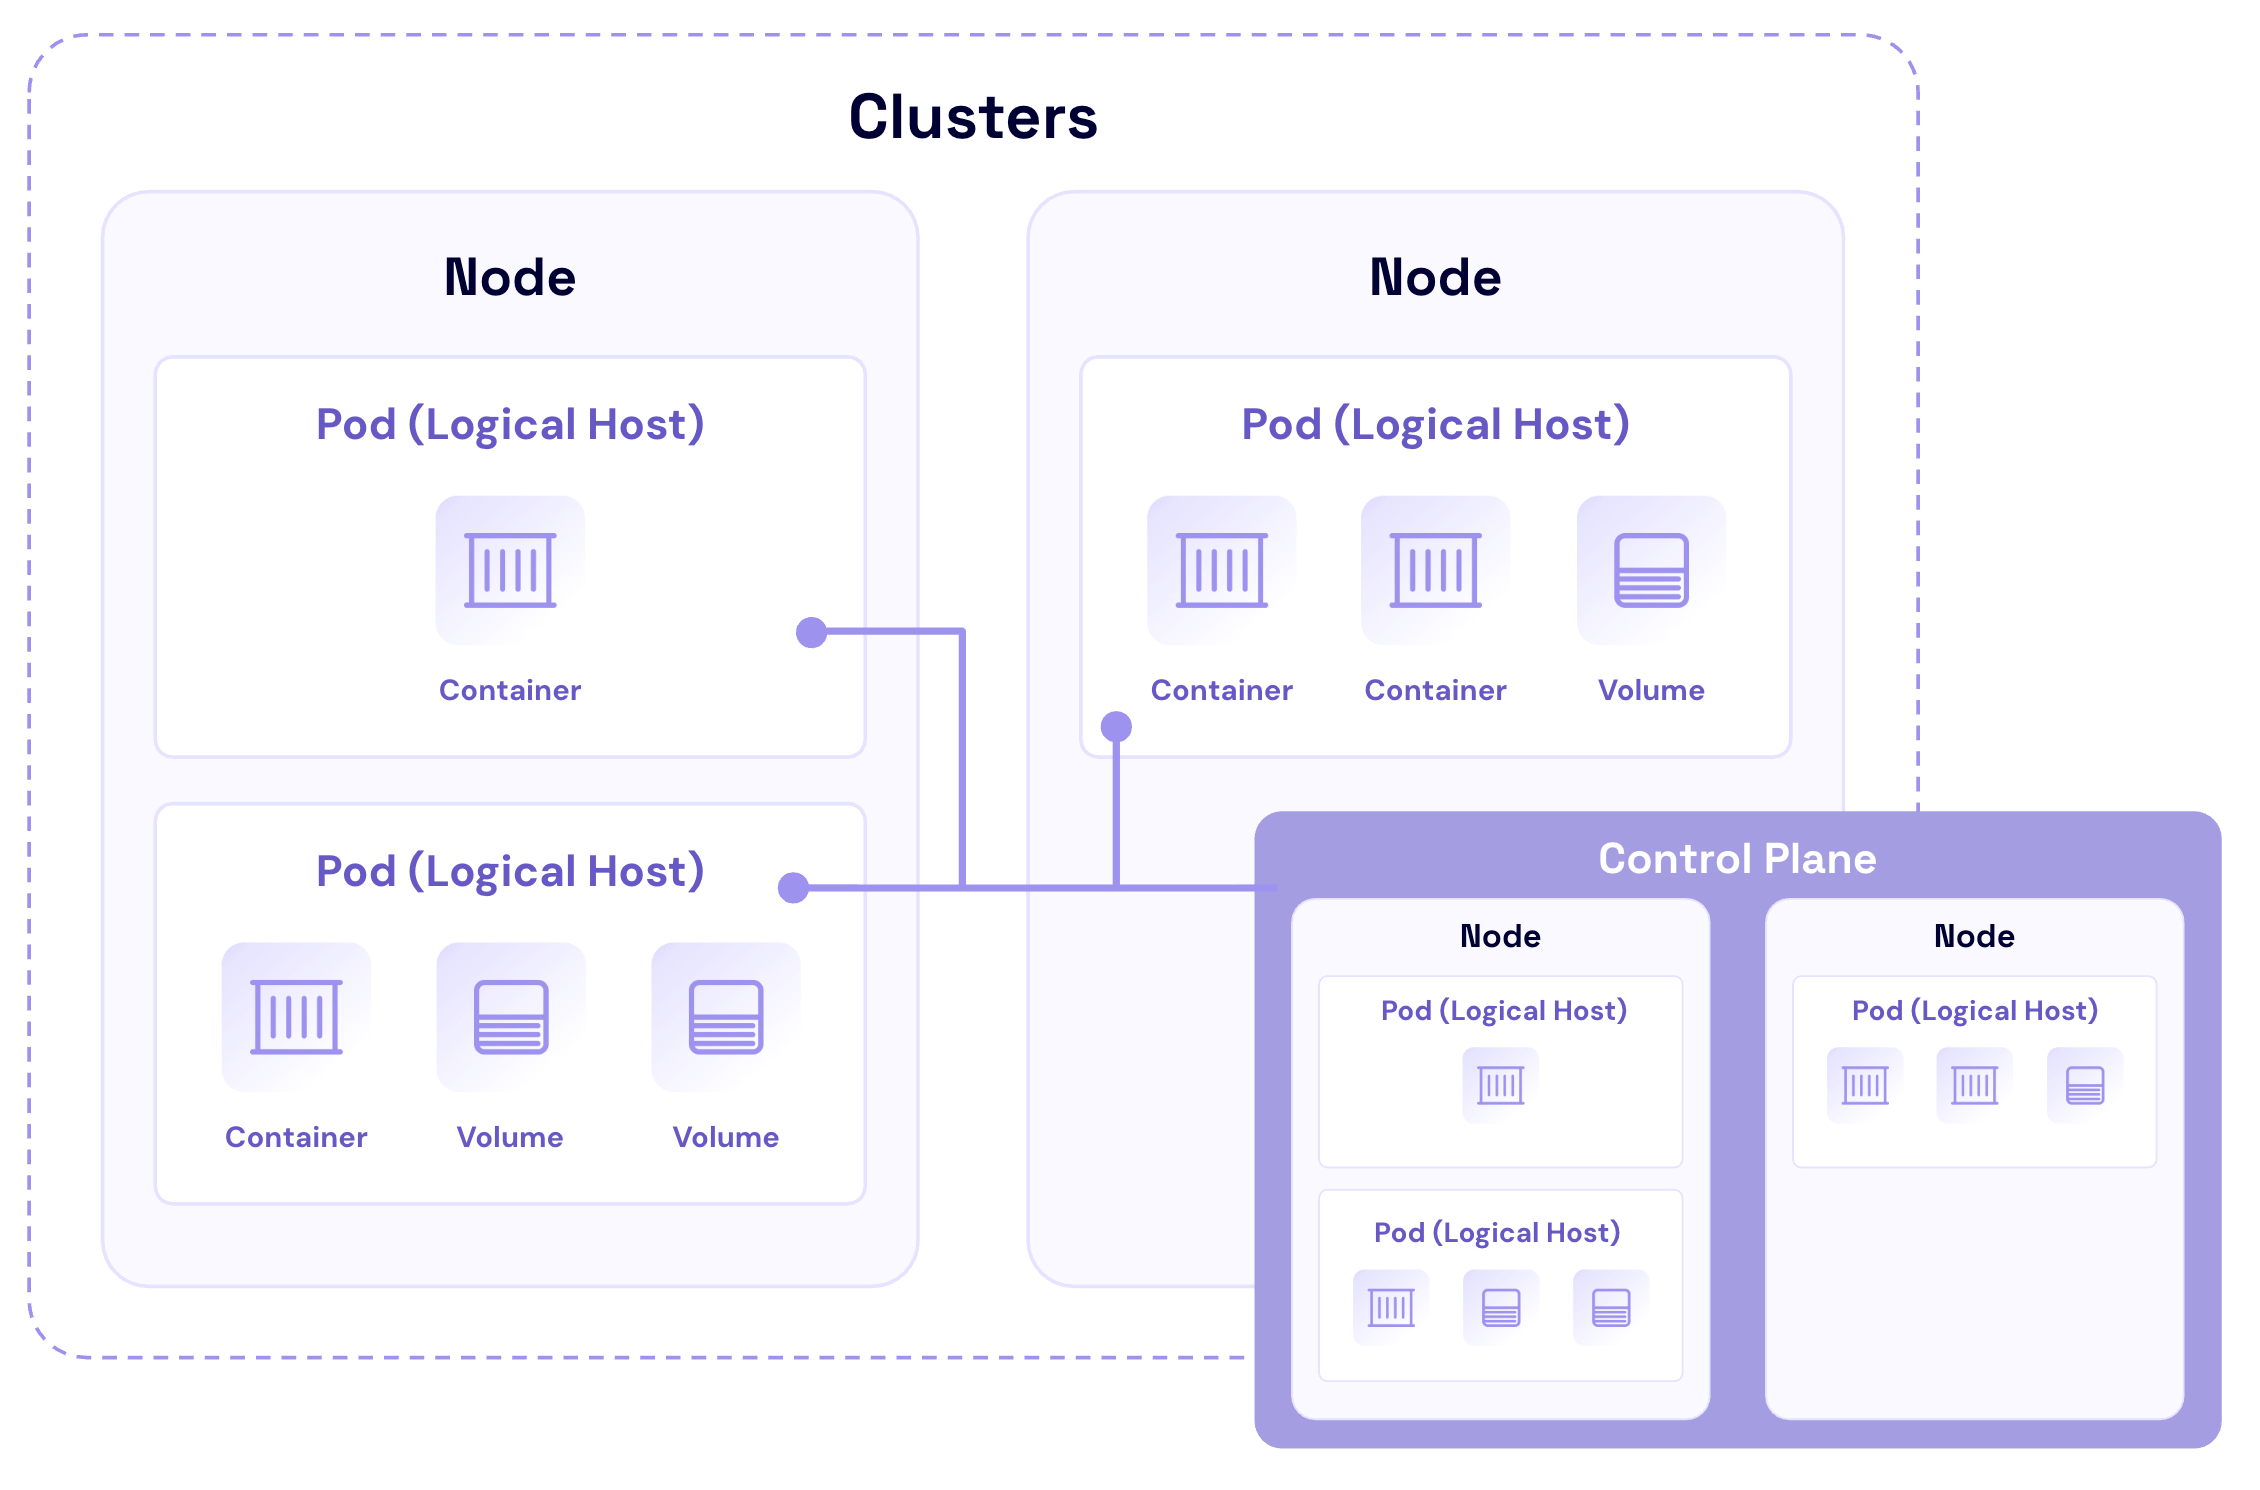
Kubernetes, originally embraced by DevOps teams for its seamless application deployment, has become the go-to operating system for deploying and managing cloud-native applications at scale. Kubernetes as a container orchestrator gives your infrastructure significant advantages, but you have to balance its ephemeral benefits with protecting your application from data loss, misconfigurations, and system failures by keeping cluster backup data in a stateful repository. Or, to stick with the nautical theme in the Kubernetes ecosystem, let’s call it mooring cluster backup data.
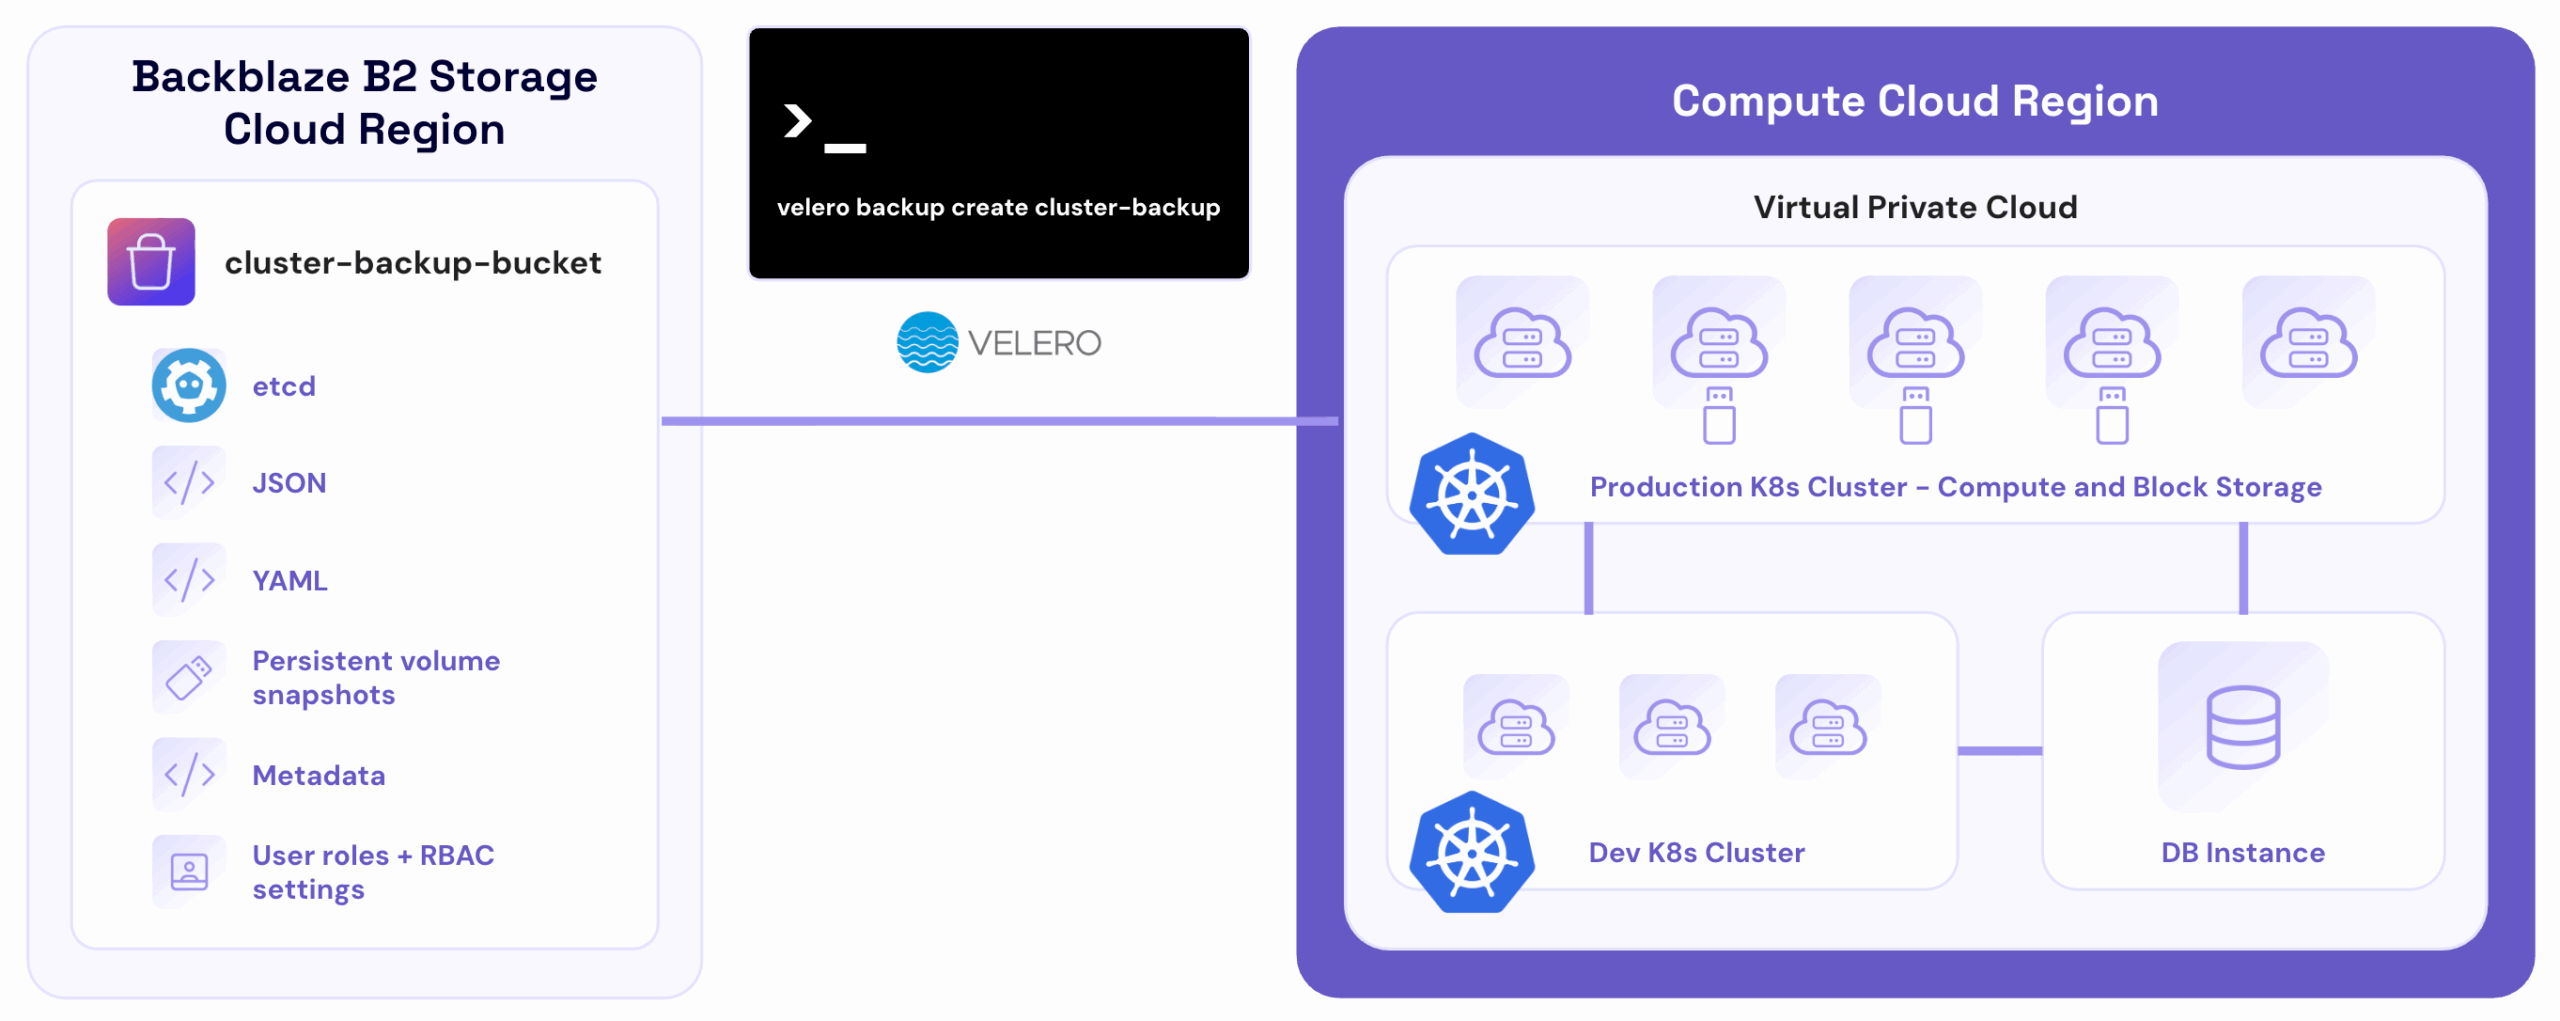
However, backing up Kubernetes can be challenging. The environment’s dynamic nature, with containers constantly being created and destroyed, presents a unique set of challenges. When traditional backup solutions don’t work for Kubernetes’s complexities, using S3 compatible object storage as the destination for a customized approach allows developers to retain complete control over backing up and protecting Kubernetes environments from a wide range of threats, from misconfigurations to ransomware.
Meet Backblaze at KubeCon + CloudNativeCon North America 2025
Backblaze is sponsoring KubeCon for the first time. Stop by booth #1742 to learn how scalable, S3 compatible storage helps cloud-native developers leverage a stateful repository for K8s cluster backups and more.
Understanding Kubernetes architecture
Kubernetes has a fairly straightforward architecture that is designed to automate the deployment, scaling, and management of application containers across infrastructure clusters. Understanding this architecture is not only essential for deploying and managing applications, but also for implementing effective security and backup measures. Here’s a breakdown of Kubernetes hierarchical components and concepts.
Containers: The foundation of Kubernetes
Containers are lightweight, virtualized environments designed to run application code. They encapsulate an application’s code, libraries, and dependencies into a single object. This makes containerized applications easy to deploy, scale, and manage across different environments.
Pods: The smallest deployable units
Pods are often described as logical hosts that can contain one or multiple containers that share storage, network, and specifications on how to run the containers. They are ephemeral by nature—temporary storage for a container that gets wiped out and lost when the container is stopped or restarted.
Nodes: The workhorses of Kubernetes
Nodes represent the physical or virtual machines that run the containerized applications. Each node is managed by the control plane components and contains the services necessary to run Pods.
Cluster: The heart of Kubernetes
A cluster is a collection of nodes that run containerized applications. Clusters provide the high-level structure within which Kubernetes manages the containerized applications. They enable Kubernetes to orchestrate containers’ deployment, scaling, and management across multiple nodes seamlessly.
Control plane: The brain behind the operation
The control plane is responsible for managing the worker nodes and the Pods in the cluster. It includes several components, such as Kubernetes API server, scheduler, controller manager, and etcd (a key-value store for cluster data). The control plane makes global decisions about the cluster, and keeping the control plane readily accessible to validated users for cluster recovery paramount as it’s the central point of management for the cluster.
kubeconfig: The instruction manual
The kubeconfig is a declaratively written configuration file (usually YAML) that provides instructions for Kubernetes tools to connect to clusters, and defines user roles and permissions. The kubeconfig essentially acts as a skeleton key for connecting to and managing clusters. Securely storing multiple copies of your kubeconfig allows you to more rapidly recover from credential rotations or cluster-wide configurations that break access. As multi-cloud Kubernetes deployments continue to grow in popularity for both application redundancy and cost savings purposes, including the kubeconfig in your disaster recovery (DR) plan is essential.
What needs to be protected in Kubernetes?
In Kubernetes, securing your environment is not just about safeguarding the data; it’s about protecting the entire ecosystem that interacts with and manages the data. Here’s an overview of the key components that require protection.
Workloads and applications
Containers and Pods: Protecting containers involves securing the container images from vulnerabilities and ensuring runtime security. For pods, it’s crucial to manage security contexts and network policies effectively to prevent unauthorized access and ensure that sensitive data isn’t exposed to other Pods or services unintentionally.
Deployments and StatefulSets: These are higher-level constructs that manage the deployment and scaling of Pods. Protecting these components involves ensuring that only authorized users can create, update, or delete deployments.
Data and storage
PersistentVolumes (PVs) and PersistentVolumeClaims (PVCs): Persistent storage in Kubernetes is managed through PVs and PVCs, and protecting them is essential to ensure data integrity and confidentiality. This includes securing access to the data they contain, encrypting data at rest and transit, and properly managing storage access permissions.
ConfigMaps and Secrets: While ConfigMaps might contain general configuration settings, Secrets are used to store sensitive data such as passwords, OAuth tokens, and SSH keys.
Network configuration
Services and ingress: Services in Kubernetes provide a way to expose an application on a set of Pods as a network service. Ingress, on the other hand, manages external access to the services within a cluster, typically HTTP. Protecting these components involves securing the communication channels, implementing network policies to restrict access to and from the services, and ensuring that only authorized services are exposed to the outside world.
Network policies: Network policies define how groups of Pods are allowed to communicate with each other and other network endpoints. Securing them is essential for creating a controlled, secure networking environment with your Kubernetes cluster.
Access controls and user management
Role-based access control (RBAC): RBAC in Kubernetes helps define who can access what within a cluster. It allows administrators to regulate access to Kubernetes resources and namespaces based on the roles assigned to users. Protecting your cluster with RBAC users and applications having only the access they need while minimizing the potential impact of compromised credentials or insider threats.
Service accounts: Service accounts provide an identity for processes that run in a Pod, allowing them to interact with the Kubernetes API. Managing and securing these accounts is crucial to prevent unauthorized API access, which could lead to data leakage or unauthorized modifications of the cluster state.
Cluster infrastructure
Nodes and the control plane: The nodes run the containerized applications and are controlled by the control plane, which includes the API server, scheduler, controller manager, and etcd database. Securing the nodes involves hardening the underlying operating system (OS), ensuring secure communication between the nodes and the control plane, and protecting control plane components from unauthorized access and tampering.
Kubernetes Secrets management: Managing Secrets securely in Kubernetes is critical for protecting sensitive data. This includes implementing best practices for Secrets encryption, both at rest and in transit, and limiting Secrets exposure to only those Pods that require access.
Protecting these components is crucial for maintaining both the security and operational integrity of your Kubernetes environment. A breach in any of these areas can compromise your entire cluster, leading to data loss and causing service disruption and financial damage. Implementing a layered security approach that addresses the vulnerabilities of the Kubernetes architecture is essential for building a resilient, secure deployment.
Challenges in Kubernetes data protection
Securing the Kubernetes components we discussed above poses unique challenges due to the platform’s dynamic nature and the diverse types of workloads it supports. Understanding these challenges is the first step toward developing effective strategies for safeguarding your applications and data. Here are some of the key challenges:
Dynamic nature of container environments
Kubernetes’s fluid landscape, with containers constantly being created and destroyed, makes traditional data protection methods less effective. The rapid pace of change demands backup solutions that can adapt just as quickly to avoid data loss.
Statelessness vs. statefulness
Stateless applications: These don’t retain data, pushing the need to safeguard the external persistent storage they rely on.
Stateful applications: Managing data across sessions involves intricate handling of PVs and PVCs, which can be challenging in a system where Pods and nodes are frequently changing.
Data consistency
Maintaining data consistency across distributed replicas in Kubernetes is complex, especially for stateful sets with persistent data needs. Strategies for consistent snapshot or application specific replication are vital to ensure integrity.
Scalability concerns
The scalability of Kubernetes, while a strength, introduces data protection complexities. As clusters grow, ensuring efficient and scalable backup solutions becomes critical to prevent performance degradation and data loss.
Security and regulatory compliance
Ensuring compliance with the appropriate standards—GDPR, HIPAA, or SOC 2 standards, for instance—always requires keeping track of storage and management of sensitive data. In a dynamic environment like Kubernetes, which allows for frequent creation and destruction of containers, enforcing persistent security measures can be a challenge. Also, the sensitive data that needs to be encrypted and protected may be hosted in portions across multiple containers. Therefore, it’s important to not only track what is currently existent but also anticipate possible iterations of the environment by ensuring continuous monitoring and the implementation of robust data management practices.
As you can see, Kubernetes data protection requires navigating its dynamic nature and the dichotomy of stateless and stateful applications while addressing the consistency and scalability challenges. A strategic approach to leveraging Kubernetes-native solutions and best practices is essential for effective data protection.
Choosing the right Kubernetes backup solution: Strategies and considerations
When it comes to protecting your Kubernetes environments, selecting the right backup solution is important. Solutions like Kasten by Veeam, Rubrik, and Commvault are some of the top Kubernetes container backup solutions that offer robust support for Kubernetes backup.
Here are some essential strategies and considerations for choosing a solution that supports your needs.
Assess your workload types: Different applications demand different backup strategies. Stateful applications, in particular, require backup solutions that can handle persistent storage effectively.
Evaluate data consistency needs: Opt for backup solutions that offer consistent backup capabilities, especially for databases and applications requiring strict data consistency. Look for features that support application-consistent backups, ensuring that data is in a usable state when restored.
Scalability and performance: The backup solution should seamlessly scale with your Kubernetes deployment without impacting performance. Consider solutions that offer efficient data deduplication, compressions, and incremental backup capabilities to handle growing data volumes.
Recovery objectives: Define clear recovery objectives. Look for solutions that offer granular recovery options, minimizing downtime by allowing for precise restoration of applications or data, aligning with recovery time objectives (RTOs) and recovery point objectives (RPOs).
Integration and automation: Choose a backup solution that integrates well or natively with Kubernetes, offering automation capabilities for backup schedules, policy management, and recovery processes. This integration simplifies operations and enhances reliability.
Vendor support and community: Consider the vendor’s reputation, the level of support provided, and the solution’s community engagement. A strong support system and active community can be invaluable for troubleshooting and best practices.
As the Kubernetes ecosystem continues to grow and evolve, a growing number of comprehensive cluster backup tools support integrations with S3 compatible storage providers like Backblaze to enable access to highly scalable and affordable unstructured data backup. For example, Velero is an open source, Kubernetes-native disaster recovery tool designed to make backing up entire Kubernetes clusters intuitive for disaster recovery, migration, and archiving purposes. Managed Kubernetes services offered by cloud providers typically have a backup function, but that’s often limited in terms of capacity, scheduling, and retention. Velero makes it possible for cloud native developers to design their own backup strategy with object storage as the destination so clusters can rapidly be redeployed and recovered in any cloud environment.
In the diagram above, a managed Kubernetes cluster runs an application in the cloud. Local backups are enabled for rapid cluster recovery in the same data center.
Kubernetes cluster admin installs and runs Velero to act as an intermediary between the Kubernetes cluster and Backblaze B2 with the command velero backupcreatecluster-backup and uploads cluster snapshots and JSON/YAML manifests to the selected object storage bucket.
After provisioning a new cluster and installing Velero, the admin runs velero restore create --from-backup cluster-backup to completely restore the cluster as it was when the last Velero backup was captured.
Leveraging cloud storage for comprehensive Kubernetes data protection
After choosing a Kubernetes backup application, integrating cloud storage such as Backblaze B2 with your application offers a flexible, secure, scalable approach to data protection. By leveraging cloud storage solutions, organizations can enhance their Kubernetes data protection strategy, ensuring data durability and availability across a distributed environment. This integration facilitates off-site backups, which are essential for disaster recovery and compliance with data protection policies, providing a robust layer of security against data loss, configuration errors, and breaches.
Protect your Kubernetes data
In summary, understanding the intricacies of Kubernetes components, acknowledging the challenges in Kubernetes backup, selecting the appropriate backup solution, and effectively integrating cloud storage are pivotal steps in crafting a comprehensive Kubernetes backup strategy. These measures ensure data protection, operational continuity, and compliance. The right backup solution, tailored to Kubernetes’s distinctive needs, coupled with the scalability and resiliency of cloud storage, provides a robust framework for safeguarding against data loss or breaches. This multi-faceted approach not only safeguards critical data but also supports the agility and scalability that modern IT environments demand.
As of December 31, 2023, we had 274,622 drives under management. Of that number, there were 4,400 boot drives and 270,222 data drives. This report will focus on our data drives. We will review the hard drive failure rates for 2023, compare those rates to previous years, and present the lifetime failure statistics for all the hard drive models active in our data center as of the end of 2023. Along the way we share our observations and insights on the data presented and, as always, we look forward to you doing the same in the comments section at the end of the post.
2023 Hard Drive Failure Rates
As of the end of 2023, Backblaze was monitoring 270,222 hard drives used to store data. For our evaluation, we removed 466 drives from consideration which we’ll discuss later on. This leaves us with 269,756 hard drives covering 35 drive models to analyze for this report. The table below shows the Annualized Failure Rates (AFRs) for 2023 for this collection of drives.
Notes and Observations
One zero for the year: In 2023, only one drive model had zero failures, the 8TB Seagate (model: ST8000NM000A). In fact, that drive model has had zero failures in our environment since we started deploying it in Q3 2022. That “zero” does come with some caveats: We have only 204 drives in service and the drive has a limited number of drive days (52,876), but zero failures over 18 months is a nice start.
Failures for the year: There were 4,189 drives which failed in 2023. Doing a little math, over the last year on average, we replaced a failed drive every two hours and five minutes. If we limit hours worked to 40 per week, then we replaced a failed drive every 30 minutes.
More drive models: In 2023, we added six drive models to the list while retiring zero, giving us a total of 35 different models we are tracking.
Two of the models have been in our environment for a while but finally reached 60 drives in production by the end of 2023.
Toshiba 8TB, model HDWF180: 60 drives.
Seagate 18TB, model ST18000NM000J: 60 drives.
Four of the models were new to our production environment and have 60 or more drives in production by the end of 2023.
Seagate 12TB, model ST12000NM000J: 195 drives.
Seagate 14TB, model ST14000NM000J: 77 drives.
Seagate 14TB, model ST14000NM0018: 66 drives.
WDC 22TB, model WUH722222ALE6L4: 2,442 drives.
The drives for the three Seagate models are used to replace failed 12TB and 14TB drives. The 22TB WDC drives are a new model added primarily as two new Backblaze Vaults of 1,200 drives each.
Mixing and Matching Drive Models
There was a time when we purchased extra drives of a given model to have on hand so we could replace a failed drive with the same drive model. For example, if we needed 1,200 drives for a Backblaze Vault, we’d buy 1,300 to get 100 spares. Over time, we tested combinations of different drive models to ensure there was no impact on throughput and performance. This allowed us to purchase drives as needed, like the Seagate drives noted previously. This saved us the cost of buying drives just to have them hanging around for months or years waiting for the same drive model to fail.
Drives Not Included in This Review
We noted earlier there were 466 drives we removed from consideration in this review. These drives fall into three categories.
Testing: These are drives of a given model that we monitor and collect Drive Stats data on, but are in the process of being qualified as production drives. For example, in Q4 there were four 20TB Toshiba drives being evaluated.
Hot Drives: These are drives that were exposed to high temperatures while in operation. We have removed them from this review, but are following them separately to learn more about how well drives take the heat. We covered this topic in depth in our Q3 2023 Drive Stats Report.
Less than 60 drives: This is a holdover from when we used a single storage server of 60 drives to store a blob of data sent to us. Today we divide that same blob across 20 servers, i.e. a Backblaze Vault, dramatically improving the durability of the data. For 2024 we are going to review the 60 drive criteria and most likely replace this standard with a minimum number of drive days in a given period of time to be part of the review.
Regardless, in the Q4 2023 Drive Stats data you will find these 466 drives along with the data for the 269,756 drives used in the review.
Comparing Drive Stats for 2021, 2022, and 2023
The table below compares the AFR for each of the last three years. The table includes just those drive models which had over 200,000 drive days during 2023. The data for each year is inclusive of that year only for the operational drive models present at the end of each year. The table is sorted by drive size and then AFR.
Notes and Observations
What’s missing?: As noted, a drive model required 200,000 drive days or more in 2023 to make the list. Drives like the 22TB WDC model with 126,956 drive days and the 8TB Seagate with zero failures, but only 52,876 drive days didn’t qualify. Why 200,000? Each quarter we use 50,000 drive days as the minimum number to qualify as statistically relevant. It’s not a perfect metric, but it minimizes the volatility sometimes associated with drive models with a lower number of drive days.
The 2023 AFR was up: The AFR for all drives models listed was 1.70% in 2023. This compares to 1.37% in 2022 and 1.01% in 2021. Throughout 2023 we have seen the AFR rise as the average age of the drive fleet has increased. There are currently nine drive models with an average age of six years or more. The nine models make up nearly 20% of the drives in production. Since Q2, we have accelerated the migration from older drive models, typically 4TB in size, to new drive models, typically 16TB in size. This program will continue throughout 2024 and beyond.
Annualized Failure Rates vs. Drive Size
Now, let’s dig into the numbers to see what else we can learn. We’ll start by looking at the quarterly AFRs by drive size over the last three years.
To start, the AFR for 10TB drives (gold line) are obviously increasing, as are the 8TB drives (gray line) and the 12TB drives (purple line). Each of these groups finished at an AFR of 2% or higher in Q4 2023 while starting from an AFR of about 1% in Q2 2021. On the other hand, the AFR for the 4TB drives (blue line) rose initially, peaking in 2022 and has decreased since. The remaining three drive sizes—6TB, 14TB, and 16TB—have oscillated around 1% AFR for the entire period.
Zooming out, we can look at the change in AFR by drive size on an annual basis. If we compare the annual AFR results for 2022 to 2023, we get the table below. The results for each year are based only on the data from that year.
At first glance it may seem odd that the AFR for 4TB drives is going down. Especially given the average age of each of the 4TB drives models is over six years and getting older. The reason is likely related to our focus in 2023 on migrating from 4TB drives to 16TB drives. In general we migrate the oldest drives first, that is those more likely to fail in the near future. This process of culling out the oldest drives appears to mitigate the expected rise in failure rates as a drive ages.
But, not all drive models play along. The 6TB Seagate drives are over 8.6 years old on average and, for 2023, have the lowest AFR for any drive size group potentially making a mockery of the age-is-related-to-failure theory, at least over the last year. Let’s see if that holds true for the lifetime failure rate of our drives.
Lifetime Hard Drive Stats
We evaluated 269,756 drives across 35 drive models for our lifetime AFR review. The table below summarizes the lifetime drive stats data from April 2013 through the end of Q4 2023.
The current lifetime AFR for all of the drives is 1.46%. This is up from the end of last year (Q4 2022) which was 1.39%. This makes sense given the quarterly rise in AFR over 2023 as documented earlier. This is also the highest the lifetime AFR has been since Q1 2021 (1.49%).
The table above contains all of the drive models active as of 12/31/2023. To declutter the list, we can remove those models which don’t have enough data to be statistically relevant. This does not mean the AFR shown above is incorrect, it just means we’d like to have more data to be confident about the failure rates we are listing. To that end, the table below only includes those drive models which have two million drive days or more over their lifetime, this gives us a manageable list of 23 drive models to review.
Using the table above we can compare the lifetime drive failure rates of different drive models. In the charts below, we group the drive models by manufacturer, and then plot the drive model AFR versus average age in months of each drive model. The relative size of each circle represents the number of drives in each cohort. The horizontal and vertical scales for each manufacturer chart are the same.
Notes and Observations
Drive migration: When selecting drive models to migrate we could just replace the oldest drive models first. In this case, the 6TB Seagate drives. Given there are only 882 drives—that’s less than one Backblaze Vault—the impact on failure rates would be minimal. That aside, the chart makes it clear that we should continue to migrate our 4TB drives as we discussed in our recent post on which drives reside in which storage servers. As that post notes, there are other factors, such as server age, server size (45 vs. 60 drives), and server failure rates which help guide our decisions.
HGST: The chart on the left below shows the AFR trendline (second order polynomial) for all of our HGST models. It does not appear that drive failure consistently increases with age. The chart on the right shows the same data with the HGST 4TB drive models removed. The results are more in line with what we’d expect, that drive failure increased over time. While the 4TB drives perform great, they don’t appear to be the AFR benchmark for newer/larger drives.
One other potential factor not explored here, is that beginning with the 8TB drive models, helium was used inside the drives and the drives were sealed. Prior to that they were air-cooled and not sealed. So did switching to helium inside a drive affect the failure profile of the HGST drives? Interesting question, but with the data we have on hand, I’m not sure we can answer it—or that it matters much anymore as helium is here to stay.
Seagate: The chart on the left below shows the AFR trendline (second order polynomial) for our Seagate models. As with the HGST models, it does not appear that drive failure continues to increase with age. For the chart on the right, we removed the drive models that were greater than seven years old (average age).
Interestingly, the trendline for the two charts is basically the same up to the six year point. If we attempt to project past that for the 8TB and 12TB drives there is no clear direction. Muddying things up even more is the fact that the three models we removed because they are older than seven years are all consumer drive models, while the remaining drive models are all enterprise drive models. Will that make a difference in the failure rates of the enterprise drive model when they get to seven or eight or even nine years of service? Stay tuned.
Toshiba and WDC: As for the Toshia and WDC drive models, there is a little over three years worth of data and no discernible patterns have emerged. All of the drives from each of these manufacturers are performing well to date.
Drive Failure and Drive Migration
One thing we’ve seen above is that drive failure projections are typically drive model dependent. But we don’t migrate drive models as a group, instead, we migrate all of the drives in a storage server or Backblaze Vault. The drives in a given server or Vault may not be the same model. How we choose which servers and Vaults to migrate will be covered in a future post, but for now we’ll just say that drive failure isn’t everything.
The Hard Drive Stats Data
The complete data set used to create the tables and charts in this report is available on our Hard Drive Test Data page. You can download and use this data for free for your own purpose. All we ask are three things: 1) you cite Backblaze as the source if you use the data, 2) you accept that you are solely responsible for how you use the data, and 3) you do not sell this data itself to anyone; it is free.
Good luck, and let us know if you find anything interesting.
They say good manners are better than good looks. When it comes to being a good internet citizen, we have to agree. And when someone else tells you that you have good manners (or MANRS in this case), even better.
If you hold your cloud partners to a higher standard, and if you think it’s not asking too much that they make the internet a better, safer place for everyone, then you’ll be happy to know that Backblaze is now recognized as a Mutually Agreed Norms for Routing Security (MANRS) participant (aka MANRS Compliant).
What Is MANRS?
MANRS is a global initiative with over 1,095 participants that are enacting network policies and controls to help reduce the most common routing threats. At a high level, we’re setting up filters to check that network routing information we receive for peers is valid, ensuring that the networks we advertise to the greater internet are marked as owned by Backblaze, and making sure that data that gets out of our network is legitimate and can’t be spoofed.
You can view a full list of MANRS participants here.
What Our (Good) MANRS Mean For You
The biggest benefit for customers is that network traffic to and from Backblaze’s connection points where we exchange traffic with our peering partners is more secure and more trustworthy. All of the changes that we’ve implemented (which we get into below) are on our side—so, no action is necessary from Backblaze partners or users—and will be transparent for our customers. Our Network Engineering team has done the heavy lifting.
MANRS Actions
Backblaze falls under the MANRS category of CDN and Cloud Providers, and as such, we’ve implemented solutions or processes for each of the five actions stipulated by MANRS:
Prevent propagation of incorrect routing information: Ensure that traffic we receive is coming from known networks.
Prevent traffic of illegitimate source IP addresses: Prevent malicious traffic coming out of our network.
Facilitate global operational communication and coordination: Keep our records with 3rd party sites like Peeringdb.com up to date as other operators use this to validate our connectivity details.
Facilitate validation of routing information on a global scale: Digitally sign our network objects using the Resource Public Key Infrastructure (RPKI) standard.
Encourage MANRS adoption: By telling the world, just like in this post!
Digging Deeper Into Filtering and RPKI
Let’s go over the filtering and RPKI details, since they are very valuable to ensuring the security and validity of our network traffic.
Filtering: Sorting Out the Good Networks From the Bad
One major action for MANRS compliance is to validate that the networks we receive from peers are valid. When we connect to other networks, we each tell each other about our networks in order to build a routing table that lets us know the optimal path to send traffic.
We can blindly trust what the other party is telling us, or we can reach out to an external source to validate. We’ve implemented automated internal processes to help us apply these filters to our edge routers (the devices that connect us externally to other networks).
If you’re a more visual learner, like me, here’s a quick conversational bubble diagram of what we have in place.
Externally verifying routing information we receive.
Every edge device that connects to an external peer now has validation steps to ensure that the networks we receive and use to send out traffic are valid. We have automated processes that periodically check and deploy for updates to any lists.
What Is RPKI?
RPKI is a public key infrastructure framework designed to secure the internet’s routing infrastructure, specifically the Border Gateway Protocol (BGP). RPKI provides a way to connect internet number resource information (such as IP addresses) to a trust anchor. In layman’s terms, RPKI allows us, as a network operator, to securely identify whether other networks that interact with ours are legitimate or malicious.
RPKI: Signing Our Paperwork
Much like going to a notary and validating a form, we can perform the same action digitally with the list of networks that we advertise to the greater internet. The RPKI framework allows us to stamp our networks as owned by us.
It also allows us to digitally sign records of our networks that we own, allowing external parties to confirm that the networks that they see from us are valid. If another party comes along and tries to claim to be us, by using RPKI our peering partner will deny using that network to send data to a false Backblaze network.
What does the process of peering and advertising networks look like without RPKI validation?
Bad actor claiming to be a Backblaze network without RPKI validation.
Now, with RPKI, we’ve dotted our I’s and crossed our T’s. A third party certificate holder serves as a validator for the digital certificates that we used to sign our network objects. If anyone else claims to be us, they will be marked as invalid and the peer will not accept the routing information, as you can see in the diagram below.
With RPKI validation, the bad actor is denied the ability to claim to be a Backblaze network.
Mind Your MANRS
Our first value as a company is to be fair and good. It reads: “Be good. Trust is paramount. Build a good product. Charge fairly. Be open, honest, and accepting with customers and each other.” Almost sounds like Emily Post wrote it—that’s why our MANRS participation fits right in with the way we do business. We believe in an open internet, and participating in MANRS is just one way that we can contribute to a community that is working towards good for all.
Today, we announced our new Powered by Backblaze program to give platform providers the ability to offer cloud storage without the burden of building scalable storage infrastructure (something we know a little bit about).
If you’re an independent software vendor (ISV), technology partner, or any company that wants to incorporate easy, affordable data storage within your branded user experience, Powered by Backblaze will give you the tools to do so without complex code, capital outlay, or massive expense.
Read on to learn more about Powered by Backblaze and how it can help you enhance your platforms and services. Or, if you’d like to get started asap, contact our Sales Team for access.
Benefits of Powered by Backblaze
Business Growth: Adding cloud services to your product portfolios can generate new revenue streams and/or grow your existing margin.
Improved Customer Experience: Take the complexity out of object storage and deliver the best solutions by incorporating a proven object cloud storage solution.
Simplified Billing: Reduce complex billing by providing customers with a single bill from a single provider.
Build Your Brand: Improve customer expectations by providing cloud storage with your company name for consistency and brand identity.
What Is Powered by Backblaze?
Powered by Backblaze offers companies the ability to incorporate B2 Cloud Storage into their products so they can sell more services or enhance their user experience with no capital investment. Today, this program offers two solutions that support the provisioning of B2 Cloud Storage: Custom Domains and the Backblaze Partner API.
How Can I Leverage Custom Domains?
Custom Domains, launched today, lets you serve content to your end users from the web domain or URL of your choosing, with no need for complex code or proxy servers. Backblaze manages the heavy lifting of cloud storage on the back end.
Custom Domains functionality combines CNAME and Backblaze B2 Object Storage, enabling the use of your preferred domain name in your files’ web domain or URLs instead of using the domain name that Backblaze automatically assigns.
We’ve chosen Backblaze so we can have a reliable partner behind our new Edge Storage solution. With their Custom Domain feature, we can implement the security needed to serve data from Backblaze to end users from Azion’s Edge Platform, improving user experience.
—Rafael Umann, CEO, Azion, a full stack platform for developers
How Can I Leverage the Backblaze Partner API?
The Backblaze Partner API automates the provisioning and management of Backblaze B2 Cloud Storage storage accounts within a platform. It allows for managing accounts, running reports, and creating a bundled solution or managed service for a unified user experience.
We wrote more about the Backblaze Partner API here, but briefly: We created this solution by exposing existing API functionality in a manner that allows partners to automate tasks essential to provisioning users with seamless access to storage.
Our customers produce thousands of hours of content daily and, with the shift to leveraging cloud services like ours, they need a place to store both their original and transcoded files. The Backblaze Partner API allows us to expand our cloud services and eliminate complexity for our customers—giving them time to focus on their business needs, while we focus on innovations that drive more value.
—Murad Mordukhay, CEO, Qencode
How to Get Started With Powered by Backblaze
To get started with Powered by Backblaze, contact our Sales Team. They will work with you to understand your use case and how you can best utilize Powered by Backblaze.
What’s Next?
We’re looking forward to adding more to the Powered by Backblaze program as we continue investing in the tools you need to bring performant cloud storage to your users in an easy, seamless fashion.
Editor’s Note: This post was originally published in 2016 and has since been updated in 2022 and 2023 with the latest information on RAM vs. storage.
Memory is a finite resource when it comes to both humans and computers—it’s one of the most common causes of computer issues. And if you’ve ever left the house without your keys, you know memory is one of the most common human problems, too.
If you’re unclear about the different types of memory in your computer, it makes pinpointing the cause of computer problems that much harder. You might hear folks use the terms memory and storage interchangeably, but there are some important differences. Understanding how both components work can help you understand what kind of computer you need, diagnose problems you’re having, and know when it’s time to consider upgrades.
The Difference Between RAM and Storage
Random access memory (RAM) and storage are both forms of computer memory, but they serve different functions.
What Is RAM?
RAM is volatile memory used by the computer’s processor to store and quickly access data that is actively being used or processed. Volatile memory maintains data only while the device is powered on. RAM takes the form of computer chips—integrated circuits—that are either soldered directly onto the main logic board of your computer or installed in memory modules that go in sockets on your computer’s logic board.
You can think of it like a desk—it’s where your computer gets work done. When you double-click on an app, open a document, or do much of anything, part of your “desk” is covered and can’t be used by anything else. As you open more files, it is like covering your desk with more and more items. Using a desk with a handful of files is easy, but a desk that is covered with a bunch of stuff gets difficult to use.
What Is Computer Storage?
On the other hand, storage is used for long-term data retention, like a hard disk drive (HDD) or solid state drive (SSD). Compared with RAM, this type of storage is non-volatile, which means it retains information even when a device is powered off. You can think of storage like a filing cabinet—a place next to your desk where you can retrieve information as needed.
RAM vs. Storage: How Do They Compare?
Speed and Performance
Two of the primary differences between RAM and storage are speed and performance. RAM is significantly faster than storage. Data stored in RAM can be written and accessed almost instantly, so it’s very fast—milliseconds fast. DDR4 RAM, one of the newer types of RAM technology, is capable of a peak transfer rate of 25.6GB/s! RAM has a very fast path to the computer’s central processing unit (CPU), the brain of the computer that does most of the work.
Storage, as it’s slower in comparison, is responsible for holding the operating system (OS), applications, and user data for the long term—it should still be fast, but it doesn’t need to be as fast as RAM.
That said, computer storage is getting faster thanks to the popularity of SSDs. SSDs are much faster than hard drives since they use integrated circuits instead of mechanical platters that have to be read sequentially, like HDDs. SSDs use a special type of memory circuitry called non-volatile RAM (NVRAM) to store data, so those shorter term memory access points stay in place even when the computer is turned off.
Even though SSDs are faster than HDDs, they’re still slower than RAM. There are two reasons for that difference in speed. First, the memory chips in SSDs are slower than those in RAM. Second, there is a bottleneck created by the interface that connects the storage device to the computer. RAM, in comparison, has a much faster interface.
Capacity and Size
RAM is typically smaller in capacity compared to storage. It is measured in gigabytes (GB) or terabytes (TB), whereas storage capacities can reach multiple terabytes or even petabytes. The smaller size of RAM is intentional, as it is designed to store only the data currently in use, ensuring quick access for the processor.
Volatility and Persistence
Another key difference is the volatility of RAM and the persistence of storage. RAM is volatile, meaning it loses its data when the power is turned off or the system is rebooted. This makes it ideal for quick data access and manipulation, but unsuitable for long-term storage. Storage is non-volatile or persistent, meaning it retains data even when the power is off, making it suitable for holding files, applications, and the operating system over extended periods.
How Much RAM Do I Have?
Understanding how much RAM you have might be one of your first steps for diagnosing computer performance issues.
Use the following steps to confirm how much RAM your computer has installed. We’ll start with an Apple computer. Click on the Applemenu and then click About This Mac. In the screenshot below, we can see that the computer has 16GB of RAM.
How much RAM on macOS (Apple menu > About This Mac).
With a Windows 11 computer, use the following steps to see how much RAM you have installed. Open the Control Panel by clicking the Windows button and typing “control panel,” then click System and Security, and then click System. Look for the line “Installed RAM.” In the screenshot below, you can see that the computer has 32GB of RAM installed.
How much RAM on Windows 11 (Control Panel > System and Security > System).
How Much Computer Storage Do I Have?
To view how much free storage space you have available on a Mac computer, use these steps. Click on the Apple menu, then System Settings, select General, and then open Storage. In the screenshot below, we’ve circled where your available storage is displayed.
Disk space on Mac OS (Apple Menu > System Settings > General > Storage).
With a Windows 11 computer, it is also easy to view how much available storage space you have. Click the Windows button and type in “file explorer.” When File Explorer opens, click on This PC from the list of options in the left-hand pane. In the screenshot below, we’ve circled where your available storage is displayed (in this case, 200GB).
Disk Space on Windows 10 (File Explorer > This PC).
How RAM and Storage Affect Your Computer’s Performance
RAM
For most general-purpose uses of computers—email, writing documents, surfing the web, or watching Netflix—the RAM that comes with our computer is enough. If you own your computer for a long enough time, you might need to add a bit more to keep up with memory demands from newer apps and OSes. Specifically, more RAM makes it possible for you to use more apps, documents, and larger files at the same time.
People that work with very large files like large databases, videos, and images can benefit significantly from having more RAM. If you regularly use large files, it is worth checking to see if your computer’s RAM is upgradeable.
Adding More RAM to Your Computer
In some situations, adding more RAM is worth the expense. For example, editing videos and high-resolution images takes a lot of memory. In addition, high-end audio recording and editing as well as some scientific work require significant RAM.
However, not all computers allow you to upgrade RAM. For example, the Chromebook typically has a fixed amount of RAM, and you cannot install more. So, when you’re buying a new computer—particularly if you plan on using that computer for more than five years, make sure to 1) understand how much RAM your computer has, and, 2) if you can upgrade the computer’s RAM.
When your computer’s RAM is filled up, your computer has to get creative to keep working. Specifically, your computer starts to temporarily use your hard drive or SSD as “virtual memory.” If you have relatively fast storage like an SSD, virtual memory will be fast. On the other hand, using a traditional hard drive will be fairly slow.
Storage
Besides RAM, the most serious bottleneck to improving performance in your computer can be your storage. Even with plenty of RAM installed, computers need to read and write information from the storage system (i.e., the HDD or the SSD).
Hard drives come in different speeds and sizes. For laptops and desktops, the most common RPM rates are between 5400–7200RPM. In some cases, you might even decide to use a 10,000RPM drive. Faster drives cost more, are louder, have greater cooling needs, and use more power, but they may be a good option.
Today, SSDs are becoming increasingly popular for computer storage. This type of computer storage is popular because it is faster, cooler, and takes up less space than traditional hard drives. They’re also less susceptible to magnetic fields and physical jolts, which makes them great for laptops.
As a user’s disk storage needs increase, typically they will look to larger drives to store more data. The first step might be to replace an existing drive with a larger, faster drive. Or you might decide to install a second drive. One approach is to use different drives for different purposes. For example, use an SSD for the operating system, and then store your business videos on a larger SSD.
If more storage space is needed, you can also use an external drive, most often using USB or Thunderbolt to connect to the computer. This can be a single drive or multiple drives and might use a data storage virtualization technology such as RAID to protect the data.
If you have really large amounts of data, or simply wish to make it easy to share data with others in your location or elsewhere, you might consider network-attached storage (NAS). A NAS device can hold multiple drives, typically uses a data virtualization technology like RAID, and is accessible to anyone on your local network and—if you wish—on the internet, as well. NAS devices can offer a great deal of storage and other services that typically have been offered only by dedicated network servers in the past.
Back Up Early and Often
As a cloud storage company, we’d be remiss not to mention that you should back up your computer. No matter how you configure your computer’s storage, remember that technology can fail (we know a thing or two about that). You always want a backup so you can restore everything easily. The best backup strategy shouldn’t be dependent on any single device, either. Your backup strategy should always include three copies of your data on two different mediums with one off-site.
FAQs About Differences Between RAM and Storage
What is the difference between internal storage and RAM and internal storage?
Internal storage is a method of data storage that writes data to a disk, holding onto that data until it’s erased. Think of it as your computer’s brain. RAM is a method of communicating data between your device’s CPU and its internal storage. Think of it as your brain’s short-term memory and ability to multi-task. The data the RAM receives is volatile, so it will only last until it’s no longer needed, usually when you turn off the power or reset the computer.
Is it better to have more RAM or more storage?
If you’re looking for better PC performance, you can upgrade either RAM or storage for a boost in performance. More RAM will make it easier for your computer to perform multiple tasks at once, while upgrading your storage will improve battery life, make it faster to open applications and files, and give you more space for photos and applications. This is especially true if you’re switching your storage from a hard disk drive (HDD) to a solid state drive (SSD).
Does RAM give you more storage?
More RAM does not provide you with more free space. If your computer is giving you notifications that you’re getting close to running out of storage or you’ve already started having to delete files to make room for new ones, you should upgrade the internal storage, not the RAM.
Is memory and storage the same?
Memory and storage are also not the same thing, even though the words are often used interchangeably. Memory is another term for RAM.
One of the benefits of the Backblaze B2 Storage Cloud having an S3 compatible API is that developers can take advantage of the wide range of Amazon Web Services SDKs when building their apps. The AWS team has released over a dozen SDKs covering a broad range of programming languages, including Java, Python, and JavaScript, and the latter supports both frontend (browser) and backend (Node.js) applications.
With all of this tooling available, you might be surprised to discover aws-lite. In the words of its creators, it is “a simple, extremely fast, extensible Node.js client for interacting with AWS services.” After meeting Brian LeRoux, cofounder and chief technology officer (CTO) of Begin, the company that created the aws-lite project, at the AWS re:Invent conference last year, I decided to give aws-lite a try and share the experience. Read on for the learnings I discovered along the way.
Brian bribed me to try out aws-lite with a shiny laptop sticker!
Why Not Just Use the AWS SDK for JavaScript?
The AWS SDK has been through a few iterations. The initial release, way back in May 2013, focused on Node.js, while version 2, released in June 2014, added support for JavaScript running on a web page. We had to wait until December 2020 for the next major revision of the SDK, with version 3 adding TypeScript support and switching to an all-new modular architecture.
However, not all developers saw version 3 as an improvement. Let’s look at a simple example of the evolution of the SDK. The simplest operation you can perform against an S3 compatible cloud object store, such as Backblaze B2, is to list the buckets in an account. Here’s how you would do that in the AWS SDK for JavaScript v2:
var AWS = require('aws-sdk');

var client = new AWS.S3({
  region: 'us-west-004',
  endpoint: 's3.us-west-004.backblazeb2.com'
});

client.listBuckets(function (err, data) {
  if (err) {
    console.log("Error", err);
  } else {
    console.log("Success", data.Buckets);
  }
});
Looking back from 2023, passing a callback function to the listBuckets() method looks quite archaic! Version 2.3.0 of the SDK, released in 2016, added support for JavaScript promises, and, since async/await arrived in JavaScript in 2017, today we can write the above example a little more clearly and concisely:
One major drawback with version 2 of the AWS SDK for JavaScript is that it is a single, monolithic, JavaScript module. The most recent version, 2.1539.0, weighs in at 92.9MB of code and resources. Even the most minimal app using the SDK has to include all that, plus another couple of MB of dependencies, causing performance issues in resource-constrained environments such as internet of things (IoT) devices, or browsers on low-end mobile devices.
Version 3 of the AWS SDK for JavaScript aimed to fix this, taking a modular approach. Rather than a single JavaScript module there are now over 300 packages published under the @aws-sdk/ scope on NPM. Now, rather than the entire SDK, an app using S3 need only install @aws-sdk/client-s3, which, with its dependencies, adds up to just 20MB.
So, What’s the Problem With AWS SDK for JavaScript v3?
One issue is that, to fully take advantage of modularization, you must adopt an unfamiliar coding style, creating a command object and passing it to the client’s send() method. Here is the “new way” of listing buckets:
const { S3Client, ListBucketsCommand } = require("@aws-sdk/client-s3");

// Since v3.378, S3Client can read region and endpoint, as well as
// credentials, from configuration, so no need to pass any arguments
const client = new S3Client();

try {
  // Inexplicably, you must pass an empty object to
  // ListBucketsCommand() to avoid the SDK throwing an error
  const data = await client.send(new ListBucketsCommand({}));
  console.log("Success", data.Buckets);
} catch (err) {
  console.log("Error", err);
}
The second issue is that, to help manage the complexity of keeping the SDK packages in sync with the 200+ services and their APIs, AWS now generates the SDK code from the API specifications. The problem with generated code is that, as the aws-lite home page says, it can result in “large dependencies, poor performance, awkward semantics, difficult to understand documentation, and errors without usable stack traces.”
A couple of these effects are evident even in the short code sample above. The underlying ListBuckets API call does not accept any parameters, so you might expect to be able to call the ListBucketsCommand constructor without any arguments. In fact, you have to supply an empty object, otherwise the SDK throws an error. Digging into the error reveals that a module named middleware-sdk-s3 is validating that, if the object passed to the constructor has a Bucket property, it is a valid bucket name. This is a bit odd since, as I mentioned above, ListBuckets doesn’t take any parameters, let alone a bucket name. The documentation for ListBucketsCommand contains two code samples, one with the empty object, one without. (I filed an issue for the AWS team to fix this.)
“Okay,” you might be thinking, “I’ll just carry on using v2.” After all, the AWS team is still releasing regular updates, right? Not so fast! When you run the v2 code above, you’ll see the following warning before the list of buckets:
(node:35814) NOTE: We are formalizing our plans to enter AWS SDK for JavaScript (v2) into maintenance mode in 2023.
Please migrate your code to use AWS SDK for JavaScript (v3).
For more information, check the migration guide at https://a.co/7PzMCcy
At some (as yet unspecified) time in the future, v2 of the SDK will enter maintenance mode, during which, according to the AWS SDKs and Tools maintenance policy, “AWS limits SDK releases to address critical bug fixes and security issues only.” Sometime after that, v2 will reach the end of support, and it will no longer receive any updates or releases.
Getting Started With aws-lite
Faced with a forced migration to what they judged to be an inferior SDK, Brian’s team got to work on aws-lite, posting the initial code to the aws-lite GitHub repository in September last year, under the Apache 2.0 open source license. At present the project comprises a core client and 13 plugins covering a range of AWS services including S3, Lambda, and DynamoDB.
Following the instructions on the aws-lite site, I installed the client module and the S3 plugin, and implemented the ListBuckets sample:
For me, this combines the best of both worlds—concise code, like AWS SDK v2, and full support for modern JavaScript features, like v3. Best of all, the aws-lite client, S3 plugin, and their dependencies occupy just 284KB of disk space, which is less than 2% of the modular AWS SDK’s 20MB, and less than 0.5% of the monolith’s 92.9MB!
Caveat Developer!
(Not to kill the punchline here, but for those of you who might not have studied Latin or law, this is a play on the phrase, “caveat emptor”, meaning “buyer beware”.)
I have to mention, at this point, that aws-lite is still very much under construction. Only a small fraction of AWS services are covered by plugins, although it is possible (with a little extra code) to use the client to call services without a plugin. Also, not all operations are covered by the plugins that do exist. For example, at present, the S3 plugin supports 10 of the most frequently used S3 operations, such as PutObject, GetObject, and ListObjectsV2, leaving the remaining 89 operations TBD.
Since its launch in 2014 as a cloud-based data warehouse, Snowflake has evolved into a broad data-as-a-service platform addressing a wide variety of use cases, including artificial intelligence (AI), machine learning (ML), collaboration across organizations, and data lakes. Last year, Snowflake introduced support for S3 compatible cloud object stores, such as Backblaze B2 Cloud Storage. Now, Snowflake customers can access unstructured data such as images and videos, as well as structured and semi-structured data such as CSV, JSON, Parquet, and XML files, directly in the Snowflake Platform, served up from Backblaze B2.
Why access external data from Snowflake, when Snowflake is itself a data as a service (DaaS) platform with a cloud-based relational database at its core? To put it simply, not all data belongs in Snowflake. Organizations use cloud object storage solutions such as Backblaze B2 as a cost-effective way to maintain both master and archive data, with multiple applications reading and writing that data. In this situation, Snowflake is just another consumer of the data. Besides, data storage in Snowflake is much more expensive than in Backblaze B2, raising the possibility of significant cost savings as a result of optimizing your data’s storage location.
Snowflake Basics
At Snowflake’s core is a cloud-based relational database. You can create tables, load data into them, and run SQL queries just as you can with a traditional on-premises database. Given Snowflake’s origin as a data warehouse, it is currently better suited to running analytical queries against large datasets than as an operational database serving a high volume of transactions, but Snowflake Unistore’s hybrid tables feature (currently in private preview) aims to bridge the gap between transactional and analytical workloads.
As a DaaS platform, Snowflake runs on your choice of public cloud—currently Amazon Web Services (AWS), Microsoft Azure, and Google Cloud Platform—but insulates you from the details of managing storage, compute, and networking infrastructure. Having said that, sometimes you need to step outside the Snowflake box to access data that you are managing in your own cloud object storage account. I’ll explain exactly how that works in this blog post, but, first, let’s take a quick look at how we classify data according to its degree of structure, as this can have a big impact on your decision of where to store it.
Structured and Semi-Structured Data
Structured data conforms to a rigid data model. Relational database tables are the most familiar example—a table’s schema describes required and optional fields and their data types, and it is not possible to insert rows into the table that contain additional fields not listed in the schema. Aside from relational databases, file formats such as Apache Parquet, Optimized Row Columnar (ORC), and Avro can all store structured data; each file format specifies a schema that fully describes the data stored within a file. Here’s an example of a schema for a Parquet file:
Semi-structured data, as its name suggests, is more flexible. File formats such as CSV, XML and JSON need not use a formal schema, since they can be self-describing. That is, an application can infer the structure of the data as it reads the file, a mechanism often termed “schema-on-read.”
This simple JSON example illustrates the principle. You can see how it’s possible for an application to build the schema of a product record as it reads the file:
Accessing Structured and Semi-Structured Data Stored in Backblaze B2 from Snowflake
You can access data located in cloud object storage external to Snowflake, such as Backblaze B2, by creating an external stage. The external stage is a Snowflake database object that holds a URL for the external location, as well as configuration (e.g., credentials) required to access the data. For example:
You can create an external table to query data stored in an external stage as if the data were inside a table in Snowflake, specifying the table’s columns as well as filenames, file formats, and data partitioning. Just like the external stage, the external table is a database object, located in a Snowflake schema, that stores the metadata required to access data stored externally to Snowflake, rather than the data itself.
Every external table automatically contains a single VARIANT type column, named value, that can hold arbitrary collections of fields. An external table definition for semi-structured data needs no further column definitions, only metadata such as the location of the data. For example:
When you query the external table, you can reference elements within the value column, like this:
SELECT value:name
  FROM product
  WHERE value:color = ‘Red’;
+------------+
| VALUE:NAME |
|------------|
| "Stapler"  |
+------------+
Since structured data has a more rigid layout, you must define table columns (technically, in Snowflake, these are referred to as “pseudocolumns”), corresponding to the fields in the data files, in terms of the value column. For example:
CREATE EXTERNAL TABLE customer (
    custkey number AS (value:custkey::number),
    name varchar AS (value:name::varchar),
    address varchar AS (value:address::varchar),
    nationkey number AS (value:nationkey::number),
    phone varchar AS (value:phone::varchar),
    acctbal number AS (value:acctbal::number),
    mktsegment varchar AS (value:mktsegment::varchar),
    comment varchar AS (value:comment::varchar)
  )
  LOCATION = @b2_stage/data/
  FILE_FORMAT = (TYPE = PARQUET)
  AUTO_REFRESH = false;
Once you’ve created the external table, you can write SQL statements to query the data stored externally, just as if it were inside a table in Snowflake:
SELECT phone
  FROM customer
  WHERE name = ‘Acme, Inc.’;
+----------------+
| PHONE          |
|----------------|
| "111-222-3333" |
+----------------+
Accessing Unstructured Data Stored in Backblaze B2 from Snowflake
The term “unstructured”, in this context, refers to data such as images, audio, and video, that cannot be defined in terms of a data model. You still need to create an external stage to access unstructured data located outside of Snowflake, but, rather than creating external tables and writing SQL queries, you typically access unstructured data from custom code running in Snowflake’s Snowpark environment.
Here’s an excerpt from a Snowflake user-defined function, written in Python, that loads an image file from an external stage:
from snowflake.snowpark.files import SnowflakeFile

# The file_path argument is a scoped Snowflake file URL to a file in the
# external stage, created with the BUILD_SCOPED_FILE_URL function.
# It has the form
# https://abc12345.snowflakecomputing.com/api/files/01b1690e-0001-f66c-...
def generate_image_label(file_path):

  # Read the image file
  with SnowflakeFile.open(file_path, 'rb') as f:
    image_bytes = f.readall()

  ...
In this example, the user-defined function reads an image file from an external stage, then runs an ML model on the image data to generate a label for the image according to its content. A Snowflake task using this user-defined function can insert rows into a table of image names and labels as image files are uploaded into a Backblaze B2 Bucket. You can learn more about this use case in particular, and loading unstructured data from Backblaze B2 into Snowflake in general, from the Backblaze Tech Day ‘23 session that I co-presented with Snowflake Product Manager Saurin Shah:
Choices, Choices: Where Should I Store My Data?
Given that, currently, Snowflake charges at least $23/TB/month for data storage on its platform compared to Backblaze B2 at $6/TB/month, it might seem tempting to move your data wholesale from Snowflake to Backblaze B2 and create external tables to replace tables currently residing in Snowflake. There are, however, a couple of caveats to mention: performance and egress costs.
The same query on the same dataset will run much more quickly against tables inside Snowflake than the corresponding external tables. A comprehensive analysis of performance and best practices for Snowflake external tables is a whole other blog post, but, as an example, one of my queries that completes in 30 seconds against a table in Snowflake takes three minutes to run against the same data in an external table.
Similarly, when you query an external table located in Backblaze B2, Snowflake must download data across the internet. Data formats such as Parquet can make this very efficient, organizing data column-wise and compressing it to minimize the amount of data that must be transferred. But, some amount of data still has to be moved from Backblaze B2 to Snowflake. Downloading data from Backblaze B2 is free of charge for up to 3x your average monthly data footprint, then $0.01/GB for additional egress, so there is a trade-off between data storage cost and data transfer costs for frequently-accessed data.
Some data naturally lives on one platform or the other. Frequently-accessed tables should probably be located in Snowflake. Media files, that might only ever need to be downloaded once to be processed by code running in Snowpark, belong in Backblaze B2. The gray area is large datasets that will only be accessed a few times a month, where the performance disparity is not an issue, and the amount of data transferred might fit into Backblaze B2’s free egress allowance. By understanding how you access your data, and doing some math, you’re better able to choose the right cloud storage tool for your specific tasks.
Sometimes you find a problem because something breaks, and other times you find a problem the good way—by thinking it through before things break. This is a story about one of those bright, shining, lightbulb moments when you find a problem the good way.
On the Backblaze Site Reliability Engineering (SRE) team, we were thinking through an upcoming datacenter migration in Cassandra. We were running through all of the various types of queries we would have to do when we had the proverbial “aha” moment. We discovered an inconsistency in the way Cassandra handles lightweight transactions (LWTs).
If you’ve ever tried to do a datacenter migration in Cassandra and something got corrupted in the process but you couldn’t figure out why or how—this might be why. I’m going to walk through a short intro on Cassandra, how we use it, and the issue we ran into. Then, I’ll explain the workaround, which we open sourced.
Get the Open Source Code
You can download the open source code from our Git repository. We’d love to know how you’re using it and how it’s working for you—let us know in the comments.
How We Use Cassandra
First, if you’re not a Cassandra dev, I should mention that when we say “datacenter migration” it means something slightly different in Cassandra than what it sounds like. It doesn’t mean a data center migration in the physical sense (although you can use datacenter migrations in Cassandra when you’re moving data from one physical data center to another). In the simplest terms, it involves moving data between two Cassandra or Cassandra-compatible database replica sets within a cluster.
And, if you’re not familiar with Cassandra at all, it’s an open-source, NoSQL, distributed database management system. It was created to handle large amounts of data across many commodity servers, so it fits our use case—lots of data, lots of servers.
At Backblaze, we use Cassandra to index filename to location for data stored in Backblaze B2, for example. Because it’s customer data and not just analytics, we care more about durability and consistency than some other applications of Cassandra. We run with three replicas in a single datacenter and “batch” mode to require writes to be committed to disk before acknowledgement rather than the default “periodic.”
Datacenter migrations are an important aspect of running Cassandra, especially on bare metal. We do a few datacenter migrations per year either for physical data moves, hardware refresh, or to change certain cluster layout parameters like tokens per host that are otherwise static.
What Are LWTs and Why Do They Matter for Datacenter Migrations in Cassandra?
First of all, LWTs are neither lightweight nor transactions, but that’s neither here nor there. They are an important feature in Cassandra. Here’s why.
Cassandra is great at scaling. In something like a replicated SQL cluster, you can add additional replicas for read throughput, but not writes. Cassandra scales writes (as well as reads) nearly linearly with the number of hosts—into the hundreds. Adding nodes is a fairly straightforward and “automagic” process as well, with no need to do something like manual token range splits. It also handles individual down nodes with little to no impact on queries. Unfortunately, these properties come with a trade-off: a complex and often nonintuitive consistency model that engineers and operators need to understand well.
In a distributed database like Cassandra, data is replicated across multiple nodes for durability and availability.
Although databases generally allow multiple reads and writes to be submitted at once, they make it look to the outside world like all the operations are happening in order, one at a time. This property is known as serializability, and Cassandra is not serializable. Although it does have a “last write wins” system, there’s no transaction isolation and timestamps can be identical.
It’s possible, for example, to have a row that has some columns from one write and other columns from another write. It’s safe if you’re only appending additional rows, but mutating existing rows safely requires careful design. Put another way, you can have two transactions with different data that, to the system, appear to have equal priority.
How Do LWTs Solve This Problem?
As a solution for cases where stronger consistency is needed, Cassandra has a feature called “Lightweight Transactions” or LWTs. These are not really identical to traditional database transactions, but provide a sort of “compare and set” operation that also guarantees pending writes are completed before answering a read. This means if you’re trying to change a row’s value from “A” to “B”, a simultaneous attempt to change that row from “A” to “C” will return a failure. This is accomplished by doing a full—not at all lightweight—Paxos round complete with multiple round trips and slow expensive retries in the event of a conflict.
In Cassandra, the minimum consistency level for read and write operations is ONE, meaning that only a single replica needs to acknowledge the operation for it to be considered successful. This is fast, but in a situation where you have one down host, it could mean data loss, and later reads may or may not show the newest write depending on which replicas are involved and whether they’re received the previous write. For better durability and consistency, Cassandra also provides various quorum levels that require a response from multiple replicas, as well as an ALL consistency that requires responses from every replica.
Cassandra Is My Type of Database
Curious to know more about consistency limitations and LWTs in Cassandra? Christopher Batey’s presentation at the 2016 Cassandra Summit does a good job of explaining the details.
The Problem We Found With LWTs During Datacenter Migrations
Usually we use one datacenter in Cassandra, but there are circumstances where we sometimes stand up a second datacenter in the cluster and migrate to it, then tear down the original. We typically do this either to change num_tokens, to move data when we’re refreshing hardware, or to physically move to another nearby data center.
The TL:DR
We reasoned through the interaction between LWTs/serial and datacenter migrations and found a hole—there’s no guarantee of LWT correctness during a topology change (that is, a change to the number of replicas) large enough to change the number of replicas needed to satisfy quorum. It turns out that combining LWTs and datacenter migrations can violate consistency guarantees in subtle ways without some specific steps and tools to work around it.
The Long Version
Let’s say you are standing up a new datacenter, and you need to copy an existing datacenter to it. So, you have two datacenters—datacenter A, the existing datacenter, and datacenter B, the new datacenter. Let’s say datacenter A has three replicas you need to copy for simplicity’s sake, and you’re using quorum writes to ensure consistency.
Refresher: What is Quorum-Based Consistency in Cassandra?
Quorum consistency in Cassandra is based on the concept that a specific number of replicas must participate in a read or write operation to ensure consistency and availability—a majority (n/2 +1) of the nodes must respond before considering the operation as successful. This ensures that the data is durably stored and available even if a minority of replicas are unavailable.
You have different types of quorum you can choose from, and here’s how those defaults make a decision:
Local quorum: Two out of the three replicas in the datacenter I’m talking to must respond in order to return success. I don’t care about the other datacenter.
Global quorum: Four out of the six total replicas must respond in order to return success, and it doesn’t matter which datacenter they come from.
Each quorum: Two out of the three replicas in each datacenter must respond in order to return success.
Most of these quorum types also have a serial equivalent for LWTs.
Type of Quorum
Serial
Regular
Local
LOCAL_SERIAL
LOCAL_QUORUM
Each
unsupported
EACH_QUORUM
Global
SERIAL
QUORUM
The problem you might run into, however, is that LWTs do not have an each_serial mode. They only have local and global. There’s no way to tell the LWT you want quorum in each datacenter.
local_serial is good for performance, but transactions on different datacenters could overlap and be inconsistent. serial is more expensive, but normally guarantees correctness as long as all queries agree on cluster size. But what if a query straddles a topology change that changes quorum size?
Let’s use global quorum to show how this plays out. If a LWT starts when RF=3, at least two hosts must process it.
While it’s running, the topology changes to two datacenters (A and B) each with RF=3 (so six replicas total) with a quorum of four. There’s a chance that a query affecting the same partition could then run without overlapping nodes, which means consistency guarantees are not maintained for those queries. For that query, quorum is four out of six where those four could be the three replicas in datacenter B and the remaining replica in datacenter A.
Those two queries are on the same partition, but they’re not overlapping any hosts, so they don’t know about each other. It violates the LWT guarantees.
The Solution to LWT Inconsistency
What we needed was a way to make sure that the definition of “quorum” didn’t change too much in the middle of a LWT running. Some change is okay, as long as old and new are guaranteed to overlap.
To account for this, you need to change the replication factor one level at a time and make sure there are no transactions still running that started before the previous topology change before you make the next. Three replicas with a quorum of two can only change to four replicas with a quorum of three. That way, at least one replica must overlap. The same thing happens when you go from four to five replicas or five to six replicas. This also applies when reducing the replication factor, such as when tearing down the old datacenter after everything has moved to the new one.
Then, you just need to make sure no LWT overlaps multiple changes. You could just wait long enough that they’ve timed out, but it’s better to be sure. This requires querying the internal-only system.paxos table on each host in the cluster between topology changes.
We built a tool that checks to see whether there are still transactions running from before we made a topology change. It reads system.paxos on each host, ignoring any rows with proposal_ballot=null, and records them. Then after a short delay, it re-reads system.paxos, ignoring any rows that weren’t present in the previous run, or any with proposal_ballot=null in either read, or any where in_progress_ballot has changed. Any remaining rows are potentially active transactions.
This worked well the first few times that we used it, on 3.11.6. To our surprise, when we tried to migrate a cluster running 3.11.10 the tool reported hundreds of thousands of long-running LWTs. After a lot of digging, we found a small (but fortunately well-commented) performance optimization added as part of a correctness fix (CASSANDRA-12126), which means proposal_ballot does not get set to null if the proposal is empty/noop. To work around this, we had to actually parse the proposal field. Fortunately all we need is the is_empty flag in the third field, so no need to reimplement the full parsing code. A big impact to us for a seemingly small and innocuous change piggy-backed onto a correctness fix, but that’s the risk of directly reading internal-only tables.
We’ve used the tool several times now for migrations with good results, but it’s still relatively basic and limited. It requires running repeatedly until all transactions are complete, and sometimes manual intervention to deal with incomplete transactions. In some cases we’ve been able to force-commit a long-pending LWT by doing a SERIAL read of the partition affected, but in a couple of cases we actually ended up running across LWTs that still didn’t seem to complete. Fortunately in every case so far it was in a temporary table and a little work allowed us to confirm that we no longer needed the partition at all and could just delete it.
Most people who use Cassandra may never run across this problem, and most of those who do will likely never track down what caused the small mystery inconsistency around the time they did a datacenter migration. If you rely on LWTs and are doing a datacenter migration, we definitely recommend going through the extra steps to guarantee consistency until and unless Cassandra implements an EACH_SERIAL consistency level.
Using the Tool
If you want to use the tool for yourself to help maintain consistency through datacenter migrations, you can find it here. Drop a note in the comments to let us know how it’s working for you and if you think of any other ways around this problem—we’re all ears!
If You’ve Made It This Far
You might be interested in signing up for our Developer Newsletter where our resident Chief Technical Evangelist, Pat Patterson, shares the latest and greatest ways you can use B2 Cloud Storage in your applications.
Since 2009, Backblaze has writtenextensivelyaboutthedatastorageservers we created and deployed which we call Backblaze Storage Pods. We not only wrote about our Storage Pods, we open sourced the design, published a parts list, and even provided instructions on how to build one. Many people did. Of the six storage pod versions we produced, four of them are still in operation in our data centers today. Over the last few years, we began using storage servers from Dell and, more recently, Supermicro, as they have proven to be economically and operationally viable in our environment.
Since 2013, we have also written extensively about our Drive Stats, sharing reports on the failure rates of the HDDs and SSDs in our legion of storage servers. We have examined the drive failure rates by manufacturer, size, age, and so on, but we have never analyzed the drive failure rates of the storage servers—until now. Let’s take a look at the Drive Stats for our fleet of storage servers and see what we can learn.
Storage Pods, Storage Servers, and Backblaze Vaults
Let’s start with a few definitions:
Storage Server: A storage server is our generic name for a server from any manufacturer which we use to store customer data. We use storage servers from Backblaze, Dell, and Supermicro.
Storage Pod: A Storage Pod is the name we gave to the storage servers Backblaze designed and had built for our data centers. The first Backblaze Storage Pod version was announced in September 2009. Subsequent versions are 2.0, 3.0, 4.0, 4.5, 5.0, 6.0, and 6.1. All but 6.1 were announced publicly.
Backblaze Vault: A Backblaze Vault is 20 storage servers grouped together for the purpose of data storage. Uploaded data arrives at a given storage server within a Backblaze Vault and is encoded into 20 parts with a given part being either a data blob or parity. Each of the 20 parts (shards) is then stored on one of the 20 storage servers.
As you review the charts and tables here are a few things to know about Backblaze Vaults.
There are currently six cohorts of storage servers in operation today: Supermicro, Dell, Backblaze 3.0, Backblaze 5.0, Backblaze 6.0, and Backblaze 6.1.
A given Vault will always be made up from one of the six cohorts of storage servers noted above. For example, Vault 1016 is made up of 20 Backblaze 5.0 Storage Pods and Vault 1176 is made of the 20 Supermicro servers.
A given Vault is made up of storage servers that contain the same number of drives as follows:
Dell servers: 26 drives.
Backblaze 3.0 and Backblaze 5.0 servers: 45 drives.
Backblaze 6.0, Backblaze 6.1, and Supermicro servers: 60 drives.
All of the hard drives in a Backblaze Vault will be logically the same size; so, 16TB drives for example.
Drive Stats by Backblaze Vault Cohort
With the background out of the way, let’s get started. As of the end of Q3 2023, there were a total of 241 Backblaze Vaults divided into the six cohorts, as shown in the chart below. The chart includes the server cohort, the number of Vaults in the cohort, and the percentage that cohort is of the total number of Vaults.
Vaults consisting of Backblaze servers still comprise 68% of the vaults in use today (shaded from orange to red), although that number is dropping as older Vaults are being replaced with newer server models, typically the Supermicro systems.
The table below shows the Drive Stats for the different Vault cohorts identified above for Q3 2023.
The Avg Age (months) column is the average age of the drives, not the average age of the Vaults. The two may seem to be related, that’s not entirely the case. It is true the Backblaze 3.0 Vaults were deployed first followed in order by the 5.0 and 6.0 Vaults, but that’s where things get messy. There was some overlap between the Dell and Backblaze 6.1 deployments as the Dell systems were deployed in our central Europe data center, while the 6.1 Vaults continued to be deployed in the U.S. In addition, some migrations from the Backblaze 3.0 Vaults were initially done to 6.1 Vaults while we were also deploying new drives in the Supermicro Vaults.
The AFR for each of the server versions does not seem to follow any pattern or correlation to the average age of the drives. This was unexpected because, in general, as drives pass about four years in age, they start to fail more often. This should mean that Vaults with older drives, especially those with drives whose average age is over four years (48 months), should have a higher failure rate. But, as we can see, the Backblaze 5.0 Vaults defy that expectation.
To see if we can determine what’s going on, let’s expand on the previous table and dig into the different drive sizes that are in each Vault cohort, as shown in the table below.
Observations for Each Vault Cohort
Backblaze 3.0: Obviously these Vaults have the oldest drives and, given their AFR is nearly twice the average for all of the drives (1.53%), it would make sense to migrate off of these servers. Of course the 6TB drives seem to be the exception, but at some point they will most likely “hit the wall” and start failing.
Backblaze 5.0: There are two Backblaze 5.0 drive sizes (4TB and 8TB) and the AFR for each is well below the average AFR for all of the drives (1.53%). The average age of the two drive sizes is nearly seven years or more. When compared to the Backblaze 6.0 Vaults, it would seem that migrating the 5.0 Vaults could wait, but there is an operational consideration here. The Backblaze 5.0 Vaults each contain 45 drives, and from the perspective of data density per system, they should be migrated to 60 drive servers sooner rather than later to optimize data center rack space.
Backblaze 6.0: These Vaults as a group don’t seem to make any of the five different drive sizes happy. Only the AFR of the 4TB drives (1.42%) is just barely below the average AFR for all of the drives. The rest of the drive groups are well above the average.
Backblaze 6.1: The 6.1 servers are similar to the 6.0 servers, but with an upgraded CPU and faster NIC cards. Is that why their annualized failure rates are much lower than the 6.0 systems? Maybe, but the drives in the 6.1 systems are also much younger, about half the age of those in the 6.0 systems, so we don’t have the full picture yet.
Dell: The 14TB drives in the Dell Vaults seem to be a problem at a 5.46% AFR. Much of that is driven by two particular Dell vaults which have a high AFR, over 8% for Q3. This appears to be related to their location in the data center. All 40 of the Dell servers which make up these two Vaults were relocated to the top of 52U racks, and it appears that initially they did not like their new location. Recent data indicates they are doing much better, and we’ll publish that data soon. We’ll need to see what happens over the next few quarters. That said, if you remove these two Vaults from the Dell tally, the AFR is a respectable 0.99% for the remaining Vaults.
Supermicro: This server cohort is mostly 16TB drives which are doing very well with an AFR of 0.62%. The one 14TB Vault is worth our attention with an AFR of 1.95%, and the 22TB Vault is too new to do any analysis.
Drive Stats by Drive Size and Vault Cohort
Another way to look at the data is to take the previous table and re-sort it by drive size. Before we do that let’s establish the AFR for the different drive sizes aggregated over all Vaults.
As we can see in Q3 the 6TB and 22TB Vaults had zero failures (AFR = 0%). Also, the 10TB Vault is indeed only one Vault, so there are no other 10TB Vaults to compare it to. Given this, for readability, we will remove the 6TB, 10TB, and 22TB Vaults from the next table which compares how each drive size has fared in each of the six different Vault cohorts.
Currently we are migrating the 4TB drive Vaults to larger Vaults, replacing them with drives of 16TB and above. The migrations are done using an in-house system which we’ll expand upon in a future post. The specific order of migrations is based on failure rates and durability of the existing 4TB Vaults with an eye towards removing the Backblaze 3.0 systems first as they are nearly 10 years old in some cases, and many of the non-drive replacement parts are no longer available. Whether we give away, destroy, or recycle the retired Backblaze 3.0 Storage Pods (sans drives) is still being debated.
For the 8TB drive Vaults, the Backblaze 5.0 Vaults are up first for migration when the time comes. Yes, their AFR is lower then the Backblaze 6.0 Vaults, but remember: the 5.0 Vaults are 45 drive units which are not as efficient storage density-wise versus the 60 drive systems.
Speaking of systems with less than 60 drives, the Dell servers are 26 drives. Those 26 drives are in a 2U chassis versus a 4U chassis for all of the other servers. The Dell servers are not quite as dense as the 60 drive units, but their 2U form factor gives us some flexibility in filling racks, especially when you add utility servers (1U or 2U) and networking gear to the mix. That’s one of the reasons the two Dell Vaults we noted earlier were moved to the top of the 52U racks. FYI, those two Vaults hold 14TB drives and are two of the four 14TB Dell Vaults making up the 5.46% AFR. The AFR for the Dell Vaults with 12TB and 16TB drives is 0.76% and 0.92% respectively. As noted earlier, we expect the AFR for 14TB Dell Vaults to drop over the coming months.
What Have We Learned?
Our goal today was to see what we can learn about the drive failure rates of the storage servers we use in our data centers. All of our storage servers are grouped in operational systems we call Backblaze Vaults. There are six different cohorts of storage servers with each vault being composed of the same type of storage server, hence there are six types of vaults.
As we dug into data, we found that the different cohorts of Vaults had different annualized failure rates. What we didn’t find was a correlation between the age of the drives used in the servers and the annualized failure rates of the different Vault cohorts. For example, the Backblaze 5.0 Vaults have a much lower AFR of 0.99% versus the Backblaze 6.0 Vault AFR at 2.14%—even though the drives in the 5.0 Vaults are nearly twice as old on average than the drives in the 6.0 Vaults.
This suggests that while our initial foray into the annualized failure rates of the different Vault cohorts is a good first step, there is more to do here.
Where Do We Go From Here?
In general, all of the Vaults in a given cohort were manufactured to the same specifications, used the same parts, and were assembled using the same processes. One obvious difference is that different drive models are used in each Vault cohort. For example, the 16TB vaults are composed of seven different drive models. Do some drive models work better in one Vault cohort versus another? Over the next couple of quarters we’ll dig into the data and let you know what we find. Hopefully it will add to our understanding of the annualized failures rates of the different Vault cohorts. Stay tuned.
There’s only one truth you need to know about tech: at some point, it will fail. Hard drives die. You get the blue screen of death the day of the big presentation. You lose cell service right when your mom calls. (Or maybe you pretend to lose service right when your mom calls. We won’t judge.) Whatever it is, we’ve all been there.
If you use network attached storage (NAS) for your business or at home, you’re probably well aware of this fact. The redundancy you get from a solid RAID configuration might be one of the reasons you invested in a NAS—to prepare for inevitable drive failures. NAS devices are a great investment for a business for their durability and reliability, but there are things you can do to extend the lifespan of your NAS and get even more out of your investment.
Extending the lifespan of a NAS system isn’t just about preventing hardware failures; it’s crucial for ensuring uninterrupted access to critical data while maximizing ROI on your IT investments. In this blog, you’ll learn about the key factors that influence NAS longevity and get real-world strategies to strengthen and optimize your NAS infrastructure.
Understanding NAS Lifespan
Today’s NAS devices offer faster processing, enhanced performance, and significantly larger storage capabilities than ever before. These technological advancements have paved the way for efficient local data management using NAS in both professional and personal settings.
Despite these advancements, it’s important to acknowledge that NAS devices tend to have a finite lifespan. This limitation is due to several factors, including the physical wear and tear of hardware components, ever-evolving software requirements, and the constant advancement of technology which can render older systems less efficient or incompatible with new standards.
Also, it’s crucial to differentiate between the life expectancy of a NAS device and that of the hard drives within the device. While the NAS itself may continue to function, the hard drives that are subjected to intense read/write operations often have a shorter lifespan. If you want to learn more about hard drive reliability and failure rates, refer to Backblaze’s Hard Drive Stats.
Key Factors Affecting NAS Longevity
From the quality of the hardware to the environment it operates in, multiple elements contribute to the lifespan of NAS. Let’s explore these key factors in detail:
1. Hardware Components: Quality and Durability
One of the key factors that heavily affects the NAS device is the quality of the hardware itself. Additionally, factors such as the processor, memory, and power unit also play crucial roles. High-quality hardware and components from reputable manufacturers tend to last longer and offer better performance and reliability which contribute to the overall lifespan of the NAS.
2. Workload and Usage Intensity
The workload handled by the NAS is a significant determinant of its longevity. Devices that are constantly under heavy load, managing large data transfers, or running intensive applications will likely experience wear and tear more rapidly than those used for lighter tasks.
3. Environmental Factors: Temperature, Humidity, and Corrosion
Operating a NAS in environments with high temperatures or humidity levels can lead to overheating and moisture-related damage. Additionally, locations with high levels of dust or corrosive elements can lead to physical deterioration of components.
4. Quality of Network Environment
The quality and stability of the network environment in which the NAS operates can also affect its lifespan. Frequent network issues or unstable connections can strain the NAS’s hardware and software, potentially leading to earlier failures.
5. Support, Technological Advancements, and Compatibility
Ongoing support and compatibility with new technologies are also vital for the longevity of NAS systems. As technology evolves, older NAS devices may struggle with compatibility issues, rendering them less efficient or even obsolete.
Maintenance and Care for Enhanced Lifespan
Now that we understand the factors that affect NAS longevity, let’s explore how proactive maintenance and care are crucial to extending its lifespan. There are a number of things you can do to keep your NAS functioning properly for the long haul:
Regular Maintenance: Routine cleaning is vital for maintaining NAS efficiency. Dust accumulation can lead to overheating. Regularly cleaning the external vents and fans, and ensuring the device is in a well-ventilated area can prevent thermal issues and prolong the device’s life.
Proactive Drive Replacements: Hard drives are among the most failure-prone components in a NAS. Implementing a regular schedule to check drive health and replacing unhealthy or borderline drives proactively can prevent data loss and reduce the workload on the NAS’s remaining drives, thus preserving its overall integrity.
Updating Software and Patches: Keeping the NAS software and firmware up to date is essential for security and performance. Regular updates often include patches for vulnerabilities, performance enhancements, and new features that can improve the efficiency and longevity of the NAS.
Monitoring NAS Health: Utilizing the tools and built-in functionalities to monitor the health and performance of your NAS also helps extend its lifespan. Many NAS systems come with software that can alert you to issues such as failing drives, high temperatures, or network problems. Keeping an eye on these metrics can help you address potential problems before they escalate.
Environmental Considerations: The operating environment of a NAS plays a significant role in NAS longevity. Keeping your NAS in a stable environment with controlled temperature and humidity levels should be considered to extend its lifespan.
Power Protection: Protect your NAS from power surges and outages using uninterrupted power supply (UPS). This can not only prevent data loss but also help avoid any potential hardware damage caused by electrical issues.
The CyberPower 900 AVR is just one example of a UPS. Source.
Recognizing When to Replace the NAS: Look out for indicators that suggest it’s time to replace your NAS. These include the expiration of the manufacturer’s warranty, noticeable performance declines, increased frequency of repairs, or when the device no longer meets your evolving storage needs. Waiting until a complete failure can be more costly and disruptive.
By adhering to these maintenance and care guidelines, you can significantly enhance the lifespan and reliability of your NAS, ensuring that it continues to serve as a robust and efficient data storage solution for your business or personal needs.
Implementing Fault Tolerance and Off-Loading Data to Cloud
In addition to proactive maintenance and care, there are a few other strategies you can use to extend NAS lifespan such as implementing fault tolerance and adding cloud storage to your backup strategy to offload data from your NAS. Let’s explore them below.
The Importance of Fault Tolerance and RAID Configurations in NAS
Fault tolerance refers to the ability of a NAS to continue operating correctly even if one or more of its hard drives fail. It’s critical for NAS systems to have fault tolerance in place, especially in business environments where data availability and integrity can not be compromised.
RAID (Redundant Array of Independent Disks) plays a pivotal role in achieving fault tolerance. It involves combining multiple hard drives into a single system to improve data redundancy and performance. By doing so, RAID protects against data loss due to single or multiple disk failures, depending on the RAID level implemented.
RAID 5: Striping and parity distributed across disks.
RAID Configurations
Various RAID configurations offer different balances of data protection, storage efficiency, and performance. Common configurations include RAID 0 (striping), RAID 1 (mirroring), RAID 5 and RAID 6, each with its specific advantages and use cases. For example, RAID 1 is simple and offers data redundancy, while RAID 5 and 6 provide a good balance between storage capacity and data protection. To fully understand which RAID configuration suits your needs, explore our NAS RAID Levels blog which explains how to choose the right RAID level for your NAS data.
Off-Loading and Backing Up NAS Data to the Cloud
Off-loading data from your NAS to a cloud storage service can significantly reduce the workload on your NAS hardware, thus potentially extending its life. You can consider creating a cloud archive of old data and a system for off-loading data on a regular cadence or as projects close.
The cloud also helps you establish a robust 3-2-1 backup strategy (three total copies of your data, two of which are local but on different mediums, and one copy off-site). This ensures data redundancy and offers enhanced data protection against local disasters, theft, or hardware failure. Many NAS devices, like Synology and QNAP, have built-in backup utilities that back up directly to cloud storage like Backblaze B2.
By integrating fault tolerance through RAID configurations and backing up data to the cloud, you can significantly enhance the data protection capabilities of your NAS. This approach not only ensures data safety but also contributes to the overall health and longevity of your NAS system.
Extending Your NAS Lifespan
Navigating the complexities of NAS systems can be a journey full of learning and adaptation. While NAS offers unparalleled convenience of local storage, it’s essential to recognize that its longevity relies on more than just its initial setup. It requires a proactive approach with diligent maintenance while embracing technological advancements such as fault tolerance and RAID levels. When properly cared for, however, many users find NAS to be a long-lived piece of their tech stack.
But, it doesn’t have to stop there. The integration of cloud storage with NAS systems can significantly help reduce the strain on your local system, and safeguard your NAS data off-site while ensuring you have comprehensive 3-2-1 data protection in place.
It’s time to hear from you. What strategies have you employed to extend the lifespan of your NAS device? Share your stories and tips in the comments below to help others in the NAS community.
At the end of Q3 2023, Backblaze was monitoring 263,992 hard disk drives (HDDs) and solid state drives (SSDs) in our data centers around the world. We’ve reported on those drives for many years. But, all the data on those drives needs to somehow get from your devices to our storage servers. You might be wondering, “How does that happen?” and “Where does that happen?” Or, more likely, “How fast does that happen?”
These are all questions we want to start to answer.
Welcome to our new Backblaze Network Stats series, where we’ll explore the world of network connectivity and how we better serve our customers, partners, and the internet community at large. We hope to share our challenges, initiatives, and engineering perspective as we build the open cloud with our Partners.
In this first post, we will explore two issues: how we connect our network with the internet and the distribution of our peering traffic. As we expand this series, we hope to capture and share more metrics and insights.
Nice to Meet You; I’m Brent
Since this is the first time you’re hearing from me, I thought I should introduce myself. I’m a Senior Network Engineer here at Backblaze. The Network Engineering group is responsible for ensuring the reliability, capacity, and security of network traffic.
My interest in computer networking began in my childhood when I first persuaded my father to upgrade our analog modem to a ISDN line by providing a financial comparison of time sink due to large download times I was conducting (nothing like using all the family dial-up time to download multi-megabyte SimCity 2000 and Doom customizations). Needless to say, I’m still interested in those same types of networking metrics, and that’s why I’m here sharing them with you at Backblaze.
First, Some Networking Basics
If you’ve ever heard folks joke about the internet being a series of tubes, well, it may be widely mocked, but it’s not entirely wrong. The internet as we know it is fundamentally a complex network of all the computers on the planet. Whenever we’re typing in an internet address into a web browser, we’re basically giving our computer the address of a computer (or server, etc.) to locate, and that computer will hopefully display data to you that it’s storing.
Of course, it’s not a free-for-all. Internet protocols like TLS/SSL are the boundaries that set the rules for how computers communicate, and networks allow different levels of access to outsiders. Internet service providers (ISPs) are defined and regulated, and we’ll outline some of those roles and how Backblaze interacts with them below. But, all that communication between computers has to be powered by hardware, which is why, at one point, we actually had to solve the problem of sharks attacking the internet. Good news: since 2006, sharks have accounted for less than one percent of fiber optic cable attacks.
Wireless internet has largely made this connectivity invisible to consumers, but the job of Wi-Fi is to broadcast a short-range network that connects you to this series of cables and “tubes.” That’s why when you’re transmitting or storing larger amounts of data, you typically get better speeds when you use a wired connection. (A good consumer example: setting up NAS devices works better with an ethernet cable.)
When you’re talking about storing and serving petabytes of data for a myriad of use cases, then you have to create and use different networks to connect to the internet effectively. Think of it like water: both a fire hose and your faucet are connected to utility lines, but they have to move different amounts of water, so they have different kinds of connections to the main utility.
And, that brings us to peering, the different levels of internet service providers, and many, many more things that Backblaze Network Engineers deal with from both a hardware and a software perspective on a regular basis.
What Is Peering?
Peering on the internet is akin to building direct express lanes between neighborhoods. Instead of all data (residents) relying on crowded highways (public internet), networks (neighborhoods) establish peering connections—dedicated pathways connecting them directly. This allows data to travel faster and more efficiently, reducing congestion and delays. Peering is like having exclusive lanes, streamlining communication between networks and enhancing the overall performance of the internet “transportation” system.
We connect to various types of networks to help move your data. I’ll explain the different types below.
The Bit Exchange
Every day we move multiple petabytes of traffic between our internet connectivity points and our scalable data center fabric layer to be delivered to either our SSD caching layer (what we call a “shard stash”) or spinning hard drives for storage.
Our data centers are connected to the world in three different ways.
1. Direct Internet Access (DIA)
The most common way we reach everyone is via a DIA connection with a Tier 1 internet service provider. These connections give us access to long-haul, high-capacity fiber infrastructure that spans continents and oceans. Connecting to a Tier 1 ISP has the advantage of scale and reach, but this scale comes at a cost—we may not have the best path to our customers.
If we draw out the hierarchy of networks that we have to traverse to reach you, it would look like a series of geographic levels (Global, Regional, and Local). The Tier 1 ISPs would be positioned at the top, leasing bandwidth on their networks to smaller Tier 2 and Tier 3 networks, which are closer to our customer’s home and office networks.
How we get from B to C (Backblaze to customer).
Since our connections to the Tier 1 ISPs are based on leased bandwidth, we pay based on how much data we transfer. The bill grows the more we transfer. There are commitments and overage charges, and the relationship is more formal since a Tier 1 ISP is a for-profit company. Sometimes you just want unlimited bandwidth, and that’s where the role of the internet exchange (IX) helps us.
2. Internet Exchange (IX)
We always want to be as close to the client as possible and our next connectivity option allows us to join a community of peers that exchange traffic more locally. Peering with an IXmeans that network traffic doesn’t have to bubble up to a Tier 1 National ISP to eventually reach a regional network. If we are on an advantageous IX, we transfer data locally inside a data center or within the same data center campus, thus reducing latency and improving the overall experience.
Benefits of an IX, aka the “Unlimited Plan,” include:
Paying a flat rate per month to get a fiber connection to the IX equipment versus paying based on how much data we transfer.
No price negotiation based on bandwidth transfer rates.
No overage charges.
Connectivity to lower tiered networks that are closer to consumer and business networks.
Participation helps build a more egalitarian internet.
In short, we pay a small fee to help the IX remain financially stable, and then we can exchange as much or as little traffic as we want.
Our network connectivity standard is to connect to multiple Tier 1 ISPs and a localized IX at every location to give us the best of both solutions. Every time we have to traverse a network, we’re adding latency and increasing the total amount of time for a file to upload or download. Internet routing prefers the shortest path, so if we have a shorter (faster) way to reach you, we will talk over the IX versus the Tier 1 network.
Less is more—the fewer networks between us and you, the better.
3. Private Network Interconnect (PNI)
The most direct and lowest latency way for us to exchange traffic is with a PNI. This option is used for direct fiber connections within the same data center or metro region to some of our specific partners like Fastly and Cloudflare. Our edge routing equipment—that is, the appliances that allow us to connect our internal network to external networks—is connected directly to our partner’s edge routing equipment. To go back to our neighborhood analogy, this would be if you and your friend put a gate in the fences that connect your backyards. With a PNI, the logical routing distance between us and our partners is the best it can be.
IX Participation
Personally, the internet exchange path is the most exciting for me as a network engineer. It harkens back to the days of the early internet (IX points began as Network Access Points and were a key component of Al Gore’s National Information Infrastructure (NII) plan way back in 1991), and the growth of an IX feels communal, as people are joining to help the greater whole. When we add our traffic to an IX as a new peer, it increases participation, further strengthening the advantage of contributing to the local IX and encouraging more organizations to join.
Backblaze Joins the Equinix Silicon Valley (SV1) Internet Exchange
Our San Jose data center is a major point of presence (PoP) (that is, a point where a network connects to the internet) for Backblaze, with the site connecting us in the Silicon Valley region to many major peering networks.
In November, we brought up connectivity to Equinix IX peering exchange in San Jose, bringing us closer to 278 peering networks at the time of publishing. Many of the networks that participate on this IX are very logically close to our customers. The participants are some of the well known ISPs that serve homes, offices, and business in the region, including Comcast, Google Fiber, Sprint, and Verizon.
Now, for the Stats
As soon as we turned up the connection, 26% inbound traffic that was being sent to our DIA connections shifted to the local Equinix IX, as shown in the pie chart below.
Before: 98% direct internet access (DIA); 2% private network interconnect (PNI). After: 72% DIA; 2% PNI; 26% internet exchange (IX).
The below graph shows our peering traffic load over the edge router and how immediately the traffic pattern changed as soon as we brought up the peer. Green indicates inbound traffic, while yellow shows outbound traffic. It’s always exciting to see a project go live with such an immediate reaction!
To give you an idea of what we mean by better network proximity, let’s take a look at our improved connectivity to Google Fiber. Here’s a diagram of the three pathways that our edge routers see that show how to get to Google Fiber. With the new IX connection, we see a more advantageous path and pick that as our method to exchange traffic. We no longer have to send traffic to the Tier 1 providers and can use them as backup paths.
Taking faster local roads.
What Does This Mean for You?
We here at Backblaze are always trying to improve the performance and reliability of our storage platform while scaling up. We monitor our systems for inefficiencies, and improving the network components is one way that we can deliver a better experience.
By joining the Equinix SV1 peering exchange, we shorten the number of network hops that we have to transit to communicate with you. And that reduces latency, speeding up your backup job upload, allowing for faster image download, or supporting Partners.
Cheers from the NetEng team! We’re excited to start this series and bring you more content as our solutions evolve and grow. Some of the coverage we hope to share in the future includes analyzing our proximity to our peers and Partners, how we can improve those connections further, and stats to show the amount of bits per second that we process in our data centers to ensure that we not only have a file, but all the related redundancy shard components related to it. So, stay tuned!
Backblaze compute partner CoreWeave is a specialized GPU cloud provider designed to power use cases such as AI/ML, graphics, and rendering up to 35x faster and for 80% less than generalized public clouds. Brandon Jacobs, an infrastructure architect at CoreWeave, joined us earlier this year for Backblaze Tech Day ‘23. Brandon and I co-presented a session explaining both how to backup CoreWeave Cloud storage volumes to Backblaze B2 Cloud Storage and how to load a model from Backblaze B2 into the CoreWeave Cloud inference stack.
Since we recently published an article covering the backup process, in this blog post I’ll focus on loading a large language model (LLM) directly from Backblaze B2 into CoreWeave Cloud.
Below is the session recording from Tech Day; feel free to watch it instead of, or in addition to, reading this article.
More About CoreWeave
In the Tech Day session, Brandon covered the two sides of CoreWeave Cloud:
Model training and fine tuning.
The inference service.
To maximize performance, CoreWeave provides a fully-managed Kubernetes environment running on bare metal, with no hypervisors between your containers and the hardware.
CoreWeave provides a range of storage options: storage volumes that can be directly mounted into Kubernetes pods as block storage or a shared file system, running on solid state drives (SSDs) or hard disk drives (HDDs), as well as their own native S3 compatible object storage. Knowing that, you’re probably wondering, “Why bother with Backblaze B2, when CoreWeave has their own object storage?”
The answer echoes the first few words of this blog post—CoreWeave’s object storage is a specialized implementation, co-located with their GPU compute infrastructure, with high-bandwidth networking and caching. Backblaze B2, in contrast, is general purpose cloud object storage, and includes features such as Object Lock and lifecycle rules, that are not as relevant to CoreWeave’s object storage. There is also a price differential. Currently, at $6/TB/month, Backblaze B2 is one-fifth of the cost of CoreWeave’s object storage.
So, as Brandon and I explained in the session, CoreWeave’s native storage is a great choice for both the training and inference use cases, where you need the fastest possible access to data, while Backblaze B2 shines as longer term storage for training, model, and inference data as well as the destination for data output from the inference process. In addition, since Backblaze and CoreWeave are bandwidth partners, you can transfer data between our two clouds with no egress fees, freeing you from unpredictable data transfer costs.
Loading an LLM From Backblaze B2
To demonstrate how to load an archived model from Backblaze B2, I used CoreWeave’s GPT-2 sample. GPT-2 is an earlier version of the GPT-3.5 and GPT-4 LLMs used in ChatGPT. As such, it’s an accessible way to get started with LLMs, but, as you’ll see, it certainly doesn’t pass the Turing test!
This sample comprises two applications: a transformer and a predictor. The transformer implements a REST API, handling incoming prompt requests from client apps, encoding each prompt into a tensor, which the transformer passes to the predictor. The predictor applies the GPT-2 model to the input tensor, returning an output tensor to the transformer for decoding into text that is returned to the client app. The two applications have different hardware requirements—the predictor needs a GPU, while the transformer is satisfied with just a CPU, so they are configured as separate Kubernetes pods, and can be scaled up and down independently.
Since the GPT-2 sample includes instructions for loading data from Amazon S3, and Backblaze B2 features an S3 compatible API, it was a snap to modify the sample to load data from a Backblaze B2 Bucket. In fact, there was just a single line to change, in the s3-secret.yaml configuration file. The file is only 10 lines long, so here it is in its entirety:
As you can see, all I had to do was set the serving.kubeflow.org/s3-endpoint metadata annotation to my Backblaze B2 Bucket’s endpoint and paste in an application key and its ID.
While that was the only Backblaze B2-specific edit, I did have to configure the bucket and path where my model was stored. Here’s an excerpt from gpt-s3-inferenceservice.yaml, which configures the inference service itself:
apiVersion: serving.kubeflow.org/v1alpha2
kind: InferenceService
metadata:
  name: gpt-s3
  annotations:
    # Target concurrency of 4 active requests to each container
    autoscaling.knative.dev/target: "4"
    serving.kubeflow.org/gke-accelerator: Tesla_V100
spec:
  default:
    predictor:
      minReplicas: 0 # Allow scale to zero
      maxReplicas: 2
      serviceAccountName: s3-sa # The B2 credentials are retrieved from the service account
      tensorflow:
        # B2 bucket and path where the model is stored
        storageUri: s3://<my-bucket>/model-storage/124M/
        runtimeVersion: "1.14.0-gpu"
        ...
Aside from storageUri configuration, you can see how the predictor application’s pod is configured to scale from between zero and two instances (“replicas” in Kubernetes terminology). The remainder of the file contains the transformer pod configuration, allowing it to scale from zero to a single instance.
Running an LLM on CoreWeave Cloud
Spinning up the inference service involved a kubectl apply command for each configuration file and a short wait for the CoreWeave GPU cloud to bring up the compute and networking infrastructure. Once the predictor and transformer services were ready, I used curl to submit my first prompt to the transformer endpoint:
% curl -d '{"instances": ["That was easy"]}' http://gpt-s3-transformer-default.tenant-dead0a.knative.chi.coreweave.com/v1/models/gpt-s3:predict
{"predictions": ["That was easy for some people, it's just impossible for me,\" Davis said. \"I'm still trying to" ]}
In the video, I repeated the exercise, feeding GPT-2’s response back into it as a prompt a few times to generate a few paragraphs of text. Here’s what it came up with:
“That was easy: If I had a friend who could take care of my dad for the rest of his life, I would’ve known. If I had a friend who could take care of my kid. He would’ve been better for him than if I had to rely on him for everything.
The problem is, no one is perfect. There are always more people to be around than we think. No one cares what anyone in those parts of Britain believes,
The other problem is that every decision the people we’re trying to help aren’t really theirs. If you have to choose what to do”
If you’ve used ChatGPT, you’ll recognize how far LLMs have come since GPT-2’s release in 2019!
Run Your Own Large Language Model
While CoreWeave’s GPT-2 sample is an excellent introduction to the world of LLMs, it’s a bit limited. If you’re looking to get deeper into generative AI, another sample, Fine-tune Large Language Models with CoreWeave Cloud, shows how to fine-tune a model from the more recent EleutherAI Pythia suite.
Since CoreWeave is a specialized GPU cloud designed to deliver best-in-class performance up to 35x faster and 80% less expensive than generalized public clouds, it’s a great choice for workloads such as AI, ML, rendering, and more, and, as you’ve seen in this blog post, easy to integrate with Backblaze B2 Cloud Storage, with no data transfer costs. For more information, contact the CoreWeave team.
Two announcements had the Backblaze #social Slack channel blowing up this week, both related to “Storage Technologies of the Future.” The first reported “Video of Ceramic Storage System Surfaces Online” like some kind of UFO sighting. The second, somewhat more restrained announcement heralded the release of DNA storage cards available to the general public. Yep, you heard that right—coming to a Best Buy near you. (Not really. You absolutely have to special order these babies, but they ARE going to be for sale.)
We talked about DNA storage way back in 2015. It’s been nine years, so we thought it was high time to revisit the tech and dig into ceramics as well. (Pun intended.)
What Is DNA Storage?
The idea is elegant, really. What is DNA if not an organic, naturally occuring form of code?
DNA consists of four nucleotide bases: adenine (A), thymine (T), cytosine (C), and guanine (G).
In DNA storage, information is encoded into sequences of these nucleotide bases. For example, A and C might represent 0, while T and G represent 1. This encoding allows digital data, such as text, images, or other types of information, to be translated into DNA sequences. Cool!
The appeal of DNA as a storage medium lies in its density and stability, as well as its ability to store vast amounts of information in a very compact space. It also boasts remarkable durability, with the ability to preserve information for thousands of years under suitable conditions. I mean, leave it to Mother Nature to put our silly little hard drives to shame.
Back in 2015, we shared that the storage density of DNA was about 2.2 petabytes per gram. In 2017, a study out of Columbia University and the New York Genome Center put it at an incredible 215 petabytes per gram. For comparison’s sake, a WDC 22TB drive (WDC WUH722222ALE6L4) that we currently use in our data centers is 1.5 pounds or 680 grams, which nets out at 0.032TB/gram or 0.000032PB/gram.
Another major advantage is its sustainability. Estimated global data center electricity consumption in 2022 was 240–340 TWh1, or around 1–1.3% of global final electricity demand. Current data storage technology uses rare earth metals which are environmentally damaging to mine. Drives take up space, and they also create e-waste at the end of their lifecycle. It’s a challenge anyone who works in the data storage industry thinks about a lot.
DNA storage, on the other hand, requires less energy. A 2023 study found that data writing can be achieved in the DNA movable-type storage system under normal operating temperatures ranging from about 60–113°F and can be stored at room temperature. DNA molecules are also biodegradable and can be broken down naturally.
The DNA data-writing process is chemical-based, and actually not the most environmentally friendly, but the DNA storage cards developed by Biomemory use a proprietary biosourced writing process, which they call “a significant advancement over existing chemical or enzymatic synthesis technologies.” So, there might be some trade-offs, but we’ll know more as the technology evolves.
What’s the Catch?
Density? Check. Durability? Wow, yeah. Sustainability? You got it. But DNA storage is still a long way from sitting on your desk, storing your duplicate selfies. First, and we said this back in 2015 too, DNA takes a long time to read and write—DNA synthesis writes at a few hundred bytes per second. An average iPhone photo would take several hours to write to DNA. And to read it, you have to sequence the DNA—a time-intensive process. Both of those processes require specialized scientific equipment.
It’s also still too expensive. In 2015, we found a study that put 83 kilobytes of DNA storage at £1000 (about $1,500 U.S. dollars). In 2021, MIT estimated it would cost about $1 trillion to store one petabyte of data on DNA. For comparison, it costs $6,000 per month to store one petabyte in Backblaze B2 Cloud Storage ($6/TB/month). You could store that petabyte for a little over 13 million years before you’d hit $1 trillion.
Today, Biomemory’s DNA storage cards ring in at a cool €1000 (about $1,080 U.S. dollars). And they can hold a whopping one kilobyte of data or the equivalent of a short email. So, yeah …it’s ahh, gotten even more expensive for the commercial product.
The discrepancy between the MIT theoretical estimate and the cost of the Biomemory cards really speaks to the expense of bringing a technology like this to market. The theoretical cost per byte is a lot different than the operational cost, and the Biomemory cards are really meant to serve as proof of concept. All that said, as the technology improves, one can only hope that it becomes more cost-effective in the future. Folks are experimenting with different encoding schemes to make writing and reading more efficient, as one example of an advance that could start to tip the balance.
Finally, there’s just something a bit spooky about using synthetic DNA to store data. There’s a Black Mirror episode in there somewhere. Maybe one day we can upload kung fu skills directly into our brain domes and that would be cool, but for now, it’s still somewhat unsettling.
What Is Ceramic Storage?
Ceramic storage makes an old school approach new again, if you consider that the first stone tablets were kind of the precursor to today’s hard drives. Who’s up for storing some cuneiform?
Cerabyte, the company behind the “video that surfaced online,” is working on storage technology that uses ceramic and glass substrates in devices the size of a typical HDD that can store 10 petabytes of data. They use a glass base similar to Gorilla Glass by Corning topped with a layer of ceramic 300 micrometers thick that’s essentially etched with lasers. (Glass is used in many larger hard drives today, for what it’s worth. Hoya makes them, for example.) The startup debuted a fully operational prototype system using only commercial off-the-shelf equipment—pretty impressive.
The prototype consists of a single read-write rack and several library racks. When you want to write data, it moves one of the cartridges from the library to the read-write rack where it is opened to expose and stage the ceramic substrate. Two million laser beamlets then punch nanoscale ones and zeros into the surface. Once the data is written, the read-write arm verifies it on the return motion to its original position.
Cerabyte isn’t the only player in the game. Others like MDisc use similar technology. Currently, MDisc stores data on DVD-sized disks using a “rock-like” substrate. Several DVD player manufacturers have included the technology in players.
Similar to DNA storage, ceramic storage boasts much higher density than current data storage tech—terabytes per square centimeter versus an HDD’s 0.02TB per square centimeter. Also like DNA storage, it’s more environmentally friendly. Ceramic and glass can be stored within a wide temperature range between -460°F–570°F, and it’s a natural material that will last millennia and eventually decompose. It’s also incredibly durable: Cerabyte claims it will last 5000+ years, and with tons of clay pots still laying around from ancient times, that makes sense.
One advantage it has on DNA storage though is speed. One laser pulse writes up to 2,000,000 bits, so data can be written at GBps speeds.
What’s the Catch?
Ceramic also has density, sustainability, and speed to boot, but our biggest question is: who’s going to need that speed? There are only a handful of applications, like AI, that require that speed now. AI is certainly having a big moment, and it can only get bigger. So, presumably there’s a market, but only a small one that can justify the cost.
One other biggie, at least for a cloud storage provider like us, though not necessarily for consumers or other enterprise users: it’s a write-once model. Once it’s on there, it’s on there.
Finally, much like DNA tech, it’s probably (?) still too expensive to make it feasible for most data center applications. Cerabyte hasn’t released pricing yet. According to Blocks & Files, “The cost roadmap is expected to offer cost structures below projections of current commercial storage technologies.” But it’s still a big question mark.
Our Hot Take
Both of these technologies are really cool. They definitely got our storage geek brains fired up. But until they become scalable, operationally feasible, and cost-effective, you won’t see them in production—they’re still far enough out that they’re on the fiction end of the science fiction to science fact spectrum. And there are a couple roadblocks we see before they reach the ubiquity of your trusty hard drive.
The first is making both technologies operational, not just theoretical in a lab. We’ll know more about both Biomemory’s and Cerabyte’s technologies as they roll out these initial proof of concept cards and prototype machines. And both have plans, naturally, for scaling the technologies to the data center. Whether they can or not remains to be seen. Lots of technologies have come and gone, falling victim to the challenges of production, scaling, and cost.
The second is the attendant infrastructure needs. Getting 100x speed is great, if the device is right next to you. But we’ll need similar leaps in physical networking infrastructure to transfer the data anywhere else. Until that catches up, the tech remains lab-bound.
All that said, I still remember using floppy disks that held mere megabytes of data, and now you can put 20TB on a hard disk. So, I guess the question is, how long will it be before I can plug into the Matrix?
To provide the best experiences, we use technologies like cookies to store and/or access device information. Consenting to these technologies will allow us to process data such as browsing behavior or unique IDs on this site. Not consenting or withdrawing consent, may adversely affect certain features and functions.
Functional
Always active
The technical storage or access is strictly necessary for the legitimate purpose of enabling the use of a specific service explicitly requested by the subscriber or user, or for the sole purpose of carrying out the transmission of a communication over an electronic communications network.
Preferences
The technical storage or access is necessary for the legitimate purpose of storing preferences that are not requested by the subscriber or user.
Statistics
The technical storage or access that is used exclusively for statistical purposes.The technical storage or access that is used exclusively for anonymous statistical purposes. Without a subpoena, voluntary compliance on the part of your Internet Service Provider, or additional records from a third party, information stored or retrieved for this purpose alone cannot usually be used to identify you.
Marketing
The technical storage or access is required to create user profiles to send advertising, or to track the user on a website or across several websites for similar marketing purposes.


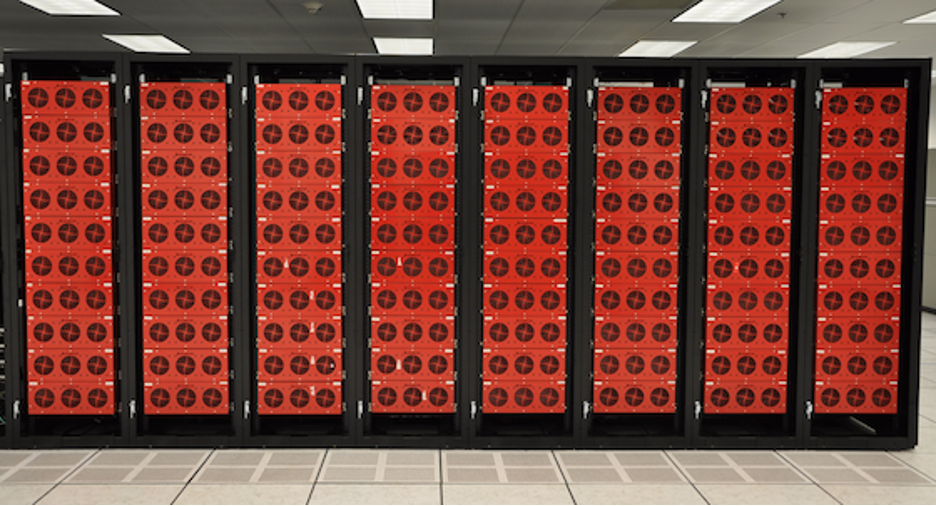
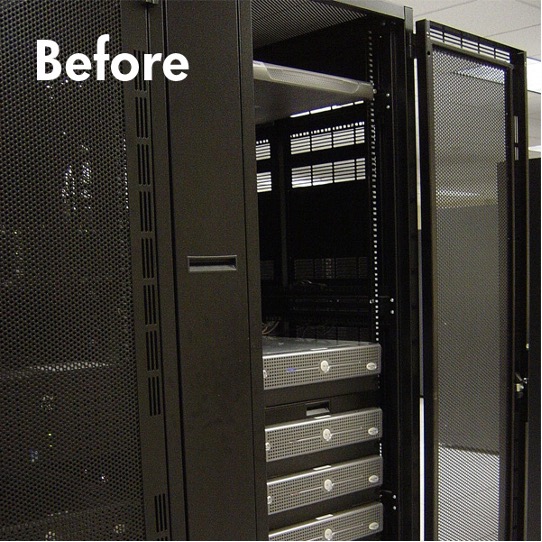
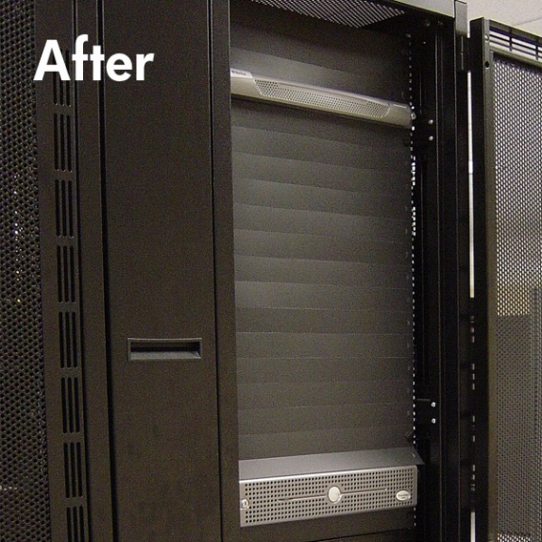
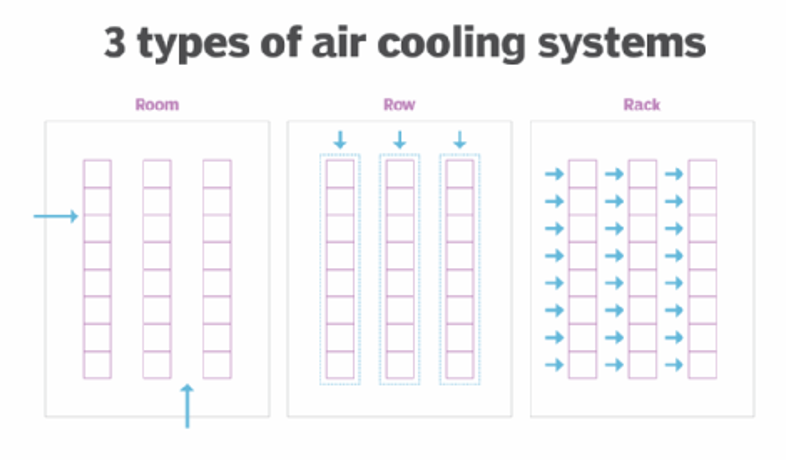
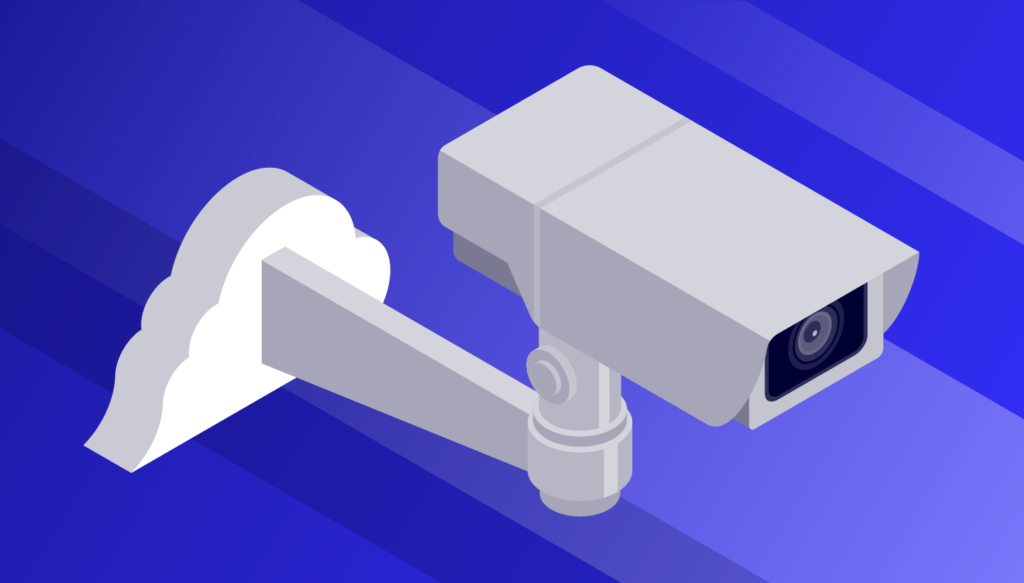
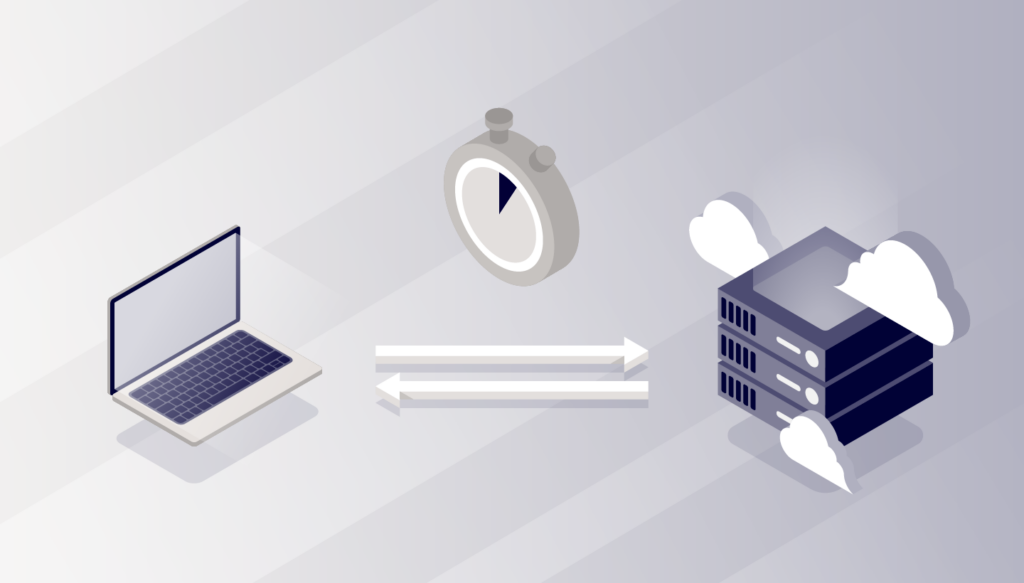
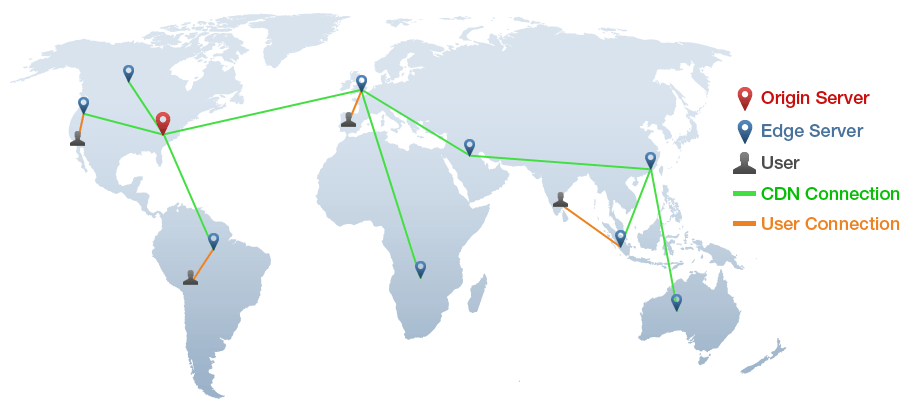


 ) is not on our roadmap—so let’s talk about what we know. Things will change over time, and some of the tools we’ve included on this list will likely go away. And, as we fully expect all of you to have strong opinions, let us know what you’re using, which tools we may have missed, and why we’re wrong in the comments section.