Post Syndicated from Maitri Brahmbhatt original https://aws.amazon.com/blogs/big-data/measure-the-adoption-of-your-amazon-quicksight-dashboards-and-view-your-bi-portfolio-in-a-single-pane-of-glass/
Amazon QuickSight is a fully managed, cloud-native business intelligence (BI) service. If you plan to deploy enterprise-grade QuickSight dashboards, measuring user adoption and usage patterns is an important ingredient for the success of your BI investment. For example, knowing the usage patterns like geo location, department, and job role can help you fine-tune your dashboards to the right audience. Furthermore, to return the investment of your BI portfolio, with dashboard usage, you can reduce license costs by identifying inactive QuickSight authors.
In this post, we introduce the latest Admin Console, an AWS packaged solution that you can easily deploy and use to create a usage and inventory dashboard for your QuickSight assets. The Admin Console helps identify usage patterns of an individual user and dashboards. It can also help you track which dashboards and groups you have or need access to, and what you can do with that access, by providing more details on QuickSight group and user permissions and activities and QuickSight asset (dashboards, analyses, and datasets) permissions. With timely access to interactive usage metrics, the Admin Console can help BI leaders and administrators make a cost-efficient plan for dashboard improvements. Another common use case of this dashboard is to provide a centralized repository of the QuickSight assets. QuickSight artifacts consists of multiple types of assets (dashboards, analyses, datasets, and more) with dependencies between them. Having a single repository to view all assets and their dependencies can be an important element in your enterprise data dictionary.
This post demonstrates how to build the Admin Console using a serverless data pipeline. With basic AWS knowledge, you can create this solution in your own environment within an hour. Alternatively, you can dive deep into the source code to meet your specific needs.
Admin Console dashboard
The following animation displays the contents of our demo dashboard.

The Admin Console dashboard includes six sheets:
- Landing Page – Provides drill-down into each detailed tabs.
- User Analysis – Provides detailed analysis of the user behavior and identifies active and inactive users and authors.
- Dashboard Analysis – Shows the most commonly viewed dashboards.
- Assets Access Permissions – Provides information on permissions applied to each asset, such as dashboard, analysis, datasets, data source, and themes.
- Data Dictionary – Provides information on the relationships between each of your assets, such as which analysis was used to build each dashboard, and which datasets and data sources are being used in each analysis. It also provides details on each dataset, including schema name, table name, columns, and more.
- Overview – Provides instructions on how to use the dashboard.
You can interactively play with the sample dashboard in the following Interactive Dashboard Demo.
Let’s look at Forwood Safety, an innovative, values-driven company with a laser focus on fatality prevention. An early adopter of QuickSight, they collaborated with AWS to deploy this solution to collect BI application usage insights.
“Our engineers love this admin console solution,” says Faye Crompton, Leader of Analytics and Benchmarking at Forwood. “It helps us to understand how users analyze critical control learnings by helping us to quickly identify the most frequently visited dashboards in Forwood’s self-service analytics and reporting tool, FAST.”
Solution overview
The following diagram illustrates the workflow of the solution.

The workflow involves the following steps:
- The AWS Lambda function
Data_Prepare is scheduled to run hourly. This function calls QuickSight APIs to get the QuickSight namespace, group, user, and asset access permissions information.
- The Lambda function
Dataset_Info is scheduled to run hourly. This function calls QuickSight APIs to get dashboard, analysis, dataset, and data source information.
- Both the functions save the results to an Amazon Simple Storage Service (Amazon S3) bucket.
- AWS CloudTrail logs are stored in an S3 bucket.
- Based on the file in Amazon S3 that contains user-group information, dataset information, QuickSight assets access permissions information, as well as dashboard views and user login events from the CloudTrail logs, five Amazon Athena tables are created. Optionally, the BI engineer can combine these tables with employee information tables to display human resource information of the users.
- Four QuickSight datasets fetch the data from the Athena tables created in Step 5 and import them into SPICE. Then, based on these datasets, a QuickSight dashboard is created.
Prerequisites
For this walkthrough, you should have the following prerequisites:
- An AWS account
- Access to the following AWS services:
- Basic knowledge of Python
- Basic knowledge of SQL
Create solution resources
We can create all the resources needed for this dashboard using three CloudFormation templates: one for Lambda functions, one for Athena tables, and one for QuickSight objects.
CloudFormation template for Lambda functions
This template creates the Lambda functions data_prepare and dataset_info.
- Choose Launch Stack and follow the steps to create these resources.

After the stack creation is successful, you have two Lambda functions, data_prepare and dataset_info, and one S3 bucket named admin-console[AWS-account-ID]. You can verify if the Lambda function can run successfully and if the group_membership, object_access, datasets_info, and data_dictionary folders are created in the S3 bucket under admin-console[AWS-account-ID]/monitoring/quicksight/, as shown in the following screenshots.


The Data_Prepare Lambda function is scheduled to run hourly with the CloudWatch Events rule admin-console-every-hour. This function calls the QuickSight Assets APIs to get QuickSight users, assets, and the access permissions information. Finally, this function creates two files, group_membership.csv and object_access.csv, and saves these files to an S3 bucket.
The Dataset_Info Lambda function is scheduled to run hourly and calls the QuickSight Assets APIs to get datasets, schemas, tables, and fields (columns) information. Then this function creates two files, datasets_info.csv and data_dictionary.csv, and saves these files to an S3 bucket.
- Create a CloudTrail log if you don’t already have one and note down the S3 bucket name of the log files for future use.
- Note down all the resources created from the previous steps. If the S3 bucket name for the CloudTrail log from step 2 is different from the one in step 1’s output, use the S3 bucket from step 2.
The following table summarizes the keys and values you use when creating the Athena tables with the next CloudFormation stack.
| Key |
Value |
Description |
| cloudtraillog |
s3://cloudtrail-awslogs-[aws-account-id]-do-not-delete/AWSLogs/[aws-account-id]/CloudTrail |
The Amazon S3 location of the CloudTrail log |
| cloudtraillogtablename |
cloudtrail_logs |
The table name of CloudTrail log |
| groupmembership |
s3://admin-console[aws-account-id]/monitoring/quicksight/group_membership |
The Amazon S3 location of group_membership.csv |
| objectaccess |
s3://admin-console[aws-account-id]/monitoring/quicksight/object_access |
The Amazon S3 location of object_access.csv |
| dataset info |
s3://admin-console[aws-account-id]/monitoring/quicksight/datsets_info |
The Amazon S3 location of datsets_info.csv |
| datadict |
s3://admin-console[aws-account-id]/monitoring/quicksight/data_dictionary |
The Amazon S3 location of data_dictionary.csv |
CloudFormation template for Athena tables
To create your Athena tables, complete the following steps:
- Download the following JSON file.
- Edit the file and replace the corresponding fields with the keys and values you noted in the previous section.
For example, search for the groupmembership keyword.

Then replace the location value with the Amazon S3 location for the groupmembership folder.

- Create Athena tables by deploying this edited file as a CloudFormation template. For instructions, refer to Get started.
After a successful deployment, you have a database called admin-console created in AwsDataCatalog in Athena and three tables in the database: cloudtrail_logs, group_membership, object_access, datasets_info and data_dict
- Confirm the tables via the Athena console.

The following screenshot shows sample data of the group_membership table.

The following screenshot shows sample data of the object_access table.

For instructions on building an Athena table with CloudTrail events, see Amazon QuickSight Now Supports Audit Logging with AWS CloudTrail. For this post, we create the table cloudtrail_logs in the default database.
- After all five tables are created in Athena, go to the security permissions on the QuickSight console to enable bucket access for
s3://admin-console[AWS-account-ID] and s3://cloudtrail-awslogs-[aws-account-id]-do-not-delete.
- Enable Athena access under Security & Permissions.
Now QuickSight can access all five tables through Athena.

CloudFormation template for QuickSight objects
To create the QuickSight objects, complete the following steps:
- Choose Launch Stack to create the QuickSight datasets and dashboard:
- Provide the ARN you noted earlier.
After a successful deployment, four datasets named Admin-Console-Group-Membership, Admin-Console-dataset-info, Admin-Console-Object-Access, and Admin-Console-CFN-Main are created and you have the dashboard named admin-console-dashboard. If modifying the dashboard is preferred, use the dashboard save-as option, then recreate the analysis, make modifications, and publish a new dashboard.
- Set your preferred SPICE refresh schedule for the four SPICE datasets, and share the dashboard in your organization as needed.
Dashboard demo
The following screenshot shows the Admin Console Landing page.
The following screenshot shows the User Analysis sheet.

The following screenshot shows the Dashboards Analysis sheet.

The following screenshot shows the Access Permissions sheet.

The following screenshot shows the Data Dictionary sheet.

The following screenshot shows the Overview sheet.

You can interactively play with the sample dashboard in the following Interactive Dashboard Demo.
You can reference the public template of the preceding dashboard in create-template, create-analysis, and create-dashboard API calls to create this dashboard and analysis in your account. The public template of this dashboard with the template ARN is 'TemplateArn': 'arn:aws:quicksight:us-east-1:889399602426:template/admin-console'.
Tips and tricks
Here are some advanced tips and tricks to build the dashboard as the Admin Console to analyze usage metrics. The following steps are based on the dataset admin_console. You can apply the same logic to create the calculated fields to analyze user login activities.
- Create parameters – For example, we can create a parameter called InActivityMonths, as in the following screenshot. Similarly, we can create other parameters such as InActivityDays, Start Date, and End Date.

- Create controls based on the parameters – In the following screenshot, we create controls based on the start and end date.

- Create calculated fields – For instance, we can create a calculated field to detect the active or inactive status of QuickSight authors. If the time span between the latest view dashboard activity and now is larger or equal to the number defined in the Inactivity Months control, the author status is Inactive. The following screenshot shows the relevant code. According to the end-user’s requirements, we can define several calculated fields to perform the analysis.

- Create visuals – For example, we create an insight to display the top three dashboard views by reader and a visual to display the authors of these dashboards.

- Add URL actions – You can add an URL action to define some extra features to email inactive authors or check details of users.

The following sample code defines the action to email inactive authors:
mailto:<<email>>?subject=Alert to inactive author! &body=Hi, <<username>>, any author without activity for more than a month will be deleted. Please log in to your QuickSight account to continue accessing and building analyses and dashboards!

Clean up
To avoid incurring future charges, delete all the resources you created with the CloudFormation templates.
Conclusion
This post discussed how BI administrators can use QuickSight, CloudTrail, and other AWS services to create a centralized view to analyze QuickSight usage metrics. We also presented a serverless data pipeline to support the Admin Console dashboard.
If you would like to have a demo, please email us.
Appendix
We can perform some additional sophisticated analysis to collect advanced usage metrics. For example, Forwood Safety raised a unique request to analyze the readers who log in but don’t view any dashboard actions (see the following code). This helps their clients identify and prevent any wasting of reader sessions fees. Leadership teams value the ability to minimize uneconomical user activity.
CREATE OR REPLACE VIEW "loginwithoutviewdashboard" AS
with login as
(SELECT COALESCE("useridentity"."username", "split_part"("useridentity"."arn", '/', 3)) AS "user_name", awsregion,
date_parse(eventtime, '%Y-%m-%dT%H:%i:%sZ') AS event_time
FROM cloudtrail_logs
WHERE
eventname = 'AssumeRoleWithSAML'
GROUP BY  1,2,3),
dashboard as
(SELECT COALESCE("useridentity"."username", "split_part"("useridentity"."arn", '/', 3)) AS "user_name", awsregion,
date_parse(eventtime, '%Y-%m-%dT%H:%i:%sZ') AS event_time
FROM cloudtrail_logs
WHERE
eventsource = 'quicksight.amazonaws.com'
AND
eventname = 'GetDashboard'
GROUP BY  1,2,3),
users as
(select Namespace,
Group,
User,
(case
when Group in (‘quicksight-fed-bi-developer’, ‘quicksight-fed-bi-admin’)
then ‘Author’
else ‘Reader’
end)
as author_status
from "group_membership" )
select l.*
from login as l
join dashboard as d
join users as u
on l.user_name=d.user_name
and
l.awsregion=d.awsregion
and
l.user_name=u.user_name
where d.event_time>(l.event_time + interval '30' minute )
and
d.event_time<l.event_time
and
u.author_status='Reader'
About the Authors
 Ying Wang is a Manager of Software Development Engineer. She has 12 years of expertise in data analytics and science. She assisted customers with enterprise data architecture solutions to scale their data analytics in the cloud during her time as a data architect. Currently, she helps customer to unlock the power of Data with QuickSight from engineering by delivering new features.
Ian Liao is a Senior Data Visualization Architect at AWS Professional Services. Before AWS, Ian spent years building startups in data and analytics. Now he enjoys helping customer to scale their data application on the cloud.
Maitri Brahmbhatt is a Business Intelligence Engineer at AWS. She helps customers and partners leverage their data to gain insights into their business and make data driven decisions by developing QuickSight dashboards.


 Weijia Shou is a Business Intelligence Engineer II at Amazon Alexa Audio Data & Insights team. She led the Alexa Audio migration of reporting dashboards to AWS QuickSight. Weijia is passionate about building scalable solutions and tools to accelerate data-driven decision making.
 Kani Singaravel is a Business Intelligence Manager at Alexa Audio, where she enjoys working with the team to solve customer problems and challenges using data analytics.

 Ravi Kiran Nidadavolu is a Software Development Manager with Fulfillment by Amazon.
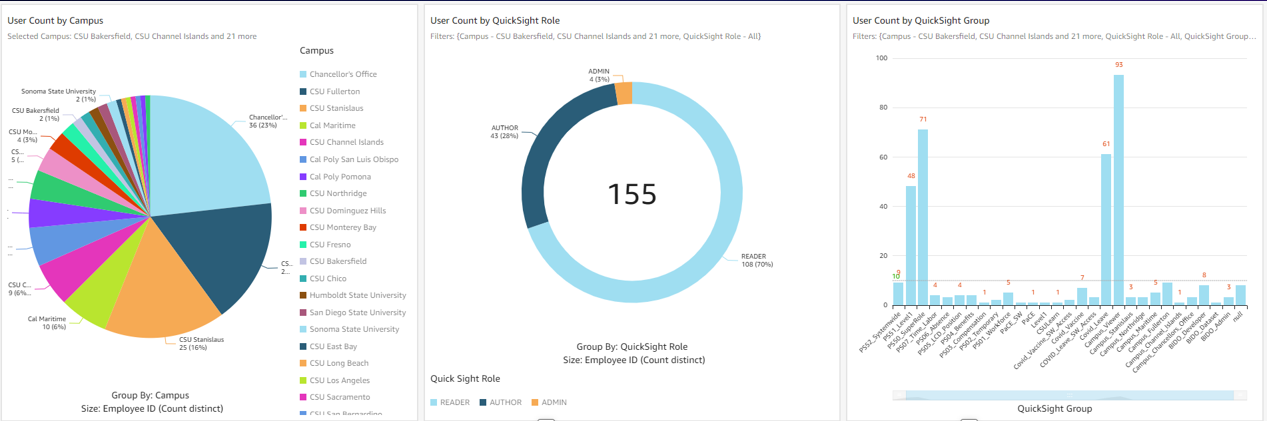


 Ying Wang is a Manager of Software Development Engineer. She has 12 years of expertise in data analytics and science. She assisted customers with enterprise data architecture solutions to scale their data analytics in the cloud during her time as a data architect. Currently, she helps customer to unlock the power of Data with QuickSight from engineering by delivering new features.
 Ian Liao is a Senior Data Visualization Architect at AWS Professional Services. Before AWS, Ian spent years building startups in data and analytics. Now he enjoys helping customer to scale their data application on the cloud.
 Maitri Brahmbhatt is a Business Intelligence Engineer at AWS. She helps customers and partners leverage their data to gain insights into their business and make data driven decisions by developing QuickSight dashboards.