On Sunday, September 28, 2025, the Republic of Moldova held a parliamentary election that was described as a referendum on its geopolitical future. The election was conducted amid claims of Russian interference, both online and offline. Ensuring the security of the election infrastructure was a critical priority, not just to protect the vote count, but to guarantee the system’s resilience so that all Moldovans could access authoritative information about the election.
We were proud to support the Moldovan Central Election Commission (CEC) ahead of their September 28th election. Consistent with public reporting, cyberattacks were not the story; the focus remained on the democratic process. We want to share what we found as we provided assistance to the CEC on election day.
Elections in Moldova
The 2025 elections in Moldova were viewed by many as a defining moment for the country. Specifically, it pitted the countries’ pro-European government against an opposition seeking closer alignment with Russia. The entire election process was carried out under intense pressure from foreign interference, employing a wide range of hybrid tactics. Beyond disinformation and illegal funding, the Moldovan state faced constant digital threats and was on high alert for planned post-election violence aimed at promoting distrust in the country’s democratic institutions. For the nation, ensuring the security and integrity of the election was a priority.
Several days before the election, Cloudflare onboarded the Moldova Central Election Commission (CEC), amid concerns over increasing cyberattacks. Since 2017, through the Athenian Project, we have provided protection to over 450 state and local government election entities in the United States. We were able to provide this expertise to the CEC and in less than a week we onboarded many of their election websites and quickly deployed mitigation strategies to help prepare them for election day.
Cyber attacks to the Moldova Election Commission
Cloudflare data shows that the Moldovan Election Commission experienced significant cyber attacks during the recent elections. From September 27 to September 29, 2025, our data shows how Moldovan citizens used the Internet to follow the political process and highlights the efforts by malicious actors to disrupt key election services.
For example, on September 28, 2025, the Moldovan Central Election Commission (CEC) experienced a series of concentrated, high-volume (DDoS) attacks strategically timed throughout the day. The attack began in the morning at 09:06:00 UTC and lasted for over twelve hours and ended as the official result reporting was underway at 21:34:00 UTC. In total, we mitigated over 898 million malicious requests directed at the CEC over the twelve-hour period.
Cloudflare systems categorized this activity into 11 attack “chunks” — which is a term used to denote a multi-wave pattern indicating a sophisticated attack. These initial bursts began during peak afternoon voting hours, with one of the most intense chunks, Chunk 5, striking before the polls closed at 15:31:00 UTC and hitting the largest recorded peak of 324,333 requests per second (rps).
Malicious traffic continued after the polls officially closed (18:00 UTC), directly targeting the result reporting phase. Multiple sustained waves, including attacks that peaked at over 243,000 rps, were mitigated. Fortunately, Cloudflare’s automated defenses successfully stopped the attacks in real-time, ensuring the CEC website remained online and accessible for Moldovan citizens.
The Moldovan government confirmed the attacks, as the Information Technology and Cybersecurity Service (STISC) reported a wide-ranging campaign targeting the CEC.md platform, government cloud systems, and diaspora voting stations. STISC also confirmed that the attacks were successfully neutralized, without any impact on the availability or integrity of electoral services.
“On behalf of the Information Technology and Cybersecurity Service (STISC), the institution technically responsible for ensuring cybersecurity of the electoral process conducted by the Central Electoral Commission of the Republic of Moldova on 28 September, we would like to extend our sincere gratitude for your outstanding support. We truly appreciate the opportunity to use your advanced systems and enterprise licenses during this critical period. Despite facing numerous DDoS attacks, thanks to your effective protection, no service interruptions were experienced, and the public remained unaffected.” – STISC Team, Information Technology and Cybersecurity Service, Republic of Moldova
“Cloudflare’s support was essential for Moldova’s parliamentary elections, ensuring uninterrupted access to real-time results for citizens at home and abroad. Their resilient infrastructure allowed us to withstand heavy DDoS attacks and protect the integrity of the democratic process.” – Anatolie Golovco, Cybersecurity and Digital Transformation Expert in the Office of the Prime Minister of Moldova
Other democracy, media and civic related targets under attack
While the Central Election Commission was the primary target, it was not the only one. On September 28, 2025, Cloudflare mitigated hundreds of millions of malicious requests aimed at Moldovan election-related, civil society and news websites. The Commission’s site absorbed the largest share, peaking near 900 million requests in a single day. But it wasn’t alone: a civic participation portal, democracy related services, a relevant broadcaster, and independent news outlets also saw significant DDoS traffic. As the chart shows, these combined attacks created a surge of hostile traffic on election day, showing what seems to be a campaign against both official institutions and public information channels.
One particularly intense application-layer wave hit a democracy-related parliamentary site, peaking at over 243,000 requests per second.
These attack patterns mirrored those against the election authority, suggesting a coordinated effort to disrupt both official election processes and the public information channels voters rely on. Cloudflare’s automated protections mitigated these multi-wave attacks in real time, keeping critical information channels available throughout the electoral timeline.
Securing the democratic process
Democracies around the world are increasingly targeted by cyberattacks. Through our Impact programs, we strive to keep websites vital to democracy — like voter registration sites, election information portals, campaign websites, and news sites — secure and available. From monitoring traffic patterns to mitigating cyberattacks, Cloudflare has observed trends that show the importance of online services during elections and the increasing attacks targeting them.
In the Moldovan parliamentary elections, the pro-Western governing party won a clear majority, defeating pro-Russian groups. We are proud to have provided services to the Moldovan Central Election Commission in securing the vote, ensuring that citizens—not malicious actors—determined the country’s future. To learn more about the Athenian Project, visit: https://www.cloudflare.com/athenian/
Elections define the course of democracies (even as there are several types of democracies), and 2024 was a landmark year, with over 60 countries — plus the European Union — holding national elections, impacting half the world’s population. As highlighted in Pew Research’s global elections report, this was a year of “political disruption,” where the Internet was a relevant stage for both democratic engagement and cyber threats.
At Cloudflare, with our presence in over 330 cities and 120 countries and interconnection with 12,500 networks, we’ve witnessed firsthand the digital impact of these elections. From monitoring Internet traffic patterns to mitigating cyberattacks, we’ve observed trends that reveal how elections increasingly play out online. As detailed in our just-published Cloudflare Impact report, we’ve also worked to protect media outlets, political campaigns, and help elections worldwide.
Here’s the map of countries with national elections that took place in 2024, from our elections report.
In terms of Internet patterns, we’ve observed how cyber activity in 2024 continues to intersect with real-world events. Online attacks are clearly a significant part of elections, even when unsuccessful in disrupting candidates or election-related websites due to strong protections. Additionally, Internet traffic patterns often vary on election day depending on the country, and government-directed Internet shutdowns continue, including ones related to elections. Email activity is also influenced, especially for more popular candidates in “polarized battles.”
Let’s start our review with attacks.
Rising threats: political and election-related cyberattacks in 2024
During 2024, elections saw a rise in DDoS attacks targeting political campaigns, parties, and election infrastructure.
In the United States, over 6 billion malicious requests were blocked between November 1-6. A set of DDoS attacks leading up to Election Day on November 5 targeted one of the campaigns with multiple days of attacks, peaking at 700,000 requests per second and sustaining 8 Gbps during major strikes. Key attack tactics included cache-busting, geodiverse patterns, and randomized user agents.
State and local websites also faced increased threats, with 290 million malicious requests blocked since September under Cloudflare’s Athenian Project. Compared to 2020, attacks in 2024 were far more intense, underscoring the growing need for robust cybersecurity to protect elections from disruption.
In France, DDoS attacks plagued multiple political parties, with peaks reaching 96,000 requests per second (rps) on election day, July 7. Additional details are available in our related blog post.
In the United Kingdom, DDoS attacks targeted political parties, with the most severe incident affecting a campaign website, reaching 156,000 rps shortly after the results were announced on election day. Additional details are available in our related blog post.
During the European parliamentary elections in early June, cyberattacks targeted several political websites around election days. Notably, a significant DDoS attack focused on two politically-related websites in the Netherlands on June 5–6 (with June 6 being election day), peaking at 73,000 rps.
In Romania, the weeks leading up to the election cycle culminating in the December 1 parliamentary elections saw DDoS attacks targeting political party websites and news organizations.
In South Africa, where the general election took place on May 29, there was a relevant DDoS attack in the weeks leading up to the election, targeting a major news site within the country for several days, with a peak on May 7 of 54,000 requests per second.
In Portugal, several DDoS attacks targeted political party websites on election day, March 10, particularly after polling stations closed. One political party’s websites experienced a peak of 69,000 rps on May 11 at 00:50 UTC.
In Taiwan, a local fact-checking website faced a DDoS attack three days before the election, on January 10.
In Japan, a DDoS attack targeted a website used to report scams and misinformation a week before the October 27 election.
While some of these rates may seem small to Cloudflare, they can be devastating for websites not well-protected against such high levels of traffic. DDoS attacks not only overwhelm systems but also serve, if successful, as a distraction for IT teams while attackers attempt other types of breaches.
Election-related Internet shutdowns
Several times in 2024, election-related Internet shutdowns were imposed by authorities for various reasons, such as in the Comoros and Pakistan.
Comoros, a small archipelago country in Southeastern Africa with a population of less than 1 million, held presidential elections on January 14, which led to protests against the re-election of President Azali Assoumani. Authorities shut down the Internet on January 17, causing a 50% drop in traffic compared to the previous week, lasting for two days.
Pakistan’s general election day on February 8 was marked by an Internet shutdown targeting mobile networks. The outage began around 02:00 UTC, reducing Internet traffic by 50% compared to the previous week. Traffic only began recovering after 15:00, highlighting the severe impact of government-initiated shutdowns on Internet connectivity.
In Mauritius, an island nation in the Indian Ocean with under 2 million residents, the government suspended access to social media platforms from November 1 to November 11 ahead of the November 10 parliamentary elections.
Other election-related Internet traffic trends
Election-day Internet traffic patterns often reflect a country’s dominant device usage, with mobile-first nations like Indonesia, Mozambique, and Ghana experiencing noticeable traffic drops after polling stations closed. While mobile-friendly countries generally see steady or higher weekend traffic compared to desktop-focused regions like Europe and the Americas, no consistent trend emerged linking device preference to overall election-day traffic increases or decreases.
Here’s a world map from our Year in Review 2024 showing countries where mobile (purple) or desktop (green) dominates Internet traffic.
Now, let’s explore a selection of relevant elections with Internet traffic impacts, ordered by election dates:
Taiwan (January 13) Taiwan’s presidential election saw traffic drop slightly during polling hours, especially in the morning with an 8% drop. Traffic returned to usual levels after 17:00 local time. Post-election, traffic rose by 5% the next morning compared to the previous week.
Finland (January 28) On January 28, Finland held its presidential election. Internet traffic dropped by 24% at 11:00 local time, coinciding with higher voter turnout in the morning. A second noticeable drop of 13% occurred at 20:00 when polling stations closed and TV stations broadcast initial projections, though traffic was slightly higher than usual afterward.
Indonesia (February 14) Indonesia held its general election on February 14. With over 200 million voters spread across 17,000 islands, it likely had the highest number of voters on a single day, unlike India’s multi-week election. During polling hours (08:00 to 13:00 local time), Internet traffic dropped by up to 15%. Traffic remained lower than the previous week for the rest of the day, with drops ranging from 8% to 16% throughout the night. Mobile device usage surged to 77%, the highest of the year, reflecting Indonesia’s mobile-first Internet culture. Traffic recovered the next morning, surpassing the previous week’s levels.
Portugal (March 10) Portugal’s parliamentary election on March 10 saw a sharp 16% traffic drop at 20:00 local time when TV stations began broadcasting projections. Traffic picked up after that and remained stable during the day.
Russia (March 17) Russia’s presidential election showed steady Internet traffic throughout the day but experienced a 7% decrease after polls closed as results and reactions were broadcast on TV. Unlike other countries, where post-election traffic surges are common, Russia’s pattern reflects the strong influence of broadcast media on election coverage.
South Korea (April 10) South Korea held legislative elections on April 10. Traffic was higher than usual before 05:00 local time but dropped 14% by 07:15 after polling stations opened at 06:00. By 11:45, traffic had rebounded above typical levels. After polling stations closed at 18:00, traffic dropped again, with a 7% decline compared to the previous week.
India (April 19–June 1) – related blog post
India’s seven-phase general election saw significant Internet traffic fluctuations. May 7 recorded the largest nationwide traffic dip of 6%, with populous states like Uttar Pradesh seeing a 9% drop and Maharashtra experiencing a 17% decline. On the final election day (June 1), mobile device usage peaked at 68%, the highest of the year. These patterns underscore India’s mobile-first Internet habits and its diverse election timelines.
North Macedonia (April 24 & May 8) North Macedonia’s two-round presidential election featured a 56% traffic increase after 11:00 local time on May 8, sustained throughout the day. Similar, albeit smaller, trends were observed during the first round on April 24.
Panama (May 5) On May 5, Panama’s presidential and parliamentary election day, Internet traffic dropped significantly while voting stations were open, with a 23% decrease in the afternoon and 25% lower traffic at 21:30 local time as results were announced. Traffic picked up after that.
South Africa (May 29) – related blog post
On May 29, South Africa’s general election saw Internet traffic decrease by 16% at 05:45 and remain lower throughout polling hours. Traffic surged by 25% the night before the election, peaking at midnight. Post-election, traffic increased by up to 12% early on May 30, highlighting the transition from offline to online engagement.
Mexico (June 2) – related blog post
Mexico’s general election on June 2 saw a 3% daily traffic drop, with hourly dips of up to 11% during polling hours (08:00–20:00 local time). Traffic surged by 14% at 01:30 the following day as results were announced, peaking at 8% above the previous week by 22:00 local time.
Iceland (June 1) Iceland’s presidential election on June 1 saw minor Internet traffic drops, including a 12% dip between 14:00 and 16:00 local time, but traffic increased at night by as much as 11% at 20:00. The day after, traffic rose by 26% compared to the previous week. Iceland elected Halla Tómasdóttir as its second female president.
European Union (June 6–9) – related blog post
The 2024 European Parliament elections showed notable Internet traffic shifts and cybersecurity challenges. The Czech Republic and Slovakia experienced traffic drops of over 10%, while Finland and Ireland saw moderate declines. Key speeches, such as Belgian Prime Minister Alexander De Croo’s resignation and French President Macron’s snap election announcement, also caused traffic fluctuations.
Source: Cloudflare; created with Datawrapper
Iran (June 28) Iran’s presidential election saw significant traffic fluctuations, with traffic falling by 16% after 17:30 local time. Extended polling hours (including at night) led to continued drops, falling to 24% lower by 22:30. After midnight, traffic rebounded, showing a 13% increase compared to the previous week.
France (June 30 & July 7) – related blog post
France’s legislative elections brought significant Internet and cybersecurity activity. On July 7, Internet traffic dropped 16% at 20:00 local time as polling stations closed and TV broadcasts announced results. Mobile device usage surged to 58%, and DNS traffic to news outlets spiked by 250% during the first round and by 244% on runoff day, reflecting heightened public interest.
United Kingdom (July 4) – related blog post
The UK’s general election on July 4 saw the Labour Party win a majority after 14 years of Conservative rule. Internet traffic declined slightly during voting hours, with a 2% drop at noon, before surging in the evening as results were announced. Northern Ireland experienced the sharpest traffic drop (10%), compared to 6% in Scotland and 5% in Wales. DNS traffic to election-related domains peaked with increases of 600% at 22:00 and 671% at 04:00 the following day.
Sri Lanka (September 21) Sri Lanka’s presidential election caused a 9% morning traffic dip and an 18% post-election surge after polls closed. Results triggered a 109% traffic increase at 03:00 local time on September 22.
Tunisia (October 6) Tunisia’s presidential election saw a 15% traffic dip at 17:00, followed by a 13% decline at 19:30 when results started arriving. The steady traffic decrease highlights the evening focus on offline engagement and result tracking.
Mozambique (October 9) Mozambique’s election drove an Internet traffic drop throughout the day, falling as much as 51% by 20:30 local time, and continuing lower than usual after that. A post-election surge of 16% occurred at 01:30. The election, held on a public holiday, resulted in a 31% daily traffic drop compared to the previous week.
Georgia (October 26) When Georgia held its parliamentary election on October 26, Internet traffic was 11% higher than the previous week, peaking at 67% above normal around 23:00 when results were announced. Unlike other countries, traffic only dipped slightly (2%) in the afternoon during polling hours.
Japan (October 27) Japan’s House of Representatives election saw Internet traffic decrease by 4% at 20:00 after polling stations closed, but it rose later in the evening.
Botswana (October 30) A traffic drop was observed throughout the day of Botswana’s general election, with a 42% decrease around 21:30 local time compared to the previous week.
United States (November 5) – related blog post
The US elections saw a 15% spike in Internet traffic, particularly after polls closed, with the Midwest leading. There were also specific spikes related to key moments during election night, as the next chart shows:
DNS traffic surged by 756% to polling services and 325% to news sites. As highlighted in our recent Internet Services Year in Review blog post, the US election also boosted DNS traffic and ranking positions for CNN, Fox News, and The New York Times, underscoring the Internet’s critical role during major political events.
Ghana (December 7) Ghana’s general election caused mid-morning traffic drops of 11%, followed by declines of 13% and 14% after polling stations closed at 17:00. These patterns indicate offline focus during results announcements.
Romania (December 1) Romania’s parliamentary election showed minimal traffic fluctuations during the day, though its November 24 presidential election remains disputed.
Email perspectives on the US presidential election
From a cybersecurity perspective, trending events, topics, and individuals often attract more emails, including malicious, phishing, and spam messages. In our analysis earlier this year, we focused on the US presidential elections and the two major party candidates.
From June 1 to November 5, 2024, Cloudflare processed over 19 million emails mentioning “Donald Trump” or “Kamala Harris,” with Trump appearing more frequently and in higher rates of spam (12%) and malicious emails (1.3%) compared to Harris (0.6% spam, 0.2% malicious). Nearly half were sent after September, with a surge in the final 10 campaign days.
Conclusion: the election cycle doesn’t stop
As a global election year, 2024 underscored how deeply the Internet is woven into the democratic process, serving both as a tool for engagement and a target for disruption. From relevant DDoS attacks to government-imposed Internet shutdowns, the challenges faced during these elections reflect a growing need for robust cybersecurity measures to safeguard critical infrastructure and ensure free, fair electoral processes.
In this context, Germany has announced an anticipated federal election for February 23, 2025, following the collapse of its governing coalition during the 2024 government crisis. This snap election joins others in France and the UK, reflecting a growing trend of political instability requiring urgent electoral responses.
Looking ahead, the increasing frequency and complexity of cyber threats, such as DDoS attacks on campaigns and election infrastructure, demand proactive defenses. Shutdowns like those in Pakistan and Comoros, along with surges in phishing and misinformation, highlight the need for closer collaboration between governments, technology providers, and civil society to safeguard democracy in the digital era.
If you want to follow more trends and insights about the Internet and elections in particular, you can check Cloudflare Radar, and more specifically our new 2024 Elections Insights report.
Elections are not just a matter of casting ballots. They depend on citizens being able to register to vote and accessing information about candidates and the election process, which in turn depend on the strength and security of the Internet. Despite the risks posed by potential cyberattacks aimed to disrupt democracy, Cloudflare did not observe any significant disruptions to campaigns or local government websites from cyberattack.
Tuesday, November 5, 2024 was Election Day in the United States. It not only decided the next president and vice president but also included elections for the US Senate, House of Representatives, state governorships, and state legislatures. Results confirm that Republican Donald Trump won the presidential election.
In this blog post, we examine online attacks against election-related sites — some of which were notable but none were disruptive — and how initial election results impacted Internet traffic across the US at both national and state levels, with increases in traffic as much as 15% nationwide. We’ll also explore email phishing trends and general DNS data around news interest, the candidates, and election-related activity.
We’ve been tracking 2024 elections globally through our blog and election report on Cloudflare Radar, covering some of the more than 60 national elections around the globe this year. At Cloudflare, we support many of these efforts to ensure a secure and trustworthy election process. We worked closely with election officials, government agencies, and civil society groups across the country to ensure that groups working in the election space had the tools they needed to stay online.
In the 24 hour period from October 31 – November 1, Cloudflare automatically mitigated over 6 billion HTTP DDoS requests that targeted US election-related websites–such as state and local government election sites and political campaigns. There were no significant disruptions to the targeted websites during this time period.
The day before the election, DNS traffic to Trump/Republican and Harris/Democrat websites peaked, with daily DNS traffic rising 59% and 4% respectively.
On election day, states in the midwest saw the highest traffic growth across the US, as compared to the previous week.
Internet traffic in the US peaked after the first polling stations closed, with a 15% increase over the previous week.
DNS traffic to news, polling, and election websites also saw large traffic jumps. Polling services were up 756% near poll closures and news sites were up 325% by late evening.
How Cloudflare assists with election infrastructure
Cloudflare’s goal is to ensure that sites that enable democracy — such as voter registration sites, election information portals, campaign websites, and results reporting platforms — remain secure and accessible, especially under heavy traffic periods or cyberattacks. Through our Impact programs, we provide essential cybersecurity resources to more than 800 websites that work on election infrastructure.
Project Galileo: Launched in 2014, Project Galileo provides free Business level services to media organizations, human rights defenders and non-profit organizations around the world. We protect more than 65 Internet properties related to elections in the United States that work on a range of topics related to voting rights, promoting free and fair elections, and posting election results. These organizations include Vote America, Decision Desk HQ, US Vote Foundation, and Electionland.
Athenian Project: Launched in 2017, the Athenian Project provides state and local governments that run elections with free Enterprise level services to ensure that voters can access accurate and up-to-date information about voter registration, polling places, and election results without interruption. We currently protect 423 websites in 33 states under the project.
Cloudflare for Campaigns: Launched in 2020, in partnership with Defending Digital Campaigns, Cloudflare for Campaigns provides a package of products to address the increasing risks posed by cyberattacks on political campaigns and state parties. We currently protect more than 354 campaigns and 34 state-level political parties in the United States.
Since 2020, we’ve strengthened our partnerships with election officials, government agencies, and nonprofits to provide essential protections. Throughout 2024, we’ve collaborated with CISA (Cybersecurity and Infrastructure Security Agency) and the Joint Cyber Defense Collaborative, briefing over 300 election officials on emerging threats and conducting 50+ calls with state and local governments to review security practices. Additionally, we held webinars on cyber threats to election groups and strategies for protecting election infrastructure.
With Defending Digital Campaigns, we worked to onboard more than 90 campaigns and parties weeks before election day. As part of this, we also worked with political vendors managing campaign infrastructure to provide insight on emerging threats and how to mitigate. Under Project Galileo, we onboarded more than 60 local media and journalism sites reporting on elections to ensure they can provide timely, accurate information on voting processes, candidate platforms, and election results.
Political and election-related cyber attacks
As we’ve seen several times this year, specific DDoS (Distributed Denial of Service) attacks often target political party or candidate websites around election day. While online attacks are frequent and not always election-related, we saw recent DDoS incidents in France, the Netherlands, and the U.K. focused on political parties during election periods.
In the US, we saw a similar uptick in attacks immediately prior to the election. Cloudflare blocked cyberattacks targeting websites affiliated with both parties, attempting to take the sites offline. Although some attacks had high volumes of traffic, the targeted websites remained online.
DDoS attacks targeting US political or elections-related Internet properties in particular clearly picked up starting in September, with the more than 6 billion HTTP DDoS requests seen during the first six days of November exceeding the volume seen during all of September and October.
Some campaign websites drove most of the malicious HTTP request traffic as part of DDoS attacks, with a clear increase since October 1, compared to minimal DDoS activity earlier in 2024.
Let’s look at a few examples of specific DDoS attacks, as these are easier to track.
High-profile campaign website, October 29 – November 6
Cloudflare blocked a series of DDoS attacks targeting a high-profile campaign website. The attacks began on October 29, with a four-minute spike reaching 345,000 requests per second. On October 31, more intense attacks followed, with the first lasting over an hour, peaking at 213,000 requests per second. Hours later, on November 1, a larger attack reached 700,000 requests per second, followed by two more waves at 311,000 and 205,000 requests per second.
Over 16 hours, Cloudflare blocked more than 6 billion malicious HTTP requests between October 31 and November 1. Additional attacks continued on November 3, with peaks at 200,000 requests per second (rps); on November 4, at 352,000; on Election Day, November 5, at 271,000 around 14:33 ET (11:33 PT); and on November 6, at 108,000.
Our data shows that the attacker(s) randomized user agents, attempted cache-busting techniques (methods to bypass cached content and overload servers with unique requests), and employed a geodiverse approach.
The DDoS attack on November 1 reached peak bandwidth of over 16 Gbps sent to Cloudflare and maintained over 8 Gbps throughout the main attack, which lasted more than two hours.
US campaign infrastructure website, November 3
Attackers also expanded their attacks beyond campaign sites, to political parties and their infrastructure, attempting — unsuccessfully — to disrupt services. For example, on November 3, 2024, a DDoS attack targeted infrastructure associated with a major campaign, lasting two minutes and reaching 260,000 malicious HTTP requests per second.
US state political party, October 29
On October 29, 2024, a high-volume DDoS attack targeted a U.S. political party website from a specific state. The attack lasted over four hours, from 12:00 to 17:29 ET (09:00 to 14:29 PT), and peaked at 206,000 requests per second. In total, over 2 billion malicious HTTP requests were blocked that day as part of this DDoS attack.
The same method used in the November 1 attack on one of the main campaign websites, mentioned above, was also used in this case. Here, the DDoS attack reached a peak of 5.7 Gbps sent to Cloudflare by the attacker, and sustained over 3 Gbps for most of its four-and-a-half-hour duration.
US counties as a target, September 13
Since September, US state and local websites protected by Cloudflare under the Athenian Project have experienced increased DDoS attacks, particularly targeting specific counties. These types of sites have seen over 290 million malicious HTTP requests since September 1, with 4% of all requests blocked as threats. These attacks were less frequent and intense than those on US political campaigns infrastructure.
On September 13, 2024, a DDoS attack targeted a county website from 19:29 UTC to 22:32 UTC (15:29 to 18:32 ET), lasting three hours and peaking at 46,000 of malicious HTTP requests per second.
These rates of DDoS attacks are already significant, even more so when we compare it with the 2020 US presidential election. In 2020, we saw more varied blocked cyberattack HTTP requests, split between WAF (Web Application Firewall) and firewall rules, and DDoS attacks. There were also significantly fewer blocked requests related to DDoS and WAF, with nearly 100 million in the whole month of October 2020 and close to 25 million in November 2020, the month of the election. In contrast, during November 1-6, 2024, alone, we observed over 6 billion malicious HTTP requests in DDoS attacks targeting campaigns.
It’s also important to note that even smaller attacks can be devastating for websites not well-protected against such high levels of traffic. DDoS attacks not only overwhelm systems but also serve, if successful, as a distraction for IT teams while attackers attempt other types of breaches.
Internet traffic in the US grows after polls closed
Generally, election days do not lead to drastic changes in Internet traffic. Traffic usually slightly dips during voting hours, though not as sharply as on national holidays, and rises in the evening as results are announced.
In the US, a similar pattern was observed on November 5, 2024, with increased Internet traffic at night. However, traffic throughout the day was generally 6% higher than the previous week, starting as early as 09:15 ET (06:15 PT). This may also be because, unlike in other countries, Election Day in the US is on a weekday rather than a weekend and is not a national holiday. Internet traffic peaked after the first polls closed, around 21:15 ET (18:15 PT), as TV news stations displayed countdown clocks. At that moment, traffic was 15% higher than the previous week.
Note: The previous 7 days line that appears in the next chart is one hour behind due to the Daylight Saving Time change over the weekend in the US. All growth calculations in this post take that change into account.
The biggest spike in traffic growth (compared to the previous week) of Election Day occurred at around 01:30 am ET (22:30 PT), when projections began to favor Trump for the presidential victory and Fox News called Pennsylvania in his favor, with traffic rising 32% compared to the previous week. Later, during Donald Trump’s speech between 02:30 and 02:45 am ET (23:30 and 23:45 PT), Internet traffic was 31% higher than the previous week.
On Election Day, daily Internet traffic in the US reached its highest level of 2024 in terms of requests, showing a 6% increase compared to the previous week.
As expected for a typical election day, considering what we observed in other countries, the share of traffic from mobile devices was also slightly higher on Election Day at 43%, compared to 42% the previous week.
State-level traffic growth peaks at 21:00 ET (18:00 PT)
State-level traffic shifts on Election Day, compared to the previous week, reveal more detail than country-level data. The map below highlights the biggest traffic changes, peaking at 21:00 ET (18:00 PT) after polling stations began to close. Notably, traffic increased nationwide and at the state level on Election Day, unlike during the two-hour presidential debates, which were broadcast on nationwide TV.
The most significant traffic increases were observed in Maine (44%), South Dakota (44%), and Montana (44%). Interestingly, central states saw higher percentages of Internet traffic growth than coastal ones. More populous states, such as California (8%), Texas (19%), New York (22%), and Florida (23%), also experienced notable traffic increases.
The seven swing states that are considered to have been decisive in the election — Georgia, Michigan, Nevada, North Carolina, Pennsylvania, and Wisconsin (we’re not considering Arizona due to data issues) — each saw traffic growth between 17% and 36%. Here’s a more focused view of those swing states for easier consumption:
State
Growth in traffic
Local time
(in each state)
Georgia
25%
21:15
Michigan
34%
21:15
Nevada
17%
18:15
North Carolina
14%
21:15
Pennsylvania
33%
21:15
Wisconsin
36%
20:15
DNS trends: from news outlets to polling services
Switching our focus to domain trends, our 1.1.1.1 resolver DNS data reveals a clear impact during the US elections when analyzing specific categories.
Analysis of DNS traffic for US news media outlets shows that traffic from the United States rose significantly right after 09:00 ET (06:00 PT), increasing around 15%, compared to the previous week. Traffic continued to climb throughout the day, peaking between 22:00 and 23:00 ET (19:00 and 20:00 PT) with DNS request traffic volume 325% higher than the previous week. There was also a brief spike on Wednesday, November 6, at 05:00 ET (02:00 PT), showing a 117% increase.
We observed significantly higher DNS traffic for polling services websites — websites of platforms or organizations that conduct and publish polls — on Election Day, peaking at 13:00 ET (10:00 PT) with a 206% increase from the previous week, and again at 22:00 ET (19:00 PT), after the polls started to close, with a 756% increase. Daily traffic to this category was up 145% on Election Day, and 36% the day prior.
Election and voting information-related websites also saw a notable rise in DNS traffic around Election Day. Traffic clearly began to increase the day before the election, and peaked on November 5, 2024, at 12:00 ET (09:00 PT), with a 313% increase from the previous week. Daily traffic was 139% higher on Election Day, and 68% higher the day before.
Social media sites/applications, especially microblogging platforms like X and Threads, were also impacted during Election Day. DNS traffic for these microblogging platforms peaked at 22:00 ET (19:00 PT), aligning with spikes for news organizations and polling services, showing a 91% increase compared to the previous week. In this microblogging category, daily DNS traffic on Election Day rose by 12% from the previous week.
Regarding the two main presidential candidates, DNS traffic for their websites and their parties’ websites was much higher the day before the election than on Election Day. On November 4, 2024, daily DNS traffic to Trump and Republican websites was up 59% compared to the previous week, while traffic to Harris and Democrat websites, which had a more significant increase in DNS traffic the previous week, rose by 4%.
Candidate-related email phishing trends
From a cybersecurity perspective, trending events, topics, and individuals often attract more emails, including malicious, phishing, and spam messages. Our earlier analysis covered email trends involving “Joe Biden” and “Donald Trump” since January. We’ve since updated it to include Kamala Harris after the Democratic Convention and the Harris-Trump debate.
From June 1 through November 4, 2024, Cloudflare’s Cloud Email Security service processed over 19 million emails with “Donald Trump” or “Kamala Harris” in the subject line — 13.9 million for Trump and 5.3 million for Harris. Nearly half of these emails (49%) were sent since September. In the last 10 days of the campaign (since October 24), Harris was named in 800,000 email subject lines and Trump in 1.3 million.
Since June 1, 12% of emails mentioning Trump were marked as spam, and 1.3% were flagged as malicious or phishing. This rate has dropped since September 1, with only 3% marked as spam and 0.3% as malicious. For emails mentioning Harris, the rates were lower: 0.6% were marked as spam and 0.2% as malicious since June, increasing slightly to 1.2% spam and 0.2% malicious since September 1. Trump was mentioned more frequently in email subjects than Harris and was found in higher overall percentages of spam and malicious emails.
Conclusion: keeping track of elections
Although Cloudflare observed a notable increase in DDoS attacks on political and election-related sites, blocking billions of malicious requests, these attacks resulted in no significant disruption due to planning and proactive defenses. We share the Cybersecurity and Infrastructure Security Agency’s view that “our election infrastructure has never been more secure” and concur with their conclusion that “We have no evidence of any malicious activity that had a material impact on the security or integrity of our election infrastructure.” Keeping our elections secure and resilient is critical to the functioning of democracy, and Cloudflare is proud to have played our part.
If you want to follow more trends and insights about the Internet and elections in particular, you can check Cloudflare Radar, and more specifically our new 2024 Elections Insights report, which will be updated as elections take place throughout the year.
Much has changed in the 2024 United States presidential election since the June 27 debate between Donald Trump and Joe Biden, then the presumptive nominees for the November election. Now, over two months later, on September 10, the debate was between Kamala Harris, the Democratic nominee, and Donald Trump, the Republican nominee. In this post, we will explore the event’s impact on Internet traffic in specific states where there was a bigger impact than during the Biden-Trump debate, as well as examine cyberattacks, email phishing trends, and general DNS data on candidates, news, and election-related activity.
Typically, we have observed that election days don’t come with significant changes to Internet traffic, and the same is true for debates. Yet, debates can also draw attention that impacts traffic, especially when there is heightened anticipation. The 2024 debates were not only aired on broadcast and cable television, but also streamed on platforms like YouTube, increasing their reach and impact.
Key takeaways:
The September 10 Harris-Trump debate caused bigger drops in Internet traffic in the US than the Biden-Trump debate on June 27.
There was also a noticeable increase in DNS traffic to both Kamala Harris-related and Donald Trump-related domains, with Trump-related DNS traffic peaking around the start of the debate and Harris-related DNS traffic peaking after the debate ended, around the time Taylor Swift announced she was endorsing Harris.
We also observed increases in DNS traffic to US news media outlets and election-related domains right after the debate ended.
Donald Trump remains the candidate with the most mentions in email subjects and the highest percentages of emails classified as spam (26.7%) and malicious (2.4%). Since mid-August, there has been a slight increase in the percentage of spam and malicious emails mentioning Kamala Harris.
Traffic drop in the US
During the September 10, 2024, debate between Harris and Trump, hosted by ABC News at 21:00 EST (01:00 UTC) in Philadelphia, Pennsylvania, Cloudflare noted a trend similar to the Biden-Trump debate, with a clear drop in nationwide Internet requests, falling as much as 9% below the same time a week prior at 21:15 EST (01:15 UTC). At the end of the debate, around 22:45 EST (02:45 UTC), the drop was less evident, at just 2%. Traffic increased slightly just after the debate.
Note: there were two four-minute breaks during the debate, at around 22:00 and 22:30, and our data here has 15-minute granularity.
There’s a clear difference between this second debate, with a drop of up to 9%, and the first one between Biden and Trump on June 27, when the traffic dropped just 2% below the same time a week prior. Interestingly, the biggest drop occurred at the same time in both debates, right after they started, at 21:15 EST (01:15 UTC).
Internet traffic dips across US states
Traffic shifts at the time of the debate, as compared to the previous week, can reveal more detail at a state-level perspective than at the country level. The map below summarizes traffic changes observed at a state level. A key observation is that traffic declines at a state level were much more pronounced during the Harris-Trump debate, than during the Biden-Trump debate in late June.
(Source: Cloudflare; created with Datawrapper)
The most significant traffic drops were observed in Vermont (-25%), Montana (-22%), and Idaho (-19%). More populous states such as California (-11%), Texas (-10%), and New York (-14%) also experienced notable declines in traffic.
Just for comparison, here’s the state map from that June 27 Biden-Trump debate:
(Source: Cloudflare; created with Datawrapper)
The initial minutes of the Harris-Trump debate triggered the largest traffic declines in most states, at least up until the first break, at around 21:30 ET (01:30 UTC).
In the next table, we provide a detailed breakdown of the same perspective shown on the US map ordered by the magnitude of the drop in traffic. We include the time of the biggest traffic drop compared to the previous week, at a 5-minute granularity, and also the percentage of the drop compared to the previous week. As noted above, the largest declines appeared to occur earlier in the debate.
State
Drop in traffic (%)
Local Time
UTC
Vermont
-25%
21:05 EDT
1:05
Montana
-22%
19:10 MDT
1:10
Idaho
-19%
19:10 MDT
1:10
Wyoming
-19%
19:15 MDT
1:15
North Dakota
-18%
20:15 CDT
1:15
Delaware
-15%
21:20 EDT
1:20
Illinois
-15%
20:20 CDT
1:20
Mississippi
-14%
20:05 CDT
1:05
New York
-14%
21:05 EDT
1:05
Rhode Island
-14%
21:45 EDT
1:45
West Virginia
-14%
21:15 EDT
1:15
Alabama
-13%
20:05 CDT
1:05
Georgia
-13%
21:20 EDT
1:20
South Carolina
-13%
21:15 EDT
1:15
Virginia
-13%
21:15 EDT
1:15
Colorado
-12%
19:45 MDT
1:45
Connecticut
-12%
21:05 EDT
1:05
Nevada
-12%
18:20 PDT
1:20
New Jersey
-12%
21:20 EDT
1:20
Alaska
-11%
17:15 AKDT
1:15
California
-11%
18:15 PDT
1:15
Florida
-11%
21:05 EDT
1:05
North Carolina
-11%
21:05 EDT
1:05
Wisconsin
-11%
20:20 CDT
1:20
Arkansas
-10%
20:05 CDT
1:05
District of Columbia
-10%
21:55 EDT
1:55
Missouri
-10%
20:25 CDT
1:25
Oregon
-10%
18:40 PDT
1:40
Pennsylvania
-10%
21:05 EDT
1:05
South Dakota
-10%
20:20 CDT
1:20
Texas
-10%
20:05 CDT
1:05
Maryland
-9%
21:20 EDT
1:20
Massachusetts
-9%
21:20 EDT
1:20
New Hampshire
-9%
21:05 EDT
1:05
Oklahoma
-9%
20:05 CDT
1:05
Arizona
-8%
18:15 MST
1:15
Indiana
-8%
21:05 EDT
1:05
Iowa
-8%
20:05 CDT
1:05
Kentucky
-8%
21:05 EDT
1:05
Maine
-8%
21:15 EDT
1:15
Nebraska
-8%
19:45 MDT
1:45
Kansas
-7%
20:25 CDT
1:25
Louisiana
-7%
20:20 CDT
1:20
Michigan
-7%
21:20 EDT
1:20
Minnesota
-7%
20:30 CDT
1:30
New Mexico
-7%
19:25 MDT
1:25
Washington
-7%
18:05 PDT
1:05
Hawaii
-6%
15:20 HST
1:20
Ohio
-6%
21:15 EDT
1:15
Tennessee
-6%
20:05 CDT
1:05
Utah
-6%
19:10 MDT
1:10
Swing state drops in traffic higher than first debate
The seven swing states that are said to be decisive in the election — Arizona, Georgia, Michigan, Nevada, North Carolina, Pennsylvania, and Wisconsin — each saw traffic drop between 8% and 13%, which is more than during the Biden-Trump debate (between 5% and 8% at that time). Here’s a more focused view of those swing states for easier visualization:
State
Drop in traffic
Local Time
UTC
Arizona
-8%
18:15 MST
1:15
Georgia
-13%
21:20 EDT
1:20
Michigan
-7%
21:20 EDT
1:20
Nevada
-12%
18:20 PDT
1:20
North Carolina
-11%
21:05 EDT
1:05
Pennsylvania
-10%
21:05 EDT
1:05
Wisconsin
-11%
20:20 CDT
1:20
DNS trends
Shifting our attention to domain trends, our 1.1.1.1 resolver data highlights a more targeted impact during and around the debate. Let’s start with Kamala Harris-related insights.
Harris and the Taylor Swift effect
Since July 21, the date of Biden’s withdrawal and endorsement of Harris, daily DNS traffic to Harris-related domains has significantly increased, with notable peaks on August 30 (the day after the Harris-Walz interview on CNN) and September 10 (the debate with Trump).
From an hourly perspective, the impact of the debate on Kamala Harris-related sites is evident, with increased DNS traffic throughout the day (September 10). The peak occurred at the debate’s start (21:00 ET / 01:00 UTC) with a 54% increase from the previous week, and again after it ended (23:00 ET / 03:00 UTC) with a 56% rise. This spike coincided with Taylor Swift’s endorsement of Kamala Harris.
Trump and the Elon Musk interview effect
Donald Trump, having a longer-standing campaign and websites compared to Kamala Harris, shows different trends. Aggregated daily DNS traffic to Trump-related domains has also increased in recent months. Significant peaks were observed on July 15 (two days after the assassination attempt), then during the Republican National Convention (August 19-22), with the highest spike occurring on August 12, following Elon Musk’s interview with Trump on X.
Hourly data shows the debate’s impact on Trump-related sites with a noticeable increase around the debate’s start (21:00 ET / 01:00 UTC), where DNS traffic was 46% higher than the previous week. This elevated traffic continued for a few hours, after the debate ended.
From news to election-related sites
Like previous US election-related events, the debate generated significant interest in US news organizations, leading to a rise in aggregated DNS traffic to general US news sites. This increase peaked during the debate at 22:00 ET (02:00 UTC), with DNS traffic 62% higher than the previous week. The elevated DNS traffic began before the debate and persisted afterward, with a 19% increase at 20:00 ET (00:00 UTC) and a 25% increase at 00:00 ET (04:00 UTC).
Microblogging social platforms like X or Threads outperformed their previous week’s traffic throughout the debate, peaking at 16% growth around 22:00 ET (02:00 UTC).
Additionally, there was a notable increase in DNS traffic to election-related websites, including official voting registration and election sites. During the morning of September 10 in the US, DNS traffic was 38% higher at 10:00 ET (14:00 UTC), with a significant spike at 23:00 ET (03:00 UTC) right after the debate, where DNS traffic surged by 76% compared to the previous week.
Harris-Trump: spam and malicious emails
From a cybersecurity perspective, trending events, topics, and individuals often attract more emails, including malicious, phishing, and spam messages. Our earlier analysis covered email trends involving “Joe Biden” and “Donald Trump” since January. We’ve since updated it to include Kamala Harris after the Democratic Convention.
From June 1, 2024, through August 21, Cloudflare’s Cloud Email Security service processed over 16 million emails that included the names “Donald Trump”, “Joe Biden”, or “Kamala Harris” in the subject, with 8.7 million referencing Trump, 4.8 million referencing Biden, and 3 million referencing Harris.
The chart below highlights a surge in emails mentioning Trump in mid-July, contrasting with a drop in the number of emails mentioning Biden in the subject and an increase in emails mentioning Harris.
Since July 21, following changes in the presumptive Democratic candidate, over 4.5 million emails mentioned “Donald Trump,” over 1.5 million mentioned “Joe Biden,” and around 2.8 million mentioned “Kamala Harris” in the subject. Of these, 26.7% of emails with Trump’s name were classified as spam, and 2.4% were classified as malicious. For Kamala Harris, 1.1% were classified as spam and 0.2% were classified as malicious, while Biden’s figures were 1.1% for spam and 0.1% for malicious.
Since mid-August, there has been a slight increase in the percentage of spam and malicious emails mentioning Kamala Harris. Trump remains the candidate with the most mentions in email subjects and the highest percentages of emails classified as spam and malicious.
September attacks on political and news sites
In our blog posts about several of the 2024 elections, we have noted that attacks on politically-related websites have remained a significant threat this year. In Europe, we’ve seen political parties and associated websites targeted around elections. We previously reported on DDoS attacks around the Republican National Convention and Democratic National Convention.
In our post about the Democratic National Convention, we showed that during late July and August, Cloudflare blocked DDoS attacks targeting three US politically related organizations, including a site associated with one of the major parties, with attacks occurring just before the Democratic Convention.
The largest DDoS attack recorded in recent days against politically-related websites targeted specifically a US political-party related website on September 4, peaking at 140,000 requests per second (rps) and lasting about 5 minutes.
But it’s not only US politically-related websites that could be the target of cyber attacks. News organizations are often attacked during relevant events, as we saw during the first year of the war in Ukraine, for example. Already in September, we’ve seen an example of a relevant US news organization that covers politics being the target of a DDoS attack on September 3, peaking at 343,000 requests per second (rps) and lasting about 5 minutes.
As highlighted in our Q2 DDoS report, most DDoS attacks are short-lived, as exemplified by the two mentioned attacks. Also, 81% of HTTP DDoS attacks peak at under 50,000 requests per second (rps), and only 7% reach between 100,000 and 250,000 rps. While a 140,000 rps attack might seem minor to Cloudflare, it can be devastating for websites not equipped to handle such high levels of traffic.
Conclusion
In this analysis of the Harris-Trump debate, we’ve observed that the September 10 debate caused bigger drops in traffic in the US than the Biden-Trump debate in late June. There was also a noticeable increase in DNS traffic to both Kamala Harris-related and Donald Trump-related domains, as well as to US news media outlets and election-related domains — in this case, right after the debate ended.
If you’re interested in more trends and insights about the Internet and elections, check out Cloudflare Radar, specifically our 2024 Elections Insights report. It will be updated throughout the year as elections (or election-related events) occur.
Internet traffic typically mirrors human behavior, with significant fluctuations during large political events. This comes during a time when the United States is in election mode, as political campaigns are in full swing and candidates for various offices, primaries and caucuses make their case to voters and debates are being held. This week, the Republican National Convention was hosted in Milwaukee, Wisconsin from July 15 to 18, 2024. We examined traffic shifts and cyberattacks since June 2024 to see how these events have impacted the Internet.
Attacks on political related websites
Cyberattacks are a constant threat, and aren’t necessarily driven by elections. With that said, notable trends can often be observed, and we’ve seen before how specific geopolitical events can trigger online attacks. For example, we saw cyberattacks at the start of the war in Ukraine to more recently in the Netherlands, when the June 2024 European elections coincided with cyberattacks on Dutch political-related websites that lasted two days — June 5th and 6th. The main DDoS (Distributed Denial of Service attack) attack on June 5, the day before the Dutch election, reached 73,000 requests per second (rps).
Shifting our focus to the United States in particular, in the weeks since April 2024, we’ve seen several DDoS attacks targeting both federal and state government and political-related websites in the United States. In recent days Cloudflare has also blocked DDoS attacks targeting two political-related websites.
One of those is related to a political campaign, represented by the yellow line on the chart below. The first spike was a DDoS attack on July 2, 2024, peaking at 56,000 rps and lasting around 10 minutes. The same political-related site was attacked later on July 14, with a 34,000 rps peak, lasting four minutes.
The other political-related site under attack, in green on the previous chart, is a think tank website that does policy advocacy related to presidential politics. It was already attacked before, around the time of the Biden vs Trump debate, as we’ve published at the time in a related blog post. The main attack was on July 11, with a 137,000 rps peak, lasting a few minutes, and was repeated, with slightly lower intensity, a few hours later on July 12.
As we’ve seen in our recent DDoS report, the vast majority of DDoS attacks are short. This emphasizes the need for automated, in-line detection and mitigation systems. Ten minutes are hardly enough time for a human to respond to an alert, analyze the traffic, and apply manual mitigations.
Trump assassination attempt impact
The attempted assassination of former President Trump at a campaign rally near Butler, Pennsylvania precipitated an increase in Internet traffic within the United States, particularly to news-related media outlets. As news broke of shots fired at a Trump rally, injuring the former president, Internet traffic in the United States (in bytes) increased around 22:30 – 23:00 UTC (18:30-19:00 EST) by 10% to 12%.
HTTP requests in the United States saw up to an 8% increase on July 13th compared to the previous week.
At the same time, DNS traffic to TV news sites, via our 1.1.1.1 resolver, surged by as much as 215%, and to general news sites by 141%.
Republican National Convention
The Republican National Convention is an important political event as delegates of the United States Republican Party choose the party’s nominees for president and vice president in the 2024 United States presidential election. Over the four-day event, convention delegates formally nominate the party’s presidential and vice presidential candidates and adopt the party’s platform, which outlines its policies and positions on various issues. The convention features speeches from prominent party members, including the nominees, party leaders, and other influential figures.
This year’s convention was held in Milwaukee, Wisconsin. During this time, we didn’t identify any noticeable traffic spikes from Milwaukee or from Wisconsin in general.
Compared to the previous week, there was an increase in DNS traffic to Republican political party and fundraising websites. On July 18th, the last day of the convention, we saw two considerable increases in hourly traffic compared to a week prior. The first at 14:00 EDT, an increase of 268% in traffic to these sites. The second, at 23:00 EDT with another increase at 266%. The daily aggregation on this day was an increase of 90.48% compared to daily traffic aggregations in the previous week.
For DNS traffic during the convention for TV news channels, we see steady traffic numbers with the highest peaking days before the convention on July 14, then during the late hours of July 15th.
For political news websites covering the RNC, traffic numbers tend to decrease slightly as the event progresses.
We identified an attack against a think-tank based in Washington D.C. that does policy advocacy related to presidential politics. The attack itself lasted around 3 minutes, from July 18th 13:18 to 13:22 exclusive (EDT) with a total of 3.12 million DDoS requests mitigated. The attack peaked at around 30.33k rps.
We see that major political events may not always cause significant shifts in Internet traffic. Our data indicates increases in traffic primarily to news and media organizations from July 13th onward. When it comes to cyber attacks, a majority of activity we see targets political campaigns and policy organizations.
If you want to follow more trends and insights about the Internet and elections in particular, you can check Cloudflare Radar, and more specifically our new 2024 Elections Insights report, which will be updated as elections take place throughout the year.
The 2024 French legislative election runoff on July 7 yielded surprising results compared to the first round on June 30, with the New Popular Front (NPF) gaining the most seats, followed by French President Macron’s Ensemble party, and the National Rally. Coalition negotiations will follow. In this post, we examine the ongoing online attacks against French political parties and how initial election predictions at 20:00 local time led to a noticeable drop in France’s Internet traffic.
Let’s start with the attacks, and then move on to the Internet traffic trends.
Political parties under attack
As we highlighted last week, the first round of the French elections saw specific DDoS (Distributed Denial of Service) attacks targeting French political party websites. While online attacks are common and not always election-related, recent activities in France, the Netherlands, and the UK confirm that DDoS attacks frequently target political parties during election periods.
Two French political parties were attacked shortly before the first round of elections, and a third party was targeted on June 30. This third party, indicated in green on the chart below, faced attacks on the evening of June 29. Several attempts were thwarted by Cloudflare throughout election day, from 10:00 to 23:00 UTC (12:00 to 01:00 local time). The most intense attack occurred at 19:00 UTC (21:00 local time), reaching nearly 40,000 requests per second, with a total of 620 million DDoS requests recorded on that day (June 29).
Our data indicates that the most significant attack Cloudflare intercepted targeted a party shown in yellow on the chart above. The party had already been attacked on June 23, 2024, and this subsequent attack happened on July 3 at 21:36 UTC (23:36 local time), lasting four minutes and peaking at 151,000 requests per second (rps), making it the second-largest attack we’ve observed on political parties recently. This was comparable in intensity and duration to another attack on a UK political party right after their election.
On the runoff election day, July 7, the party represented by the blue line was again a target, having been attacked previously on June 24, 27, and 29. The most severe of these occurred on June 27, with attacks reaching 118,000 rps during a day that totaled 610 million daily DDoS requests. On July 7, the attacks resumed, with the first starting at 09:55 UTC (11:55 local time) and continuing sporadically until 23:18 UTC (01:18 local time on July 8). The peak of these attacks came at 11:40 UTC (13:40 local time), reaching 96,000 rps.
While these rates may seem small to Cloudflare, they can be devastating for websites not well-protected against such high levels of traffic. DDoS attacks not only overwhelm systems but also serve, if successful, as a distraction for IT teams while attackers attempt other types of breaches.
Exit polls came with a 20:00 Internet traffic dip
Each election brings its own unique circumstances. For instance, the UK’s snap election took place on Thursday, July 4, 2024, aligning with Britain’s tradition of weekday elections. In contrast, France and many other countries hold elections on weekends, typically Sundays.
During the first round of the French elections on June 30, morning traffic was lower than the previous week and rose in the afternoon. The runoff, a week later, displayed a different pattern. Morning traffic remained stable compared to June 30, but it saw a significant decrease in the afternoon, especially after 17:30 local time. Polling stations in major cities closed at 20:00. At this time, TV media began broadcasting the first results, causing a 16% drop in traffic compared to the previous week. This trend, where traffic dips as initial results are announced, is also seen in other elections, like the UK’s.
Traffic shifts during voting day, compared to the previous week, are more revealing when viewed in detail. The map and table below summarize the traffic changes observed at the state level within France, when voting closed and initial results predictions were revealed on TV at around 20:00 local time. This was the moment when, from Cloudflare’s data perspective, attention was diverted from online use.
(Source: Cloudflare; created with Datawrapper)
The table below shows the drops in traffic on July 7, at 20:00 local time, compared to the previous week.
State
Drop in traffic (%)
Bourgogne-Franche-Comté
-19%
Grand Est
-19%
Brittany
-15%
Auvergne-Rhône-Alpes
-15%
Corsica
-14%
Occitanie
-11%
Nouvelle-Aquitaine
-11%
Normandy
-10%
Île-de-France
-10%
Hauts-de-France
-9%
Pays de la Loire
-8%
Provence-Alpes-Côte d’Azur
-7%
Centre-Val de Loire
-6%
On election day in France, Internet traffic decreased most significantly in the regions of Bourgogne-Franche-Comté and Grand Est, both in the eastern part of the country and both experiencing a 19% drop. When comparing these regions to the Île-de-France region, where Paris is located, we see a smaller traffic decrease, at 10%. In the south, in regions like Provence-Alpes-Côte d’Azur, the drop was even less pronounced, at 7%.
Mobile device usage
Also notable was the increase in mobile device request traffic share during both election days, driving the share to levels higher than usual. Over the past month, mobile device traffic share on Sundays typically ranged from 53% to 54%. However, it rose to 57% on the first election day, June 30, and increased further to 58% on the runoff day, July 7, 2024. Mobile device traffic share was especially elevated from 11:00 to 22:00 local time on these days.
DNS trends: news outlets bring results
Switching focus to domain trends, our 1.1.1.1 resolver DNS data reveals a targeted impact from the French elections, allowing for a comparison between the two election days. Analyzing French news media outlets, DNS traffic in France was significantly higher on the first election day, June 30, with a 250% increase at 20:00 local time compared to the previous week. This was 6% higher than on the runoff day, July 7.
For French TV domains, the situation reversed during the runoff on July 7, showing 31% more DNS traffic at 20:00 local time than in the first round. On June 30, DNS traffic at that time was already 274% higher than the previous week, but the increase on July 7 was even more significant, at 391% compared to June 23, 2024—the Sunday before the two election days.
For microblogging social media in France, traffic was higher during the two election days, peaking on the first round. At the close of voting polls at 20:00 local time on June 30, traffic surged 38% compared to June 23, 2024. On July 7, runoff day, traffic increased by 32% at 20:00 local time compared to June 23, but was 4% lower than on June 30.
Conclusion: keeping track of elections
In France, more attention was diverted from the Internet during the decisive runoff election day than in the first round, with a noticeable dip in traffic when TV stations announced predicted results at 20:00 local time.
If you want to follow more trends and insights about the Internet and elections in particular, you can check Cloudflare Radar, and more specifically our new 2024 Elections Insights report, which will be updated as elections take place throughout the year.
The 2024 UK general election, the first since Brexit officially began (January 31, 2020) and after 14 years of Conservative leadership, saw the Labour Party secure a majority. This blog post examines Internet traffic trends and cyberattack activity on election day, highlighting notable declines in traffic during the afternoon and evening as well as a DDoS attack on a political party shortly after polls closed.
The UK’s snap election on Thursday, July 4, 2024, typical of British Thursday weekday elections, contrasts with weekend elections in other countries. Polling stations were open from 07:00 to 22:00.
Generally, election days do not result in drastic changes to Internet traffic. Traffic typically dips during voting hours but not as sharply as during major events like national holidays, and rises in the evening as results are announced.
On July 4, 2024, traffic initially rose slightly from the previous week, then fell around noon (-2%). Significant declines began only after 16:00, with noticeable drops at 16:45 and again at 22:00 as polls closed.
Internet traffic dips across UK countries
Traffic shifts during voting day, compared to the previous week, are more revealing when viewed in detail. The map and table below summarize the traffic changes observed at the country level within the UK, where the greatest impact was observed in Northern Ireland (-10%), followed by Scotland (-6%), Wales (-5%), and England (-3%), all after 16:00.
Country
Drop in traffic (%)
Time of drop in traffic (local)
Northern Ireland
-10%
July 4, 16:00
Scotland
-6%
July 4, 20:00
Wales
-5%
July 4, 17:00
England
-3%
July 4, 16:00
Next, examining the day’s traffic changes, we observed a clear drop in Northern Ireland around 13:00 local time and during off-work hours between 16:00 and 20:00, before it began to increase again.
In Scotland, traffic fell by about 5% from 16:00 to 21:00 local time compared to the previous week.
In Wales, decreases occurred at 07:00 (4% drop), between 16:00 and 18:00 (around 5% drop), and at 21:00.
And in England, traffic decreased by approximately 3% between 16:00 and 18:00 and about 2% between 20:00 and 22:00.
In all the countries within the UK, traffic clearly increased after 23:00 local time when the voting polls had already closed and the first results started to arrive. Peak increases were reached at different times: Wales saw a 3% increase at 01:00; Northern Ireland and England experienced their highest increases of 12% and 11% respectively at 02:00; and Scotland had a 9% increase at 02:00 followed by a 12% spike at 04:00.
DNS trends: news outlets bring results
Switching focus to domain trends, our 1.1.1.1 resolver DNS data reveals a more targeted impact from the UK elections. Analyzing the participating parties, DNS traffic significantly increased on election day, peaking at 22:00 and midnight local time (up to 600% growth), and then again at 04:00 (671%).
Among the main parties, Labour, led by Keir Starmer, outperformed the Conservative Party on election day. Labour’s DNS traffic spiked at 22:00 local time, with an 866% increase from the previous week.
Analyzing official government and election-related websites, the UK differs from other countries in how results are shared. Official results weren’t continuously updated as they came in. The largest spike in DNS traffic, a 172% increase from the previous week, occurred on election morning around 07:00 local time. This increase likely happened because UK citizens were searching for the correct polling stations and other voting resources.
News sites and microblogging social media platforms in the UK experienced significant increases in usage after the polling stations closed at 22:00 local time. In the UK, news sites not only provide initial projections but also final results. DNS traffic for UK news media outlets surged 74% compared to the previous week, peaking at 104% at midnight and 04:00.
For microblogging social media in Great Britain, traffic was already 25% higher than the previous week when the polls closed (22:00), peaking at 27% at midnight and remaining elevated through the night.
We saw last week in the US, during the Biden vs Trump debate, that video streaming social platforms such as YouTube or TikTok, were used to watch through news outlets channels the debate live, with DNS traffic surging. How about the UK? DNS traffic was 10% higher than in the previous week starting at midnight, and at 01:00 local time was 15% higher.
Attacks: political parties included impact
Focusing on attacks, those are usually constant, and aren’t necessarily driven always by elections. But, as we’ve seen at the start of the war in Ukraine or more recently in the Netherlands or in France, specific events do trigger attacks. DDoS (Distributed Denial of Service) attacks remain a common method employed by attackers.
In recent days, there has been DDoS activity targeting political parties in the UK that participated in these elections. Our data shows that two parties experienced attacks that were blocked by Cloudflare. One party, represented in blue, suffered an attack on June 16, which lasted over four hours and peaked at 60,000 requests per second (rps).
The party shown in yellow was hit by four DDoS attacks on different days: June 13, 19, 26, and in the early hours of July 5 (UTC), just after the election’s first predictions were broadcast, giving a majority to the Labour Party. This was the most significant attack in recent days, peaking at 156,000 rps. It began at 01:47 local time (00:47 UTC) and ended four minutes later. Here’s a closer look at that July 5, 2024, attack:
Although these rates are small on Cloudflare’s scale, they can be devastating for unprotected websites unaccustomed to such levels of traffic.
Conclusion: high intensity election year
Even if major political events don’t always bring notable changes to Internet traffic, our data shows that in the UK, traffic decreased more significantly in the afternoon and evening, especially as voting stations remained open until 22:00.
After voting ended, news sites became the go-to resource for UK residents seeking initial predictions and results.
We also observed attacks targeting political parties in the UK, further highlighting that this election year is marked by cyberattacks aimed at influencing politically related websites.
If you want to follow more trends and insights about the Internet and elections in particular, you can check Cloudflare Radar, and more specifically our new 2024 Elections Insights report, which will be updated as elections take place throughout the year.
France is currently electing a new government through early legislative elections that began on Sunday, June 30, 2024, with a second round scheduled for July 7. In this blog, we show how Cloudflare blocked DDoS attacks targeting three different French political parties.
2024 has been dubbed “the year of elections,” with elections taking place in over 60 countries, as we have mentioned before (1, 2, 3). If you regularly follow the Cloudflare blog, you’re aware that we consistently cover election-related trends, including in South Africa, India, Iceland, Mexico, the European Union and the 2024 US presidential debate. We also continuously update our election report on Cloudflare Radar.
Recently in France, as in the early stages of the war in Ukraine and during EU elections in the Netherlands, political events have precipitated cyberattacks. In France, several DDoS (Distributed Denial of Service attack) attacks targeted political parties involved in the elections over the past few days, with two parties hit just before the first round and another on election day itself.
The first political party, shown in yellow in the previous chart, experienced a DDoS attack on June 23, 2024, peaking at 68,000 requests per second (rps); it also endured a second DDoS attack on June 29, the day before the election, peaking at 20,000 rps. Although these rates are small on Cloudflare’s scale, they can be devastating for unprotected websites unaccustomed to such levels of traffic.
The second party, represented by the blue line, was targeted on June 24, June 27, and June 29, 2024, with the most severe attack occurring on June 27, reaching 118,000 rps during a day marked by frequent DDoS spikes that had in total 610 million daily requests.
The third party was attacked on the evening of June 29 in France, with several attempts blocked by Cloudflare on election day, June 30, between 10:00 and 23:00 UTC (12:00 and 01:00 local time). The peak activity targeting this party hit nearly 40,000 rps at 19:00 UTC (21:00 local time), with a total of 620 million daily DDoS requests on election day.
Modest drops and clear traffic increases after voting ends
During the first round of the election this past Sunday, June 30, 2024, Internet traffic was initially higher than the previous week but dropped by as much as 3% at 11:30 local time (09:30 UTC) after the polls opened. Traffic began to increase again after 17:45 local time (15:45 UTC) and peaked at 20:00 local time (18:00 UTC) when the polls closed and the first projections were announced.
We will provide a trends update on the French election after the runoff scheduled for July 7, 2024.
If you want to follow more trends and insights about the Internet and elections in particular, you can check Cloudflare Radar, and more specifically our new 2024 Elections Insights report, which will be updated as elections take place throughout the year.
The Biden vs. Trump debate influenced Internet traffic at the state level in the US, with drops in traffic as high as 17% (in Vermont) during the debate.
Microblogging and video streaming platforms saw traffic changes during the debate.
Trump-related sites, including donation platforms, gained much more traction than Biden’s during and after the debate.
Emails with “Trump” in the subject had higher rates of spam and malicious content compared to those with “Biden.”
No increase in cyberattacks during the debate, but frequent DDoS attacks targeted government and political sites in the preceding months.
Internet traffic ebbs and flows usually follow human patterns, and high visibility events that are broadcast on TV usually have an impact. Let’s take a look at the first of the 2024 United States presidential debates between the two major presumptive candidates, Joe Biden and Donald Trump, for the November presidential election.
Typically, from what we usually observe, election days don’t come with highly intensive changes to Internet traffic, and the same is true for debates. Yet, debates can also draw attention that impacts traffic, especially when there is heightened anticipation. The 2024 debates are not only aired on broadcast and cable television but also streamed on platforms like YouTube, enhancing their reach and impact.
During the June 27, 2024, debate between Biden and Trump, hosted by CNN at 21:00 EST (01:00 UTC), Cloudflare noted a slight drop in nationwide Internet requests, falling to 2% below the same time a week prior at 21:15 EST (01:15 UTC). Interestingly, Internet traffic was 4% higher just before the debate started and surged to 6% above the previous week’s levels after the debate concluded at 23:45 EST (03:45 UTC).
Internet traffic dips across US states
Traffic shifts at the time of the debate, as compared to the previous week, are much more revealing at a state-level perspective than at the country level. The map below summarizes traffic changes observed at a state level:
The most significant traffic drops were seen in Vermont (-17%), South Dakota (-16%), Wyoming (-16%), and Alaska (-16%). More populous states like California, Texas, and New York saw milder reductions of between 5% and 6%, and Florida experienced a 9% drop at 21:45 local time (01:45 UTC) during the debate.
The six swing states that are said to be decisive in the election, Arizona, Georgia, Michigan, Nevada, Pennsylvania and Wisconsin, all saw traffic drop between 5% and 8%.
The initial minutes of the Biden vs. Trump debate triggered the largest traffic declines in most states, though several, including Florida, Louisiana, Georgia, Nevada, and Wisconsin, observed deeper dips midway through. States like Ohio and Missouri recorded their most substantial traffic drops towards the debate’s conclusion.
In the next table, we provide a detailed breakdown of the same perspective shown on the US map ordered by the magnitude of the drop in traffic. We include the time of the biggest traffic drop compared to the previous week, at a 5-minute granularity, and also the percentage of the drop compared to the previous week. (Illinois is not included due to data issues.)
State
Drop in traffic (%)
Time of drop in traffic (local)
Time of drop in traffic (UTC)
Vermont
-17%
21:00
1:00
Alaska
-16%
17:30
1:30
South Dakota
-16%
20:10 / 19:10
1:10
Wyoming
-16%
19:25
1:25
New Hampshire
-13%
21:05
1:05
Rhode Island
-12%
21:05
1:05
Louisiana
-11%
20:45
1:45
Massachusetts
-11%
21:05
1:05
Connecticut
-10%
21:30
1:30
Montana
-10%
19:10 / 18:10
1:10
Nebraska
-10%
20:05 / 19:05
1:05
Oklahoma
-10%
20:05
1:05
Florida
-9%
21:45
1:45
Georgia
-8%
21:45
1:45
Nevada
-8%
18:40
1:40
New Jersey
-8%
21:05
1:05
Ohio
-8%
22:25
2:25
Washington
-8%
18:30
1:30
Kentucky
-7%
21:15
1:15
North Carolina
-7%
21:15
1:15
North Dakota
-7%
20:10 / 19:10
1:10
Wisconsin
-7%
20:45
1:45
California
-6%
18:05
1:05
Iowa
-6%
20:35
1:35
Kansas
-6%
20:05
1:05
Maine
-6%
21:05
1:05
Michigan
-6%
21:05
1:05
Minnesota
-6%
20:05
1:05
New Mexico
-6%
19:10
1:10
Tennessee
-6%
20:30 / 21:30
1:30
Alabama
-5%
20:10
1:10
Arizona
-5%
18:20
1:20
Arkansas
-5%
20:25
1:25
Colorado
-5%
19:15
1:15
Indiana
-5%
21:10
1:10
New York
-5%
21:25
1:25
Pennsylvania
-5%
21:15
1:15
South Carolina
-5%
21:35
1:35
Texas
-5%
20:20 / 19:20
1:20
Idaho
-4%
19:45 / 18:45
1:45
Utah
-4%
19:05
1:05
Virginia
-4%
21:05
1:05
Delaware
-3%
21:05
1:05
Oregon
-3%
18:15
1:15
West Virginia
-3%
21:05
1:05
District of Columbia
-2%
21:55
1:55
Hawaii
-2%
15:20
1:20
Maryland
-2%
21:10
1:10
Mississippi
-2%
20:20
1:20
Missouri
-2%
21:10
2:10
Illinois
–
–
–
DNS trends: Trump-related sites see accelerated growth
Switching focus to domain trends, our 1.1.1.1 resolver data reveals a more targeted impact from the debate. Considering the candidates individually (using the official sites related to both candidates), we found that Biden-associated websites saw a 176% surge in DNS queries at around 23:00 EST (03:00 UTC), compared to the previous week.
However, Trump-associated sites saw a greater increase than Biden-associated sites, showing an increase before, during, and after the debate, with the peak growth reaching 803% over the previous week at 01:00 EST (05:00 UTC).
For donation sites, those linked to Biden were busiest before the debate on June 17 and 18, thanks to events with Barack Obama and Bill and Hillary Clinton. DNS traffic for Trump’s donation sites, as compared with the previous week, increased during the debate, growing 830% at 22:00 EST (02:00 UTC) and reaching a high of 1270% increase by 01:00 EST.
The debate aired on multiple TV channels and was streamed on YouTube. During the debate, video streaming platforms like TikTok and YouTube, which are among the top Internet services globally, saw a 4% increase in DNS traffic at 22:00 EST (02:00 UTC). Significant changes in DNS traffic on these platforms are uncommon due to their widespread popularity.
Political news sites also spiked, with a 68% traffic increase around 22:00 EST (02:00 UTC).
Microblogging social platforms like X or Threads outperformed their previous week’s traffic throughout the debate day, with growth peaking at 41% at the start of the debate around 21:00 EST (01:00 UTC).
Biden vs Trump: spam and malicious emails
In June 2024 (through June 27), Cloudflare’s Cloud Email Security service processed over 2.5 million emails containing “Biden” or “Trump” in the subject line. Trump-related subjects appeared 13% more often than those related to Biden. Moreover, emails with “Trump” had higher percentages of spam, at 3%, and malicious messages, at 0.6%, compared to 0.8% for spam and 0.2% for malicious messages with “Biden.”
The peak occurrence of spam emails with “Trump” was on June 9, at 19.8%, and the highest rate of malicious messages was on June 12, at 2.9%. For “Biden,” the highest spam rate was on June 21, at 1.2%, and the peak for malicious messages was also on June 9, at 0.8%.
Attacks: government and political impact
Focusing on attacks, those are usually constant, and aren’t necessarily driven always by elections. But, as we’ve seen at the start of the war in Ukraine or more recently in the Netherlands, events do trigger attacks. Already in June 2024, during the European elections, we recently published a blog post about the cyberattack on Dutch political-related websites that lasted two days – June 5 and 6. The main DDoS (Distributed Denial of Service attack) attack on June 5, the day before the Dutch election, reached 73,000 requests per second (rps).
Shifting our focus to the US in particular, in the weeks since April 2024, we’ve seen some DDoS attacks targeting both government, state or political-related websites in the United States. That said, we haven’t seen any substantial attacks targeting political sites during the day of debate, June 27. The most recent one we saw was this week, on June 24, and targeted a political-related website involved in the current elections. It was a small attack that lasted under 10 minutes and peaked at 35,000 requests per second (rps).
Now that we’ve explored the US presidential debate trends, let’s compare it with Internet trends from other debates in the UK and France from the week of June 24, 2024.
UK and France: debates with an impact
In other countries like the UK and France, election-related debates during the week of June 24 also serve as examples for comparison with the Biden vs Trump debate. Both the UK and France experienced more significant nationwide traffic impacts during their debates compared to the US. However, the geographic and population size of the US, coupled with the debate’s broad availability on streaming platforms, could have influenced this disparity.
In France, the snap election is scheduled for Sunday, June 30, 2024, and the runoff on July 7, 2024. The final debate among the leading candidates on Tuesday, June 25, 2024 (21:00 local time), led to a 14% drop in Internet HTTP requests, as it was broadcast nationally and carried broad interest. Despite this, the UEFA Euro 2024 football match between France and Poland on the same day, at 18:00 local time, caused an even greater traffic decrease of 16%.
The following day, Wednesday, June 26, 2024, the two main candidates for the snap UK general election — scheduled for July 4, 2024 — participated in their final debate on BBC national TV. The debate between Rishi Sunak and Sir Keir Starmer, which started at 20:15 local time, resulted in a 7% drop in UK Internet traffic compared to the previous week. The most significant decrease occurred at 20:45. At a more detailed level, Wales experienced an 11% drop during the debate, followed by England at 8%, Scotland at 7%, and Northern Ireland at 5%.
Conclusion: high intensity election year
Even if major political events don’t always bring significant changes to Internet traffic, our data shows that the Biden vs. Trump debate had an impact, especially at the state level. Microblogging and video streaming social platforms also saw traffic shifts during the debate, with Trump-related sites seeing larger spikes in DNS traffic than Biden-related sites, especially after the debate.
We also observed a higher percentage of spam and malicious emails sent with “Trump” in the subject of the messages than with “Biden.” Although we didn’t see an uptick in cyberattacks during the debate, we note that these have been frequent, especially DDoS attacks in the months before, targeting both federal and state government services as well as politically related sites.
If you want to follow more trends and insights about the Internet and elections in particular, you can check Cloudflare Radar, and more specifically our new 2024 Elections Insights report, which will be updated as elections take place throughout the year.
The 2024 European Parliament election took place June 6-9, 2024, with hundreds of millions of Europeans from the 27 countries of the European Union electing 720 members of the European Parliament. This was the first election after Brexit and without the UK, and it had an impact on the Internet. In this post, we will review some of the Internet traffic trends observed during the election days, as well as providing insight into cyberattack activity.
Elections matter, and as we have mentioned before (1, 2), 2024 is considered “the year of elections”, with voters going to the polls in at least 60 countries, as well as the 27 EU member states. That’s why we’re publishing a regularly updated election report on Cloudflare Radar. We’ve already included our analysis of recent elections in South Africa, India, Iceland, and Mexico, and provided a policy view on the EU elections.
The European Parliament election coincided with several other national or local elections in European Union member states, leading to direct consequences. For example, in Belgium, the prime minister announced his resignation, resulting in a drop in Internet traffic during the speech followed by a clear increase after the speech was over. In France, we saw a similar pattern with the announcement of legislative snap elections.
From analyzing patterns seen during previous elections in France and Brazil, we know that Internet traffic often decreases during voting hours, though not as significantly as during other major events like national holidays. This usual drop is typically followed by an increase in traffic as election results are announced.
Let’s start with a wider picture of the 2024 European Parliament election, focusing on the time of the biggest drop in Internet HTTP requests during the election days as compared to the previous week. Note that there were some national or local elections taking place at the same time, and European Union elections are known to have low turnout compared to national and local ones.
Source: Cloudflare; created with Datawrapper
Drops greater than 10% were observed only in the Czech Republic, Luxembourg, Slovakia, Cyprus, Belgium, Estonia, and Croatia. The table below includes the percentage that traffic dropped and the specific time during the election day it occurred. In countries with more than one election day, we considered the time and day of the biggest drop.
Countries
Elections day(s)
Local time
Drop in traffic %
Czech Republic
June 7 – 8
June 8, 14:30
-20%
Luxembourg
June 9
12:45
-18%
Slovakia
June 8
15:45; 19:00
-16%
Cyprus
June 9
10:00
-16%
Belgium
June 9
11:45
-14%
Estonia
June 7-9
June 9, 9:00
-13%
Croatia
June 9
18:00
-12%
Poland
June 9
18:00
-10%
Netherlands
June 6
10:15
-10%
Germany
June 9
13:45
-10%
Ireland
June 7
7:15
-9%
Finland
June 9
9:00
-9%
Portugal
June 9
15:45
-9%
Malta
June 8
12:15
-9%
Latvia
June 8
08:30, 16:15
-9%
Slovenia
June 9
18:00
-8%
Hungary
June 9
6:00
-8%
Austria
June 9
12:30
-7%
Italy
June 8 – 9
June 9, 16:00
-6%
France
June 9
13:30
-6%
Bulgaria
June 9
19:45
-5%
Greece
June 9
8:00
-5%
Spain
June 9
13:00
-4%
Lithuania
June 9
8:00
-3%
Romania
June 9
9:45
-1%
Denmark
June 9
–
–
Sweden
June 9
–
–
The data in the list above shows that Central European countries had the highest drop in Internet traffic, particularly the Czech Republic and Slovakia. Eastern Europe saw significant drops in Estonia and Poland. Southern Europe had consistent moderate drops across multiple countries, with Cyprus and Croatia showing higher losses. Northern Europe showed minimal to no traffic drop in Scandinavian countries, with Finland and Ireland experiencing moderate declines.
Looking at the specific (local) times of day during voting periods on election days, morning drops (06:00 – 10:00) were more common in Northern and Eastern Europe. Late morning to early afternoon drops (10:15 – 14:30) were predominantly observed in Western and Central Europe. Late afternoon drops (15:45 – 19:45) were more common in Central and Southern Europe.
Impact of notable announcements in Belgium and France
There’s more to say when we look at specific country trends. The 27 members of the European Union bring diversity in habits, languages, and cultures. That also impacted traffic, and this election in particular had a national impact in some of the countries.
In Belgium, national and regional elections took place on the same day, June 9. After polling stations closed at 16:00 local time (14:00 UTC), HTTP requests followed the typical pattern of increasing, peaking at 21:15 local time (19:15 UTC), with 7% more requests than the previous week. This trend was interrupted by Prime Minister Alexander De Croo’s speech at around 22:00 local time (20:00 UTC), admitting defeat in the national elections. This pattern is typical when important announcements are broadcast on TV, impacting Internet traffic.
How about France? President Emmanuel Macron announced at around 21:00 local time (19:00 UTC) that he would dissolve the national parliament for a snap legislative election. This followed the EU elections that gave a victory to his rival Marine Le Pen’s National Rally in the European Parliament vote. At the time of his speech, requests dropped 6% compared to the previous week, and increased right after Macron’s speech, peaking at 22:15 local time (20:15 UTC) with a 6% increase.
After voting ends, traffic increases
It was not only Belgium and France that had typical increases in HTTP requests at night when the first projections and results started to be announced. The same happened in the Netherlands, the first European country to enter the 2024 European Parliament election, on Thursday, June 6.— We have previously written about Dutch political websites being attacked on that day. Traffic was 4% higher than usual after 20:30 local time (18:30 UTC), and peaked at 01:15 with a 15% increase compared to the previous week.
Similar trends were seen in Italy on June 9, and in Germany on the same day. In Germany, at 21:45 (19:45 UTC), requests were already 8% higher, with a 23:00 (21:00 UTC) drop of 2% during election speeches, and a peak at 00:30 (22:30 UTC) with an 18% increase.
The same night-time trends were observed in other countries:
Slovakia had a peak increase of 24% at 23:45 local time (21:45 UTC) on June 8.
Spain saw a 21% peak increase at 21:00 local time (19:00 UTC) on June 9.
Poland had a 9% peak increase at 01:45 local time (23:45 UTC).
Portugal experienced a 29% peak increase at 00:15 local time (23:15 UTC).
Croatia had a 19% peak increase at 23:00 (21:00 UTC).
Slovenia had a 19% peak increase at 22:45 (20:45 UTC).
Lithuania had a 22% peak increase at 23:00 (20:00 UTC).
Estonia saw the highest peak increase, reaching 35% at 00:00 (21:00 UTC).
Growing interest in election information and news
Switching to domain trends, DNS traffic (using our 1.1.1.1 resolver) shows a more specific impact related to elections. Social media platforms invited users in Europe to vote, sometimes giving European or local websites as a reference. Here’s an example from Instagram:
Did this increase traffic to election-related sites in the European Union? Our DNS data shows a 26x peak growth at 19:00 UTC on Sunday, June 9, 2024. DNS traffic was already much higher compared to the previous week on June 8, with a peak growth of 8x at 17:00 UTC.
Looking at European news outlets’ domains, there was an initial 1.68x increase (compared to the previous week) at 13:00 UTC on June 9, 2024, and a second peak at 19:00 UTC.
For local election-results sites, there was a significant 55x peak growth at 22:00 UTC on June 9, 2024, compared to the previous week.
Government-focused cyberattacks
Focusing on attacks, as mentioned above, we recently published a blog post about the cyberattack on Dutch political-related websites that lasted two days – June 5 and 6. The main DDoS (Distributed Denial of Service attack) attack on June 5, the day before the Dutch election, reached 73,000 requests per second (rps).
Looking at government or state-related websites in the European Union in 2024, there have been several spikes in attacks targeting defense organizations, European courts, and educational institutions since the year started.
The main one was on February 25, 2024, when Cloudflare blocked a DDoS attack on a French government website that reached 420 million requests per hour and lasted over three hours.
Between January and June 2024, government sites in Belgium, France, and Germany were the main targets, receiving 49%, 25%, and 10% respectively of attack requests targeting EU government-related sites.
In a broader view, from January 1 to June 9, Cloudflare mitigated 8.6 billion threats to government websites in the EU, with 68% of those being DDoS threats. This amounts to an average of 53.42 million threats mitigated per day. These trends highlight the ongoing threat to critical infrastructure across Europe, with government sites frequently targeted by cyberattacks.
Just before the elections
Focusing on the five weeks before the EU election, we didn’t see significant attacks on European election-related organizations. However, there were a few DDoS threats that targeted government sites from European Union member states. Notable instances include attacks on the Bulgarian government on June 6, the French government on May 11 and June 9, another in France on May 23, Sweden on May 18 and April 29, and Denmark on May 7.
These attacks were not very large compared to others mentioned. The largest targeted the Bulgarian government on June 6, with 122 million daily DDoS requests and a peak of 110,500 requests per second at 11:29 local time (08:29 UTC).
On election day in France, June 9, a French government website was also the target of a smaller attack, with 42,000 DDoS requests per second at 11:57 local time (09:57 UTC).
Conclusion
The 2024 European Parliament election had some clear impacts on Internet traffic, and cyber threats were looming in the weeks before, most notably the Dutch political-related attack around election day.
While voting led to typical drops in Internet traffic, the announcement of results and significant political events caused spikes in activity.
If you want to follow more trends and insights about the Internet and elections in particular, you can check Cloudflare Radar, and more specifically our new 2024 Elections Insights report, that we’re updating as elections take place throughout the year.
Through Cloudflare’s Impact programs, we provide cyber security products to help protect access to authoritative voting information and the security of sensitive voter data. Two core programs in this space are the Athenian Project, dedicated to protecting state and local governments that run elections, and Cloudflare for Campaigns, a project with a suite of Cloudflare products to secure political campaigns’ and state parties’ websites and internal teams.
However, the weeks ahead of the elections, and Election Day itself, were not entirely devoid of attacks. Using data from Cloudflare Radar, which showcases global Internet traffic, attack, and technology trends and insights, we can explore traffic patterns, attack types, and top attack sources associated with both Athenian Project and Cloudflare for Campaigns participants.
For both programs, overall traffic volume unsurprisingly ramped up as Election Day approached. SQL Injection (SQLi) and HTTP Anomaly attacks were the two largest categories of attacks mitigated by Cloudflare’s Web Application Firewall (WAF), and the United States was the largest source of observed attacks — see more on this last point below.
Below, we explore the trends seen across both customer sets from October 1, 2022, through Election Day on November 8.
Athenian Project
Throughout October, daily peak traffic volumes effectively doubled over the course of the month, with a weekday/weekend pattern also clearly visible. However, significant traffic growth is visible on Monday, November 7, and Tuesday, November 8 (Election Day), with Monday’s peak just under 2x October’s peaks, while Tuesday saw two peaks, one just under 4x higher than October peaks, while the other was just over 4x higher. Zooming in, the first peak was at 1300 UTC (0800 Eastern time, 0500 Pacific time), while the second was at 0400 UTC (2300 Eastern time, 2000 Pacific time). The first one appears to be aligned with the polls opening on the East Coast, while the second appears to be aligned with the time that the polls closed on the West Coast.
However, aggregating the traffic here presents a somewhat misleading picture. While both spikes were due to increased traffic across multiple customer sites, the second one was exacerbated by a massive increase in traffic for a single customer. Regardless, the increased traffic clearly shows that voters turned to local government sites around Election Day.
Despite this increase in overall traffic, attack traffic mitigated by Cloudflare’s Web Application Firewall (WAF) remained remarkably consistent throughout October and into November, as seen in the graph below. The obvious exception was an attack that occurred on Monday, October 10. This attack targeted a single Athenian Project participant, and was mitigated by rate limiting the requests.
SQL injection (SQLi) attacks saw significant growth in volume in the week and a half ahead of Election Day, along with an earlier significant spike on October 24. While the last weekend in October (October 29 and 30) saw significant SQLi attack activity, the weekend of November 5 and 6 was comparatively quiet. However, those attacks ramped up again heading into and on Election Day, as seen in the graph below.
Attempted attacks mitigated with the HTTP Anomaly ruleset also ramped up in the week ahead of Election Day, though to a much lesser extent than SQLi attacks. As the graph below shows, the biggest spikes were seen on October 31/November 1, and just after midnight UTC on November 4 (late afternoon to early evening in the US). Related request volume also grew heading into Election Day, but without significant short-duration spikes. There is also a brief but significant attack clearly visible on the graph on October 10. However, it occurred several hours after the rate limited attack referenced above — it is not clear if the two are related.
The distribution of attacks over the surveyed period from October 1 through November 9 shows that those categorized as SQLi and HTTP Anomaly were responsible for just over two-thirds of WAF-mitigated requests. Nearly 14% were categorized as “Software Specific,” which includes attacks related to specific CVEs. The balance of the attacks were mitigated by WAF rules in categories including File Inclusion, XSS (Cross Site Scripting), Directory Traversal, and Command Injection.
Media reports suggest that foreign adversaries actively try to interfere with elections in the United States. While this may be the case, analysis of the mitigated attacks targeting Athenian Project customers found that over 95% of the mitigated requests (attacks) came from IP addresses that geolocate to the United States. However, that does not mean that the attackers themselves are necessarily located in the country, but rather that they appear to be using compromised systems and proxies within the United States to launch their attacks against these sites protected by Cloudflare.
Cloudflare for Campaigns
In contrast to Athenian Project participants, traffic to candidate sites that are participants in Cloudflare for Campaigns began to grow several weeks ahead of Election Day. The graph below shows a noticeable increase (~50%) in peak traffic volumes starting on October 12, with an additional growth (50-100%) starting a week later. Traffic to these sites appeared to quiet a bit toward the end of October, but saw significant growth again heading into, and during, Election Day.
However, once again, this aggregate traffic data presents something of a misleading picture, as one candidate site saw multiple times more traffic than the other participating sites. While those other sites saw similar shifts in traffic as well, they were dwarfed by those experienced by the outlier site.
The WAF-mitigated traffic trend for campaign sites followed a similar pattern to the overall traffic. As the graph below shows, attack traffic also began to increase around October 19, with a further ramp near the end of the month. The October 27 spike visible in the graph was due to an attack targeting a single customer’s site, and was addressed using “Security Level” mitigation techniques, which uses IP reputation information to decide if and how to present challenges for incoming requests.
The top two rule categories, HTTP Anomaly and SQLi, together accounted for nearly three-quarters of the mitigated requests, and Directory Traversal attacks were just under 10% of mitigated requests for this customer set. The HTTP Anomaly and Directory Traversal percentages were higher than those for attacks targeting Athenian Project participants, while the SQLi percentage was slightly lower.
Once again, a majority of the WAF-mitigated attacks came from IP addresses in the United States. However, among Cloudflare for Campaigns participants, the United States only accounted for 55% of attacks, significantly lower than the 95% seen for Athenian Project participants. The balance is spread across a long tail of countries, with allies including Germany, Canada, and the United Kingdom among the top five. As noted above, however, the attackers may be elsewhere, and are using botnets or other compromised systems in these countries to launch attacks.
Improving security with data
We are proud to be trusted by local governments, campaigns, state parties, and voting rights organizations to protect their websites and provide uninterrupted access to information and trusted election results. Sharing information about the threats facing these websites helps us further support their valuable work by enabling them, and other participants in the election space, to take proactive steps to improve site security.
On Tuesday, November 8, 2022, constituents cast their ballots for the 2022 US midterm elections, which included races for all 435 seats in the House of Representatives, 35 of the 100 seats in the Senate, and many gubernatorial races in states including Florida, Michigan, and Pennsylvania. Preparing for elections is a giant task, and states and localities have their work cut out for them with corralling poll workers, setting up polling places, and managing the physical security of ballots and voting machines.
We at Cloudflare are proud to be able to play a role in helping safeguard the integrity of the electoral process. Through our Impact programs, we provide cyber security products to help protect access to authoritative voting information and the security of sensitive voter data.
We have reported on our work in the election space with the Athenian Project, dedicated to protecting state and local governments that run elections; Cloudflare for Campaigns, a project with a suite of Cloudflare products to secure political campaigns’ and state parties’ websites and internal teams; and Project Galileo, in which we have helped voting rights organizations and election results sites stay online during traffic spikes.
Since our reporting in 2020, we have expanded our relationships withgovernment agencies and worked with project participants across the United States in a range of election roles to support free and fair elections. For the midterm elections, we continued to support election entities with the tools and expertise on how to secure their web infrastructure to promote trust in the voting process.
Overall, we were ready for the unexpected, as we had experience supporting those in the election community in 2020 during a time of uncertainty around COVID-19 and increased political polarization. But for the midterms, the Cybersecurity and Infrastructure Security Agency (CISA), the key agency tasked with protecting election infrastructure against cyber threats, reported the morning of November 8 that they “continue to see no specific or credible threat to disrupt election infrastructure” for the day of the election.
At Cloudflare, although we did see reports of a few smaller attacks and outages, we are pleased that the robust cyber security preparations by governments, nonprofits, local municipalities, campaigns, and state parties appeared to be successful, as we did not identify large-scale attacks on November 8, 2022.
Below are highlights on the activity we saw as we approached midterms and how we worked together with all of these groups to secure election resources.
Key takeaways from the 2022 midterm elections
For state and local governments protected under the Athenian Project
For political campaigns and state parties protected under Cloudflare for Campaigns
With our partnership with Defending Digital Campaigns, we protected 56 House campaigns, 15 political parties, and 34 Senate campaigns during the midterm elections.
Average daily application-layer attack volume against campaign sites was over 3x higher in November through Election Day than it was in October.
From October 1 through November 8, 2022, political campaign and state party sites saw an average of 149,949 threats per day.
Risks to online election groups as we approached the midterms
In preparation for the midterms, the Federal Bureau of Investigation (FBI) and CISA put out a variety of public service announcements calling attention to cyber election risks, like DDoS attacks, and providing reassurance that cyber attacks were “unlikely to result in large-scale disruptions or prevent voting.” Earlier this year, the FBI issued a warning on phishing attempts, with details about a seemingly organized plot to steal election officials’ credentials via an email with a fake invoice attached.
We also saw some threat actors announce plans to target the midterm elections. Killnet, a pro-Russia hacking group, targeted US state websites, successfully taking the public-facing websites of a number of states temporarily offline. Hacking groups will target public-facing government websites to promote mistrust in the democratic process.
Voting authorities face challenges unrelated to malicious activity, too. Without the proper tools in place, traffic spikes during election season can impede voters’ ability to access information about polling places, registration, and results. During the 2020 US election, we saw 4x traffic spikes to government elections sites.
On the political organizing side, political campaigns and state parties increasingly rely on the Internet and their web presence to issue policy stances, raise donations, and organize their campaign operations. In October 2022, the FBI notified Republican and Democratic state parties that Chinese hackers were scanning party websites for vulnerabilities.
So, what happened during the 2022 US midterm elections?
As we prepared for the midterms, we had a team of engineers ready to assist state and local governments, campaigns, political parties, and voting rights organizations looking for help to protect their websites from cyber attacks. A majority of the threats that we saw and directly assisted on were before the election, especially in the wake of many advisories from federal agencies on Killnet’s targeting of US government sites.
During this time, we worked with CISA’s Joint Cyber Defense Collaborative (JCDC) to provide security briefings to state and local election officials and to make sure our free Enterprise services for state and local governments under the Athenian Project were part of JCDC’s Cybersecurity Toolkit to Protect Elections. We provided additional support in terms of webinars, security recommendations, and best practices to better prepare these groups for the midterms.
A week before the election, we worked with partners such as Defending Digital Campaigns to onboard many political campaigns and state parties to Cloudflare for Campaigns after seeing a number of campaigns come under DDoS attack. With this, we were able to accept 21 of the Senate Campaigns up for re-election, with an overall total of 34 Senate campaigns protected under the project.
Preparing for the next election
Being in the election space means working with local government, campaigns, state parties, and voting rights organizations to build trust. Democracies rely on access to information and trusted election results.
We accept applications to the Athenian Project all year long, not just during election season — learn how to apply. We look forward to providing more information on threats to these actors in the election space in the next few months to support their valuable work.
Brasil, sei lá Ou o meu coração se engana Ou uma terra igual não há — From Tom Jobim’s song, Brasil Nativo
Brazil’s recent presidential election got significant attention from both global and national media outlets, not only because of the size of the country, but also because of premature allegations of electoral fraud. The first round of the Brazilian 2022 general election was held on October 2, and the runoff was held on Sunday, October 30. With 124 million votes counted, former president Lula da Silva (2003-2010) won with 50.9% of the votes, beating incumbent Jair Bolsonaro, who had 49.1% of the votes.
The final results of the elections as published by the official Tribunal Super Eleitoral, with more than 124 million votes counted.)
Using Cloudflare’s data, we can explore the impact that this election had on Internet traffic patterns in Brazil, as well as interest in content from election-related websites, news organizations, social media platforms, and video platforms.
Here are a few highlights: while the runoff generated much more interest to election related websites (we actually have a view to DNS queries, a proxy to websites), the first round showed bigger increases in traffic to news organizations.
For the candidate’s domains, Lula’s win had the higher impact.
Also: official results came earlier on the runoff than the first round, and spikes in traffic were higher earlier that day (October 30).
(Note: we’re using local times — that means UTC-3, that is related to the more populated regions of Brazil — in this blog, although some charts have x-axis UTC).
Let’s start by looking at general Internet traffic in Brazil.
On election days, traffic goes down (during the day)
Using Cloudflare Radar, we can see something that has also been observed in other countries that hold Sunday elections: when most people are getting outside to vote, Internet traffic goes down (in comparison with previous Sundays). We saw this in the two rounds of the Presidential elections in France back in April 2022, in Portugal’s legislative elections in January 2022 and now, in Brazil.
We can also compare Sundays in October. There were five weekends. The two that had elections show the same pattern of lower traffic during the day, as seen in the previous chart. Comparing the two election days, there was a bigger drop in traffic on October 30 (down 21% at around 18:00 local time), than on October 2 (down 10% at around 20:00). Related or not, there was a bigger turnout on the runoff (124 million votes) than on the first round (123 million). Here’s the view on October 30:
And here’s October 2:
A more clear view in comparing the October weekends, and where you can see how the October 2 and 30 Sundays have the same pattern and different from the others three of the month, is this one (bear in mind that the x-axis is showing UTC time, it’s -3 hours in Brazil):
If we look at the main network providers (ASNs) in Brazil, the trend is the same. Claro (AS28573) also shows the drop in traffic on October 30, as does Telefonica (AS27699):
Here’s Telefonica:
We observed a similar impact from the October 30 runoff election to traffic from different states in Brazil, including São Paulo, Rio de Janeiro, Rio Grande do Norte, Minas Gerais, and Bahia.
Mobile device usage greater on weekends (and on election days)
When we look at the share of Brazil’s Internet traffic from mobile devices during October, we find that the highest percentages were on October 2 (first round of the elections, 66.3%), October 9 (66.4%) and October 30 (runoff election, 65%). We’ve seen this in other elections, an increase in mobile device traffice, so this seems to follow the same trend.
This chart also shows how mobile device usage in Brazil is at its highest on the weekends (all the main spikes for percentage of mobile devices are over the weekend, and more on Sundays).
Now, let’s look at anonymized and aggregated DNS traffic data from our 1.1.1.1 resolver. This data provides a proxy for traffic to, and thus interest in, different categories of sites from users in Brazil around the election.
Election-related sites: higher interest in the runoff
Brazil has government websites related to elections, but also its own Tribunal Superior Eleitoral (Electoral Superior Court) that includes a website and app with live updates on the results of the elections for everyone to check. Looking at those related domains and using mean hourly traffic in September as a baseline, we can see that the October 2 first round spiked to 16x more DNS queries at 20:00 local time. However, DNS query traffic during the runoff election peaked at 18:00 local time on October 30 with 17.4x more DNS traffic as compared to the September baseline.
We can look more closely at each one of those two election days. On October 2, traffic had its first significant increase at around 17:00 local time, reaching 15x more requests to election-related domains as compared to the September baseline. This initial peak occurred at the same time the polling stations were closing. However, the peak that day, at 16x above baseline, was reached at 20:00 local time, as seen in the figure below.
On Sunday, October 30, 2022, the pattern is similar, although the peak was reached earlier, given that results started to arrive earlier than on the first round. The peak was reached at around 18:00 local time, with request traffic 17.4x above baseline.
As seen in the figure below, Lula first led in the official results at 18:45 local time, with votes from 67% of the polling stations counted at that time. Around 20:00 Lula was considered the winner (the peak seen in the previous chart was at that time).
Candidate websites: in the end, winner takes all?
For Lula-related domains, there are clear spikes around the first round of elections on October 2. A 13x spike was observed on October 1 at around 21:00 local time. Two notable spikes were observed on October 2 — one at 16.7x above baseline at 09:00 local time, and the other at 10.7x above baseline at 21:00 local time. During the October 30 runoff election, only one clear spike was observed. The spike, at 16.7x above baseline, occurred at around 20:00, coincident with the time Lula was being announced as the winner.
For Bolsonaro-related domains, we observed a different pattern. Increased traffic as compared to the baseline is visible in the days leading up to the first round election, reaching 10x on September 30. On October 2, a 8x spike above baseline was seen at 18:00 local time. However, the two most significant spikes seen over the course of the month were observed on October 16, at 20x above baseline, a few hours after the first Lula-Bolsonaro television debate, and on October 25, at around 20:00, at 22x above baseline. That was the last week of campaigning before the October 30 runoff and when several polling predictions were announced. The second and last Bolsonaro-Lula debate was on October 28, and there’s a spike at 22:00 to Lula’s websites, and a smaller but also clear one at 21:00 to Bolsonaro’s websites).
News websites: more interest in the first round
With official election results being available more rapidly, DNS traffic for Brazilian news organization websites peaked much earlier in the evening than what we saw in France, for example, where more definitive election results arrived much later on election day. But another interesting trend here is how the first round, on October 2, had 9.1x more DNS traffic (compared with the September baseline), than what we saw during the runoff on October 30 (6.1x).
The way the results arrived faster also had an impact on the time of the peak, occurring at around 19:00 local time on October 30, as compared to around 20:00 on October 2.
At 19:45 local time on October 30, Lula was already the winner with more than 98% of the votes counted. After 20:00 there was a clear drop in DNS traffic to news organizations.
On October 2, it was only around 22:00 that it became official that there would be a runoff between Lula and Bolsonaro. Peak request volume was reached at 20:00 (9x), but traffic remained high (8x) at around 21:00 and until 22:00, like the following chart shows:
Conclusion: Real world events impact the Internet
Cloudflare Radar, our tool for Internet insights, can provide a unique perspective on how major global or national events impact the Internet. It is interesting to not only see that a real world event can impact Internet traffic (and different types of websites) for a whole country, but also see how much that impact is represented at specific times. It’s all about human behavior at relevant moments in time, like elections as a collective event is.
We blogged previously about some trends concerning the first round of the 2022 French presidential election, held on April 10. Here we take a look at the run-off election this Sunday, April 24, that ended up re-electing Emmanuel Macron as President of France.
First, the two main trends: French-language news sites outside France were clearly impacted by the local rule that states that exit polls can only be published after 20:00.
And Internet traffic was similar on both the election days (April 10 and 24) and that includes the increase in use of mobile devices and interest in news websites — there we also saw a clear interest in the Macron-Le Pen debate on April 20.
We have discussed before that election days usually don’t have a major impact on overall Internet traffic. Let’s compare April 10 with 24, the two Sundays when the elections were held. The trends throughout the day are incredibly similar (with a slight increase in traffic on April 24), even with a two-week gap between them.
Another election-day trend is the use of mobile devices to access the Internet, mainly at night. The largest spikes in number of requests made using mobile devices in France during April seemed to be all election-related:
#1. April 10 (first round of the election), 21:00 local time. 58% of traffic by mobile devices.
#2. April 24 (second round of the election), 22:00. 57% mobile traffic.
#3. April 20 (presidential debate), 22:00. 56% mobile traffic.
Not only did both the election Sundays (after the polling stations were closed) have an impact on mobile traffic in France, but the presidential debate (Wednesday, April 20) had the same type of impact, increasing requests from mobile devices.
The TV debate was seen by 15.6 million viewers in France and lasted between 21:00 and 22:45, local time; at the same time mobile traffic was higher than in any other Wednesday and was the #3 spike of April, with 10% more mobile requests than in the previous Wednesday at the same time.
The special case of French-language news sites
For the elections, local rules state that French media is barred from publishing partial results or polls of any kind until 20:00, the time when voting stations in metropolitan France officially close. So, that means that French news outlets have to wait for the allotted hour to give official projections.
Given that, we looked at French-language news websites from French-speaking countries like Switzerland and Belgium. They aren’t bound by French law and can show information about exit polls earlier (bear in mind that in most French cities polling stations close at 19:00 and only in the bigger cities does it go on until 20:00).
We can clearly see that requests to French-language news sites outside France clearly spiked earlier than those in France. News websites in France had spikes after 20:00 local time on both elections days, but Belgian and Swiss news sites had major increases in traffic at 19:00 on April 10 (1857% more than the previous Sunday!). For the runoff elections on April 24, the biggest spike of the month was at 18:00 (3100% more requests than the previous Sunday), but it was also higher than on previous days one hour later, at 19:00 (3080% higher).
There are no spikes at all related to the French debate (April 20), so that seems to show that those Belgian and Swiss news sites had a huge increase of French citizens eager to see the polls before 20:00.
Election results change online patterns
We saw two weeks ago that official election websites had a clear spike in requests on April 10, the first round of the elections. Here we’re looking at DNS request trends to get a sense of traffic to Internet properties.
Official French election-related websites had an increase in traffic throughout the week prior to the first round, after Monday, April 4, but it’s no surprise that the two major spikes were on both the elections’ day. How much? Here is the breakdown by bigger spikes in traffic:
#1. April 10 (first round of the election), 00:00 local time. 925% more requests than the previous Sunday (at the same time).
#2. April 24 (second round of the election), 20:00. 707% more requests.
#3. April 10 (first round of the election), 20:00. 370% more requests.
#3. April 11, 10:00. 115% more requests than the previous Monday.
(there’s a draw at these last two spikes)
News sites go up after polling stations close
Regarding the main French news websites, as we saw two weeks ago, 20:00 local time, after the polling stations are all closed, and the first major polls are revealed continues to be the time of the biggest spikes of the whole month.
The biggest spike of the month in our aggregate DNS chart, that shows trends from 12 news websites, was definitely on April 10, the first round election day, around 20:00 local time, when those domains had 116% more traffic than at the same time on the previous Sunday. And the second-biggest spike was the runoff election day, on April 24, at the same time (20:00 local time), with an increase of 142% in traffic compared to the previous Sunday at the same time.
Very close to those two spikes is Monday morning, April 11, after the first round of the elections. At 10:00 local time requests were 45% higher than in the previous Monday. The Macron-Le Pen debate on Wednesday, April 20, also had a spike. At 21:00, when it was starting, requests were 56% higher than on the previous Wednesday.
The same trend is seen on the major French TV station websites, with a clear isolated spike on April 10 (the first round election day) at 20:00 local time, with a 472% increase in traffic compared to the previous Sunday, when the main exit polls were announced. Something similar, at the same time (20:00), on April 24, with a 375% increase in requests compared to the previous Sunday.
That’s only matched, again, by the April 20 debate. At 21:00 traffic was 308% higher than the previous Wednesday, so people were clearly taking notice of the debate and checking news outlets and TV station websites — there were French sites like france.tv that transmitted via streaming.
Conclusion
When people are really eager to see something as important as election results, they go and search where the first polls are (in this case, before 20:00 local time, they are outside France).
Also, in two different election moments in France separated by two weeks, there are clear similarities in Internet trends that show the way people use the Internet during election periods. That’s more clear when results start to arrive, but also a debate as important for a presidential election as the Le Pen-Macron one, also impacts not only the Internet traffic but also the attention to news and TV websites.
Nous avons publié un article de blog consacré à certaines tendances concernant le premier tour de l’élection présidentielle française de 2022, qui s’est déroulé le 10 avril. Nous nous intéressons ici au second tour de l’élection, qui a eu lieu le dimanche 24 avril et a abouti à la réélection d’Emmanuel Macron à la présidence de la France.
Tout d’abord, les deux principales tendances : les sites d’information francophones situés hors de France ont été clairement impactés par la réglementation locale, qui stipule que les estimations ne peuvent être publiées qu’après 20 heures.
Le trafic Internet a été similaire les deux jours de l’élection (les 10 et 24 avril), et cela inclut l’augmentation de l’utilisation des appareils mobiles et l’intérêt pour les sites d’actualités – – là aussi, nous avons constaté un net intérêt pour le débat Macron-Le Pen du 20 avril.
Nous avons déjà évoqué le fait que les jours d’élections n’ont généralement pas un impact majeur sur le trafic Internet global. Comparons les journées des 10 et 24 avril, les deux dimanches où ont eu lieu les élections. Les tendances tout au long de la journée sont incroyablement similaires (avec une légère augmentation du trafic le 24 avril), même à deux semaines d’intervalle.
Une autre tendance des jours d’élection est l’utilisation d’appareils mobiles pour accéder à l’internet, principalement la nuit. Les plus importants pics du nombre de requêtes transmises depuis des appareils mobiles en France au mois d’avril semblent être tous liés aux élections :
N°1. 10 avril (premier tour de l’élection), 21 heures, heure locale. 58 % du trafic provenait d’appareils mobiles.
N°2. 24 avril (deuxième tour de l’élection), 22 heures. 57 % de trafic mobile.
N°3. 20 avril (débat présidentiel), 22 heures. 56 % de trafic mobile.
Les deux dimanches de l’élection (après la fermeture des bureaux de vote) ont eu un impact sur le trafic mobile en France, et le débat présidentiel (mercredi 20 avril) a eu un impact semblable, entraînant une augmentation des requêtes provenant d’appareils mobiles.
Le débat télévisé a été regardé par 15,6 millions de téléspectateurs en France et a été diffusé de 21 heures à 22h45, heure locale ; au même moment, le trafic mobile a été plus élevé que tout autre mercredi et a constitué le pic n°3 du mois d’avril, avec une augmentation de 10 % des requêtes mobiles par rapport au mercredi précédent à la même heure.
Le cas particulier des sites d’actualités en langue française
Pour les élections, la réglementation locale stipule que les médias français ne peuvent pas publier de résultats partiels ou de sondages de quelque nature que ce soit avant 20 heures, heure de fermeture officielle des bureaux de vote en France métropolitaine. Cela signifie donc que les médias français doivent attendre l’heure prévue pour annoncer les estimations officielles.
Nous avons donc consulté les sites web d’actualités en langue française de pays francophones tels que la Suisse et la Belgique. Ces sites ne sont pas liés par la loi française et peuvent diffuser plus tôt des informations concernant les estimations (n’oubliez pas que dans la plupart des villes françaises, les bureaux de vote ferment à 19 heures, et qu’ils ne restent ouverts jusqu’à 20 heures que dans les grandes villes).
Nous voyons clairement que les requêtes transmises aux sites d’actualités francophones situés hors de France ont connu un pic plus tôt dans la journée que celles transmises aux sites situés en France. Les sites d’actualités situés en France ont connu des pics après 20 heures, heure locale, lors des deux jours des élections, mais les sites d’information belges et suisses ont connu des hausses de trafic importantes à 19 heures le 10 avril (1857 % de plus que le dimanche précédent !). Pour le second tour des élections le 24 avril, le pic le plus important du mois a été enregistré à 18 heures (3100 % de requêtes en plus par rapport au dimanche précédent), mais il était également plus élevé que les jours précédents une heure plus tard, à 19 heures (3080 % de plus).
Aucun pic n’est lié au débat français (20 avril), ce qui semble indiquer que les sites d’actualités belges et suisses ont connu une forte augmentation de la fréquentation due au nombre de citoyens français désireux de consulter les sondages avant 20 heures.
Les résultats des élections modifient les modèles en ligne
Nous avons constaté, il y a deux semaines, que les sites web officiels des élections ont connu un pic de requêtes clairement visible le 10 avril, date du premier tour des élections. Nous examinons ici les tendances des requêtes DNS pour évaluer le trafic circulant vers les propriétés Internet.
Les sites officiels français dédiés aux élections ont connu une augmentation du trafic tout au long de la semaine précédant le premier tour, après le lundi 4 avril, mais c’est sans surprise que les deux pics majeurs ont été observés le jour des élections. Quel volume ? Voici la répartition en fonction des plus grands pics de trafic :
N°1. 10 avril (premier tour de l’élection), minuit, heure locale. 925 % de requêtes en plus par rapport au dimanche précédent (à la même heure).
N°2. 24 avril (deuxième tour de l’élection), 20 heures. 707 % de requêtes en plus.
N°3. 10 avril (premier tour de l’élection), 20 heures. 370 % de requêtes en plus.
N°3. 11 avril 10 heures. 115 % de requêtes en plus par rapport au lundi précédent.
(Ces deux derniers pics sont égaux)
La fréquentation des sites d’actualités augmente après la fermeture des bureaux de vote
En ce qui concerne les principaux sites d’actualités français, comme nous l’avons vu il y a deux semaines, c’est à 20 heures, heure locale, après la fermeture de tous les bureaux de vote et la révélation des premiers grands sondages que les plus importants pics mensuels continuent d’être observés.
Le plus important pic du mois sur notre graphique DNS agrégé, qui présente les tendances de 12 sites d’actualités, a sans conteste été observé le 10 avril, jour du premier tour des élections, vers 20 heures, heure locale, lorsque ces domaines ont enregistré un trafic 116 % supérieur au dimanche précédent à la même heure. Le deuxième pic le plus important a été enregistré le jour du second tour des élections, le 24 avril, à la même heure (20 heures, heure locale), avec une augmentation de 142 % du trafic par rapport au dimanche précédent à la même heure.
Très proche de ces deux pics se trouve le lundi matin du 11 avril, après le premier tour des élections. À 10 heures, heure locale, le nombre de requêtes était supérieur de 45 % à celui enregistré le lundi précédent. Le débat Macron-Le Pen, le mercredi 20 avril, a également provoqué un pic. À 21 heures, heure de début du débat, le nombre de requêtes était 56 % plus élevé que le mercredi précédent.
On observe la même tendance sur les sites des grandes chaînes de télévision françaises, avec un pic clair et isolé à 20 h, heure locale, le 10 avril (jour du premier tour des élections) et une augmentation de 472 % du trafic par rapport au dimanche précédent, lors de l’annonce des principales estimations. Un pic semblable est constaté à la même heure (20 heures), le 24 avril, avec une augmentation de 375 % des demandes par rapport au dimanche précédent.
Ce pic n’est égalé, une fois encore, que par le débat du 20 avril. À 21 heures, le trafic était 308 % plus élevé que le mercredi précédent, ce qui signifie que le public était clairement attentif au débat et consultait les sites des médias et des chaînes de télévision. Certains sites français, comme france.tv, diffusaient en streaming.
Conclusion
Lorsque les personnes sont vraiment impatientes de consulter une information aussi importante que les résultats d’une élection, ils cherchent les sites sur lesquels sont diffusées les premiers estimations (dans ce cas, avant 20 heures, heure locale, ils sont situés hors de France).
Par ailleurs, lors de deux échéances électorales différentes en France, à deux semaines d’intervalle, on observe de nettes similitudes dans les tendances Internet qui montrent de quelle façon les personnes utilisent l’Internet en période électorale. Cela devient plus clair lorsque les résultats commencent à arriver, mais un débat aussi important pour une élection présidentielle que le débat Le Pen-Macron a également un impact non seulement sur le trafic Internet, mais également sur l’attention portée aux sites d’information et de télévision.
Vous pouvez garder un œil sur ces tendances grâce à Cloudflare Radar.
The first round of the 2022 French presidential elections were held this past Sunday, April 10, 2022, and a run-off will be held on April 24 between the top two candidates, Emmanuel Macron and Marine Le Pen. Looking at Internet trends in France for Sunday, it appears that when people were voting Internet traffic went down, and, no surprise, it went back up when results are coming in — that includes major spikes to news and election-related websites.
Cloudflare Radar data shows that Sundays are usually high-traffic days in France. But this Sunday looked a little different.
The seven-day Radar chart shows that there was a decrease in traffic compared to the previous Sunday between 08:00 and 16:00 UTC, that’s 10:00 and 18:00 in local time — bear in mind that polling stations in France were open between 08:00 and 19:00 (or 20:00 in big cities) local time. So, the decrease in traffic was ‘inside’ the period when French citizens were allowed to vote.
That’s a similar trend we have seen in other elections, like the Portuguese one back in January 2022.
The time of the French election day with the largest difference compared to the previous Sunday was 14:00 UTC (16:00 in local time), when traffic decreased as much as 16% (as the previous 7-day chart shows). That’s clear in this chart:
That doesn’t show us precisely how people use the Internet differently on an election day — note that we already saw in the past how the weather, times of the year or even events affect human behaviour and subsequently Internet trends.
Let’s look deeper into those trends. We know that weekdays, weekends and even Sundays have, in many countries, specific patterns so, when we compare the previous four Sundays in France since March 20, we can see some trends highlighted in the next chart:
April 10, Election Day, was the Sunday with the most traffic of the previous month at 06:30 UTC (08:30 local time) and in several periods between 16:30 and 20:45 UTC (18:30 and 22:45 local time).
April 10, Election Day, was the Sunday with the least traffic of the previous month in several periods between 09:45 and 11:15 (11:45 and 13:15 local time) and it was the #3 out of #4 with less traffic between 12:15 and 16:15 (14:15 and 18:15 local time).
This seems to show patterns such as: before going to vote more people than usual were online on Sunday, Election Day (08:30 local time), but traffic went down considerably in the late morning period between (11:30-13:15) and again after lunch (14:15 and 18:15) shortly before the polling stations were closed.
The first exit polls started to be published around 18:40 local time (seen in the second and biggest green circle in the previous chart), but the main exit poll was at 20:00 local time, when all the polling stations were already closed, at that time Internet traffic in France was at its highest compared to Sundays during the past 30 days (seen in the third green circle in the previous chart, 18:00 UTC).
How about mobile devices’ usage trends? People in France were definitely using their mobile devices more on Election Day, and that is also evident when compared to the previous Sunday, April 3.
On Election Day, April 10, 2022, at around 09:00 local time mobile usage represented 60% of Internet traffic and had another spike at 21:00 local time with 58% (the seven-day average for mobile usage in France is 48%).
When results arrive, people go online
Official websites usually aren’t the most popular sites in a given country, their popularity is mostly connected to when citizens have to fill in their tax forms online or want to see something like election results — although news media outlets are also important there. Here we’re looking at DNS request trends to get a sense of traffic to Internet properties.
Official French election-related websites like elections.interieur.gouv.fr (where the results are published) had an increase in traffic throughout the week mainly after Monday, April 4, but on election day there were two major spikes.
The first spike in traffic was around 20:00 local time (370% more than the previous Sunday at the same time), when all the polling stations were already closed and the first major polls were revealed. But the main spike was later, at midnight (local time), when 84% of the votes were already counted and published — Macron was leading (27%) followed closely by Le Pen (25%). That spike represented 925% more requests than in the previous Sunday.
The news Internet traffic spike ‘knocks’ at 20:00
When there are elections in a country, people tend to see the analysis and results using media outlets from radio to TV, but also the Internet — media websites and social media. Let’s focus on French media outlets. The biggest spike of the week in our aggregate DNS chart, that shows trends from 12 news websites, was definitely on Election Day, around 20:00 local time, when those domains had 116% more traffic than at the same time on the previous Sunday.
Nonetheless, after 16:00 local time, traffic started to increase to those news outlets and by 18:00 local time it had its largest spike of the week with sustained growth until 20:00. At 23:00 local time there was another increase in traffic and after that it started to decrease. But, this Monday morning, traffic at 08:00 was already higher again than during the previous week (Election Day excluded). So, no surprise, Sunday night was when people were looking more into the news.
The same trend is seen on the major French TV station websites, with an even more isolated spike at 20:00 local time and a 472% increase in traffic compared to the previous Sunday, when the main exit polls were announced.
This was also similar to the broadcast radio website trends. Besides the 20:00 local time spike (272% increase compared to the previous Sunday), there was also a big one at 23:00 local time (300%) and a Monday morning spike with higher than before traffic (82% increase):
How about social media?
Regarding social media in France (looking at the aggregate DNS of the several sites), there’s no clear trend regarding the elections, but there were slightly fewer requests than on the previous Sunday. So social media doesn’t appear to have been as impacted by the elections as news websites.
Conclusion
Although there aren’t big changes in Internet traffic, like those seen in countries that shut down the Internet during election periods, Election Day seems to influence human and Internet patterns, in this case when results started to pour in on election night people went to news or official election websites.
As the election season has ramped down and the new Presidential Administration begins, we think it’s important to assess whether there are lessons we can draw from our experience helping to provide cybersecurity services for those involved in the 2020 U.S. elections.
Cloudflare built the Athenian Project – our project to provide free services to state and local election websites – around the idea that access to the authoritative voting information offered by state and local governments is key to a functioning democracy and that Cloudflare could play an important role in ensuring that election-related websites are protected from cyberattacks intended to disrupt that access. Although the most significant challenges in this election cycle fell outside the realm of cybersecurity, the 2020 election certainly validated the importance of having access to definitive sources of authoritative election information.
We were pleased that the robust cybersecurity preparations we saw for the 2020 U.S. election appeared to be successful. From the Cloudflare perspective, we had the opportunity to witness firsthand the benefits of having access to free cybersecurity services provided to organizations that promote accurate voting information and election results, state and local governments conducting elections, and federal U.S candidates running for office. As we protect many entities in the election space, we have the ability to identify, learn and analyze attack trends targeted at these sites that provide authoritative election information. We hope that we will continue to be able to assist researchers, policymakers and security experts looking to support best practices to protect the integrity of the electoral process.
Supporting free and fair elections
Many state and local governments bolstered their security postures ahead of the 2020 elections. There have been partnerships between governments, organizations, and private companies assisting election officials with the tools and expertise on best ways to secure the democratic process. Additionally, the spread of COVID-19 has prompted unprecedented challenges on how citizens can vote safely and securely.
Before the 2020 U.S. election, we detailed much of the activity targeting those in the election space to prepare for election day. To the relief of security experts, there were no significant publicly reported cybersecurity incidents as Chris Krebs, Director of the Cybersecurity and Infrastructure Security Agency during the 2020 election described it as “just another Tuesday on the Internet.” On November 12, 2020, a joint statement from the leading election security organizations stated “The November 3rd election was the most secure in American history . . . [T]here is no evidence that any voting system deleted or lost votes, changed votes, or was in any way compromised.”
At Cloudflare, we had a team of over 50 employees monitoring and addressing any issues to ensure we were providing our highest level of support to those working in the election space. It is important to note that our services do not protect electronic voting boxes or ballot counters; instead, Cloudflare services provide protection to websites, applications, and APIs. But we do protect many websites that provide pertinent information on the electoral process in the United States. This includes a wide range of players in the election space that facilitate voter registration, provide information on polling places, and publish election results. Since the 2016 election, state and local government websites that provide information such as voter registration, polling places, and election results, which have been increasingly targeted with cyberattacks.
Protecting organizations in the election space with Project Galileo
We launched Project Galileo in 2014 to provide a free set of security services to a range of vulnerable groups on the Internet such as human rights organizations, journalists and social justice organizations. Under the project, we currently protect more than 1,400 organizations working in regions all over the world with many organizations that work towards providing accurate voting information, tackling voter suppression, providing resources on voting rights and publishing election results. Cloudflare works with a variety of different types of non-governmental entities under Project Galileo, but we generally put them into two groups: participants, who are granted the benefits of Project Galileo, and partners, who work with us to identify other organizations who might be worth supporting. Our partners are typically larger civil society organizations and high profile NGOs, who work with entities who might benefit from our services and decide who should receive Cloudflare protections under the project.
Many of these organizations need cybersecurity protections well before election day. Belmont University is a private, four-year university located in Nashville, Tennessee. Shortly after the University was selected to be the site of the third and final 2020 U.S. Presidential Debate, the University reached out to Cloudflare asking for assistance. As part of the support for the debate, Belmont launched a new website to provide a centralized space for volunteers, media, and the community to prepare and organize the debate.
The project was quickly accepted to Project Galileo and we worked with Paul Chenoweth, Web Programming Service Manager for Belmont University to tackle concerns over server capacity, visitor traffic, site security, and analytics. Chenoweth explains, “We faced a number of web site challenges in 2008 when the university hosted the Town Hall Presidential Debate and with a totally new set of conditions in 2020, we did not know what to expect. We were worried about our site being taken down by malicious actors but also by unpredictable surges in traffic to the site. The Cloudflare team helped us create firewall rules, lock down our origin, and provided support during the Presidential debate.” Due to the spread of COVID-19, the debate website was the primary source of information for media registration, volunteer applications, and the event calendar for more than 40 themed virtual education events for the community. Overall, the university saw a 5x increase in traffic and blocked more than 80,000 malicious HTTP requests targeting their site.
Read stories from these organizations and Project Galileo here.
Under Project Galileo, we provide powerful cybersecurity tools to assist organizations such as Vote America, U.S. Vote Foundation, Decision Desk HQ, and many more working in the election space to identify and mitigate attacks targeting their web infrastructure. Along with protection from malicious DDoS attacks, our services also help with large influxes of unexpected traffic as organizations tend to see traffic spikes during voter registration deadlines. During the months leading up to elections, many of these organizations provided up to date information on the changing voting processes due to COVID-19. During the ballot count, many organizations posted election results online as state and local governments began reporting official numbers.
Many of the election-related organizations under Project Galileo allow you to register to vote, view the status of your voting ballot, and much more. States often hold their state and presidential primaries on different dates with the earliest primaries for 2020 held in March with 24 states and June with 23 states. When looking at cyberattacks against election organizations during the elections, the Cloudflare WAF blocked more than 10 million attacks in 2020. We can see that the WAF mitigated a majority of attacks during these two months, as many states held elections and voter registration deadlines.
Protecting election websites with the Athenian Project
In 2017, we launched the Athenian Project to provide our highest level of service to U.S. state and local governments running elections. This includes county board of election websites, Secretaries of State, and many smaller municipalities that register citizens to vote and publish election results. Under the Athenian Project, we protect more than 275 election entities in 30 states. In the past year, we onboarded more than 100 government election sites in preparation for the November 3rd election.
Read stories from state and local governments protected under the Athenian project here.
During the month leading up to elections, we had a team of engineers ready to assist state and local governments looking for help protecting their websites from cyberattacks. We onboarded Solano County in California, who engaged with our team on the best way to secure their election resources as we approached November 3rd. “The right to a free and fair election is one of the most basic civil rights we enjoy as Americans; it is a right upon which many of our foundational civil rights depend. Creating the conditions for transparent, clear, and truthful communications about the process and outcomes of elections is crucial to maintain the public trust in our electoral process”, saysTim Flanagan, Chief Information Officer for Solano County. In a few hours, we onboarded the county to Cloudflare and implemented best-practices tailored for election entities that use our services under the Athenian Project. “Cloudflare’s services added additional layers of security to our web presence that raised confidence in our ability to assure County’s residents that our election results were trustworthy.”
Starting in November, we saw traffic to government election sites increase as many people looked for polling places or how to contact local election officials. We also saw those traffic spikes after election day, as many election websites post periodic updates as the counting of ballots ensues. We reported many of these traffic spikes in the Election Dashboard with Cloudflare Radar.
For cyberattacks targeting government election websites, we found a majority of attacks before election day and primarily in September with about 50 million HTTPS requests blocked by the web application firewall.
From November 4 to November 11, the WAF mitigated 16,304,656 malicious requests to sites under the Athenian Project. During this time, many state and local governments were counting ballots and posting election results to their websites. A majority of attacks were blocked by the managed ruleset in the WAF – a set of rules curated by Cloudflare engineers to block against common vulnerabilities – including SQLi, cross-site scripting and cross-site forgery requests. These are not sophisticated attacks that we see, but hackers looking for vulnerabilities to access or modify sensitive information. For example, file inclusion is an attack targeting web applications to upload malware to steal or modify the content of the site.
Protecting Political Campaigns in 2020
In January 2020, we launched Cloudflare for Campaigns, a suite of free security services to federal campaigns with our partnership with Defending Digital Campaigns. During the course of the year, we onboarded 75 campaigns ranging from House, Senate, and Presidential candidates running for election in 2020. At Cloudflare, we have a range of campaigns that use our services ranging from free up to our Enterprise level plan. Overall, we protected more than 450 candidate sites running for federal office in 2020.
In 2020, the average number of attacks on U.S. campaign websites on Cloudflare per month was about 13 million. When comparing attacks against political campaigns and government election sites, we saw more DDoS attacks rather than hackers trying to exploit website vulnerabilities. As depicted below, campaigns used Cloudflare’s layer 7 DDoS protection that automatically monitors and mitigates large DDoS attacks, alongside rate-limiting to mitigate malicious traffic. For election websites, it’s clear that hackers tried to exploit common website vulnerabilities that were blocked by the WAF and firewall rules, with the goal of gaining access to internal systems rather than make the site inaccessible like we see in DDoS attacks.
Lessons learned and how we move forward
We learned a lot from preparing for the 2020 U.S. election while engaging with those in the election space and learned to be flexible in the face of the unexpected. We learned that COVID-19 had impacted many of these groups at a disportionate rate. For example, organizations that work in promoting online voter registration were well suited for the move to online that we found ourselves in during COVID-19. For political candidates, they had to adapt to moving campaign events and outreach to an online environment rather than the traditional campaign operations of door-knocking and large fundraising events. This move online meant that campaigns needed to pay more attention to digital risks.
We also learned as we approached the November election that the election space involves a range of players. Protecting elections requires not only working with governments to secure their websites for the unexpected, but also working with campaigns and non-profit organizations who work on election-related issues. We appreciated the fact that Cloudflare has many different projects that support a range of players working in promoting trust in the electoral process, giving us the flexibility to protect them. Many of these players need different levels of support and assistance with how to properly protect their web infrastructure from cyberattacks, and having a range of projects offering a different level of plans and support, helped us in finding the best way to protect them. We were able to provide a free set of services to a wide range of players each with separate goals but a common mission: providing authoritative information to build trust in the electoral process.
Both the awareness of the importance of election security and election security itself has improved since the 2016 election. We have seen the benefits of sharing information across many partners, organizations, and local players. To help prepare state and local governments for elections, we conducted webinars and security tunings sessions for many of these election players. In the case of state and local governments we protect under the Athenian Project, as we conducted more security training, we saw many participants recommend others in their state to ensure they were protected as well. For example, a week before the general election, the Wisconsin Election Commission sent an election security reminder with resources on how to mitigate a DDoS attack with Cloudflare to county and municipal clerks across Wisconsin.
At Cloudflare, we worked with a variety of government agencies to share threat information that we saw targeted against these participants. Days before the November 3rd election, we were invited to the last meeting conducted by the Cybersecurity and Infrastructure Security Agency to share threats data we had seen against government election websites and how they could be mitigated to more than 200 general election stakeholders, including counties across the United States.
Weeks after the election, I spoke with Stacy Mahaney, the Chief Information Officer at the Missouri Secretary of State, which is currently protected under the Athenian Project. His comment aptly summarized Cloudflare’s security practices. “Security is like an onion. Every layer of security that you add protects against various layers of attack or exposure. We were able to add layers to our security defenses with Cloudflare. The more layers you add, the more difficult it is for attackers to succeed in making voters question the trust of the democratic process that we work to protect every day.” Information security is about prevention and detection and is a continual process that involves monitoring, training, and threat analysis. By adding more layers including tools such as a web application firewall, 2FA, SSL encryption, authentication protocols, and security awareness training, it makes it more difficult for hackers to penetrate through the security layers.
Although cybersecurity experts concluded that the 2020 election was one of the safest in the history of elections, the work is not done yet. Not only will future U.S. election cycles begin again soon, but election security is a global concern that benefits from the involvement of experienced players with appropriate expertise. The longer we engage with those working with those in the election space, the more we learn the best ways to protect their web infrastructure and internal teams. We look forward to continuing our work to protect resources in the voting process and help build trust in democratic institutions.
There is significant global attention around the upcoming United States election. Through the Athenian Project and Cloudflare for Campaigns, Cloudflare is providing free protection from cyber attacks to a significant number of state and local elections’ websites, as well as those of federal campaigns.
One of the bedrocks of a democracy is that people need to be able to get access to relevant information to make a choice about the future of their country. This includes information about the candidates up for election; learning about how to register, and how to cast a vote; and obtaining accurate information on the results.
A question that I’ve been increasingly asked these past few months: are cyberattacks going to impact these resources leading up to and on election day?
Internally, we have been closely monitoring attacks on the broader elections and campaign websites and have a team standing by 24×7 to help our current customers as well as state and local governments and eligible political campaigns to protect them at no cost from any cyberattacks they may see.
The good news is that, so far, cyberattacks have not been impacting the websites of campaigns and elections officials we are monitoring and protecting. While we do see some background noise of attacks, they have not interfered in the process so far. The attack traffic is below what we saw in 2016 and below what is typical in elections we have observed in other countries.
But there are still nearly two weeks before election day so our guard is up. We thought it was important to provide a view into how overall traffic to campaign and elections sites is trending as well as a view into the cyberattacks we’re observing. To that end, today we’re sharing data from our internal monitoring systems publicly through Cloudflare Radar. You can access the special “Election 2020” Radar dashboard here:
The dashboard is updated continuously with information we’re tracking on traffic to elections-related sites, both legitimate and from cyberattacks. It is normal to see fluctuations in this traffic depending on the time of day as well as when there will be occasional cyberattacks. So far, nothing here surprises us.
It’s important to note that Cloudflare does not see everything. We do not, for instance, have any view into misinformation campaigns that may be on social media. We also do not protect every state and local government or every campaign.
That said, we have Athenian Project participants in more than half of US states — including so-called red states, blue states, purple states, and several of the battleground states. We also have hundreds of federal campaigns that are using us ranging across the political spectrum. While we may not see a targeted cyberattack, given the critical role the web now plays to the election process, we believe we would likely see any wide-spread attacks attempting to disrupt the US elections.
So far, we are not seeing anything that suggests such an attack has impacted the election to date.
Our team will continue to monitor the situation. If any state or local elections agency or campaigns comes under attack, we stand ready to help at no cost through the Athenian Project and Cloudflare for Campaigns.
We could not have built Cloudflare into the company it is today without a stable, functional government. In the United States, that process depends on democracy and fair elections not tainted by outside influence like cyberattacks. We believe it is our duty to provide our technology where we can to help ensure this election runs smoothly.
The collective thoughts of the interwebz
Manage Consent
To provide the best experiences, we use technologies like cookies to store and/or access device information. Consenting to these technologies will allow us to process data such as browsing behavior or unique IDs on this site. Not consenting or withdrawing consent, may adversely affect certain features and functions.
Functional
Always active
The technical storage or access is strictly necessary for the legitimate purpose of enabling the use of a specific service explicitly requested by the subscriber or user, or for the sole purpose of carrying out the transmission of a communication over an electronic communications network.
Preferences
The technical storage or access is necessary for the legitimate purpose of storing preferences that are not requested by the subscriber or user.
Statistics
The technical storage or access that is used exclusively for statistical purposes.The technical storage or access that is used exclusively for anonymous statistical purposes. Without a subpoena, voluntary compliance on the part of your Internet Service Provider, or additional records from a third party, information stored or retrieved for this purpose alone cannot usually be used to identify you.
Marketing
The technical storage or access is required to create user profiles to send advertising, or to track the user on a website or across several websites for similar marketing purposes.


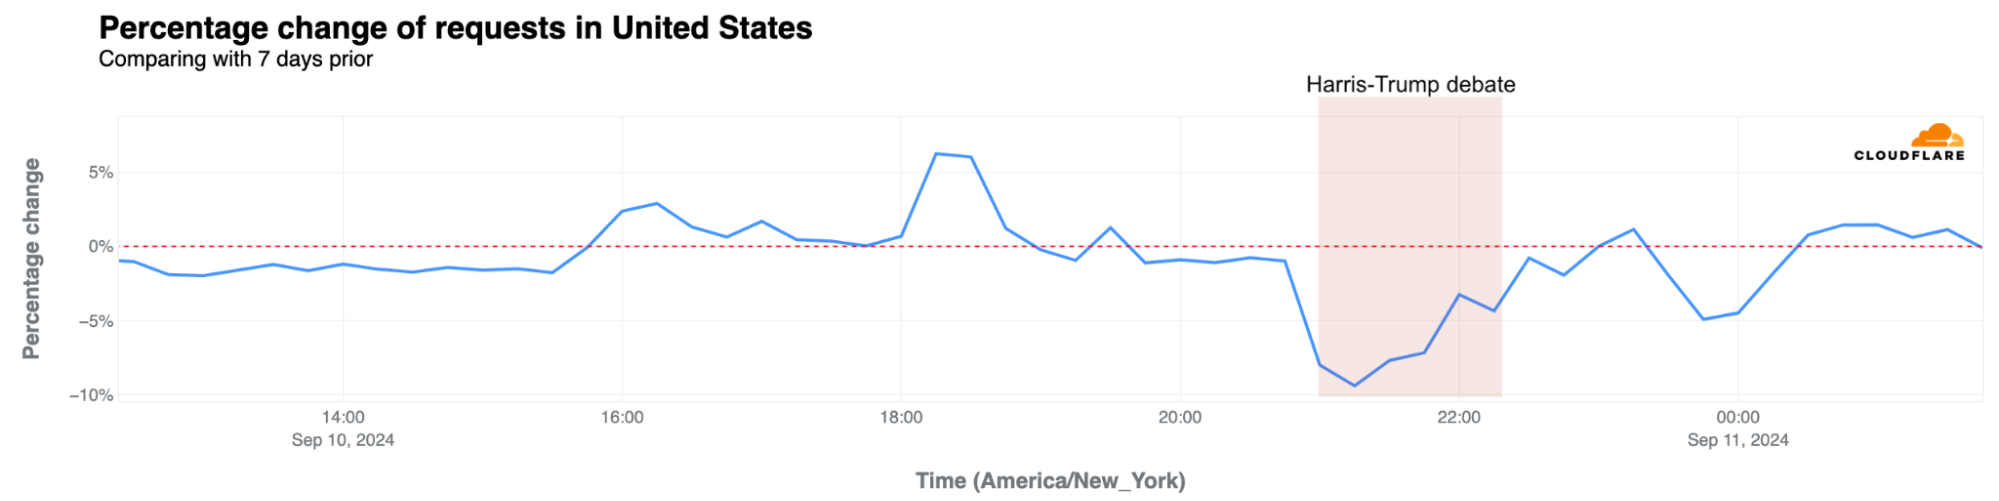
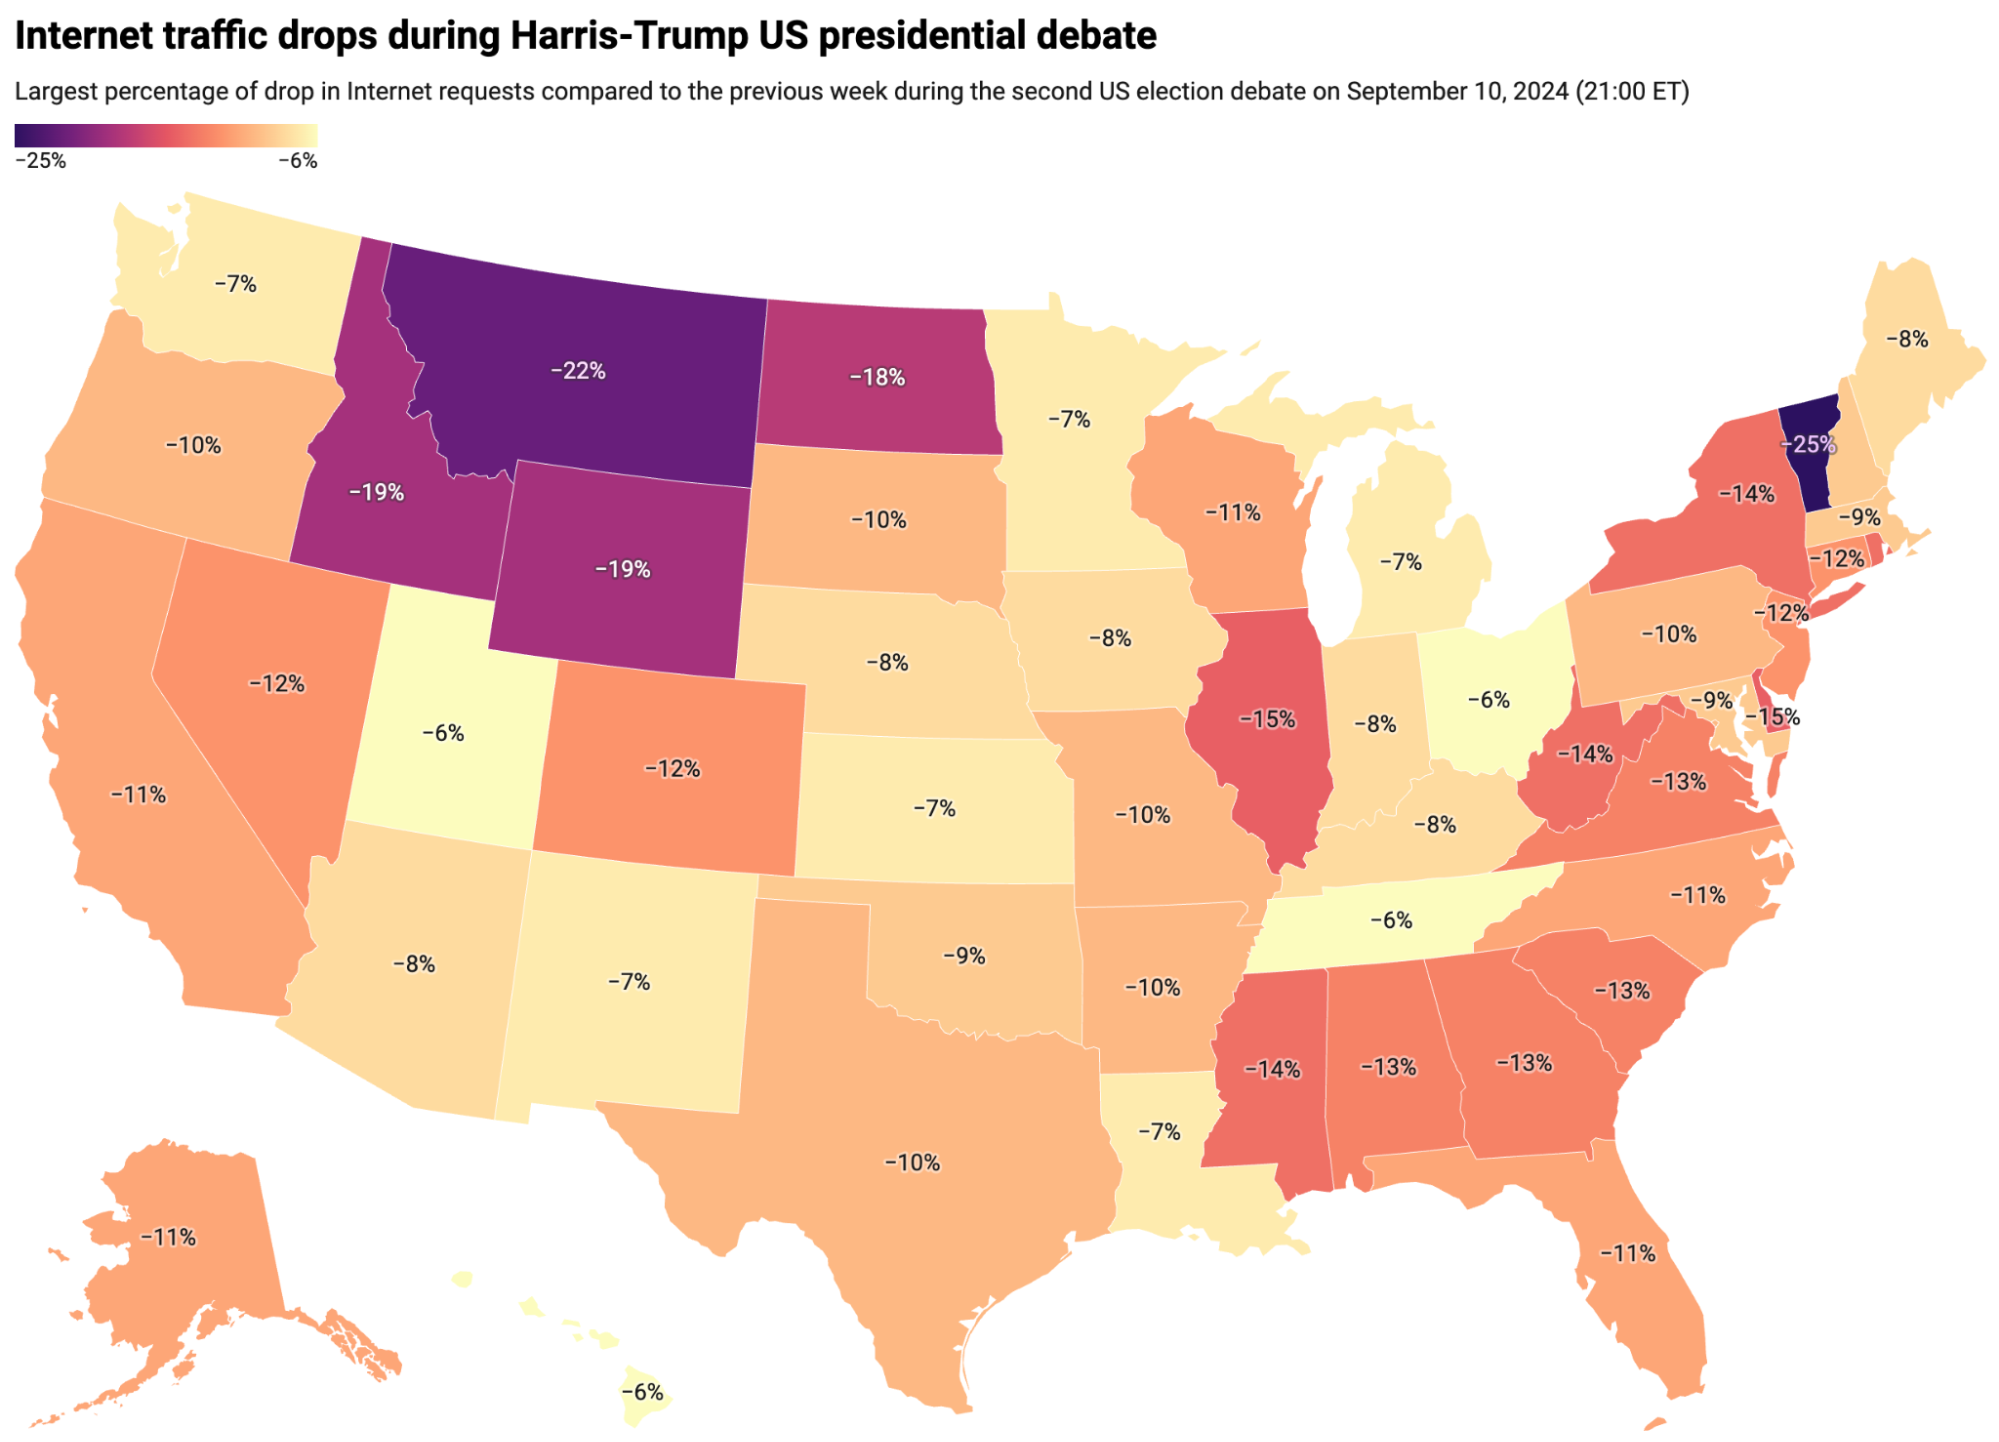
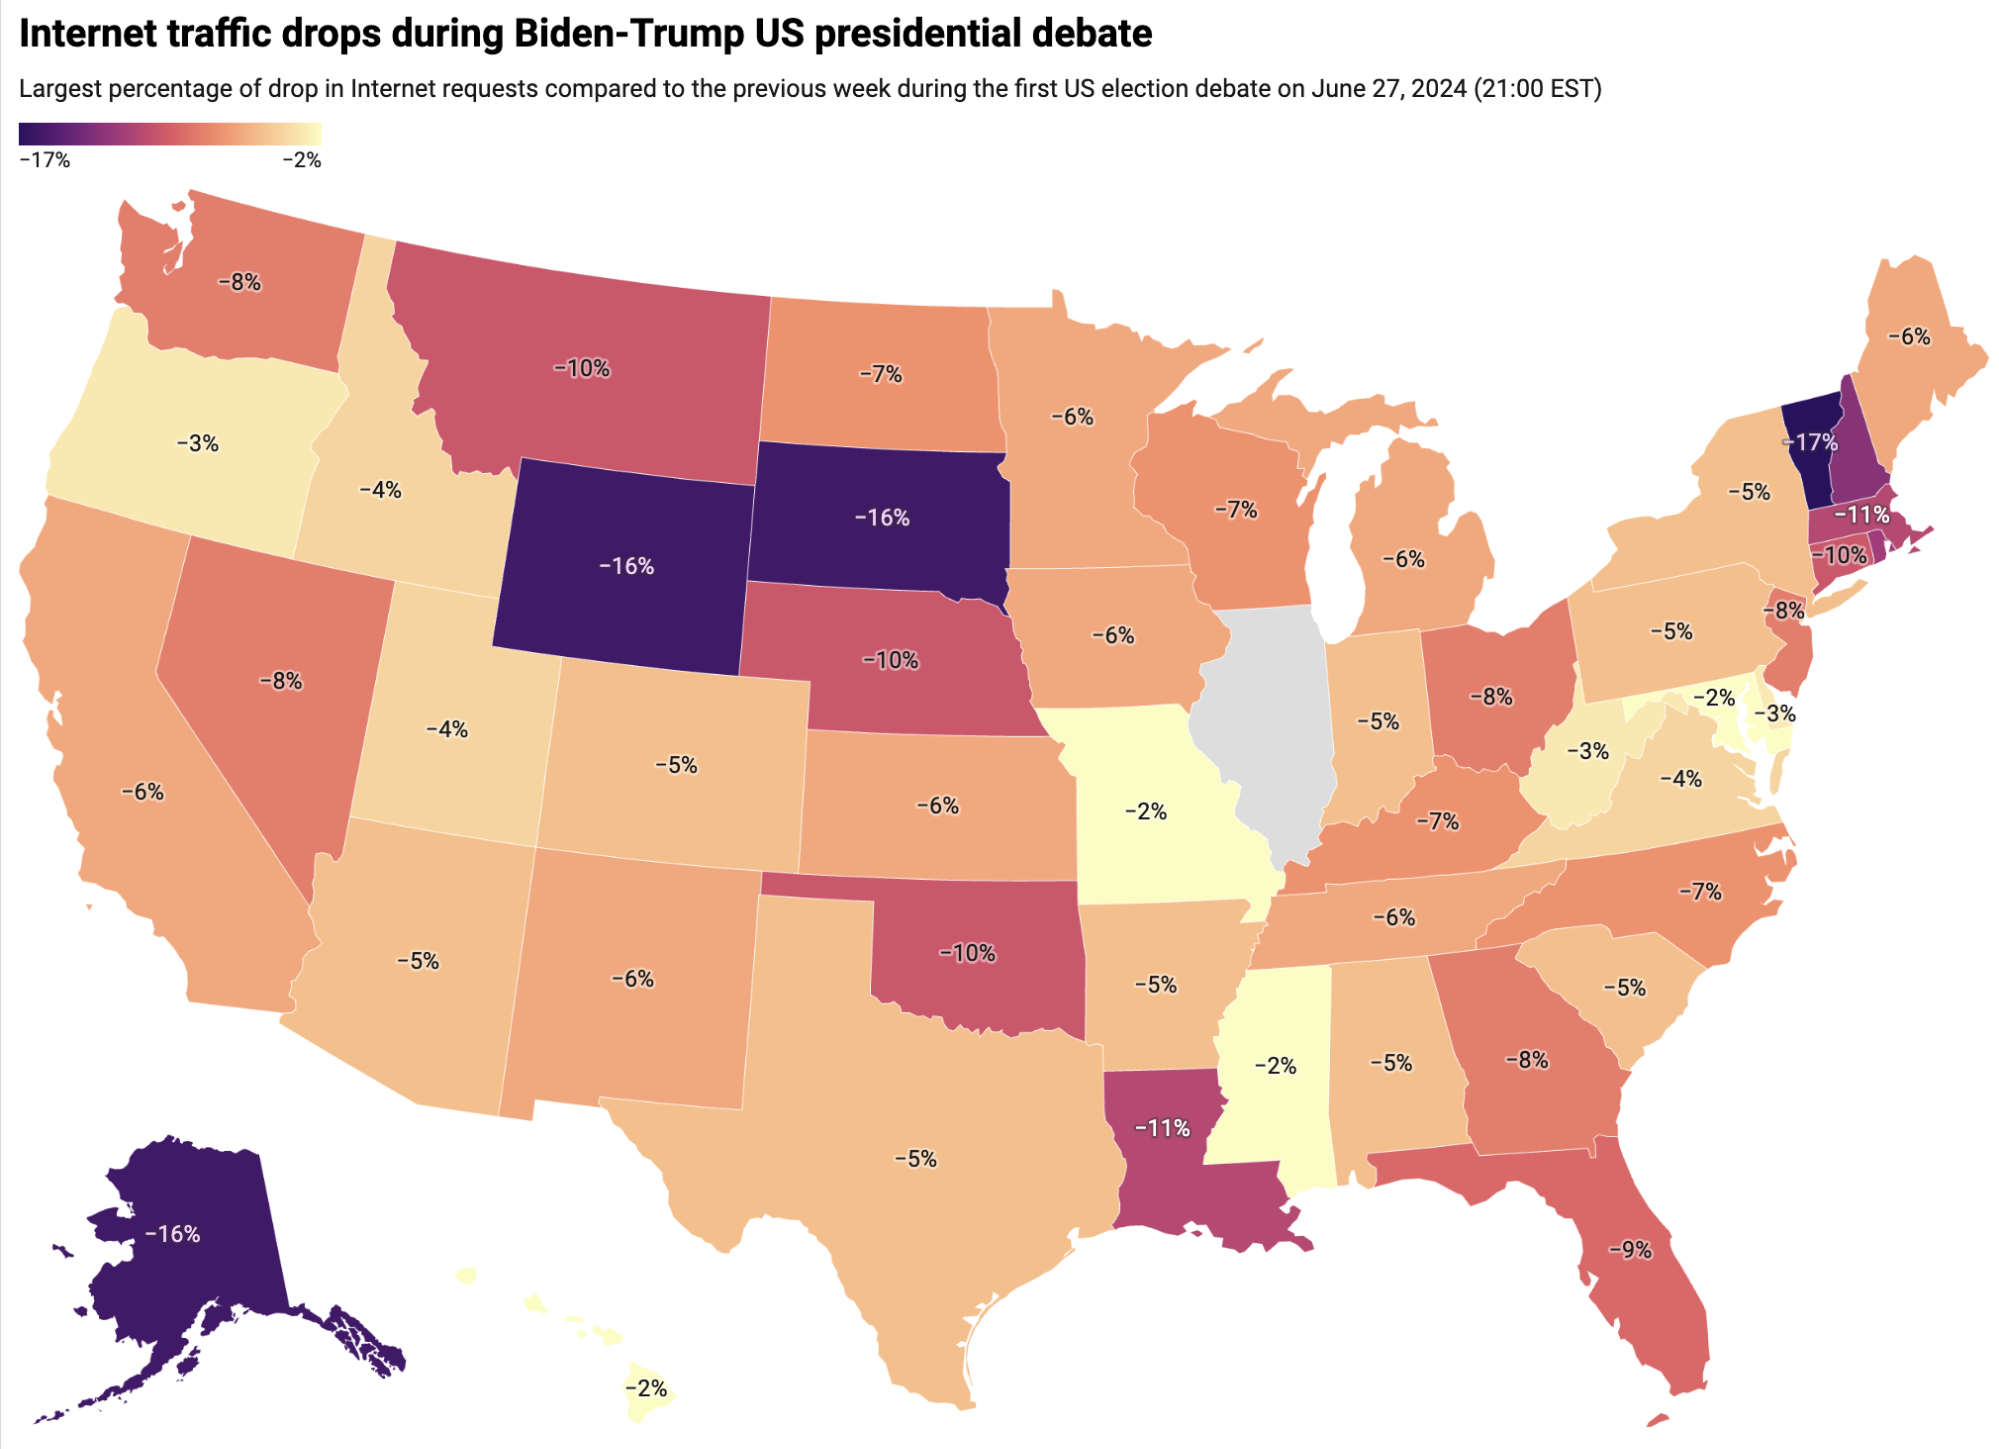
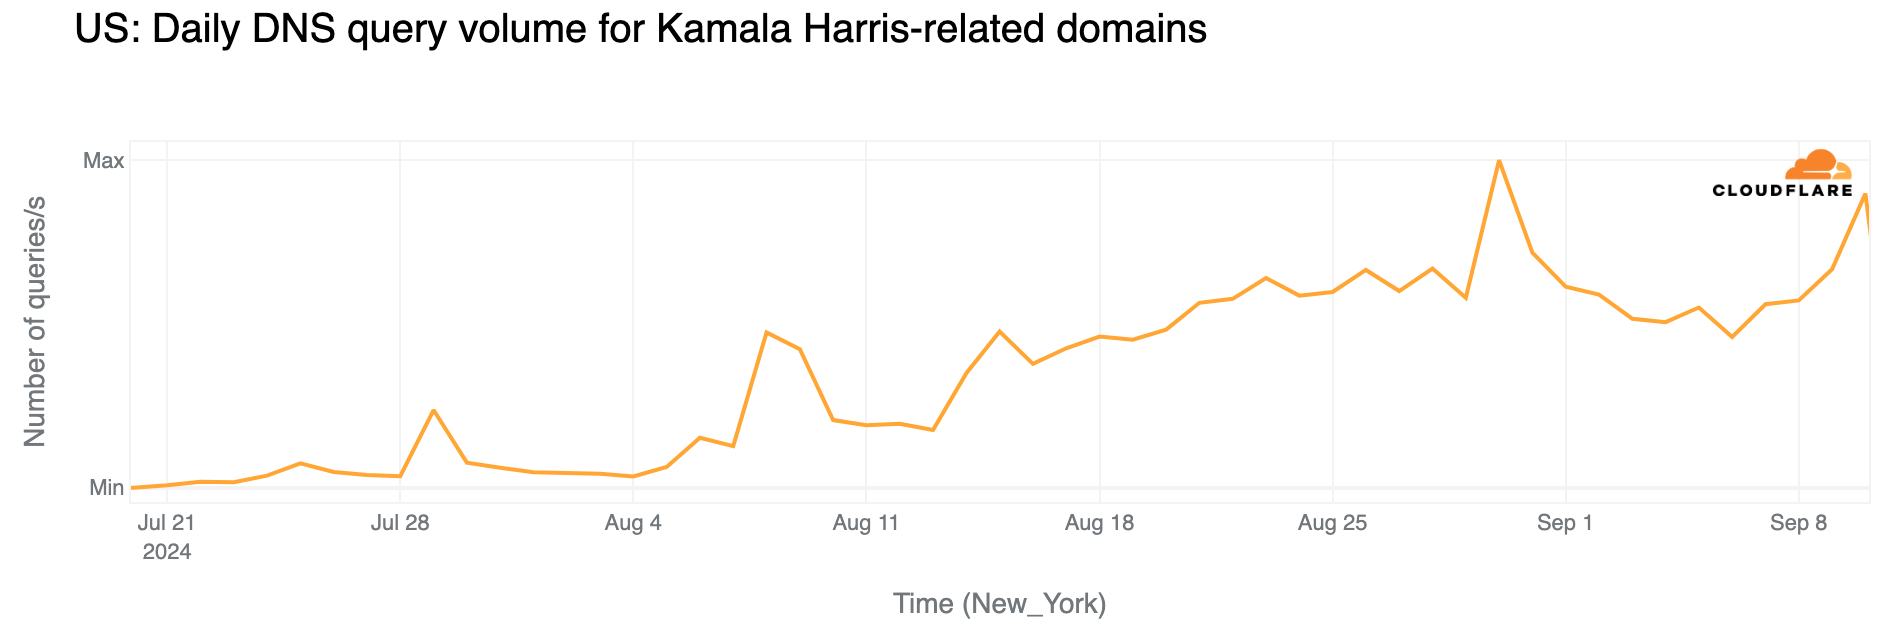
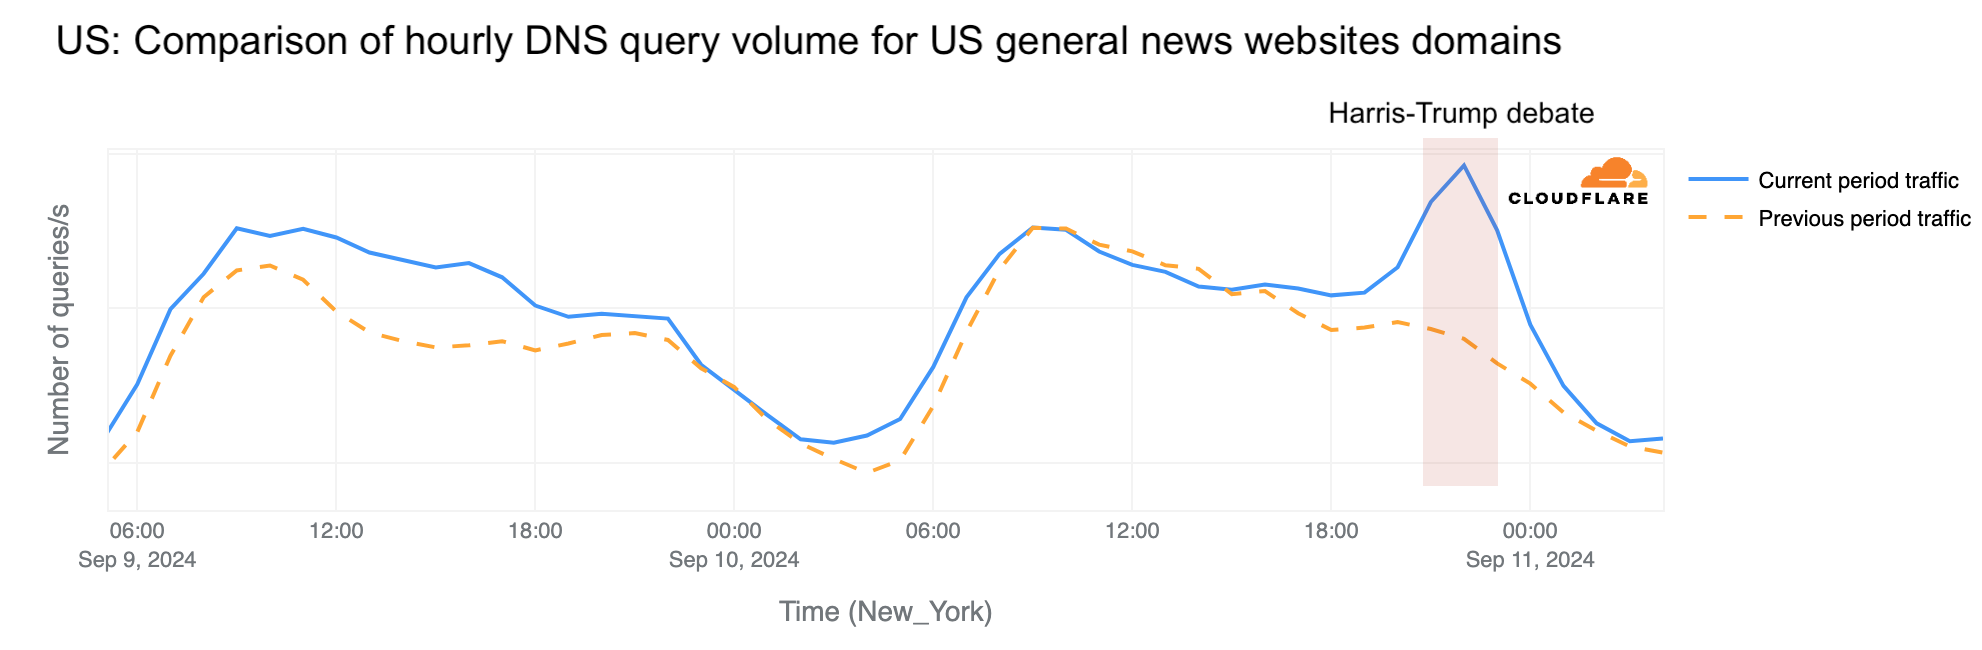
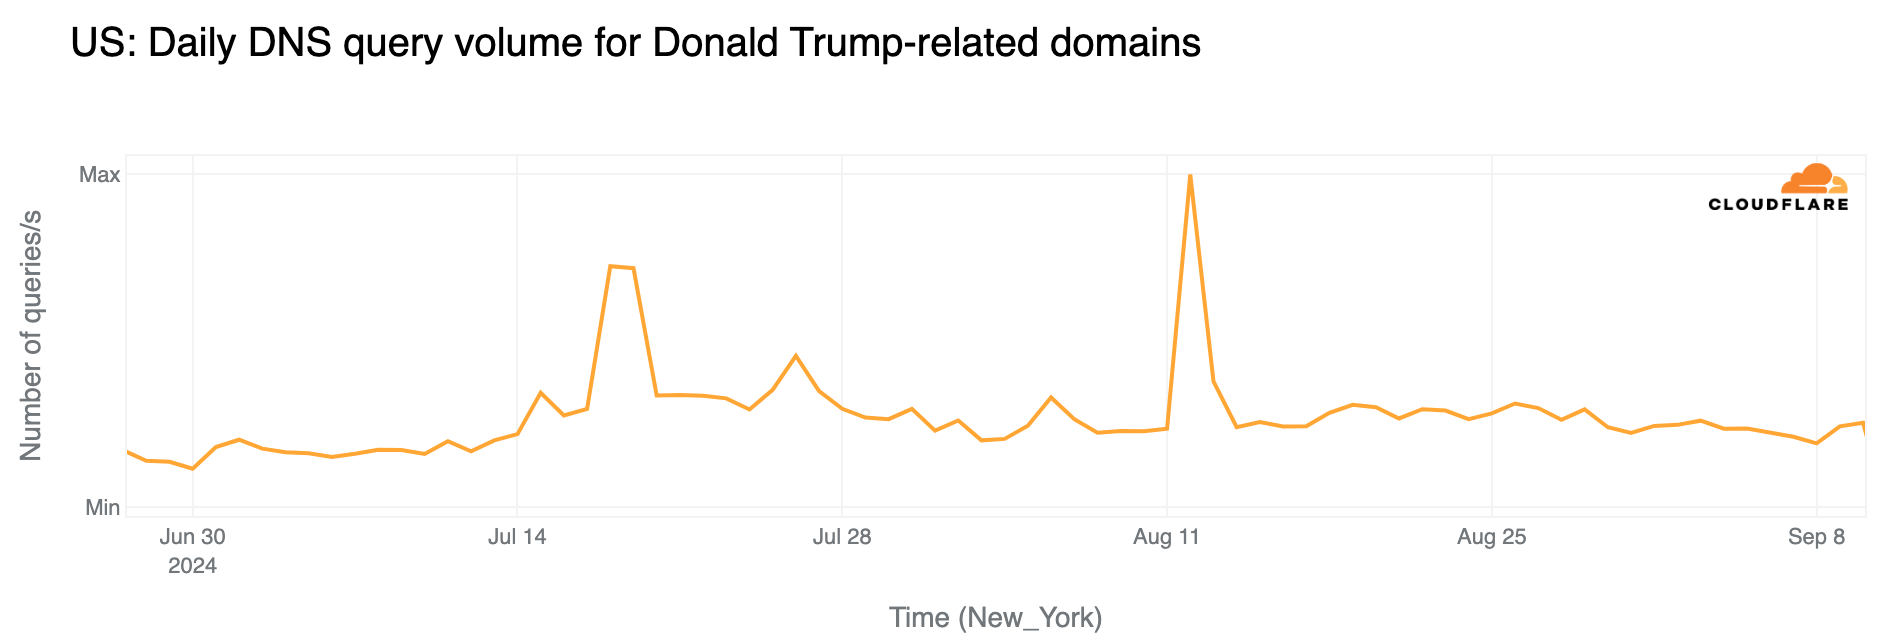
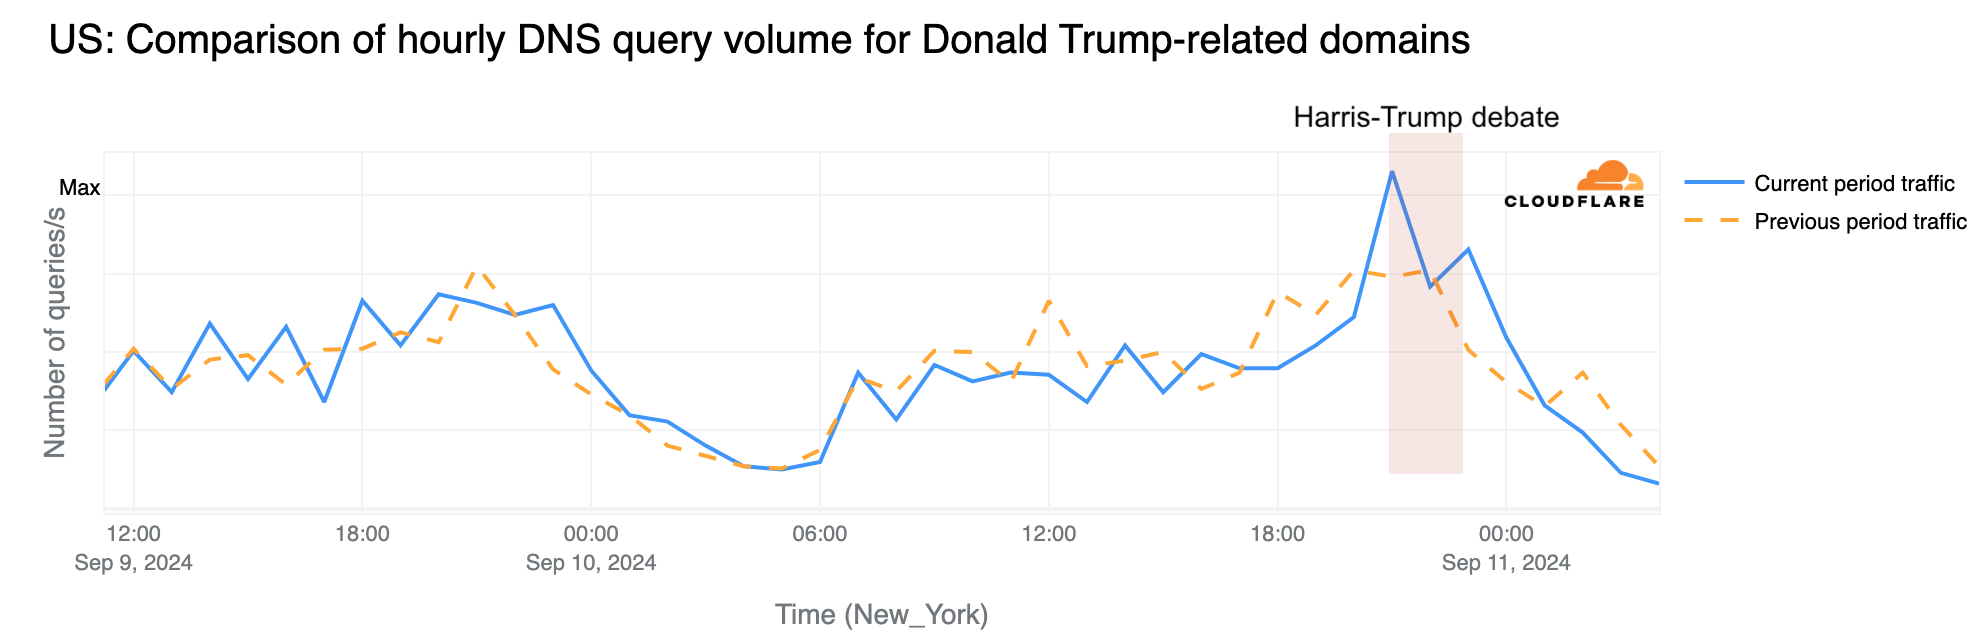

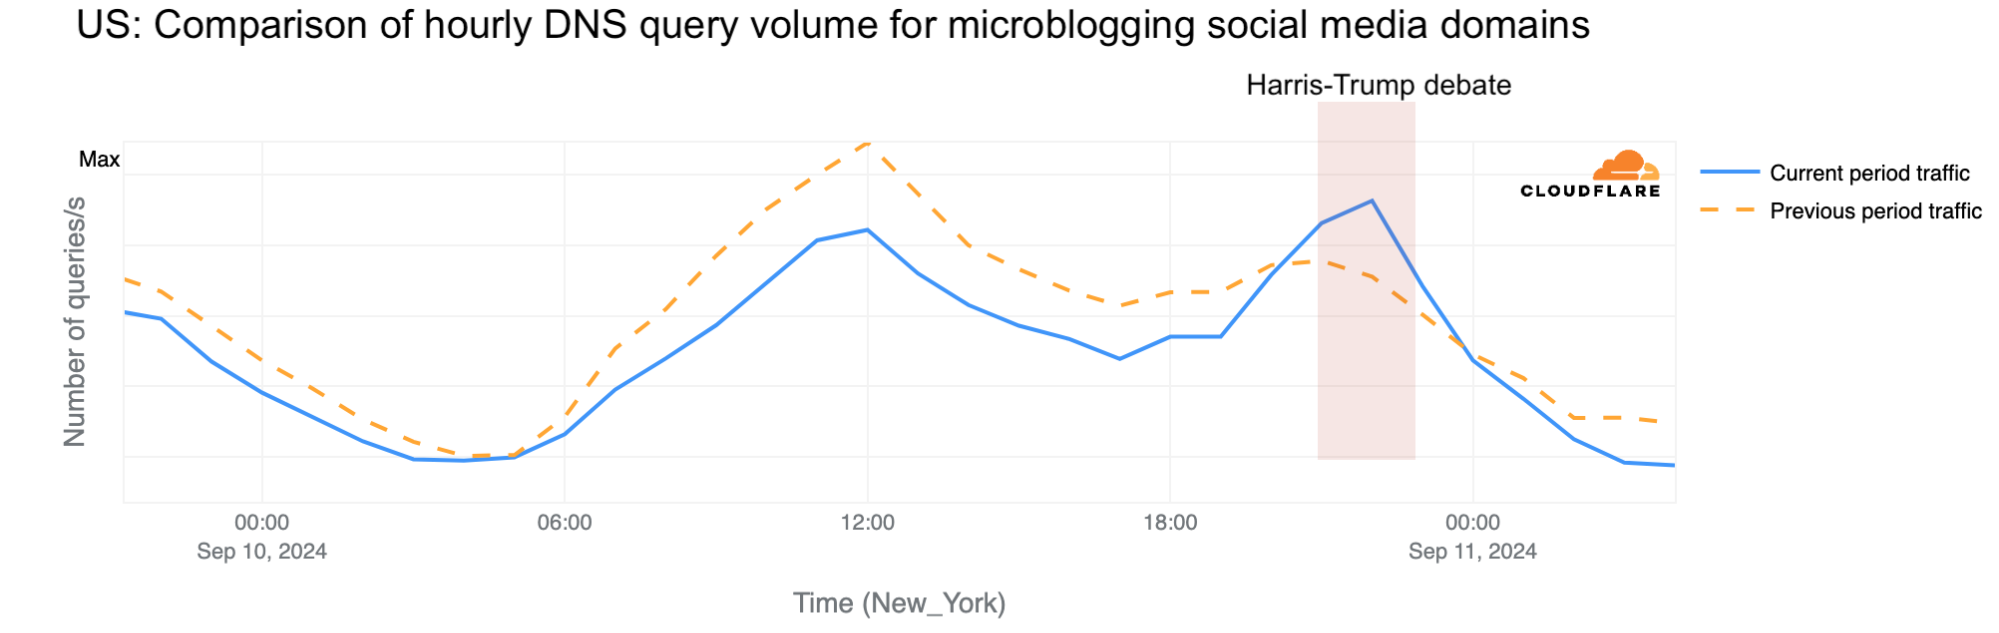
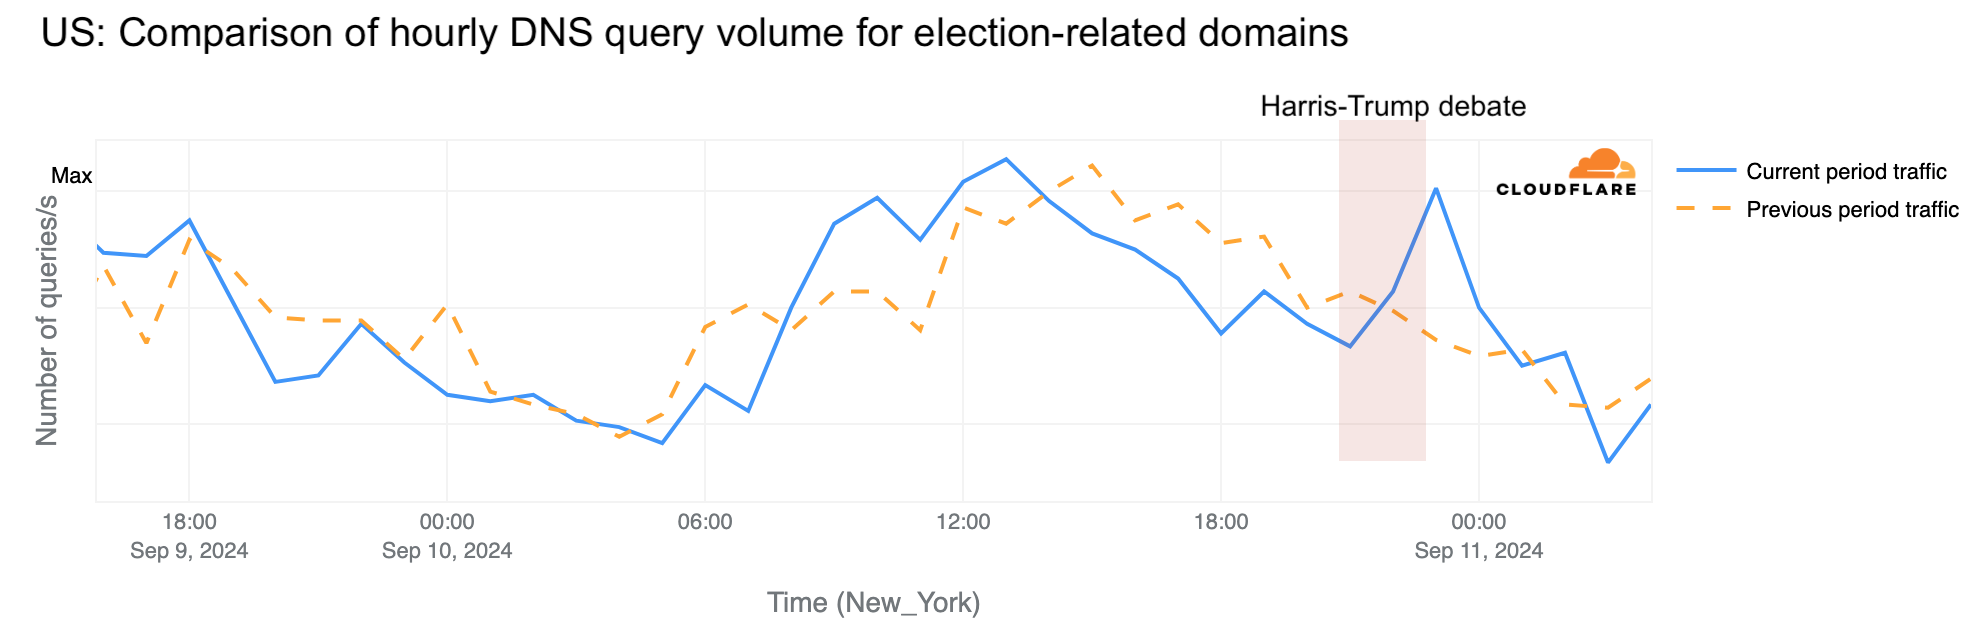
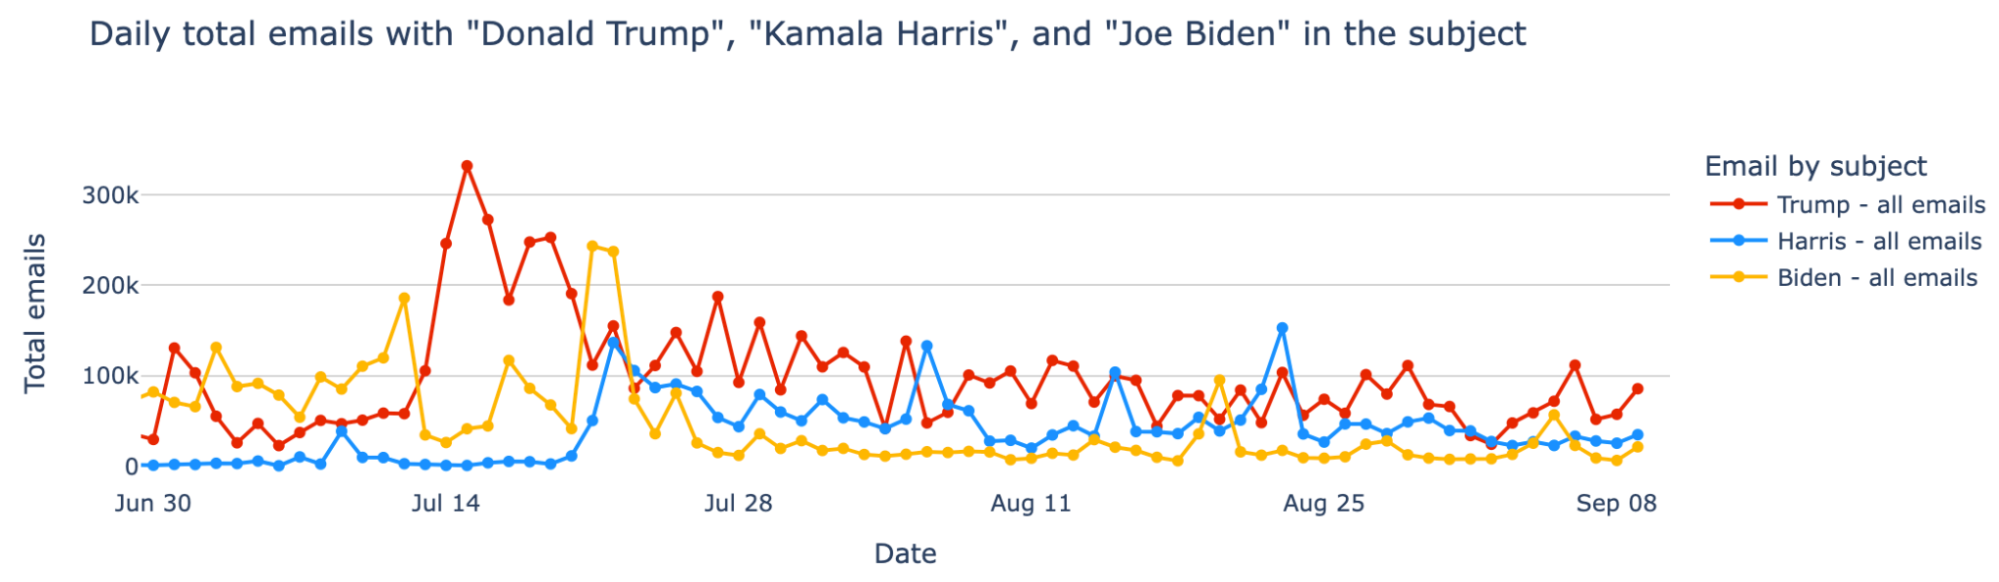
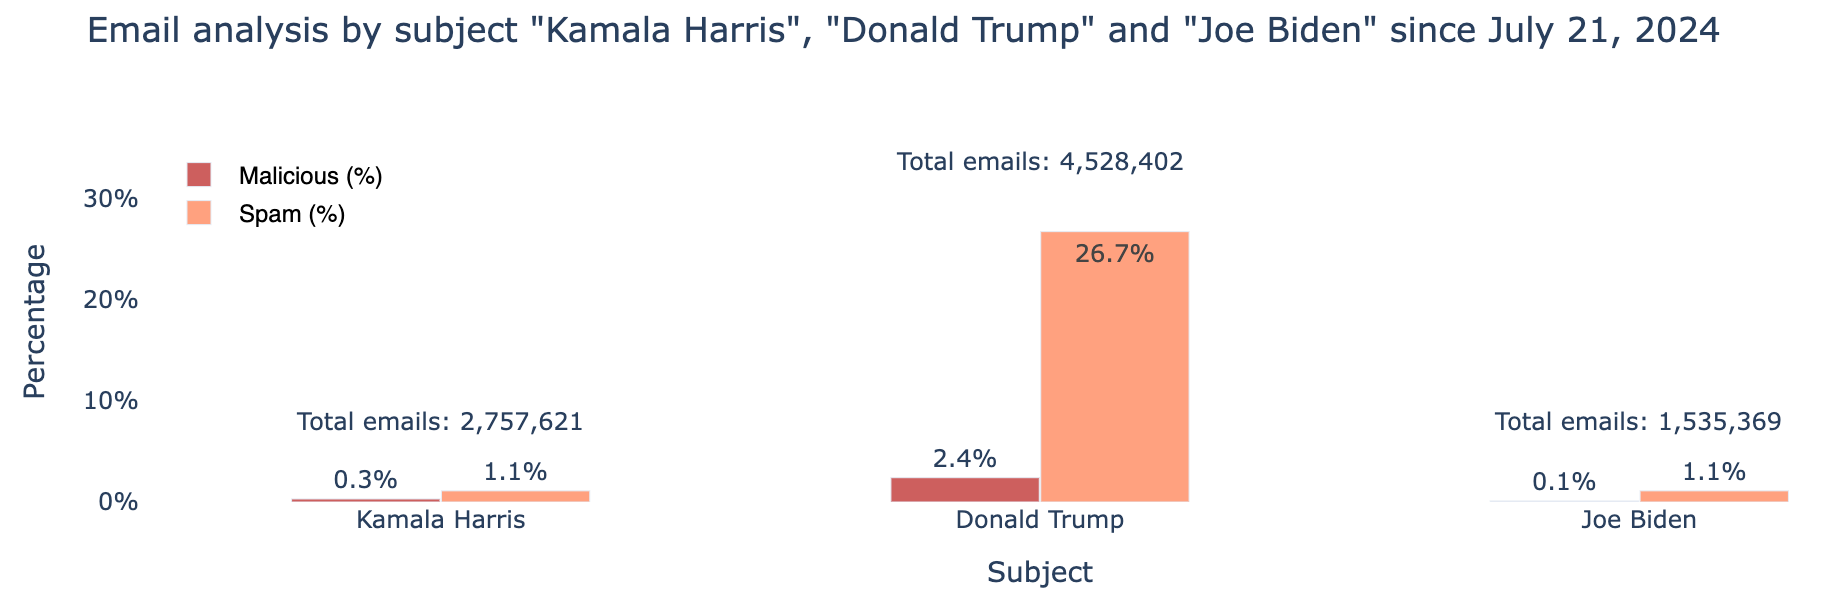
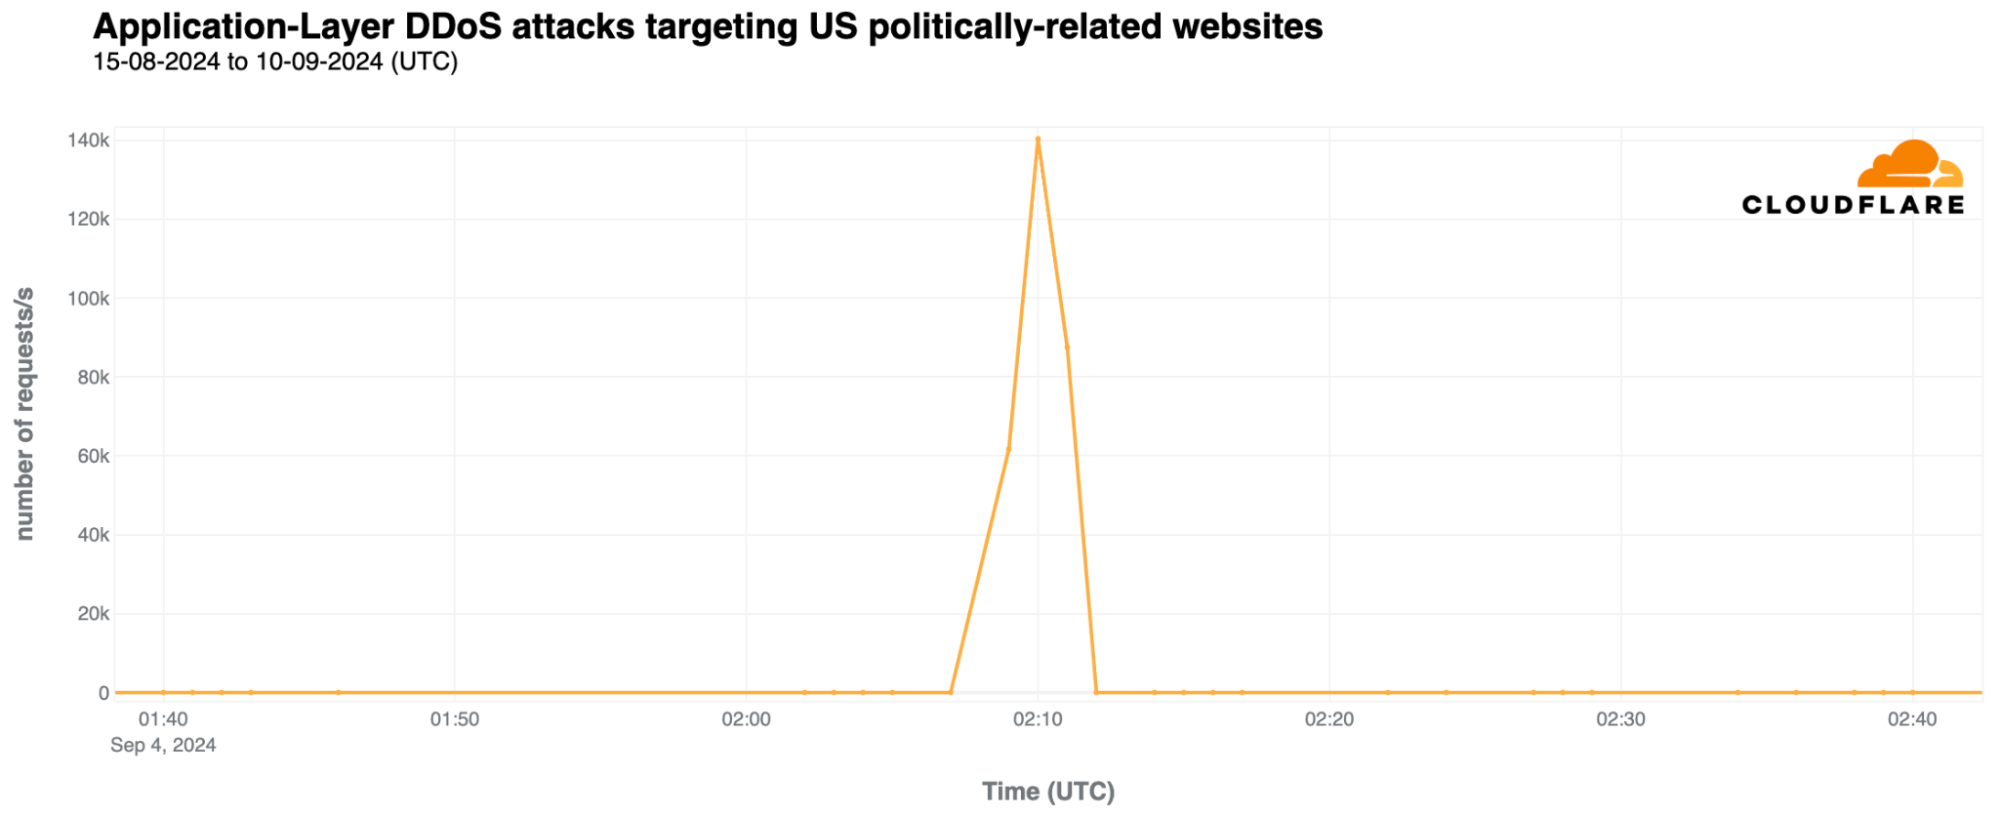
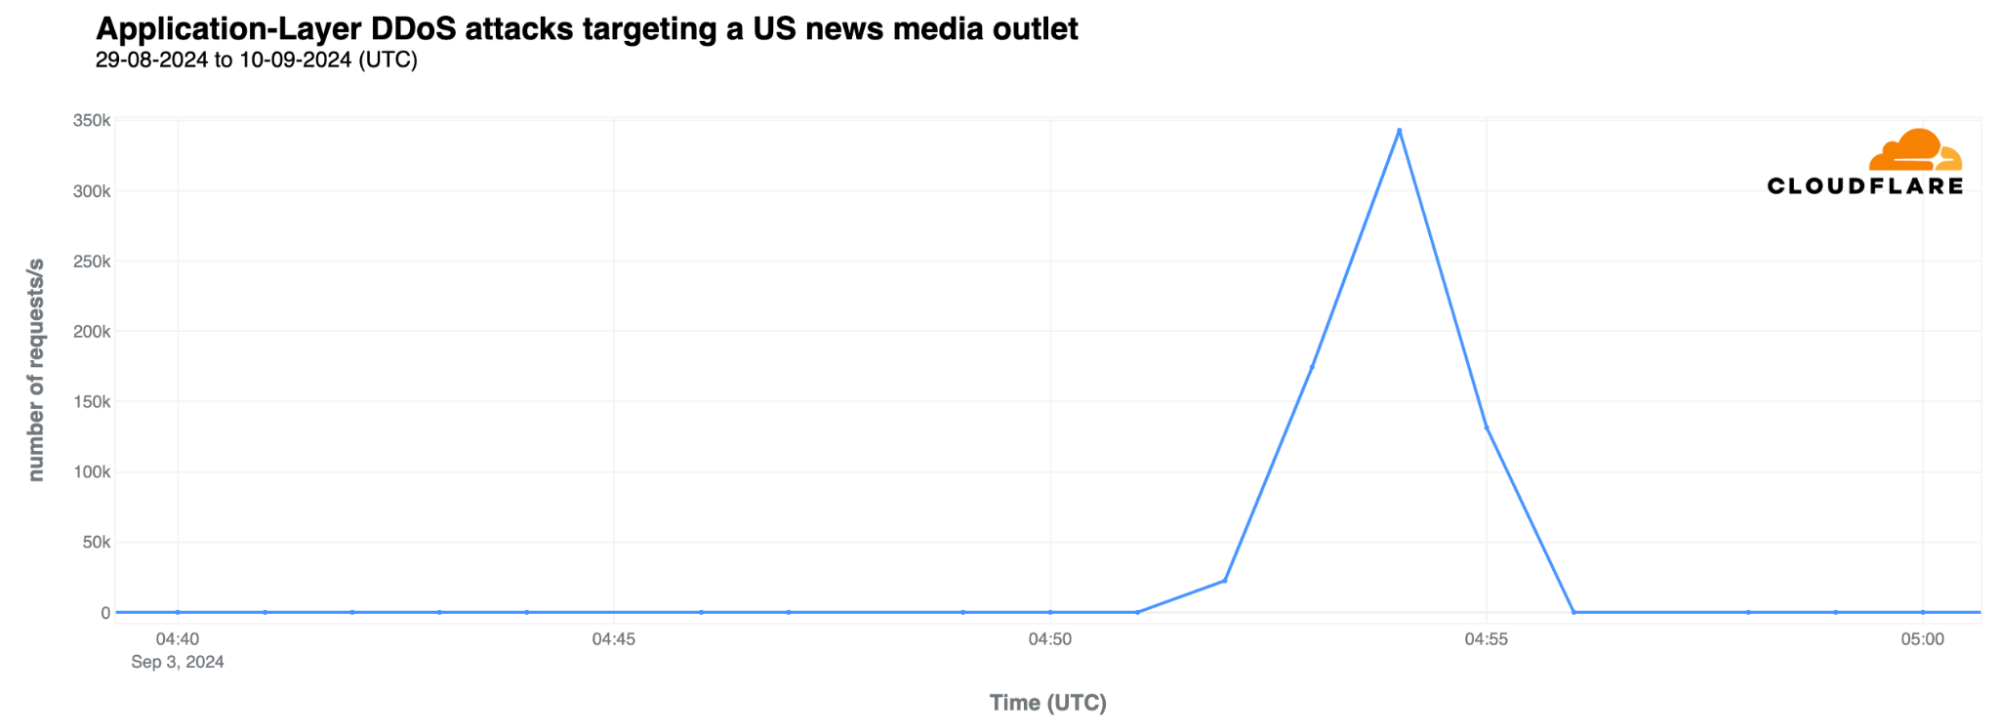

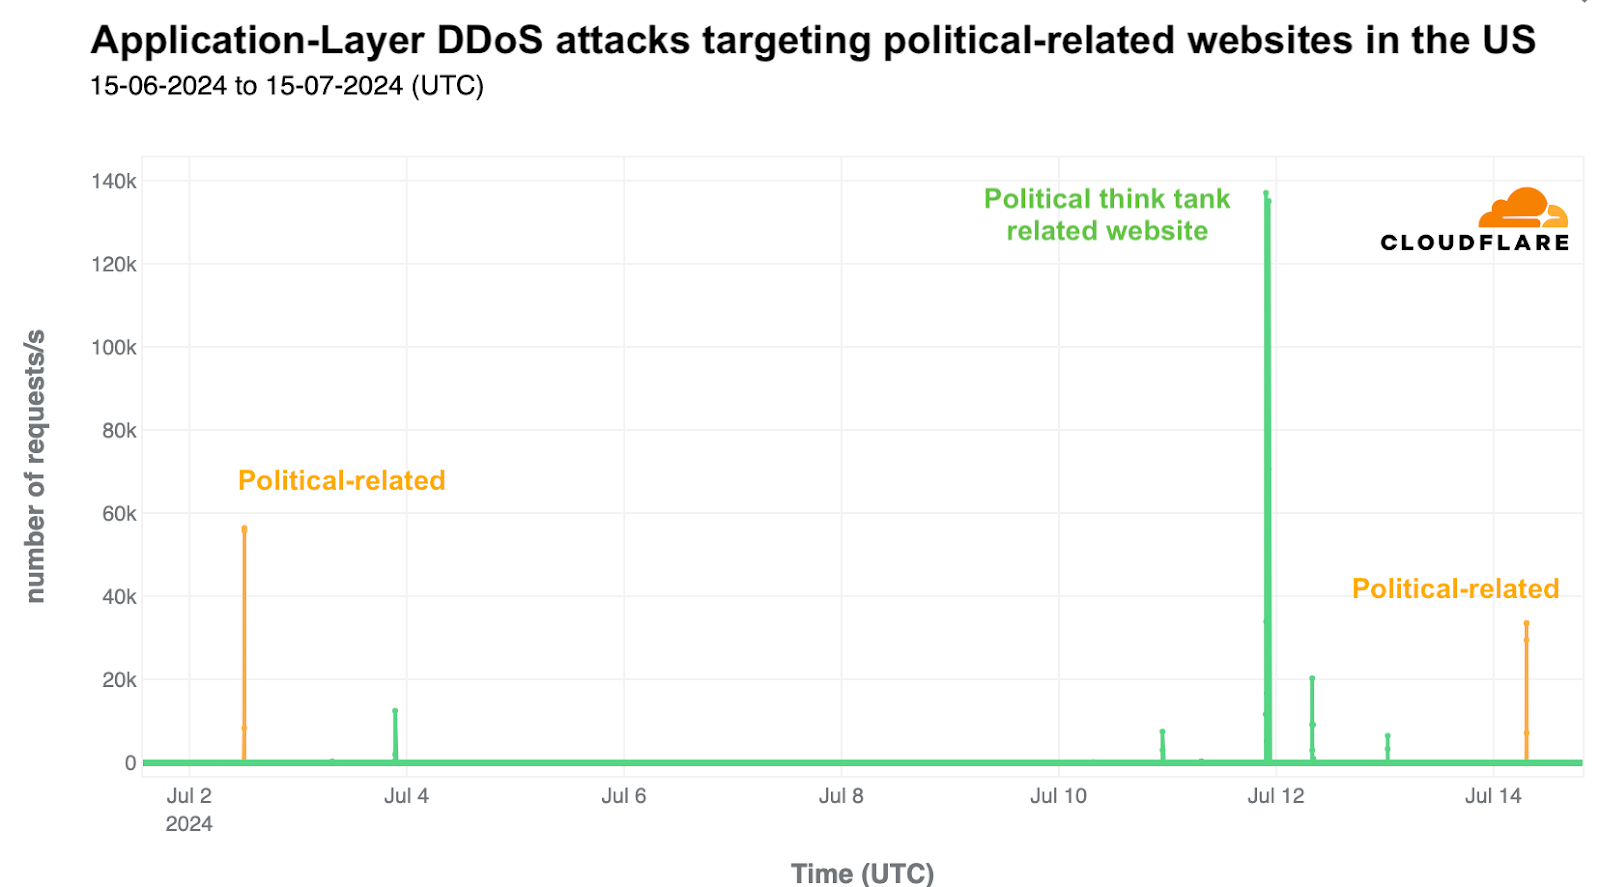
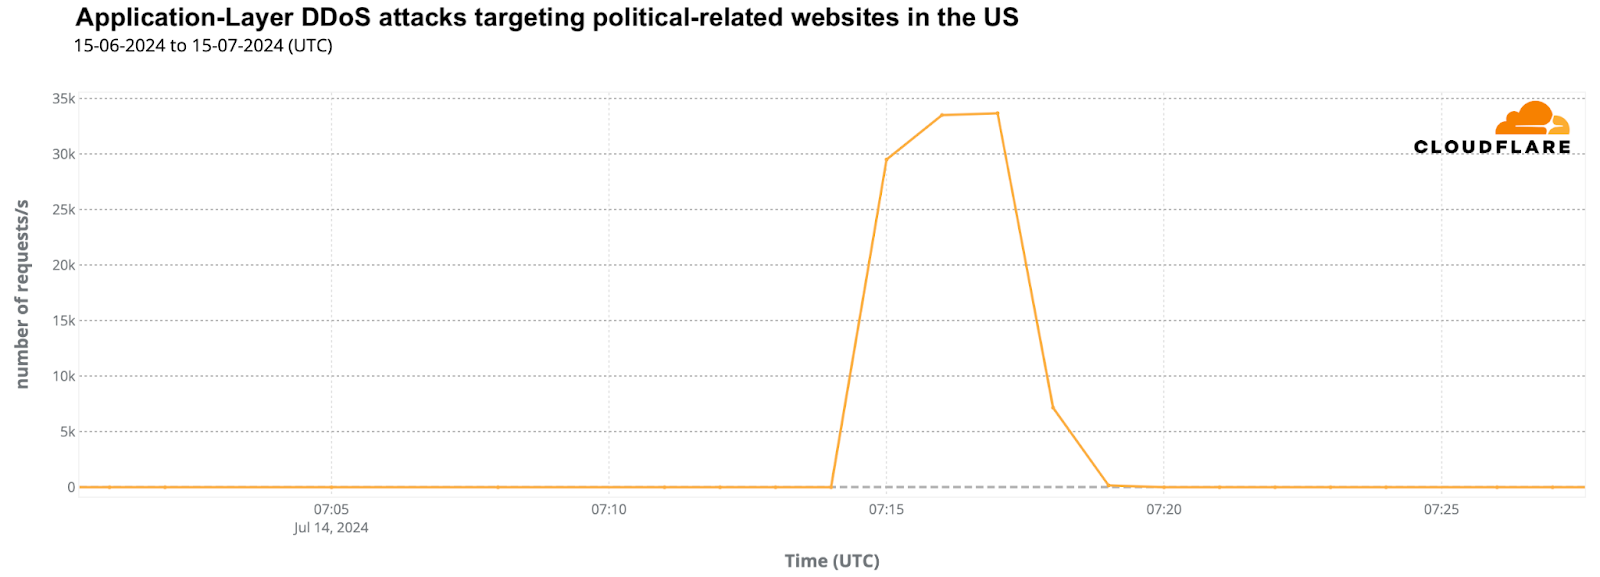
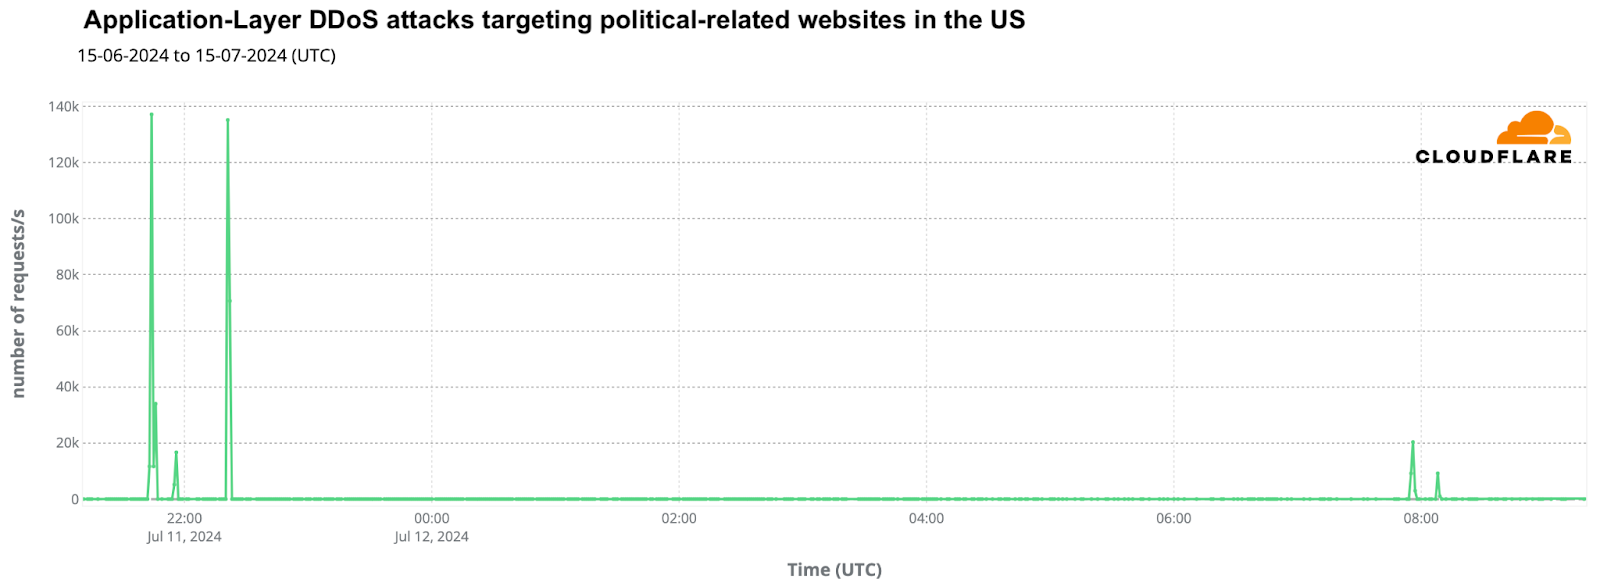
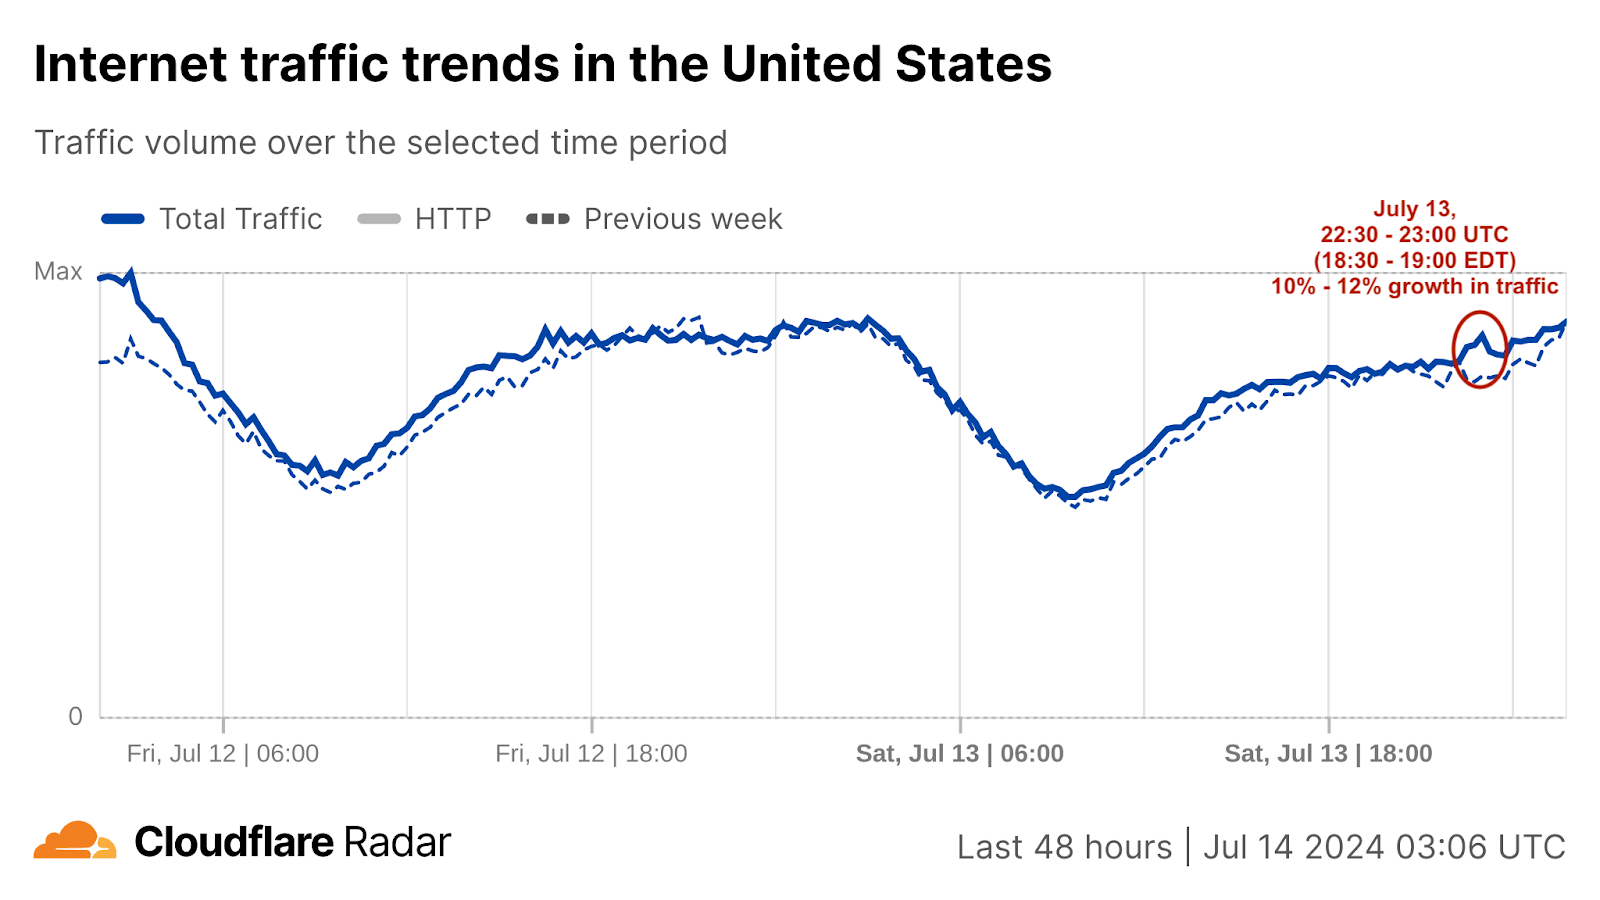
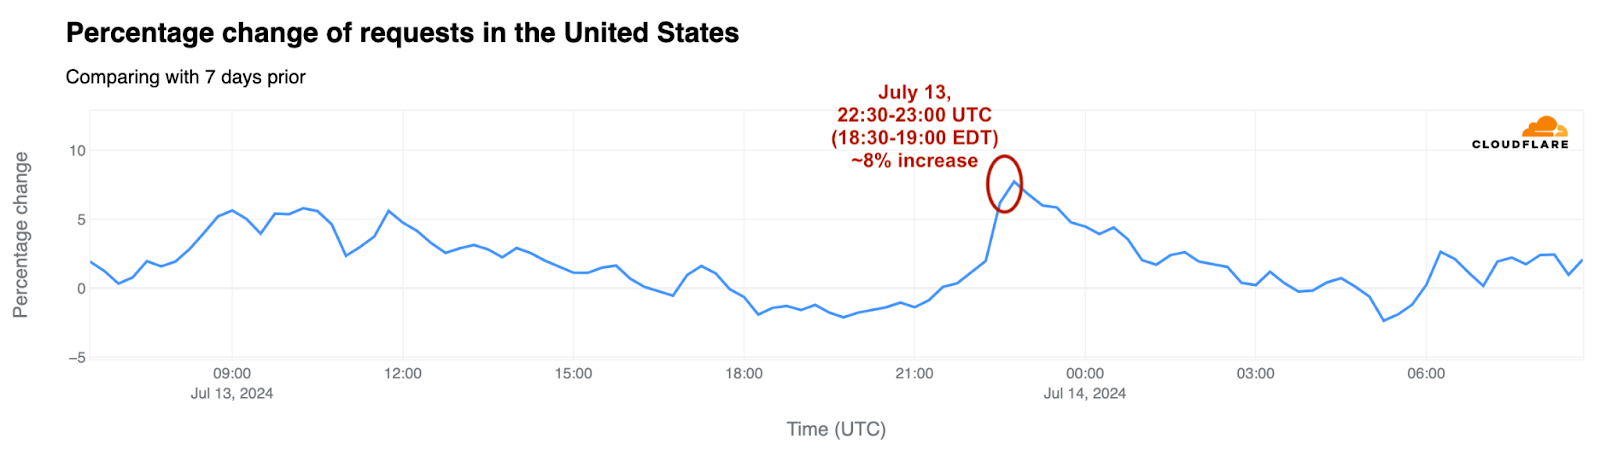
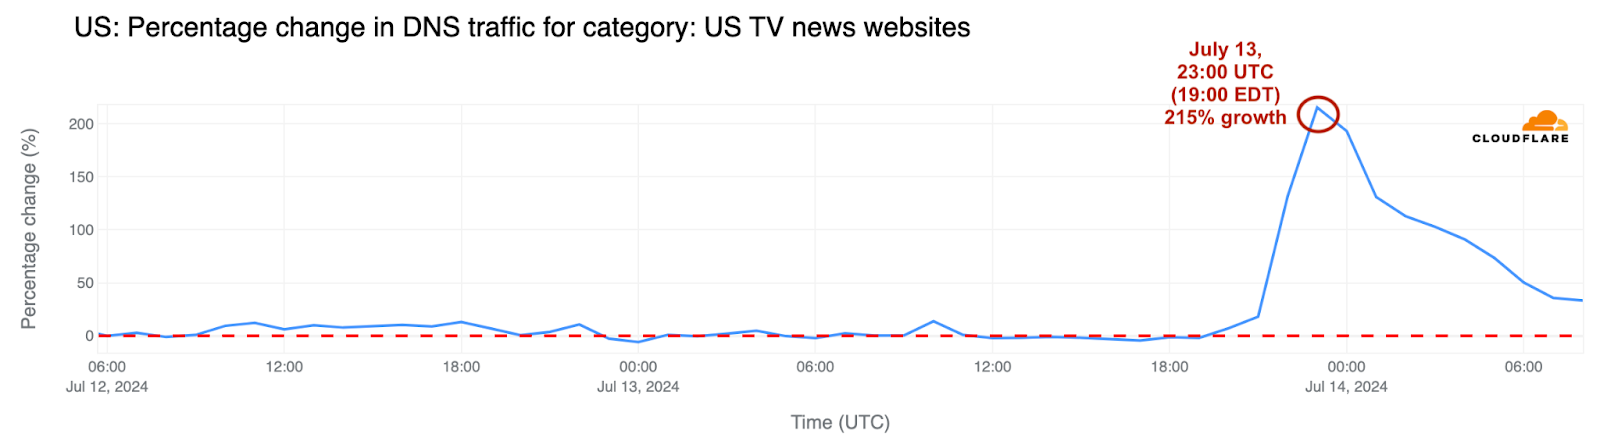
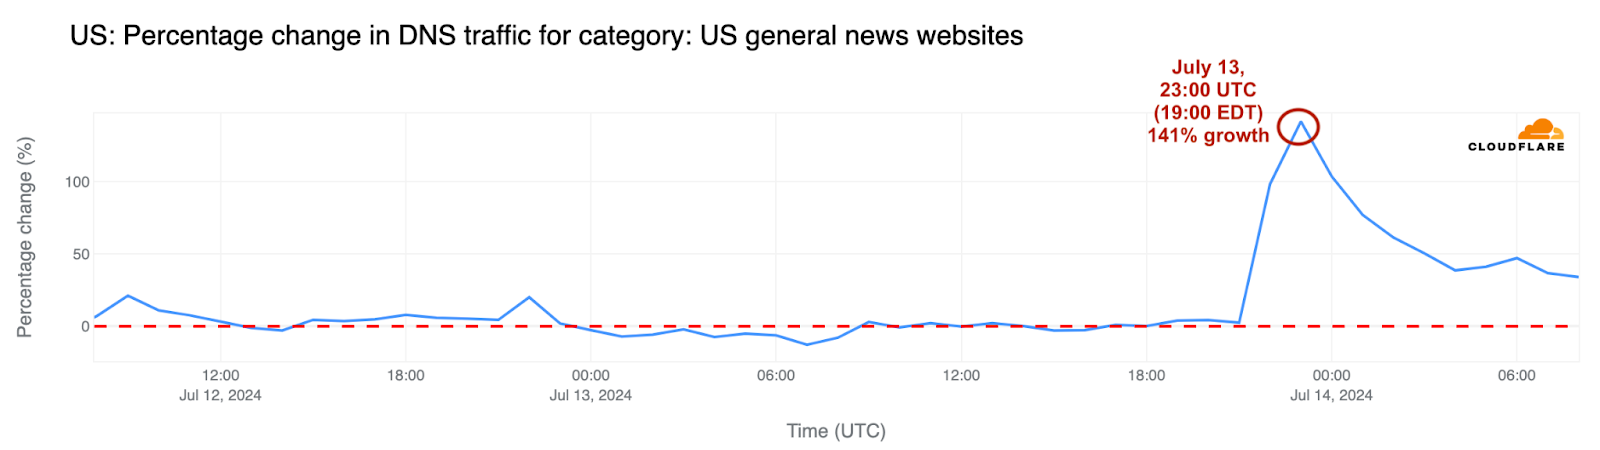
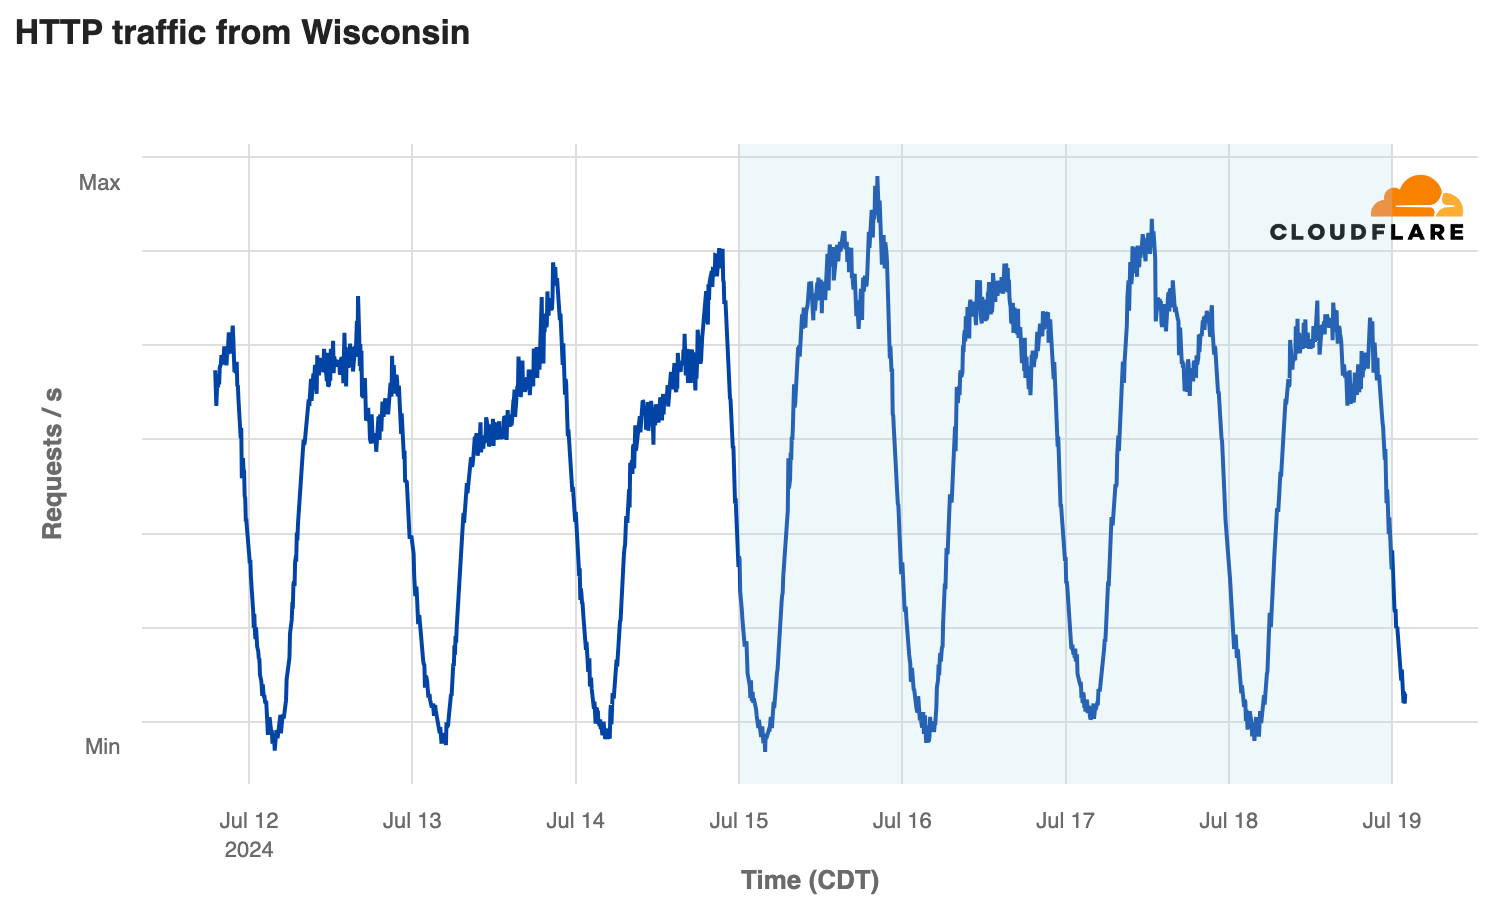
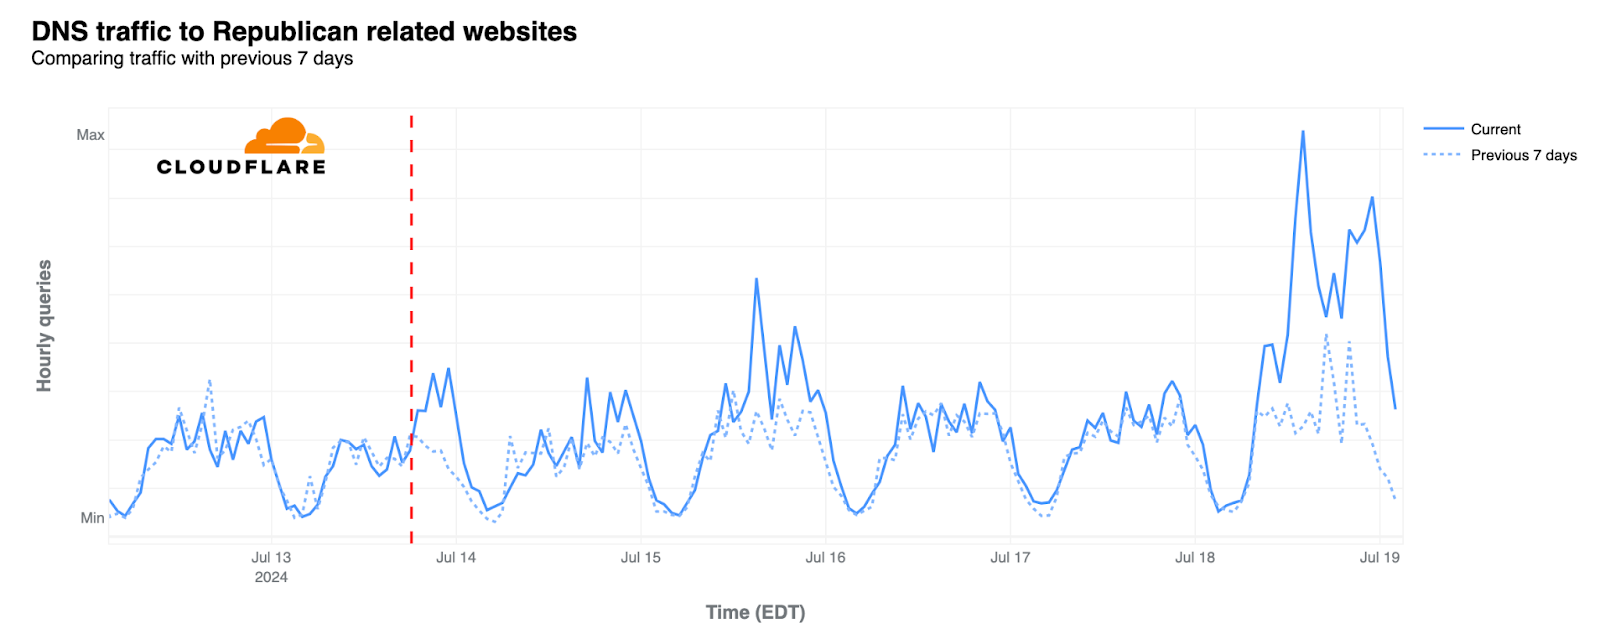
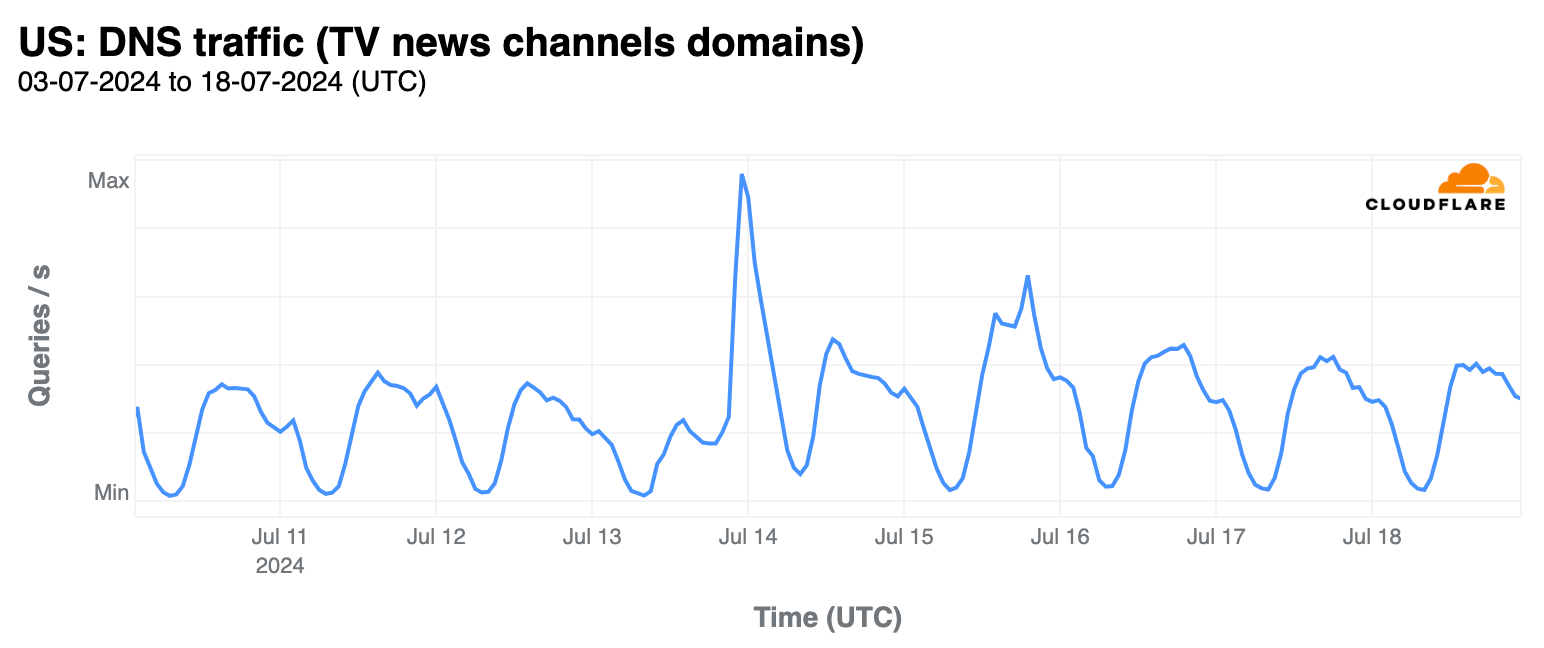
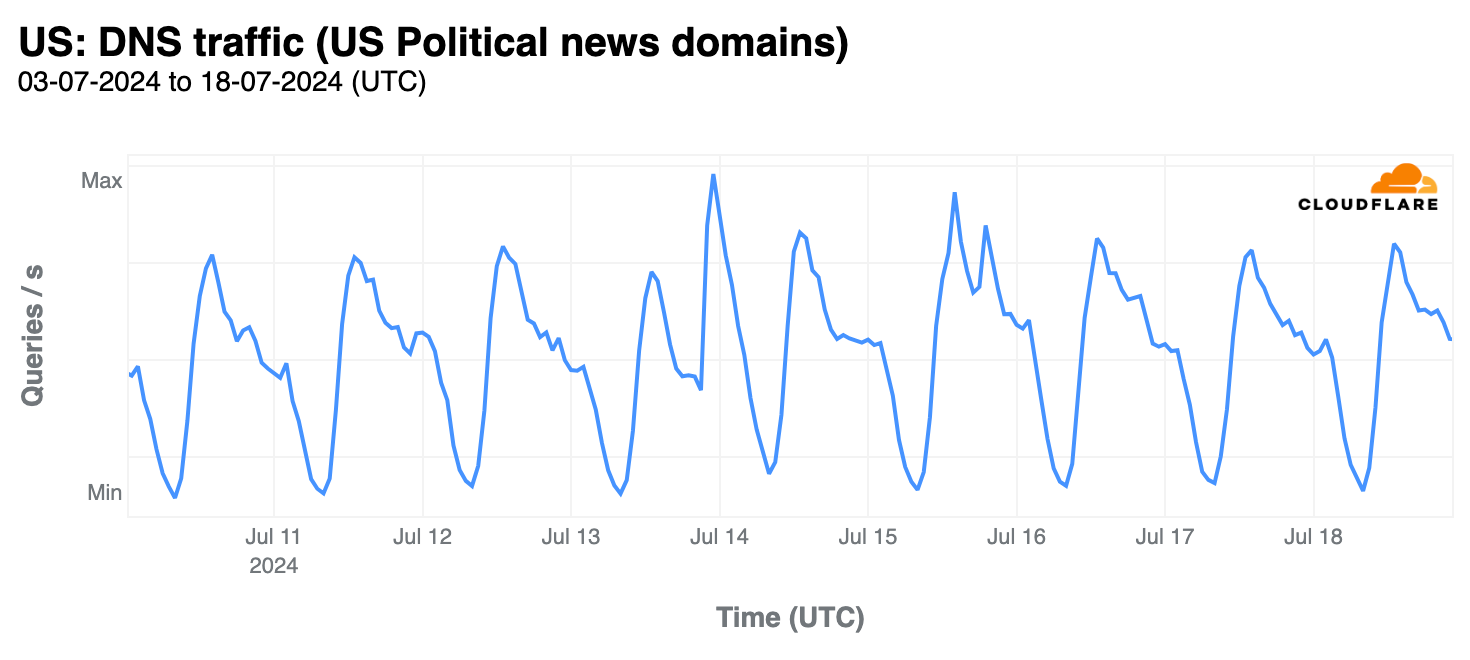
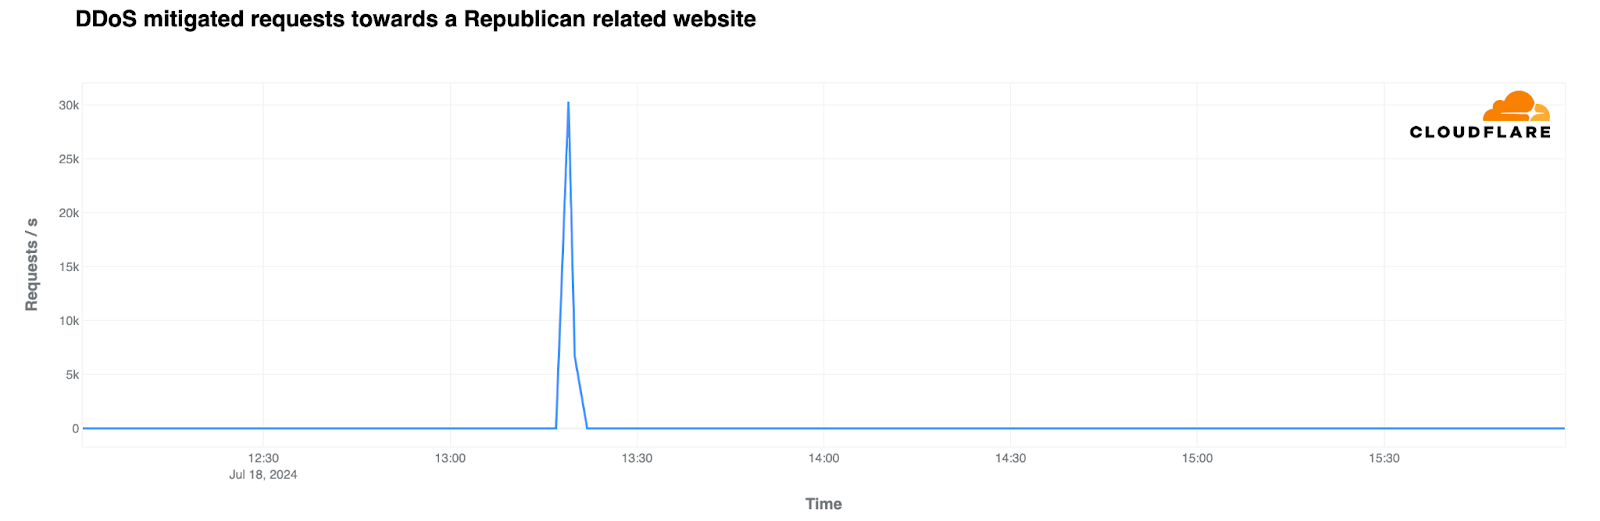
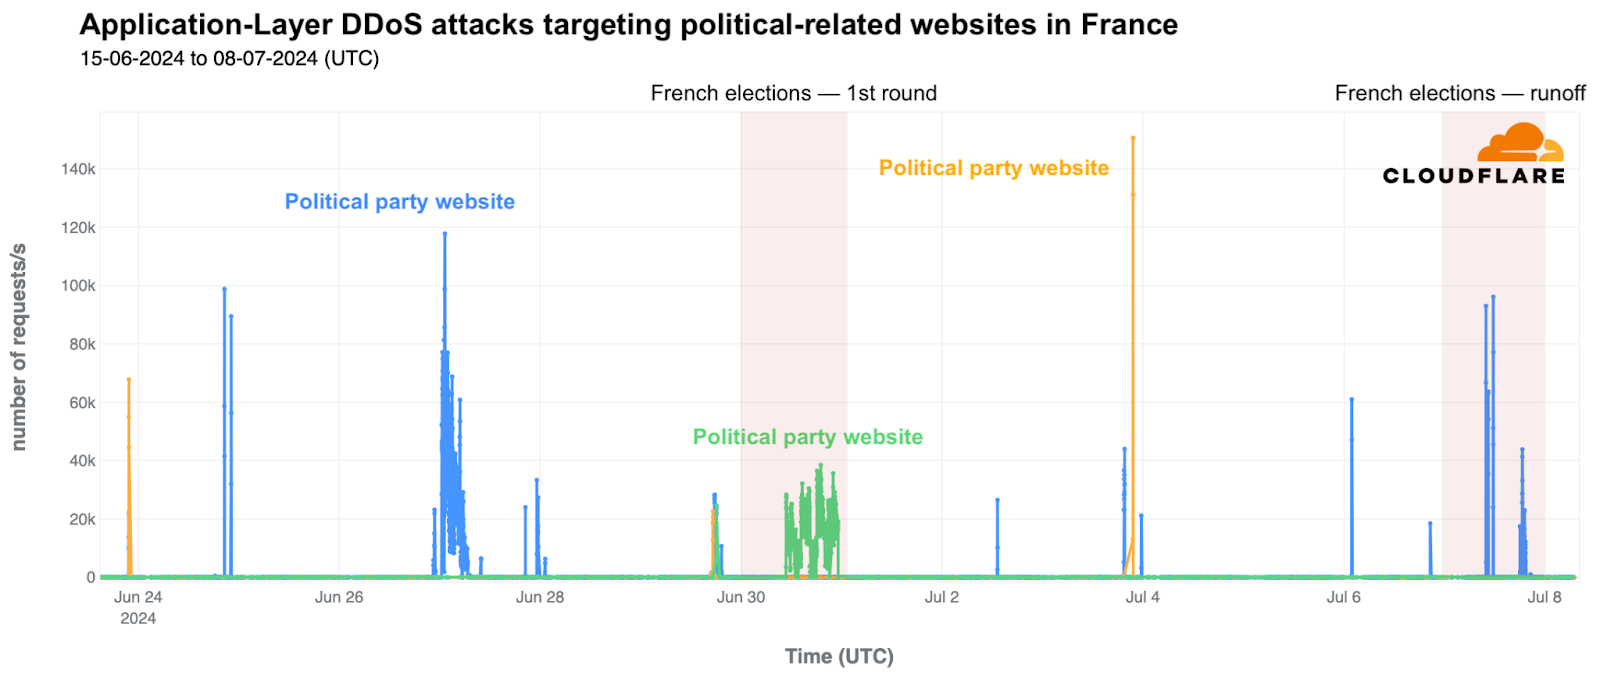
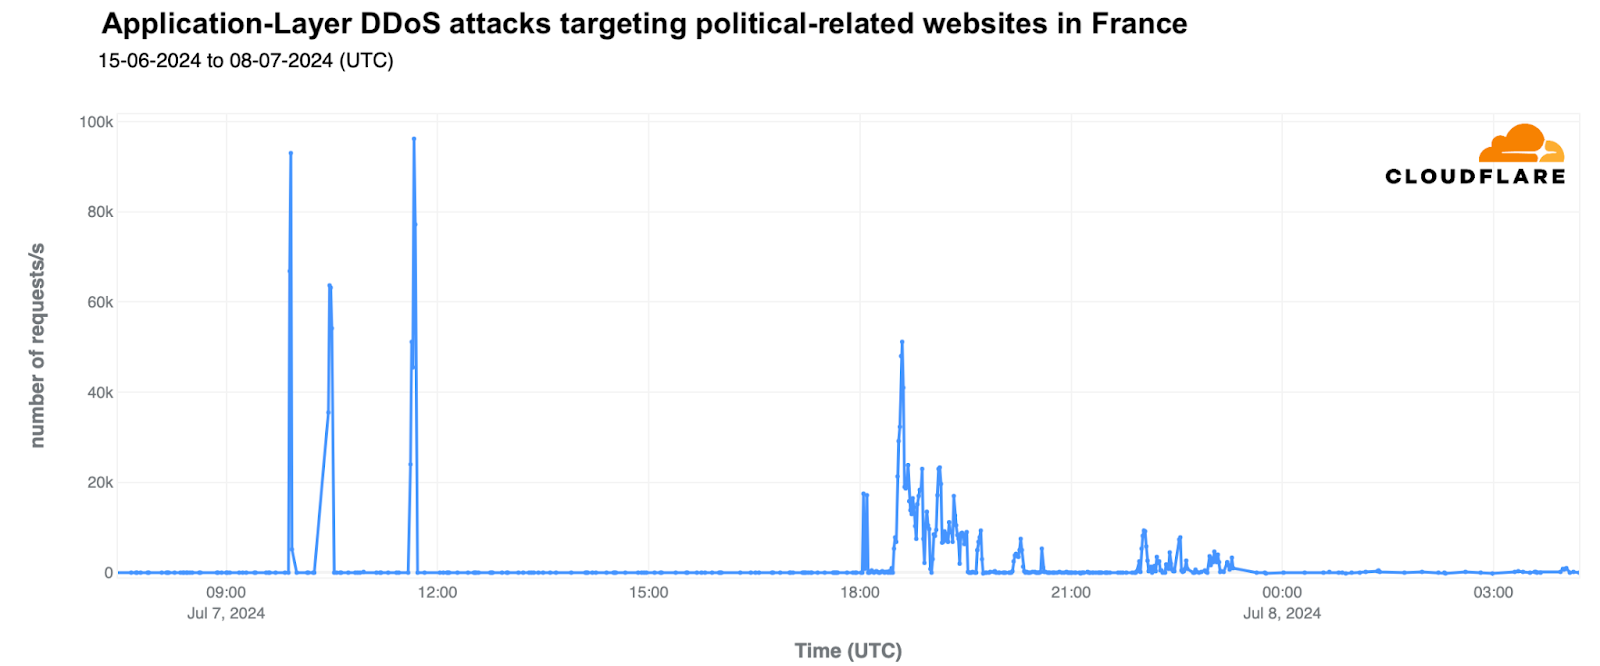
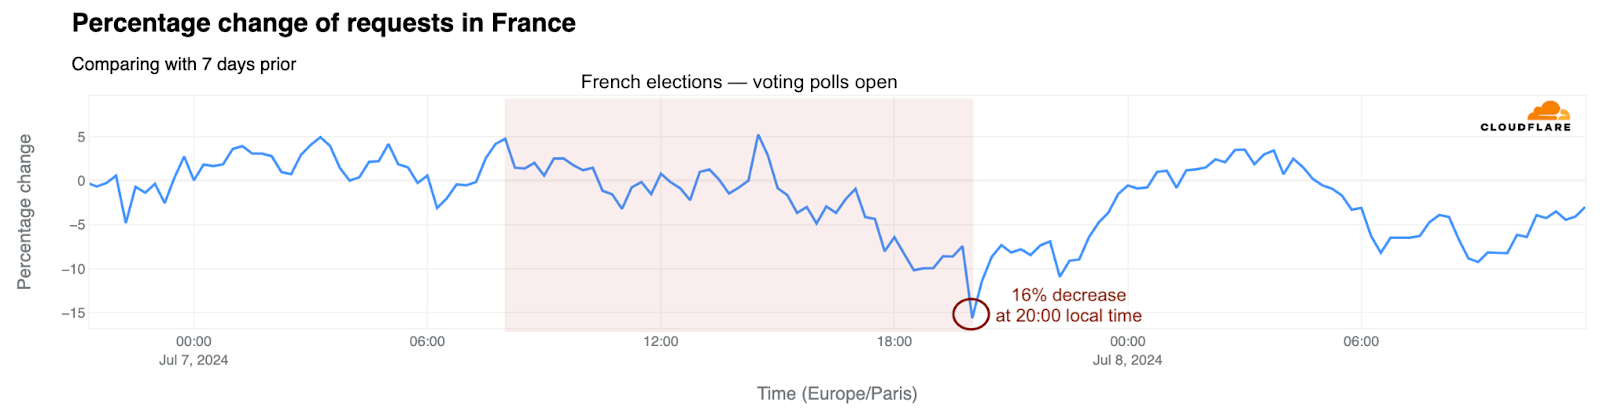
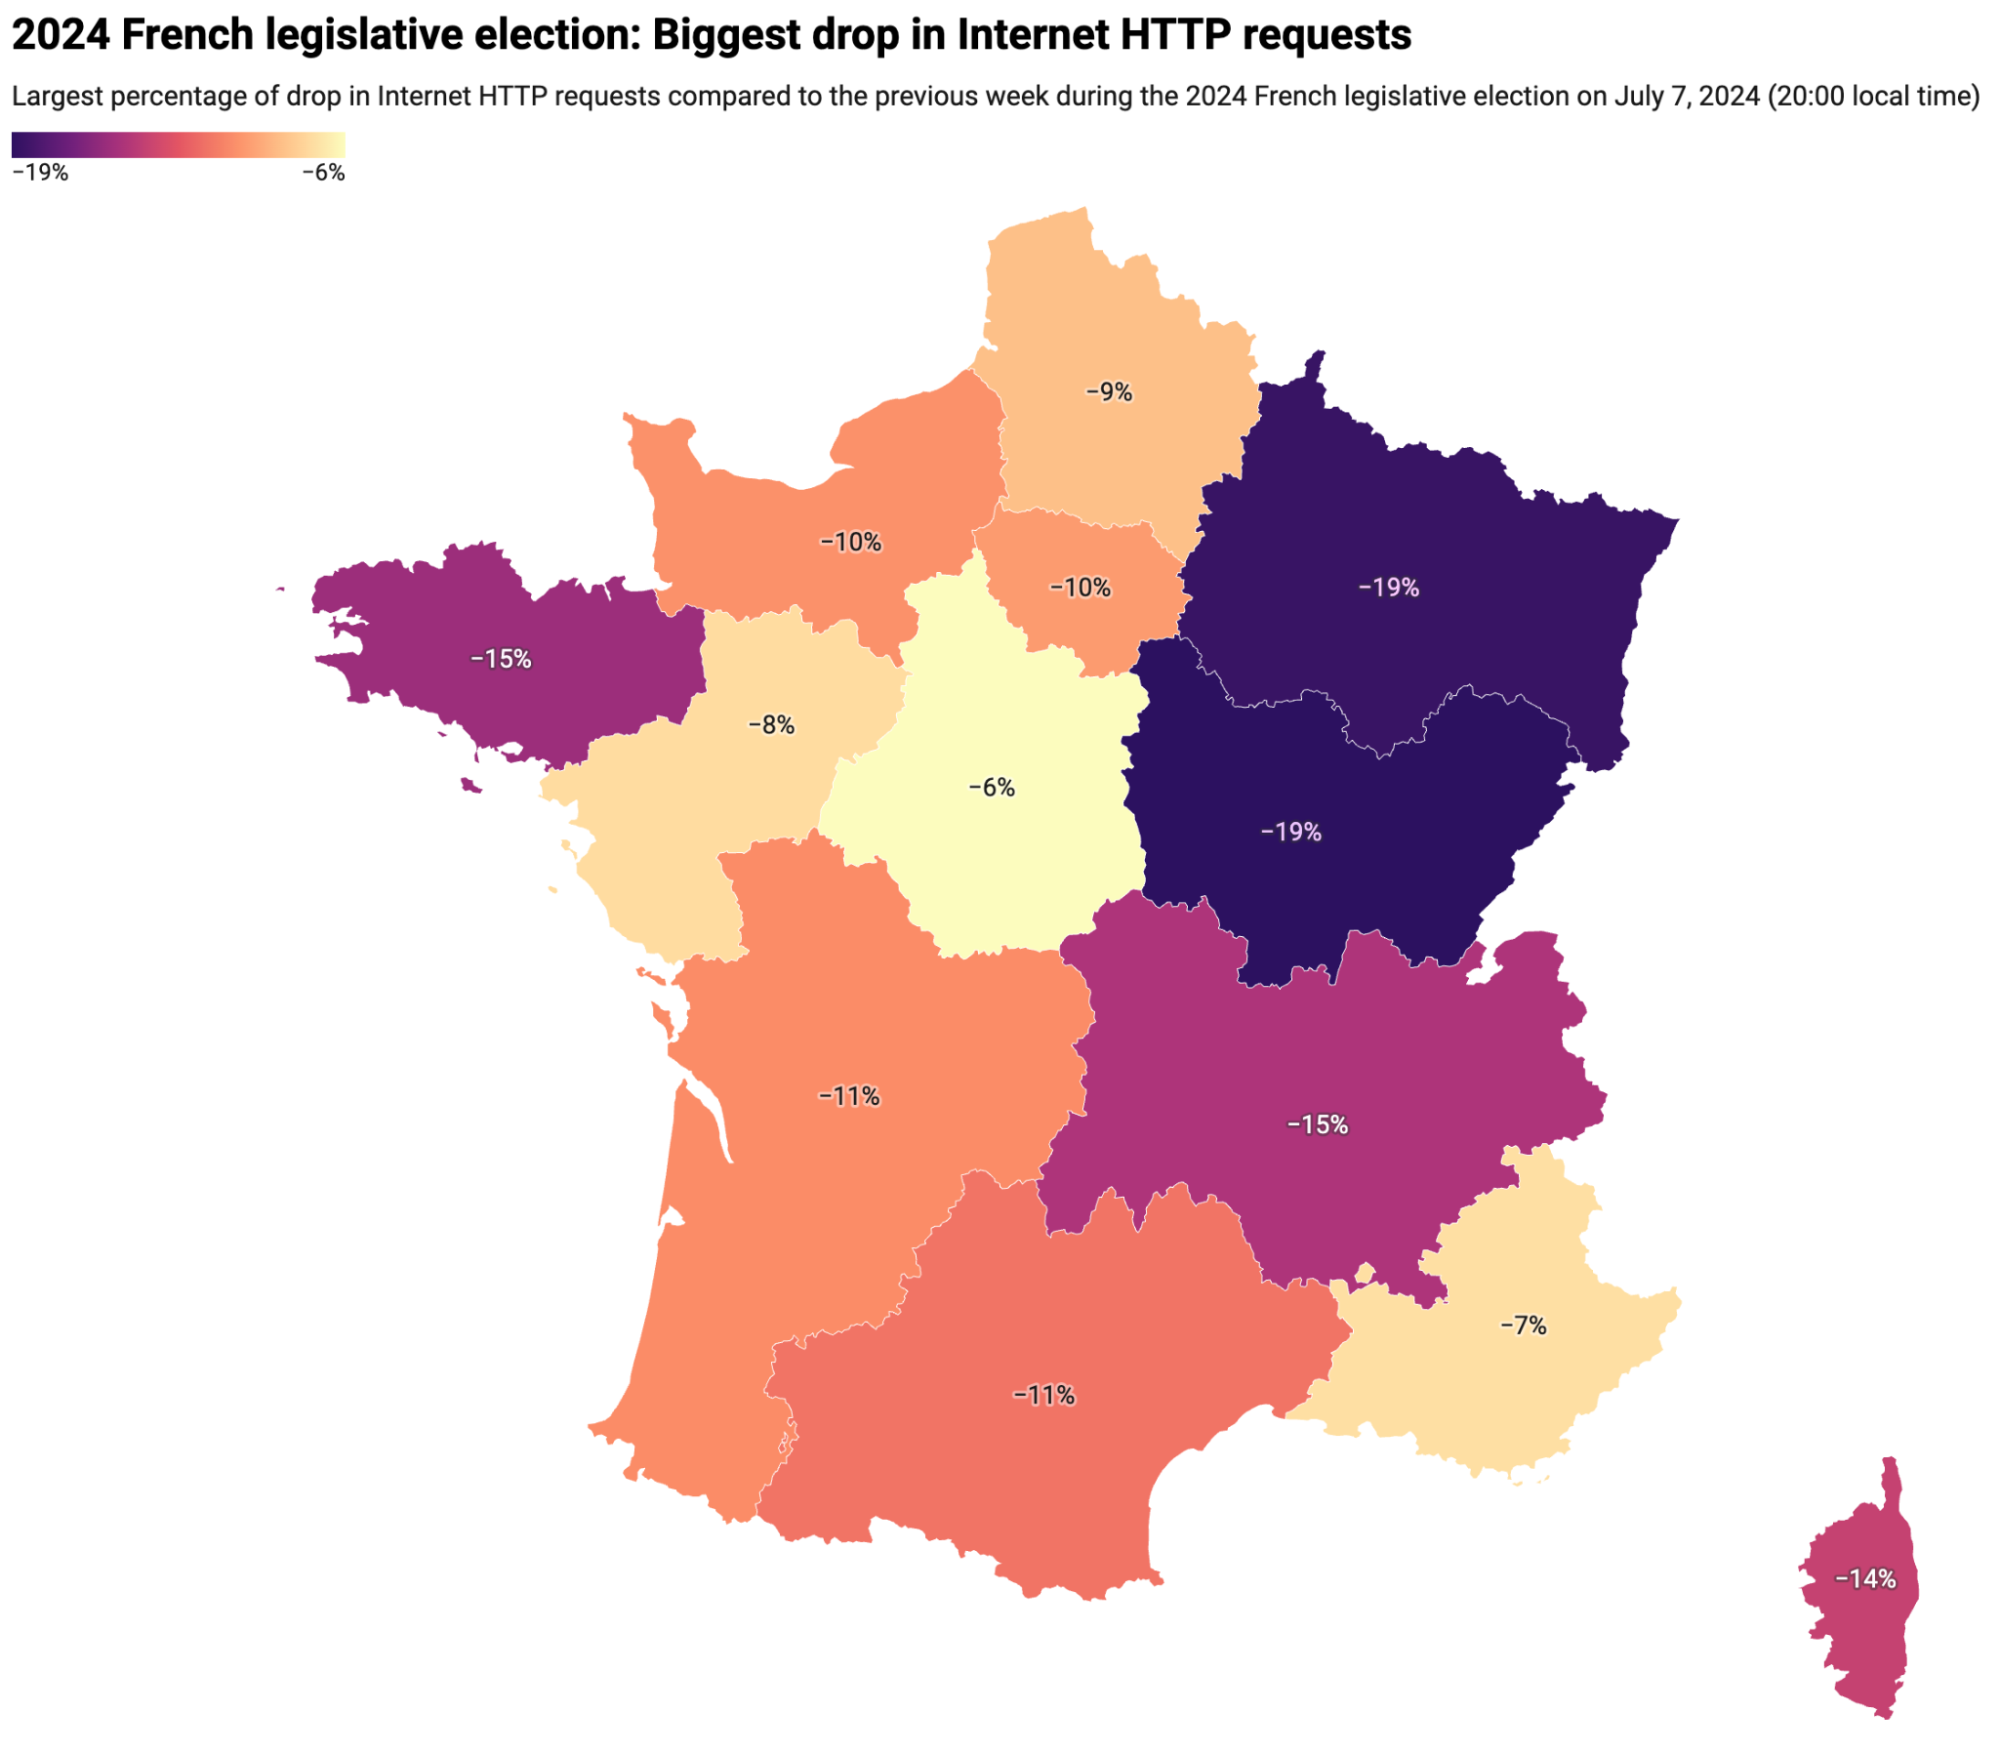
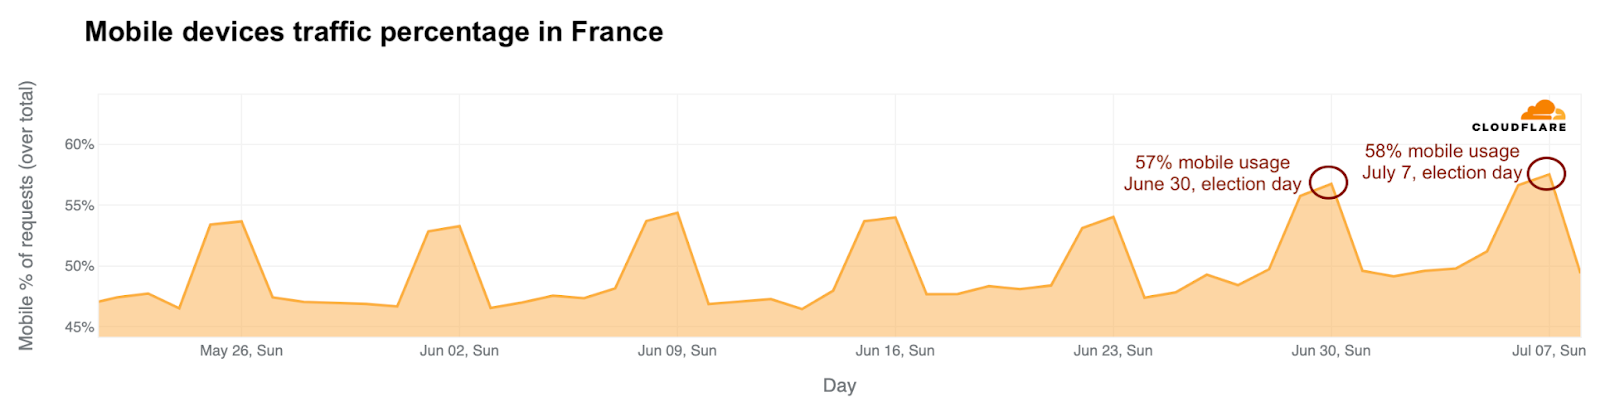
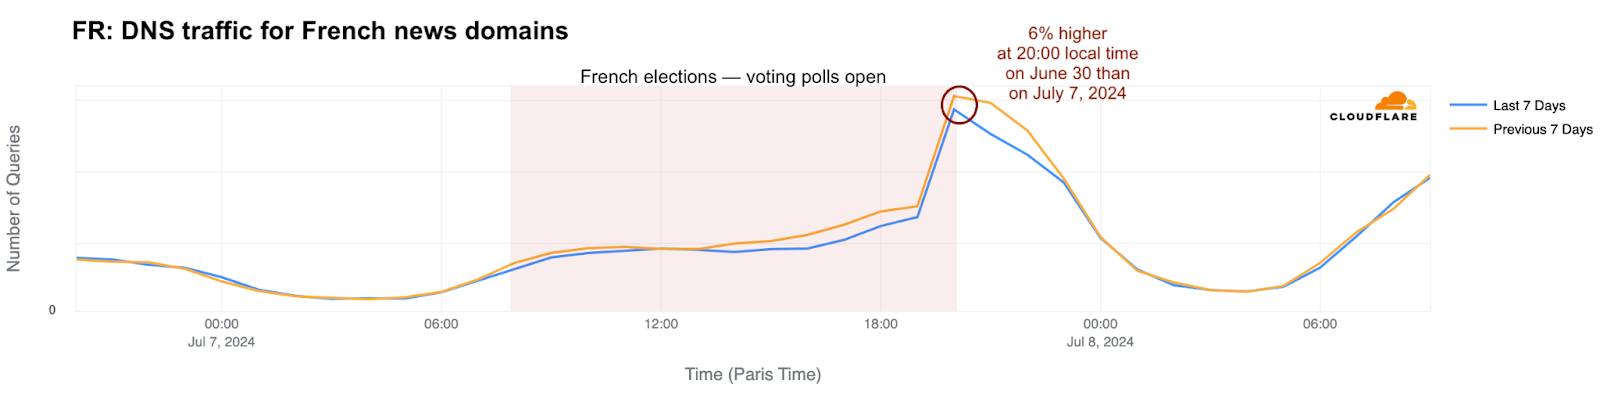
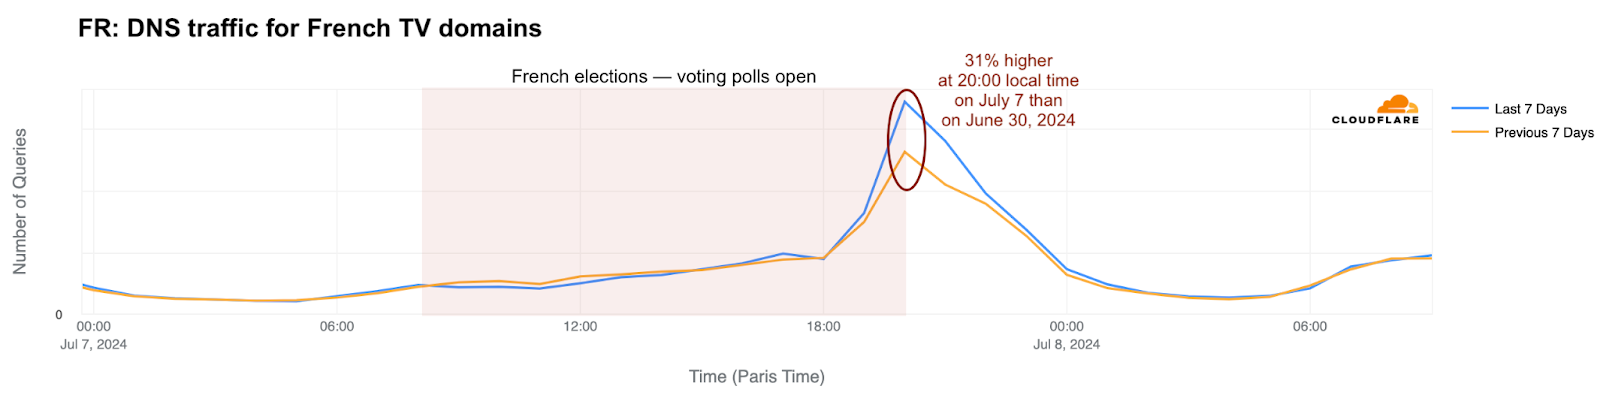
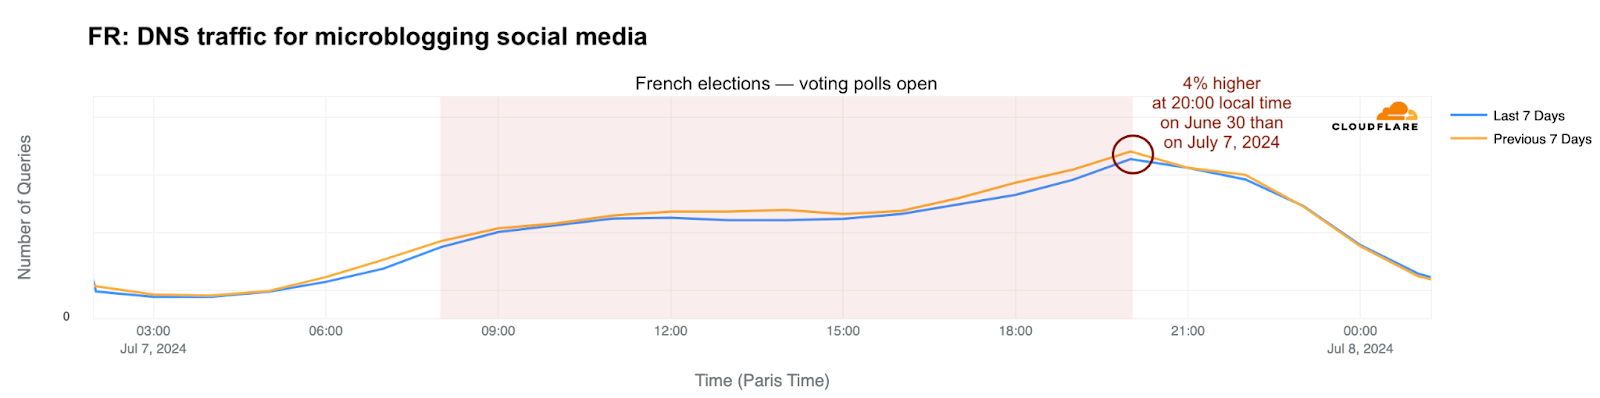

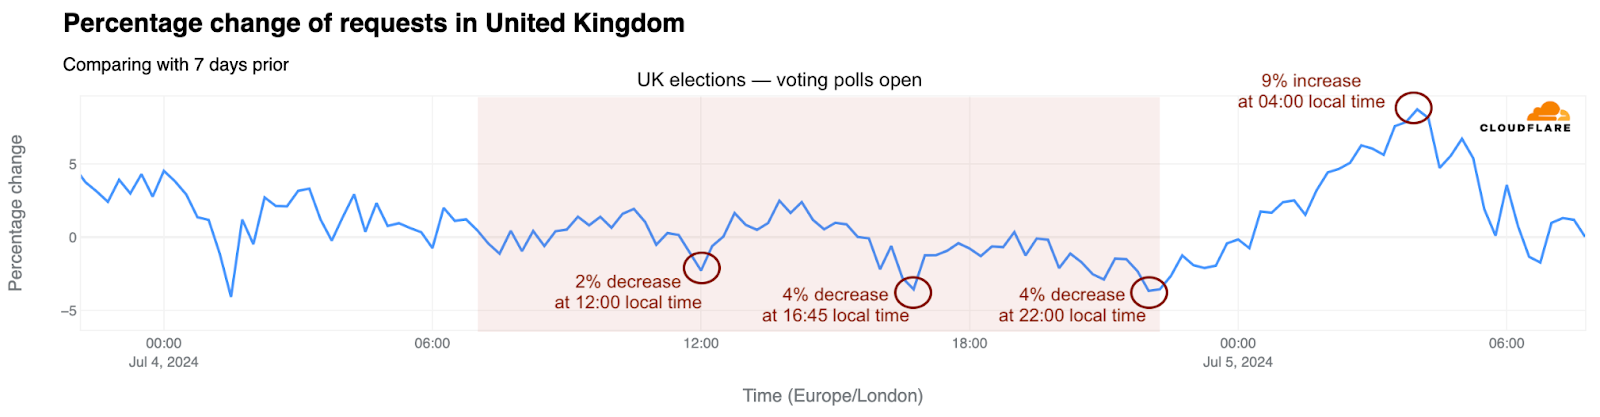
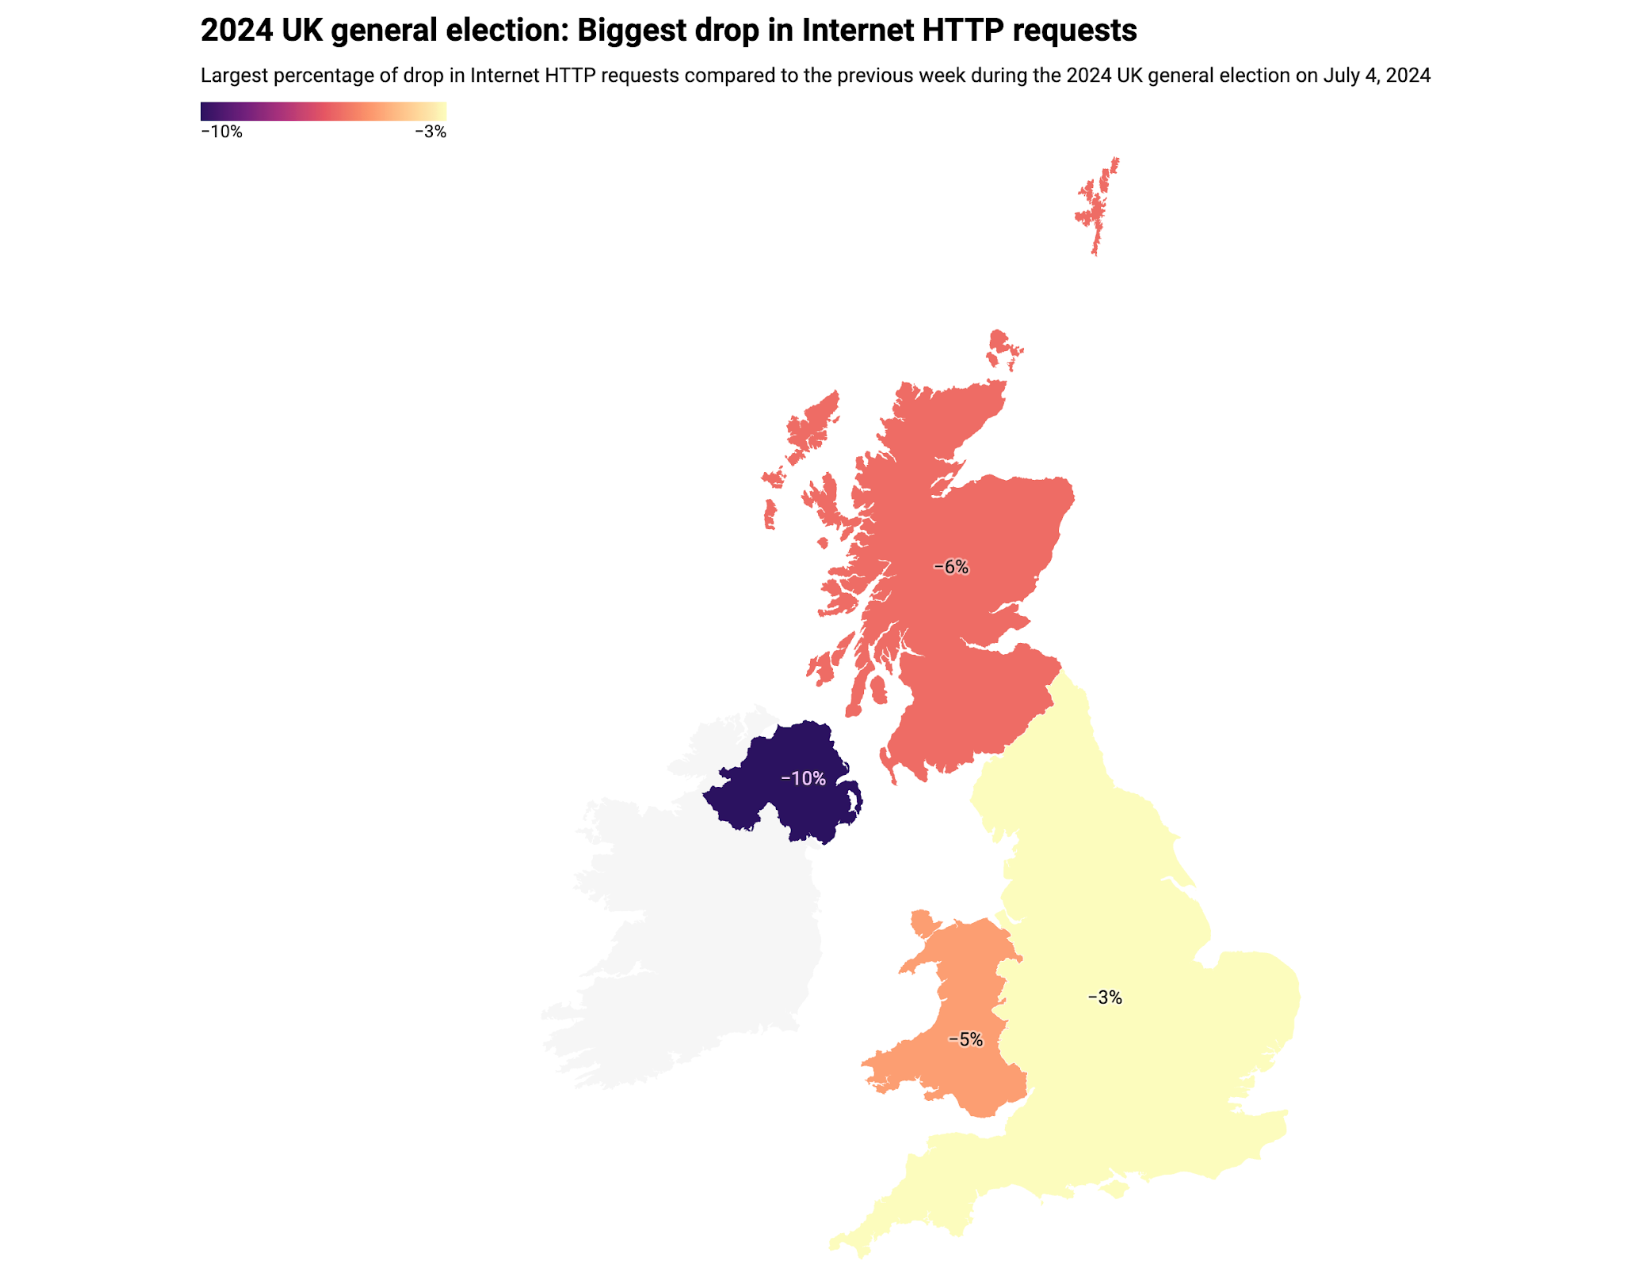
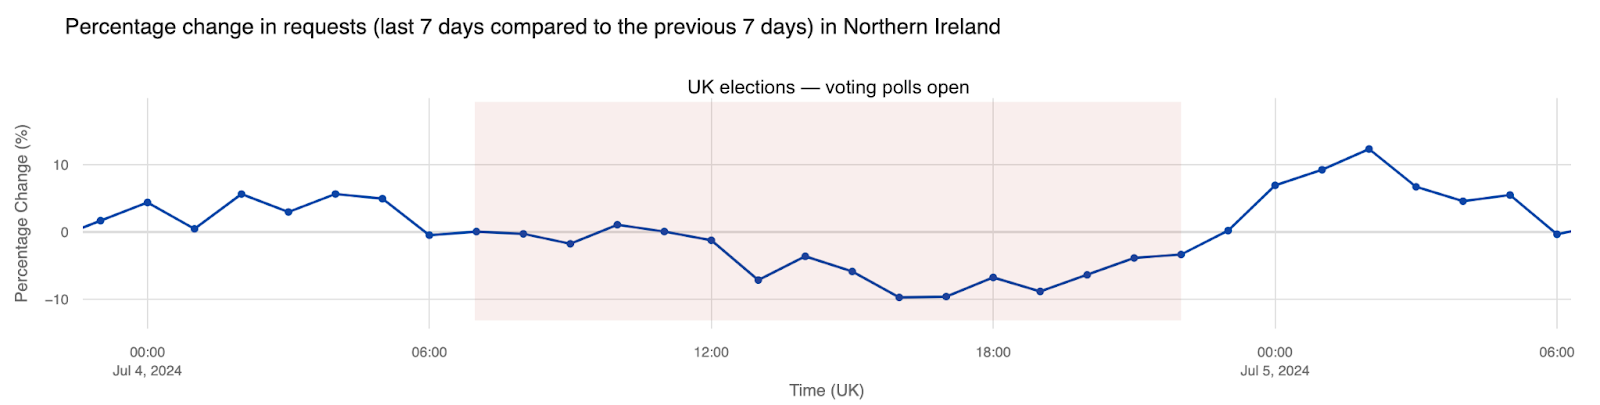
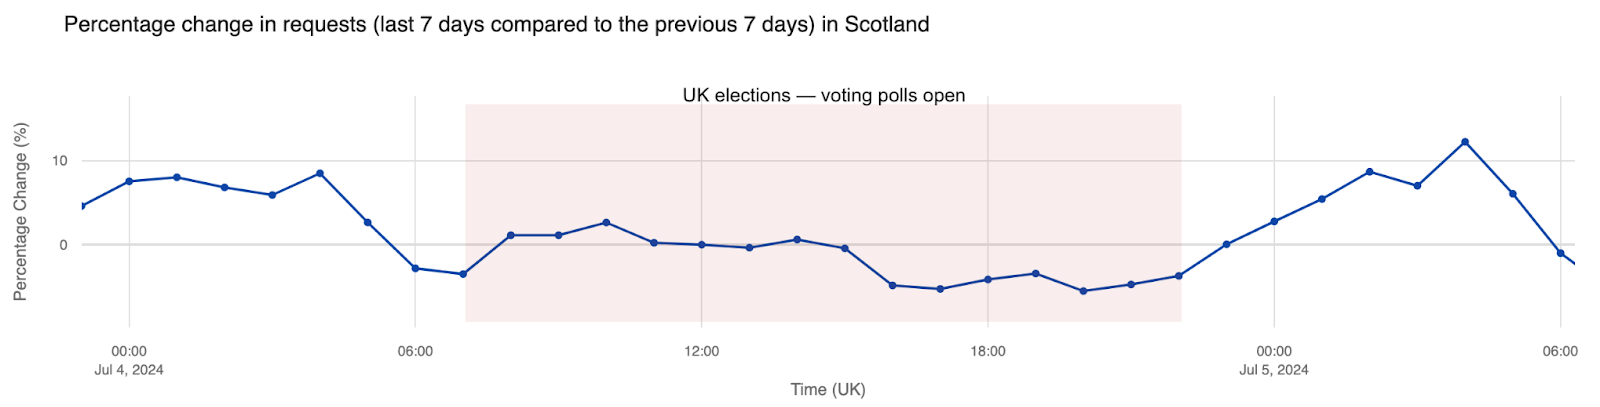
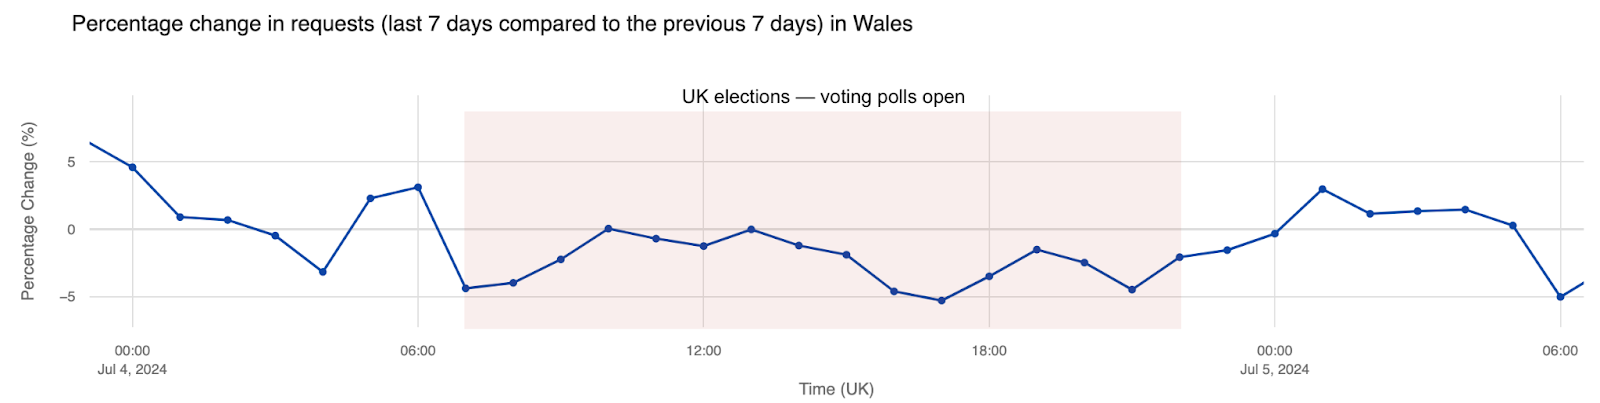
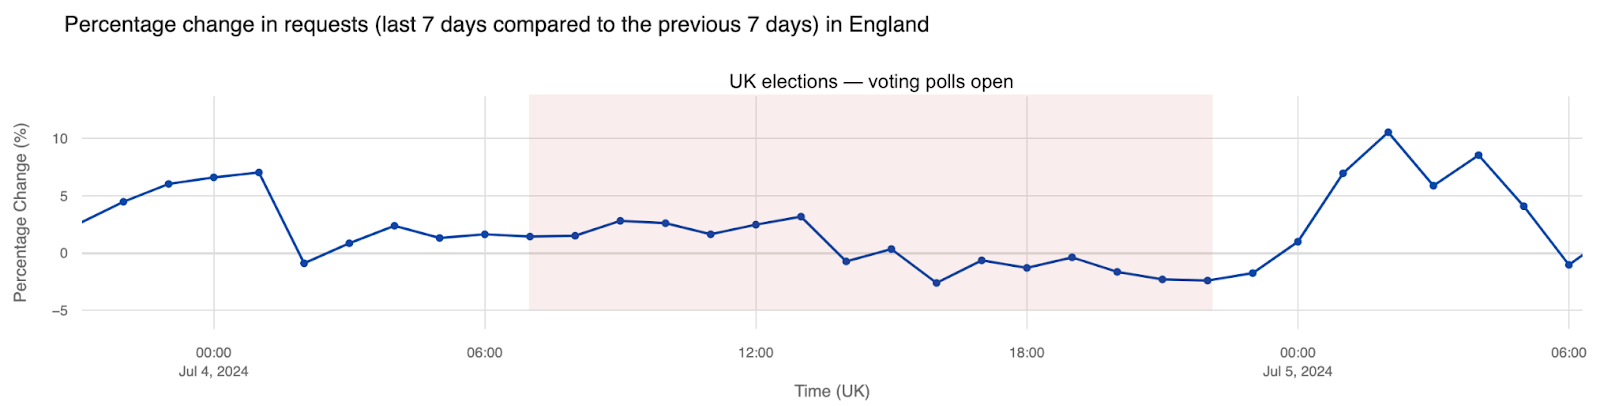
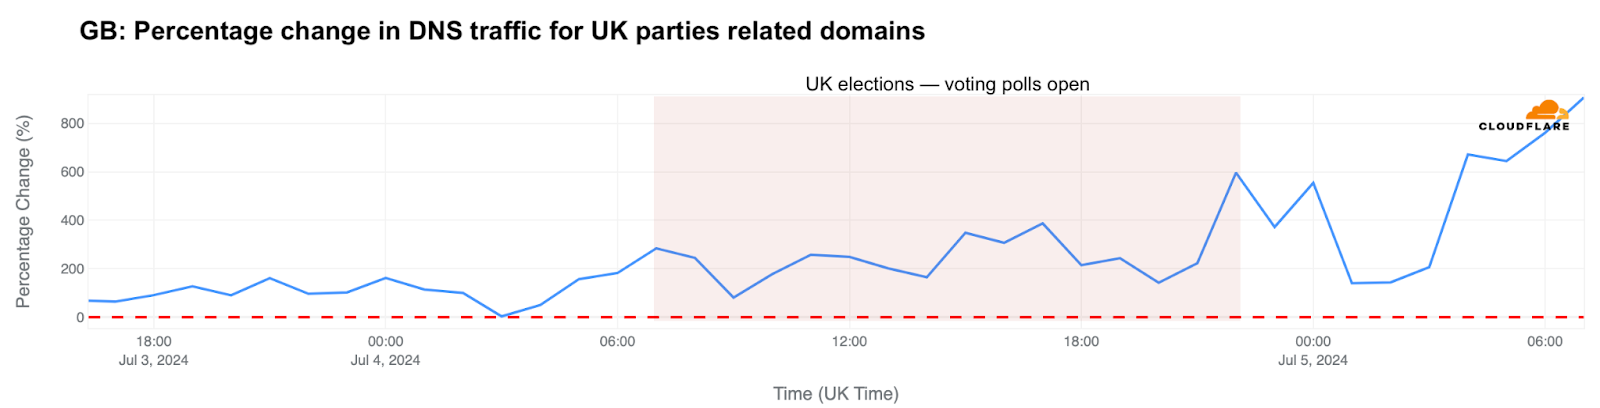
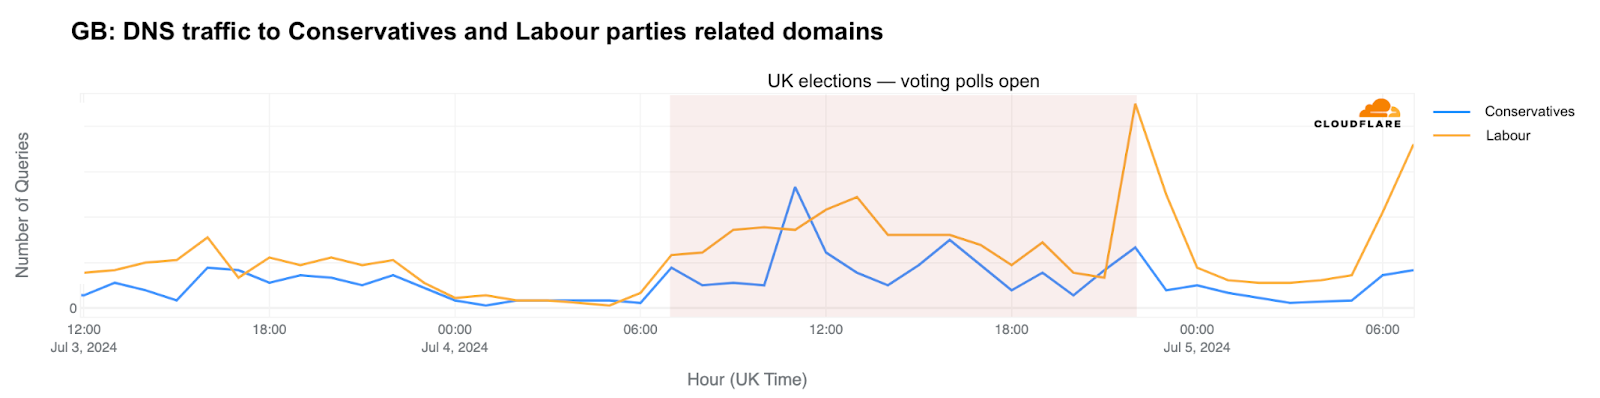
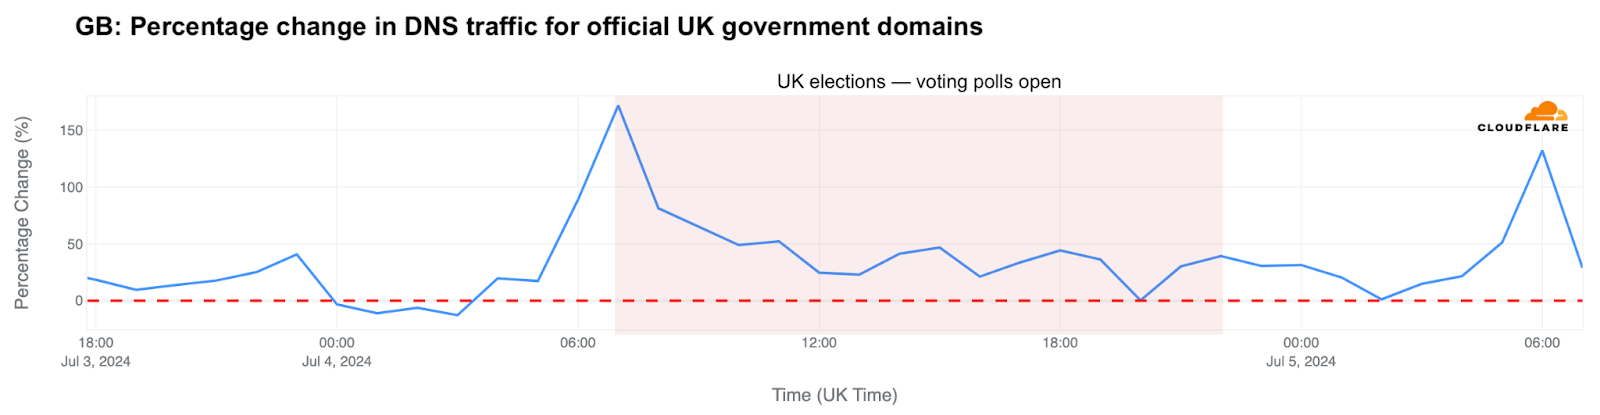
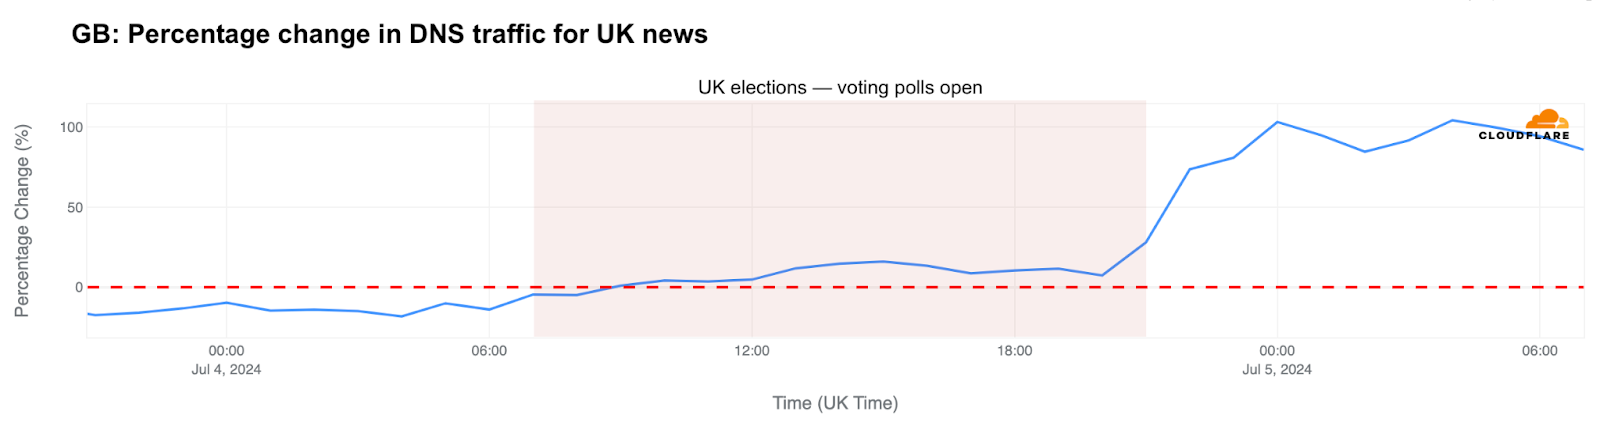
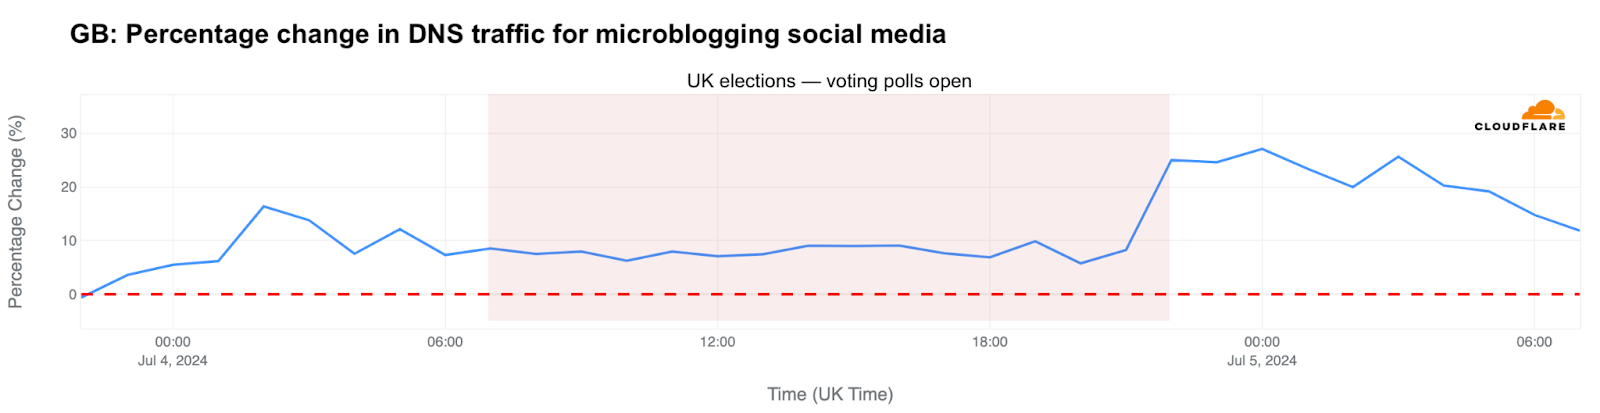
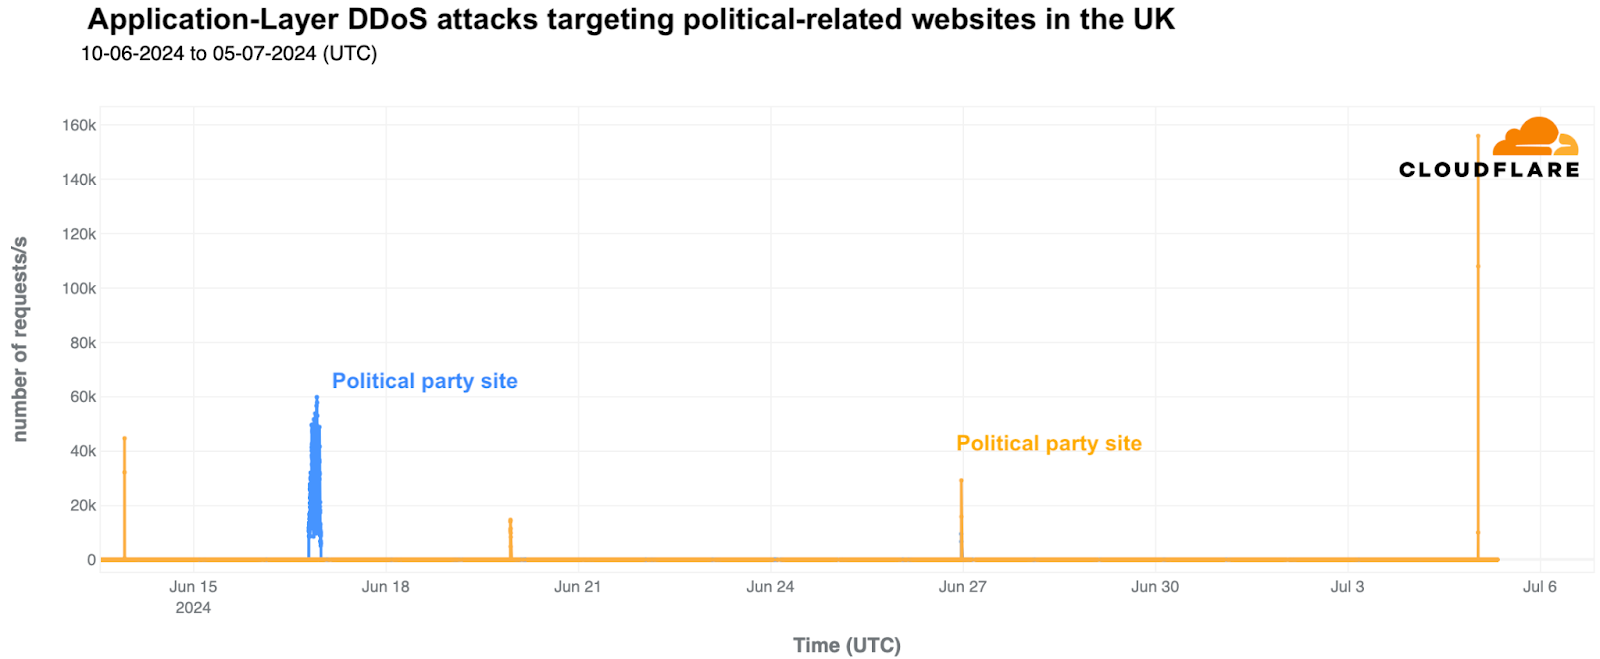
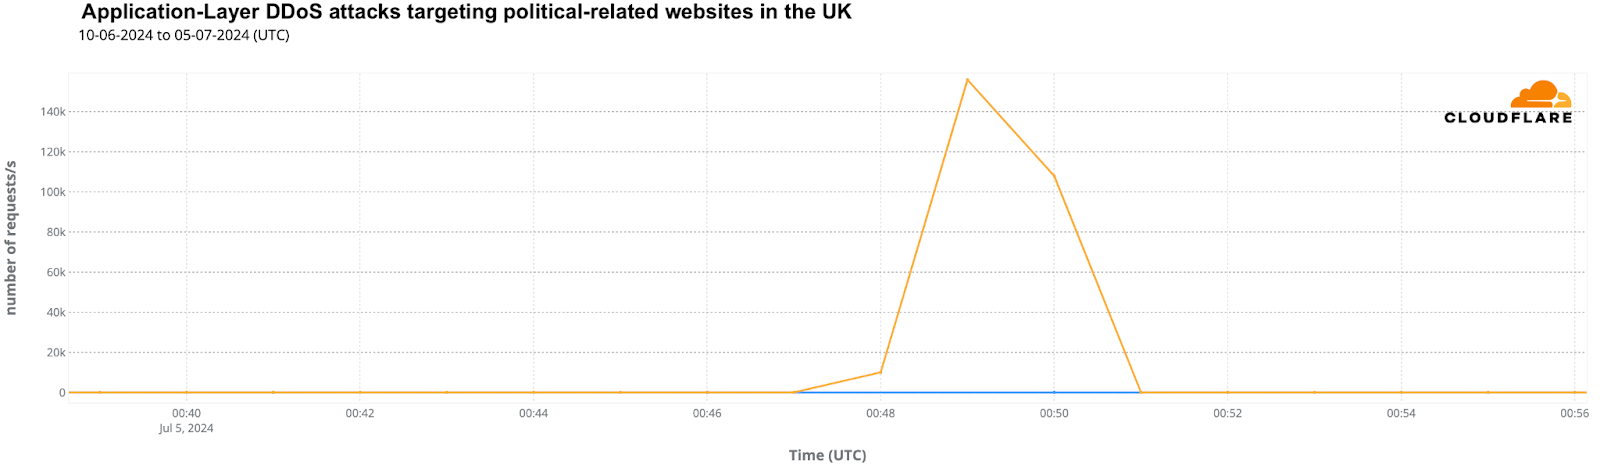


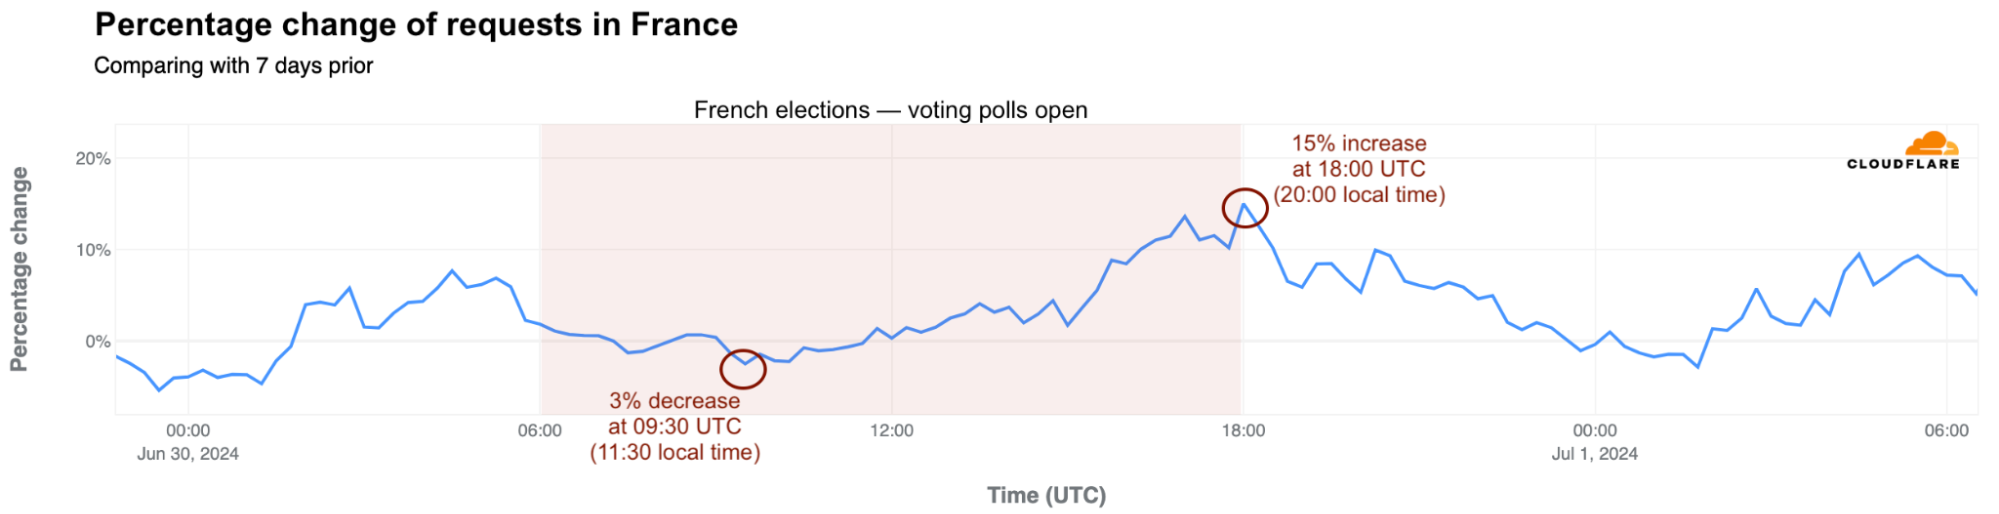

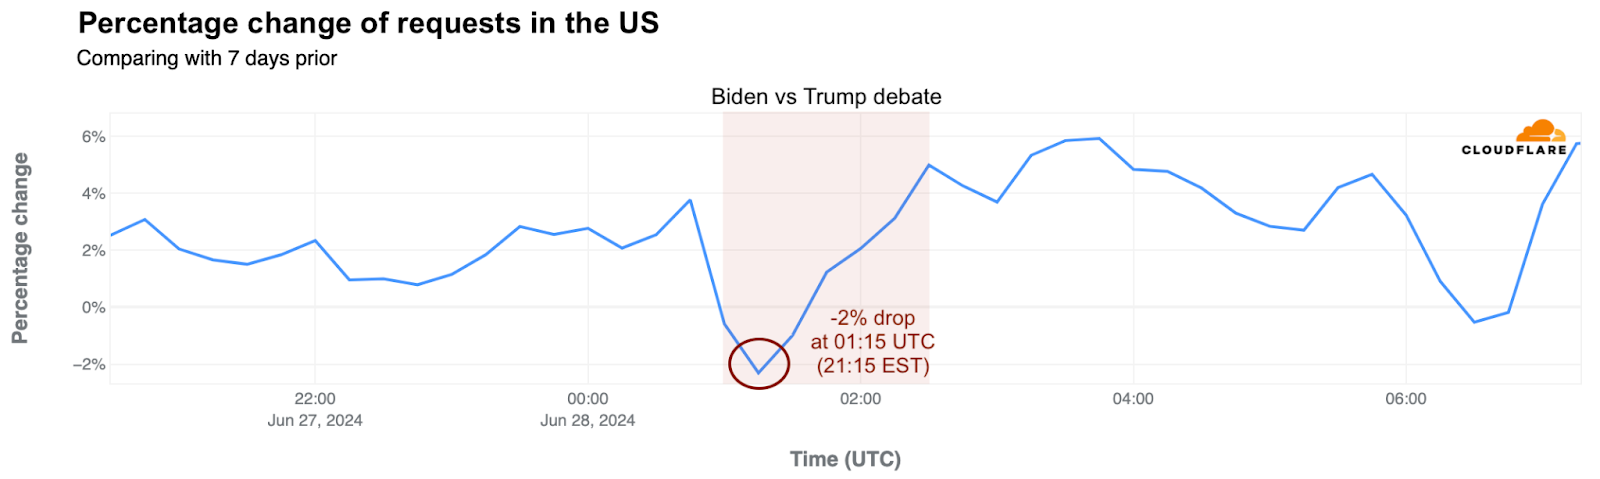
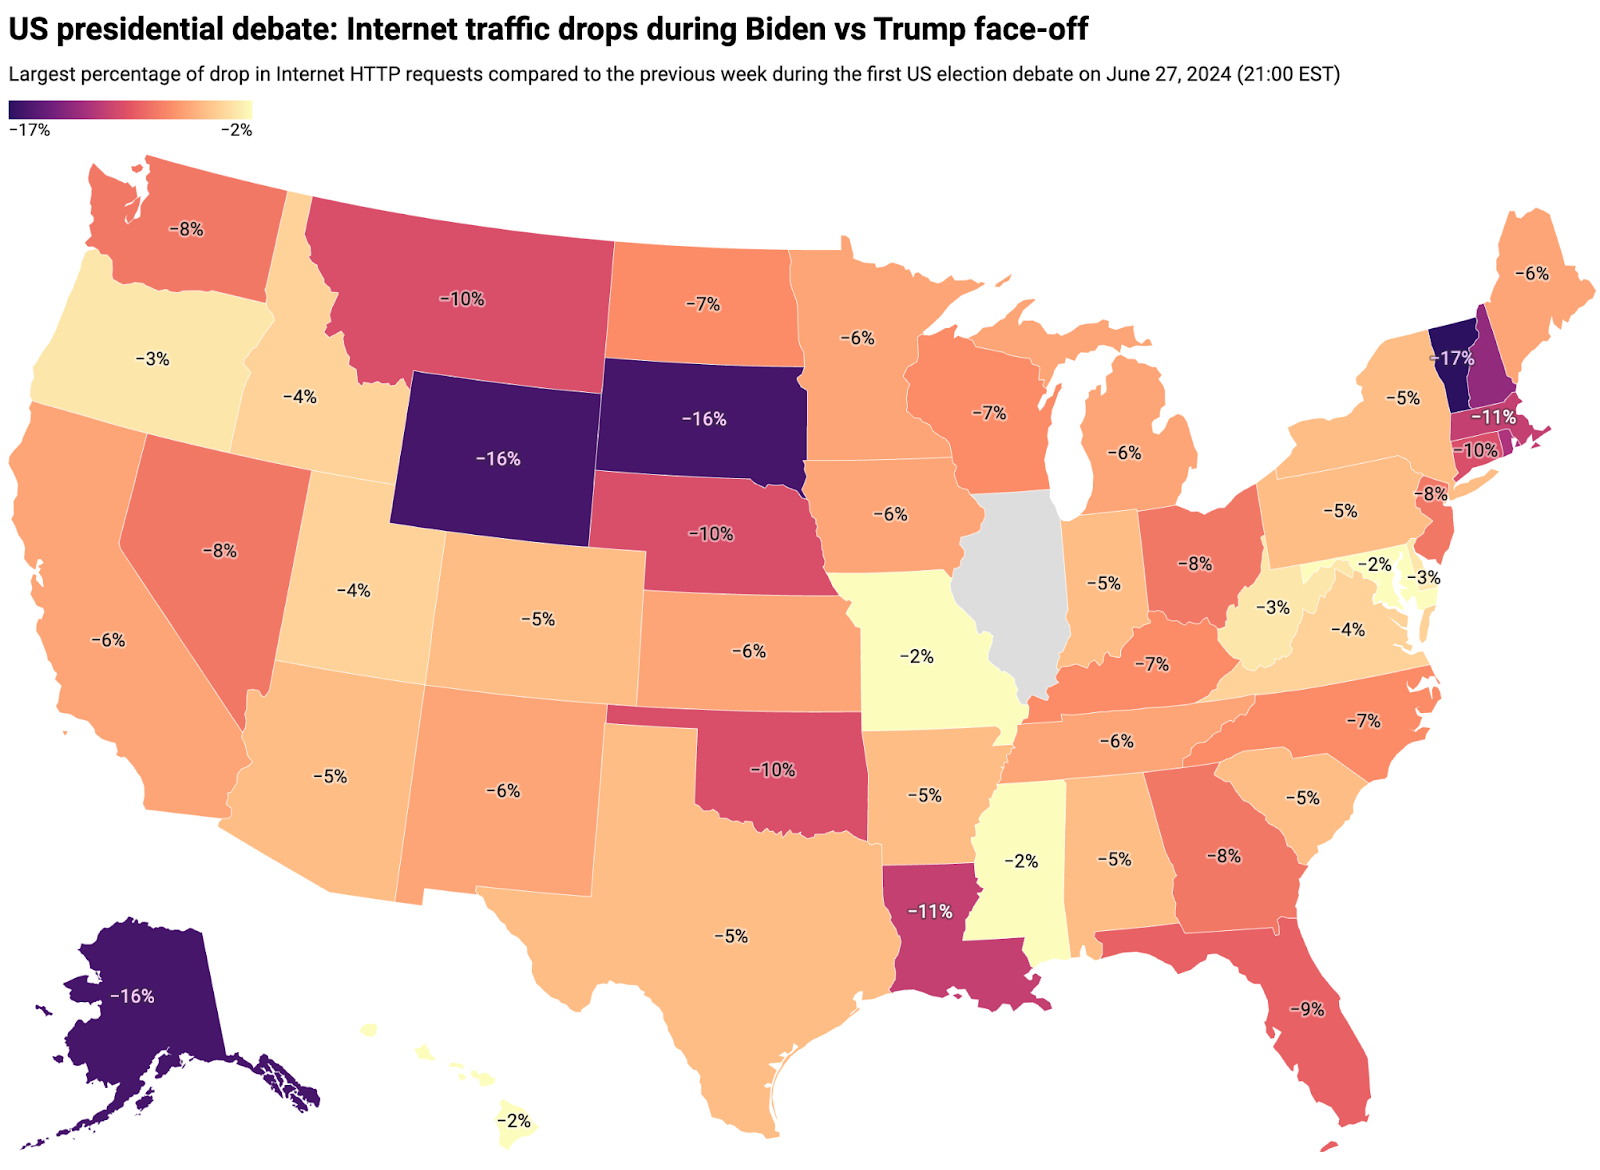
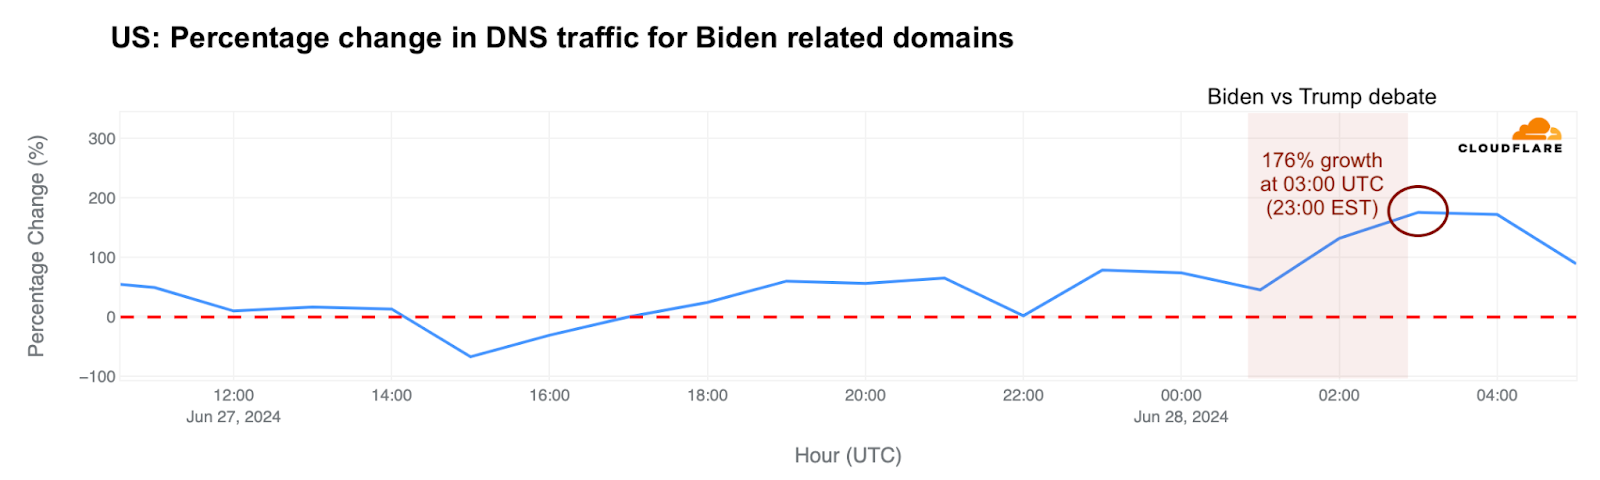
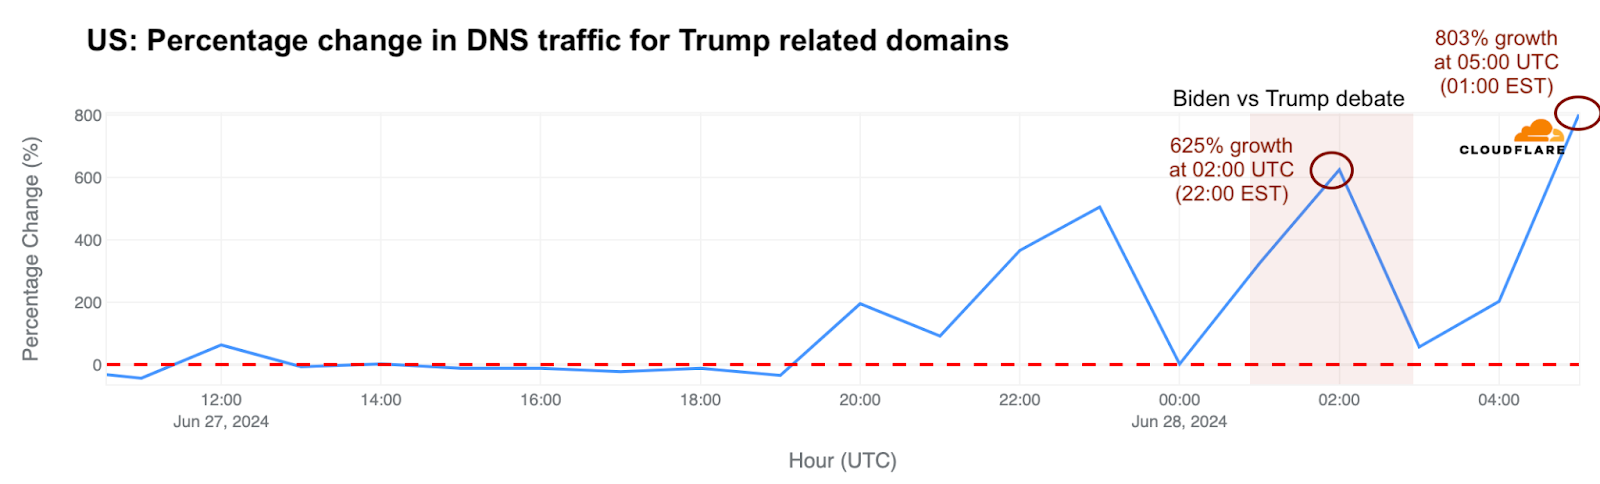
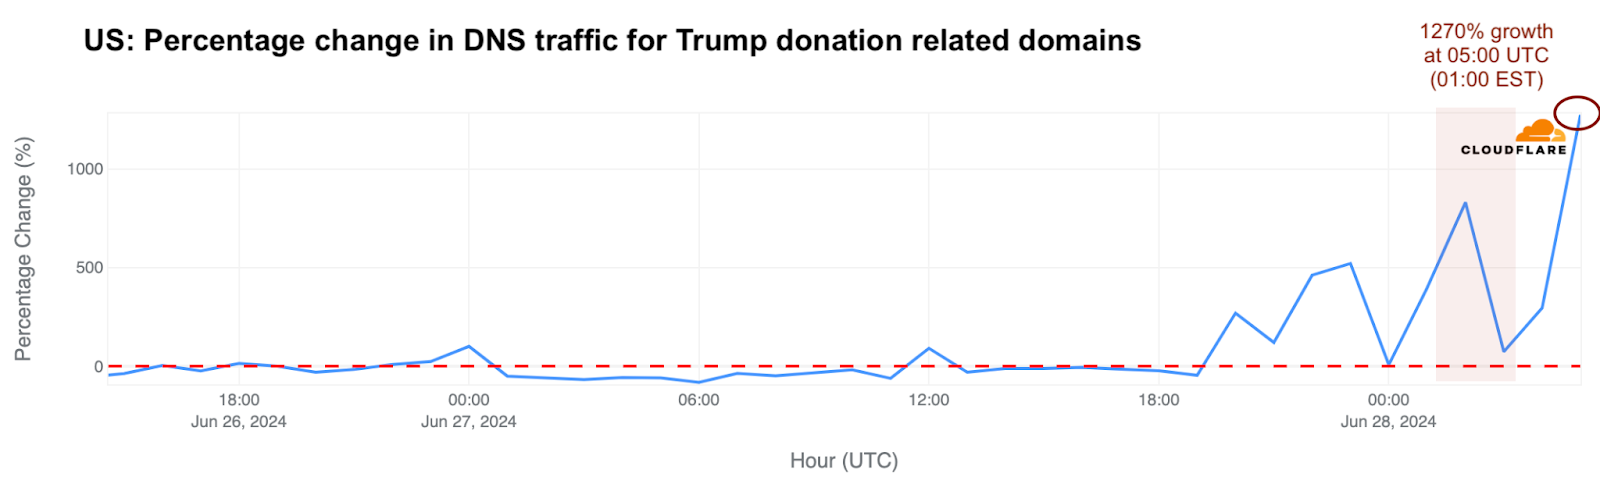
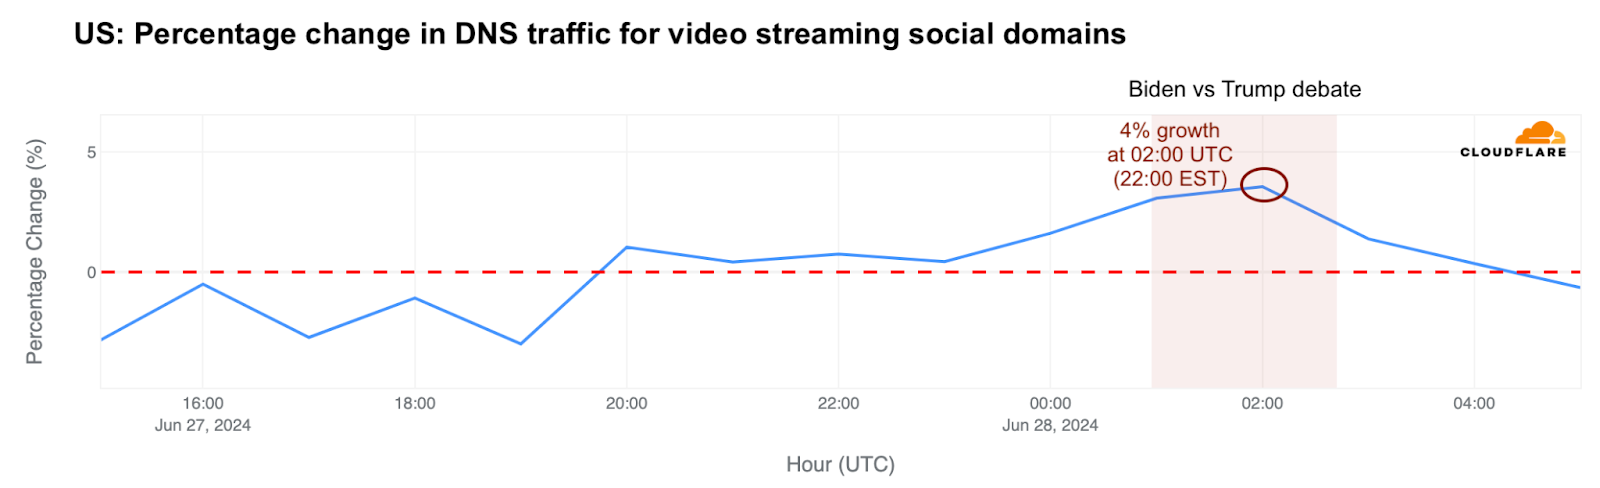
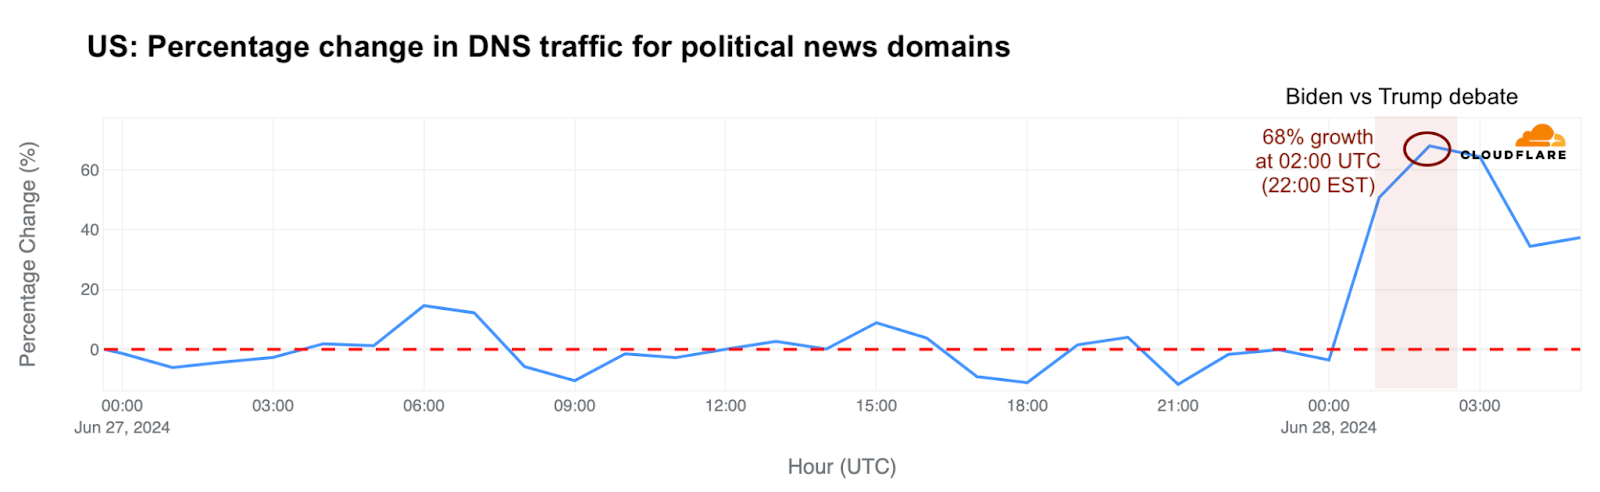
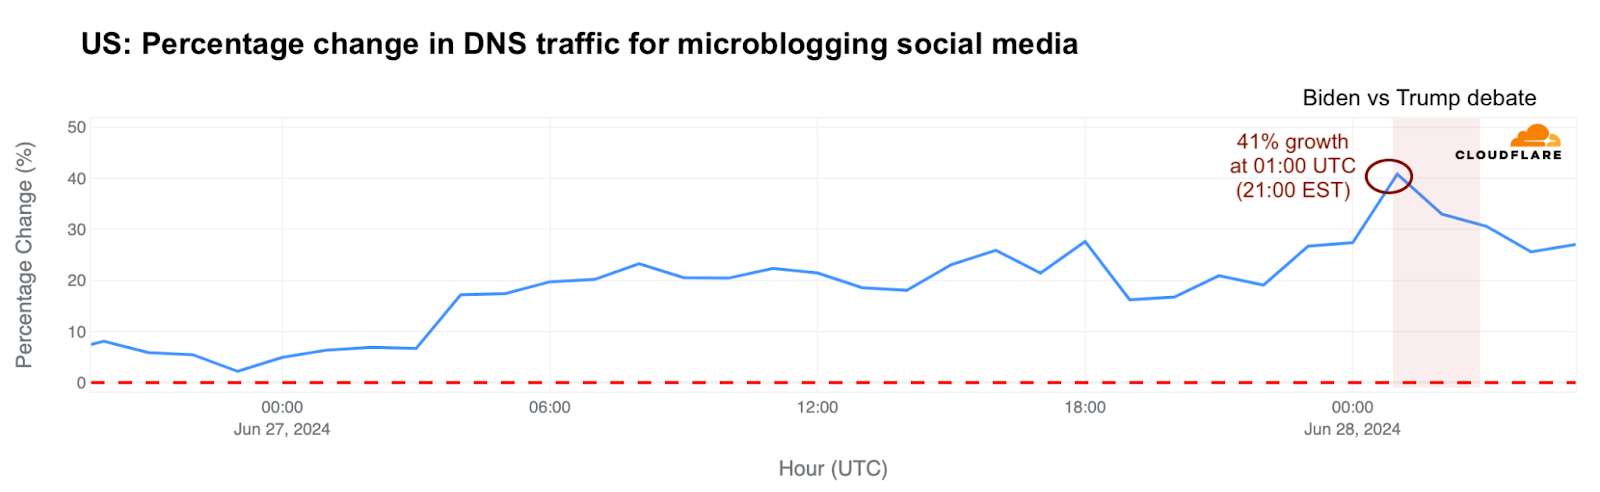
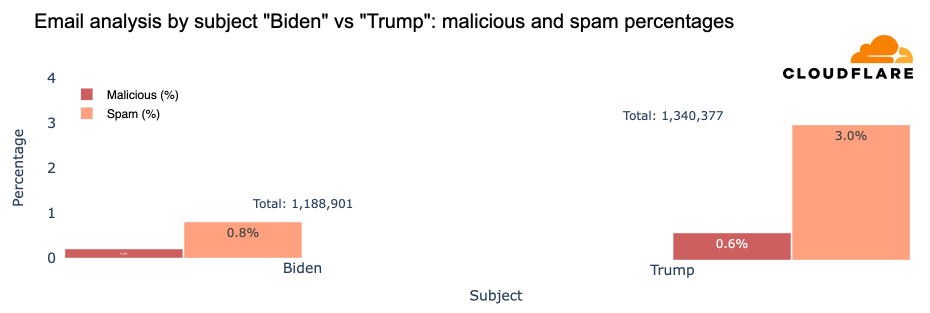
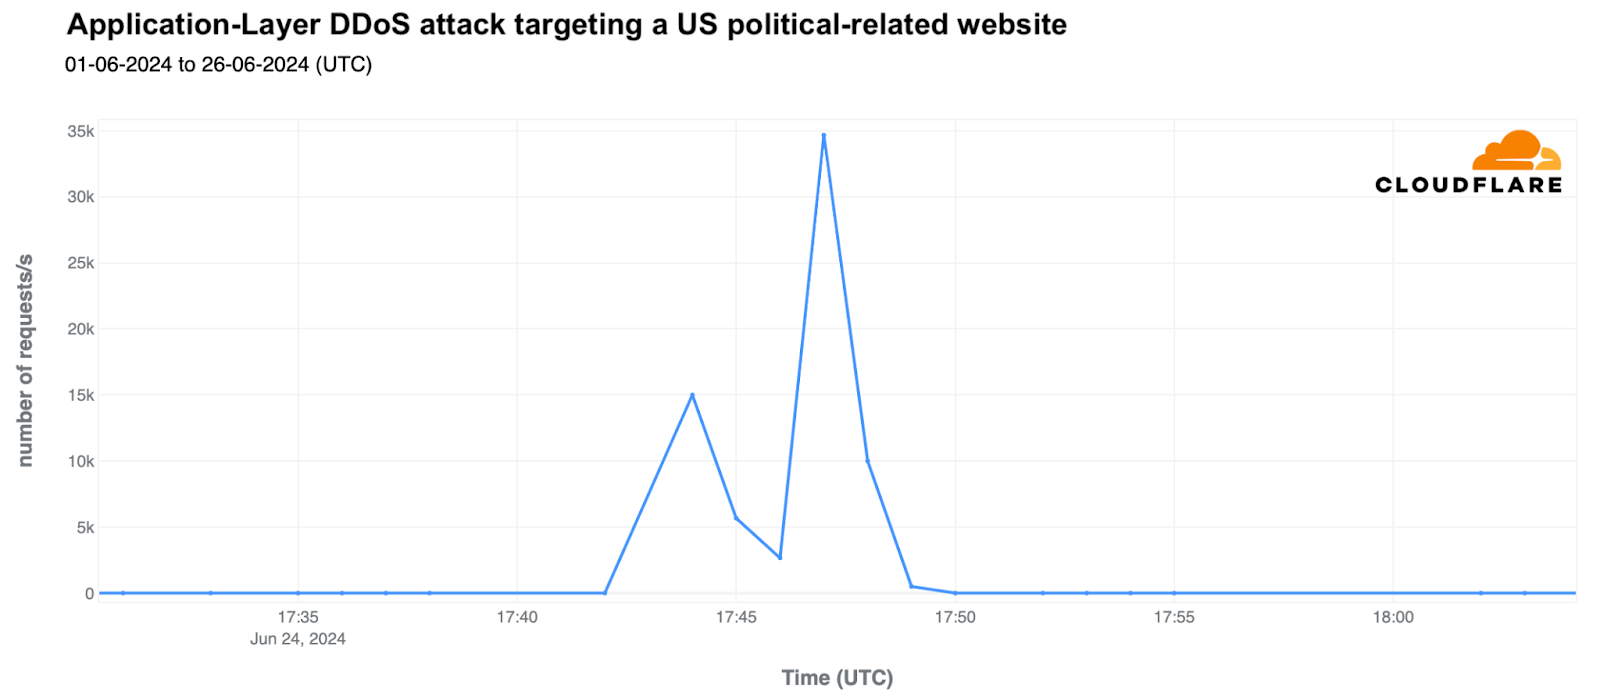
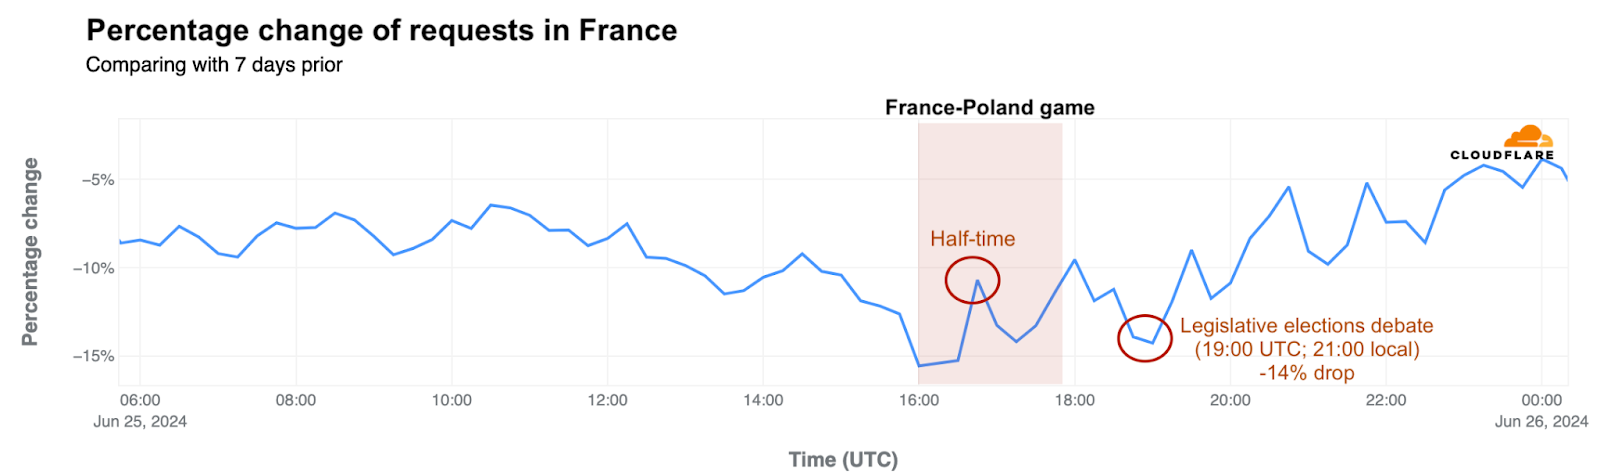

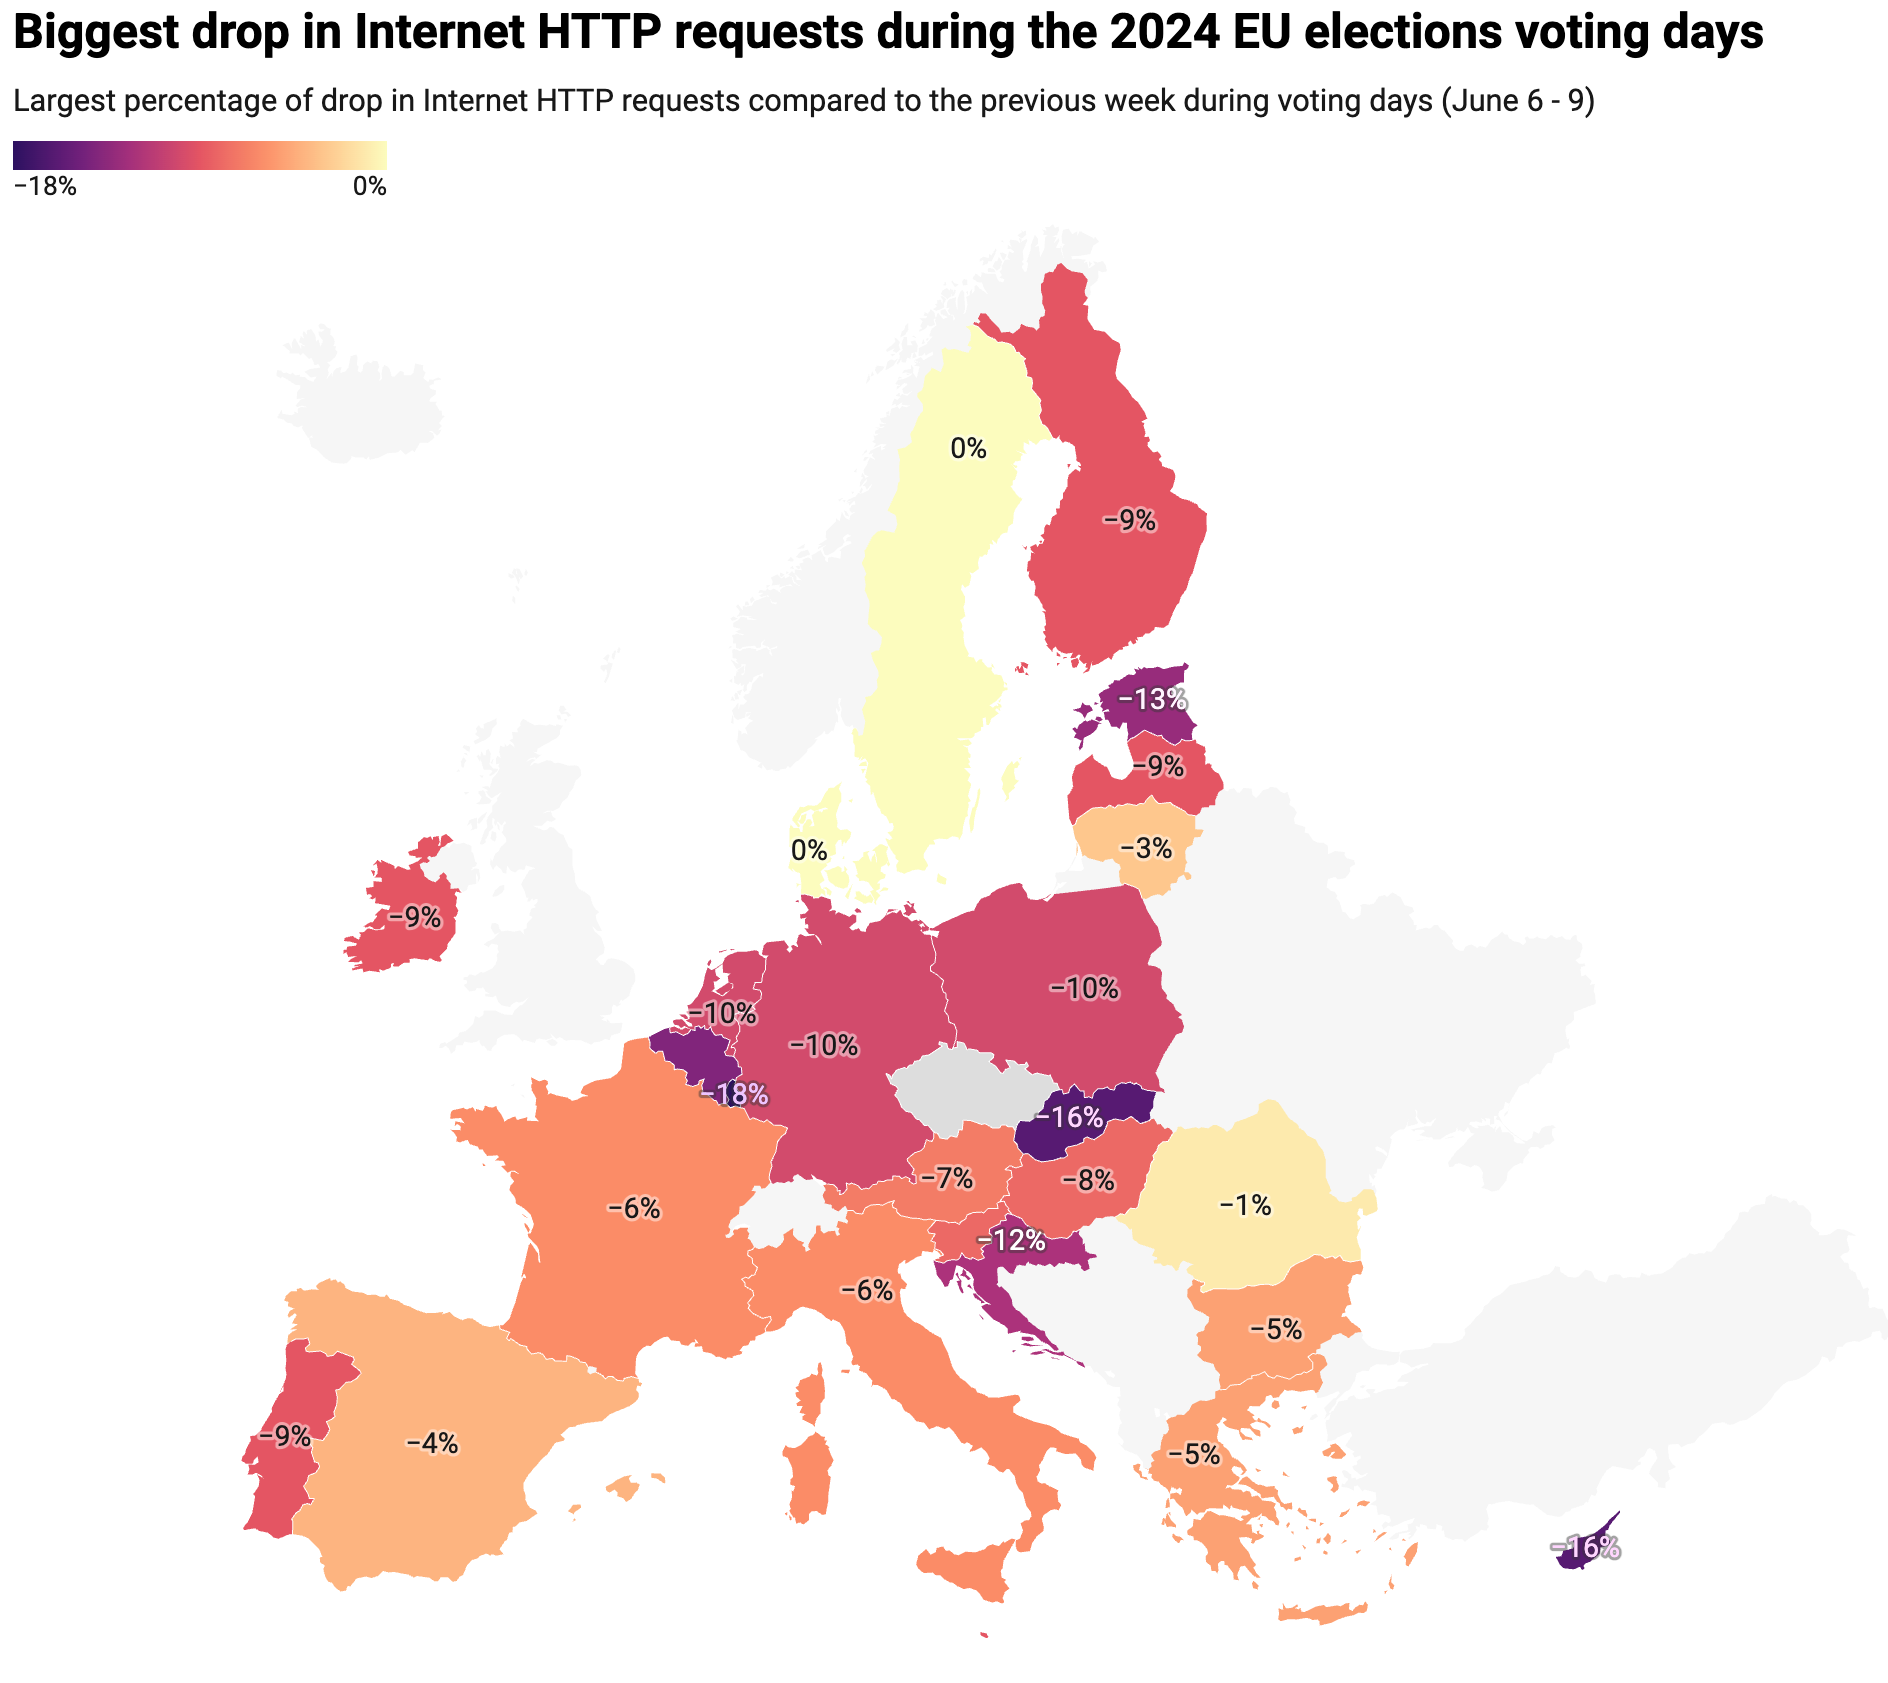
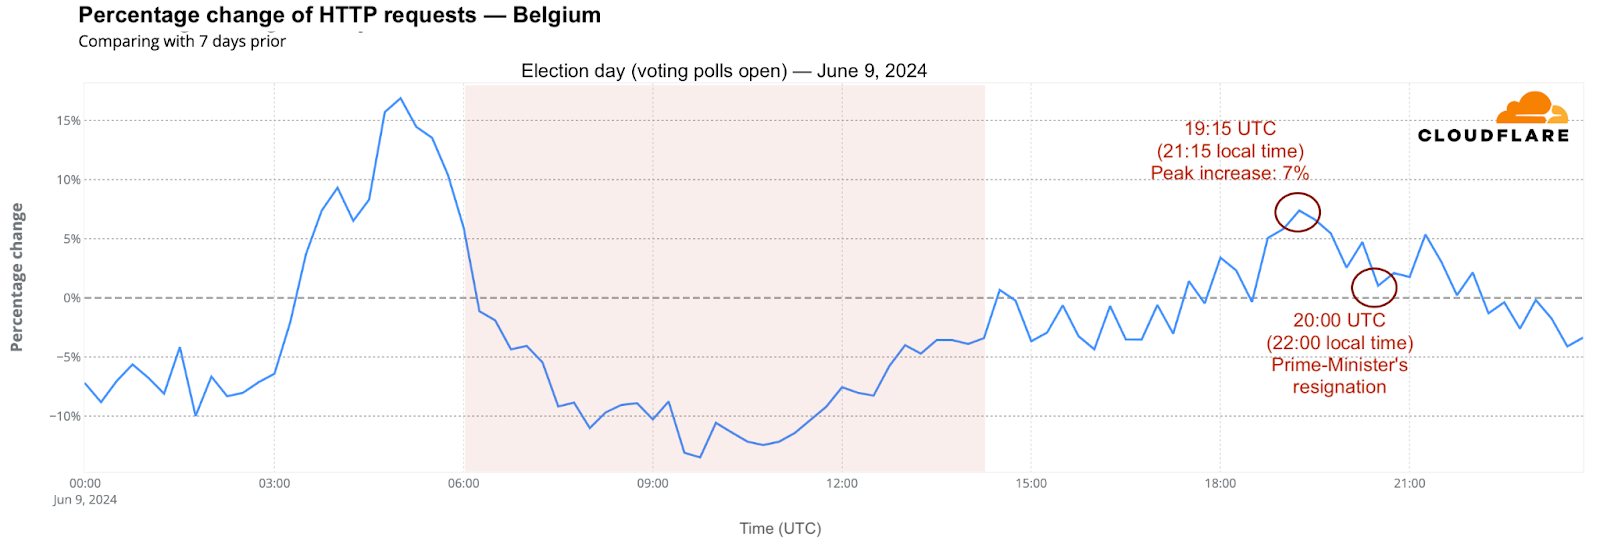
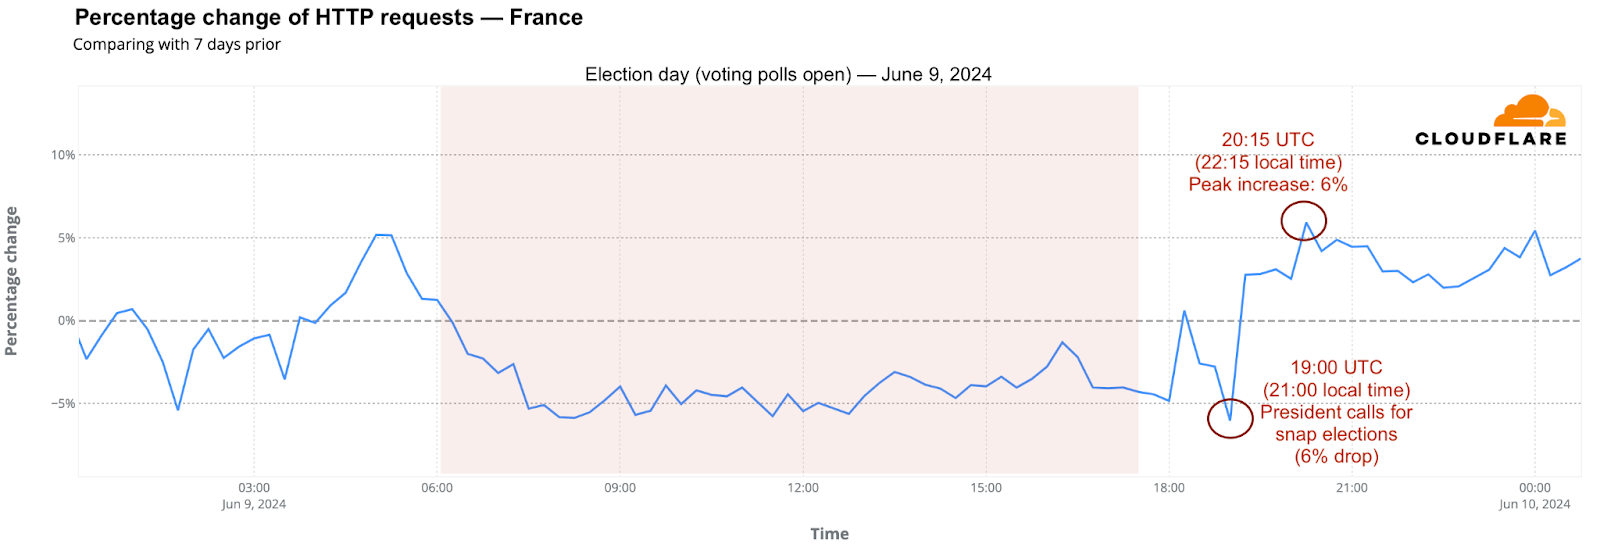
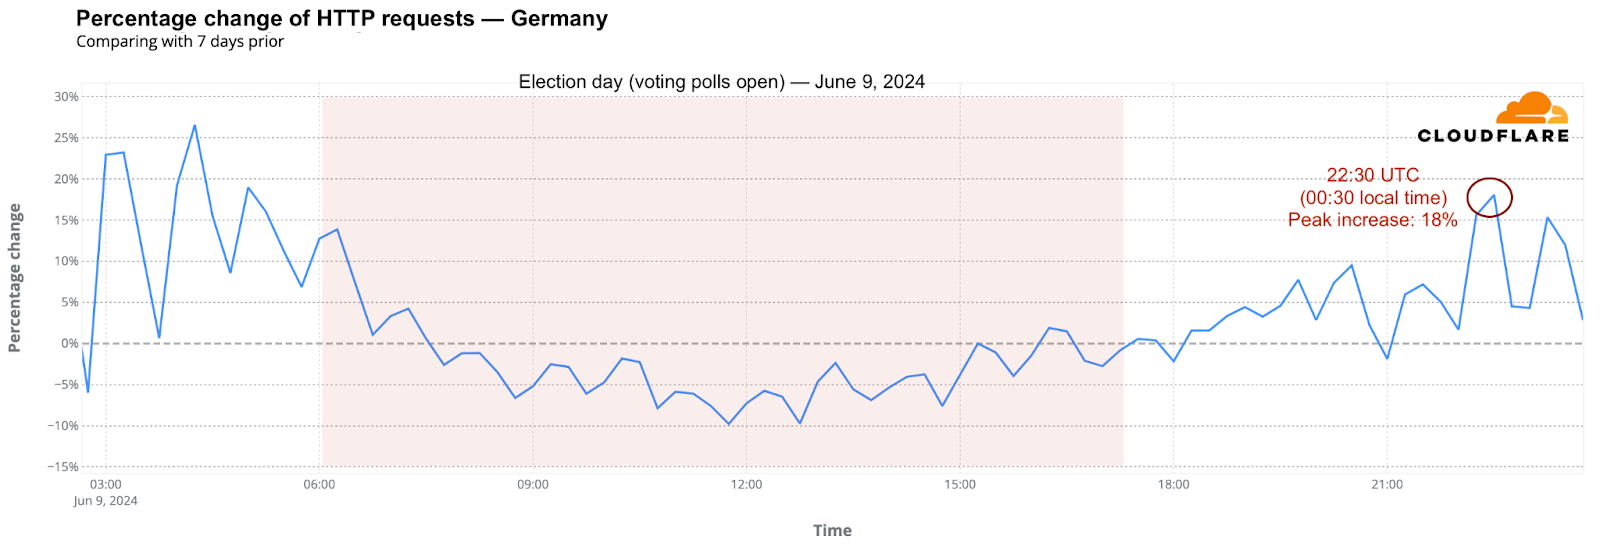
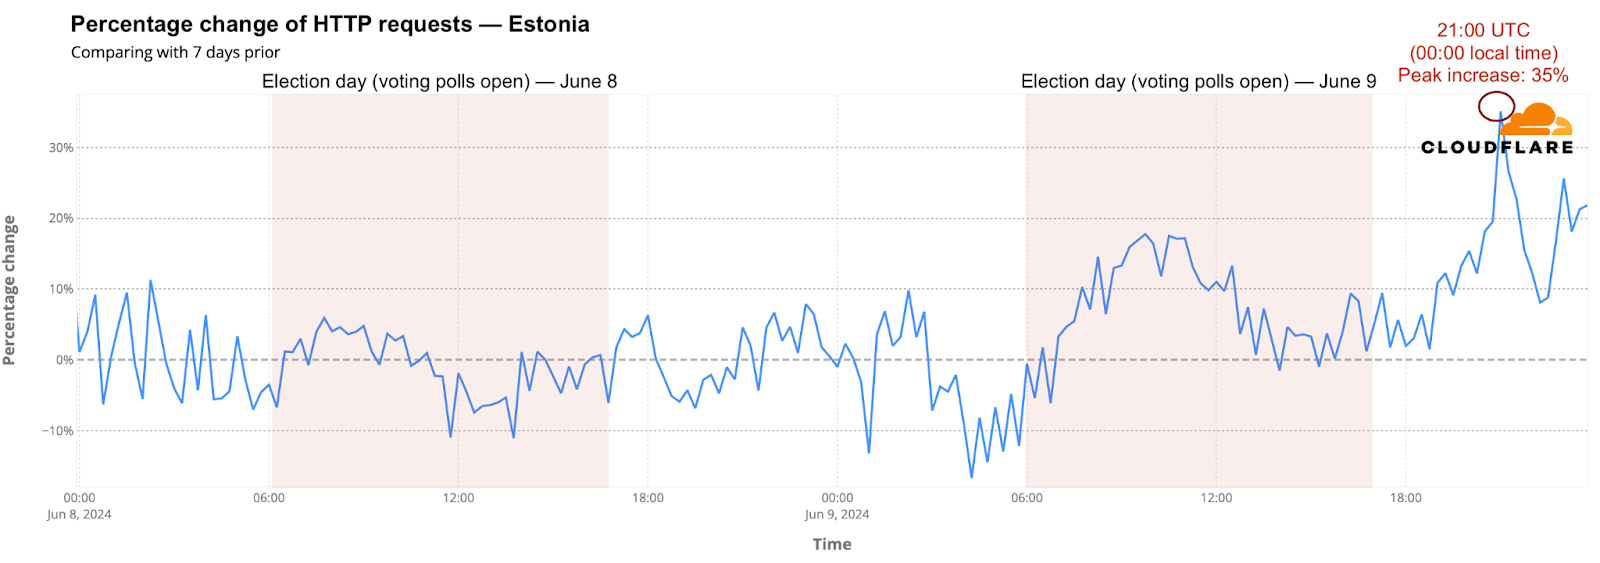

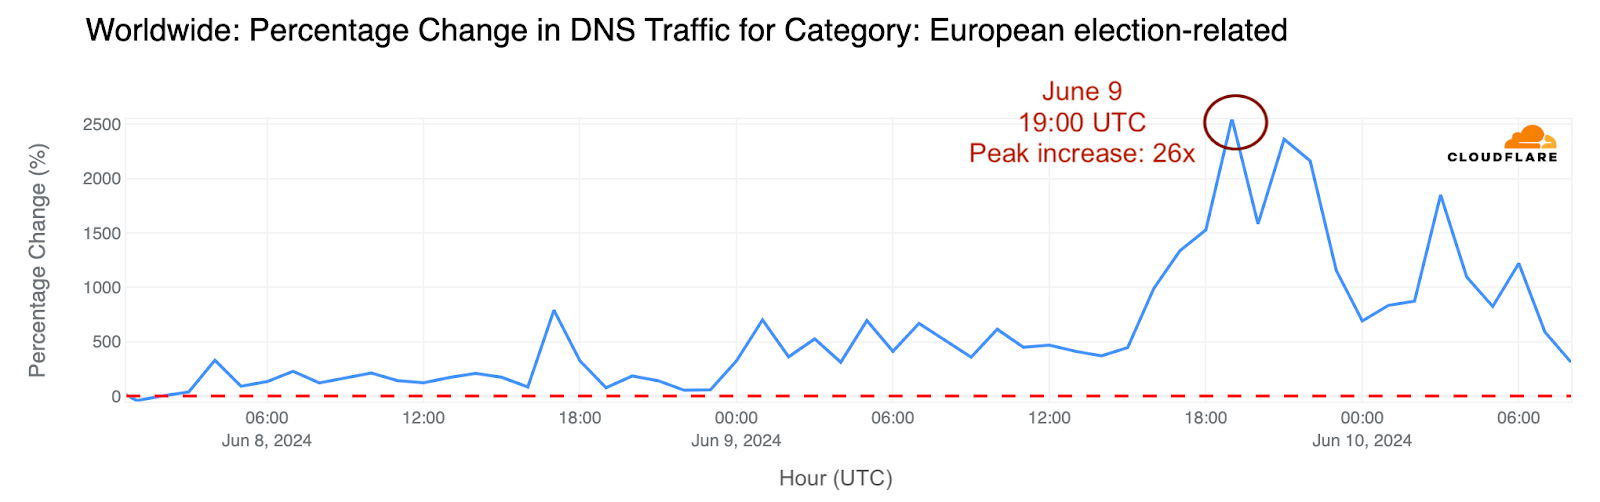
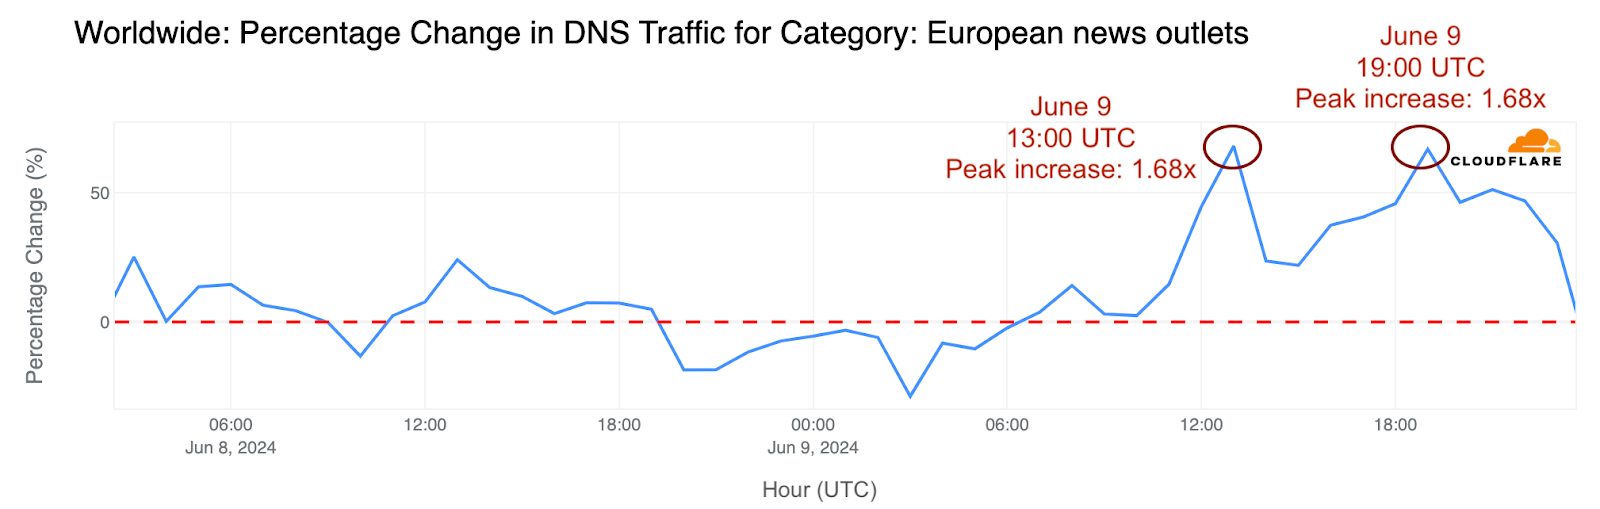
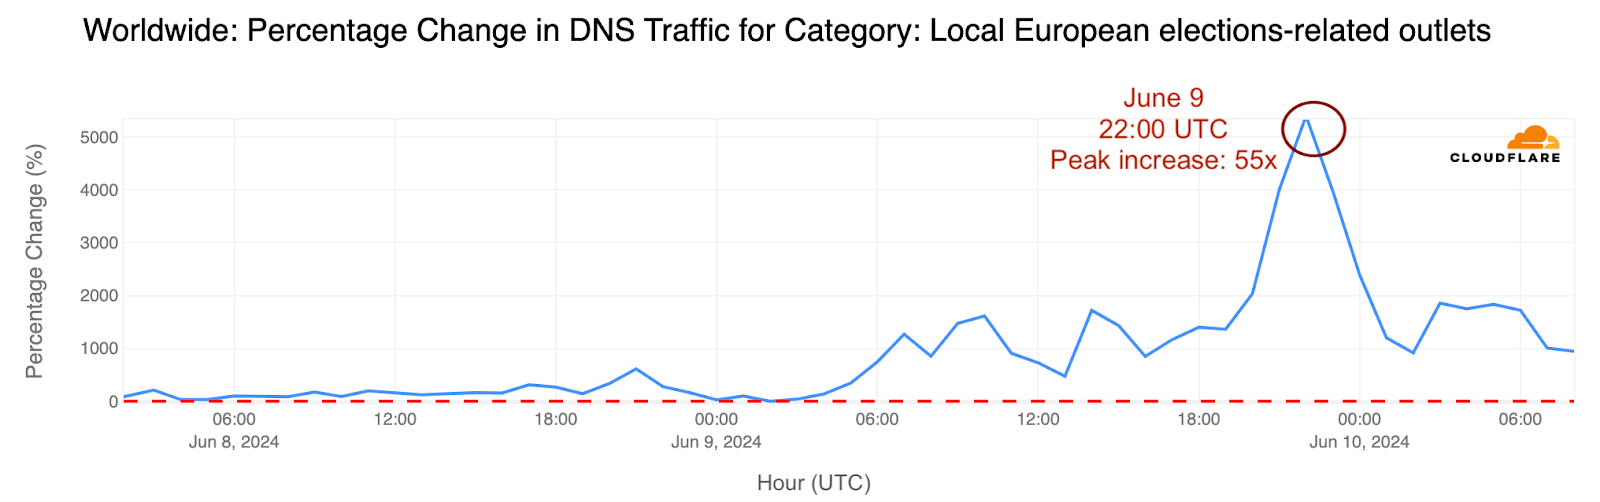
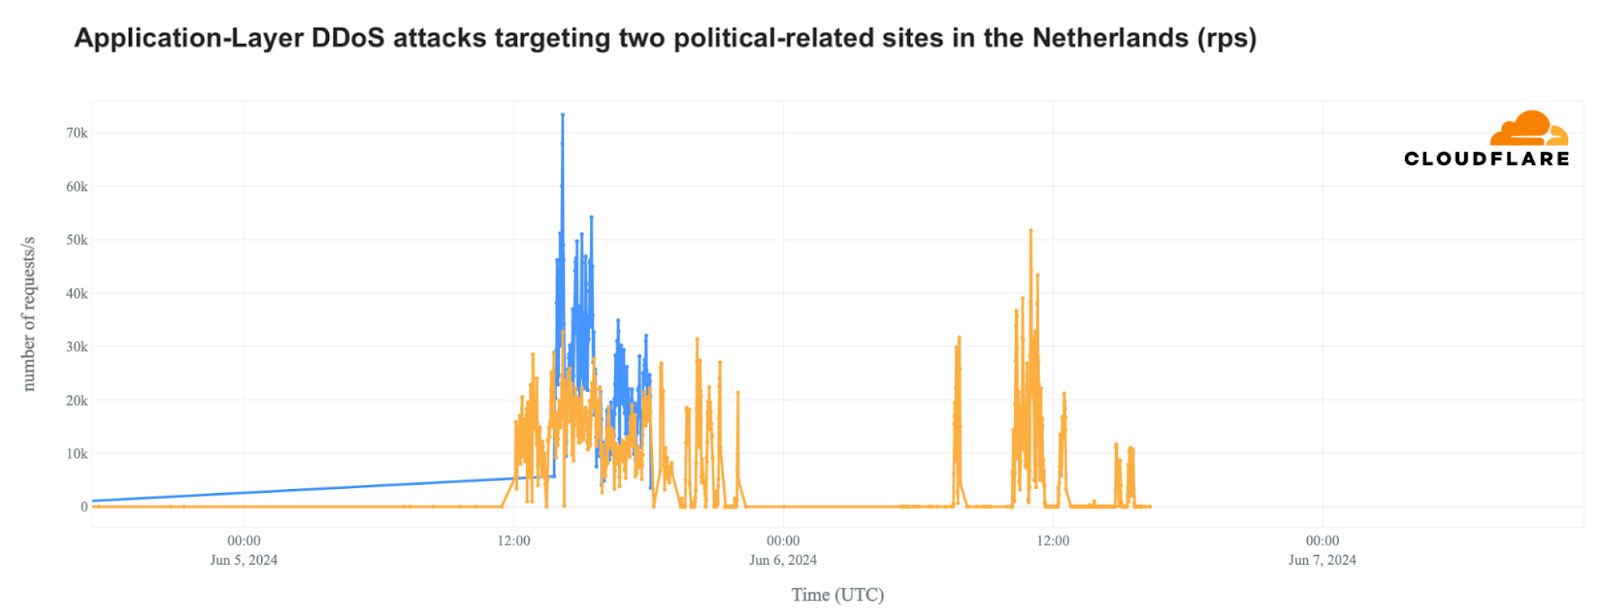
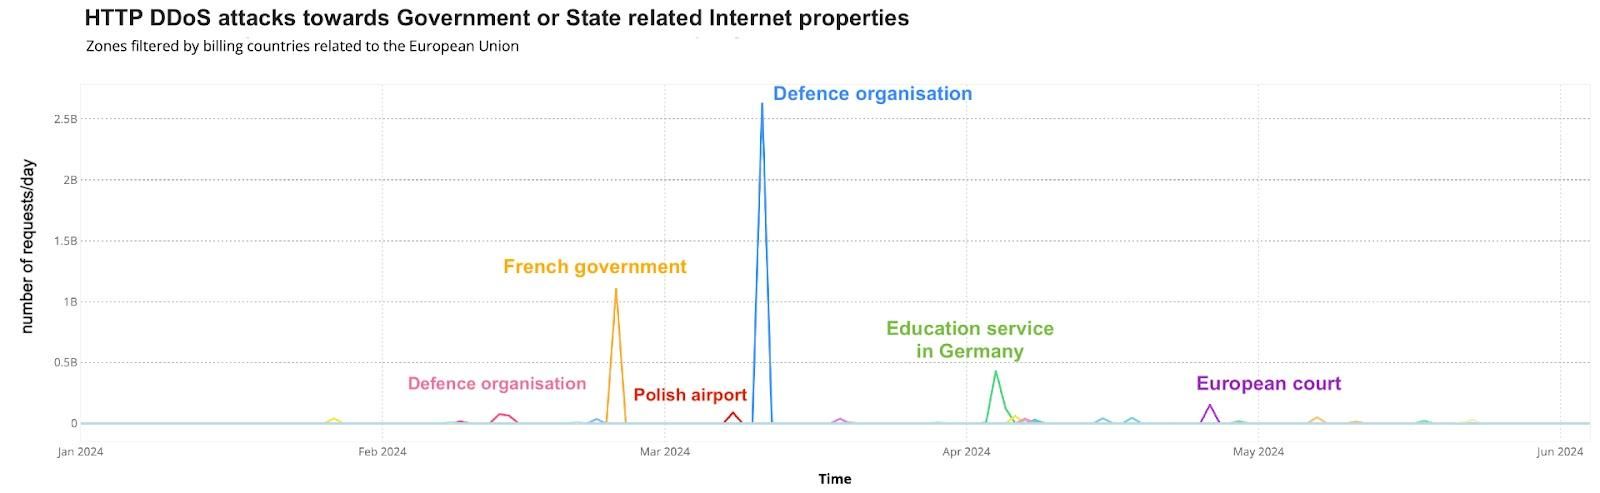
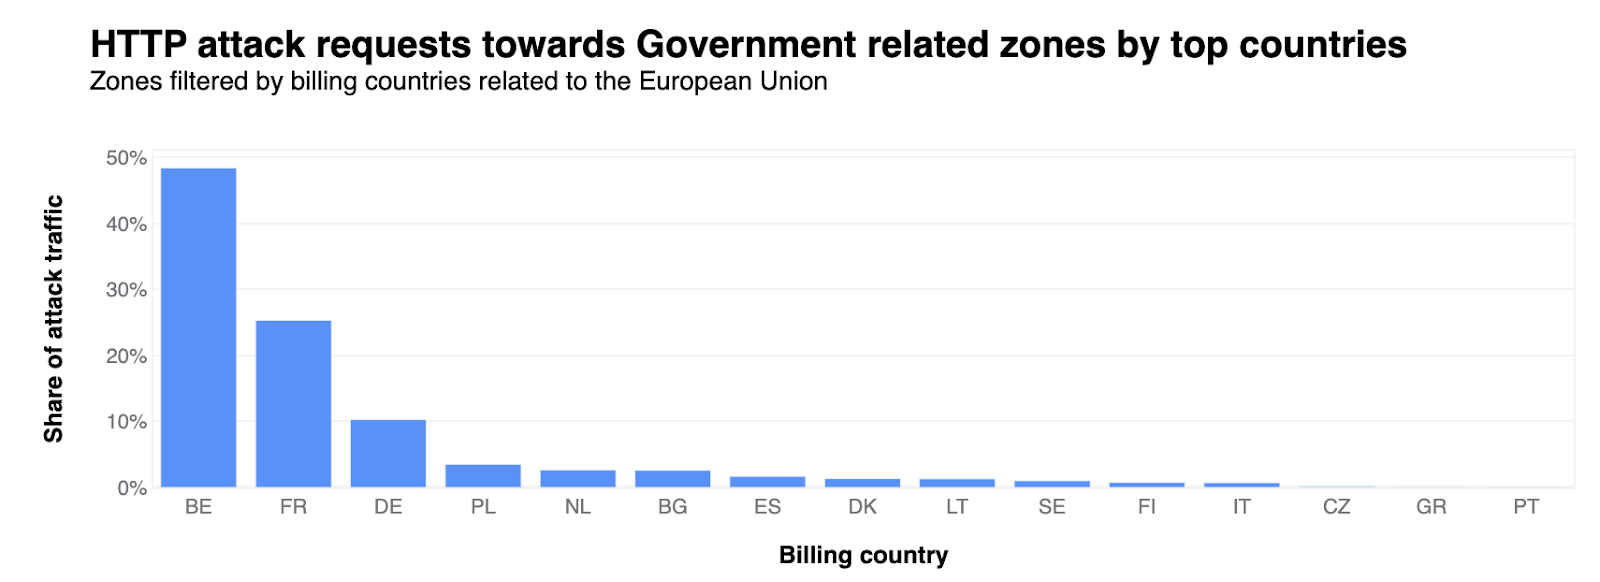
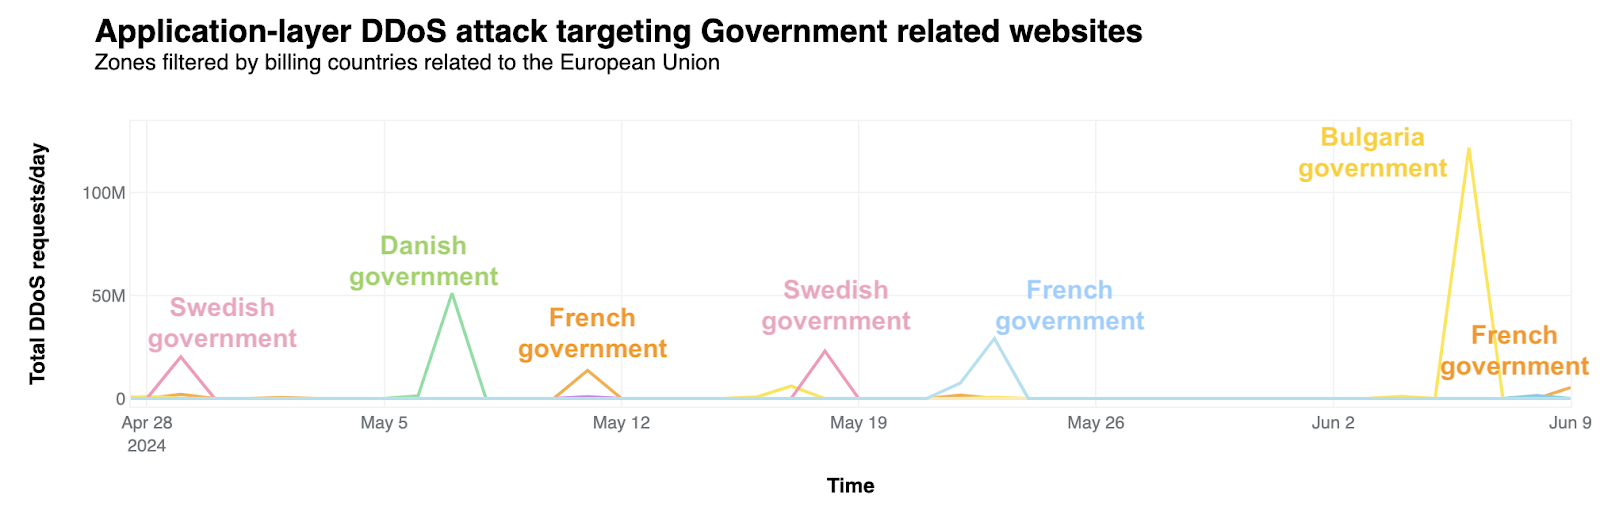
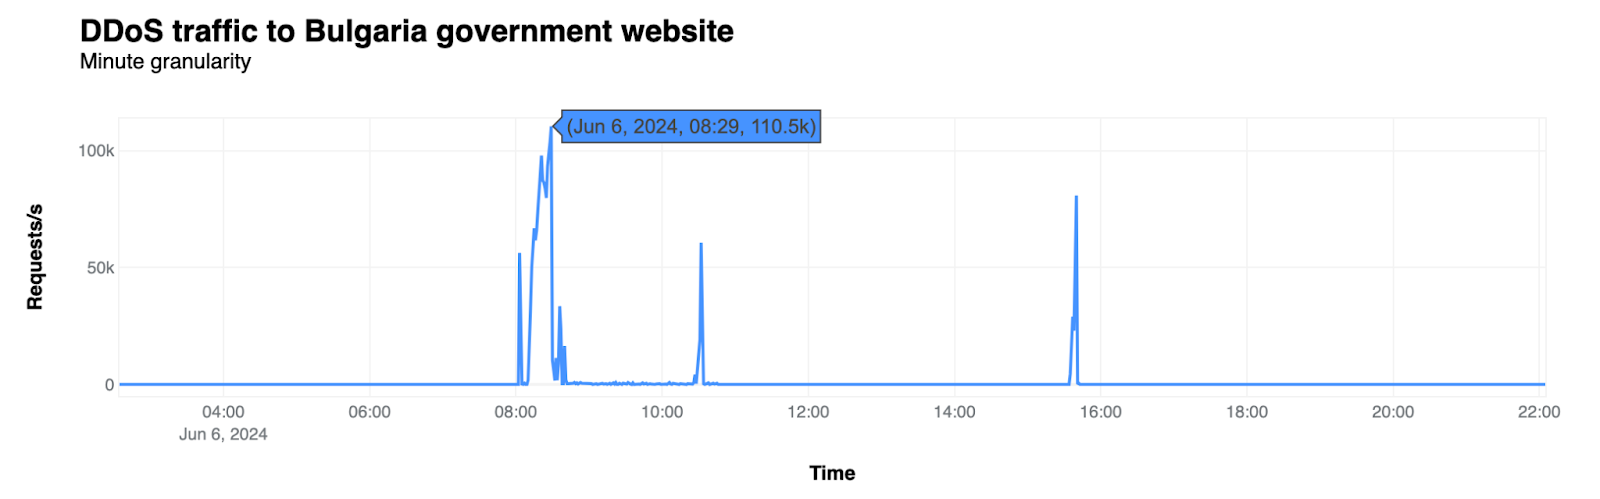
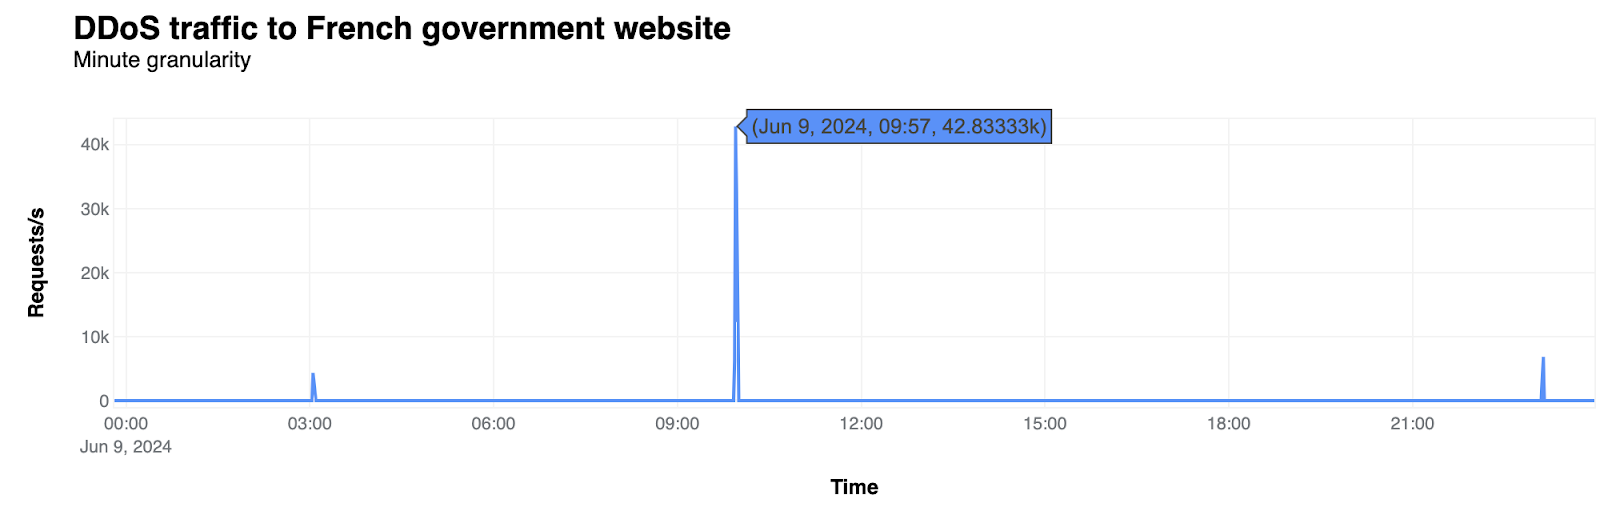


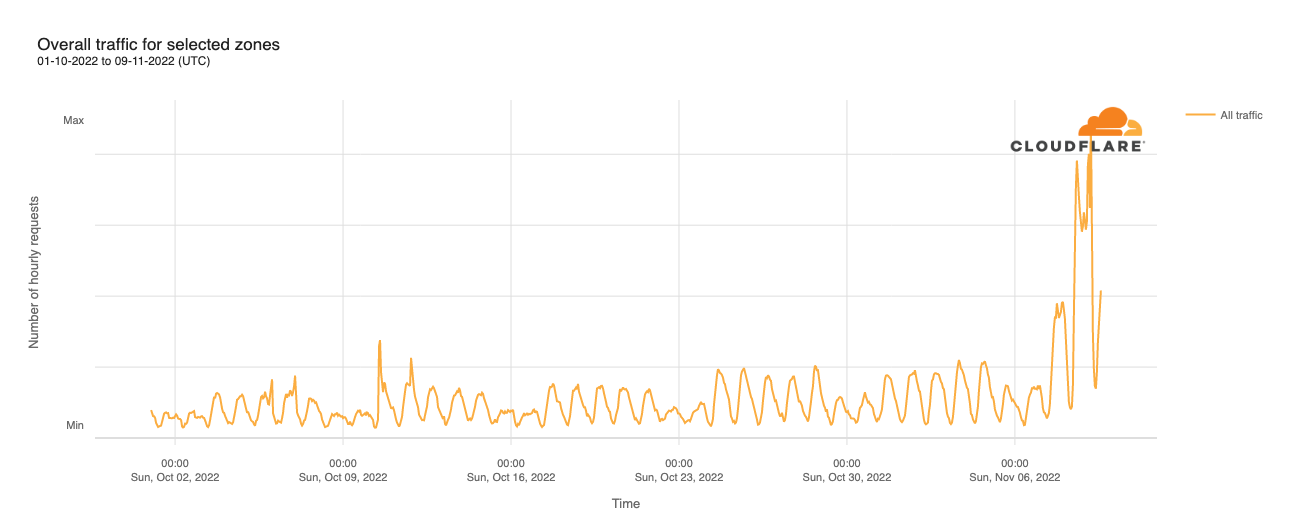
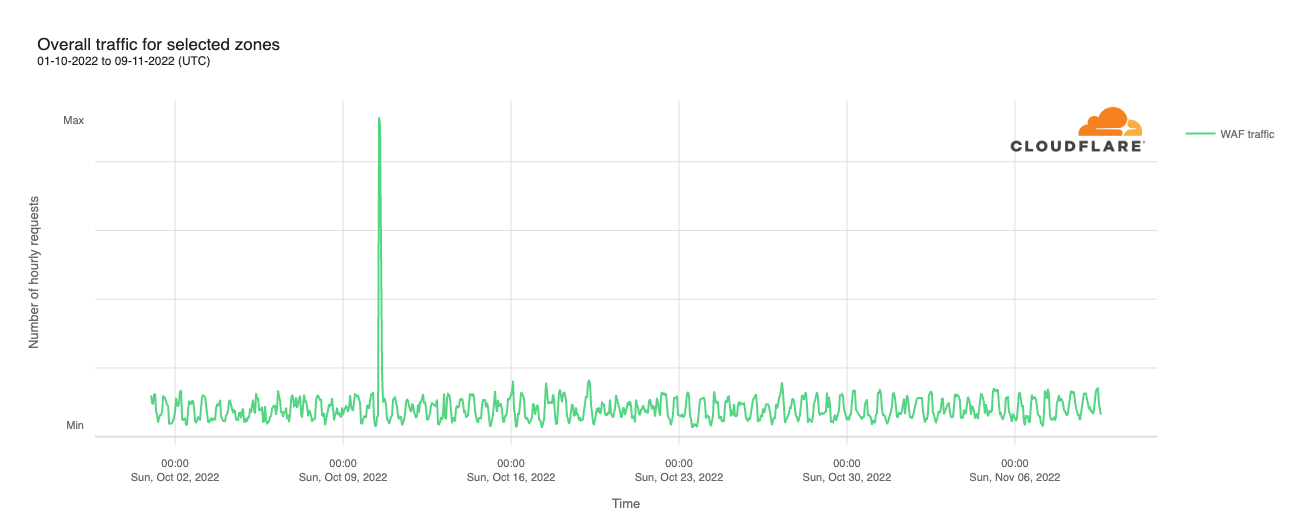
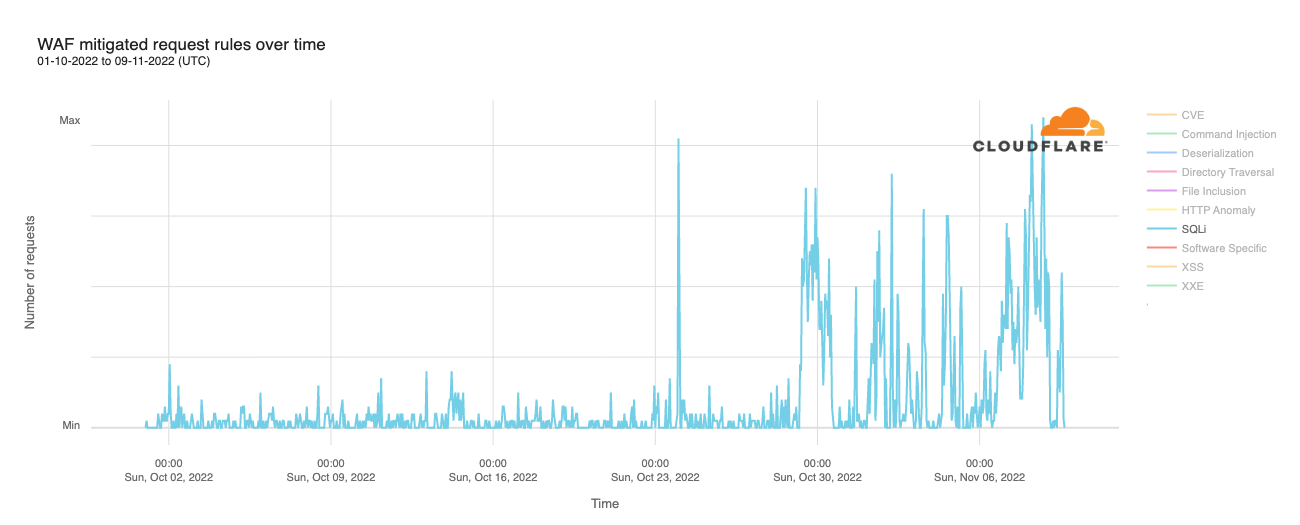
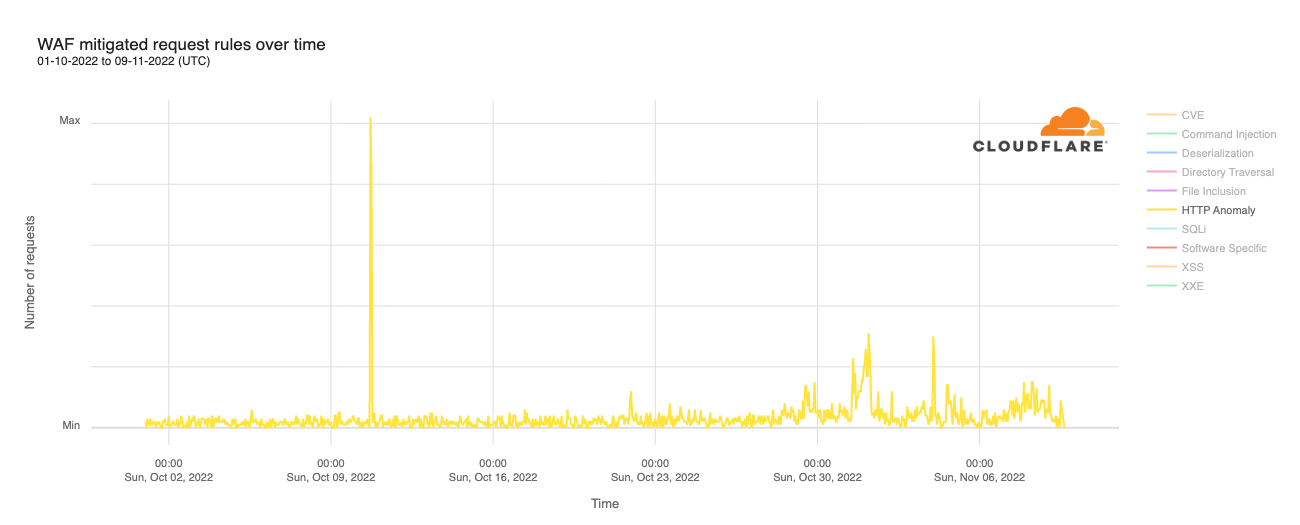
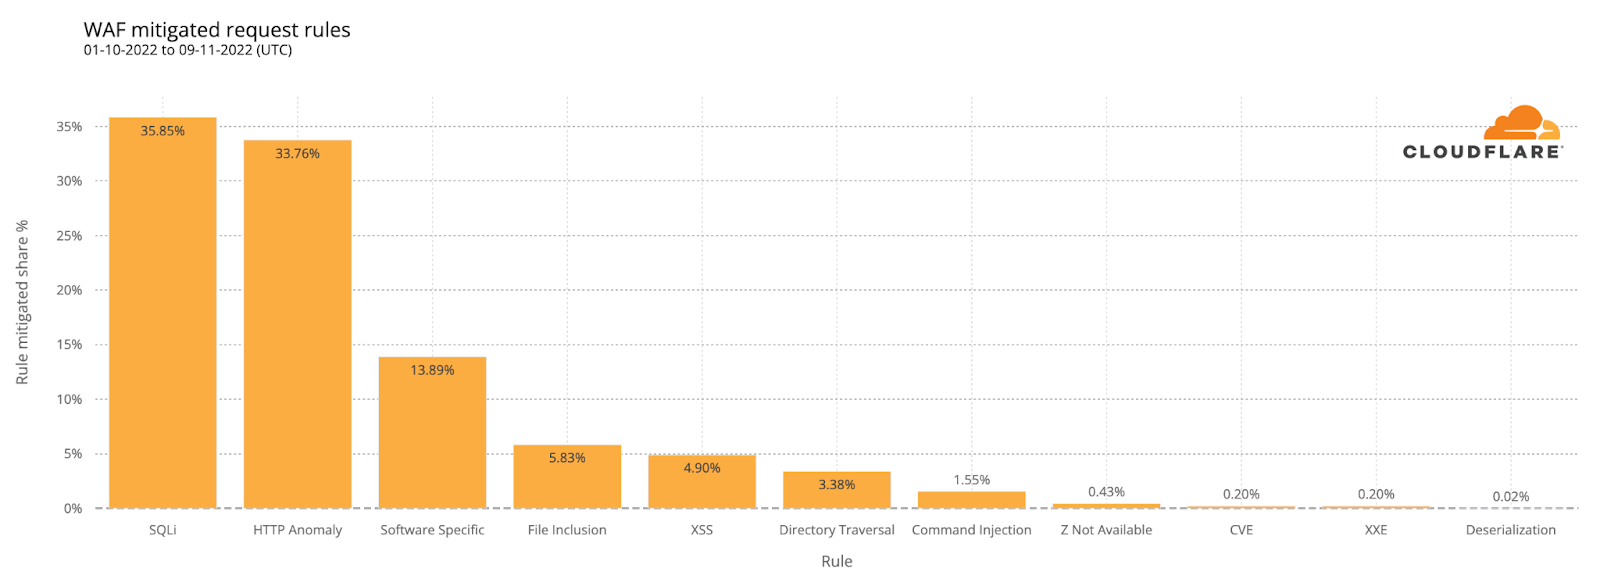
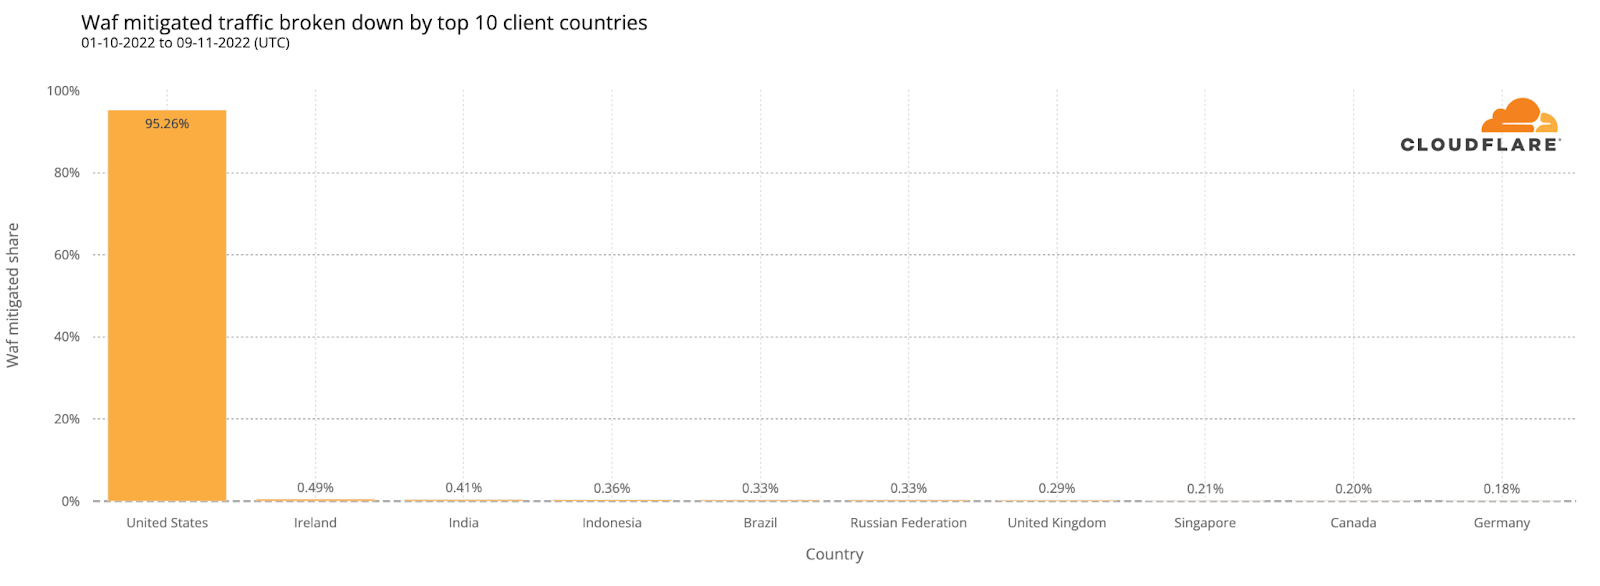
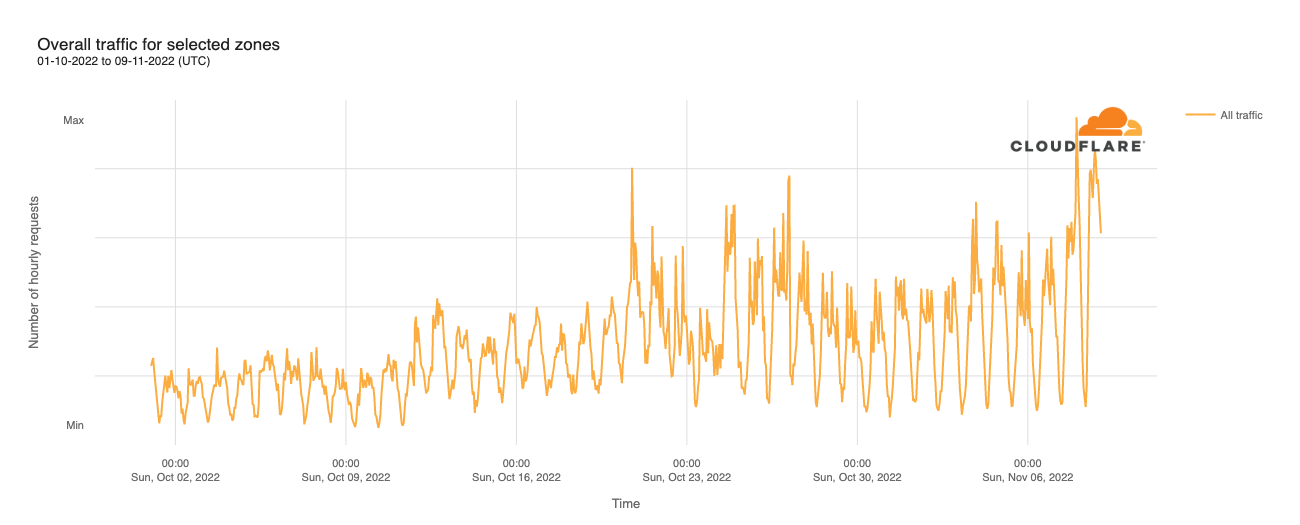
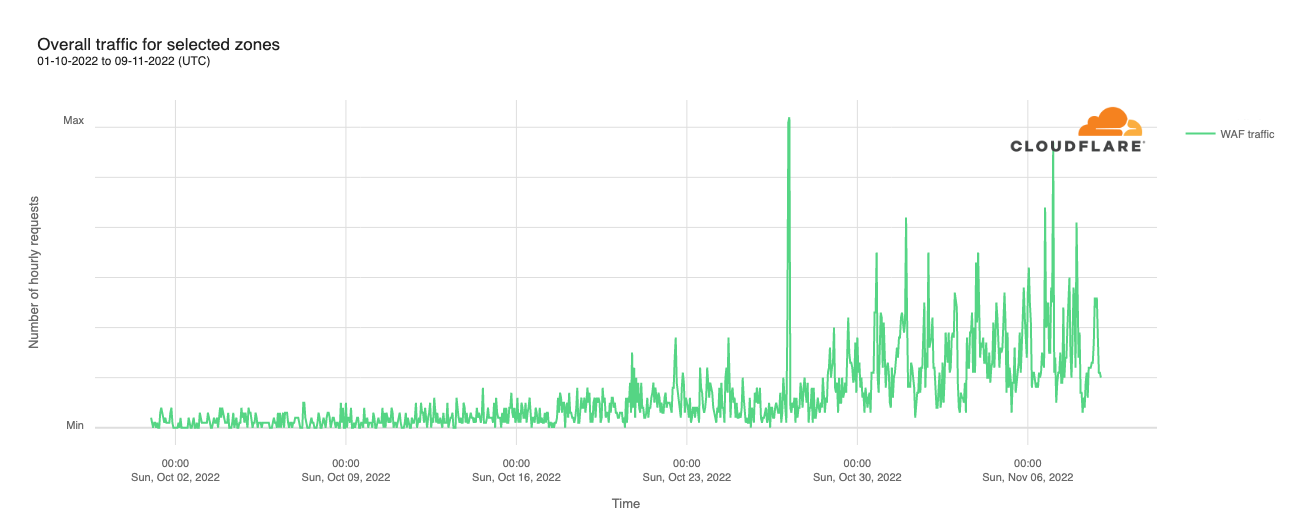
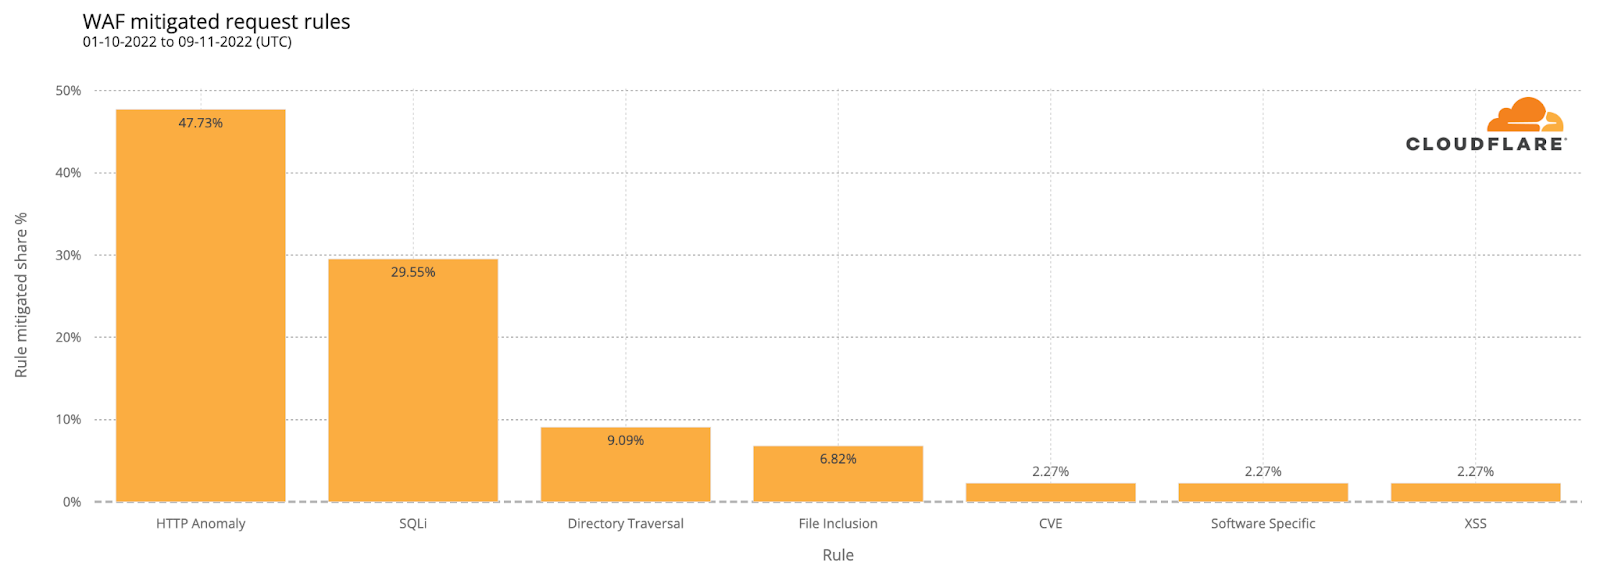
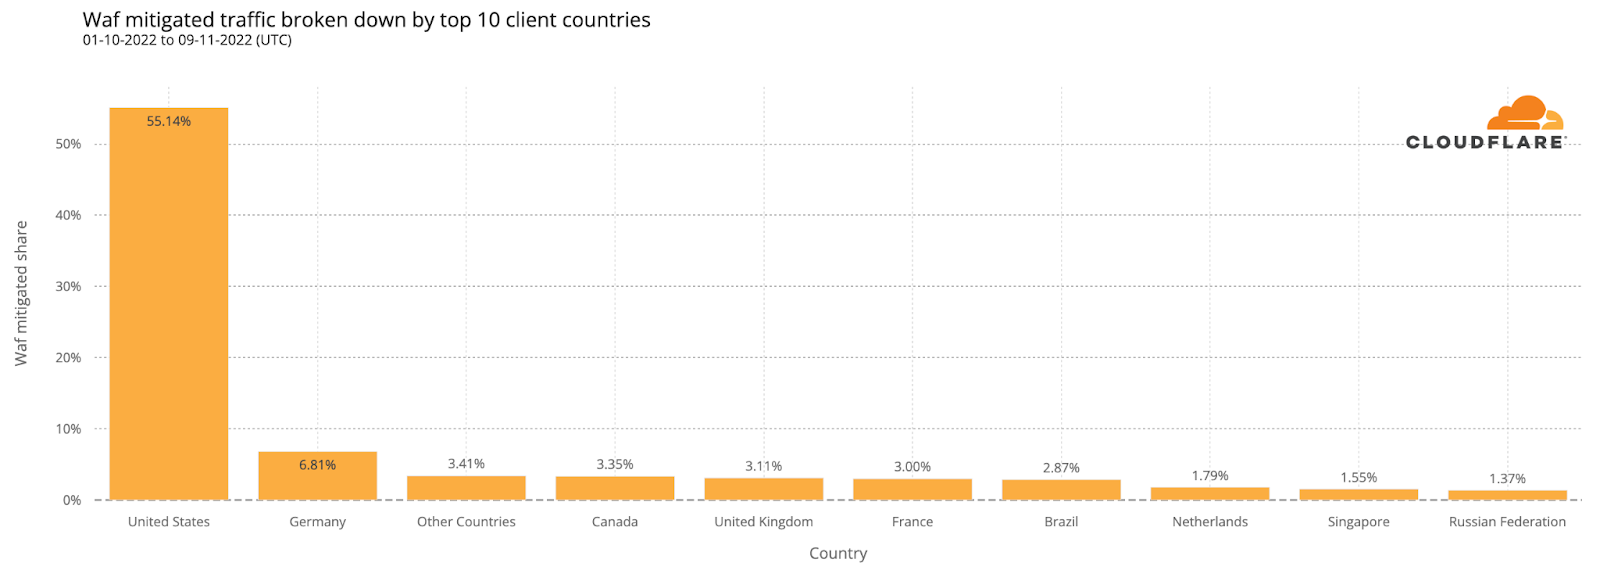


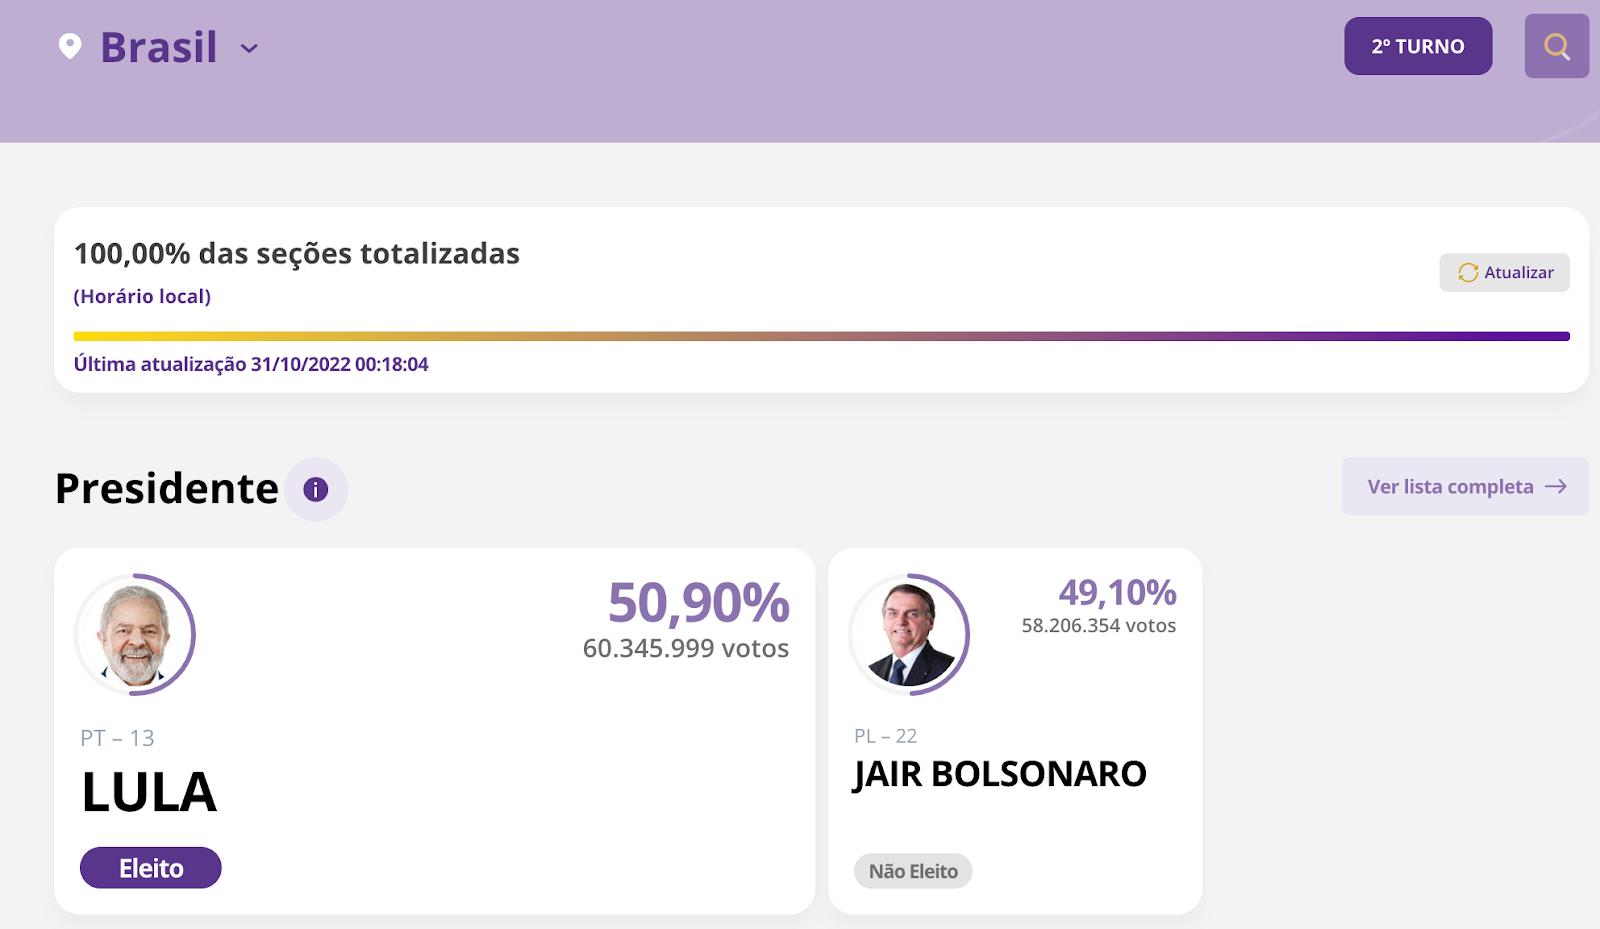
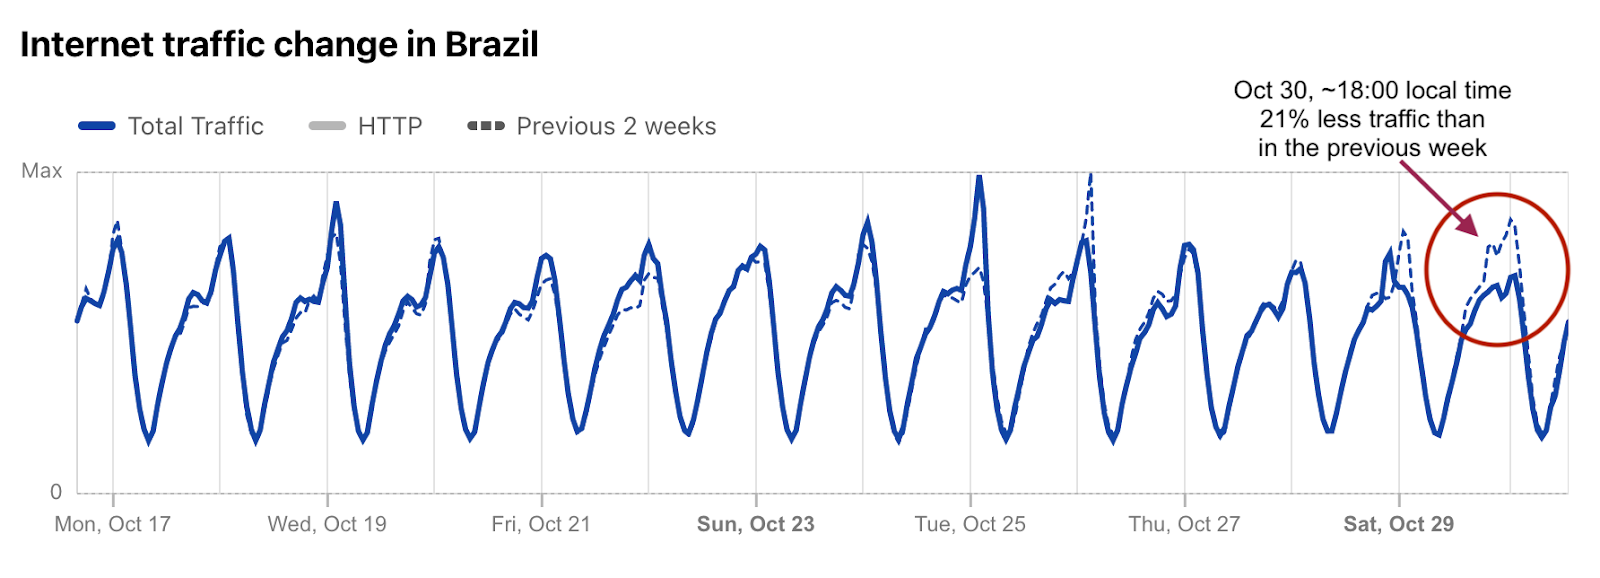
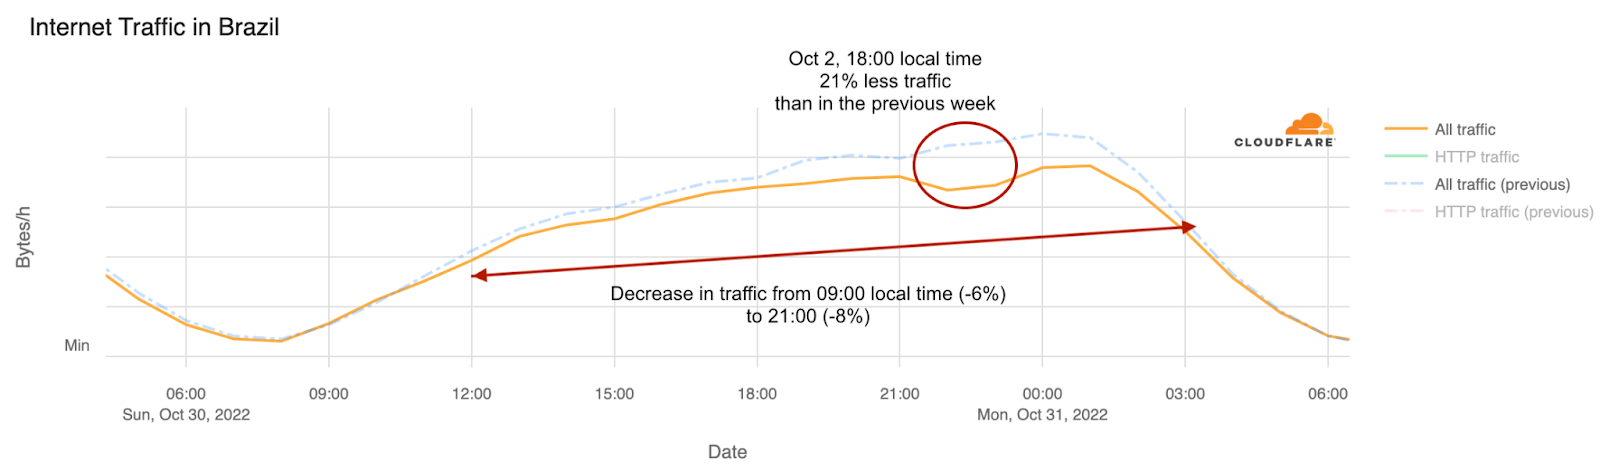
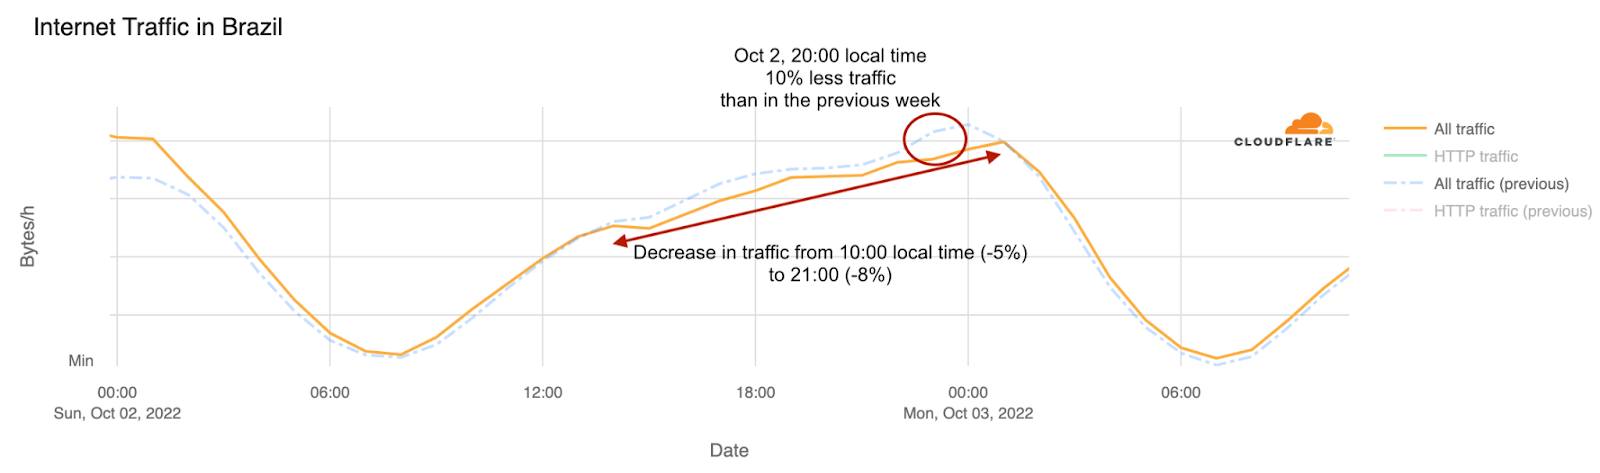
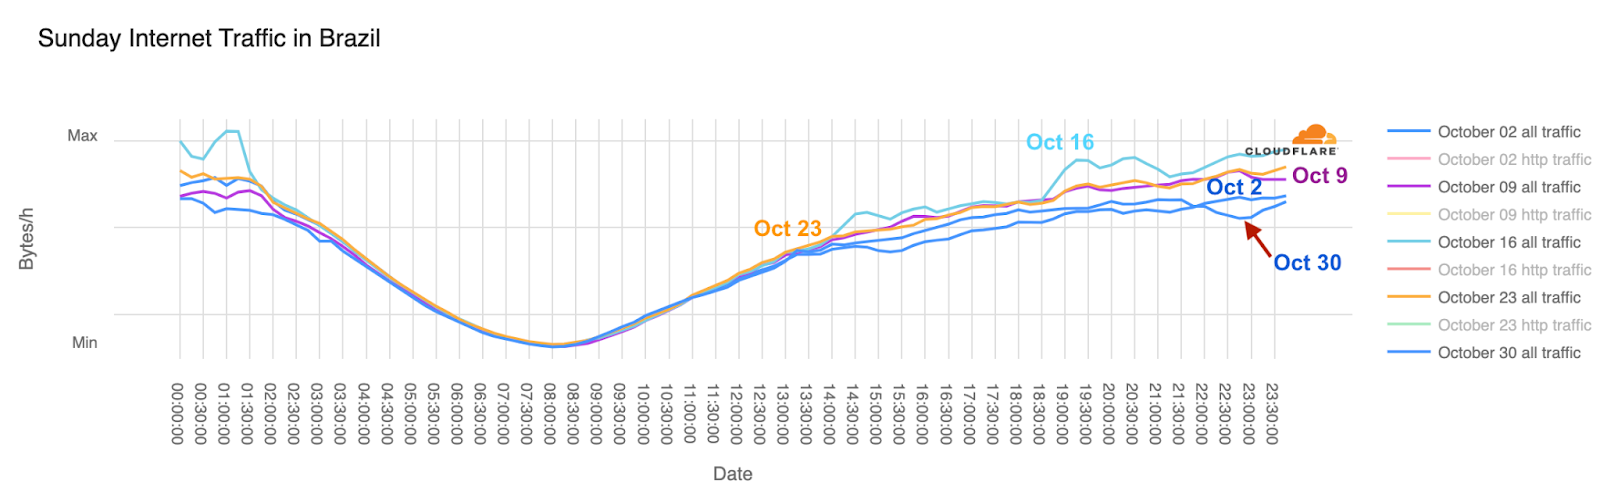
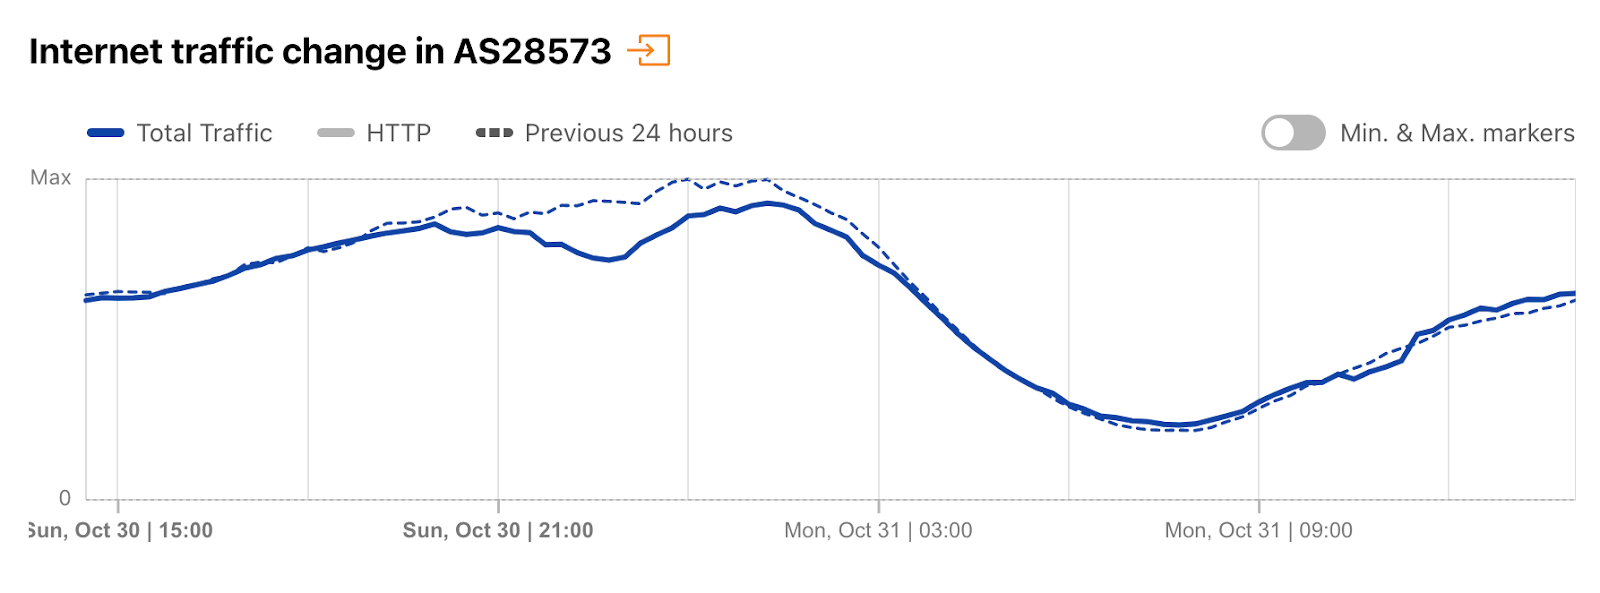
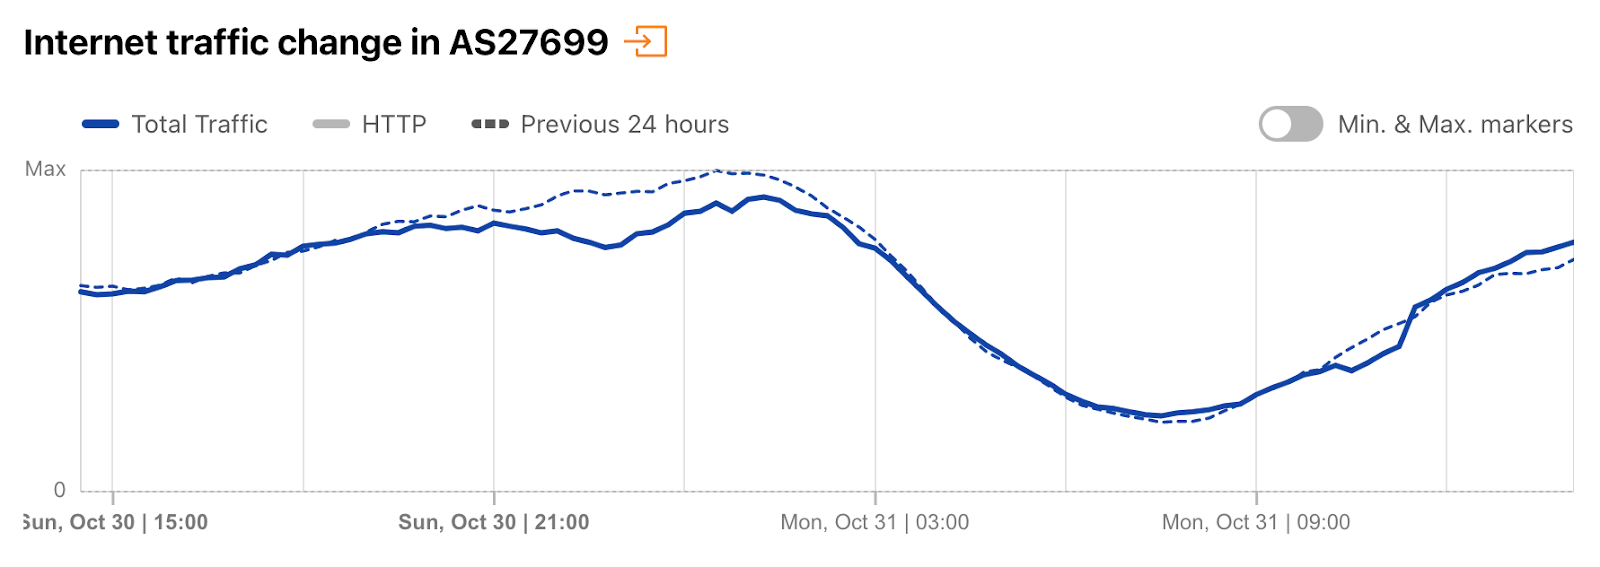
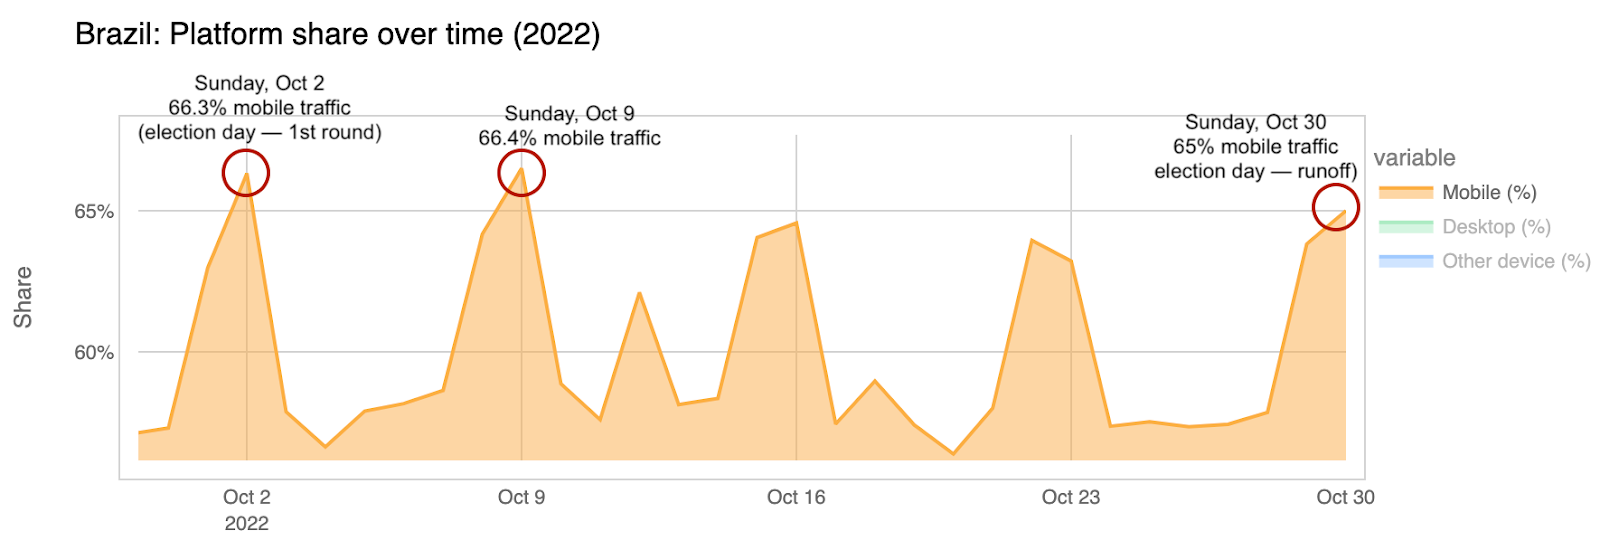
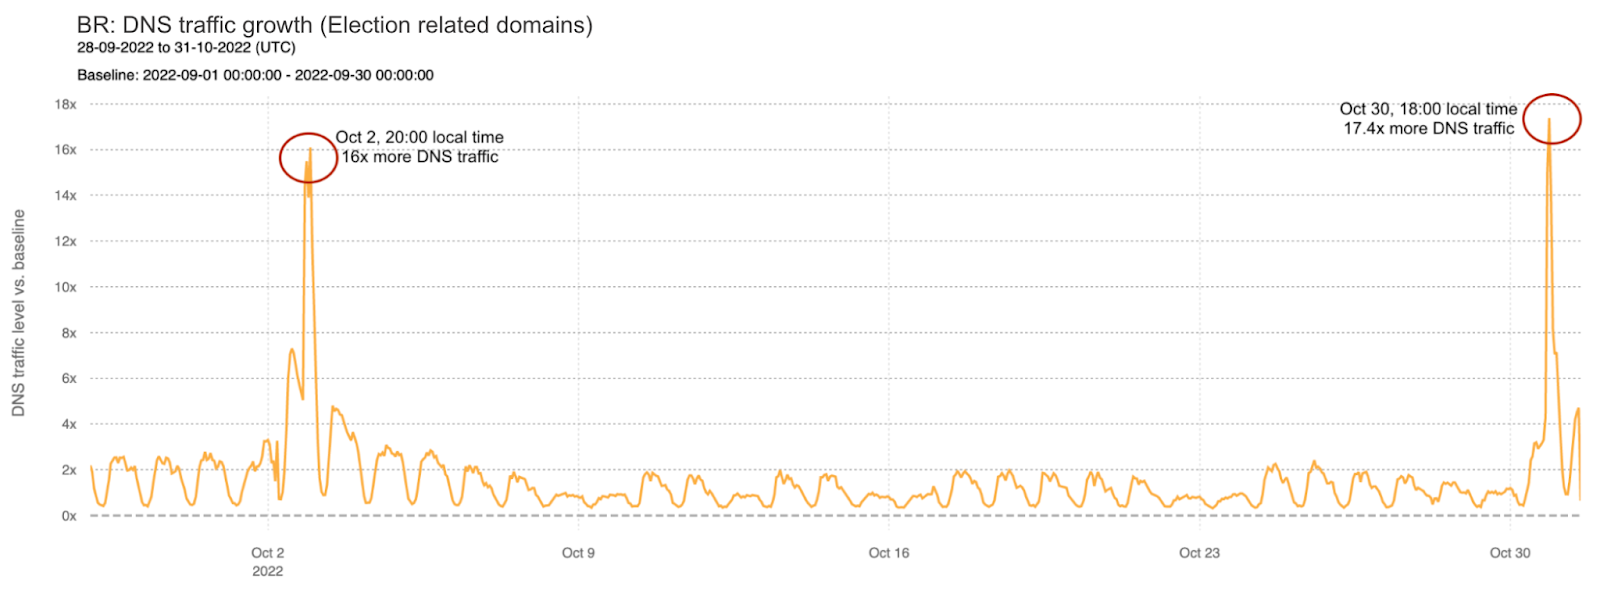
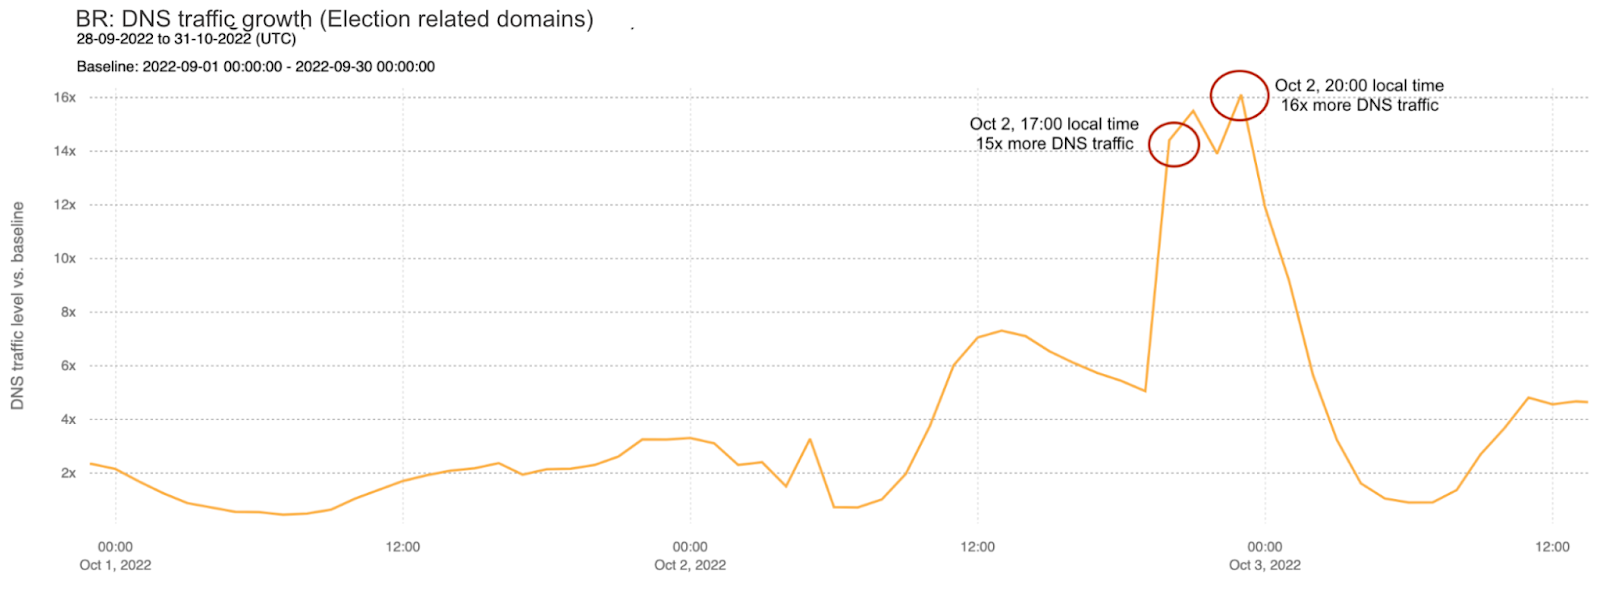
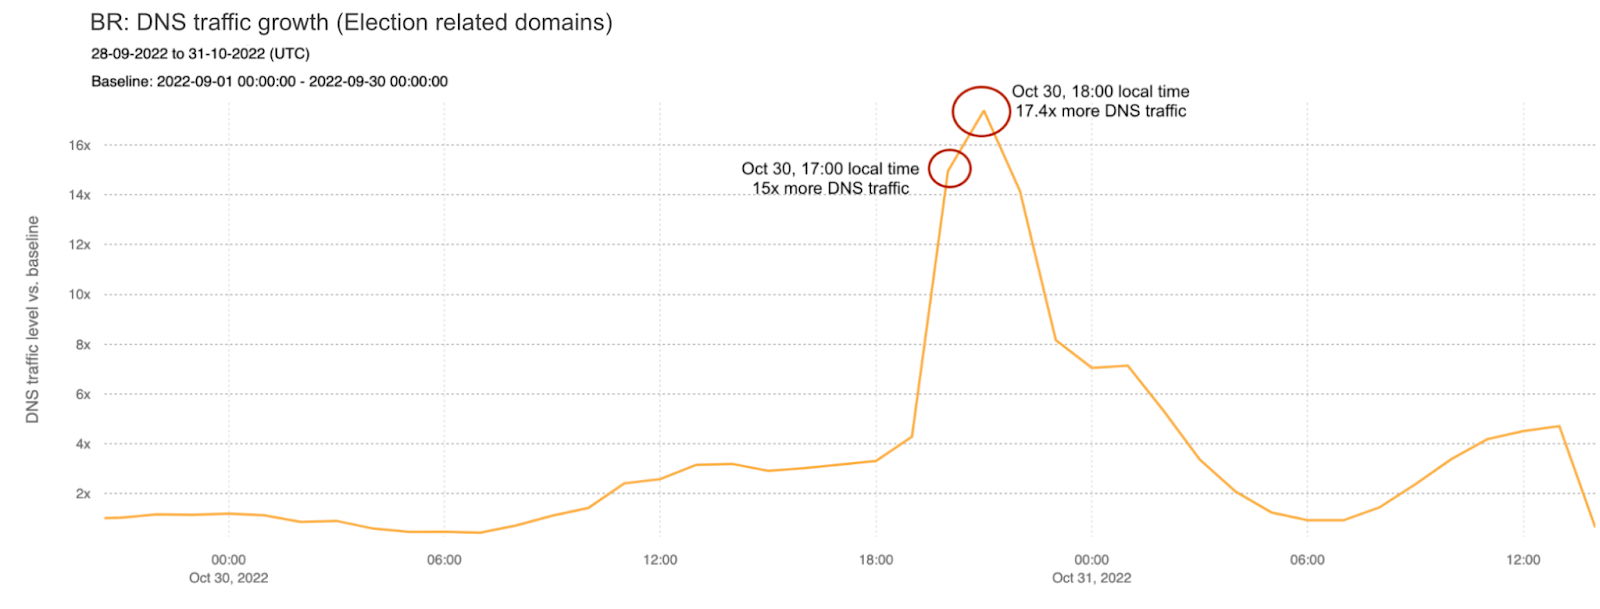
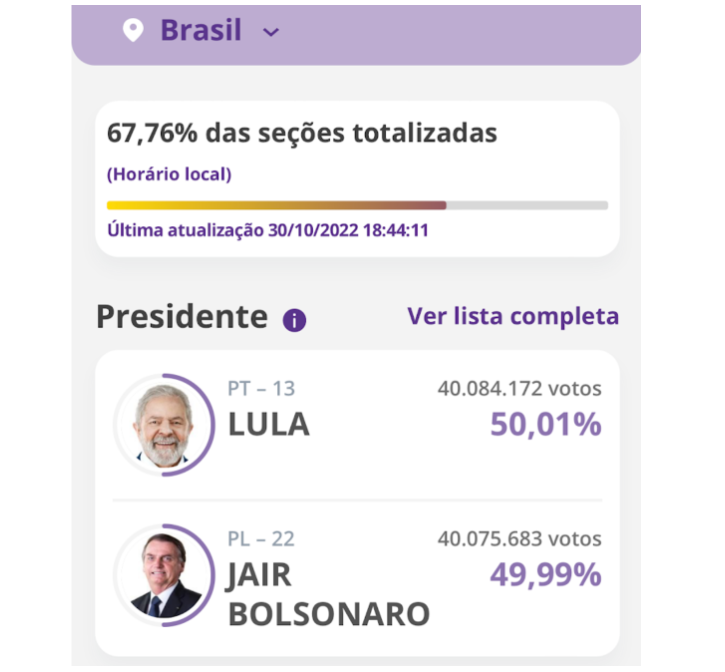
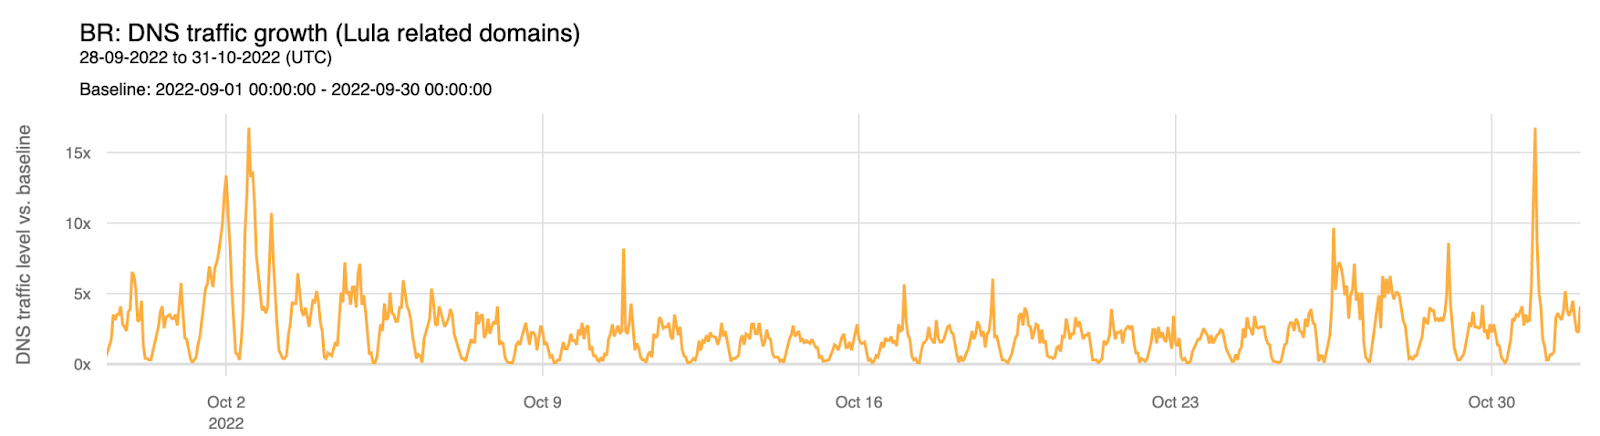
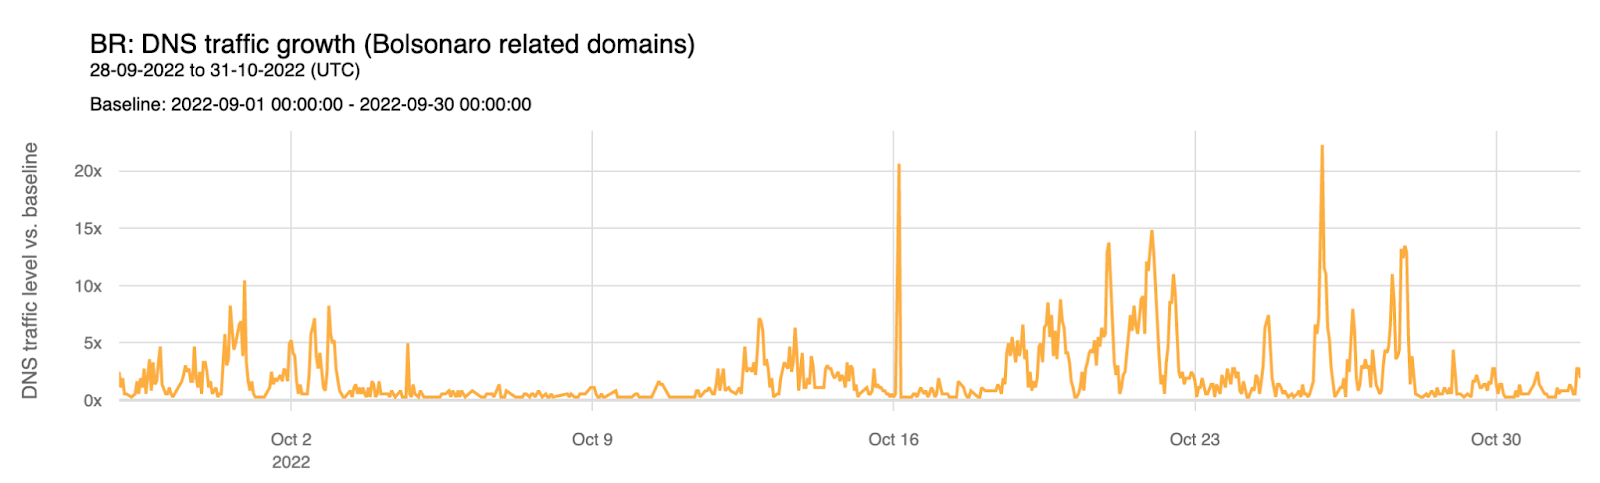
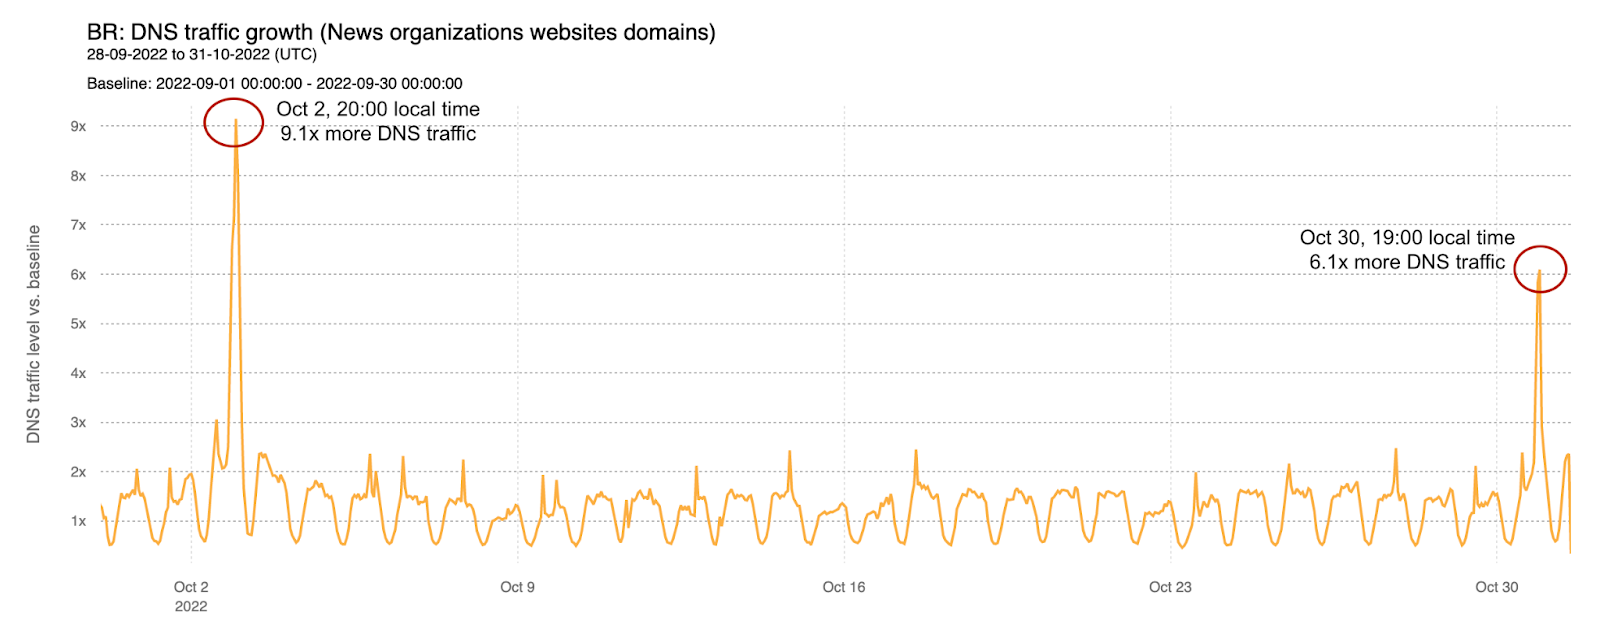
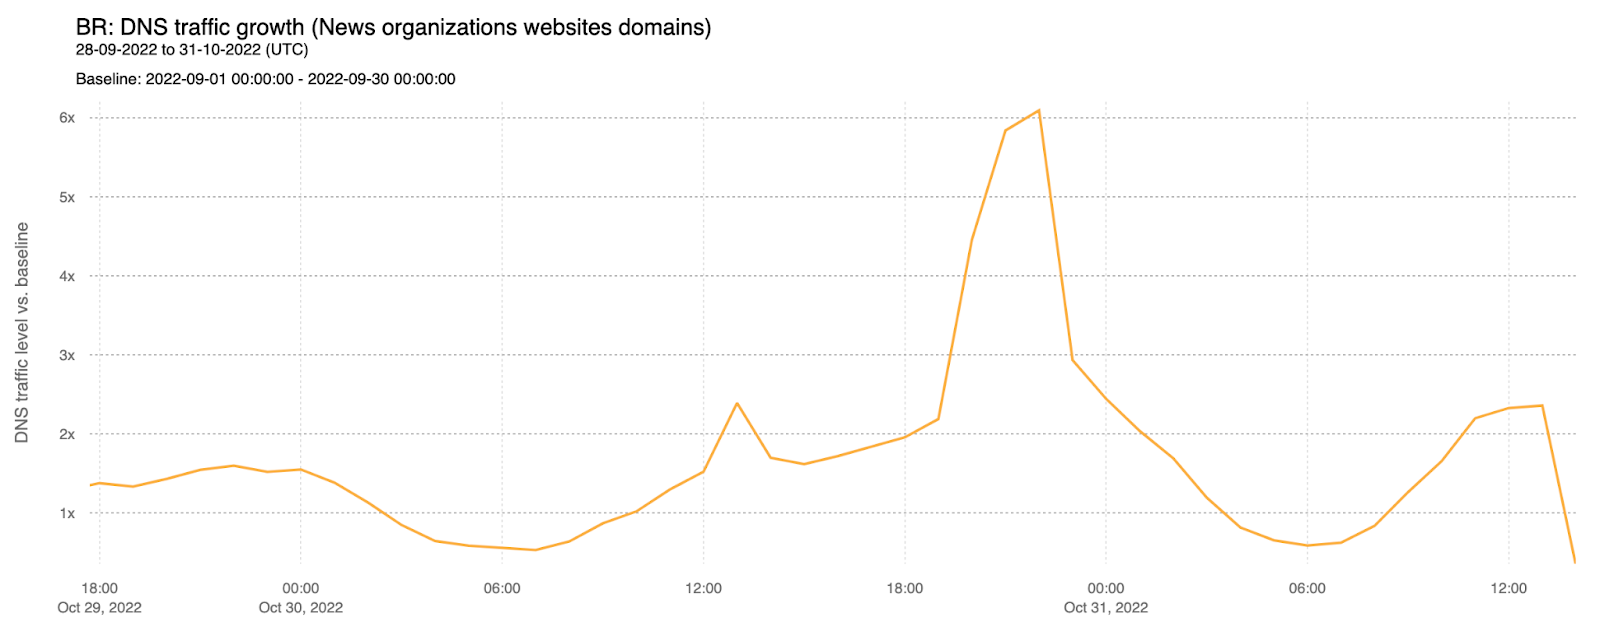
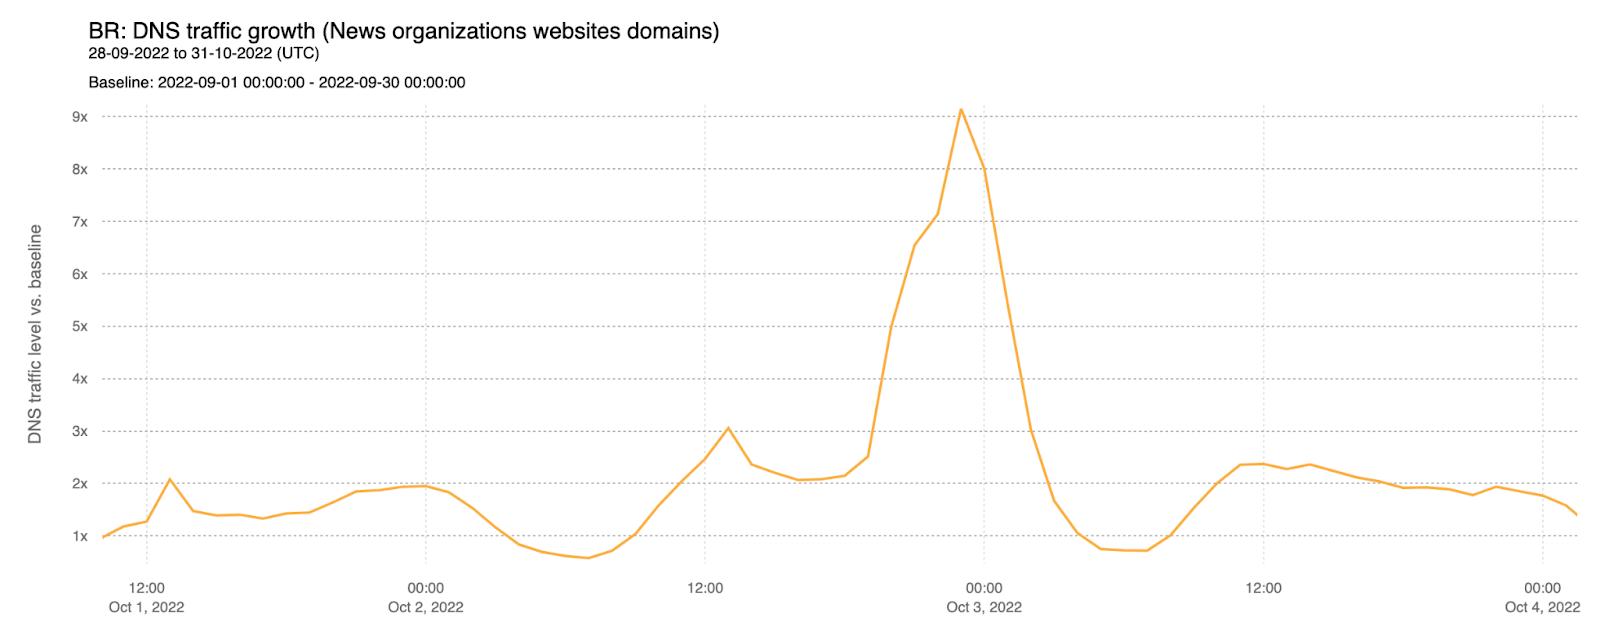


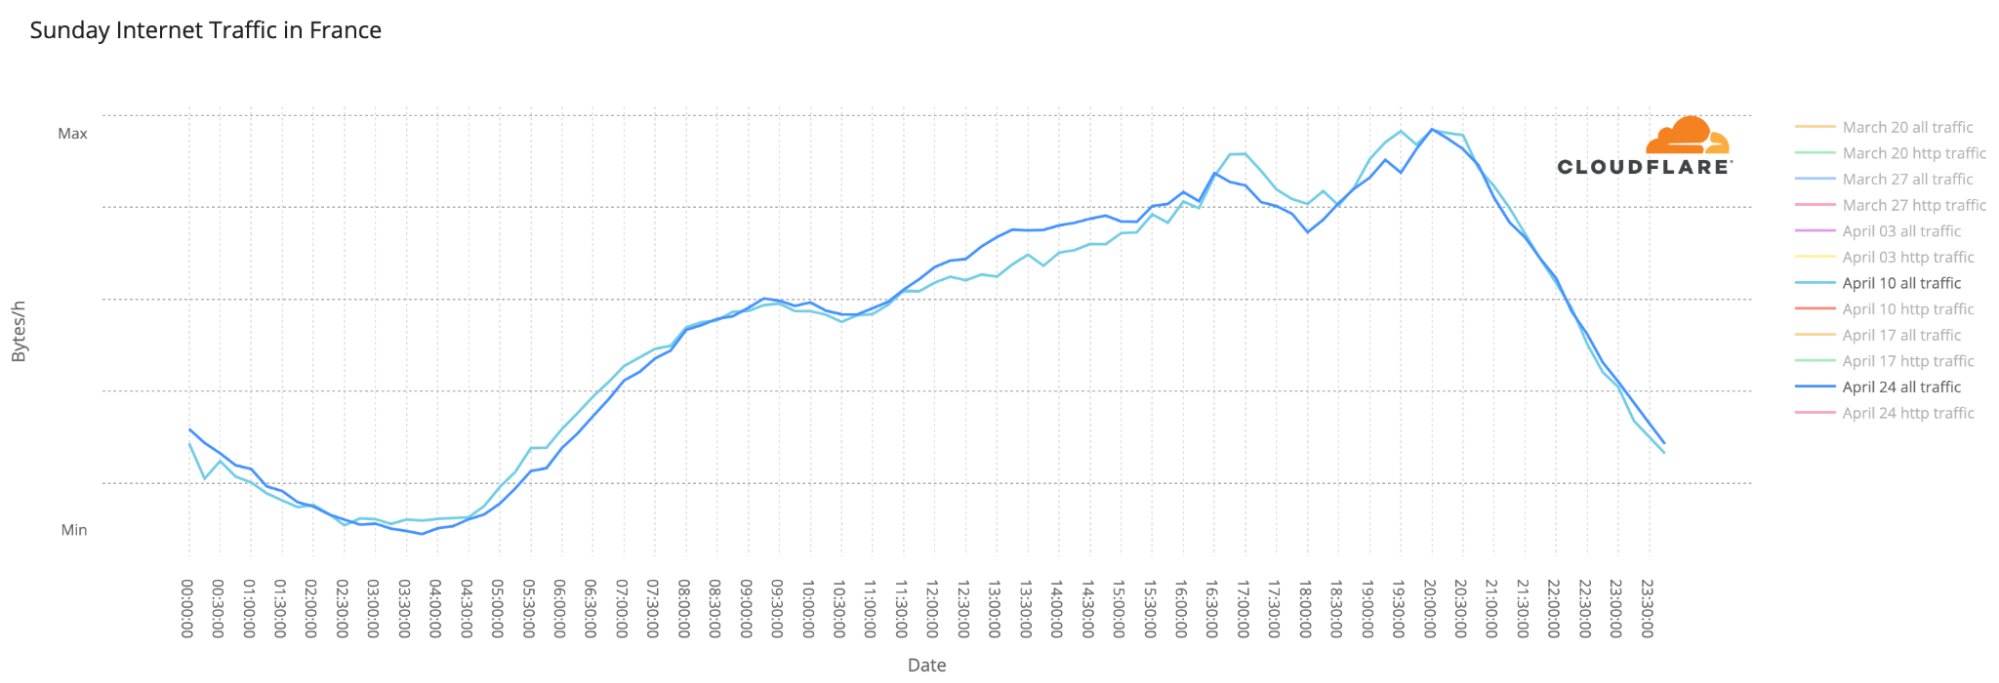
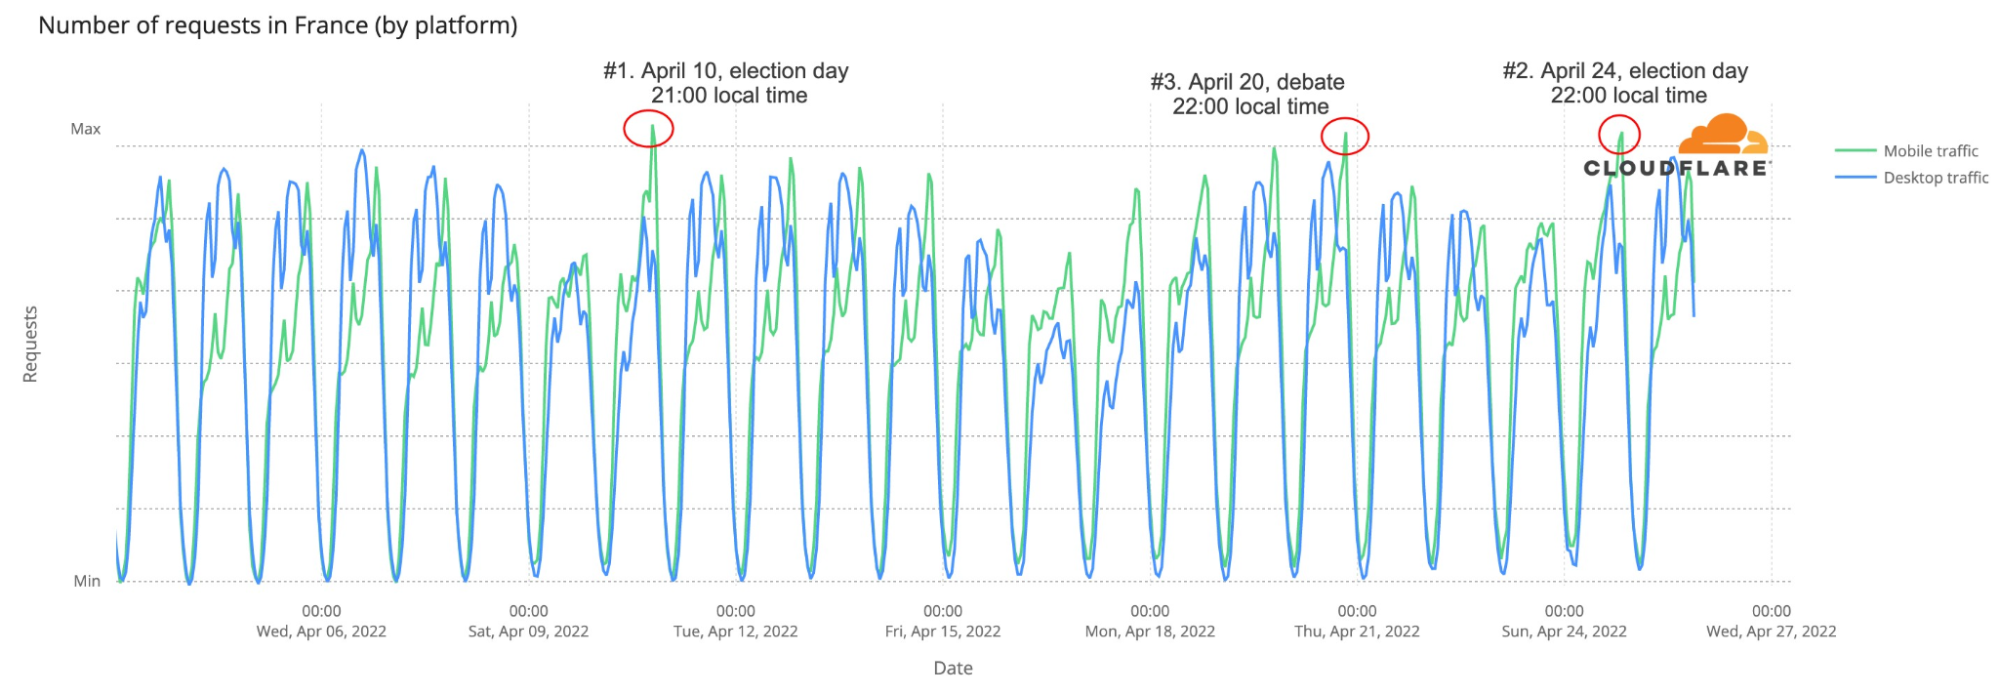
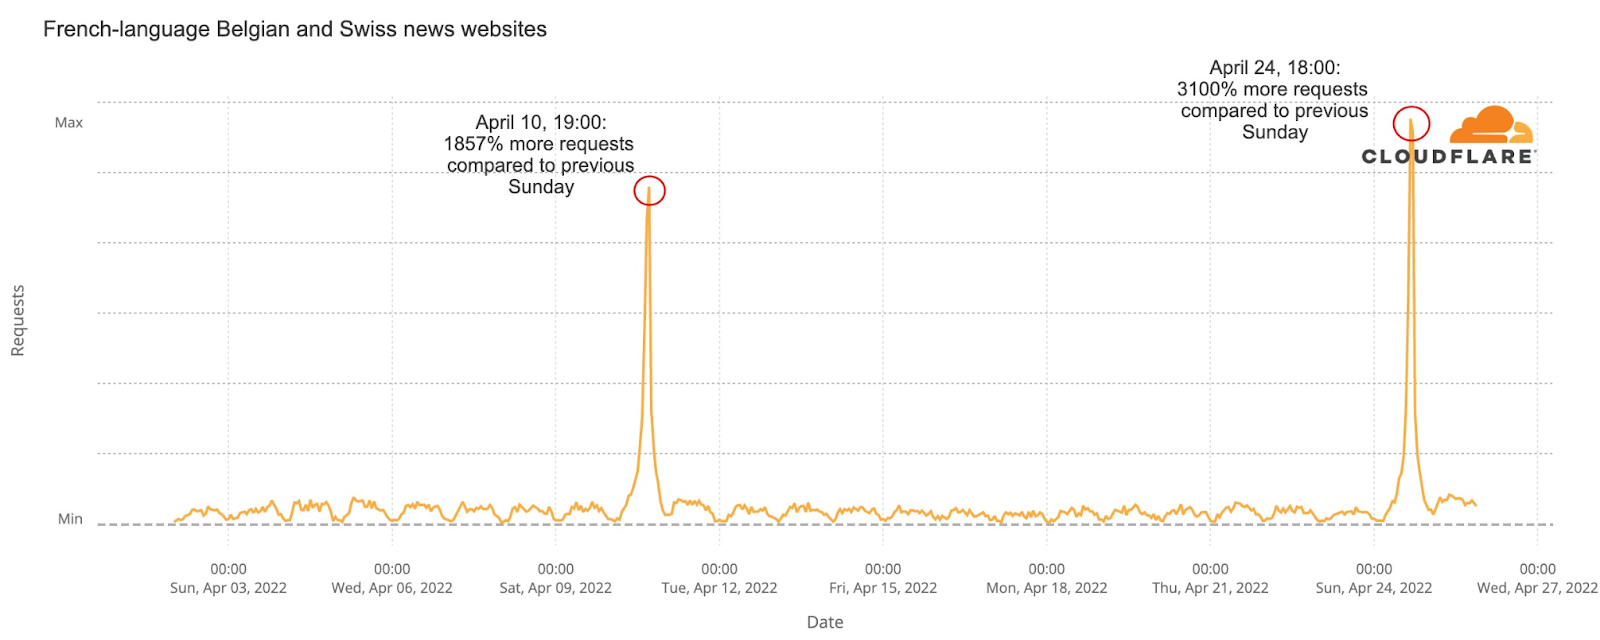
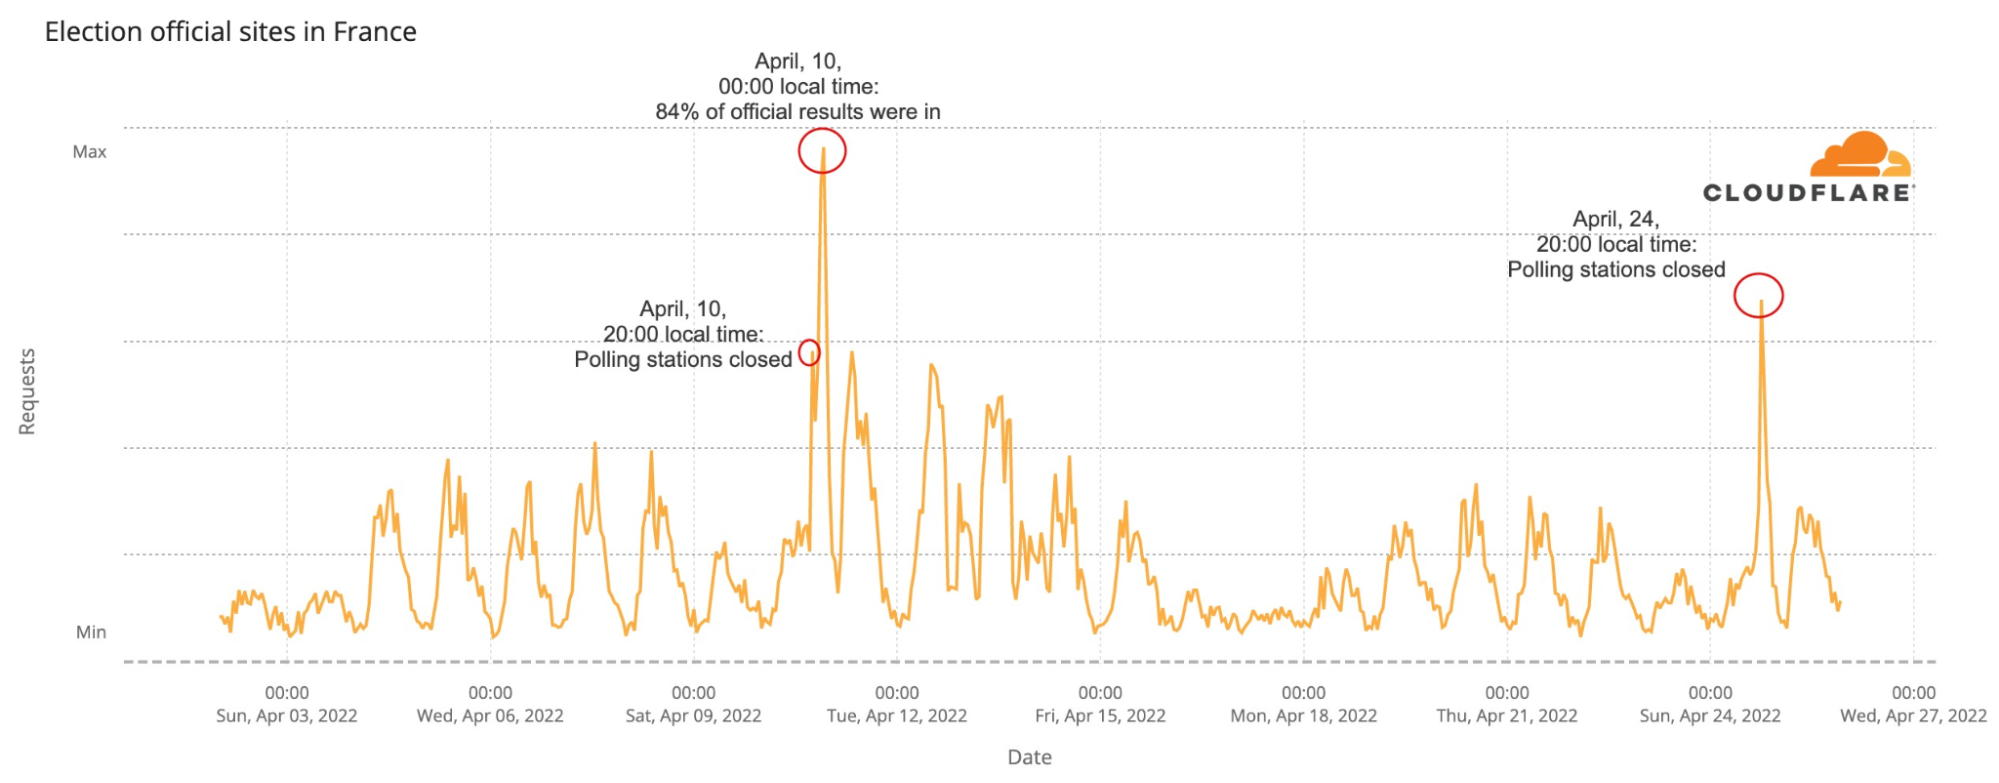
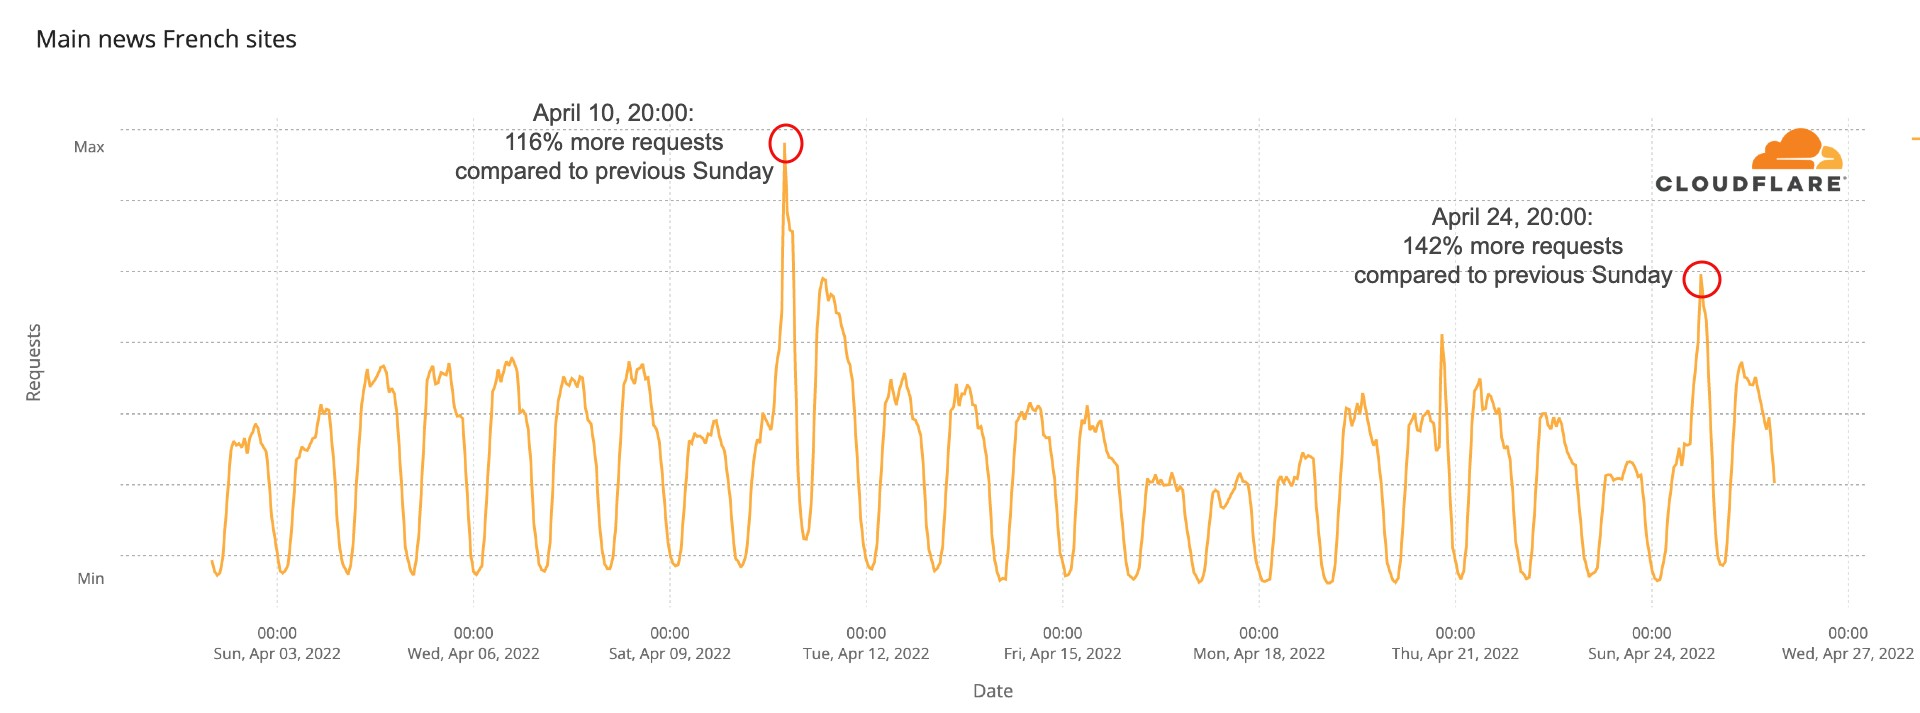
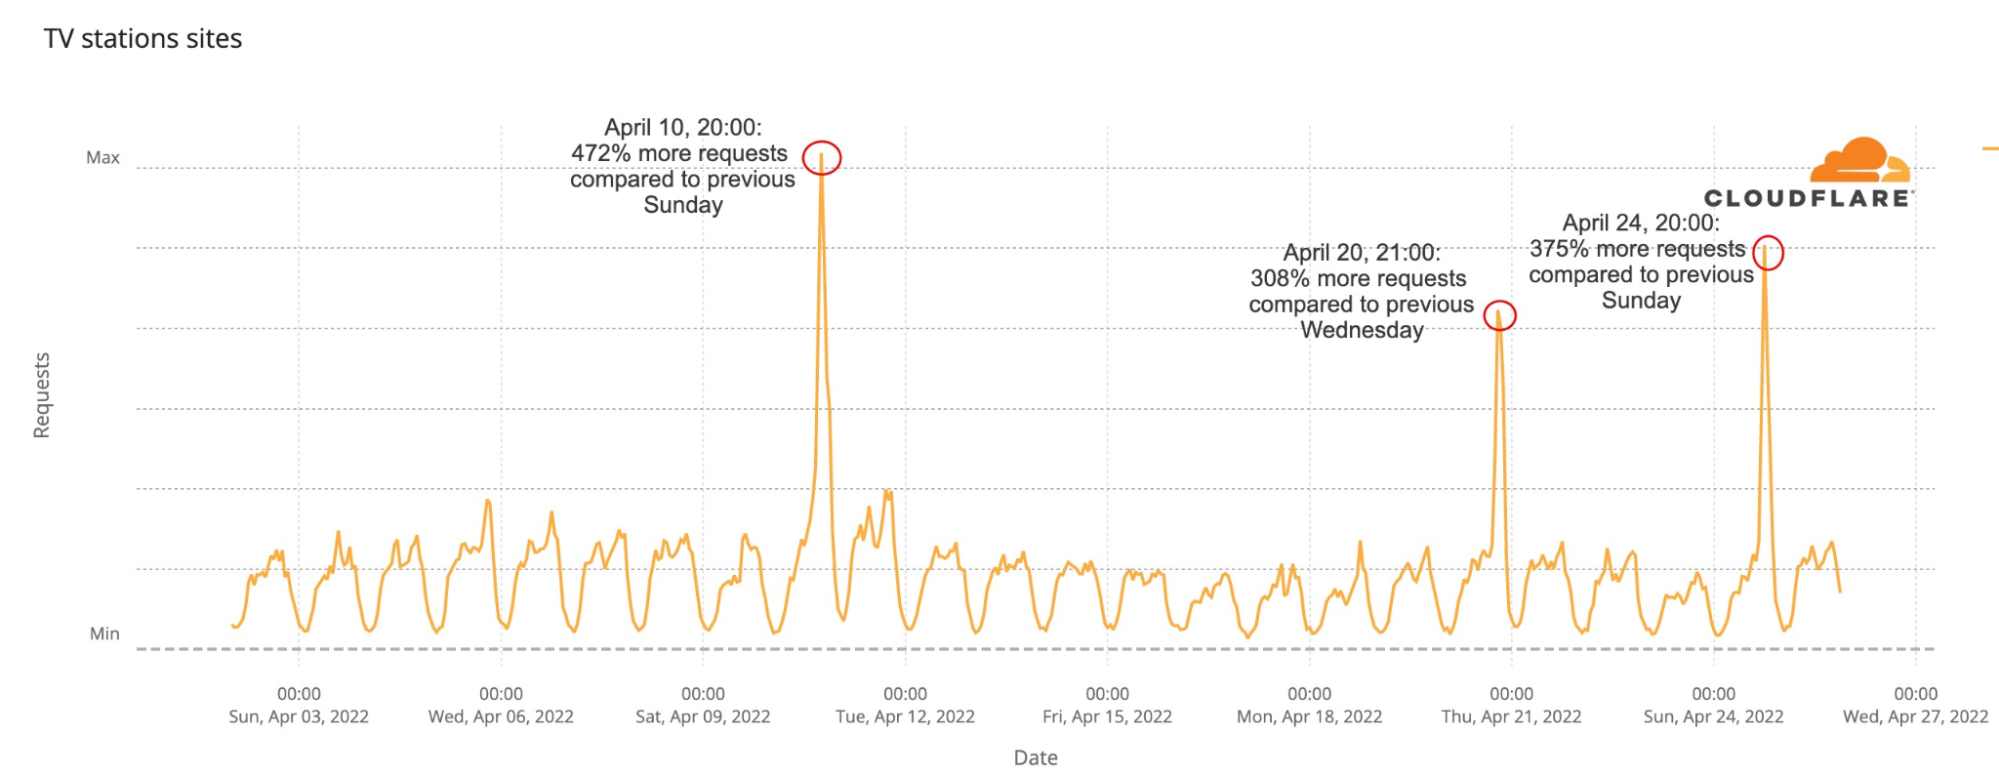


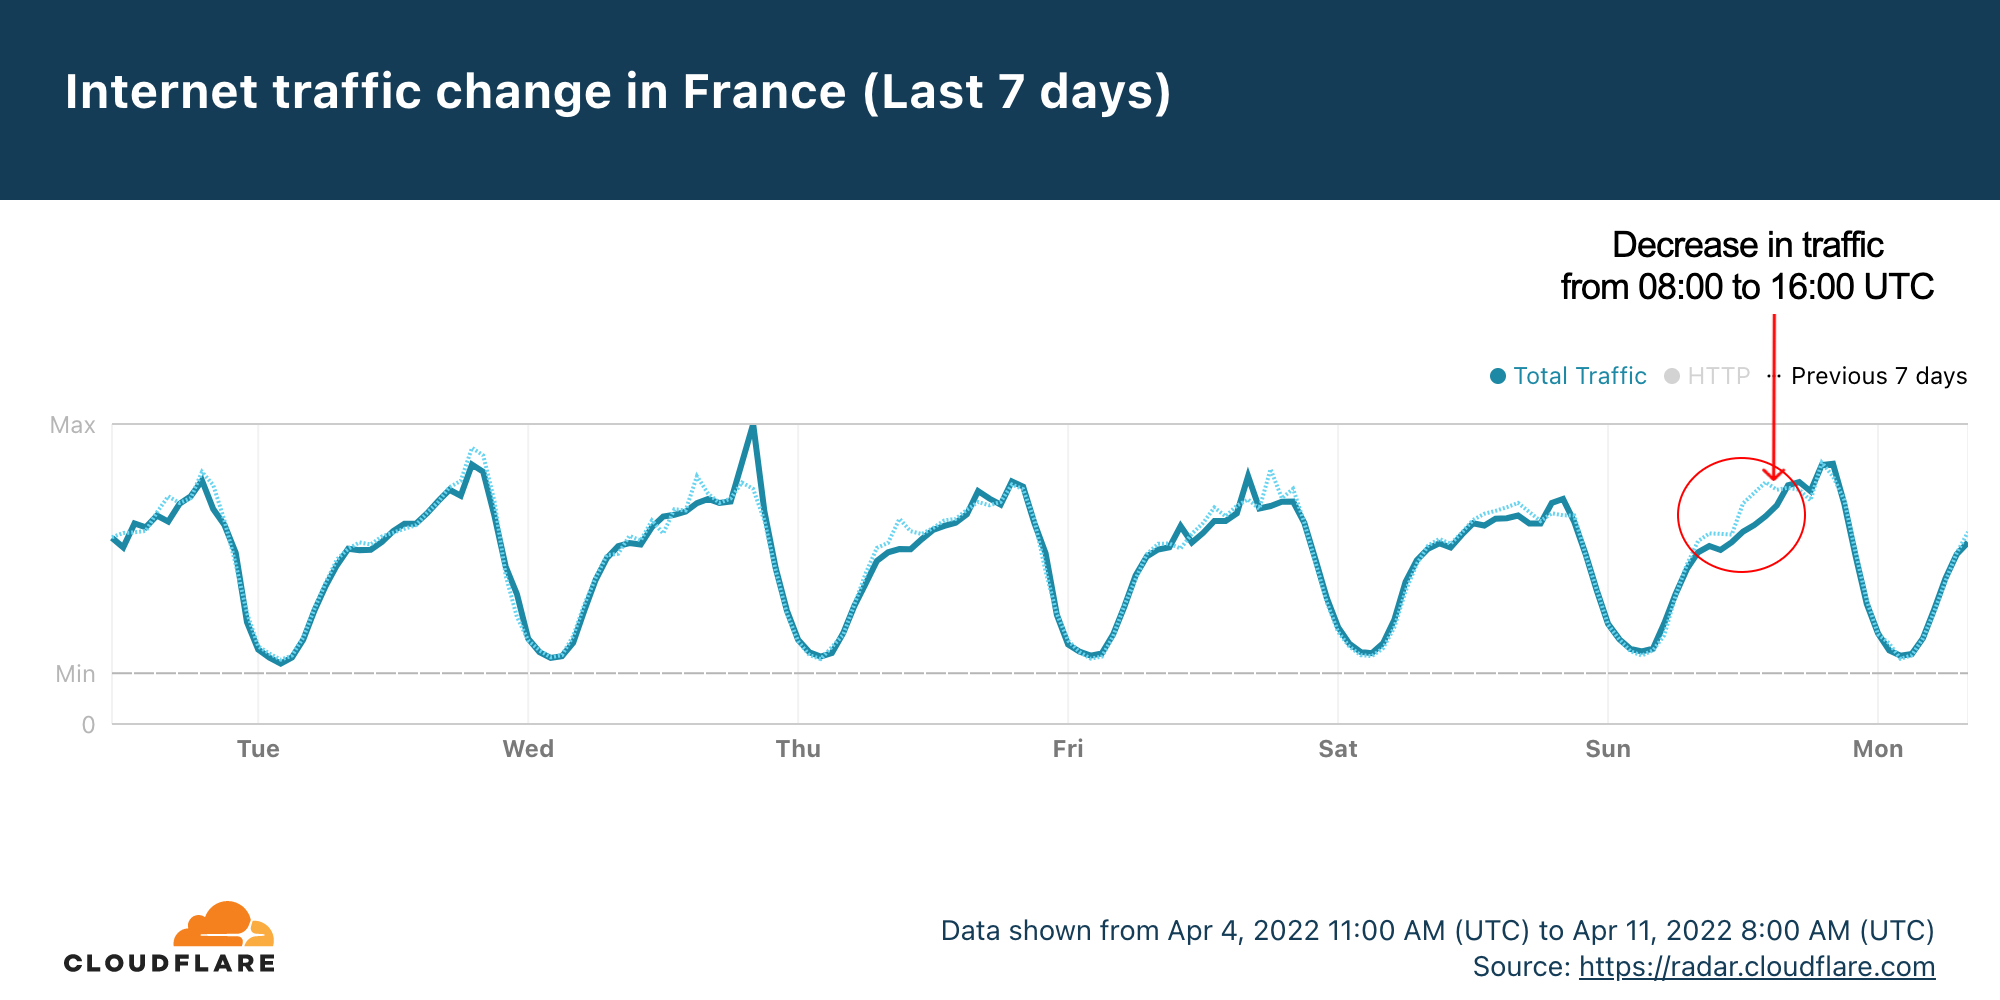
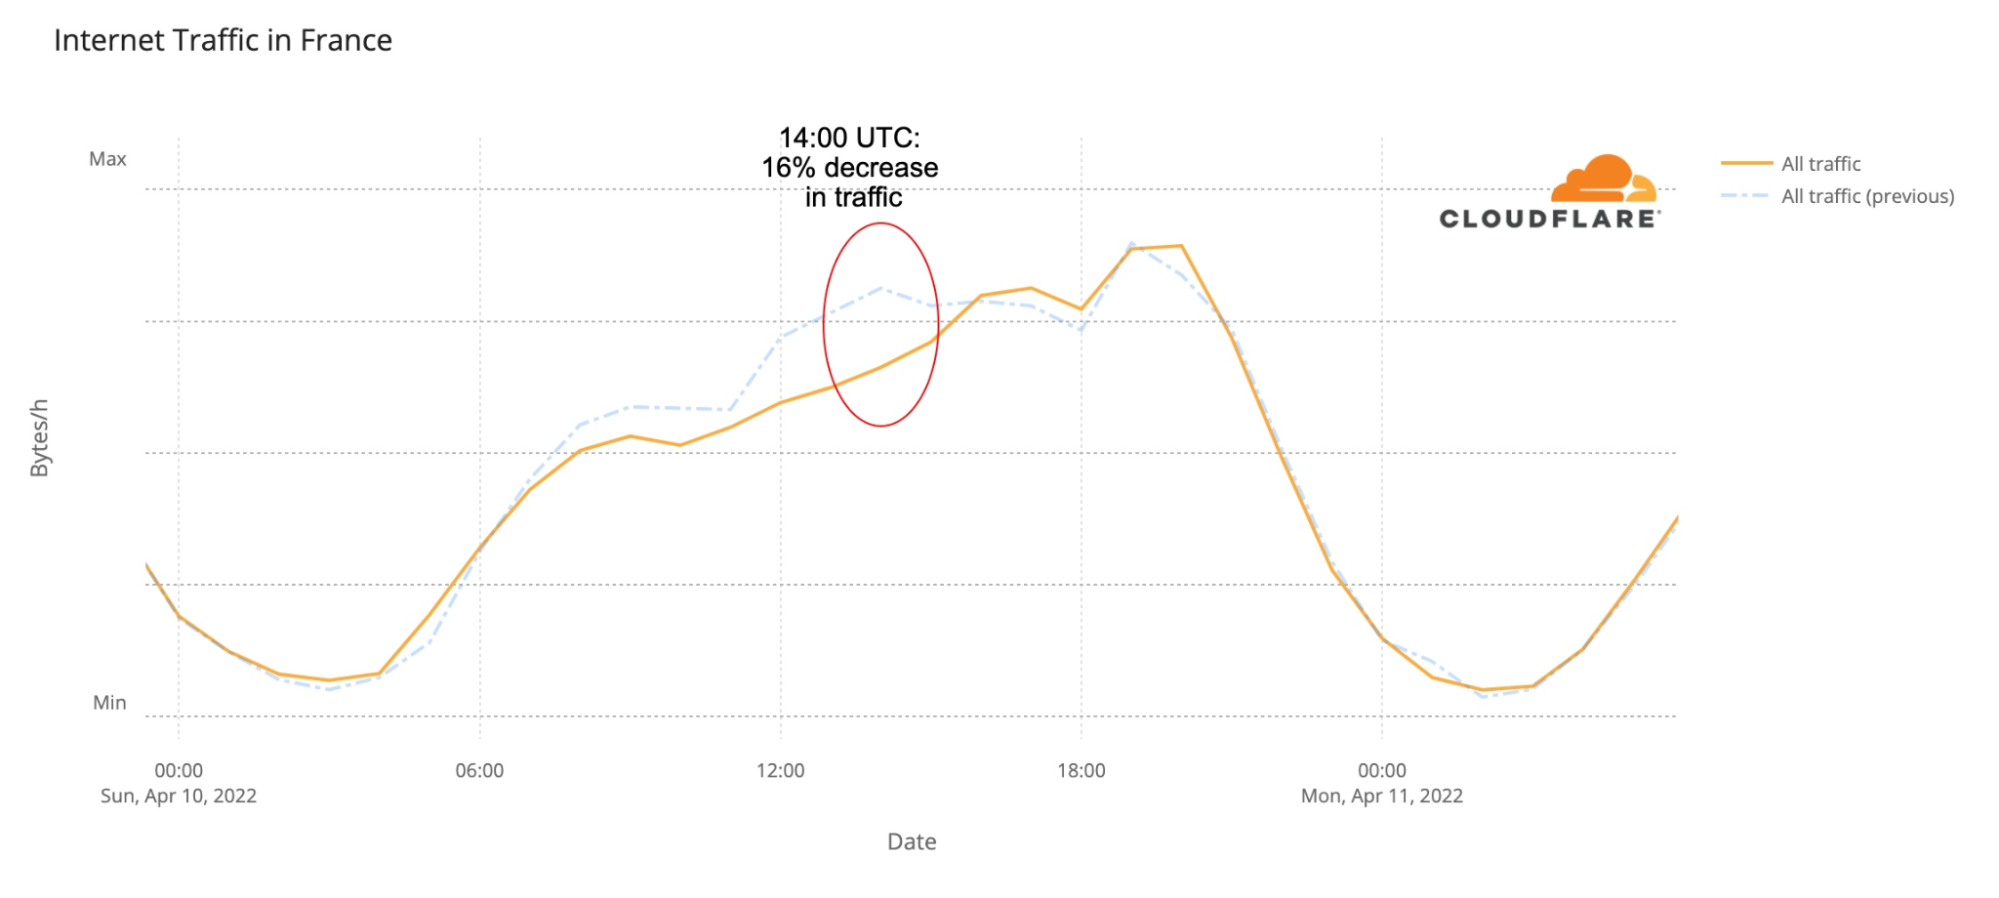
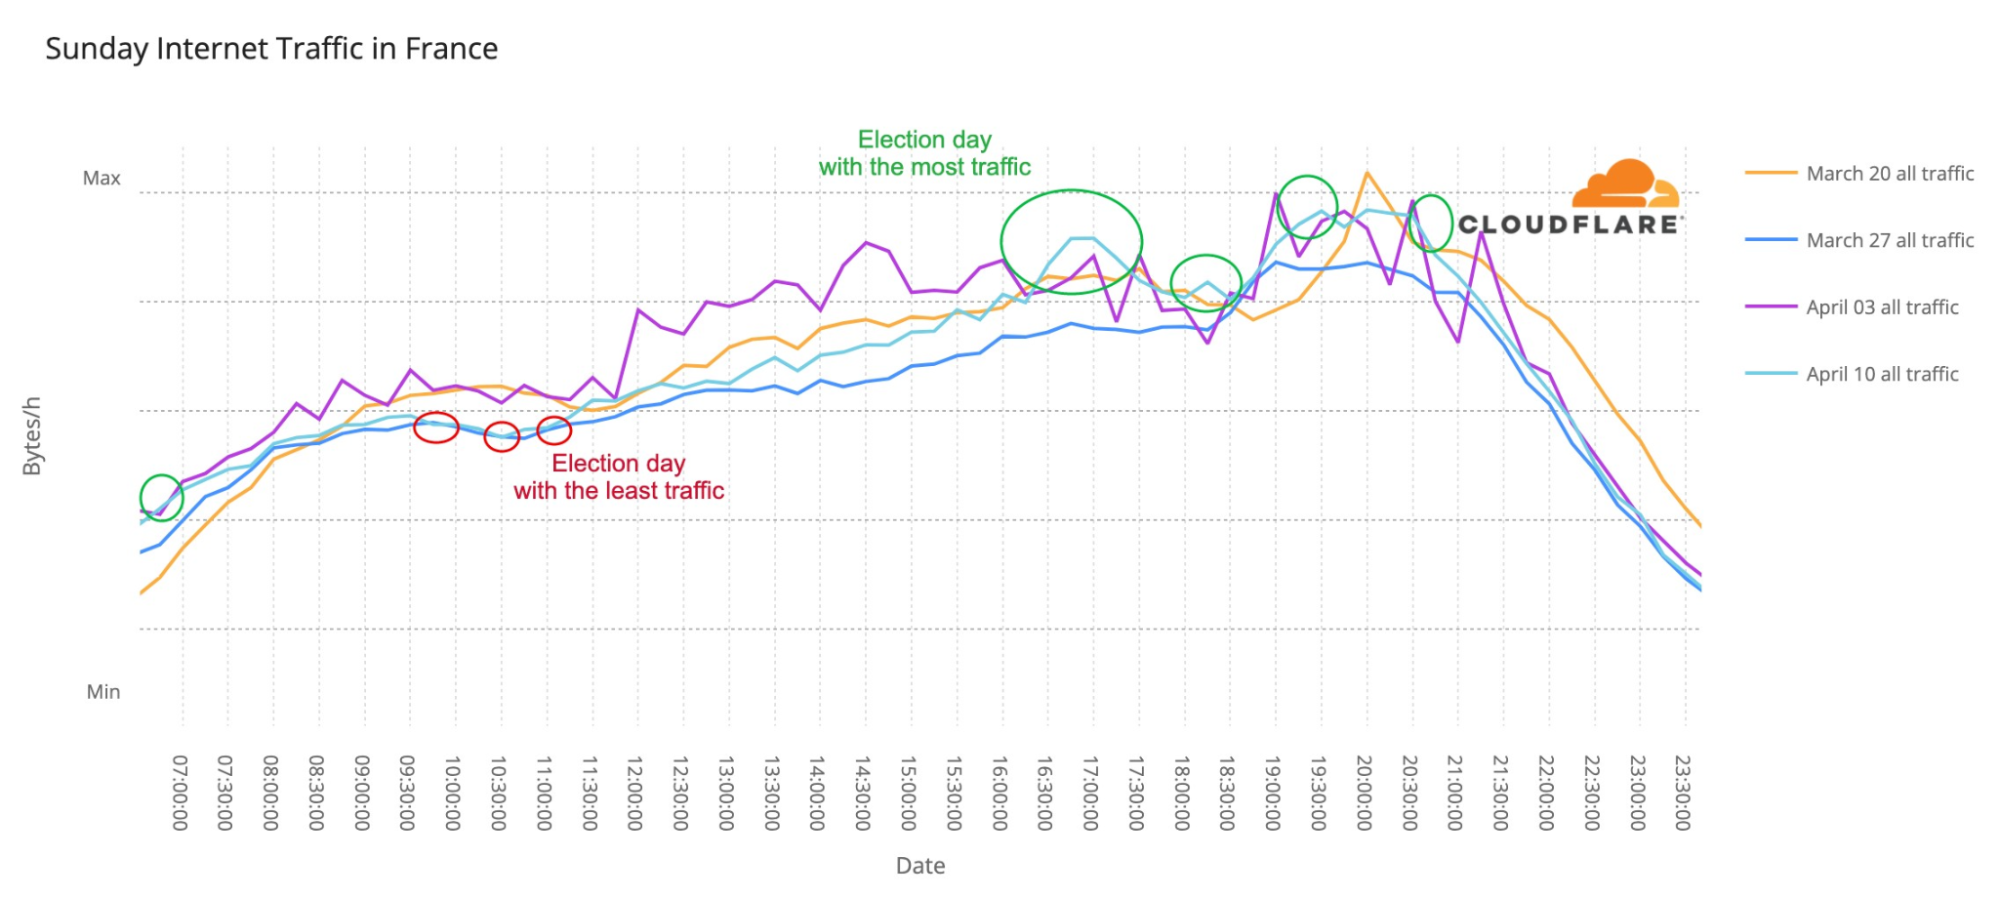
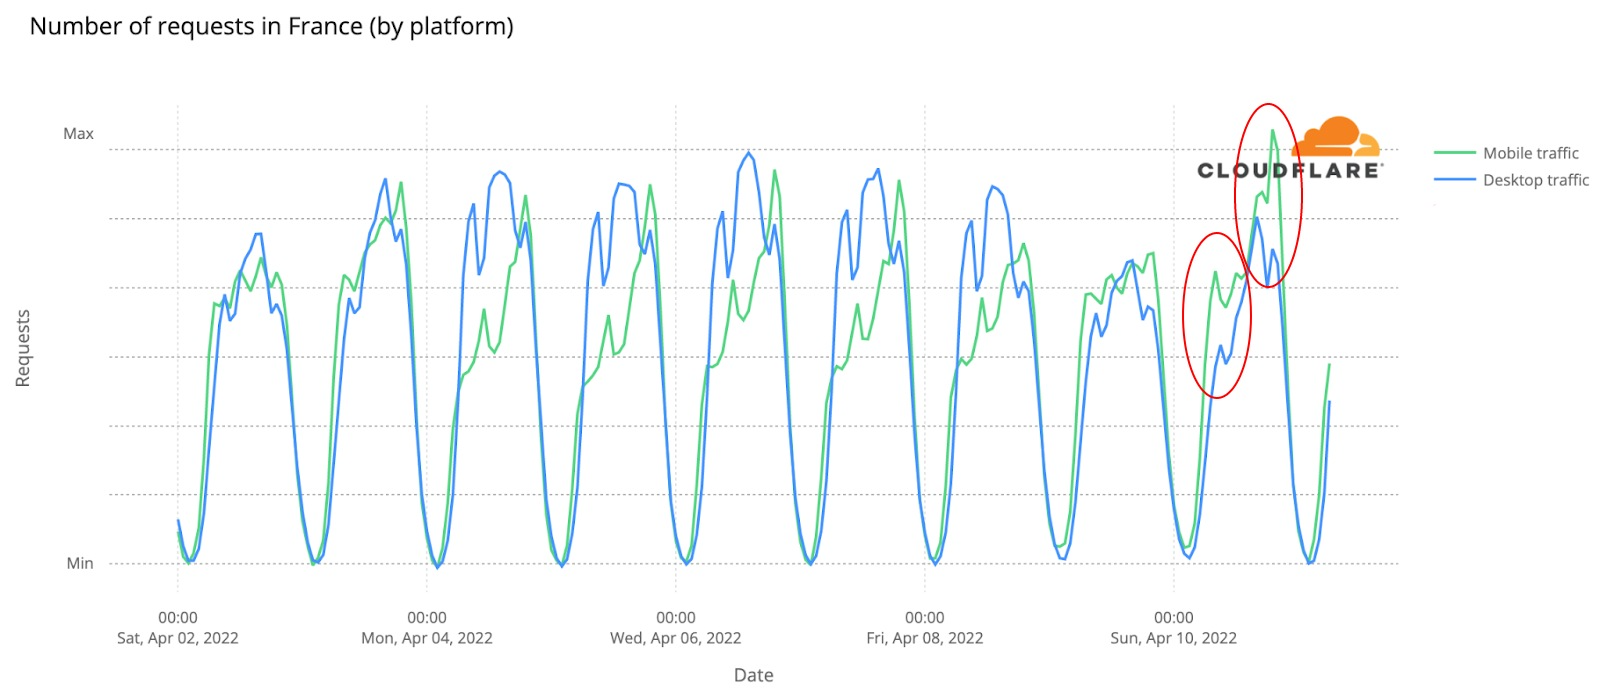
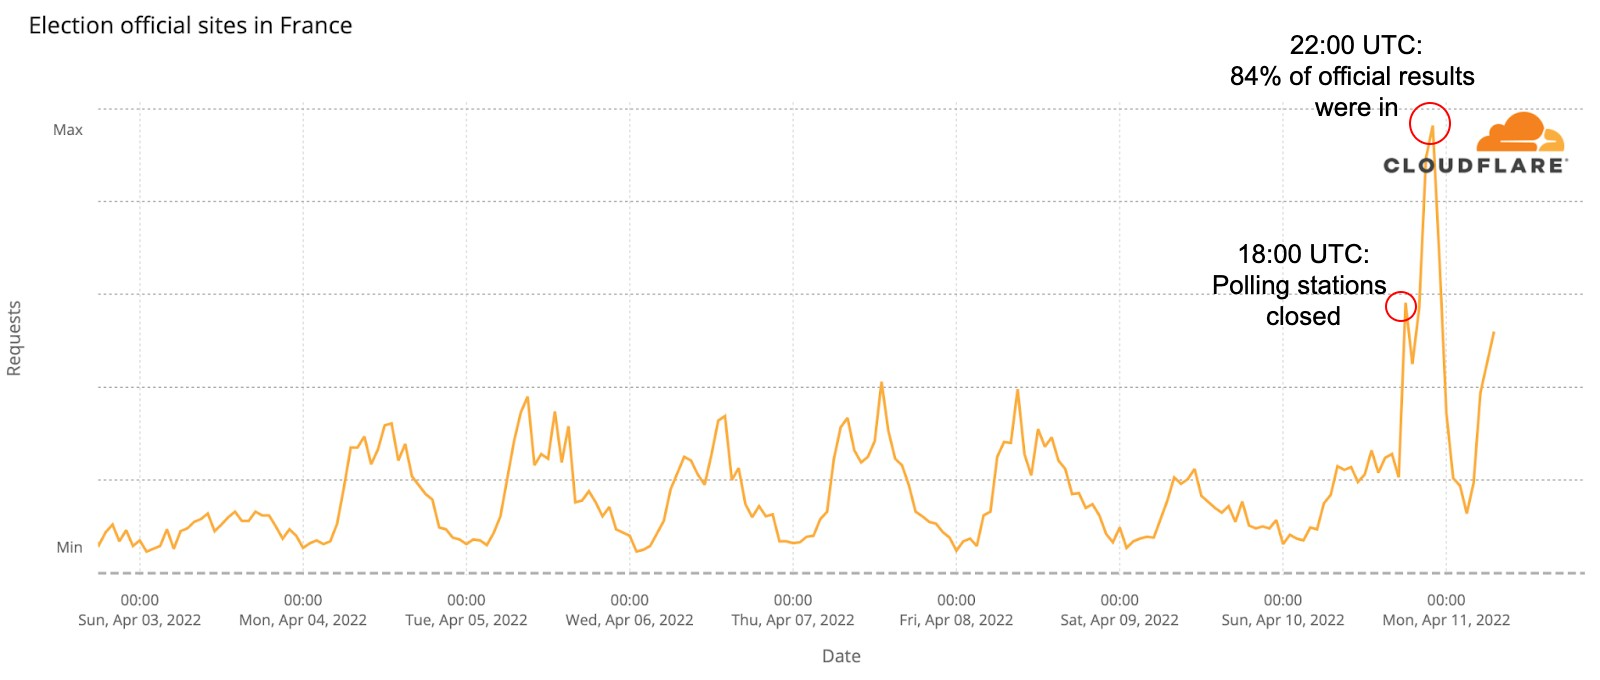
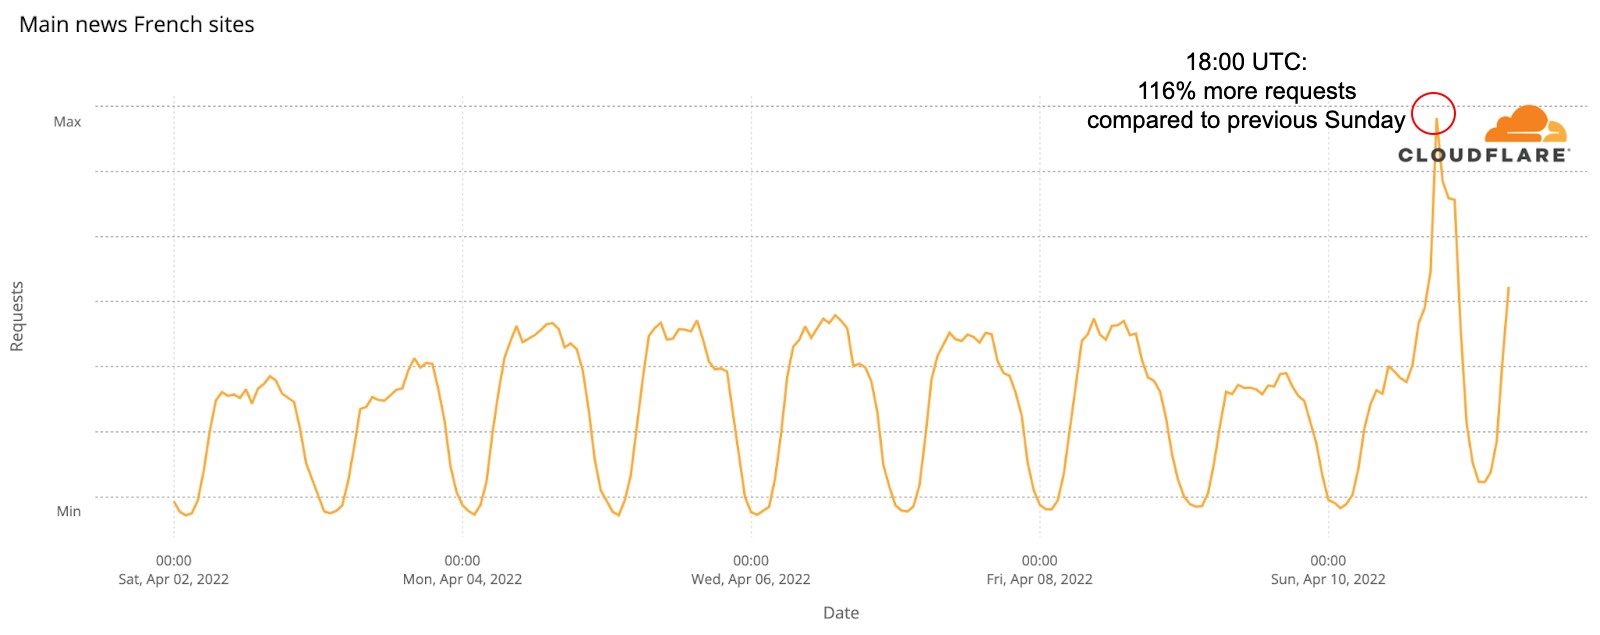
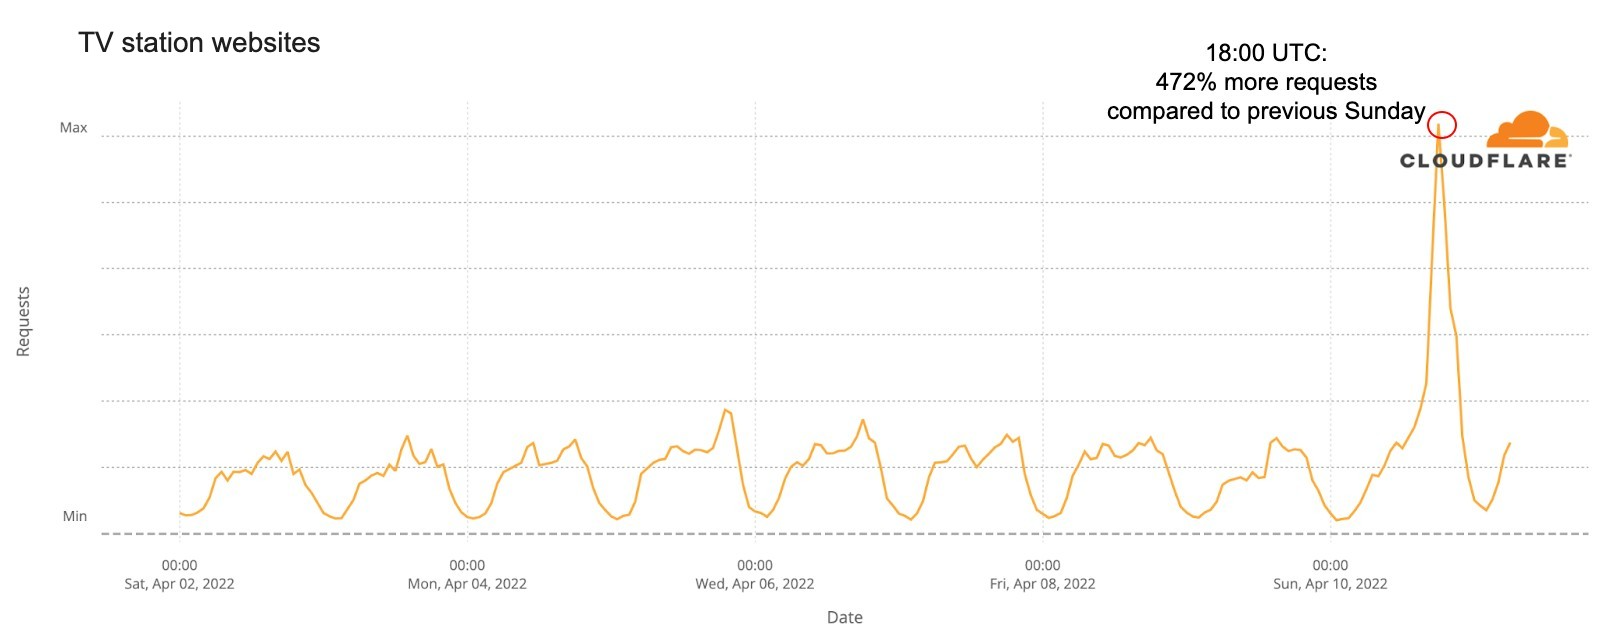
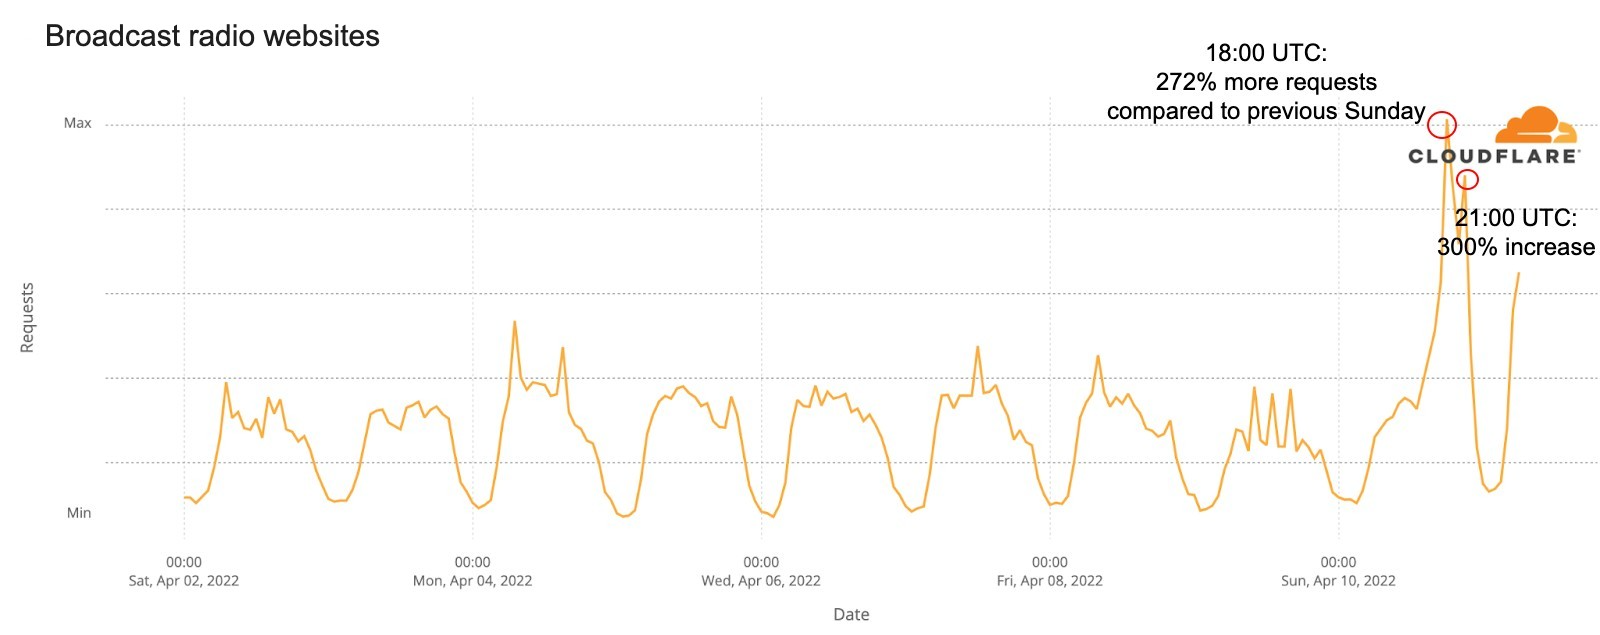
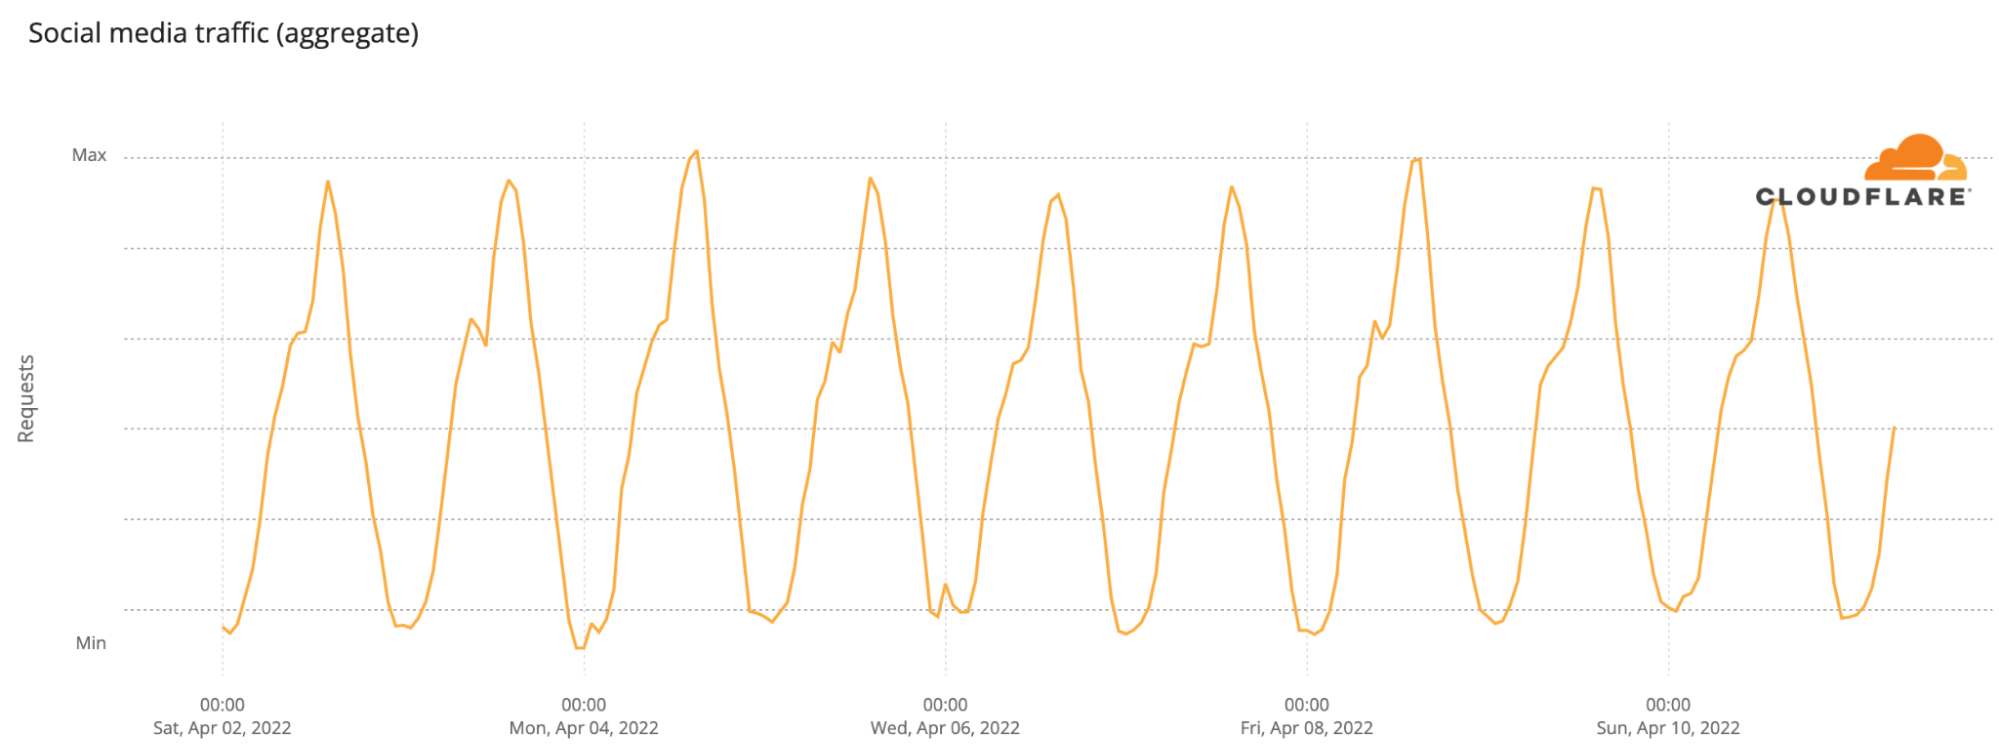


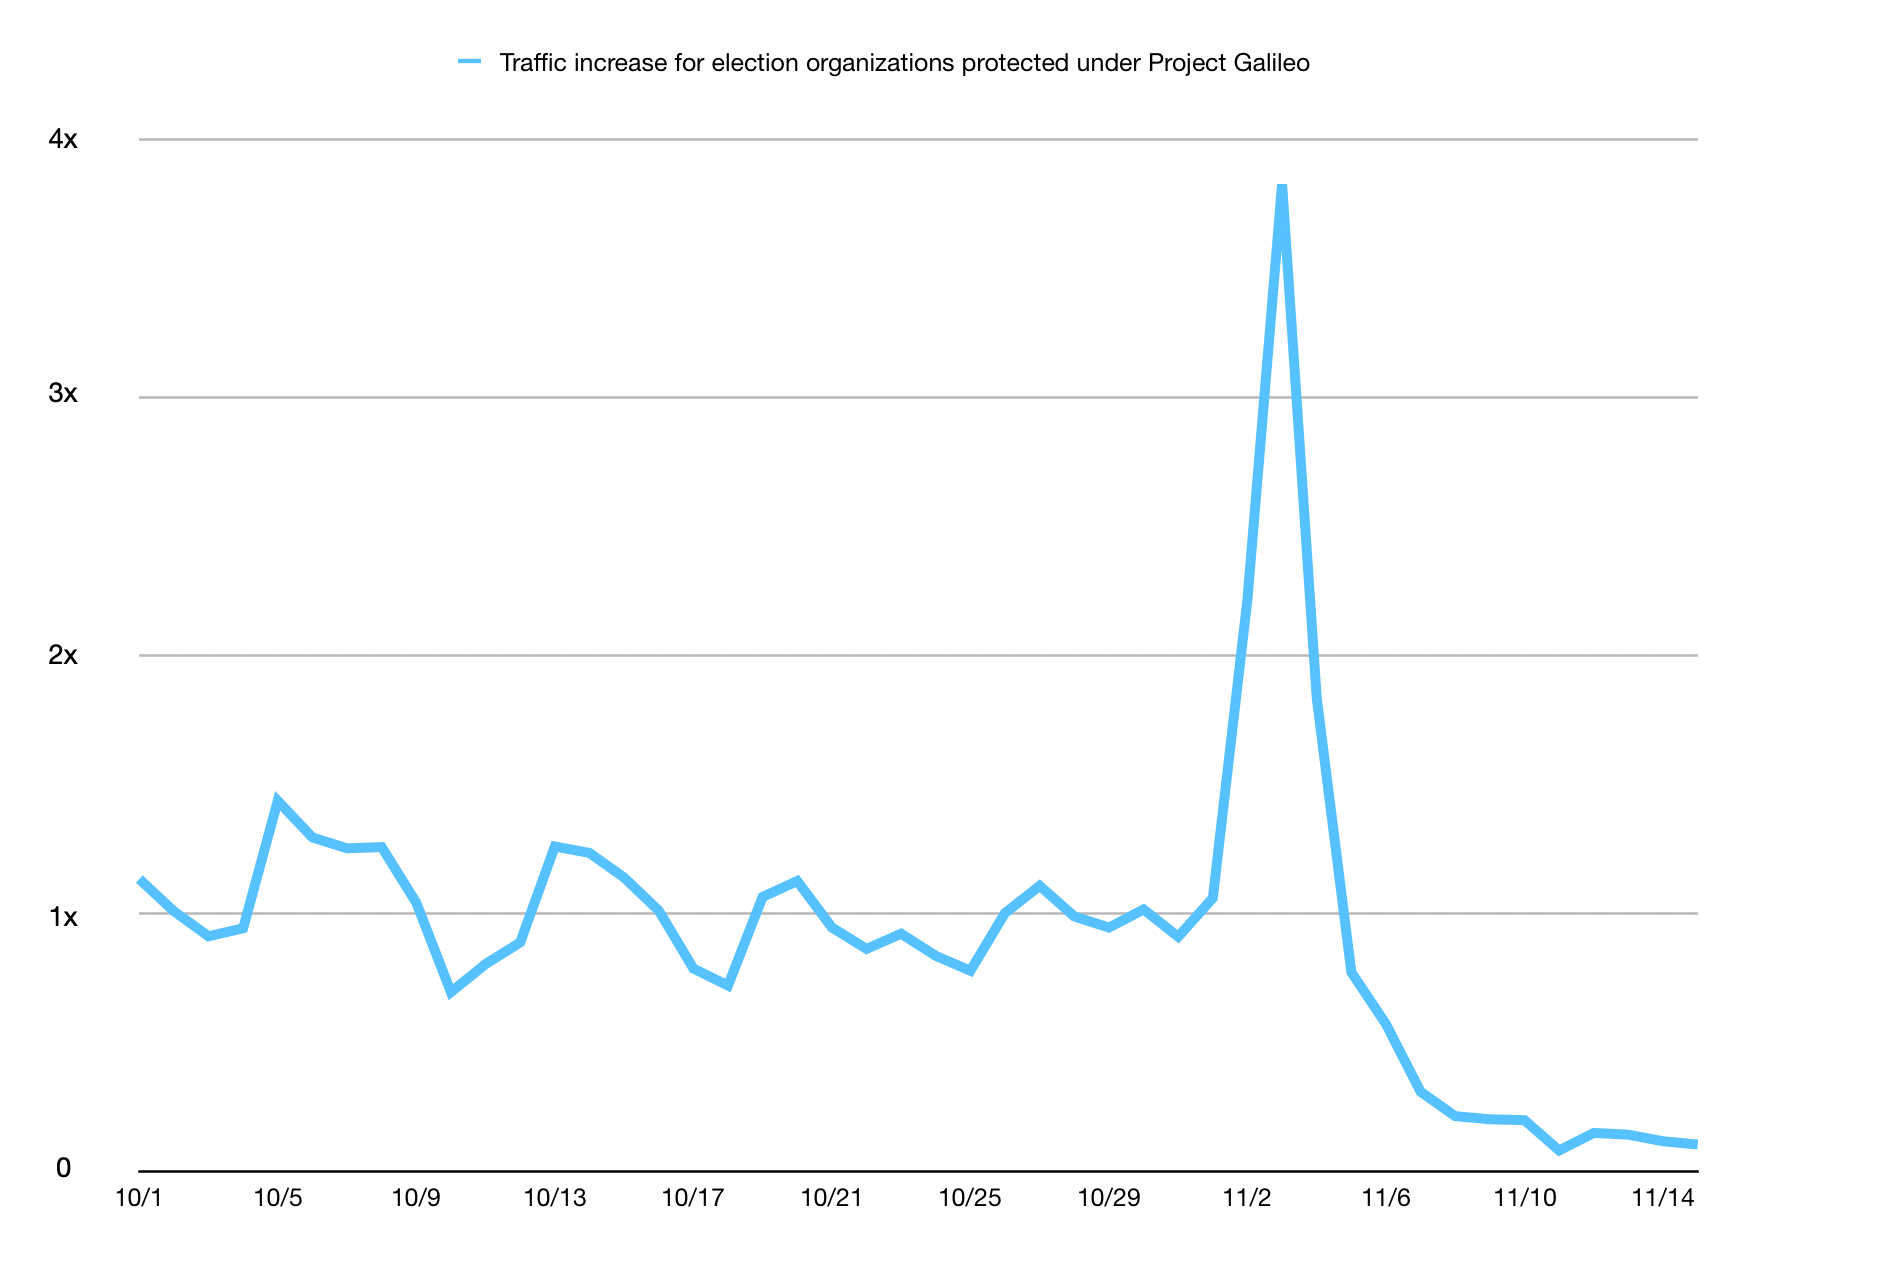
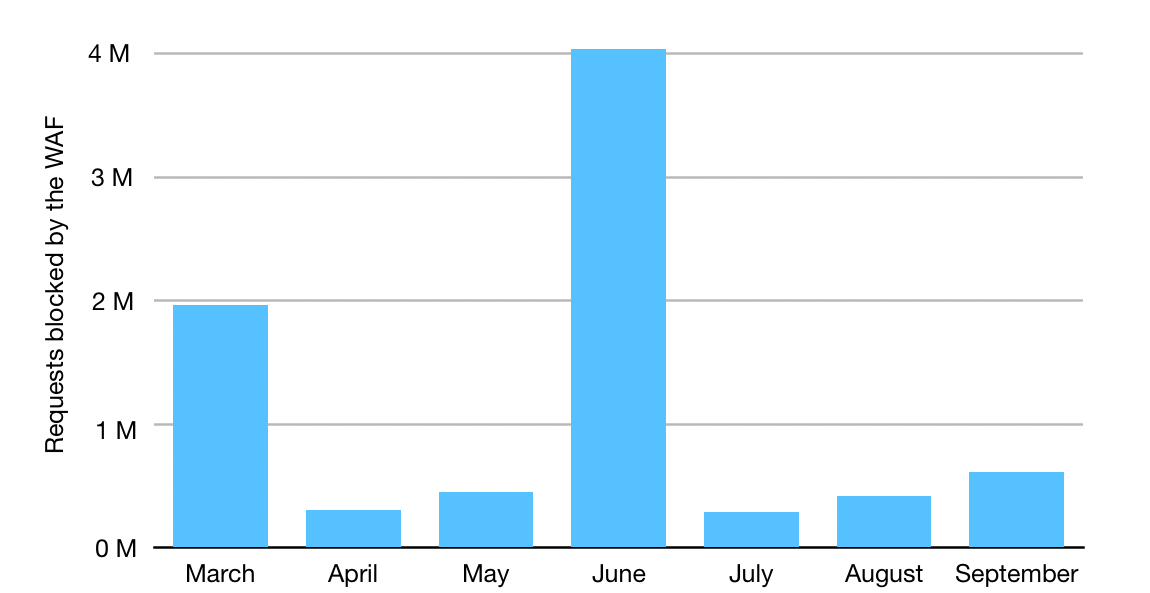

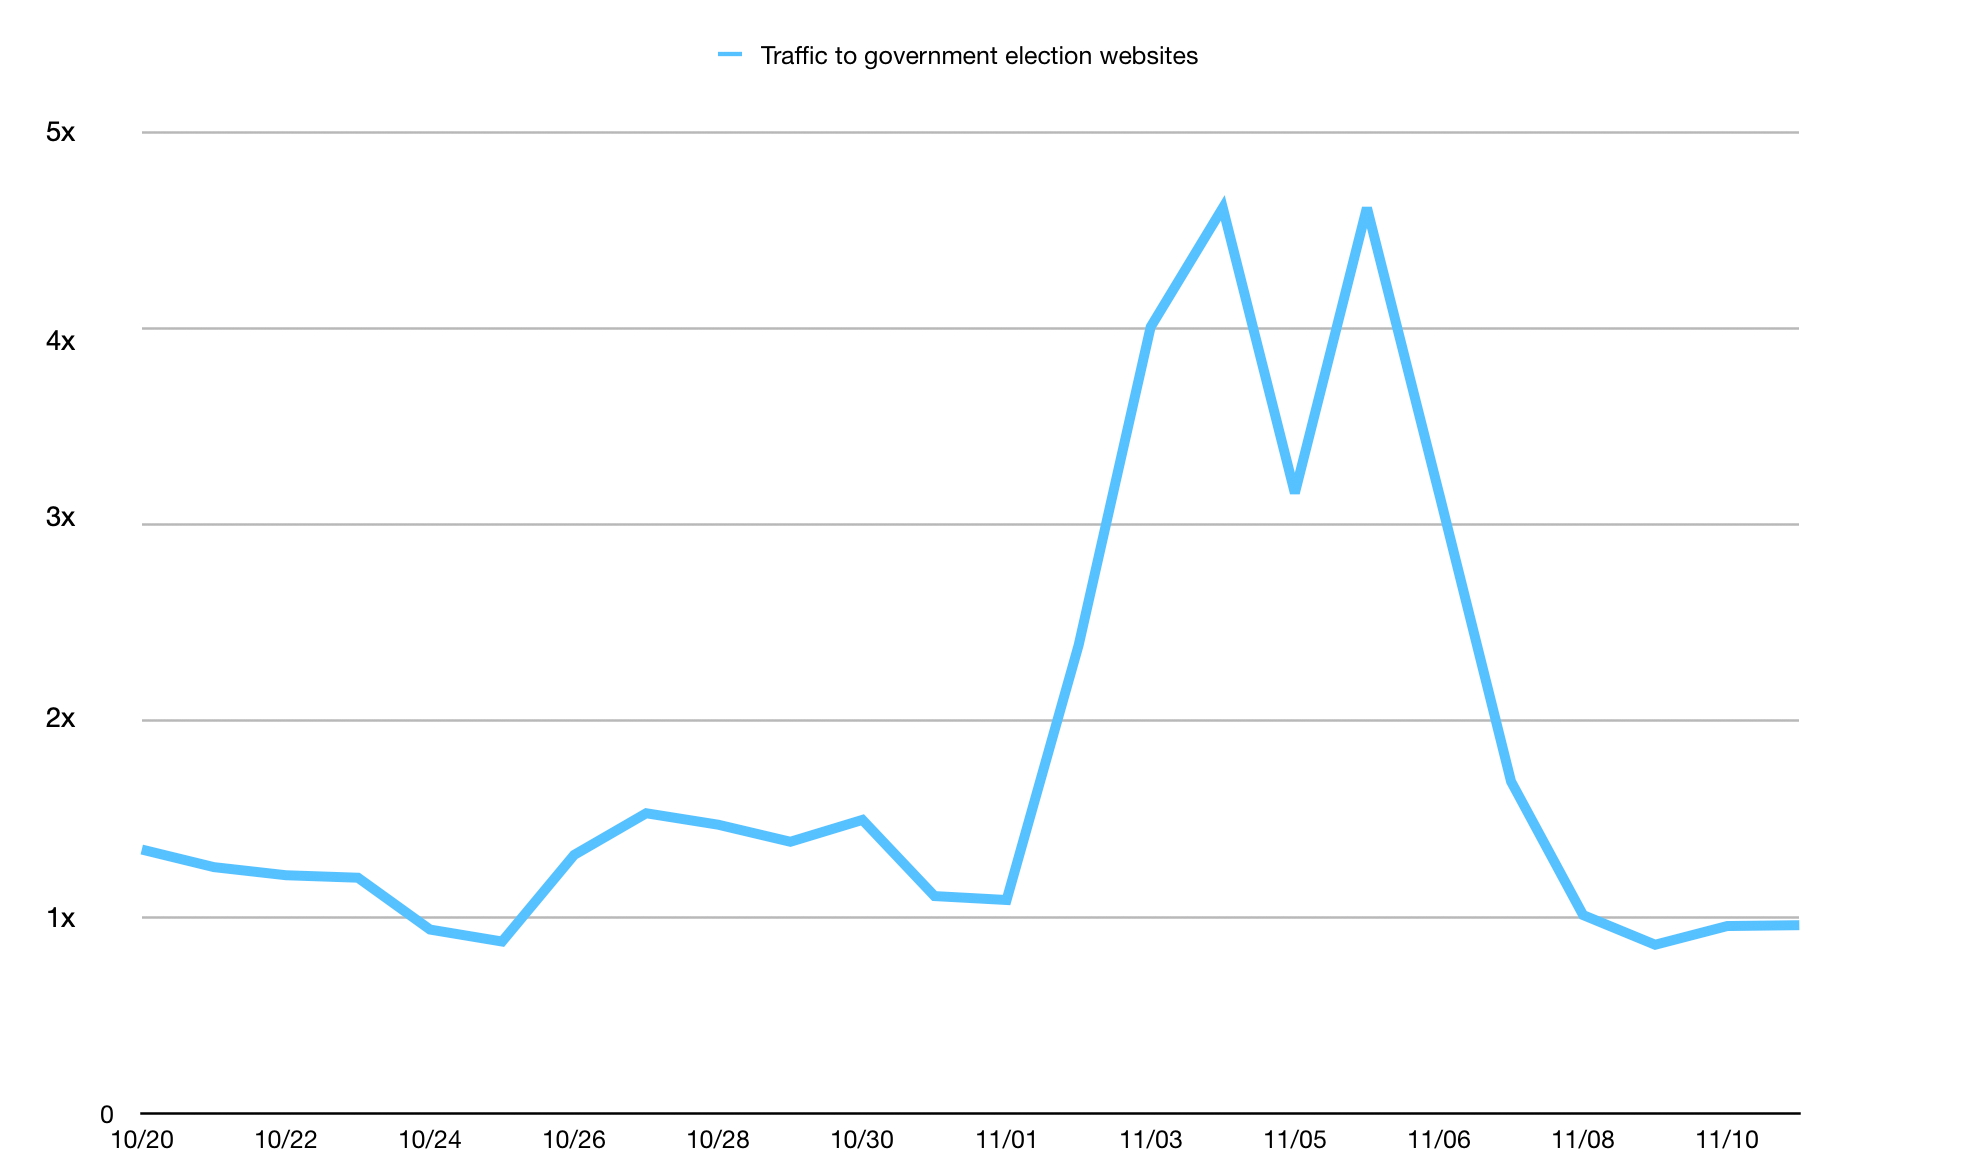
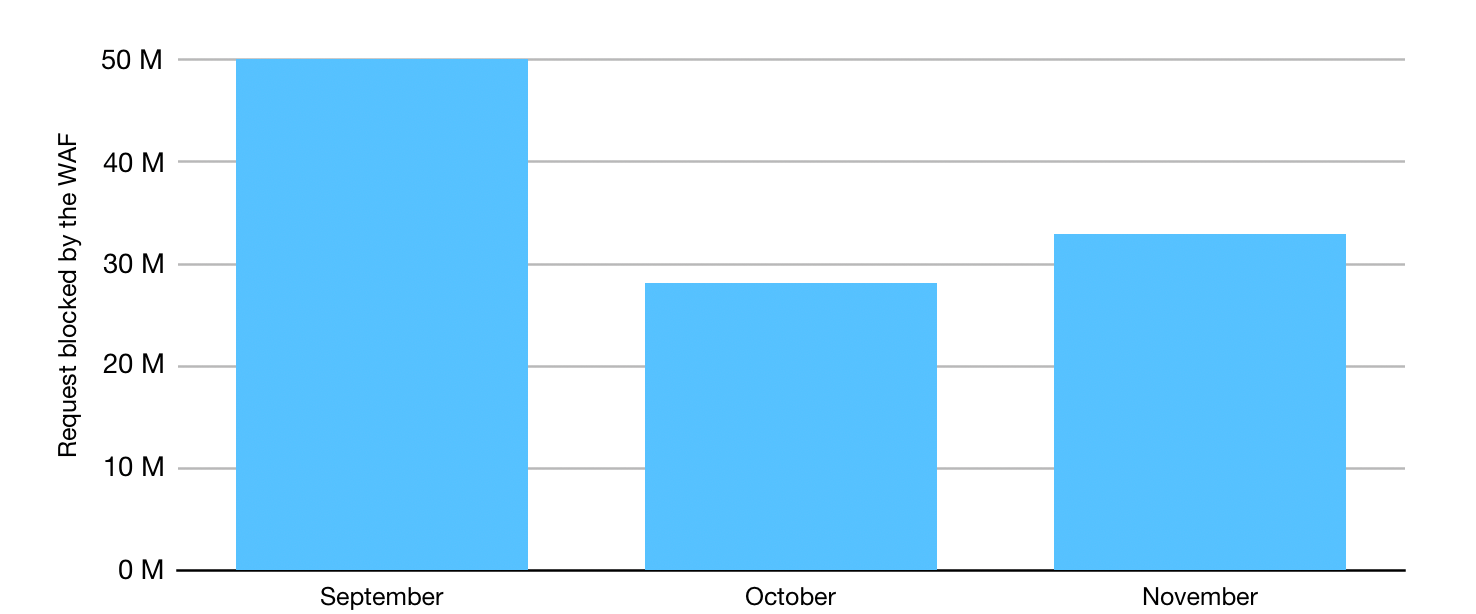
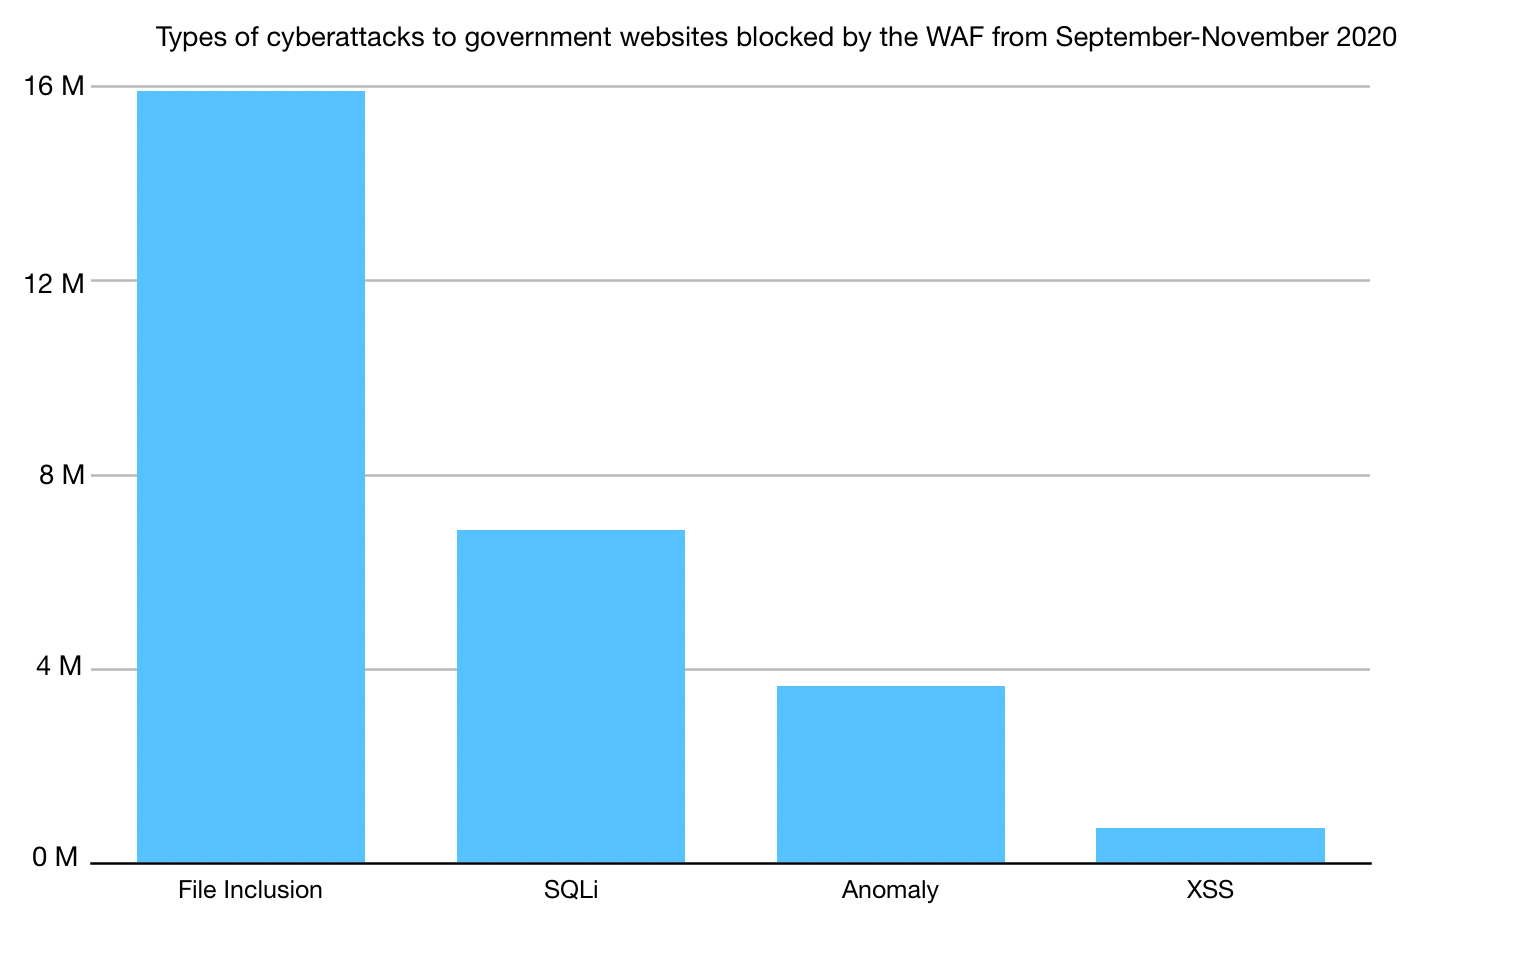
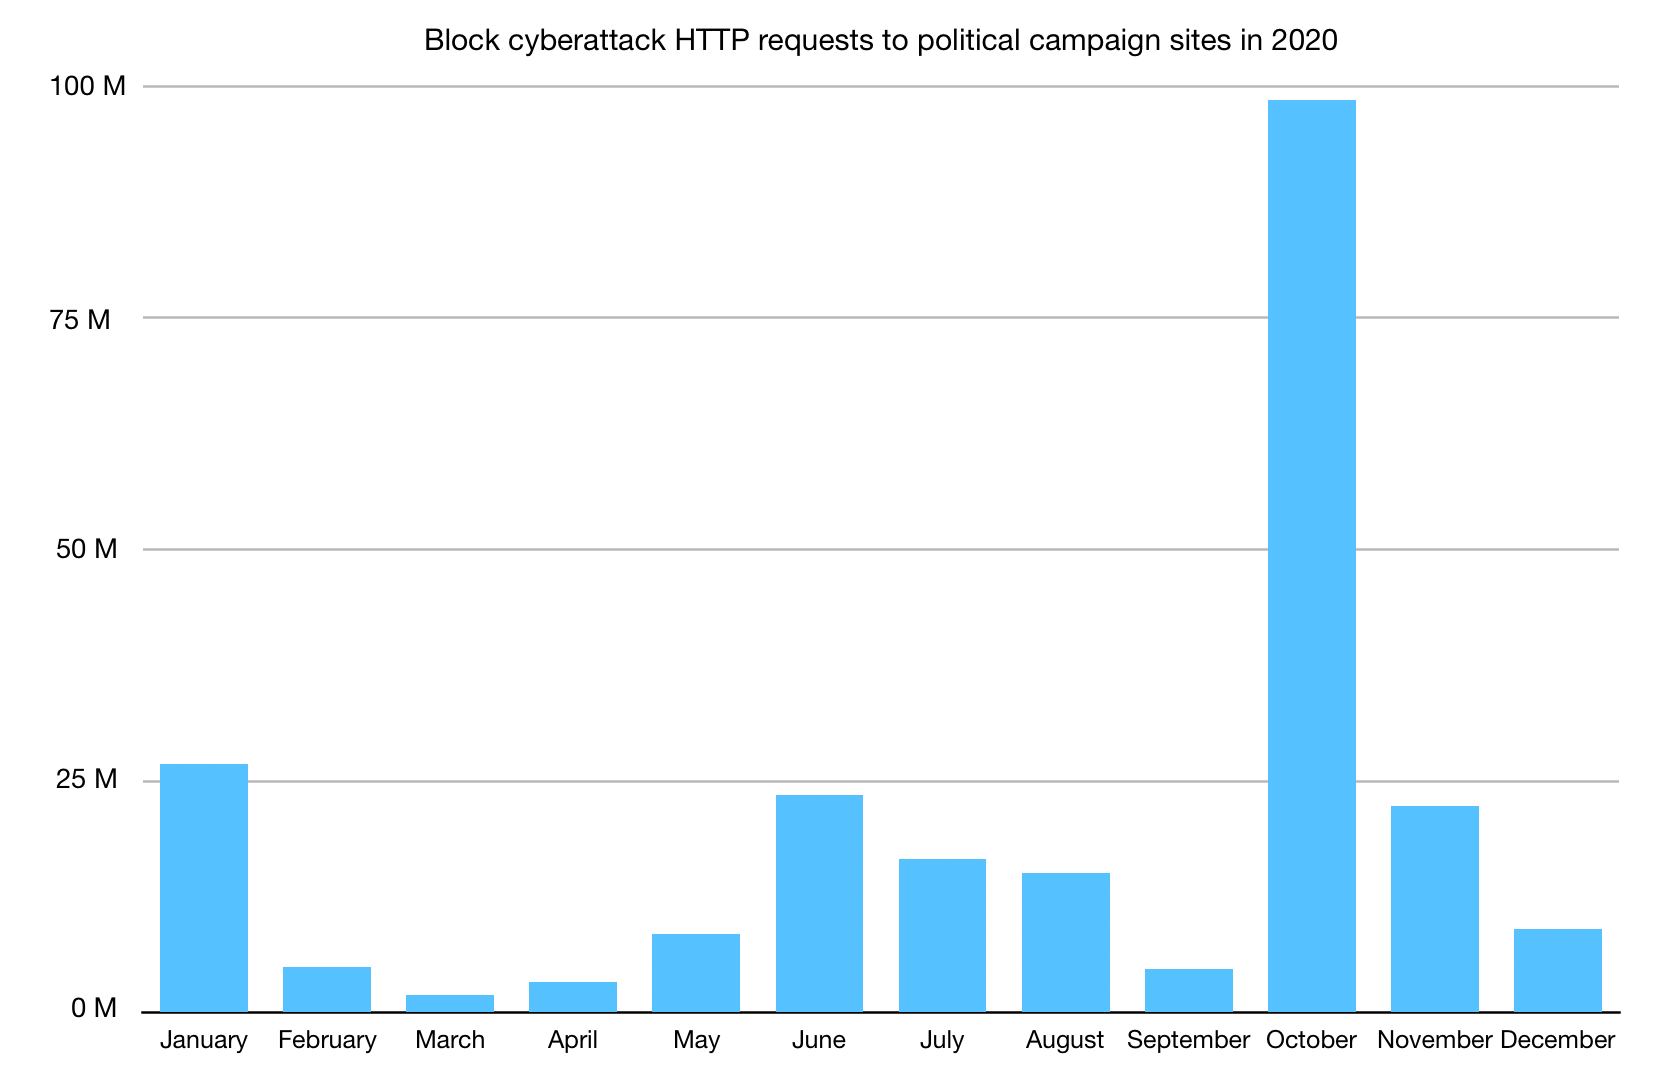
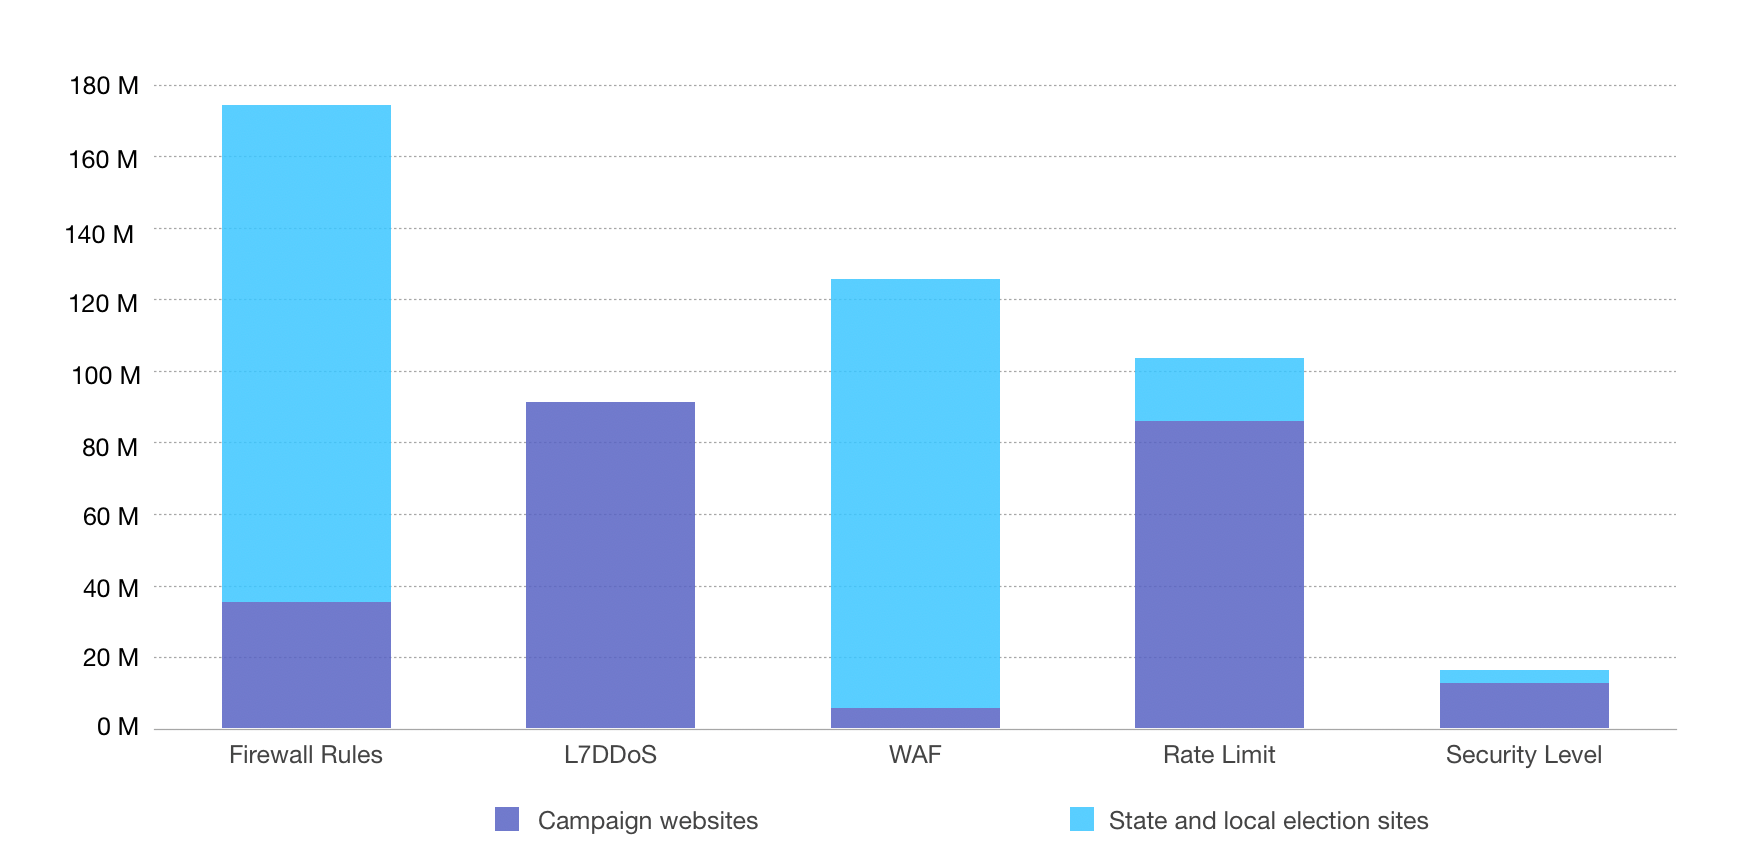
