Here at Cloudflare, we frequently use and write about data in the present. But sometimes understanding the present begins with digging into the past.
We recently learned of a 2024 turkmen.news article (available in Russian) that reports Turkmenistan experienced “an unprecedented easing in blocking,” causing over 3 billion previously-blocked IP addresses to become reachable. The same article reports that one of the reasons for unblocking IP addresses was that Turkmenistan may have been testing a new firewall. (The Turkmen government’s tight control over the country’s Internet access is well-documented.)
Indeed, Cloudflare Radar shows a surge of requests coming from Turkmenistan around the same time, as we’ll show below. But we had an additional question: Does the firewall activity show up on Radar, as well? Two years ago, we launched the dashboard on Radar to give a window into the TCP connections to Cloudflare that close due to resets and timeouts. These stand out because they are considered ungraceful mechanisms to close TCP connections, according to the TCP specification.
In this blog post, we go back in time to share what Cloudflare saw in connection resets and timeouts. We must remind our readers that, as passive observers, there are limitations on what we can glean from the data. For example, our data can’t reveal attribution. Even so, the ability to observe our environment can be insightful. In a recent example, our visibility into resets and timeouts helped corroborate reports of large-scale blocking and traffic tampering by Russia.
Turkmenistan requests where there were none before
Let’s look first at the number of requests, since those should increase if IP addresses are unblocked. In mid-June 2024 Cloudflare started receiving a noticeable increase in HTTP requests, consistent with reports of Turkmenistan unblocking IPs.
The Transmission Control Protocol (TCP) is a lower-layer mechanism used to create a connection between clients and servers, and also carries 70% of HTTP traffic to Cloudflare. A TCP connection works much like a telephone call between humans, who follow graceful conventions to end a call—and who are acutely aware when conventions are broken if a call ends abruptly.
TCP also defines conventions to end the connection gracefully, and we developed mechanisms to detect when they don’t. An ungraceful end is triggered by a reset instruction or a timeout. Some are due to benign artifacts of software design or human user behaviours. However, sometimes they are exploited by third parties to close connections in everything from school and enterprise firewalls or software, to zero-rating on mobile plans, to nation-state filtering.
When we look at connections from Turkmenistan, we see that on June 13, 2024, the combined proportion of the four coloured regions increases; each coloured region represents ungraceful ends at a distinct stage of the connection lifetime. In addition to the combined increase, the relative proportions between stages (or colours) changes as well.
Further changes appeared in the weeks that followed. Among them are an increase in Post-PSH (orange) anomalies starting around July 4; a reduction in Post-ACK (light blue) anomalies around July 13; and an increase in anomalies later in connections (green) starting July 22.
The shifts above could be explained by a large firewall system. It’s important to keep in mind that data in each of the connection stages (captured by the four coloured regions in the graphs) can be explained by browser implementations or user actions. However, the scale of the data would need a great number of browsers or users doing the same thing to show up. Similarly, individual changes in behaviour would be lost unless they occur in large numbers at the same time.
Digging down to individual networks
We’ve learned that it can be helpful to look at the data for individual networks to reveal common patterns between different networks in different regions operated by single entities.
Looking at individual networks within Turkmenistan, trends and timelines appear more pronounced. July 22 in particular sees greater proportions of anomalies associated with the Server Name Indication, or domain name, rather than the IP address (dark blue), although the connection stage where the anomalies appear varies by individual network.
A different picture emerges from AS51495 (Ashgabat City Telephone Network). Post-ACK anomalies almost completely disappear on July 12, corresponding with an increase in anomalies during the Post-PSH stage. An increase of anomalies in the Later (green) connection stage on July 22 is apparent for this AS as well.
Finally, for AS59974 (Altyn Asyr), you can see below that there is a clear spike in Post-ACK anomalies starting July 22. This is the stage of the connection where a firewall could have seen the SNI, and chooses to drop the packets immediately, so they never reach Cloudflare’s servers.
We’ve previously discussed how to use the resets and timeouts data because, while useful, it can also be misinterpreted. Radar’s data on resets and timeouts is unique among operators, but in isolation it’s incomplete and subject to human bias.
Take the figure above for AS59974 where Post-ACK (light blue) anomalies markedly increased on July 22. The Radar view is proportional, meaning that the increase in proportion could be explained by greater numbers of anomalies – but could also be explained, for example, by a smaller number of valid requests. Indeed, looking at the HTTP request levels for the same AS, there was a similarly pronounced drop starting on the same day, as shown below.
If we look at the same two graphs before July 22, however, rates of reset and timeout anomalies do not appear to mirror the very large shifts up and down in HTTP requests.
Looking ahead can also mean looking behind
These charts from Radar above offer a way to analyze news events from a different angle, by looking at requests and TCP connection resets and timeouts. Does this data tell us definitively that new firewalls were being tested in Turkmenistan? No. But the trends in the data are consistent with what we could expect to see if that were the case.
If thinking about ways to use the resets and timeouts data going forward, we’d encourage also looking at the data in retrospect—or even further past to improve context.
A natural question might be, for example, “If Turkmenistan stopped blocking IPs in mid-2024, what did the data say beforehand?” The figure below captures October and November 2023. (The red-shaded region contains missing data due to the Nov. 2 Cloudflare control plane and metrics outage.) Signals about the Internet in Turkmenistan were evolving well before the news article that prompted us to look.
We’re proud to offer a unique view of TCP connection anomalies on Radar. It’s a testament to the long-lived benefits that emerge when approaching Internet measurement as a science. In keeping with the open spirit of science, we’ve also shared how we detect and log resets and timeouts so that others can reproduce the observability on their servers, whether by hobbyists or other large operators.
In the third quarter, we observed Internet disruptions with a wide variety of known causes, as well as several with no definitive or published cause. Once again, we unfortunately saw a number of government-directed shutdowns, including exam-related shutdowns in Sudan, Syria, and Iraq. Cable cuts, both submarine and terrestrial, caused Internet outages, including one caused by a stray bullet. A rogue contractor, among other events, caused power outages that impacted Internet connectivity. Damage from an earthquake and a fire caused service disruptions, as did a targeted cyberattack. And a myriad of technical issues, including issues with China’s Great Firewall, resulted in traffic losses across multiple countries.
As we have noted in the past, this post is intended as a summary overview of observed and confirmed disruptions, and is not an exhaustive or complete list of issues that have occurred during the quarter. A larger list of detected traffic anomalies is available in the Cloudflare Radar Outage Center. These anomalies are detected through significant deviations from expected traffic patterns observed across our network. Note that both bytes-based and request-based traffic graphs are used within the post to illustrate the impact of the observed disruptions — the choice of metric to include was generally made based on which better illustrated the impact of the disruption.
Government-directed shutdowns
Sudan
Regular drops in traffic from Sudan were observed between 12:00-15:00 UTC (14:00-17:00 local time) each day from July 7-10. Partial outages were observed at Sudatel (AS15706), and near-complete outages at SDN Mobitel (AS36998) and MTN Sudan (AS36972). Similar drops were also seen in traffic to our 1.1.1.1 DNS resolver from these impacted ASNs.
We have observed Sudan implementing government-directed Internet shutdowns in the past (2021, 2022), and given that the timing aligns with the last four days of postponed 2024 secondary school certificate examinations, in addition to fitting the pattern of short-duration disruptions repeating across multiple days, we believe that these drops in traffic were exam-related shutdowns as well.
Syria
In our second quarter post, we covered the cellular connectivity-focused exam-related Internet shutdowns that Syria chose to implement this year in an effort to limit their impact. During the second quarter, the shutdowns associated with the “Basic Education Certificate” took place on June 21, 24, and 29 between 05:15 – 06:00 UTC (08:15 – 09:00 local time). Exams and associated shutdowns for the “Secondary Education Certificate” were scheduled to take place between July 12 and August 3, and during that period, we observed six additional Internet disruptions in Syria on July 12, 17, 21, 28, 31, and August 3, as shown in the graph below.
“As part of its efforts to ensure the integrity of the examination process, and in coordination with relevant authorities, the Ministry of Education was able to uncover organized exam cheating networks in three examination centers in Lattakia Governorate. These networks used advanced electronic technologies and devices in their attempt to manipulate the exam process.
The network was seized in cooperation with the Lattakia Education Directorate, following close monitoring and detection of suspicious attempts. It was found that members of the network used small earphones, wireless communication devices, and mobile phones equipped with advanced transmission and reception technologies, which contradict educational values and violate the integrity of the examination process and the principle of justice.”
Venezuela
A slightly more unusual government directed shutdown took place in Venezuela on August 18 when Venezuelan provider SuperCable (AS22313) ceased service. An X post from Venezuelan industry watcher VE sin Filtro published a notification from CONATEL, the National Commission of Telecommunications in Venezuela, that notified SuperCable that as of March 14, 2025, its authority to operate in the country had been revoked, and established a 60 day transition period so that users could find another provider. Another X post from VE sin Filtro shared an email that SuperCable subscribers received from the company announcing the end of the service and, and noted that half an hour after the email was sent, subscribers were left without Internet connectivity. Traffic began to fall at 15:00 UTC (11:00 local time), and was gone after 15:30 UTC (11:30 local time). Connectivity remained shut down through the end of the quarter.
Interestingly, we did not see a corresponding full loss of announced IP address space when traffic disappeared. However, such full losses did occur between August 19-21, and again briefly on September 16. The number of announced /24s (blocks of 256 IPv4 addresses) fell from 95 to 63 on September 25, and remained at that level through the end of the quarter.
Iraq
Similar to Syria, we covered the latest rounds of exam-related Internet shutdowns in Iraq in our second quarter blog post. In that post, we noted that the shutdowns in the main part of the country ran until July 3 for preparatory school exams, and through July 6 in the Kurdistan region. These can be seen in the graph below.
In mid-September, the Taliban ordered the shutdown of fiber optic Internet connectivity in multiple provinces across Afghanistan, as part of a drive to “prevent immorality”. It was the first such ban issued since the Taliban took full control of the country in August 2021. As many as 15 provinces experienced shutdowns, and these regional shutdowns blocked Afghani students from attending online classes, impacted commerce and banking, and limited access to government agencies and institutions such as passport and registration offices, customs offices.
Less than two weeks later, just after 11:30 UTC (16:00 local time) on Monday, September 29, 2025, subscribers of wired Internet providers in Afghanistan experienced a brief service interruption, lasting until just before 12:00 UTC (16:30 local time). Mobile providers Afghan Wireless (AS38472) and Etisalat (AS131284) remained available during that period. However, just after 12:30 UTC (17:00 local time), the Internet was completely shut down, taking the country completely offline.
On July 7, a post on X from Claro alerted subscribers to a service disruption caused by damage to two fiber optic cables. According to a subsequent post, one was damaged by work being done by CORAAVEGA (La Vega Water And Sewerage Corporation) and the other by work being done by the Dominican Electric Transmission Company. As a result of the damage, traffic from Claro (AS6400) began to drop just before 16:00 UTC (12:00 local time), falling just over two-thirds compared to the prior week. Claro’s technicians were able to quickly locate the faults and repair them, with traffic recovering around 18:00 UTC (14:00 local time).
Angola
Between 12:45-15:45 UTC (13:45-16:45 local time) on July 19, users in Angola experienced an Internet disruption, with Unitel Angola (AS37119) experiencing as much as a 95% drop in traffic as compared to the previous week, and Connectis (AS327932) suffering a complete outage. According to an X post from Unitel Angola, it “was caused by a disruption at our partner Angola Cables, resulting from public road works that affected the national fiber optic interconnections.”
However, the timing of the disruption coincided with protests over the rise in diesel fuel prices, and local non-governmental organizations disputed Unitel Angola’s explanation, claiming that it was actually due to a government-directed Internet shutdown. Multiple Angolan network providers experienced a drop in announced IP address space during the period the Internet disruption occurred, and analysis of routing information for these networks finds that they share Angola Cables (AS37468) as an upstream provider, lending some credence to the explanation from Unitel Angola.
Haiti
Digicel Haiti (AS27653) is no stranger to Internet disruptions caused by damage to both terrestrial and submarine cables, experiencing such problems during the first and second quarters of 2025, as well as first, second, and third quarters of 2024. The most recent such disruption occurred on August 26, when they experienced two different cuts on their fiber optic infrastructure, according to an X post from the company’s Director General. Traffic dropped by approximately 80% during the disruption, which lasted from 19:30-23:00 UTC (15:30-19:00 UTC).
Pakistan & United Arab Emirates
Telegeography’s Submarine Cable Map shows that the Red Sea has a high density of submarine cables that carry data between Europe, Africa, and Asia. Cuts to these cables can significantly impact connectivity, ranging from increased latency on international connections to complete outages. The impacts may only affect a single country, or they may disrupt multiple countries connected to a damaged cable. On September 6, Pakistan Telecom (AS17557)posted a message on X that stated “We would like to inform that submarine cable cuts have occurred in Saudi waters near Jeddah, impacting partial bandwidth capacity on SMW4 and IMEWE systems. As a result, internet users in Pakistan may experience some service degradation during peak hours.” (Initial reporting that the cable cuts occurred near Jeddah were apparently incorrect, as the damage occurred in Yemeni waters.)
Looking at the impact in Pakistan, we observed traffic drop by 25-30% in Sindh and Punjab between 12:00-20:00 UTC (17:00 – 01:00 local time).
In the United Arab Emirates, Etisalat alerted customers via a post on X that they “may experience slowness in data services due to an interruption in the international submarine cables.” Between 11:00-22:00 UTC (15:00-02:00 local time) on September 6, traffic from AS8966 (Etisalat)dropped as much as 28%.
Also in the UAE, service provider du (AS15802) told their customers via a post on X that “You may experience some slowness in our data services due to an International submarine cable cut.” This slowness is visible in Radar’s Internet quality metrics for the network between 11:00-22:00 UTC (15:00-02:00 local time) on September 6, with median bandwidth dropping by more than half, from 25 Mbps to as low as 9.8 Mbps, and median latency doubling from 30 ms to over 60 ms.
The graphs below provide another view of the impact of the cable cuts, based on Cloudflare network probes between New Delhi (del-c) to London (lhr-a) and Bombay (bom-c) to Frankfurt (fra-a). For the former pair of data centers, mean latency grew by approximately 20%, and for the latter pair, by approximately 30%, starting around 23:00 UTC on September 5. (The stable latency line at the bottom of both graphs represents probes going over the Cloudflare backbone, which was not impacted by the cable cuts.)
Texas, United States
Fiber optic cables are frequently damaged by errant ship anchors (submarine) or construction equipment (terrestrial), but on September 26, a stray bullet damaged a cable in the Dallas, Texas area, disrupting Internet connectivity for Spectrum (AS11427) customers. Spectrum acknowledged the service interruption in a post on X, followed by another post four and a half hours later stating that the issue had been resolved. Although neither post cited the bullet as the cause of the disruption, news reports attributed the claim to a Spectrum spokesperson. Overall, the disruption was fairly nominal, lasting for just two hours between 18:00-20:00 UTC (13:00-15:00 local time), with traffic dropping less than 25% as compared to the prior week.
South Africa
“Major cable breaks” disrupted Internet connectivity for customers of Telkom (AS37457) in South Africa on September 27. Although Telkom acknowledged the initial service disruption and its subsequent resolution in posts on X, it didn’t provide any information about the cause in these posts. However, it apparently later issued a statement, stating “Telkom confirms that mobile voice and data services, which were disrupted earlier on Saturday due to major cable breaks, have now been fully restored nationwide.” The disruption lasted six hours, from 08:00-14:00 UTC (10:00-16:00 local time), with traffic dropping as much as 50% as compared to the previous week.
Power outages cause Internet disruptions
Tanzania
A reported power outage at one of Airtel Tanzania’s data centers on July 1 resulted in a multi-hour disruption in connectivity for its mobile customers. The service interruption occurred between 11:30-18:00 UTC (14:30-21:00 local time), with traffic dropping on Airtel Tanzania (AS37133) by as much as 40% as compared to the previous week.
Czech Republic
According to the Industry and Trade Ministry in the Czech Republic, a fallen power cable caused a widespread power outage on July 4. This power outage impacted Internet connectivity within the country, with traffic dropping by as much as 32%. Traffic fell just after the power outage began at 10:00 UTC (12:00 local time), and although it was “nearly fully resolved” by 16:00 UTC (18:00 local time), traffic did not return to expected levels until closer to 20:00 UTC (22:00 local time). This trailing traffic recovery aligns with a published report that noted “While ČEPS, the national transmission system operator, restored full grid functionality by mid-afternoon, tens of thousands remained without electricity into the evening.”
St. Vincent and the Grenadines
On St. Vincent and the Grenadines, the St Vincent Electricity Services Limited (VINLEC) stated in a Facebook post that a “system failure” caused a power outage that affected customers on mainland St. Vincent. According to VINLEC, the system failed at approximately 11:30 local time on August 16 (03:30 UTC on August 17), and power was restored to all customers just after 04:00 local time on August 17 (08:00 UTC). During the four-hour power outage, which also disrupted Internet connectivity, traffic dropped by as much as 80% below expected levels.
Curaçao
In Curaçao, a series of Facebook posts from Aqualectra, the island’s water and power company, confirmed that there was a power outage, and provided updates on the progress towards restoration. The impact of the power outage to Internet connectivity was visible in traffic disruptions across several Internet service providers, including Flow (AS52233) and UTS (AS11081). The observed disruptions lasted for most of the day, with traffic dropping around 06:45 UTC (02:45 local time) and recovering to expected levels around 23:45 UTC (19:45 local time). During the disruption, the country’s traffic dropped by over 80% as compared to the previous week, with Flow experiencing a near complete outage.
Cuba
Wide-scale power outages occur all too frequently in Cuba, and when power is lost, Internet connectivity follows. We have covered many such events in this series of blog posts over the last several years, and the latest occurred on September 10. That morning, an X post from the Unión Eléctrica de Cuba reported the collapse of the national electric power system at 09:14 local time (13:14 UTC) following the unexpected shutdown of the Antonio Guiteras Thermoelectric Power Plant (CTE). The island’s Internet traffic dropped by nearly 60% (as compared to expected levels) almost immediately, and remained lower than normal for over a day, returning to expected levels around 17:15 UTC on September 11 (13:15 local time) when the Ministerio de Energía y Minas de Cuba posted on X that the national electric system had been restored.
Gibraltar
A contractor cutting through three high voltage cables caused a nationwide power outage in Gibraltar on September 16, according to a Facebook post from the Gibraltar government. This power outage resulted in a disruption to Internet traffic between 11:15-18:30 UTC (13:15-20:30 local time), falling as low as 80% below the previous week.
Earthquake
Kamchatka Peninsula, Russia
A magnitude 8.8 earthquake struck the Kamchatka Peninsula in Russia at 23:24 UTC on July 29 (11:24 local time on July 30), and was powerful enough to trigger tsunami warnings for Japan, Alaska, Hawaii, Guam, and other Russian regions. The graphs below show that there was an immediate impact to Internet traffic across several networks in the region, including Rostelecom (AS12389) and InterkamService (AS42742), where traffic dropped by 75% or more. While traffic started to recover almost immediately across both providers, traffic on Rostelecom approached expected levels much more quickly than on InterkamService.
Targeted cyberattack
Yemen
A cyberattack targeting Houthi-controlled YemenNet(AS30873) on August 11 briefly disrupted connectivity across the network in Yemen. A significant drop in traffic occurred at around 14:15 UTC (17:15 local time), recovering by 15:00 UTC (18:00 local time). This observed drop in traffic aligns with the reported timing and duration of the attack, which was focused on YemenNet’s ADSL infrastructure.
The attack also apparently impacted YemenNet’s routing, as announced IPv4 address space began to decline as the attack commenced. Although the attack ended within an hour after it started, announced address space remained depressed for approximately an additional hour, reaching as low as 510 /24s (blocks of 256 IPv4 addresses) being announced, down from a “steady state” of 870 /24s.
Fire causes infrastructure damage
Egypt
A fire at the Ramses Central Exchange in Cairo, Egypt on July 7 disrupted telecommunications services for a number of providers with infrastructure in the facility. The fire broke out in a Telecom Egypt equipment room, and impacted connectivity across multiple providers, including Etisalat (AS36992), Mobinil (AS37069), Orange Egypt (AS24863), and Vodafone Egypt (AS24835). Internet traffic across these providers initially dropped at 14:30 UTC (17:30 local time). Recovery to expected levels varied across the providers, with Etisalat recovering by July 9, Vodafone and Mobinil by July 10, and Orange Egypt on July 11.
On July 10, Telecom Egypt announced that services affected by the fire had been restored, after operations were transferred to alternative exchanges.
Technical problems
Starlink
Global satellite Internet service provider Starlink (AS14593) acknowledged a July 24 network outage through a post on X. The Vice President of Network Engineering at SpaceX explained, in a subsequent X post, that “The outage was due to failure of key internal software services that operate the core network.”
Traffic initially dropped around 19:15 UTC, and the disruption lasted approximately 2.5 hours. The impact of the Starlink outage was particularly noticeable in countries including Yemen and Sudan, where traffic dropped by approximately 50%, as well as in Zimbabwe, South Sudan, and Chad.
China
At around 16:30 UTC on August 19 (00:30 local time on August 20), we observed an anomalous 25% drop in China’s Internet traffic. Our analysis of related metrics found that this disruption caused a drop in the share of IPv4 traffic, as well as a spike in the share of HTTP traffic (meaning that HTTPS traffic share had fallen), as shown in the graphs below.
Further analysis also found the share of TCP connections terminated in the Post SYN stage doubled during the observed outage, from 39% to 78%, as shown below. The cause of these unusual observations was ultimately uncovered by a Great Firewall Report blog post, which stated, in part: “Between approximately 00:34 and 01:48 (Beijing Time, UTC+8) on August 20, 2025, the Great Firewall of China (GFW) exhibited anomalous behavior by unconditionally injecting forged TCP RST+ACK packets to disrupt all connections on TCP port 443. This incident caused massive disruption of the Internet connections between China and the rest of the world. … The responsible device does not match the fingerprints of any known GFW devices, suggesting that the incident was caused by either a new GFW device or a known device operating in a novel or misconfigured state.” This explanation is consistent with the anomalies visible in the Radar graphs.
Pakistan
Subscribers of Nayatel (AS23674) experienced an approximately 90 minute disruption to Internet connectivity on September 24, due to a reported outage at an upstream provider. Traffic dropped as much as 57% between around 09:15-10:45 UTC (14:15-15:45 local). Transworld (AS38193) is one of several upstream providers to Nayatel, and a more significant drop in traffic is visible for that network, lasting from around 09:15-12:15 UTC (14:15-17:15 local time). The Nayatel disruption was likely less significant than the one seen at Transworld because Transworld is upstream of only a portion of the prefixes originated by Nayatel — traffic from other Nayatel prefixes was carried by other providers that remained available.
No definitive cause
Iran
Several weeks after experiencing a full Internet shutdown, Iran again experienced a sudden drop in Internet traffic around 21:00 UTC on July 5 (00:30 local time on July 6), with traffic falling 80% as compared to the prior week. While most of the “unknown” disruptions covered in this series of posts are observed but have no associated acknowledgement or explanation, this disruption had multiple competing explanations.
A published report noted “IRNA, Iran’s official news agency, cited the state-run Telecommunications Infrastructure Company, reporting a national-level disruption in international connectivity that affected most internet service providers Saturday night. Yet government officials have not publicly addressed the cause.” However, posts from civil society groups that follow Internet connectivity in Iran (net4people, FilterWatch) suggested that the disruption was again due to an intentional shutdown. And a post thread on X referenced, and disputed, a claim that the disruption was due to a DDoS attack. Unfortunately, no definitive root cause for this disruption could be found.
Colombia
Customers of Claro Colombia experienced an Internet disruption that lasted just over 30 minutes on August 6, with traffic falling two-thirds or more as compared to the prior week between 16:45 – 17:20 UTC. The disruption affected multiple ASNs owned by Claro, including AS10620, AS14080, and AS26611. (The Telmex Colombia and Comcel names shown in the graphs below are historical – Telmex and Comcel merged in 2012 and have operated under the Claro brand since then.) Claro did not acknowledge the disruption on social media, nor did it provide any explanation for it.
Pakistan
A near-complete outage at Pakistani backbone provider PTCL (AS17557) caused traffic from the network provider to drop 90% at 16:10 UTC (21:10 local time) on August 19. PTCL acknowledged the issue in a post on X, noting “We are currently facing data connectivity challenges on our PTCL and Ufone services.” Although they published a subsequent post several hours later after service was restored, they did not provide any additional information about the cause of the outage. However, one published report claimed “The disruption was primarily caused by a technical fault in PTCL’s fiber optic infrastructure.” while another report claimed “According to industry sources, the internet disruption in Pakistan may be connected to a technical fault in the fiber optic backbone or issues with main internet providers responsible for international online traffic.
Interestingly, traffic from PTCL to Cloudflare’s 1.1.1.1 DNS resolver spiked as the outage began, and the share of requests made over UDP grew from 94% to 99%. In addition, routing data shows that there was also a small drop in announced IPv4 address space coincident with the outage. However, these additional observations do not necessarily confirm a “technical fault in PTCL’s fiber optic infrastructure” as the ultimate cause of the disruption.
South Africa
To their credit, South African provider RSAWEB (AS37053)quickly acknowledged an issue with their FTTx and Enterprise connectivity on September 10, but neither their initial post nor subsequent updates provided any information on the cause of the problem. Whatever the cause, it resulted in a near-complete loss of Internet traffic from RSAWEB between 15:00 and 16:30 UTC (17:00 – 18:30 local time).
Routing data also shows a loss of just two announced /24 address blocks concurrent with the outage, dropping from 470 to 468. Unless all of RSAWEB’s outbound traffic was flowing through this limited amount of IP address space, it seems unusual that the withdrawal of just 512 IPv4 addresses from the=e routing table would have such a significant impact on the network’s traffic.
SpaceX Starlink
After experiencing a brief disruption in July due to a software failure, Starlink (AS14593) suffered another short disruption between 04:00-05:00 UTC on September 15. Although Starlink generally acknowledges disruptions to their global network on their X account, and often providing a root cause, in this case they apparently published an acknowledgement on X, but deleted it after the issue was resolved. In addition to the drop in traffic, we observed a concurrent drop in announced IPv4 address space and spike in BGP announcements (likely withdrawals), suggesting that the disruption may have been caused by a network-related issue.
Conclusion
The recent launch of regional traffic insights on Radar brings yet another perspective to our ability to investigate observed Internet traffic anomalies. We can now drill down at regional and network levels, as well as exploring the impact across DNS traffic, connection bandwidth and latency, TCP connection tampering, and announced IP address space, helping us understand the impact of such events. And while these blog posts feature graphs from Radar and the Radar Data Explorer, the underlying data is available from our rich API. You can use the API to retrieve data to do your own local monitoring or analysis, or the Radar MCP server to incorporate Radar data into your AI tools.
In 2025, Generative AI is reshaping how people and companies use the Internet. Search engines once drove traffic to content creators through links. Now, AI training crawlers — the engines behind commonly-used LLMs — are consuming vast amounts of web data, while sending far fewer users back. We covered this shift, along with related trends and Cloudflare features (like pay per crawl) in early July. Studies from Pew Research Center (1, 2) and Authoritas already point to AI overviews — Google’s new AI-generated summaries shown at the top of search results — contributing to sharp declines in news website traffic. For a news site, this means lots of bot hits, but far fewer real readers clicking through — which in turn means fewer people clicking on ads or chances to convert to subscriptions.
Cloudflare’s data shows the same pattern. Crawling by search engines and AI services surged in the first half of 2025 — up 24% year-over-year in June — before slowing to just 4% year-over-year growth in July. How is the space evolving? Which crawling purposes are most common, and how is that changing? Spoiler: training-related crawling is leading the way. In this post, we track AI and search bot crawl activity, what purposes dominate, and which platforms contribute the least referral traffic back to creators.
Key takeaways
Training crawling grows: Training now drives nearly 80% of AI bot activity, up from 72% a year ago.
Publisher referrals drop: Google referrals to news sites fell, with March 2025 down ~9% compared to January.
AI & search crawling increase: Crawling rose 32% year-over-year in April 2025, before slowing to 4% year-over-year growth in July.
AI-only crawler shifts: OpenAI’s GPTBot more than doubled in share of AI crawling traffic (4.7% to 11.7%), Anthropic’s ClaudeBot rose (6% to ~10%), while ByteDance’s Bytespider fell from 14.1% to 2.4%.
Crawl-to-refer imbalance (how many pages a bot crawls per page that a user clicks back to): Anthropic increased referrals but still leads with 38,000 crawls per visitor in July (down from 286,000:1 in January). Perplexity decreased referrals in 2025 — with more crawling but fewer referrals at 194 crawls per visitor in July.
Referral traffic from search is already shifting, as we noted above and as studies have shown. In our dataset of news-related customers (spanning the Americas, Europe, and Asia), Google’s referrals have been clearly declining since February 2025. This drop is unusual, since overall Internet traffic (and referrals as well) historically has only dipped during July and August — the summer months when the Northern Hemisphere is largely on break from school or work. The sharpest and least seasonal decline came in March. Despite being a 31-day month, March had almost the same referral volume as the shorter, 28-day February.
Looking at longer comparisons: March 2025 referral traffic from Google was 9% lower than January, the same drop seen in June. April was worse, down 15% compared with January.
This drop seems to coincide with some of Google’s changes. AI Overviews launched in the U.S. in May 2024, but in March 2025, Google upgraded AI Overviews with Gemini 2.0, introduced AI Mode in Labs, and expanded Overviews to more European countries. By May 2025, AI Mode rolled out broadly in the U.S. with Gemini 2.5, adding conversational search, Deep Search, and personalized recommendations.
The search-to-news site pipeline seems to be weakening, replaced in part by AI-driven results.
Looking at a daily perspective, we can also spot a clear U.S.-election-related peak in referrals from Google to the cohort of known news sites on November 5–6, 2024.
AI and search crawling: spring surge (+24%), summer slowdown
In June, we talked about search and AI crawler growth, and our picture of the trend is now more complete with more data. To focus only on AI and search crawlers, and to remove the bias of customer growth, we analyzed a fixed set of customers from specific weeks, a method we’ve also used in the Cloudflare Radar Year in Review.
What the data shows: crawling spiked twice: first in November 2024, then again between March and April 2025. April 2025 alone was up 32% compared with May 2024, the first full month where we have comparable data. After that surge, growth stabilized. In June 2025, crawling traffic was still 24% higher year-over-year, but by July the increase was down to just 4%. That shift highlights how quickly crawler activity can accelerate and then cool down.
As the chart below shows, crawling traffic rose sharply in March and April. It remained high but slightly lower in May, before starting to drop in June. The seasonal dip is similar to what we see in overall Internet traffic during the Northern Hemisphere’s summer months (August and September are often the quietest), though in the case of crawlers, this is likely due to reduced overall web activity rather than bots themselves taking a “break.” Historically, activity tends to rise again in November — as it did in 2024 for AI and search bot traffic — when people spend more time online for shopping and seasonal habits (a pattern we’ve seen in past years).
Googlebot is still the anchor, accounting for 39% of all AI and search crawler traffic, but the fastest growth now comes from AI-specific crawlers, though bots related to Amazon and ByteDance (Bytespider) have lost significant ground. GPTBot’s share grew from 4.7% in July 2024 to 11.7% in July 2025. ClaudeBot also increased, from 6% to nearly 10%, while Meta’s crawler jumped from 0.9% to 7.5%. By contrast, Amazonbot dropped from 10.2% to 5.9%, and ByteDance’s Bytespider dropped from 14.1% to just 2.4%.
The table below shows how market shares have shifted between July 2024 and July 2025:
Bot name
% share July 2024
% share July 2025
Δ percentage-point change
1
Googlebot
37.5
39
1.5
2
GPTBot
4.7
11.7
7
3
ClaudeBot
6
9.9
3.9
4
Bingbot
8.7
9.3
0.6
5
Meta-ExternalAgent
0.9
7.5
6.5
6
Amazonbot
10.2
5.9
-4.3
7
Googlebot-Image
4.1
3.3
-0.8
8
Yandex
5
2.9
-2.1
9
GoogleOther
4.6
2.7
-1.8
10
Bytespider
14.1
2.4
-11.6
11
Applebot
1.8
1.5
-0.3
12
ChatGPT-User
0.1
0.9
0.9
13
OAI-SearchBot
0
0.9
0.9
14
Baiduspider
0.5
0.5
0
15
Googlebot-Mobile
0.2
0.4
0.2
AI-only crawlers: OpenAI rises, ByteDance falls
Looking only at AI bot traffic (as tracked on our Radar AI page), the trend is clear. Since January 2025, GPTBot has steadily increased its crawling volume, driven mainly by training-related activity. ClaudeBot crawling accelerated in June, while Amazonbot and Bytespider activity slowed.
The chart below shows how GPTBot surged over the past 12 months, overtaking Amazonbot and Bytespider, which both fell sharply:
A comparison between July 2024 and July 2025 makes the shift even more obvious. GPTBot gained 16 percentage points, Meta’s crawler rose by more than 15, and ClaudeBot grew by 8. On the shrinking side, Amazonbot dropped 12 percentage points and Bytespider dropped over 31 percentage points.
AI-only bots
July 2024 %
July 2025 %
Δ percentage-point change
1
GPTBot
11.9
28.1
16.1
2
ClaudeBot
15
23.3
8.3
3
Meta-ExternalAgent
2.4
17.7
15.3
4
Amazonbot
26.4
14.1
-12.3
5
Bytespider
37.3
5.8
-31.5
6
Applebot
4.9
3.7
-1.2
7
ChatGPT-User
0.2
2.4
2.2
8
OAI-SearchBot
0
2.2
2.2
9
TikTokSpider
0
0.7
0.7
10
imgproxy
0
0.7
0.7
11
PerplexityBot
0
0.4
0.4
12
Google-CloudVertexBot
0
0.3
0.3
13
AI2Bot
0
0.2
0.2
14
Timpibot
0.6
0.1
-0.5
15
CCBot
0.1
0.1
0
We covered the functionality of these bots in our June blog post.
Crawling by purpose: training dominates
Training is the clear leader. (We classify purpose based on operator disclosures and industry sources, a method we explained in this AI Week blog.) Over the past 12 months, 80% of AI crawling was for training, compared with 18% for search and just 2% for user actions. In the last six months, the share for training rose further to 82%, while search dropped to 15% and user actions increased slightly to 3%.
The chart below shows how training-related crawling steadily grew over the past year, far outpacing other purposes:
The year-over-year comparison reinforces this trend. In July 2024, training accounted for 72% of AI crawling. By July 2025, it had risen to 79%. Over the same period, search fell from 26% to 17%, while user actions grew modestly from 2% to 3.2%.
Crawl-to-refer ratios shifts: tens of thousands of bot crawls per human click
The crawl-to-refer ratio measures how many pages a platform crawls compared with how often it drives users to a website. In practice, a high ratio means heavy crawling but little referral traffic. For example, for every visitor Anthropic refers back to a website, its crawlers have already visited tens of thousands of pages.
Why does this metric matter? It highlights the imbalance between how much content AI systems consume and how little traffic they return. For publishers, it can feel like giving away the raw material for free. With that in mind, here’s how different platforms compare from January to July 2025.
Anthropic remains the most crawl-heavy platform. Even after an 87% decline this year, it still crawled 38,000 pages for every referred page visit in July 2025 — the highest imbalance among major AI players. Referrals may be improving, though, after Anthropic added web search to Claude in March 2025 (initially for U.S. paid users) and expanded it globally by May to all users, including the free tier. The feature introduced direct citations with clickable URLs, creating new referral pathways.
The full dataset is below, showing January–July 2025 ratios by platform ordered by the highest ratio average:
(Note: a rising ratio means more bot crawling per human click sent back, while a falling ratio means less bot crawling per human click sent back)
Anthropic recorded the steepest decrease in bot to human traffic, down 86.7%. From 286,930 bots per human in January, to 38,065 bots per human in July, the change shows a dramatic increase in referrals. Despite the change, it remains by far the most crawl-heavy platform, with tens of thousands of pages still crawled for every referral.
Perplexity moved in the opposite direction, with bot crawling increasing +256.7% relative to human visitors; climbing from 54 bots per human in January to 195 bots per human in July. While the ratio is still far below Anthropic, the increase shows it is crawling more heavily, relative to the traffic it refers, than it did earlier.
OpenAI ratio dropped slightly, from 1,217 bots per human in January to 1,091 in July (-10%). The shift is smaller than Anthropic’s but suggests OpenAI is sending a bit more referral traffic relative to its crawling.
Microsoft stayed steady, with its ratio moving only slightly, from 38.5 bots per human in January to 40.7 in July (+6%). This consistency suggests stable behavior from Bing-linked services.
Yandex increased from 15.5 bots per human in January to 21.4 in July (+38%). The overall ratio is far smaller than Anthropic’s or Perplexity’s, but it shows Yandex is crawling more heavily relative to the traffic it sends back.
Alongside measuring crawling volumes and referral traffic (now also visible on the AI Insights page of Cloudflare Radar), it’s worth looking at whether AI operators follow good practices when deploying their bots. Cloudflare data shows that most leading AI crawlers are on our verified bots list, meaning their IP addresses match published ranges and they respect robots.txt. But adoption of newer standards like WebBotAuth — which uses cryptographic signatures in HTTP messages to confirm a request comes from a specific bot, and is especially relevant today — is still missing.
Google, Meta, and OpenAI run distinct bots for different purposes, while Anthropic lags in verification. That makes it easier for bad actors to spoof its crawler and ignore robots.txt, since without verification, it’s hard to distinguish real from fake traffic — leaving its compliance effectively unclear. (A longer list of AI bots is available here).
Conclusion and what’s next
If training-related crawling continues to dominate while referrals stay flat, creators face a paradox: feeding AI systems without gaining traffic in return. Many want their content to appear in chatbot answers, but without monetization or cooperation, the incentive to produce quality work declines.
The Web now stands at a fork in the road. Either a new balance emerges — one where the new AI era helps sustain publishers and creators — or AI turns the open web into a one-way training set, extracting value with little flowing back.
You can learn more about some of these data trends on Cloudflare Radar’s updated AI Insights page.
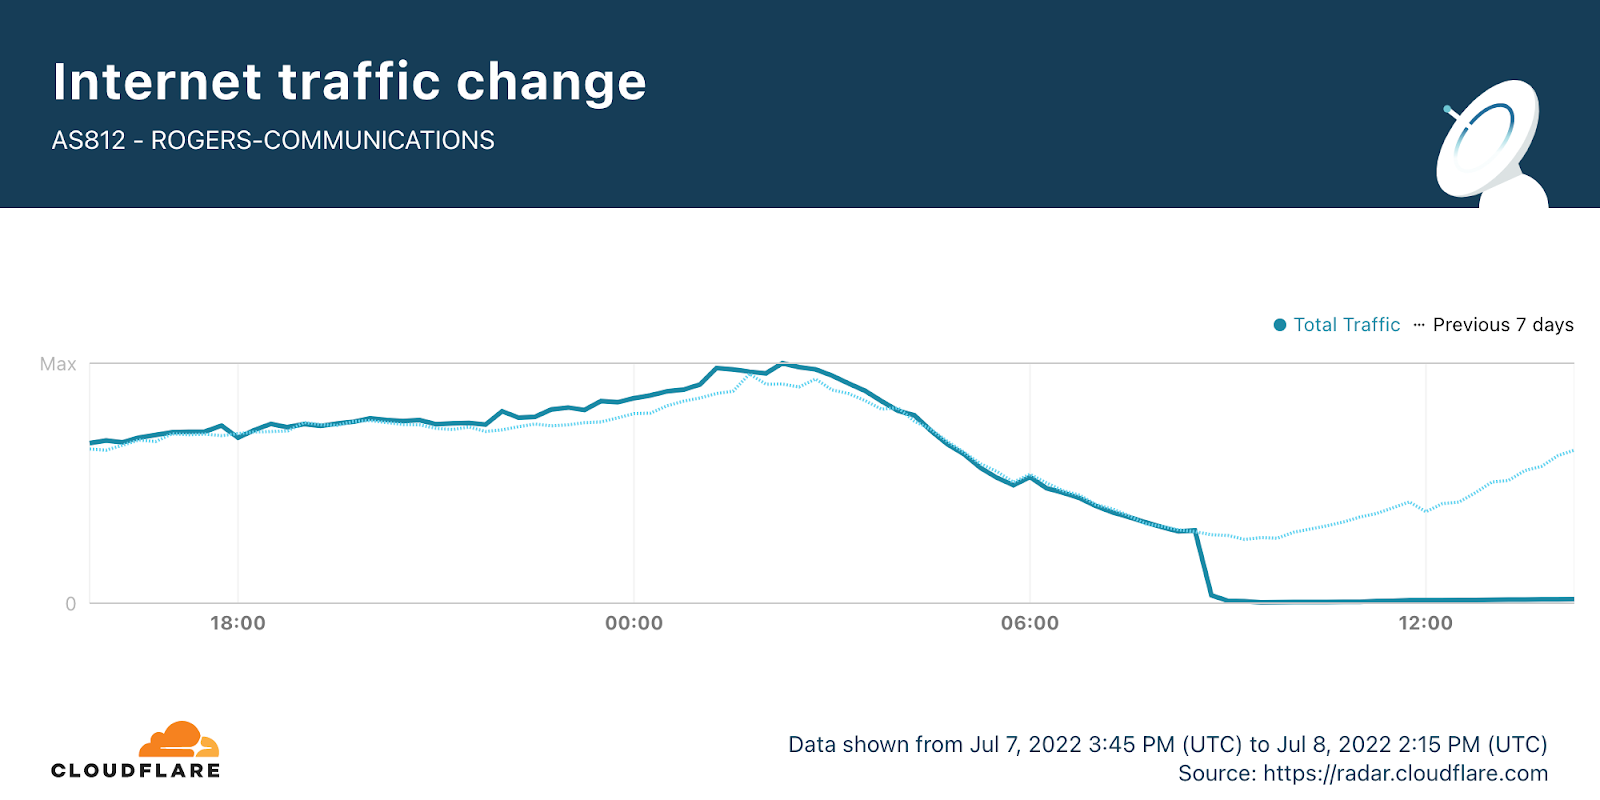
An outage at one of the largest ISPs in Canada, Rogers Communications, started earlier today, July 8, 2022, and is ongoing (eight hours and counting), and is impacting businesses and consumers. At the time of writing, we are seeing a very small amount of traffic from Rogers, but we are only seeing residual traffic, and nothing close to a full recovery to normal traffic levels.
Based on what we’re seeing and similar incidents in the past, we believe this is likely to be an internal error, not a cyber attack.
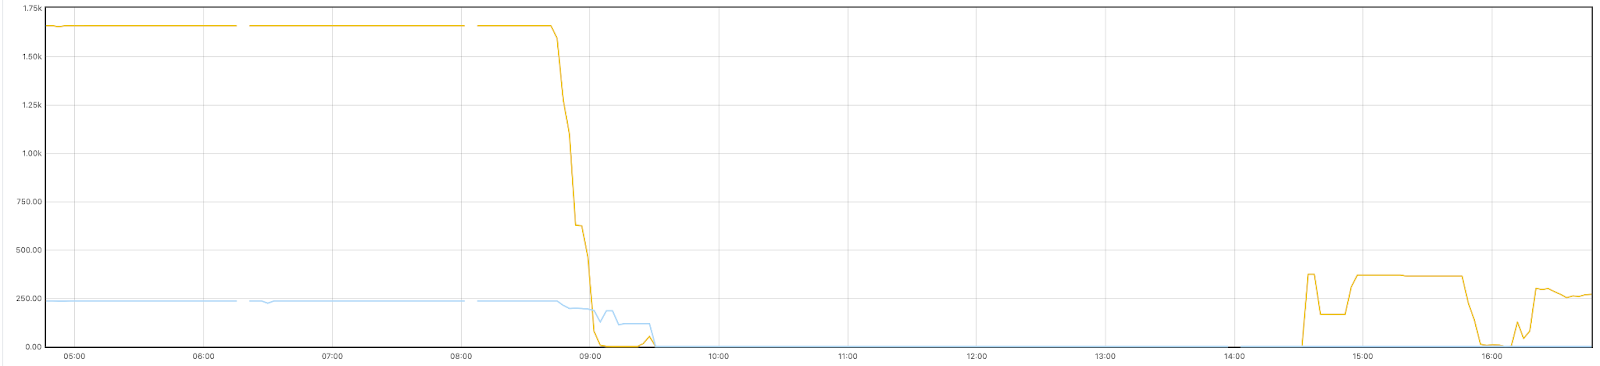
Cloudflare Radar shows a near complete loss of traffic from Roger’s ASN, AS812, that started around 08:45 UTC (all times in this blog are UTC).
What happened?
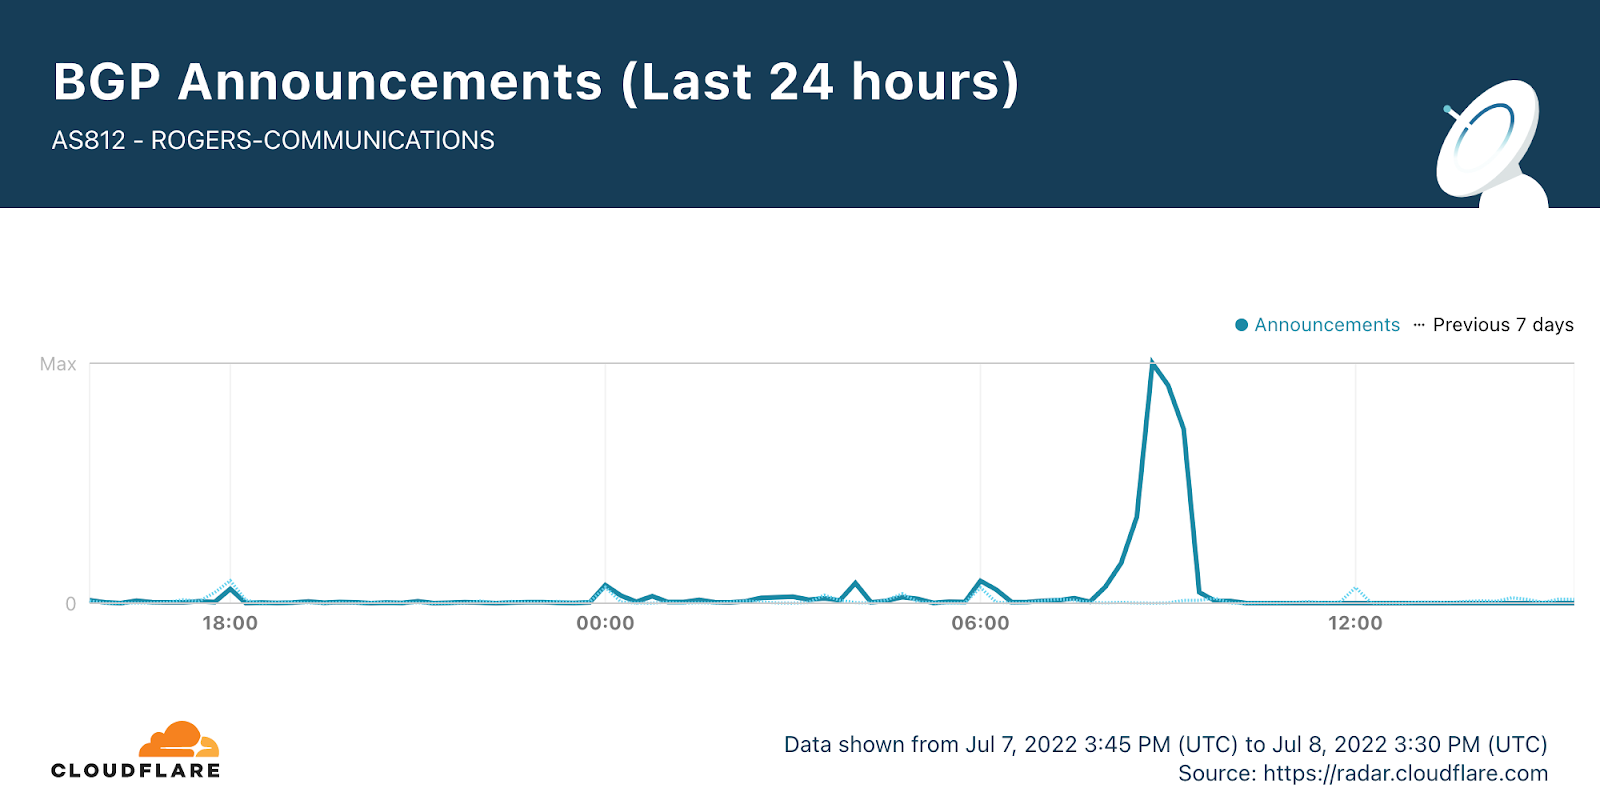
Cloudflare data shows that there was a clear spike in BGP (Border Gateway Protocol) updates after 08:15, reaching its peak at 08:45.
BGP is a mechanism to exchange routing information between networks on the Internet. The big routers that make the Internet work have huge, constantly updated lists of the possible routes that can be used to deliver each network packet to its final destination. Without BGP, the Internet routers wouldn’t know what to do, and the Internet wouldn’t exist.
The Internet is literally a network of networks, or for the maths fans, a graph, with each individual network a node in it, and the edges representing the interconnections. All of this is bound together by BGP. BGP allows one network (say Rogers) to advertise its presence to other networks that form the Internet. Rogers is not advertising its presence, so other networks can’t find Roger’s network and so it is unavailable.
A BGP update message informs a router of changes made to a prefix (a group of IP addresses) advertisement or entirely withdraws the prefix. In this next chart, we can see that at 08:45 there was a withdrawal of prefixes from Roger’s ASN.
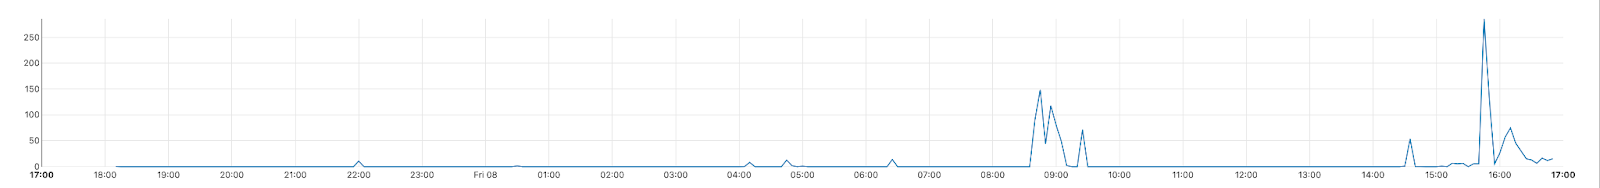
Since then, at 14:30, attempts seem to be made to advertise their prefixes again. This maps to us seeing a slow increase in traffic again from Rogers’ end users.
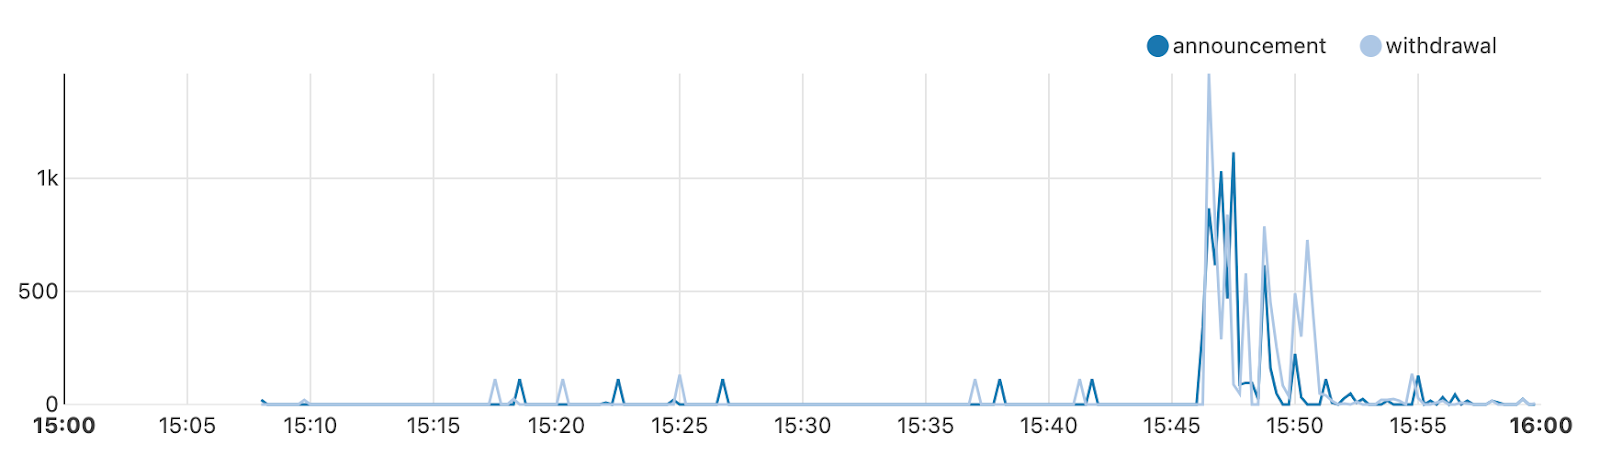
The graph below, which shows the prefixes we were receiving from Rogers in Toronto, clearly shows the withdrawal of prefixes around 08:45, and the slow start in recovery at 14:30, with another round of withdraws at around 15:45.
Outages happen more regularly than people think. This week we did an Internet disruptions overview for Q2 2022 where you can get a better sense of that, and on how collaborative and interconnected the Internet (the network of networks) is. And not so long ago Facebook had an hours long outage where BGP updates showed Facebook itself disappearing from the Internet.
Follow @CloudflareRadar on Twitter for updates on Internet disruptions as they occur, and find up-to-date information on Internet trends using Cloudflare Radar.
“I declare before you all that my whole life, whether it be long or short, shall be devoted to your service and the service of our great imperial family to which we all belong.” — Queen Elizabeth II birthday speech, April 21, 1947
When Elizabeth II’s reign started, on February 6, 1952 (the coronation was on June 2, 1953), the Turing machine had already been proposed (1936), and with that the basis for computer science. ARPANET, which became the technical foundation of the Internet, was still a dream that came to fruition in the late 60s — the World Wide Web is from 1989 and in 2014 we celebrated its Silver Jubilee. So, with that in mind, let’s answer the question: did the 2022 celebrations of the first British monarch with a 70th anniversary on the throne have an impact on the UK’s Internet traffic?
First, some details about the Platinum Jubilee. There was a four-day bank holiday (June 2-5) in the UK for the celebration that included parades and pageants, and several ceremonies. There was a Big Jubilee Lunch in many communities on Sunday, June 5, and more than 16,000 street parties (pubs and bars were also allowed to stay open for extra two hours). In events like these, not only there’s a lot to do outside, but also to see on the television and that impacts the Internet — we saw it during the Eurovision 2022 final.
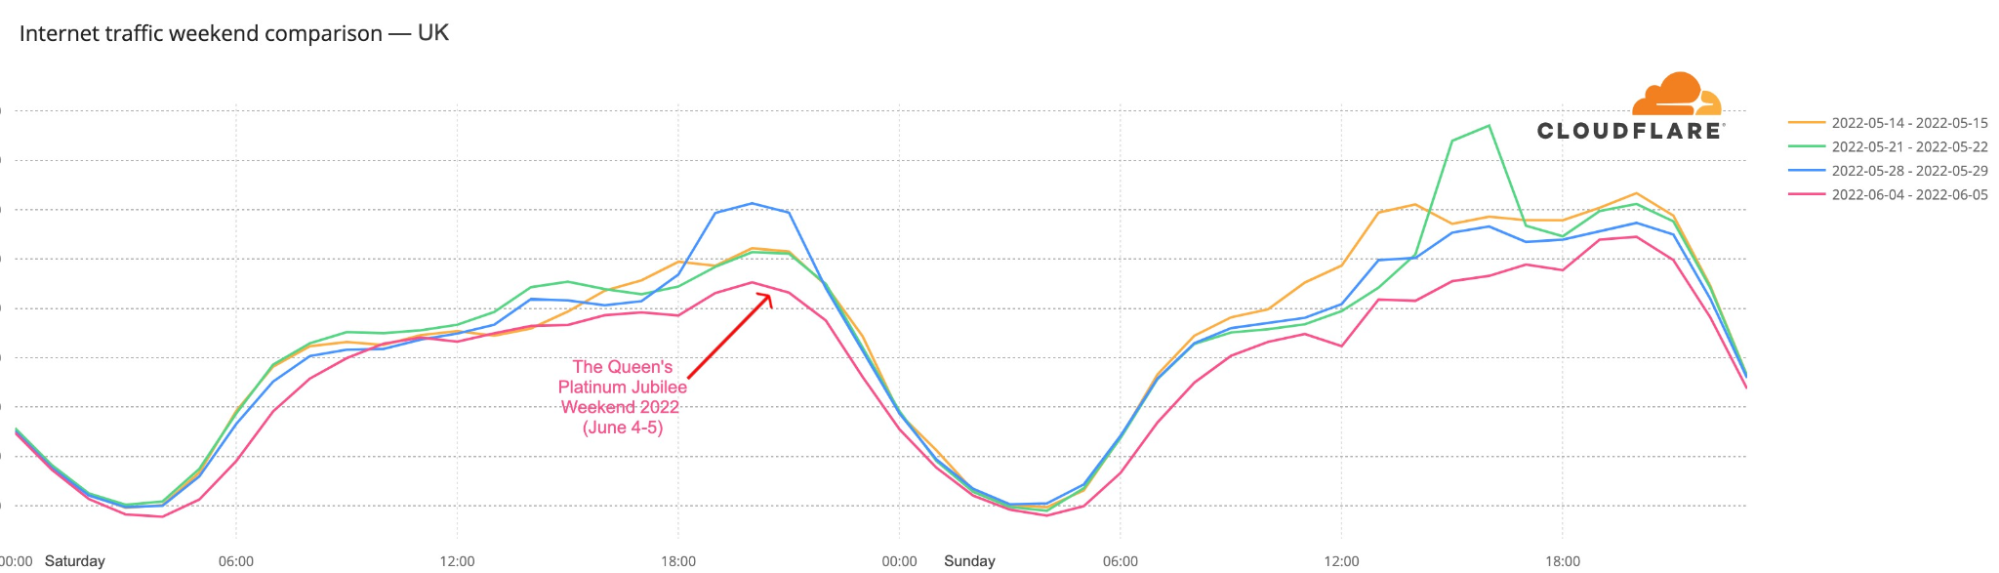
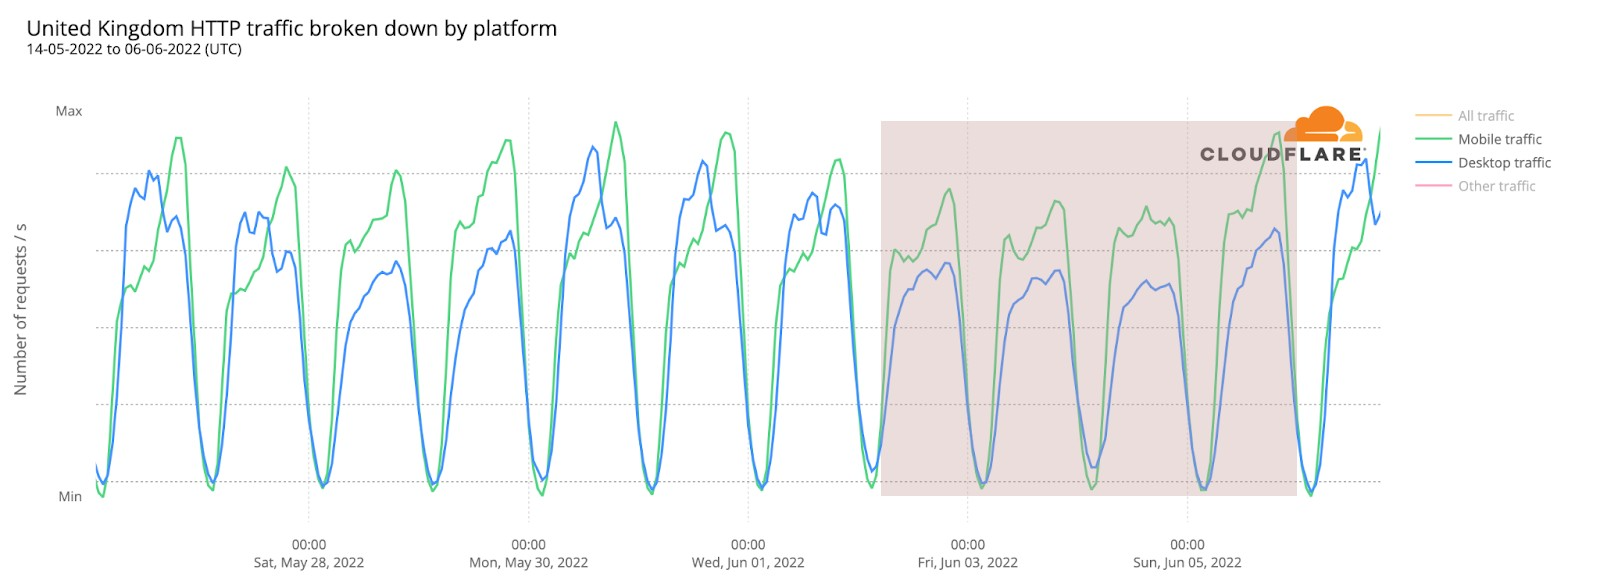
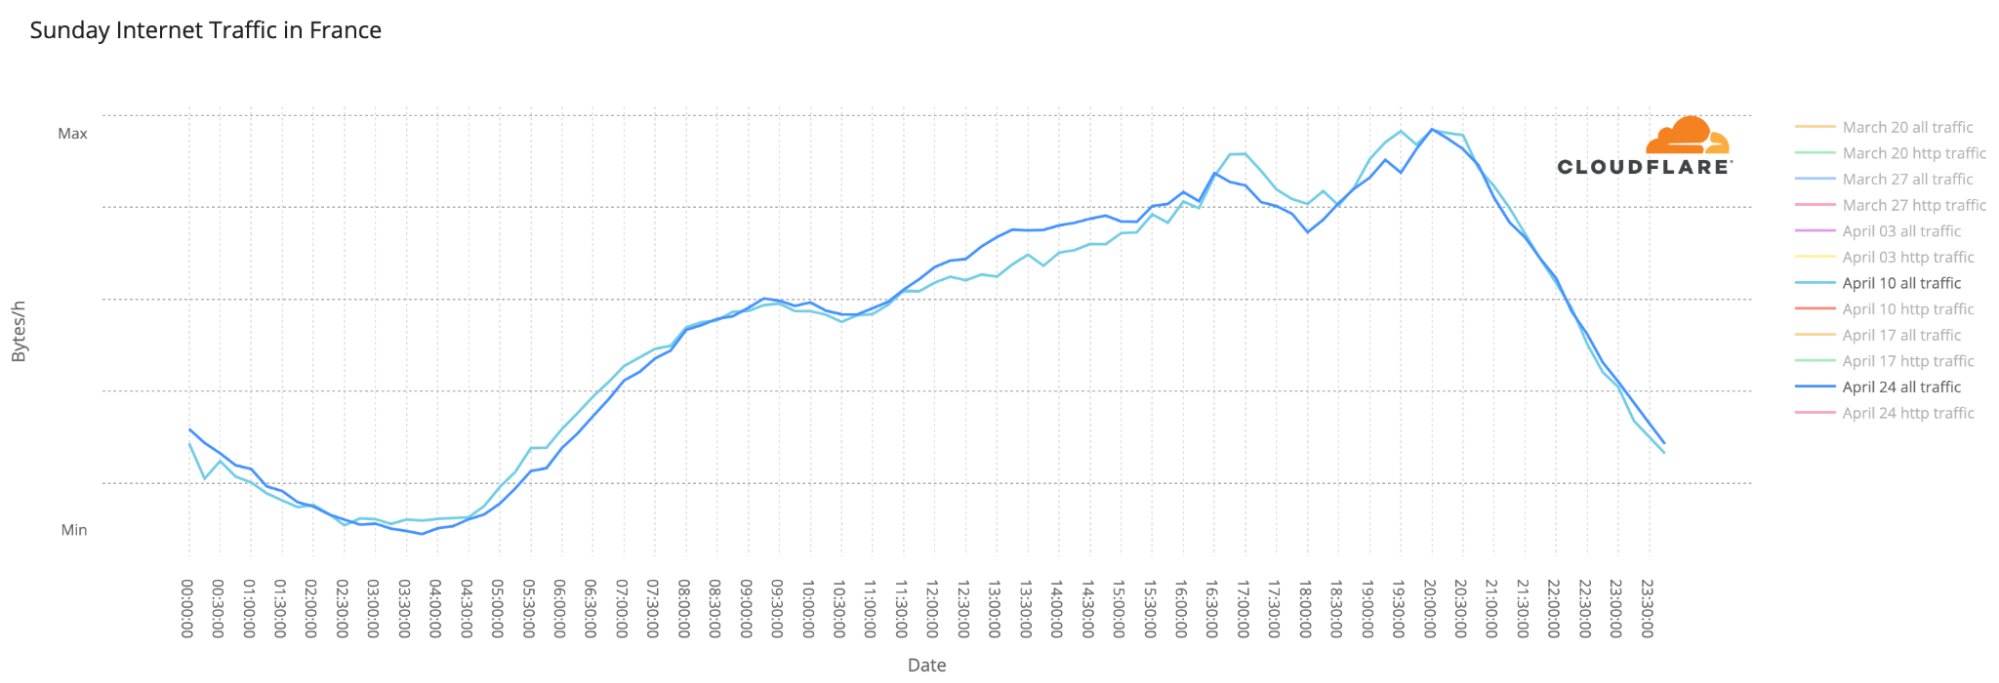
Looking at Cloudflare Radar’s data from the UK, we can see that this past weekend clearly had less Internet traffic compared to recent weekends, so people were less online during the daytime, when the Jubilee was being celebrated. Here’s the chart with the previous four weekends of the UK’s Internet traffic:
That lower traffic trend is most clear on Saturday, June 4, at 20:00 local time, when traffic was 23% lower than on the previous Saturday, and on Sunday, June 5, at 15:00, when traffic was 25% lower than on the previous Sunday. The weather was actually sunnier on the previous weekend, May 28-29, but people did seem to have many reasons (related to the Jubilee) to go outside or at least be less online.
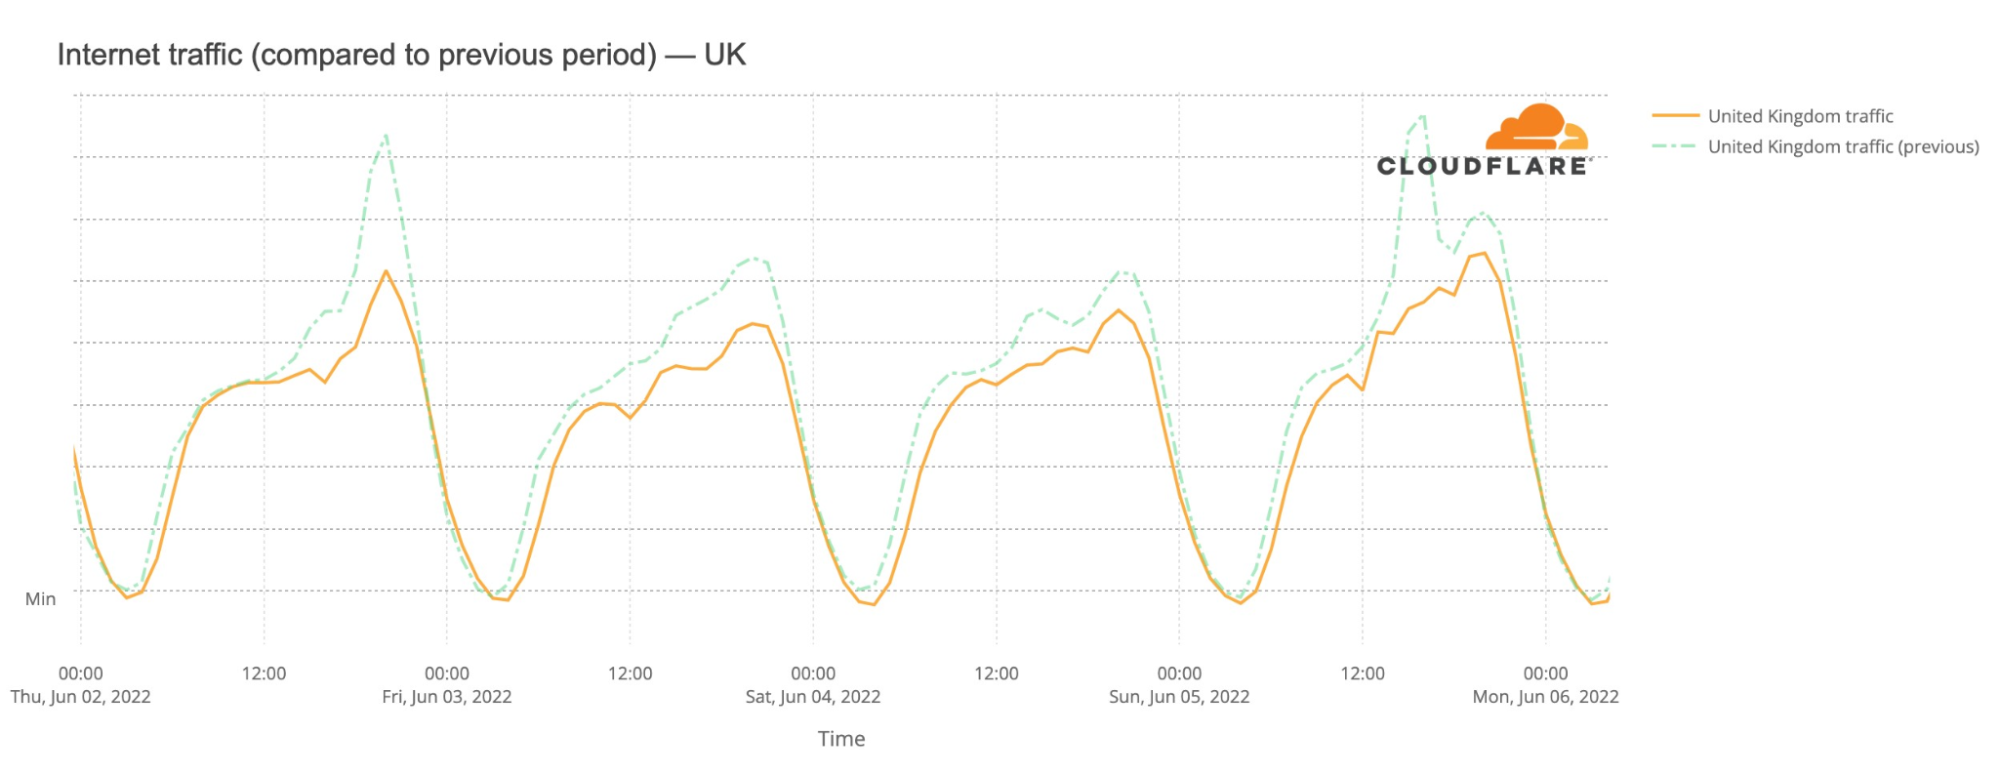
Looking at the full picture of when the four-day bank holiday started, Thursday, June 2, 2022, until Sunday, June 5, there’s a clear trend of less traffic through all of those days, which is not unusual, at least for Thursday and Friday, considering that holidays usually have traffic more similar to weekends than weekdays.
No surprise, when there’s a holiday, or it’s the weekend people tend to use their mobile devices more to access the Internet, and that was clearly what we saw in the UK since Thursday, June 2, mobile traffic (green line) was always prevalent compared to desktop traffic (blue line) since then.
On the weekdays before June 2, we can see that Internet traffic by mobile devices only stands out after 18:00 (before that, with people working, desktop took the lead).
From Canada to New Zealand
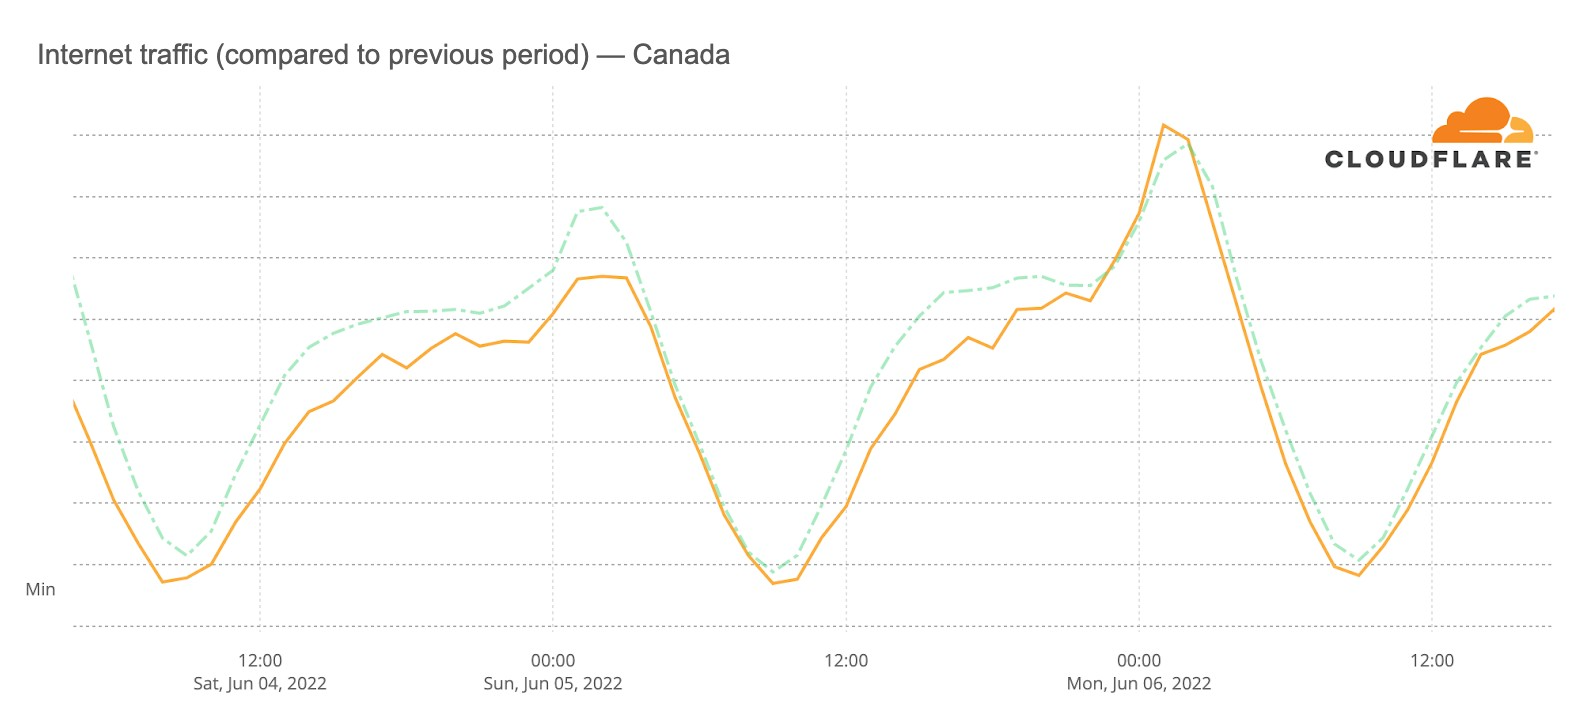
There are several other commonwealth countries that also had relevant events to celebrate since June 2 and through the past weekend for the Queen’s Platinum Jubilee. Canada is one with several activities throughout the country, including free admission to museums and historic sites, park parties and concerts.
Related to the Jubilee celebrations or not, Internet traffic in Canada was lower this past weekend than in the previous one. Saturday, June 4, at 22:00 in Toronto traffic was 13% lower than in the previous period, and throughout the day that was also the case. On Sunday, traffic was only lower during daytime, especially around 12:00 in Toronto, when it was 15% lower than in the previous Sunday. That was the time of the Jubilee Pageant, in central London (in the next charts, times are in UTC).
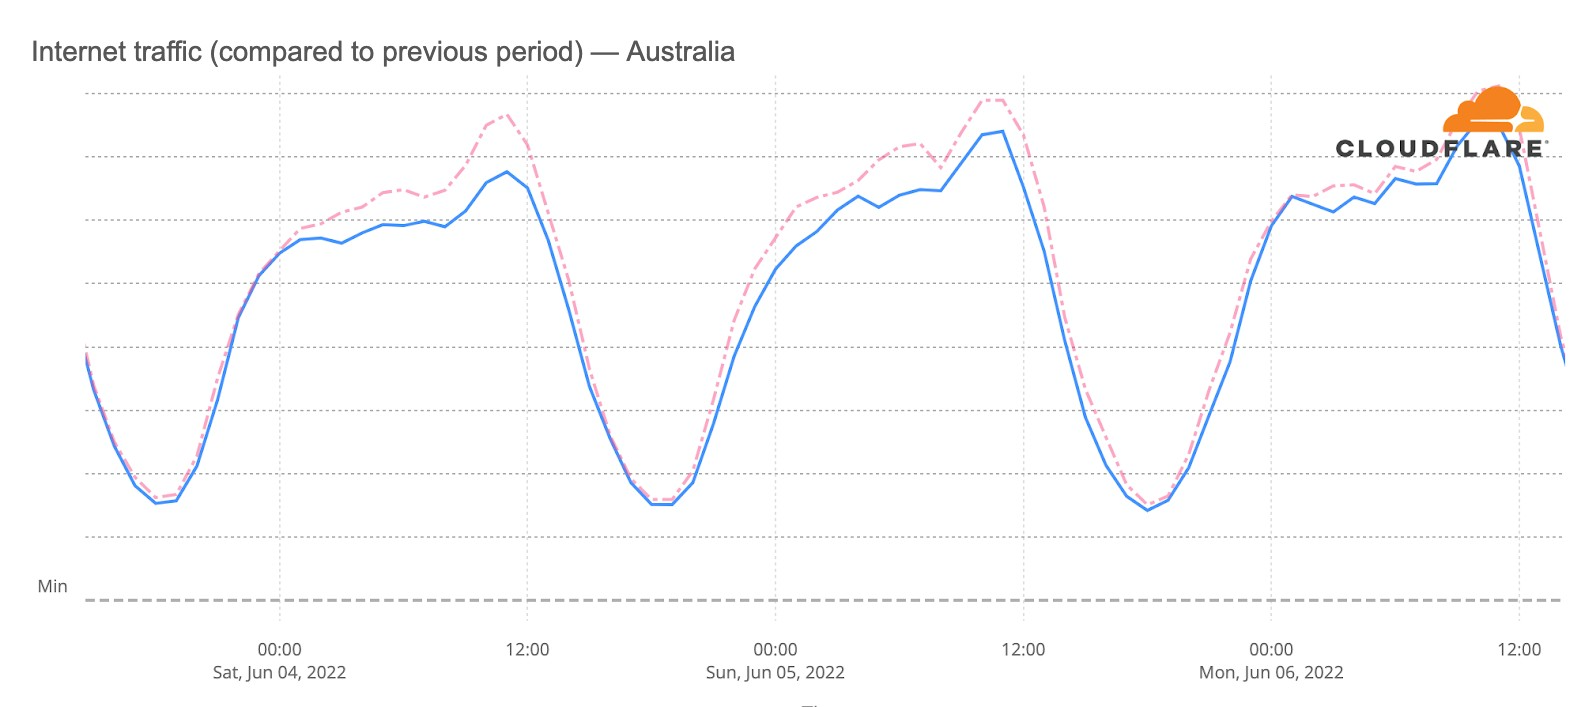
Something similar can be seen in terms of lower traffic this weekend in Australia:
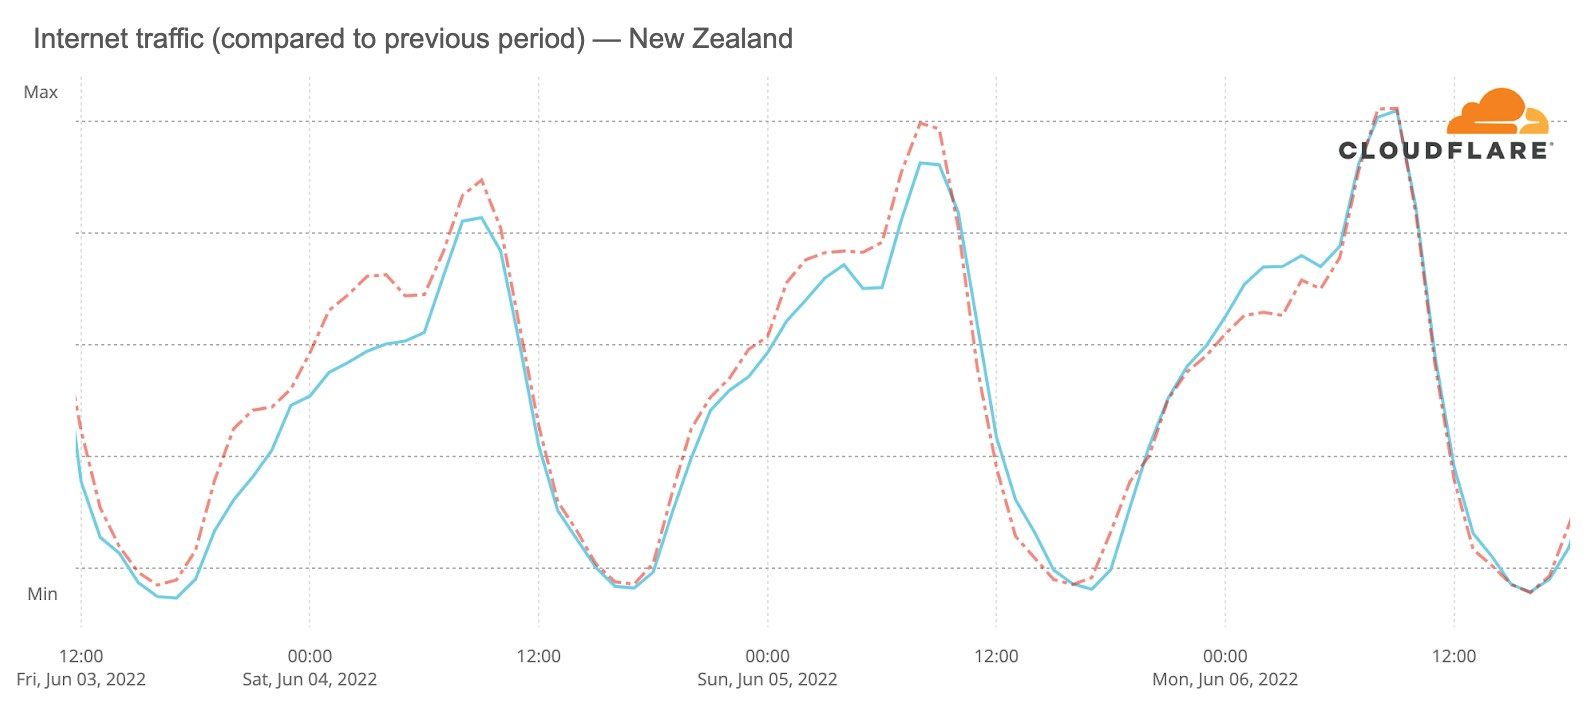
And also New Zealand:
Royal family and news websites (Boris Johnson’s no confidence vote included)
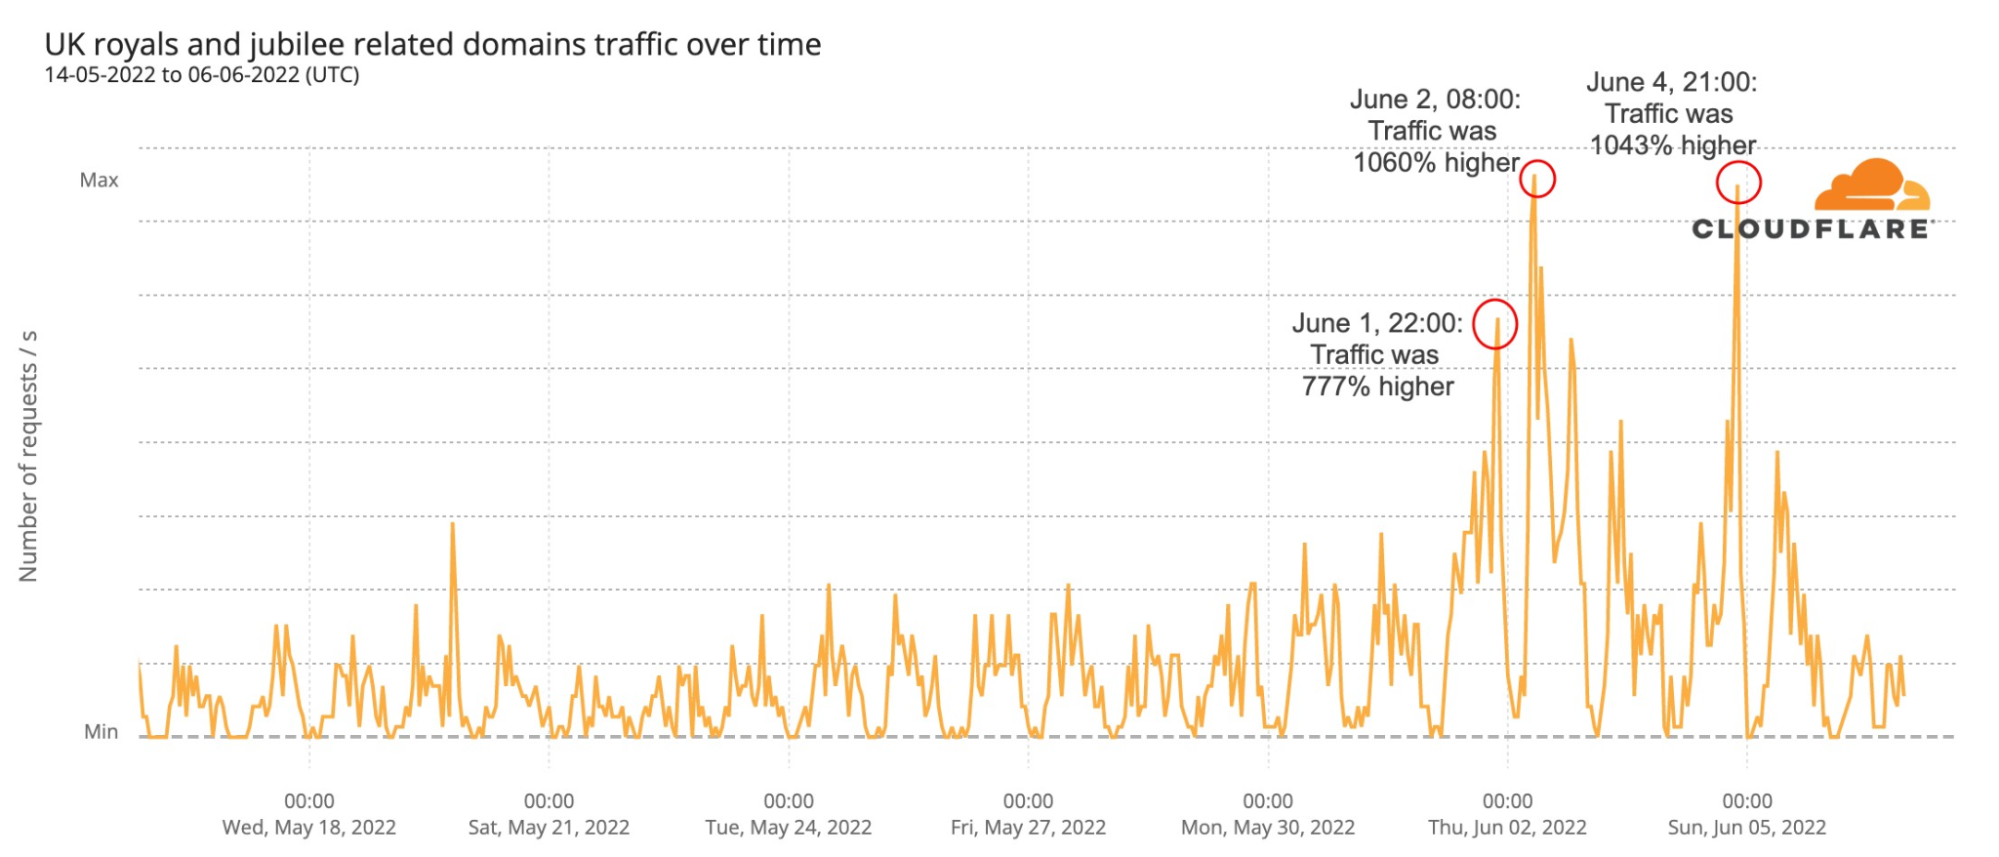
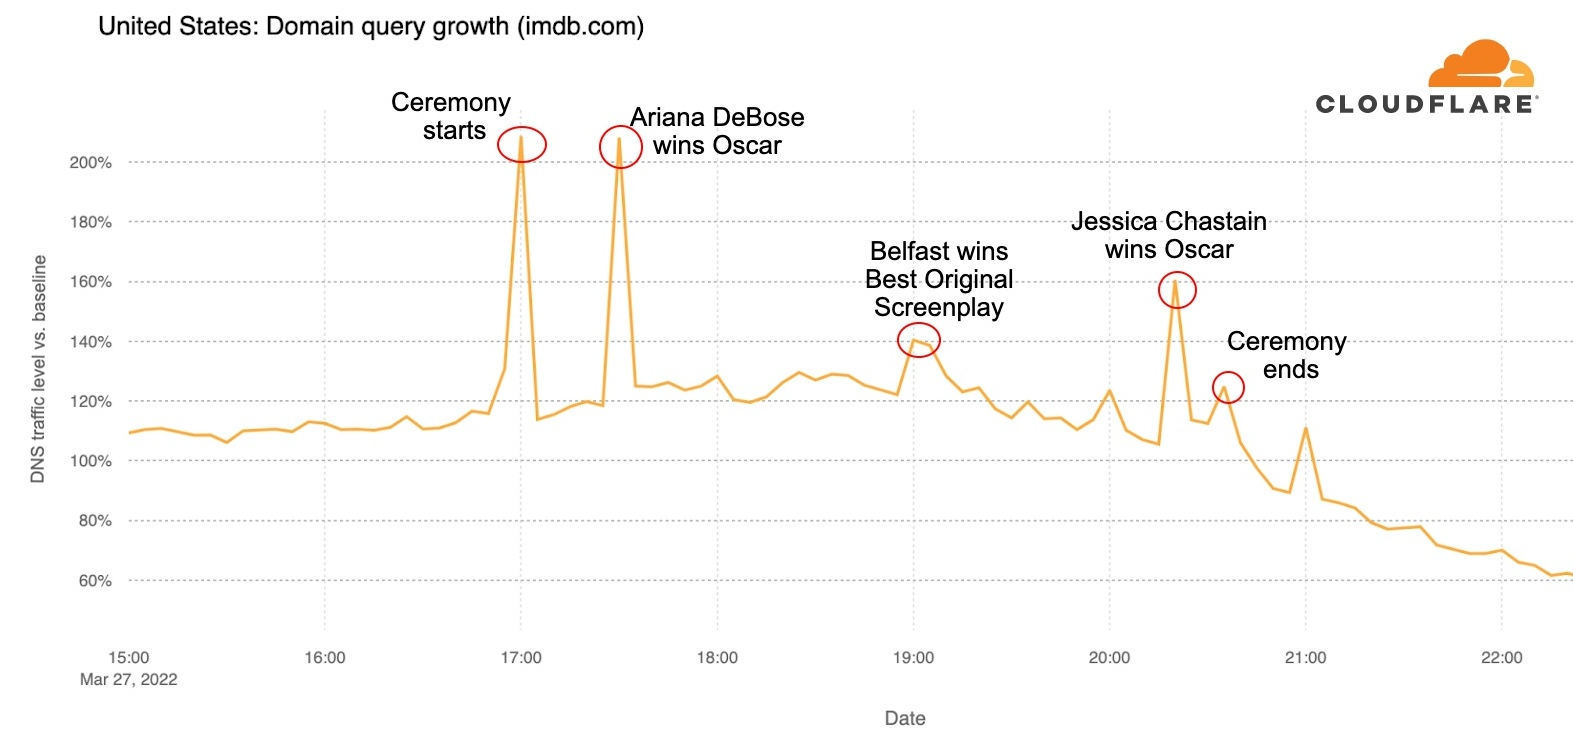
Here we’re looking at DNS request trends to get a sense of traffic to Internet properties. First, we can see that websites concerning the UK Royal family and the Jubilee were clearly seeing more traffic after Wednesday, June 1 (the day before the four-day bank holiday). The three biggest spikes were: Wednesday evening, when traffic was 777% higher at 22:00 (compared to the previous week); the next morning (08:00), when it rose 1060%; and on Saturday evening (21:00) it got 1043% more traffic.
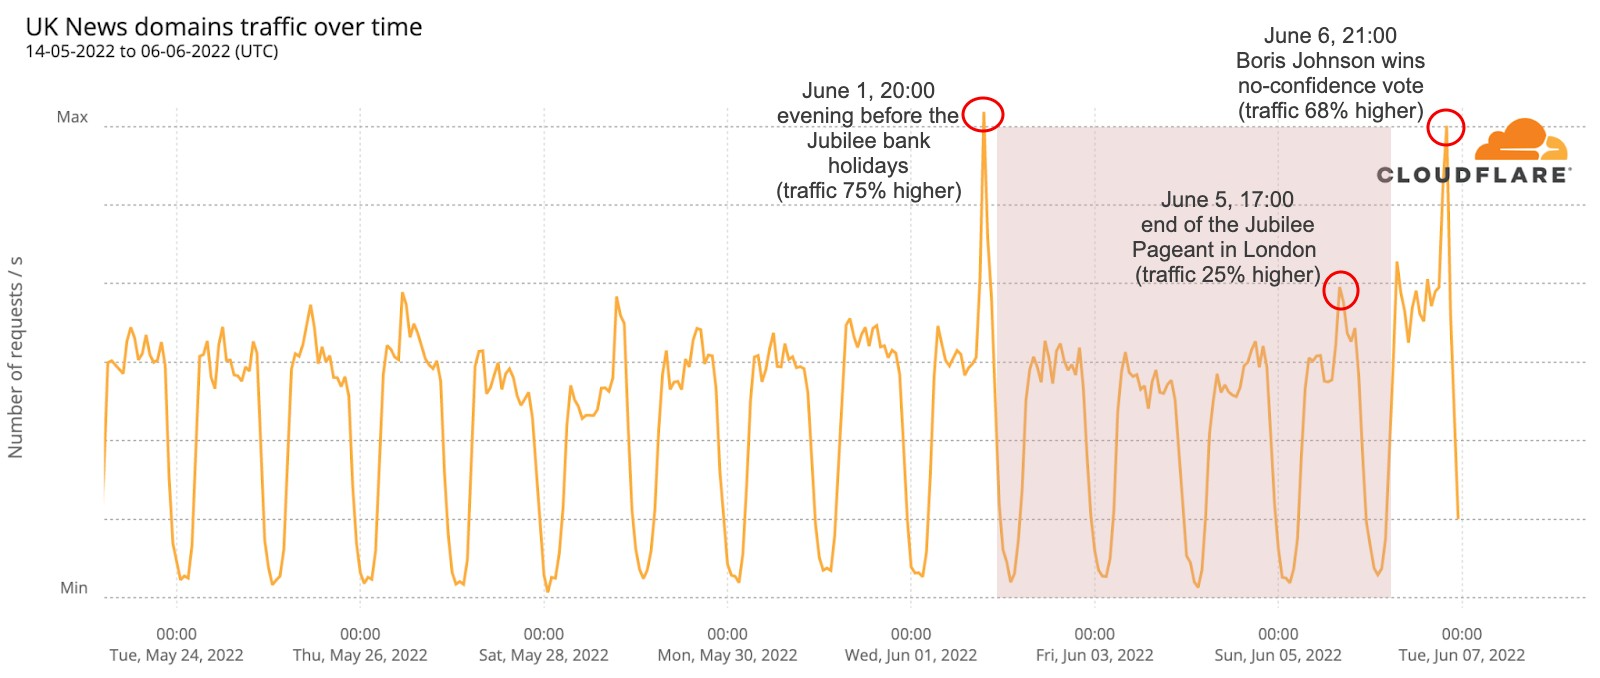
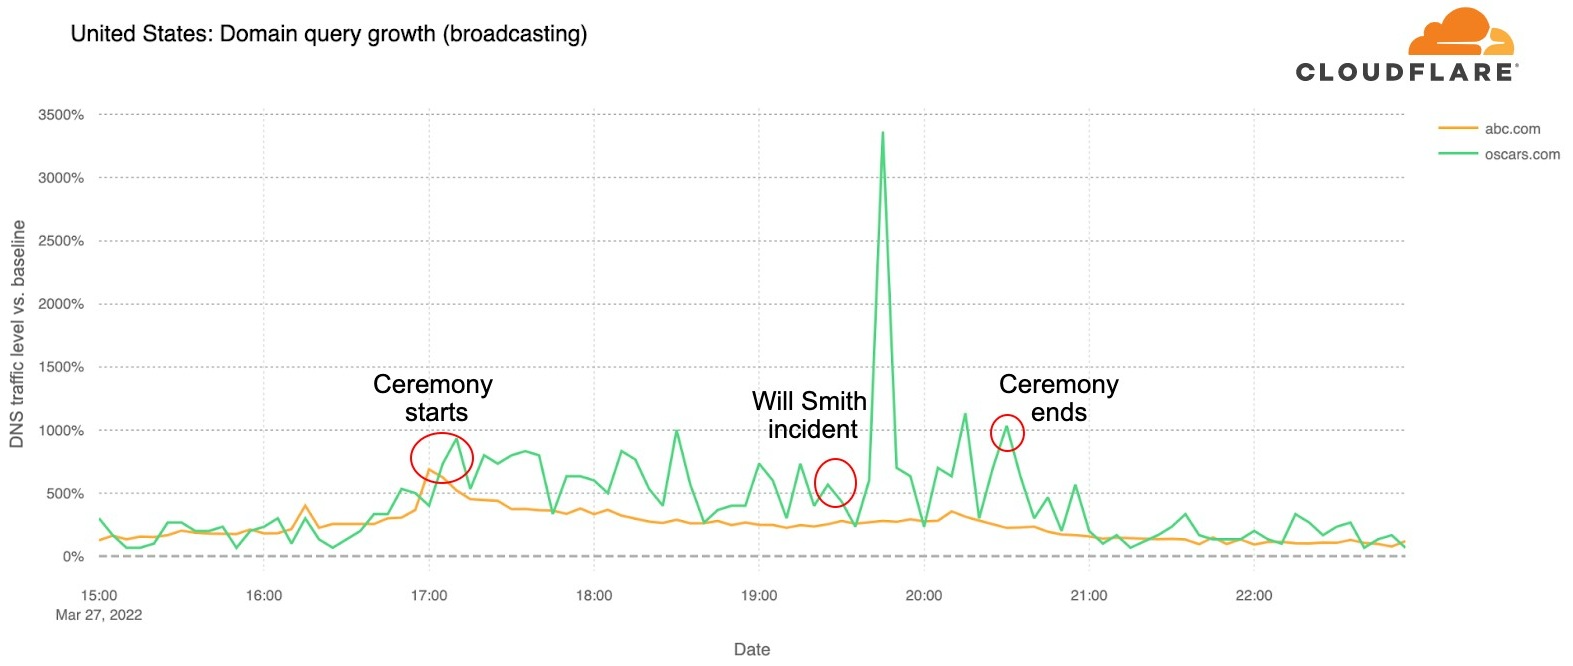
UK-based news websites (TV broadcasters and newspapers) also covered Queen Elizabeth II’s Platinum Jubilee extensively over the extended weekend. And there are three big highlights/spikes from the past few days regarding media outlets’ websites, but only two seem to be related to the Jubilee or the bank holidays.
We can see that the biggest spike in traffic (75% more than the previous period) was the night before the Jubilee four-day bank holiday started. Then, Sunday afternoon when the London Jubilee Pageant was ending, there was another spike (25% higher).
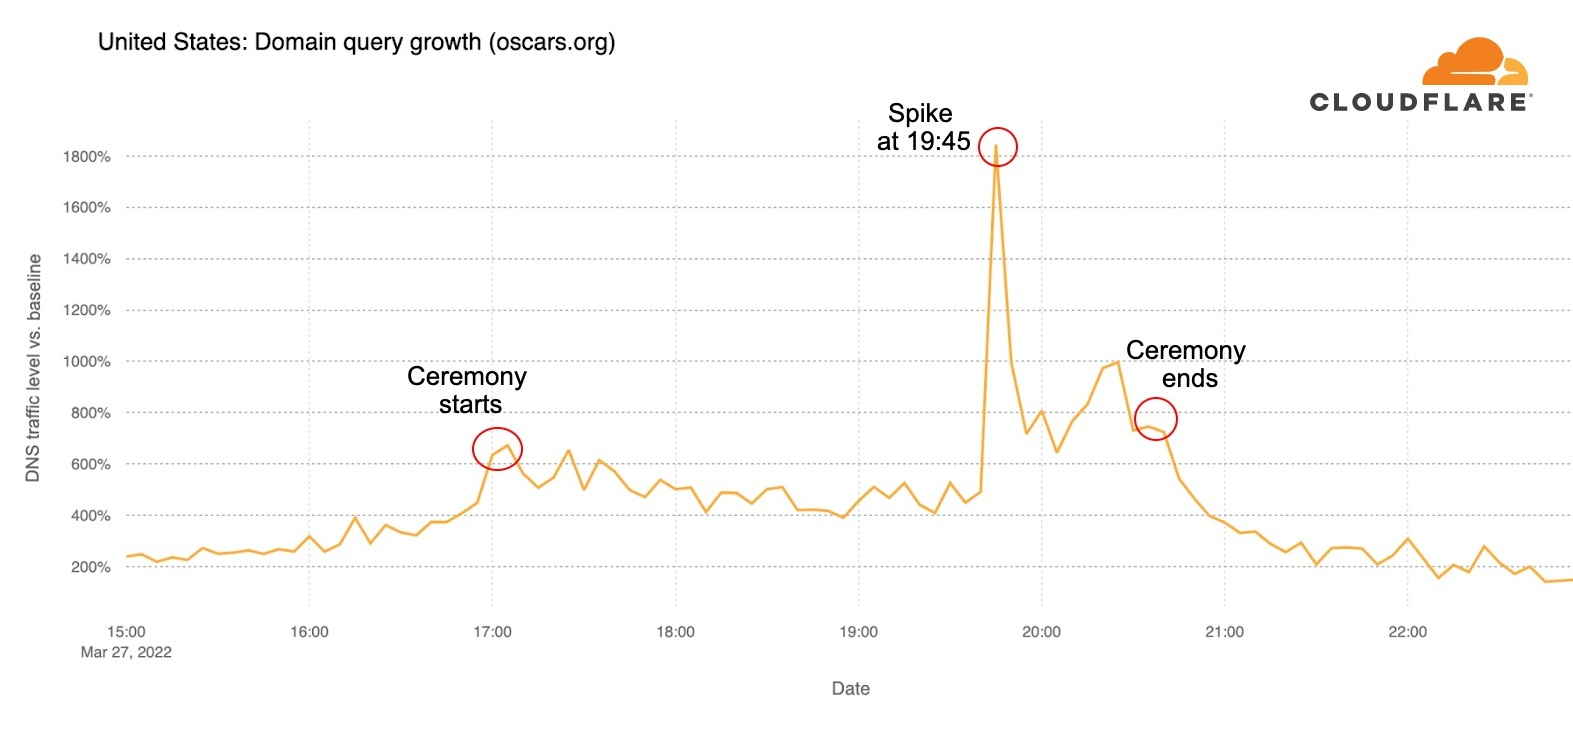
But the day with more sustained traffic from the last 14 days was actually Monday, June 6. That was the day that Boris Johnson, the British prime minister, won a no confidence vote in the UK’s Parliament. There was a clear first spike at around 08:00, when the news that a vote of no confidence would take place on that day broke, and a much bigger one at 21:00 (68% higher), when the final result of the vote was announced.
Social media and messaging trends
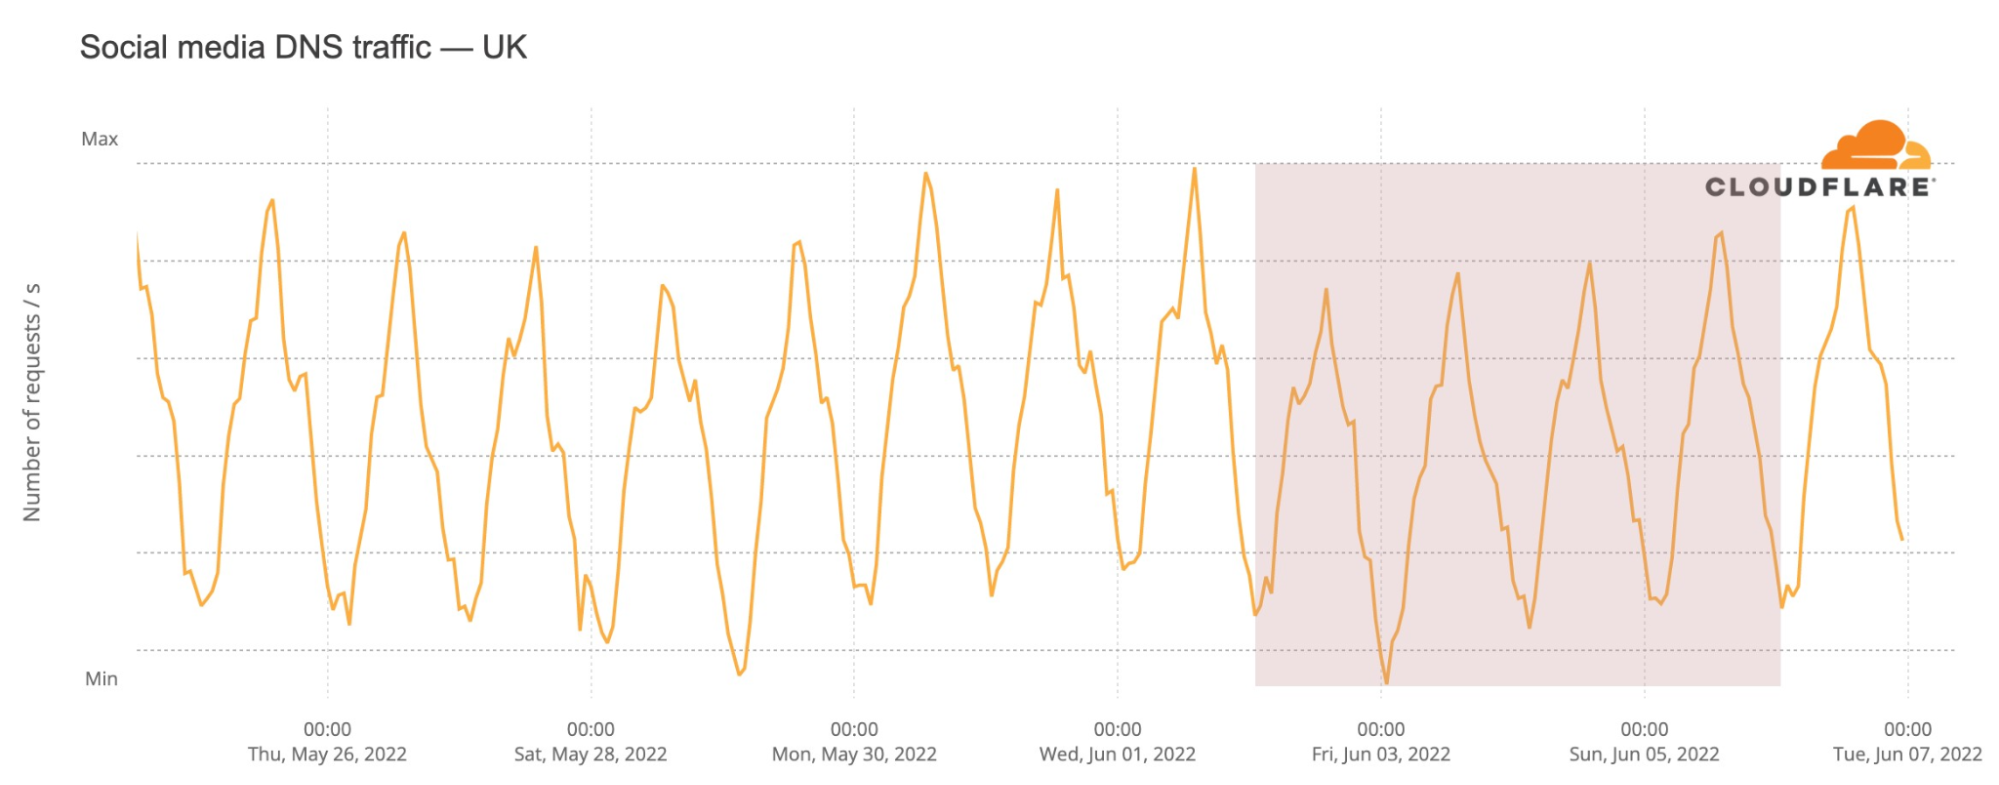
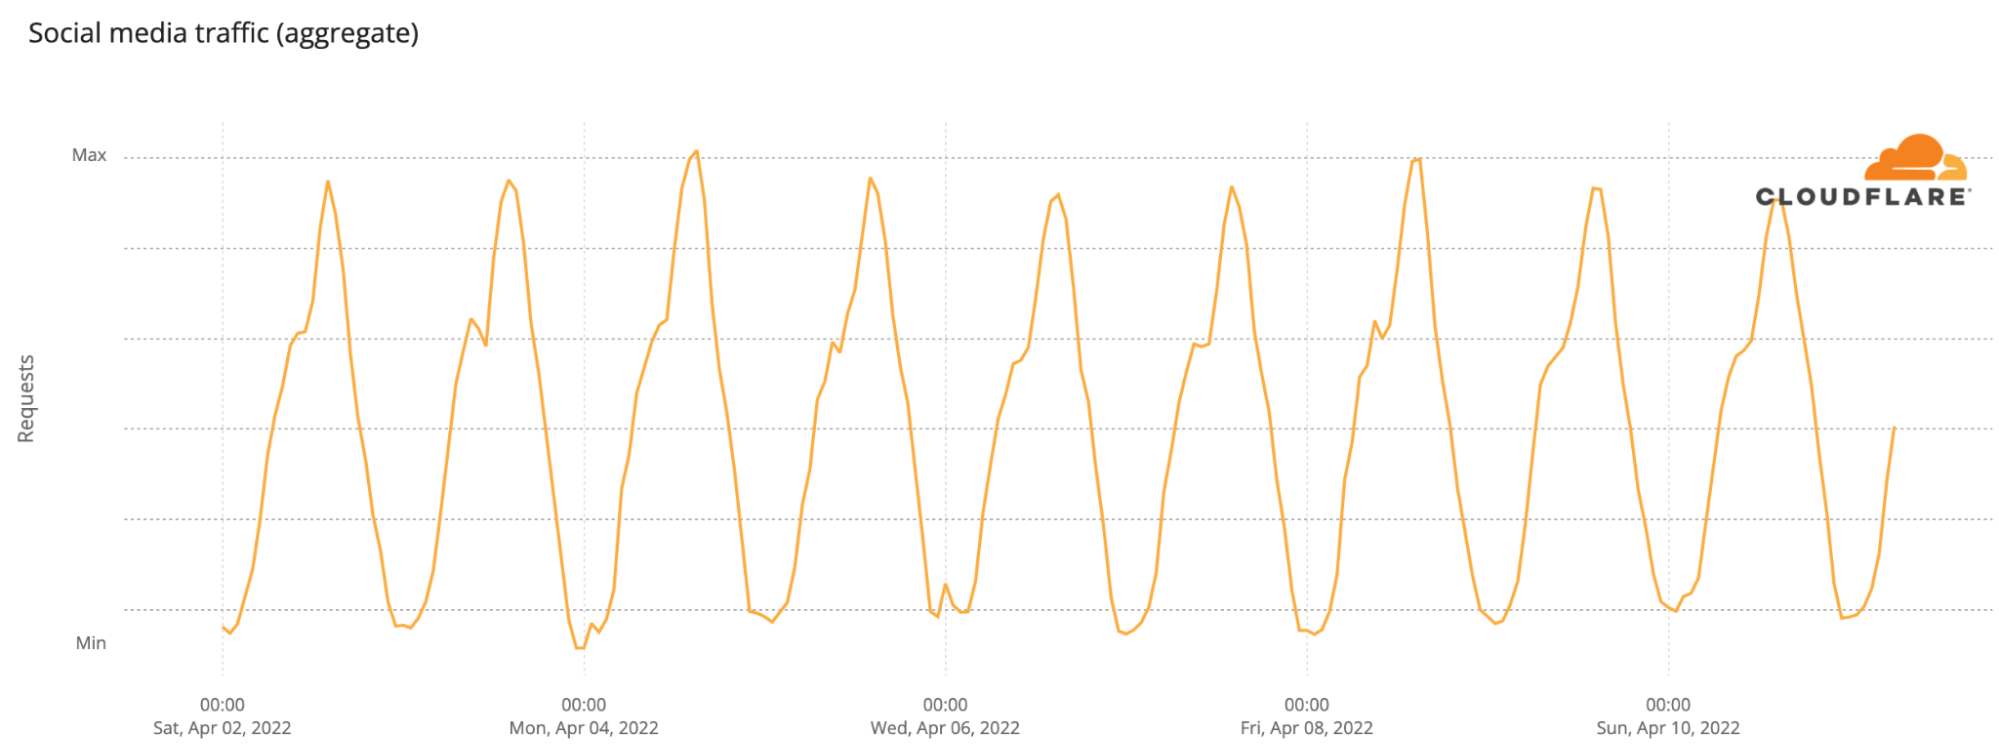
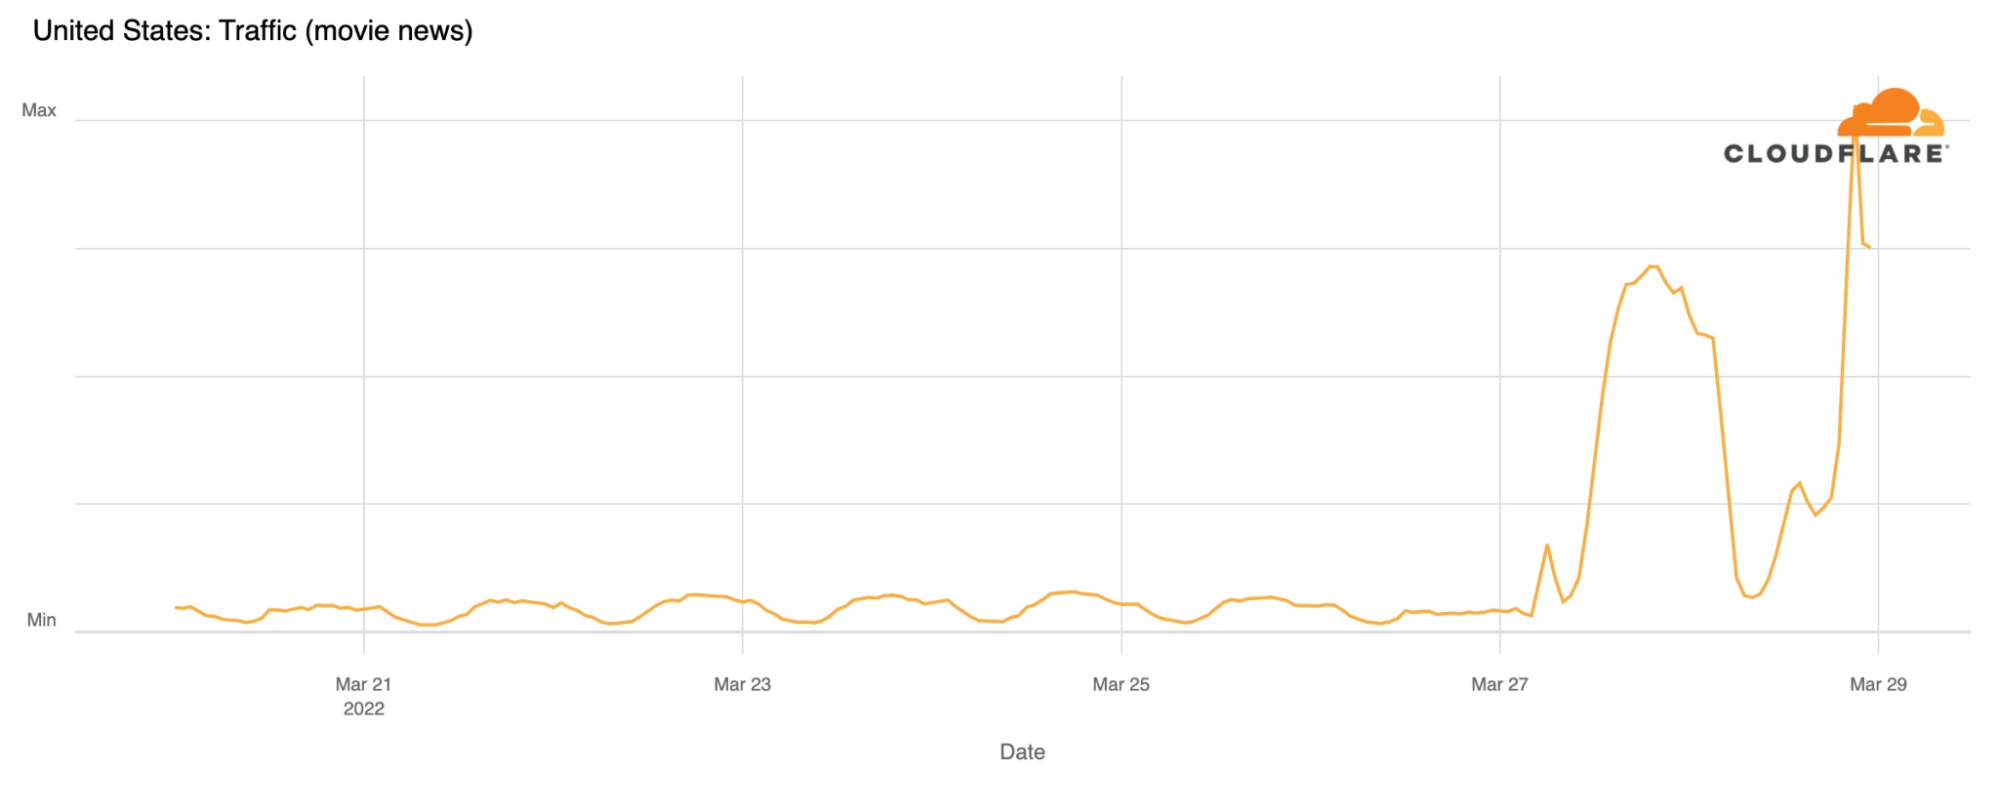
Social media trends show a similar pattern to Internet traffic in general, but it’s interesting to see that Thursday, June 2, the first day of the extended weekend, was the one of the full 14 days we’re looking at with less DNS traffic to those platforms.
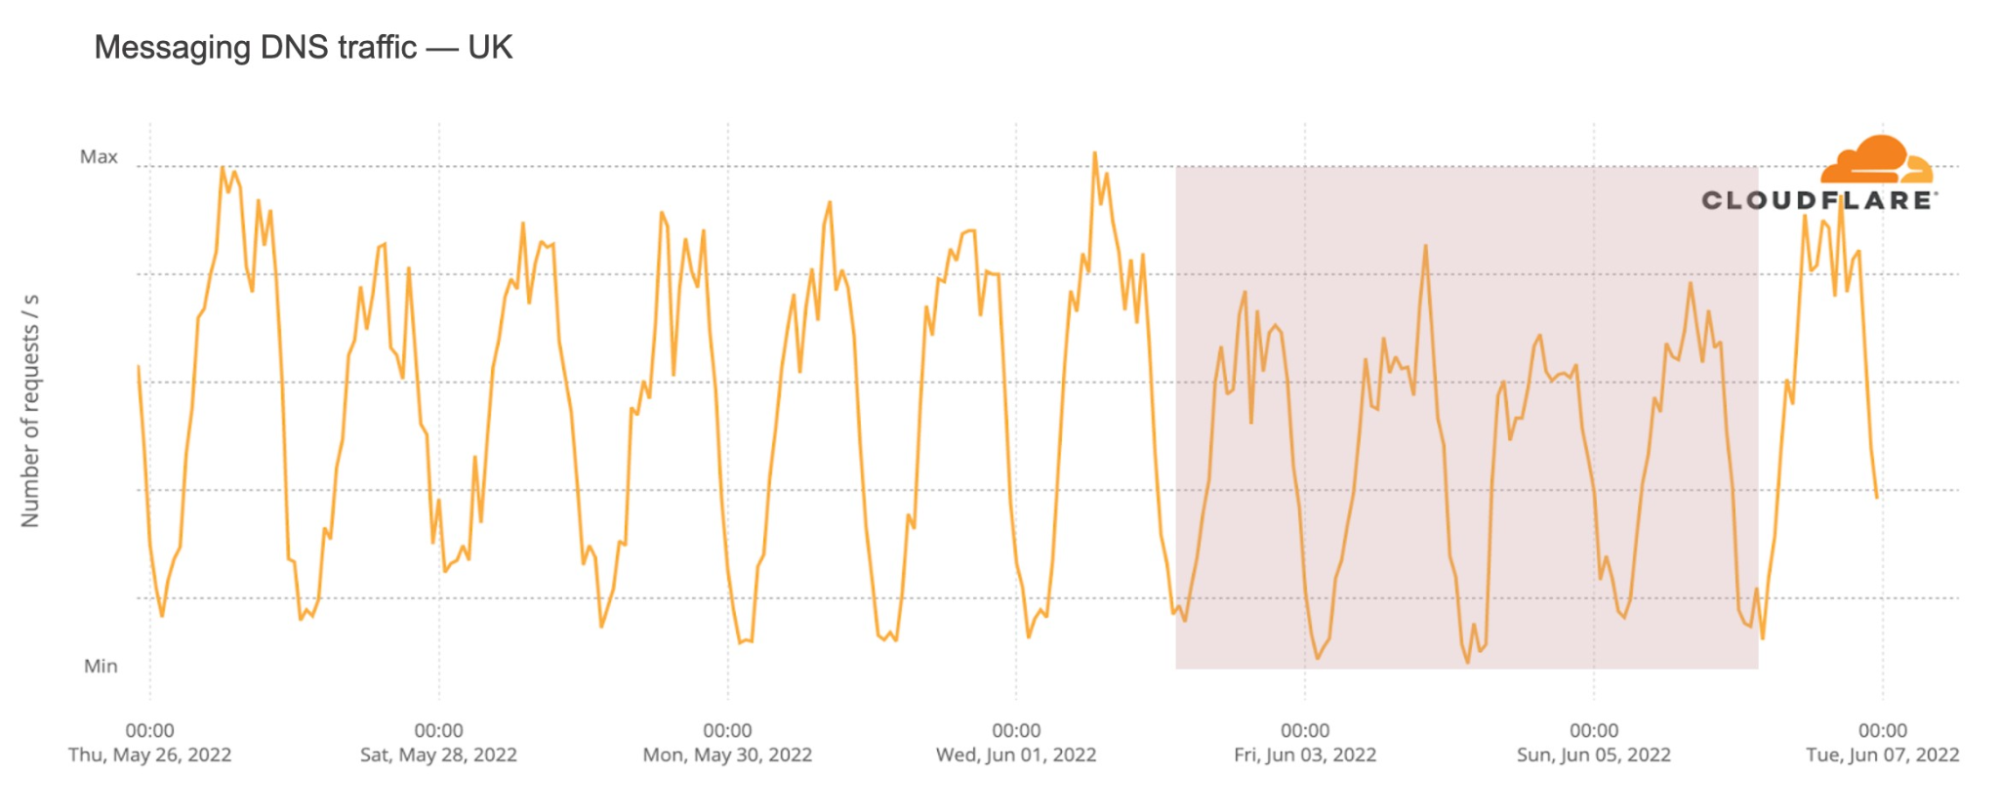
Messaging, on the other hand, had consistently much lower traffic during the four-day bank holiday, even compared to the previous weekend. Saturday, June 4, was the day with less messaging DNS traffic, at least of the two weeks period we’re observing. At 11:00 Saturday, traffic was 18% lower than in the previous period, the same level of lower DNS requests at 15:00 and through most of the day.
Conclusion: celebrations and events ‘move’ the Internet
When there’s a big country-wide celebration going on, especially one that has a lot of outdoor events and activities, Internet patterns do change. That happens, in this case, for a monarch whose reign began in 1952, when there wasn’t any Internet (it took more than 40 years for the network of networks that can connect us all on Earth to reach its more popular global form).
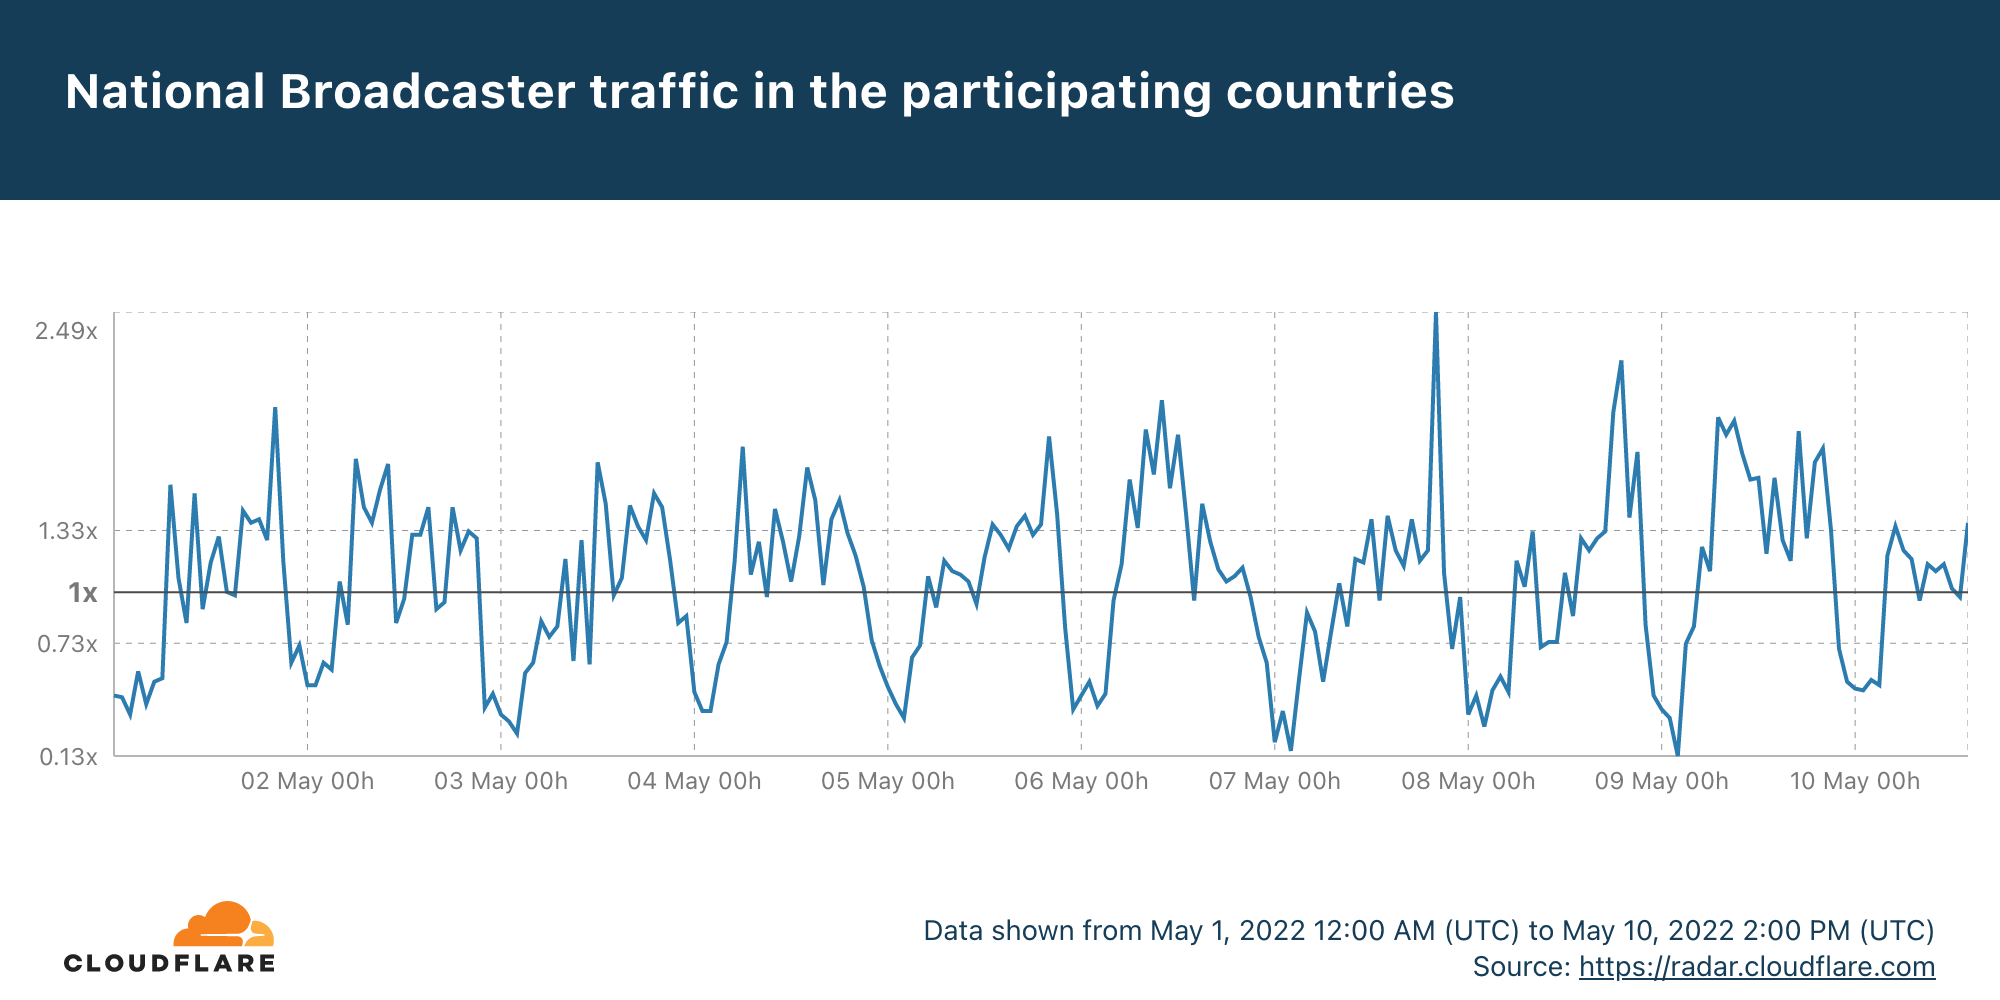
There’s only one song contest that is more than six decades old and not only presents many new songs (ABBA, Celine Dion, Julio Iglesias and Domenico Modugno shined there), but also has a global stage that involves 40 countries — performers represent those countries and the public votes. The 66th edition of the Eurovision Song Contest, in Turin, Italy, had two semi-finals (May 10 and 12) and a final (May 14), all of them with highlights, including Ukraine’s victory. The Internet was impacted in more than one way, from whole countries to the fan and official broadcasters sites, but also video platforms.
On our Eurovision dedicated page, it was possible to see the level of Internet traffic in the 40 participant countries, and we tweeted some highlights during the final.
— Cloudflare Radar (@CloudflareRadar) May 14, 2022
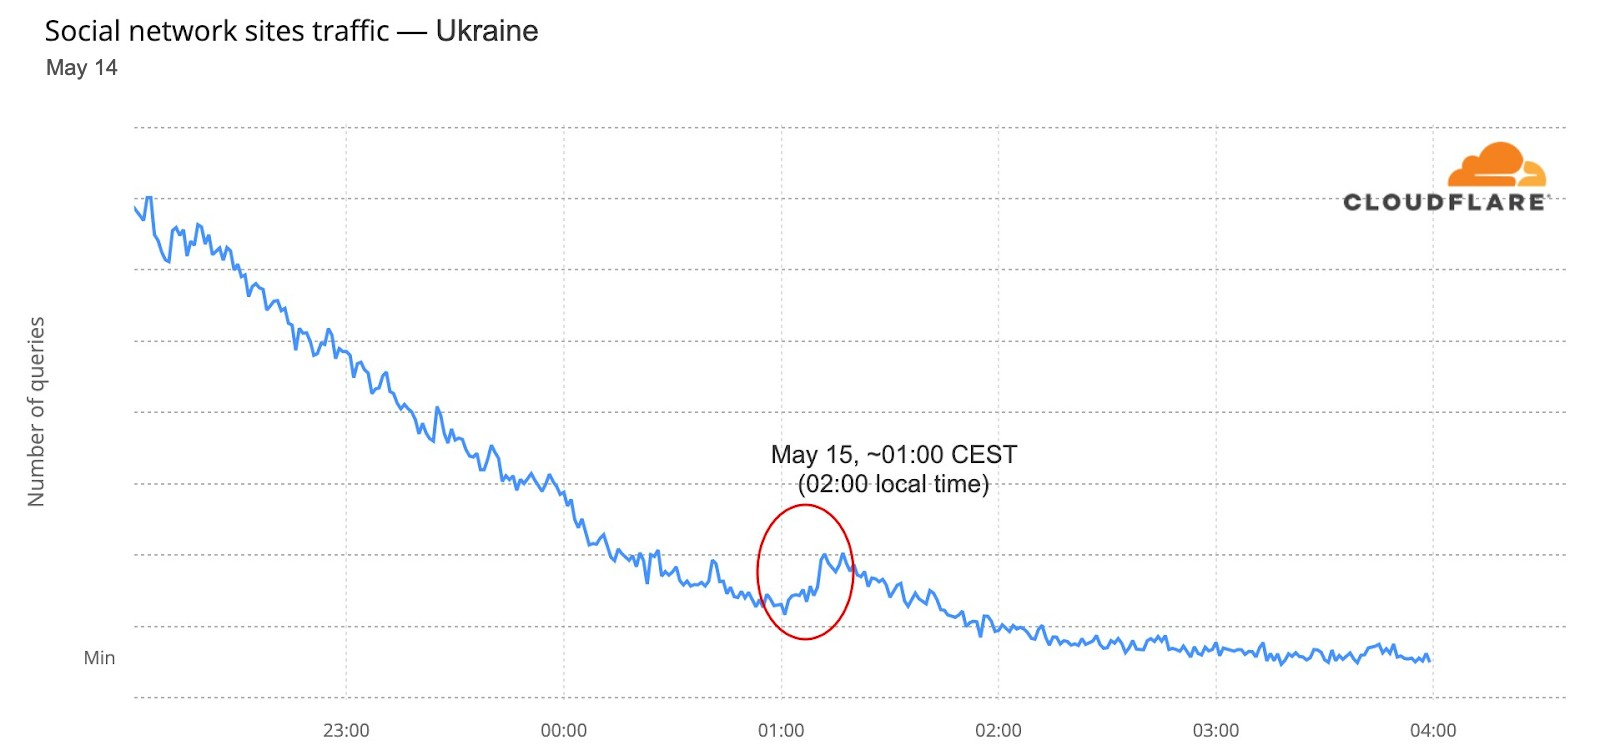
First, some technicalities. The baseline for the values we use in the following charts is the average of the preceding week, except for the more granular minute by minute view that uses the traffic average of May 9 and 10 as baseline. To estimate the traffic to the several types of websites from the 40 participating countries, we use DNS name resolution data. In this blog post, we’re using CEST, Central European Summer Time.
It’s not often that an entertainment event has an impact on a country’s Internet. So, was there an impact on Eurovision nights?
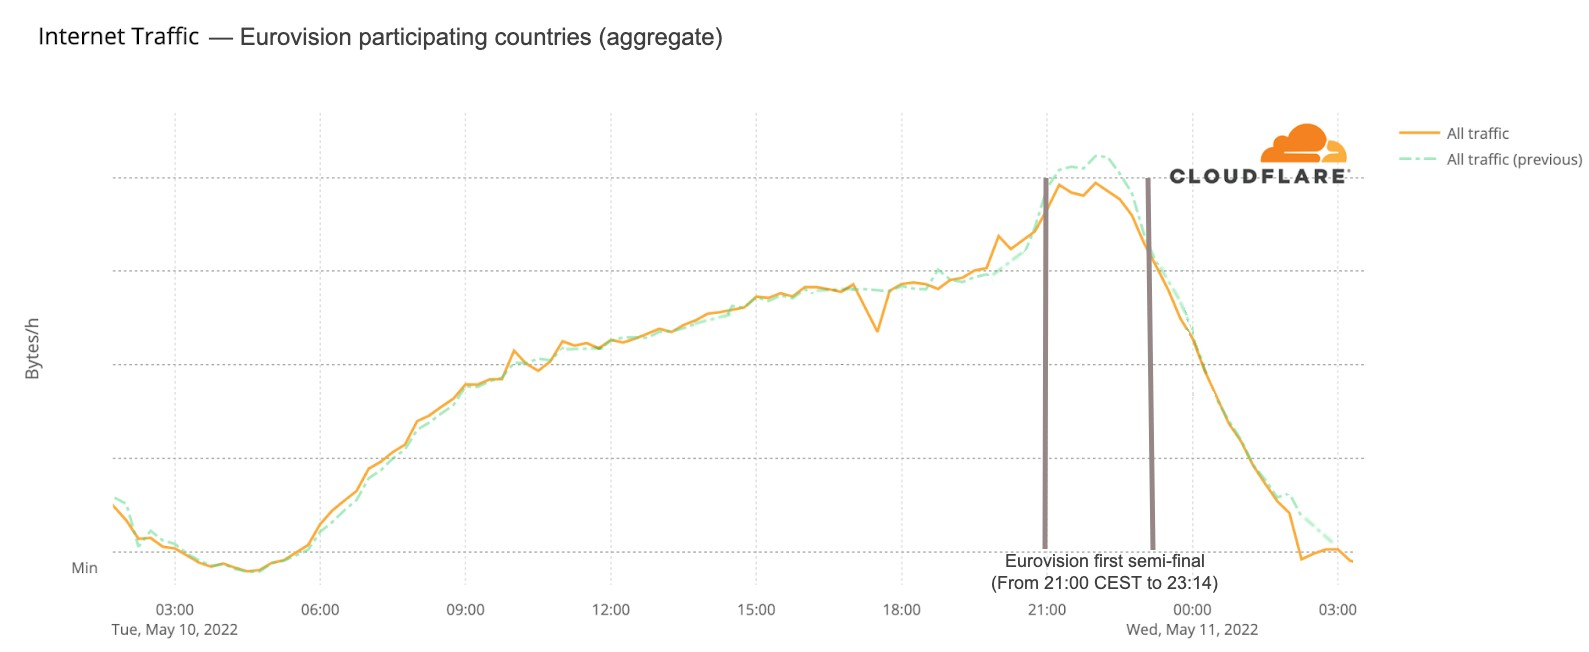
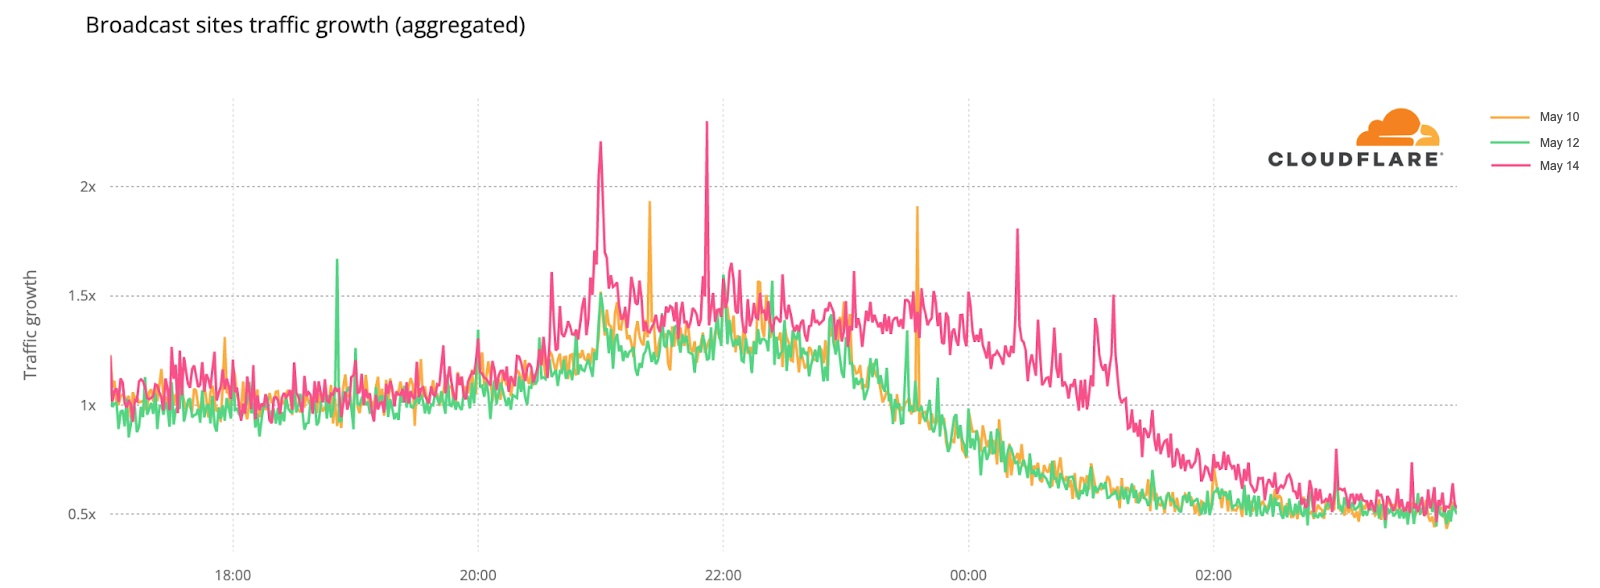
Let’s start with aggregate Internet traffic to the 40 participant countries (Australia included). In the first May 10 semi-final, there seems to be a slight decrease in traffic during the contest — it makes sense if we think that most people were probably watching the broadcast on national TV (and not on YouTube, that was also transmitting live the event). Traffic was lower than in the previous period between 21:00 and 23:00 (the event was between 21:00 to 23:14), but it was back to normal at 23:00.
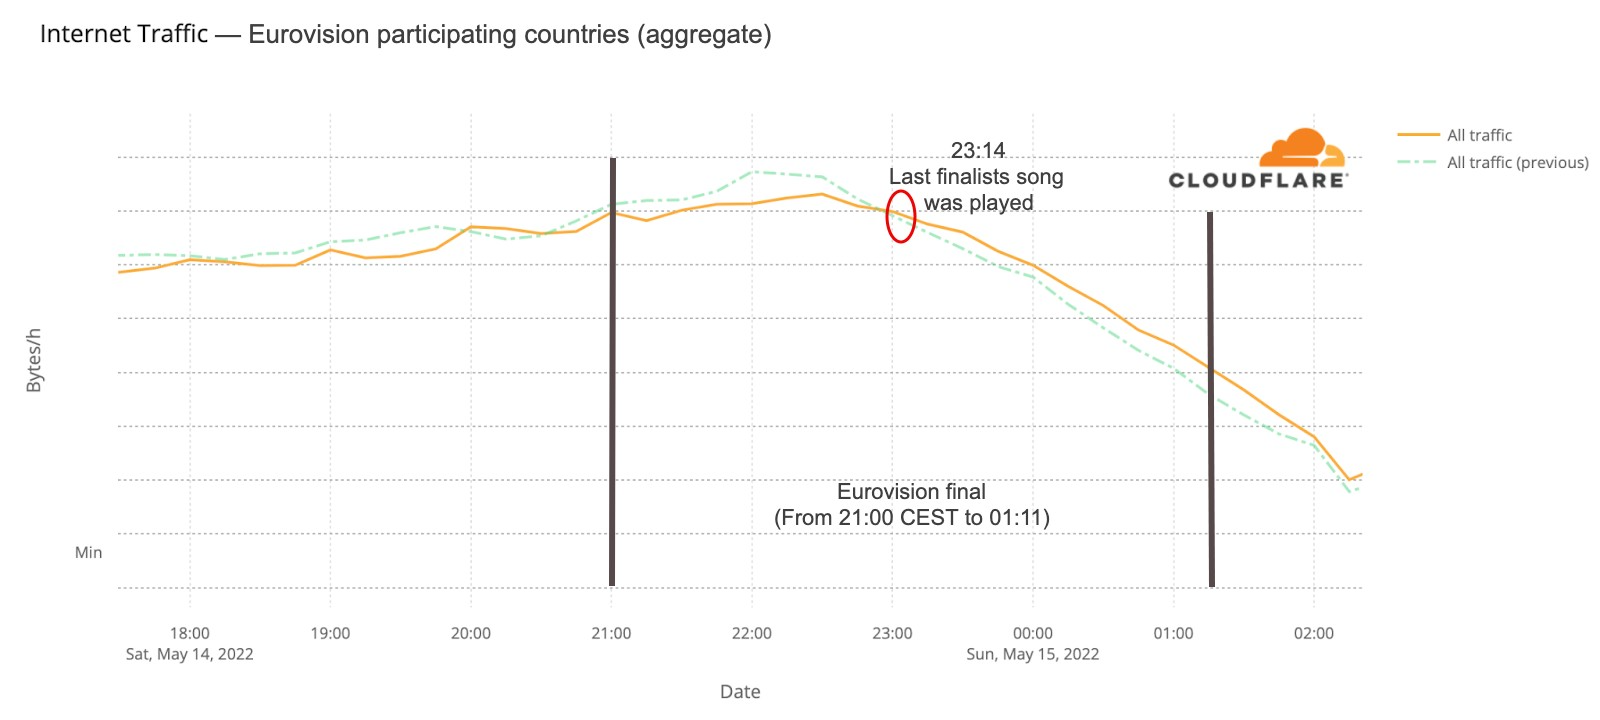
For the second semi-finalthat trend is less clear. But the May 14 final (that lasted from 21:00 CEST to 01:10) told a different story. Traffic was 6% lower than on the previous Saturday after 21:00, mostly around 22:00, and after 23:15 it was actually higher (between 4% and 6%) than before and continued that way until 02:00.
What happened at that 23:15 time in Eurovision? The last of the 25 songs at the contest was Estonia’s “Hope”, by Stefan, and it ended at 23:14 (also in this blog post we will also see how 23:16 was the highest spike in terms of DNS traffic to fan websites during the final). This is the Internet traffic in the participating countries on May 14 chart:
There were several countries that showed similar impact in terms of traffic change during at least the final. France, UK, Germany, Iceland, Greece and Switzerland are examples.
Eurovision & the UK
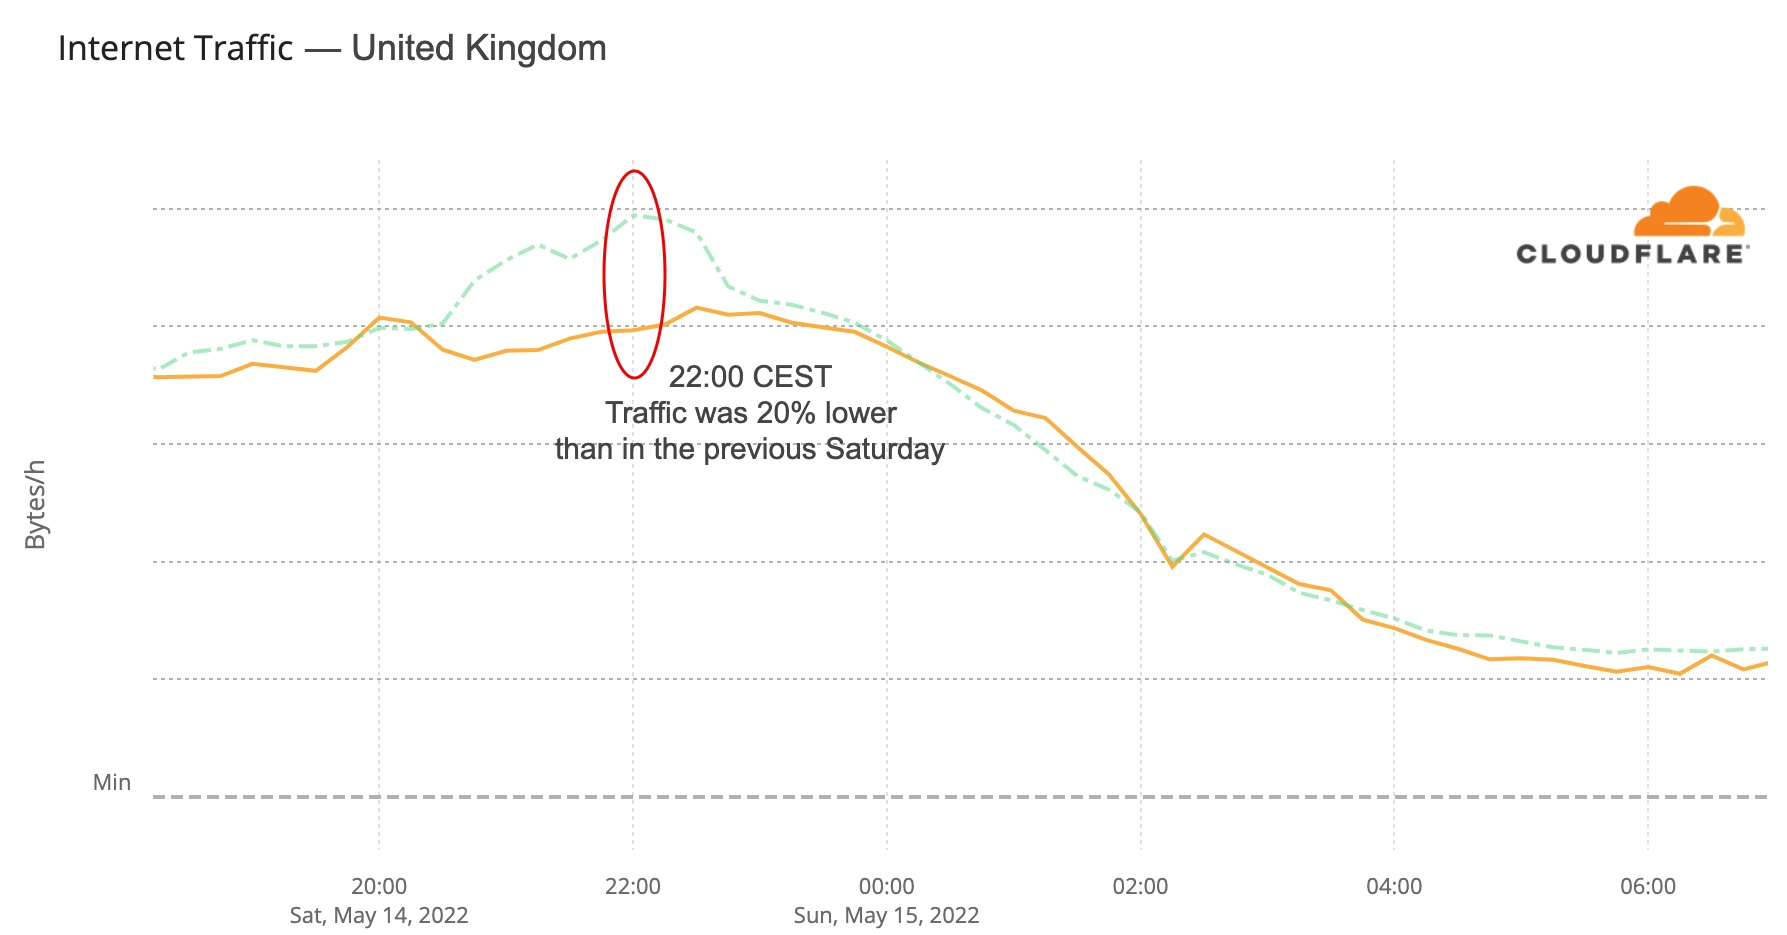
The UK was one of the countries where there seems to be more impact during the time of the grand final — last year, according to the ratings, eight million were watching the BBC transmission with the commentator Graham Norton. Traffic started to drop to lower levels than usual at 20:30 (a few minutes before the final) and was 20% lower at 22:00, starting to go closer to normal levels after 23:00, when the set of 25 finalists’ songs came to an end.
Here’s the UK’s Internet traffic trend during the Eurovision May 14 final:
Fan sites: what a difference a winner makes
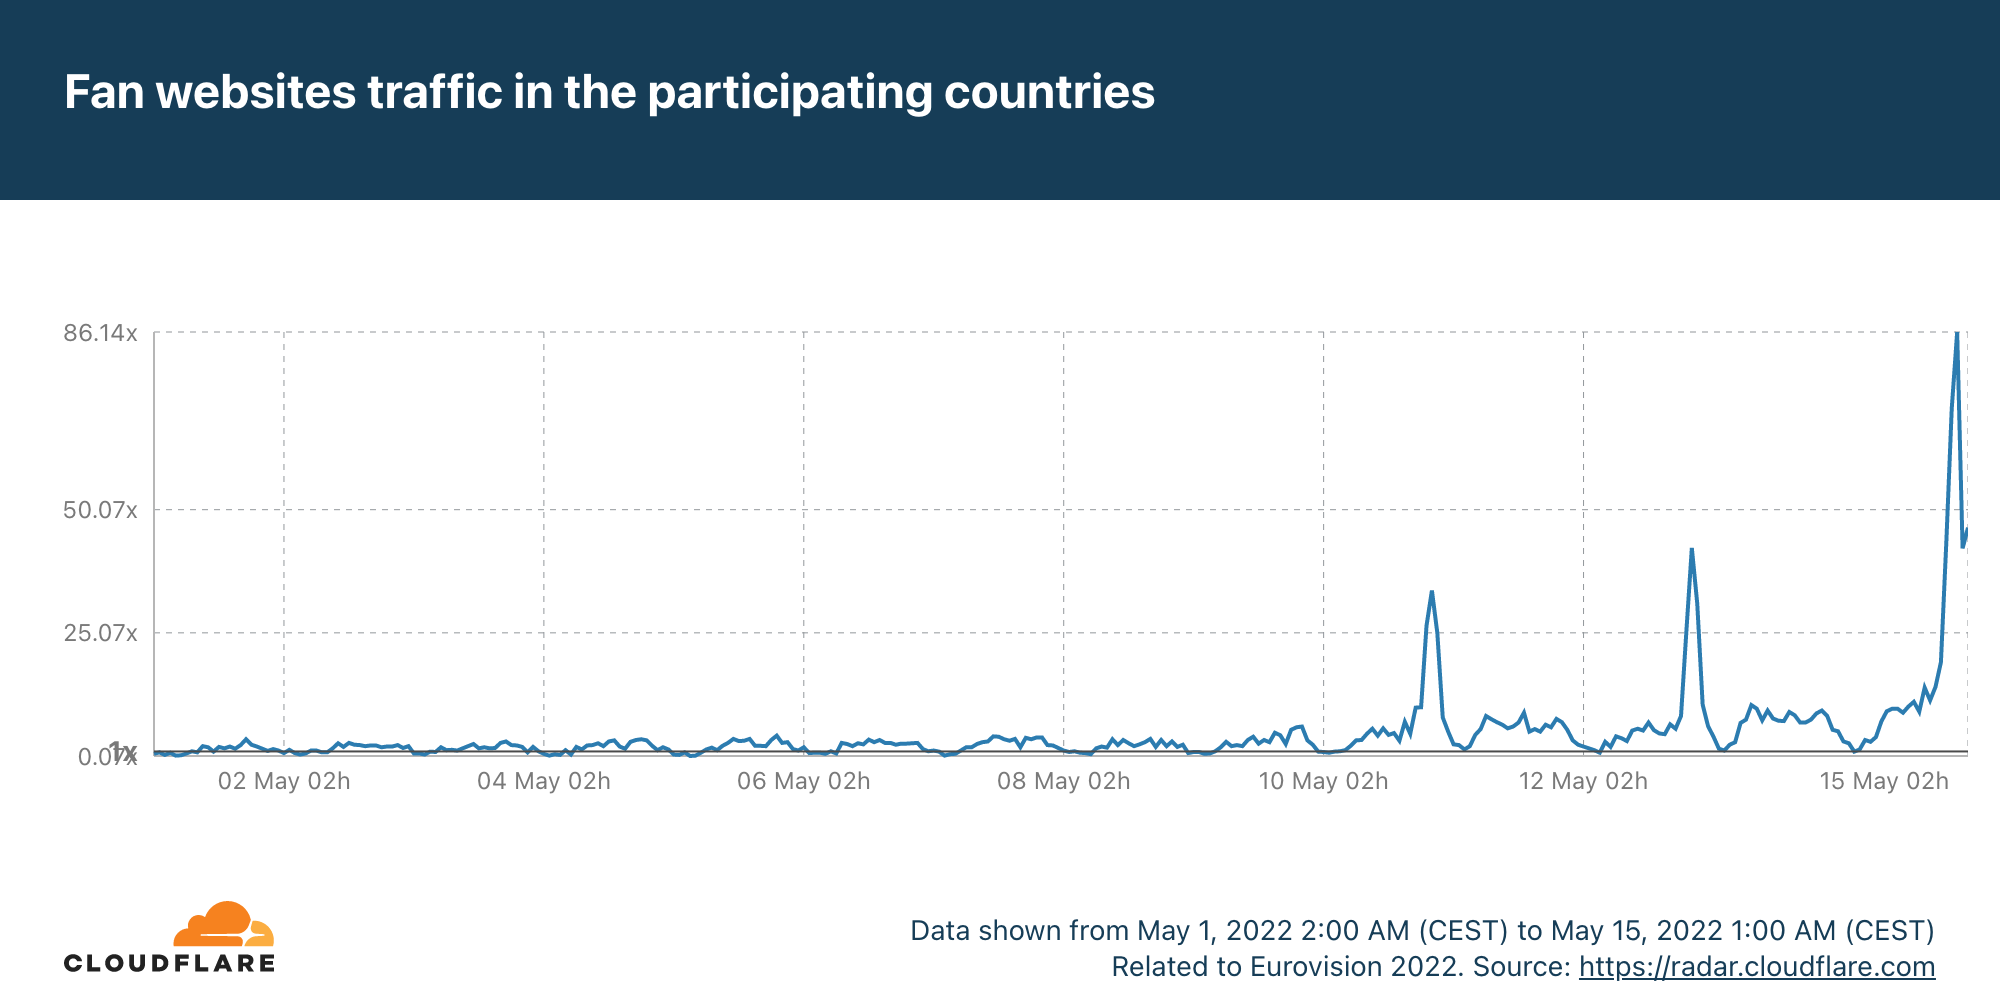
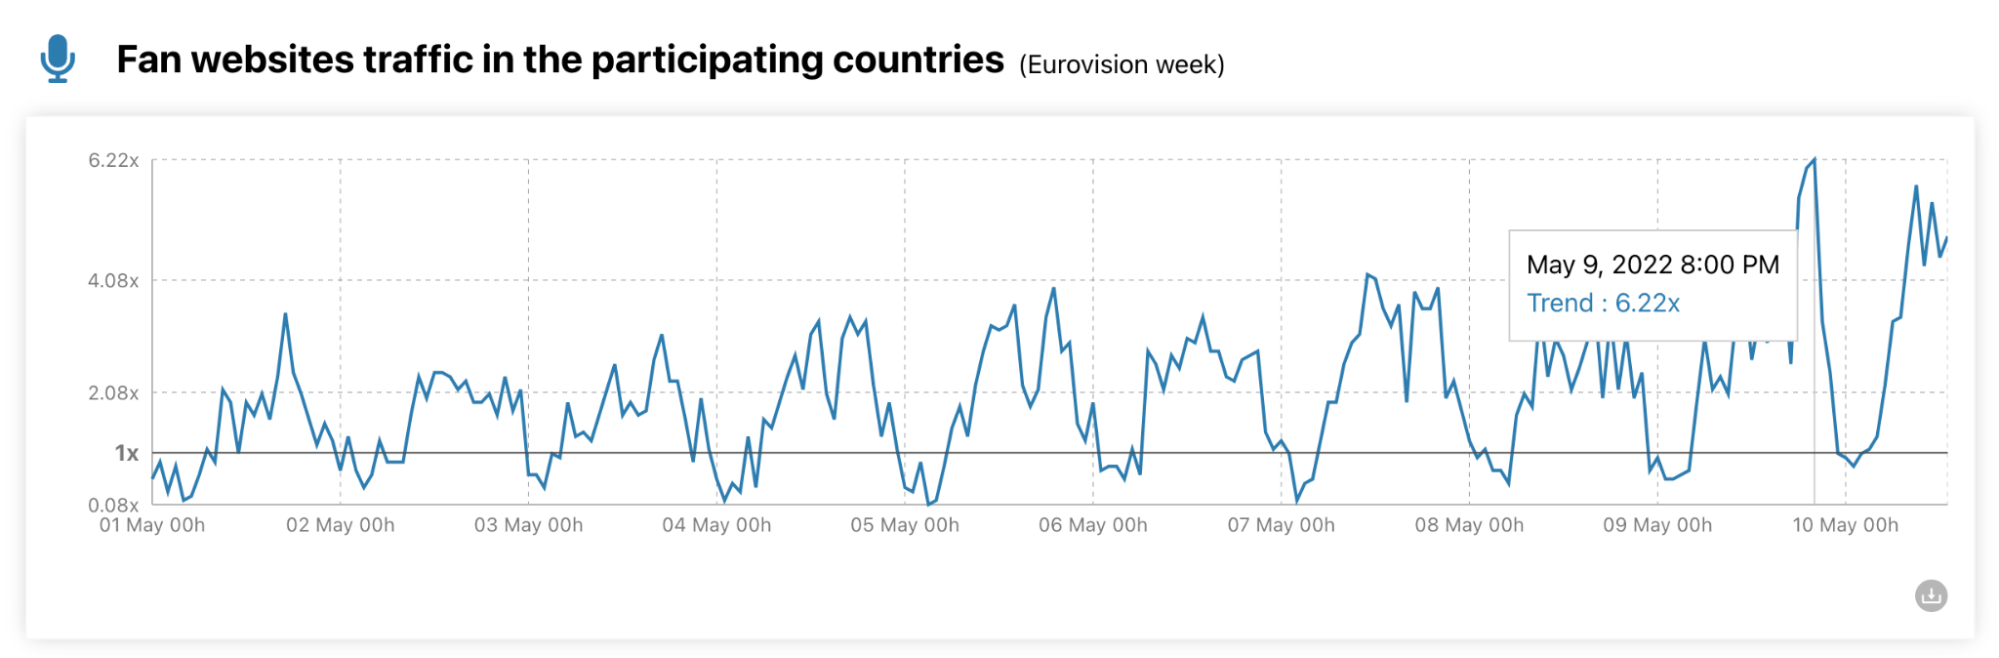
The most obvious thing to check in terms of impact are the fan websites. Eurovision has many, some general (there’s the OGAE, General Organisation of Eurovision Fans), others more local. And DNS traffic to them was clearly impacted.
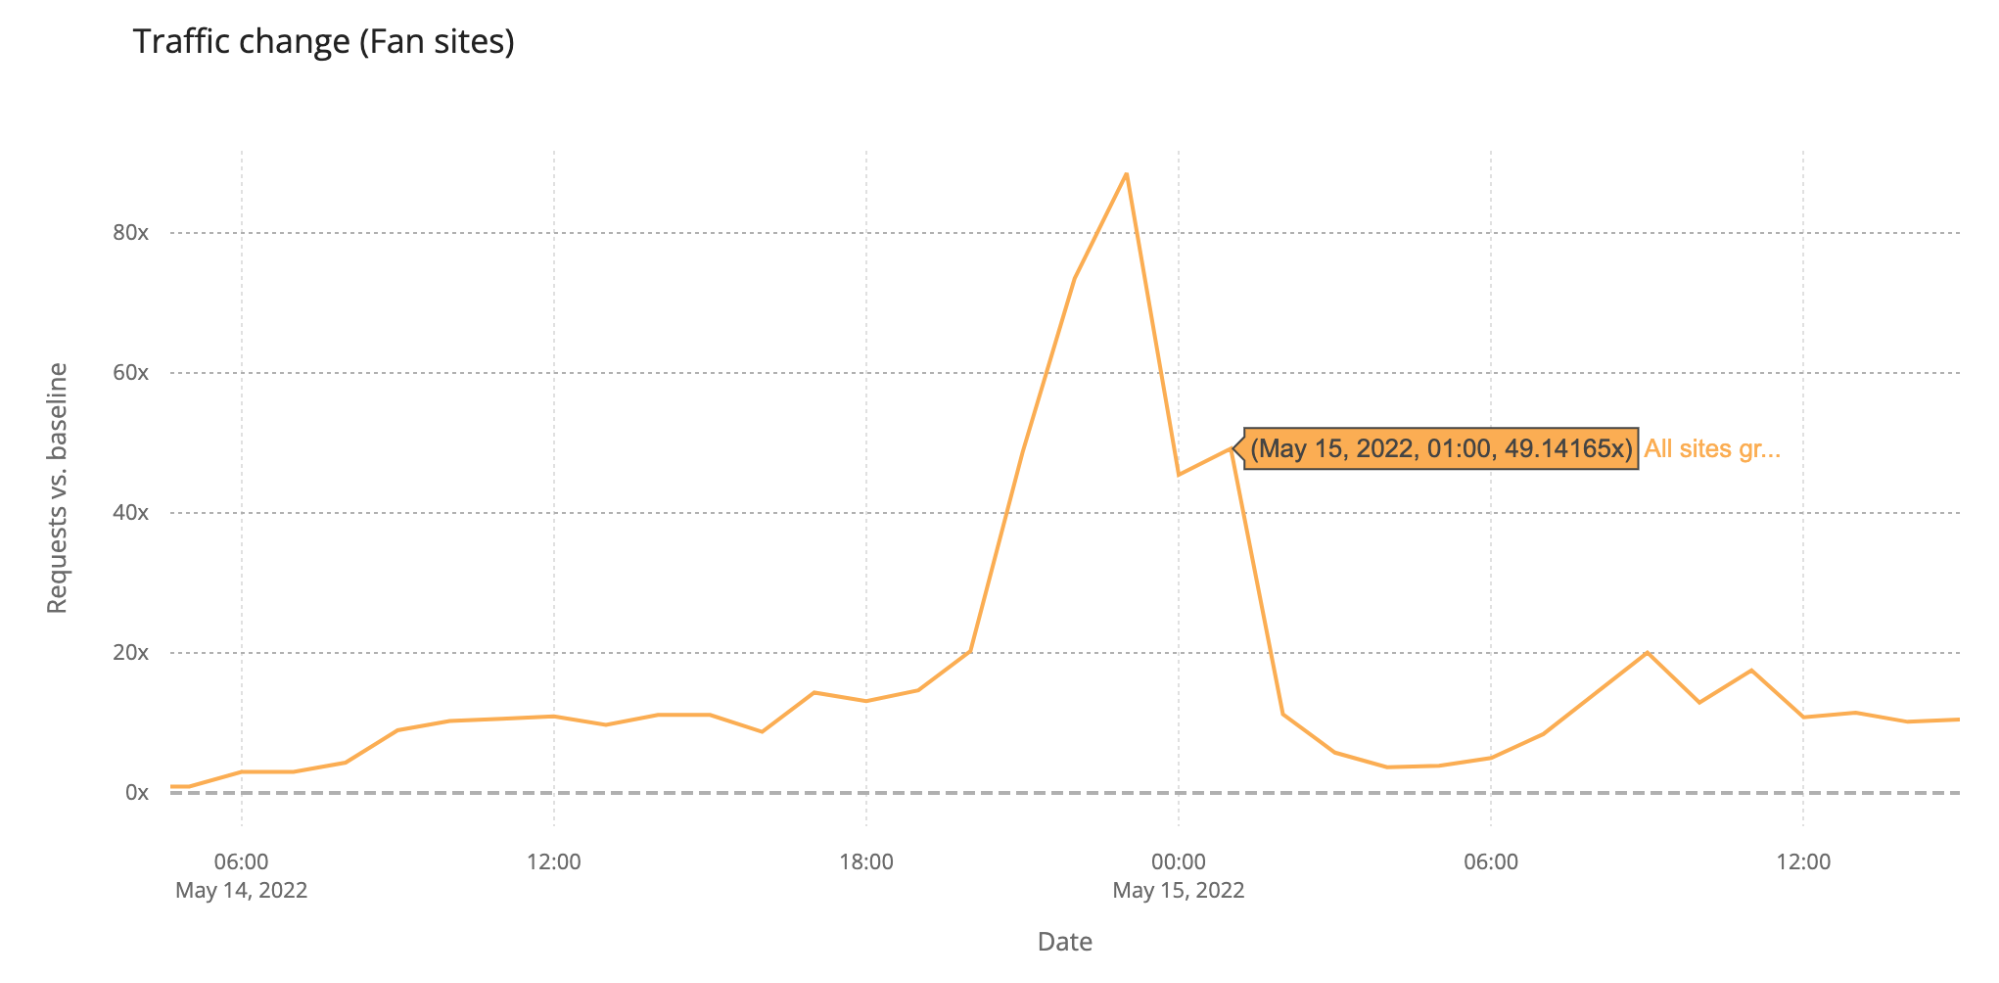
The first semi-final, on May 10, had 33x more traffic than in the average of the previous week, with a clear 22:00 CEST spike. But the second semi-final, May 12, topped that, with 42x more traffic at the same time. The final, with the 25 finalists, clearly surpassed that and at 22:00 traffic was already 70x. But because the final was much longer (in the semi-finals it was around 23:00 that the finalists were announced), the peak was reached at 23:00, with 86x more traffic than usual.
“We have a winner. The winner of the Eurovision Song Contest 2022 is… Ukraine!”. — Alessandro Cattelan, Laura Pausini and Mika at 01:01 CEST, May 15, 2022.
Saturday’s final was more than four hours long (the semi-finals took little over two hours), and it finished a few minutes after 01:00 CEST. DNS traffic to fan websites dropped from 86x to 45x at midnight, but it went up again to 49x more traffic when it was already 01:00 CEST in most of Europe and Ukraine was announced the winner of Eurovision 2022. This next chart shows Saturday’s May 14 final traffic change to fan sites:
We can also clearly see that on Sunday morning, at 09:00, there was a 20x peak to fan sites, and also at 11:00 (17%).
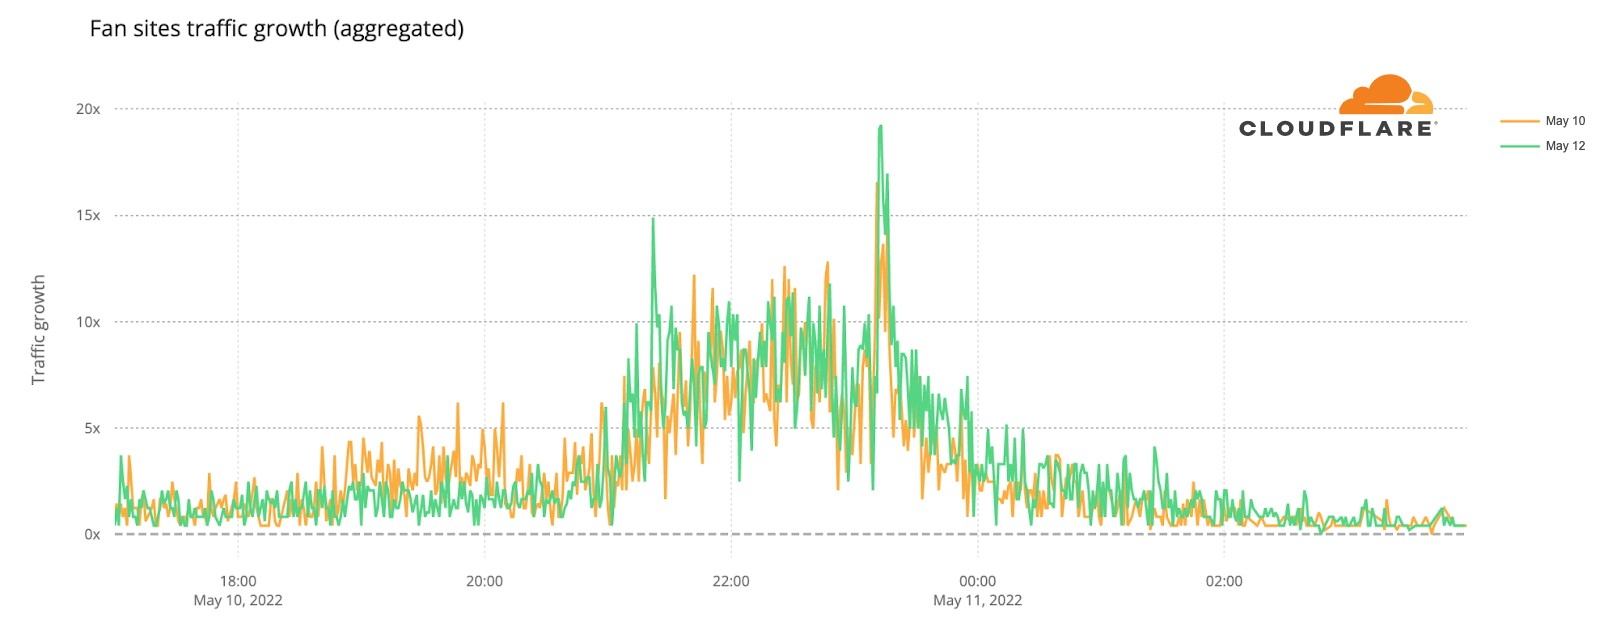
Now, let’s go deeper by looking at a minute by minute view (the previous charts show hourly data) of DNS traffic to fan sites. In the two semi-finals it’s easy to see that the moment the finalists were announced, and the event was ending, around 23:12, was when traffic was higher. Here’s what the May 10 (yellow) and May 12 (green) two semi-finals fan sites growth looked like:
We can also spot some highlights in fan sites during the semi-final besides the finalists’ announcement, which we saw were definitely the most popular moments of the two nights. First, on May 10 there was more traffic before the event (21:00) than on May 12, so people seem to have greater expectations of the first Eurovision 2022 event of the week. In terms of spikes (before the winners’ announcements), we created a list of moments in time with more interest to the fan websites and connected them to the events that were taking place at that time in Eurovision (ordered by impact):
First semi-final, May 10 #1. 22:47 Sum up of all the songs. #2. 22:25 Norway’s song (Subwoolfer, “Give That Wolf a Banana”). #3. 21:42 Bulgaria’s song (Intelligent Music Project, “Intention”). #4. 21:51 Moldova’s song (Zdob și Zdub and Advahov Brothers, “Trenulețul”). #5. 22:20 Greece’s song (Amanda Georgiadi Tenfjord, “Die Together”).
Second semi-final, May 12 #1. 21:22 Between Serbia (Konstrakta, “In corpore sano”) and Azerbaijan (Nadir Rustamli, “Fade to Black”). #2. 22:48 Voting period starts. #3. 22:30 Czech Republic’s song (We Are Domi, “Lights Off”). #4. 22:38 Laura Pausini & Mika performing (“Fragile” Sting cover song). #5. 22:21 Belgium’s song (Jérémie Makiese, “Miss You”).
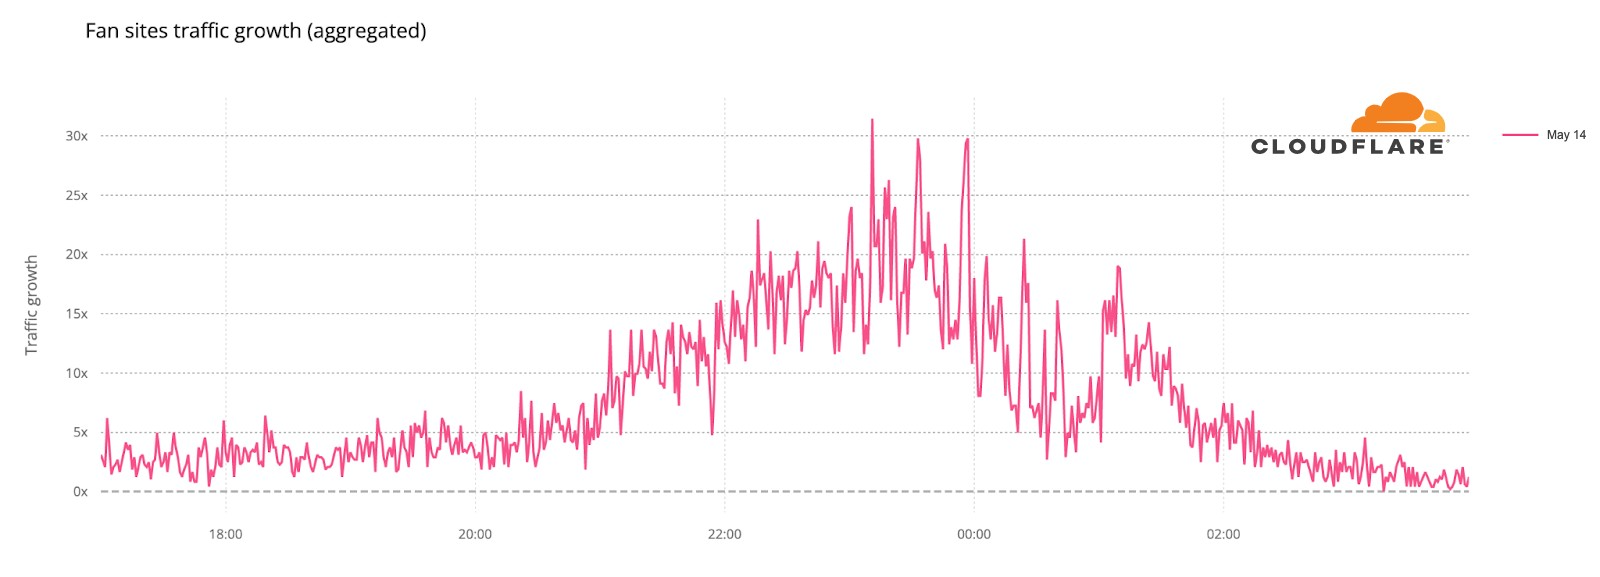
How about the May 14 final? This chart (followed by a ranking list) shows DNS traffic spikes in fan sites on Saturday’s final:
Final, May 14 #1. 23:11 Between Serbia (Konstrakta, “In corpore sano”) and Estonia (Stefan, “Hope”). #2. 23:33 Sum up of all the songs. #3. 23:57 Voting ended. #4. 23:19 Sum up of all the songs. #5. 23:01 Ending of the United Kingdom’s song (Sam Ryder, “Space Man”).
— BBC Eurovision🇬🇧 | 👩🚀#teamSPACEMAN (@bbceurovision) May 15, 2022
(UK’s performer and representative Sam Ryder with Graham Norton, the BBC commentator of Eurovision since 2009 — the BBC broadcasts the event since 1956.)
The broadcasters show
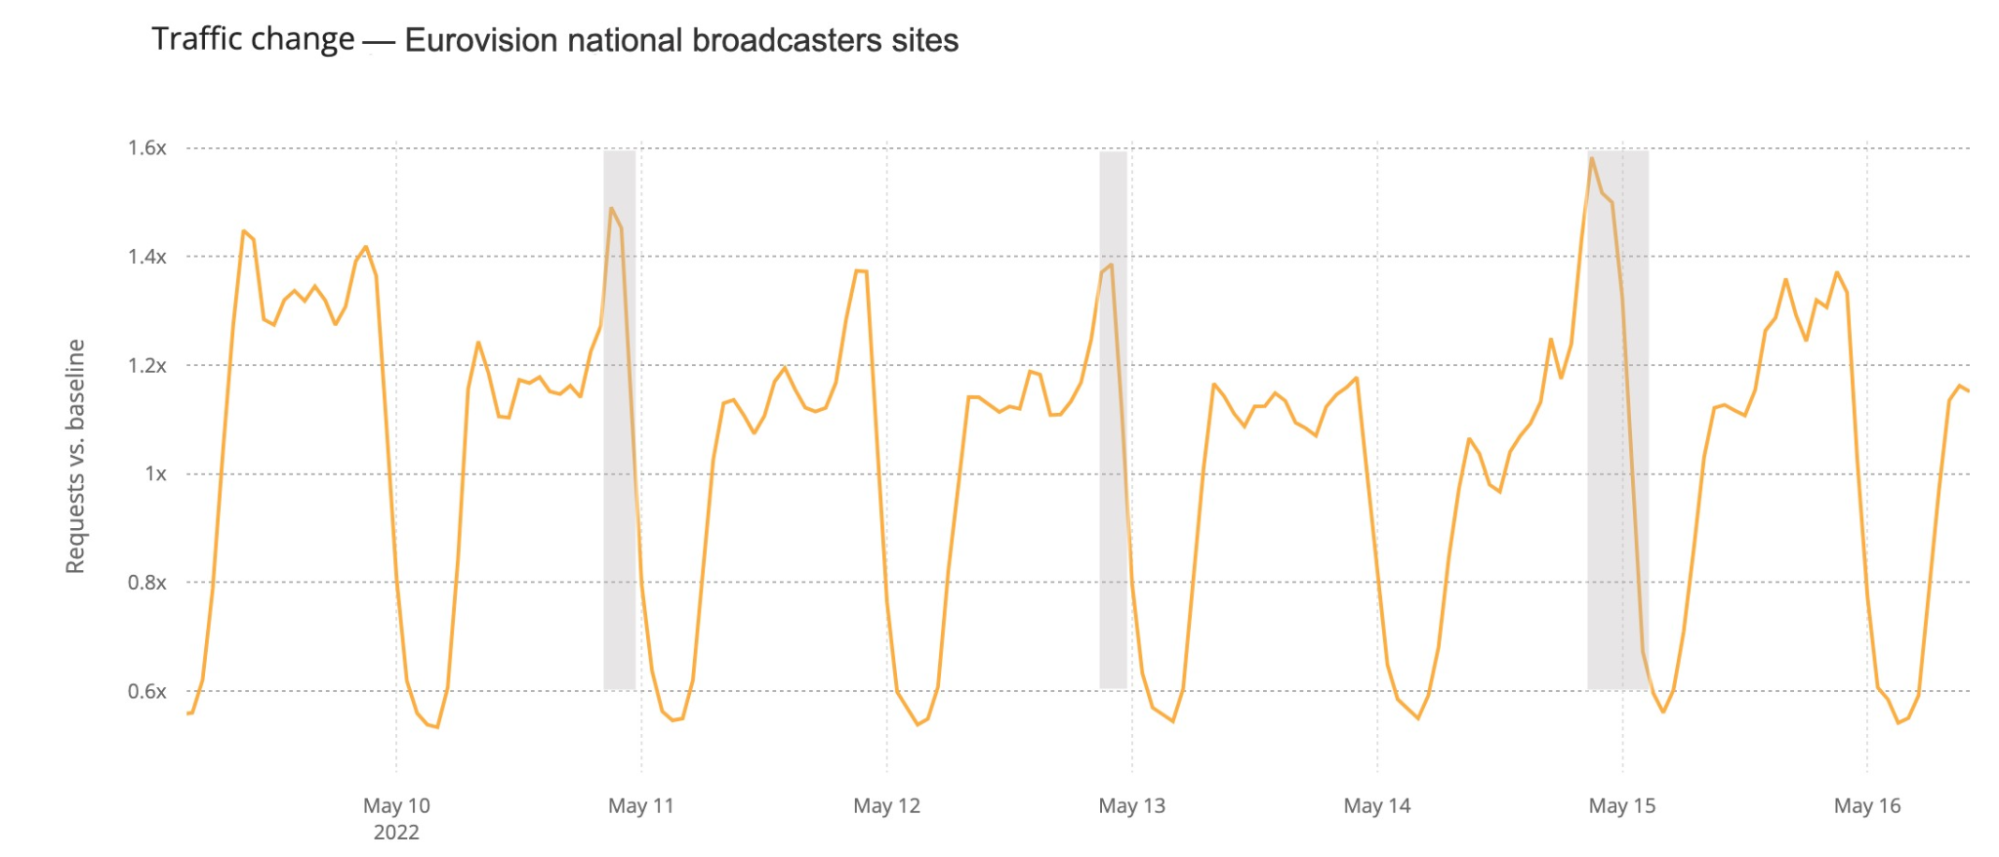
How about official national broadcaster websites? Around 23:00 CEST traffic to the aggregate of 40 broadcasters was generally higher on the semi-finals and final nights (represented in grey on the next chart). That’s more clear on the final at 23:00, when DNS traffic was 18% higher than in the previous Saturday (and 50% compared to the previous day). During the semi-finals the difference is more subtle, but at 23:00 traffic in both May 10 and 12 traffic was ~6% higher than in previous days.
When we focus on the minute by minute view also on the broadcaster sites but on the three Eurovision evenings, the highest growth in traffic is also during the final (like we saw in the fan sites), mainly after 23:00, which seems normal, considering that the final was much longer in time than the semi-finals that ended around that time.
During the final (represented in pink in the previous chart), there were some clear spikes. We’ve added them to a ranking that also shows what was happening in the event at that time.
Broadcaster site spikes. Final, May 14 #1. 21:52 Best moments clip of the two semi-finals #2. 21:00 Contest starts #3. 00:24 Sam Ryder, the UK representative (with the song “Space Man”) being interviewed after reaching the #1 in the voting process. #4. 01:09 Ukraine’s (Kalush Orchestra, “Stefania”) performance as the winner #5. 01:02 Ukraine was announced as the Eurovision 2022 winner.
Video platforms: the post-final growth
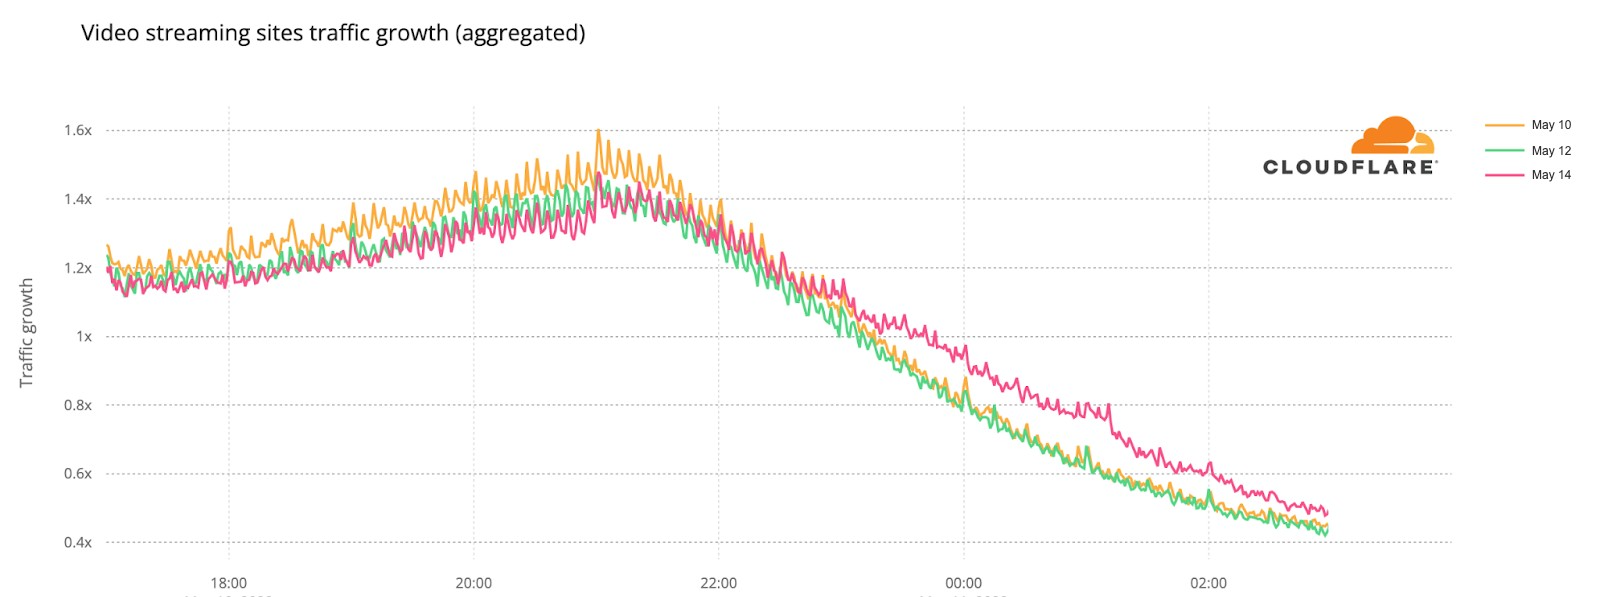
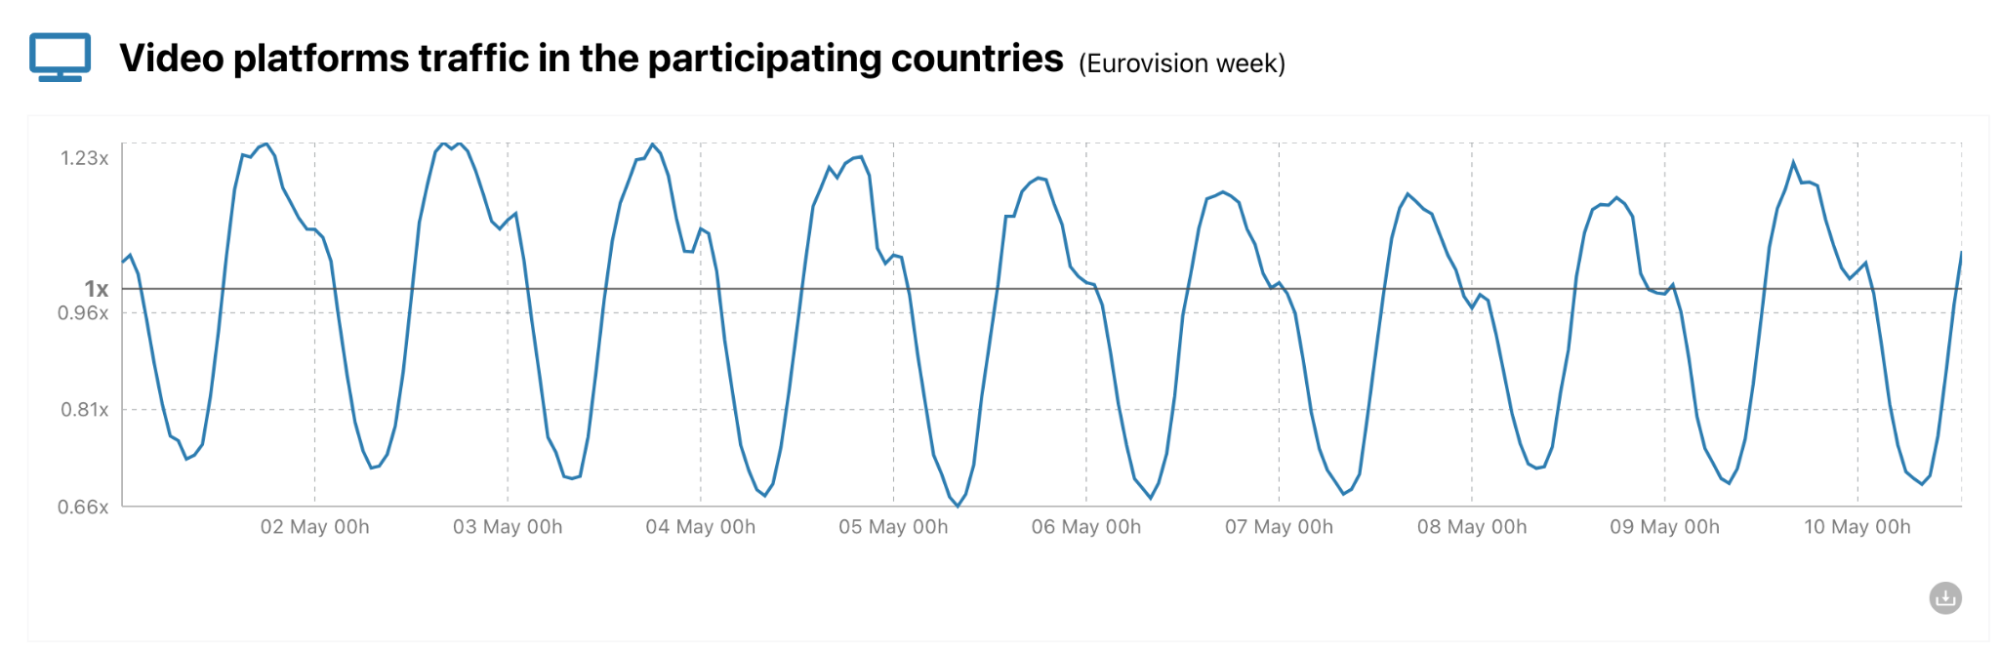
Eurovision uses video platforms like YouTube and TikTok to share all the songs, clips of the events and performers and there was also a live transmission on YouTube of the three nights. Given that, we looked at DNS traffic to the video platforms in an aggregate for the 40 participating countries. So, was there an impact to this well known and high performing social and video platforms? The short answer is: yes.
The final was also the most evident example, especially after 23:15, when all the 25 finalists songs already performed and the event had two more hours of non-participant performances, video clips that summarize the songs and the voting process — the famous moment in Europe to find out who will get from each of the 40 participant countries the maximum of 12 points.
In this comparison between the semi-finals and final day, we can see how on May 10, the day of the first semi-final, video platform traffic had more growth before the contest started, which is not that surprising given that it was the first Eurovision 2022 event and there was perhaps curiosity to check who were the other contestants (by then Eurovision had videos of them all on YouTube).
But the May 14 final shows more DNS traffic growth than the other Eurovision days after 23:16 (as we saw before, that was the time when all the finalists’ songs had already been performed). The difference in traffic compared to the semi-finals was higher at 1:11 CEST. That was the moment that the final came to an end on Saturday night, and at that time it reached 31% more traffic to video platforms than on May 10, and 38% than on May 12.
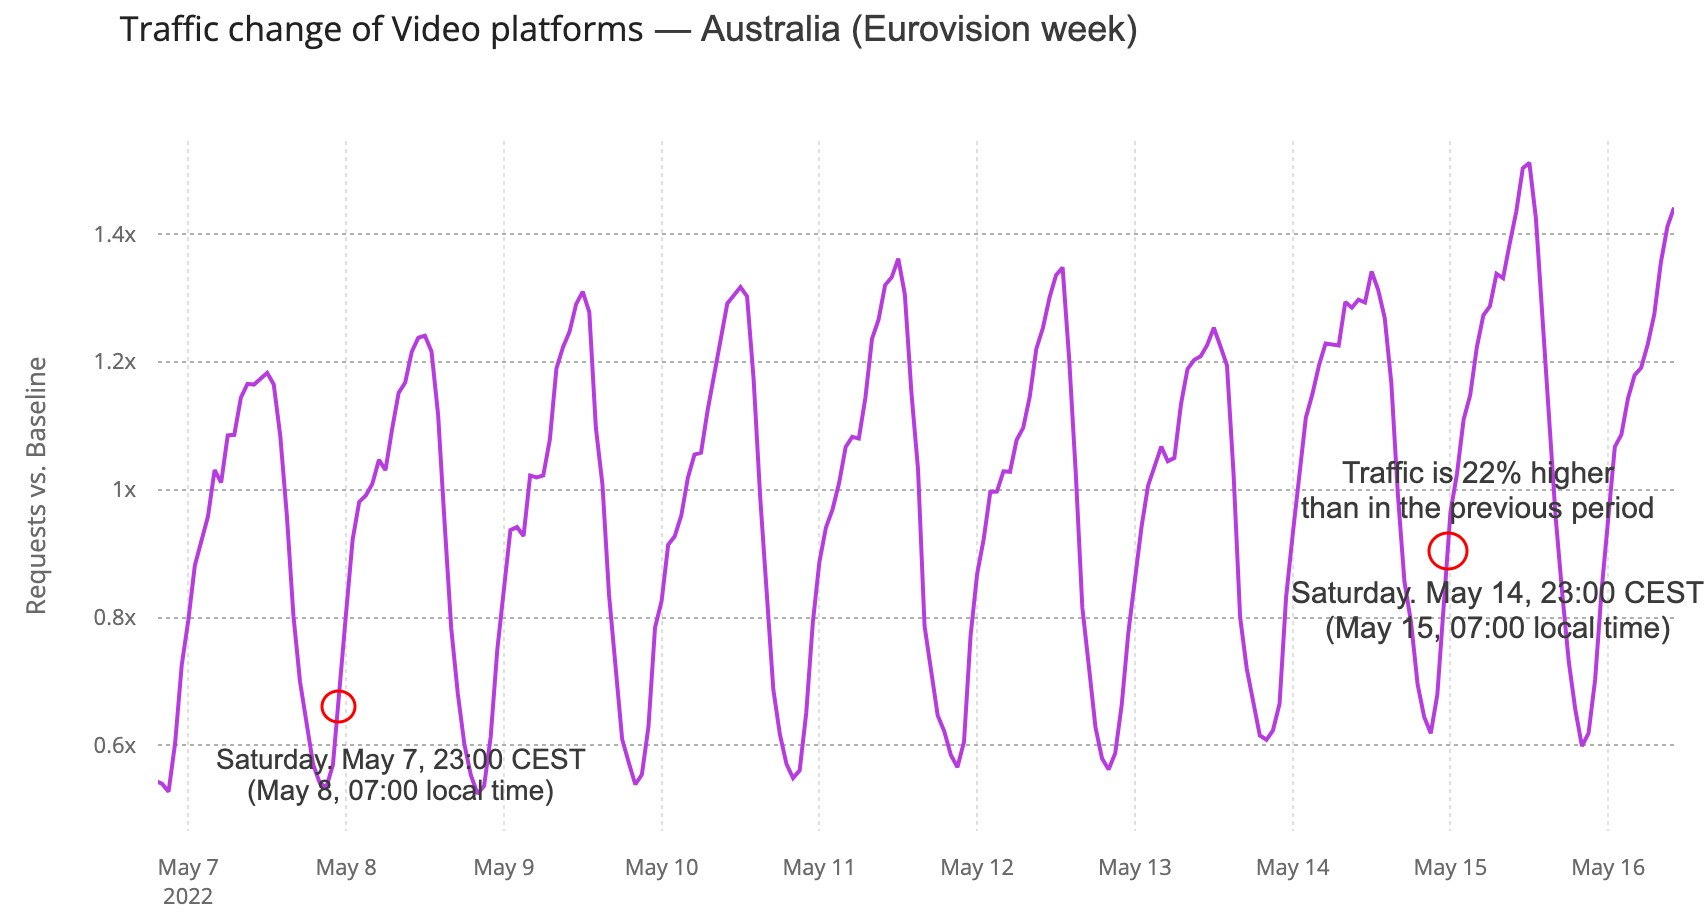
Australia’s impact (with an eight hours difference)
Australia was one of the 40 participants, and it had a major time difference (there’s an eight-hour difference to CEST). Continuing to look at video platforms, DNS traffic in Australia was 22% higher at 23:00 CEST (07:00 local time) than it was in the previous Saturday and continued high around 17% of increase a few hours after. Before the 23:00 peak, traffic was 20% higher at 22:00 and 17% at 21:00, when the event was beginning.
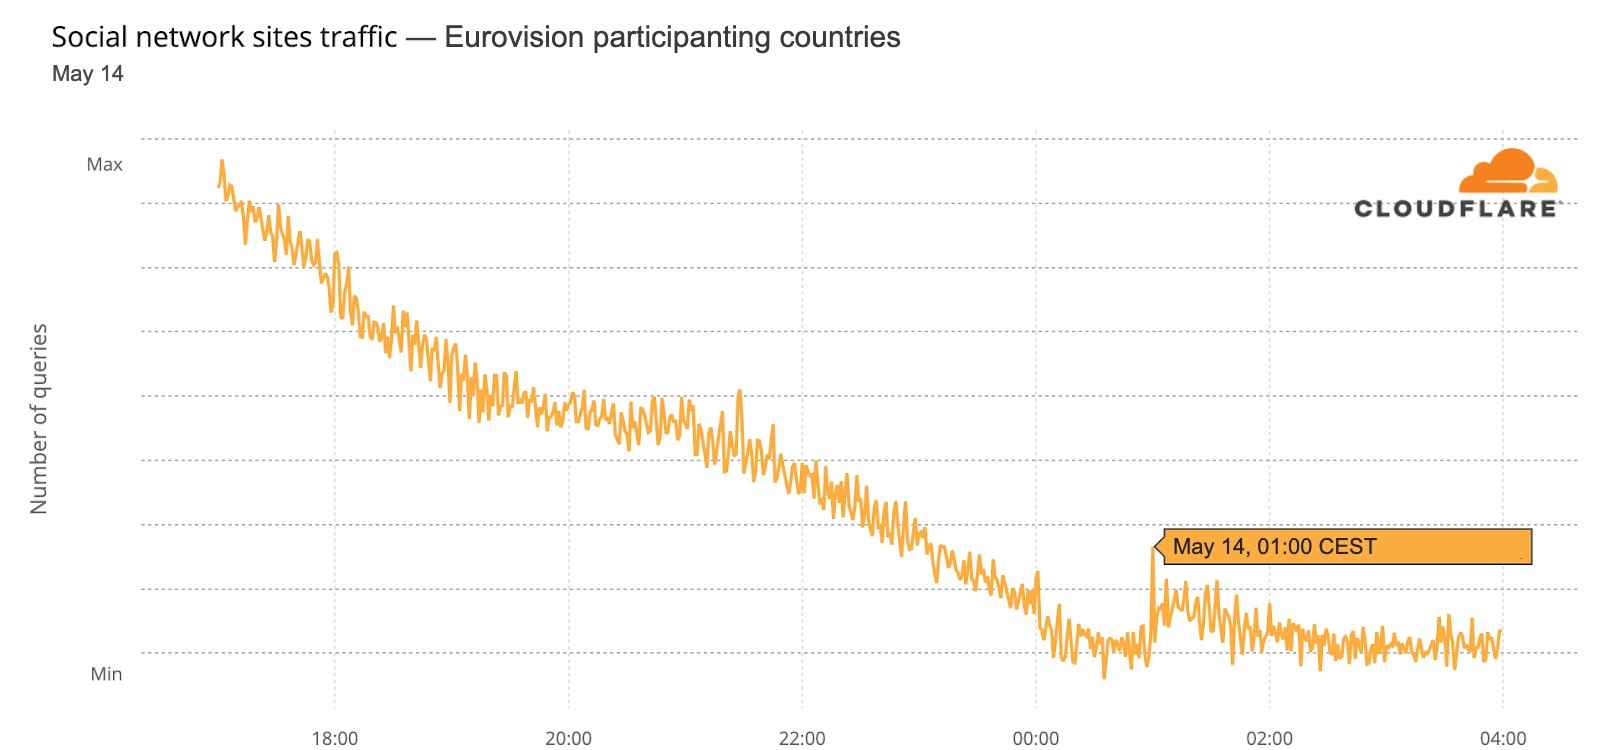
The winners & social media
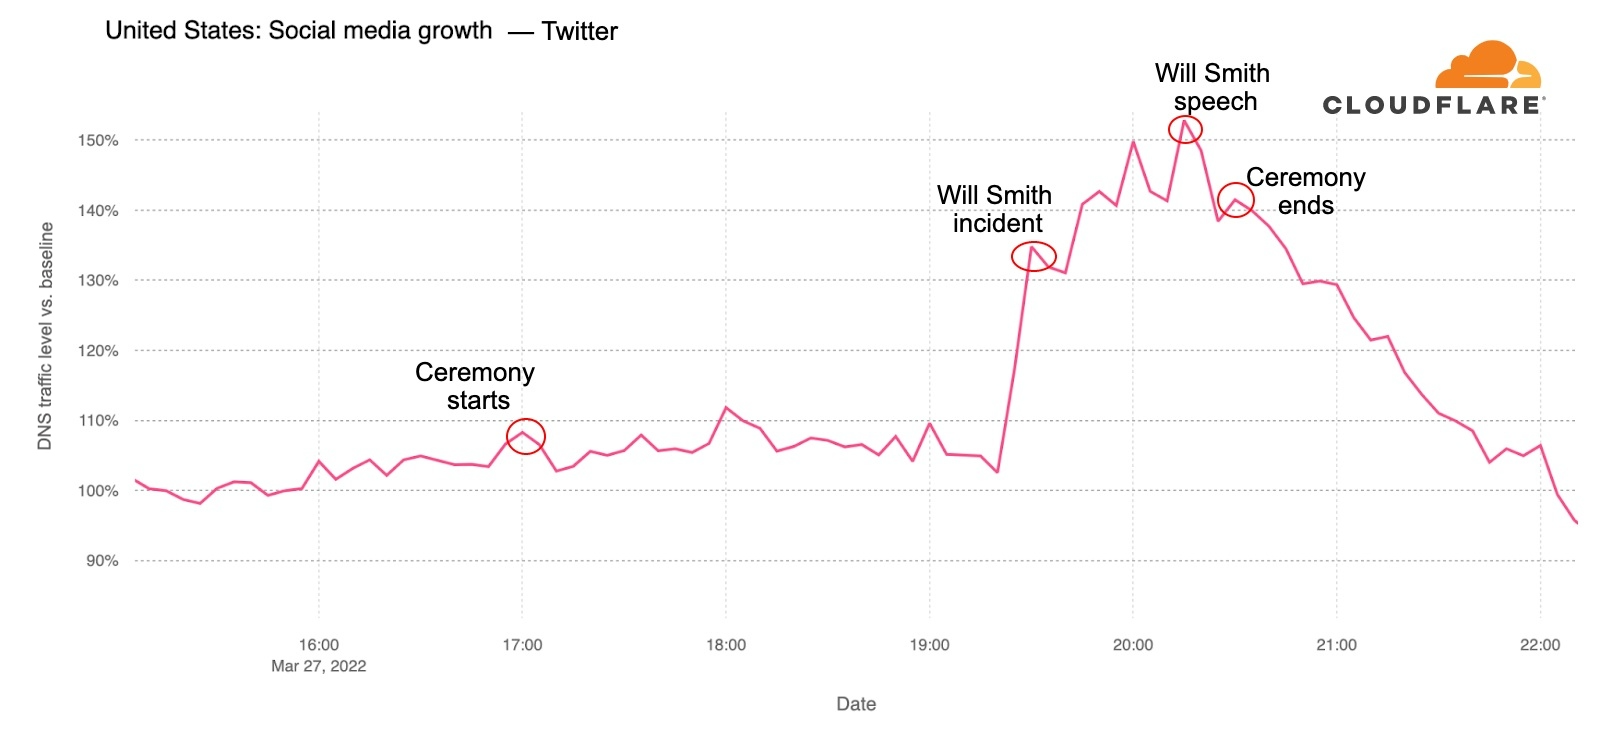
Social media in general in the 40 participating countries wasn’t as impacted, but there was a 01:00 CEST spike during the final at around the time the decision to choose the winner was between Ukraine and the UK — at 01:01 Ukraine was announced the winner of Eurovision 2022.
We can also see an impact on social media in Ukraine, when Kalush Orchestra’s “Stefania” song was announced the winner at Saturday’s, May 14, final (it was already after midnight, May 15). The usual traffic slowing down night trend that is seen in other days was clearly interrupted after 01:02 CEST (02:02 local time in Ukraine).
Conclusion: the Eurovision effect
When an event like Eurovision happens, there are different patterns on the Internet in the participating countries, usually all in Europe (although this year Australia was also there). Fan and broadcaster websites have specific impact because of the event, but in such a multimedia event, there are also some changes in video platforms’ DNS traffic.
And that trend goes as far as the Internet traffic of the participating countries at a more general level, something that seems to indicate that people, at least for some parts of Eurovision and in some countries, were more focused on their national TV broadcast.
The Eurovision Song Contest has a history that goes back to 1956, so it’s even older than the European Union and one of its highlights over the years was being the first global stage for the Swedish group ABBA — Waterloo won the 1974 edition). This year, for the 66th edition, we have a dedicated page for Eurovision fans, journalists or anyone interested in following Internet trends related to the event taking place in Turin, Italy.
The contest consists of two semi-finals and a final. The first semi-final is today, May 10, at 21:00 CEST, the second is Thursday, May 12, at 21:00 CEST. And the final is on Saturday, May 14, at 21:00 CEST. We are using Central European Summer Time and not our usual (on Radar) UTC because that’s the timezone of most of the 40 countries that will take part in the contest. There will be 17 countries in the first semi-final, 18 in the second, and 25 in the final (the full list is here).
From countries to fan sites.
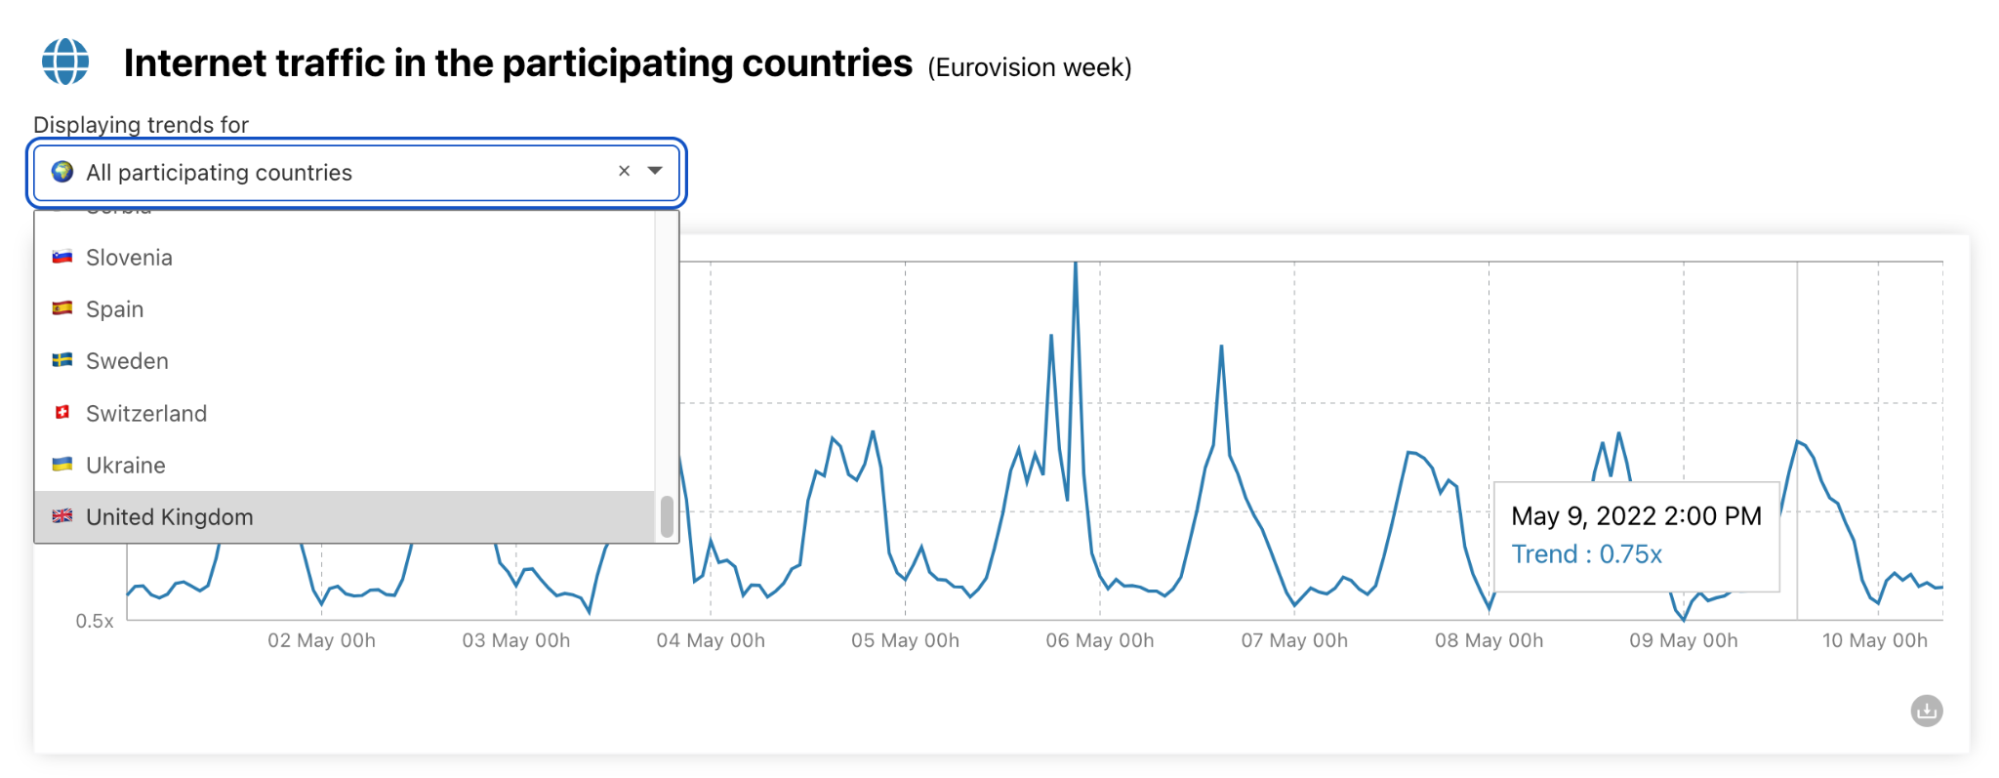
First, you can see the Internet traffic aggregate in all the 40 countries that are participating in Eurovision 2022. There’s also a toggle to choose each of the 40 countries regarding Internet traffic. If you pass the mouse over the traffic line, the traffic level hour by hour is also highlighted.
Then, we use DNS name resolution data to estimate traffic from the 40 participating countries to several types of websites. We have a video platforms chart as Eurovision has content on major video platforms. The baseline for the values we use is the average of the previous week, represented in the charts.
We also show social media trends in the participating countries, by hour, to see if the Eurovision semi-finals and final cause a change.
The contest has a large base of fan websites (there’s even the OGAE, General Organisation of Eurovision Fans), and we also have a chart for Eurovision fan sites. In this chart, yesterday at 20:00 CEST, traffic was already at its highest since May 1, with 6.22x more than the average of the previous week (that’s the baseline here).
Last, but not least, we also show the impact on national official broadcasters’ websites from the participating countries. For all the charts, there’s a download button to save the image file like this:
For this evening’s first semi-final, Portugal is participating and since we’re writing this blog post from our Lisbon office, I asked everyone’s favorite songs for the 2022 Eurovision edition. Norway’s song from Subwoolfer, Give That Wolf A Banana, was one of the favorites, followed by Portugal’s song from MARO, Saudade, Saudade.
The UK’s song from Sam Ryder, SPACE MAN, is automatically in Saturday’s final and was also praised at the Lisbon office, the same with France’s song from Alvan & Ahez, called Fulenn, where the group sings in their native language, Breton (from the French region of Brittany).
We blogged previously about some trends concerning the first round of the 2022 French presidential election, held on April 10. Here we take a look at the run-off election this Sunday, April 24, that ended up re-electing Emmanuel Macron as President of France.
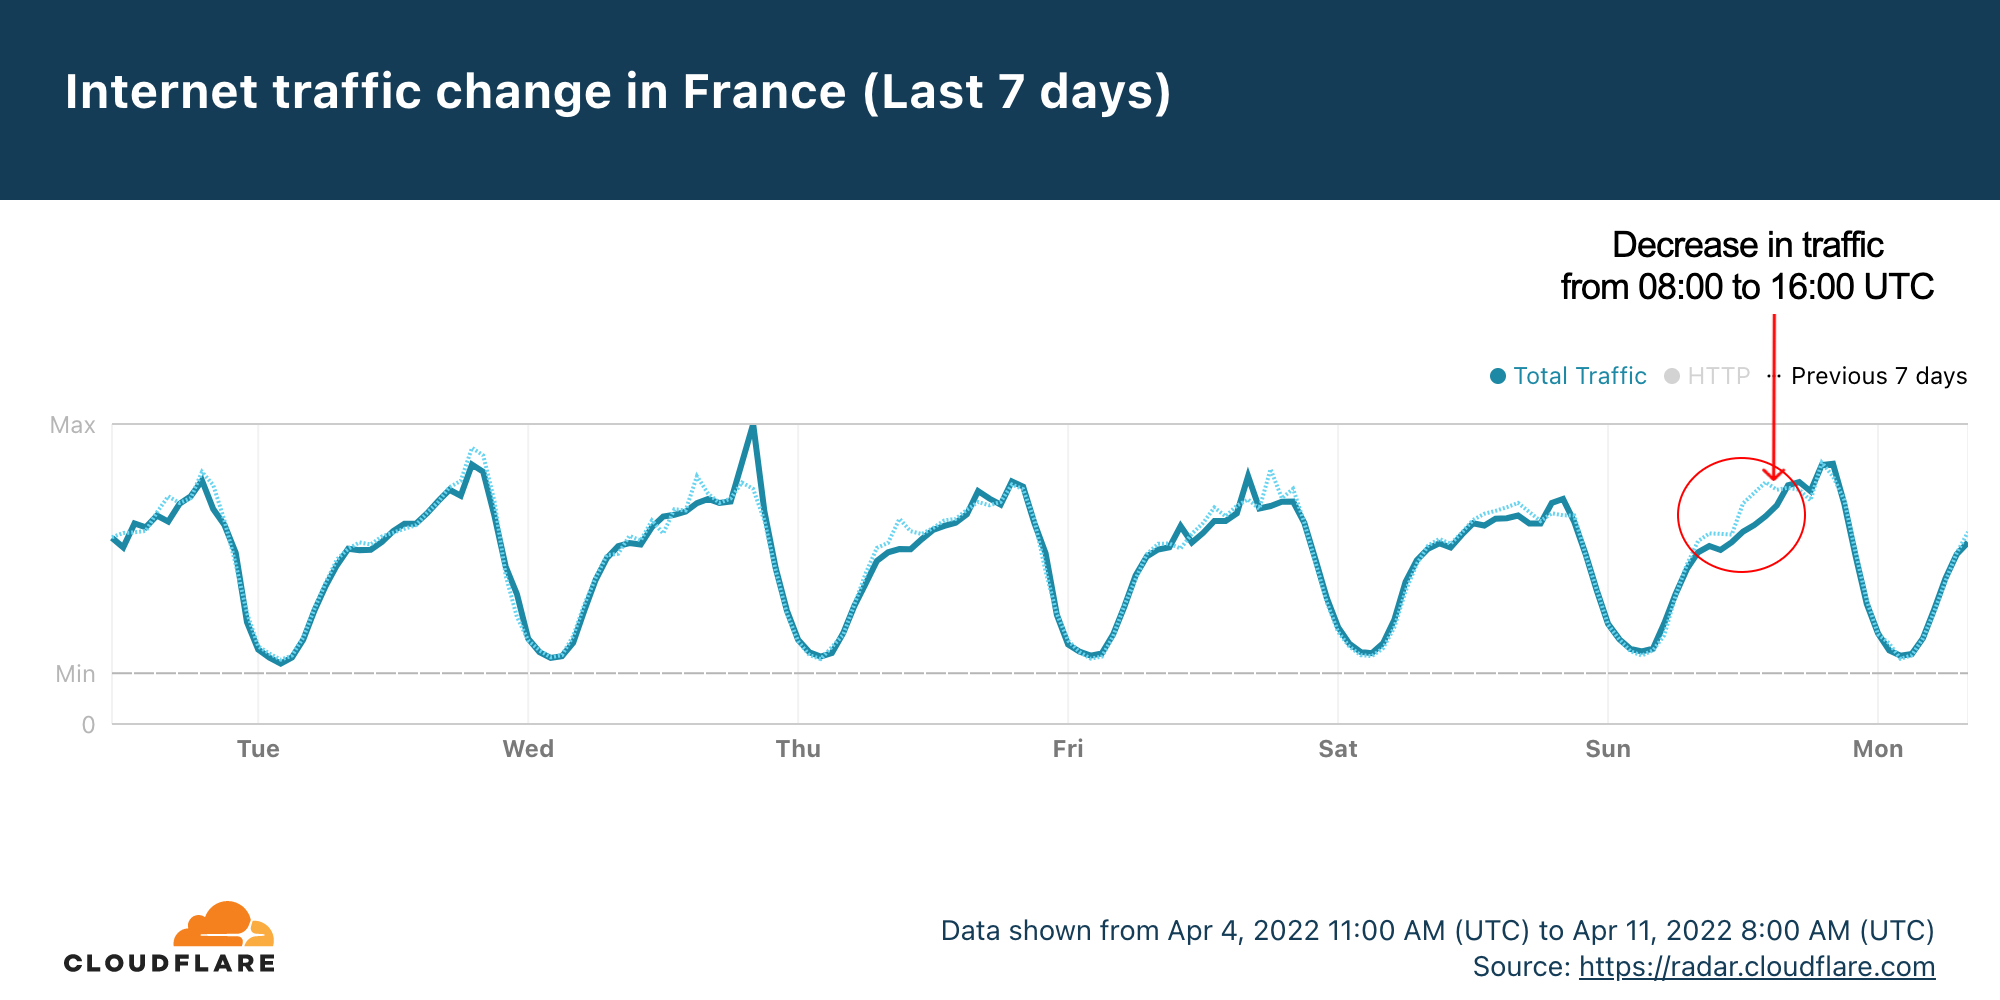
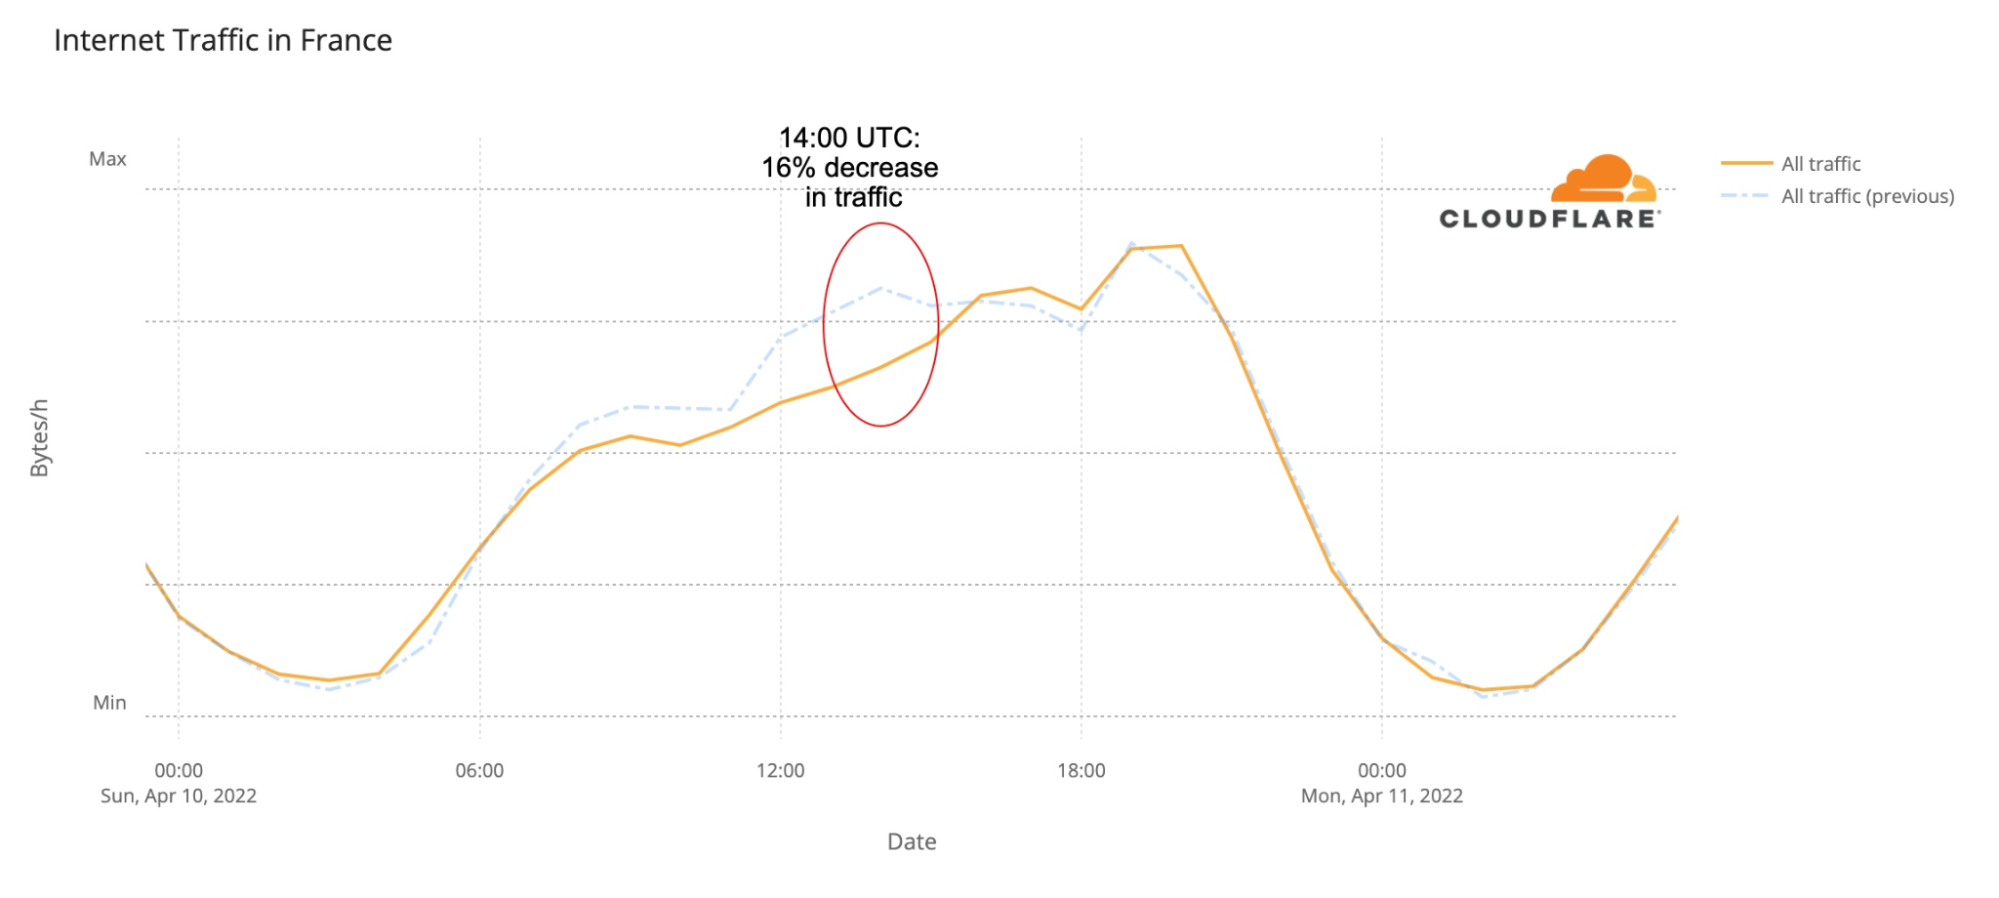
First, the two main trends: French-language news sites outside France were clearly impacted by the local rule that states that exit polls can only be published after 20:00.
And Internet traffic was similar on both the election days (April 10 and 24) and that includes the increase in use of mobile devices and interest in news websites — there we also saw a clear interest in the Macron-Le Pen debate on April 20.
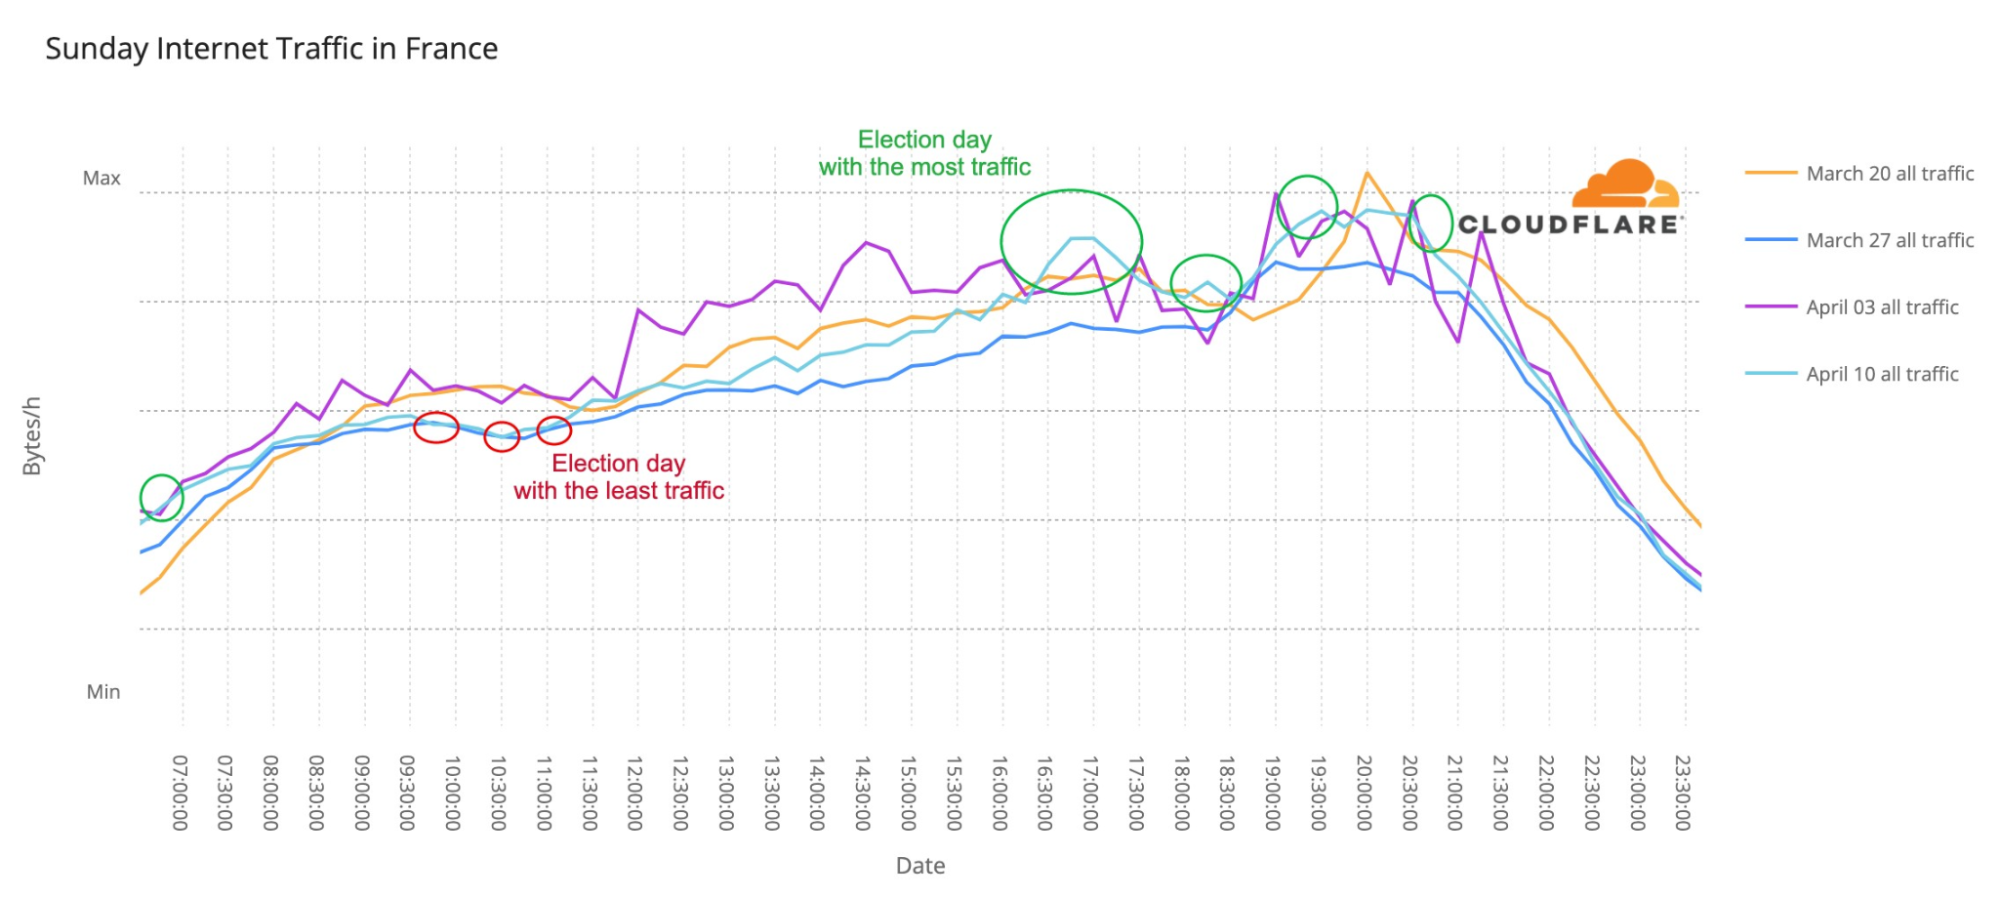
We have discussed before that election days usually don’t have a major impact on overall Internet traffic. Let’s compare April 10 with 24, the two Sundays when the elections were held. The trends throughout the day are incredibly similar (with a slight increase in traffic on April 24), even with a two-week gap between them.
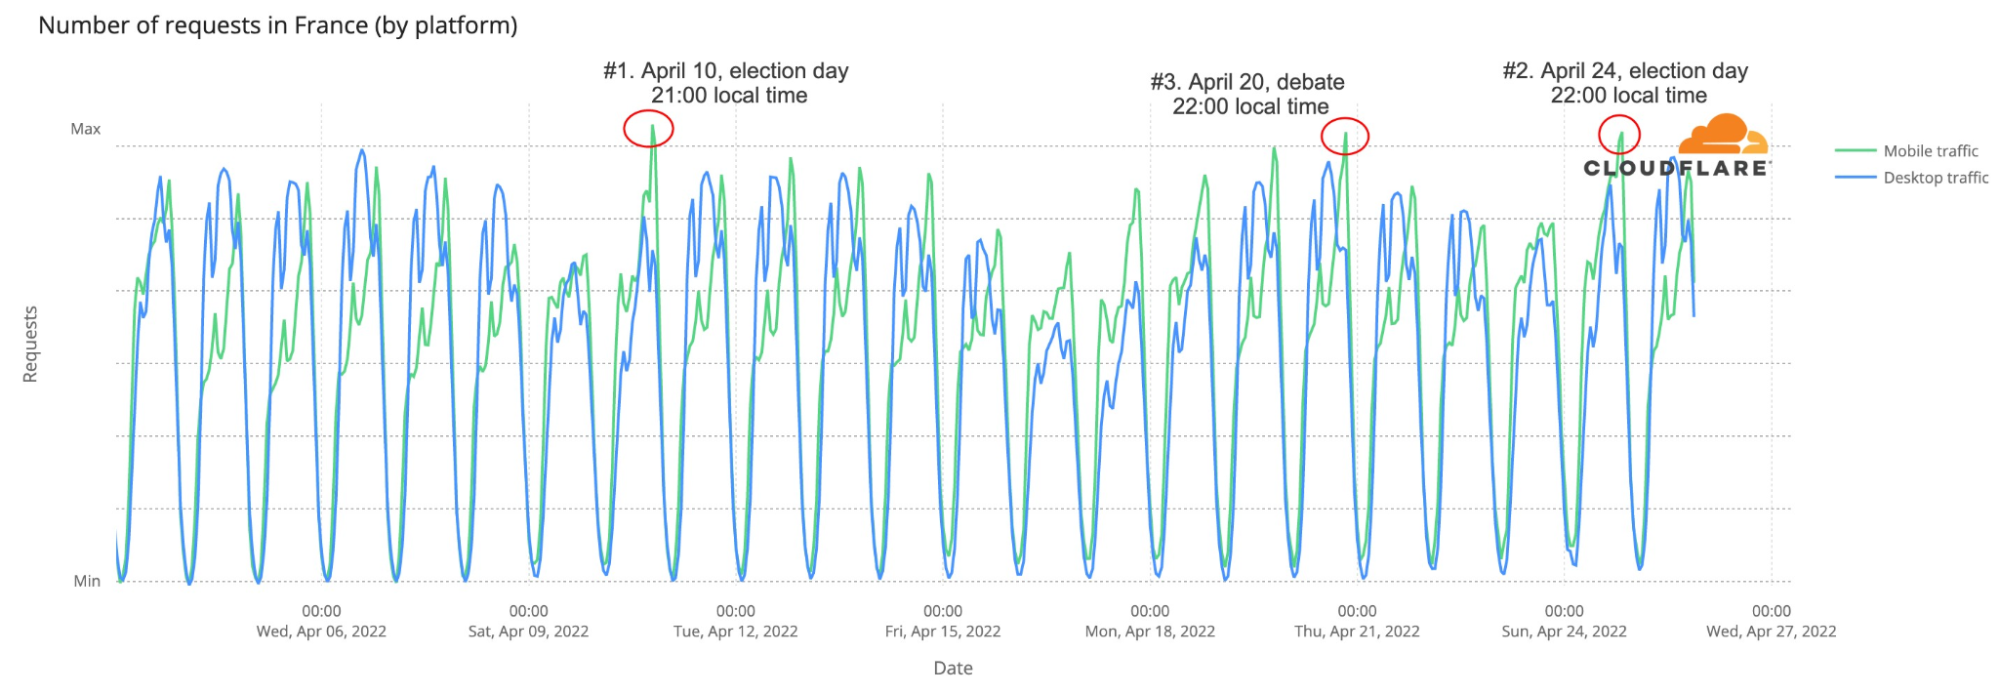
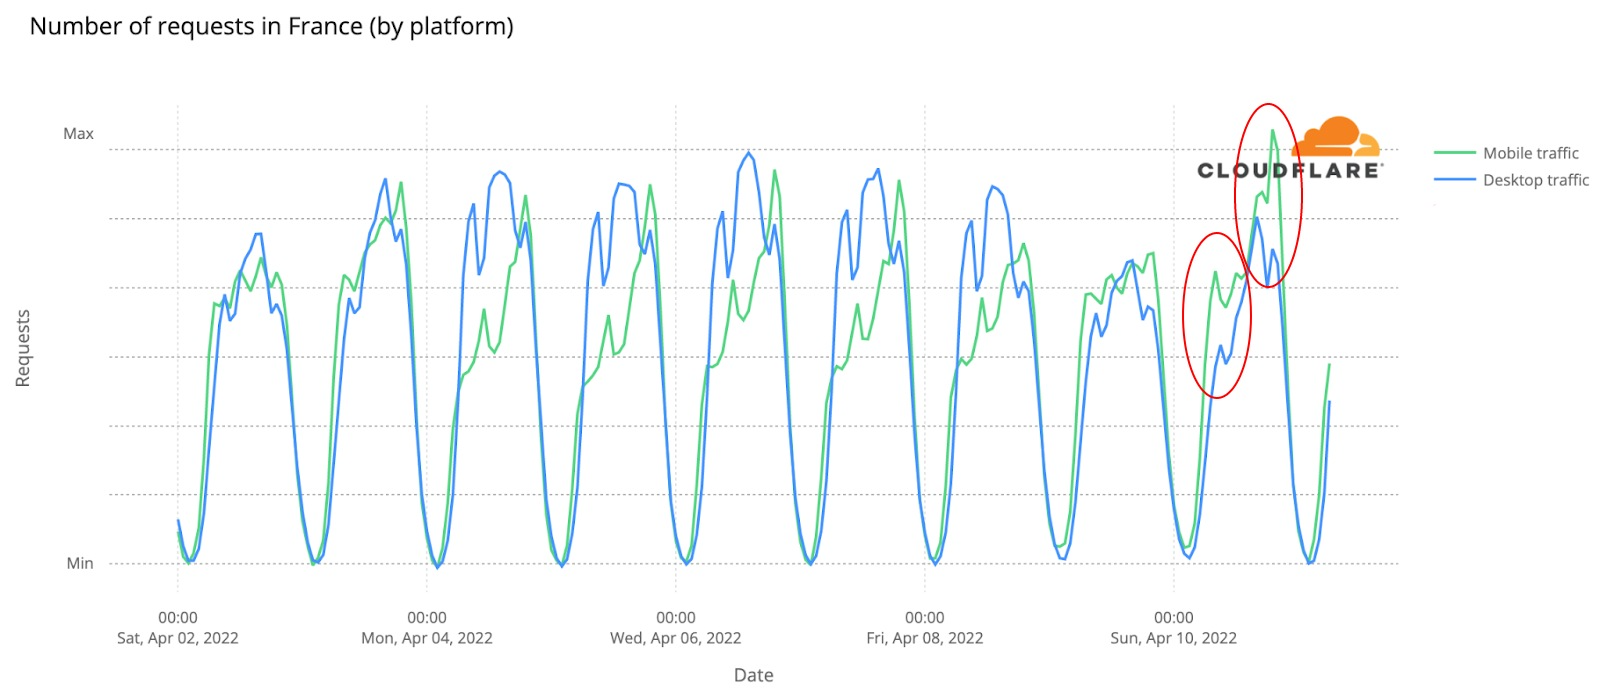
Another election-day trend is the use of mobile devices to access the Internet, mainly at night. The largest spikes in number of requests made using mobile devices in France during April seemed to be all election-related:
#1. April 10 (first round of the election), 21:00 local time. 58% of traffic by mobile devices.
#2. April 24 (second round of the election), 22:00. 57% mobile traffic.
#3. April 20 (presidential debate), 22:00. 56% mobile traffic.
Not only did both the election Sundays (after the polling stations were closed) have an impact on mobile traffic in France, but the presidential debate (Wednesday, April 20) had the same type of impact, increasing requests from mobile devices.
The TV debate was seen by 15.6 million viewers in France and lasted between 21:00 and 22:45, local time; at the same time mobile traffic was higher than in any other Wednesday and was the #3 spike of April, with 10% more mobile requests than in the previous Wednesday at the same time.
The special case of French-language news sites
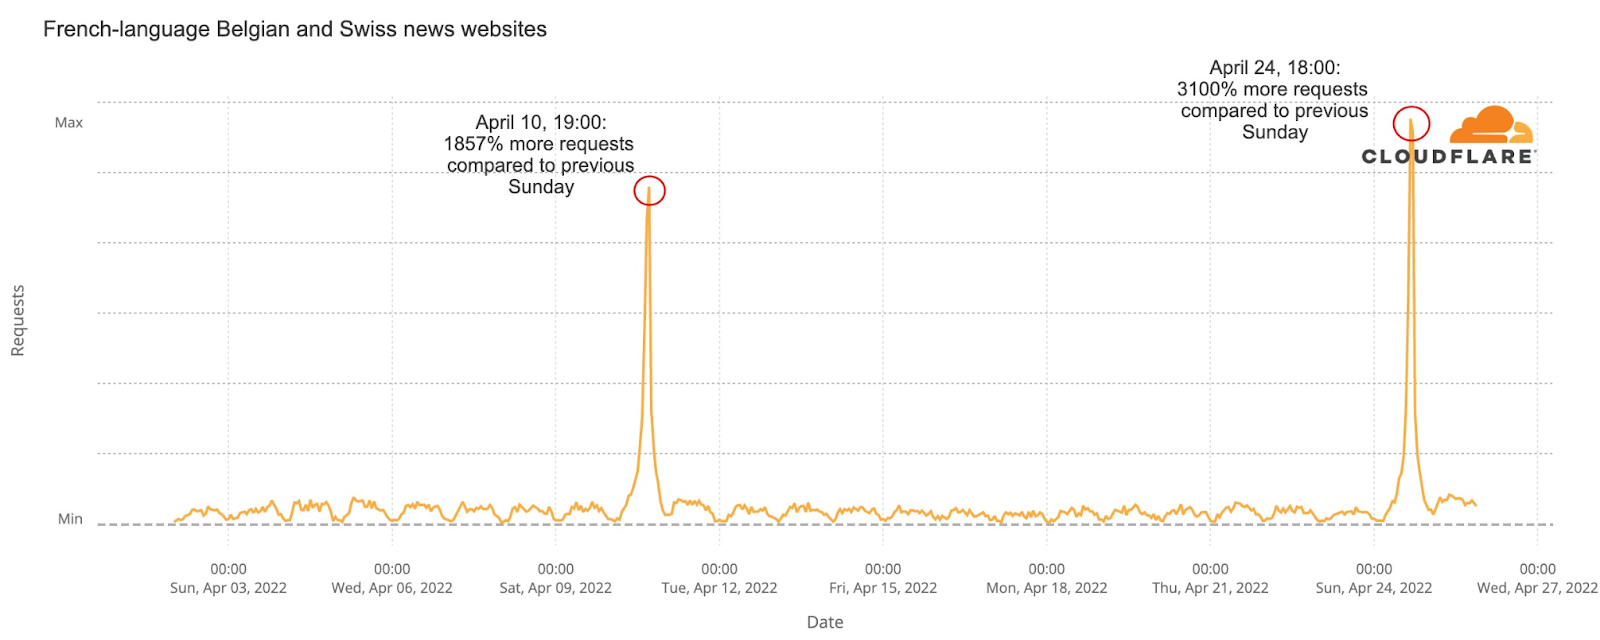
For the elections, local rules state that French media is barred from publishing partial results or polls of any kind until 20:00, the time when voting stations in metropolitan France officially close. So, that means that French news outlets have to wait for the allotted hour to give official projections.
Given that, we looked at French-language news websites from French-speaking countries like Switzerland and Belgium. They aren’t bound by French law and can show information about exit polls earlier (bear in mind that in most French cities polling stations close at 19:00 and only in the bigger cities does it go on until 20:00).
We can clearly see that requests to French-language news sites outside France clearly spiked earlier than those in France. News websites in France had spikes after 20:00 local time on both elections days, but Belgian and Swiss news sites had major increases in traffic at 19:00 on April 10 (1857% more than the previous Sunday!). For the runoff elections on April 24, the biggest spike of the month was at 18:00 (3100% more requests than the previous Sunday), but it was also higher than on previous days one hour later, at 19:00 (3080% higher).
There are no spikes at all related to the French debate (April 20), so that seems to show that those Belgian and Swiss news sites had a huge increase of French citizens eager to see the polls before 20:00.
Election results change online patterns
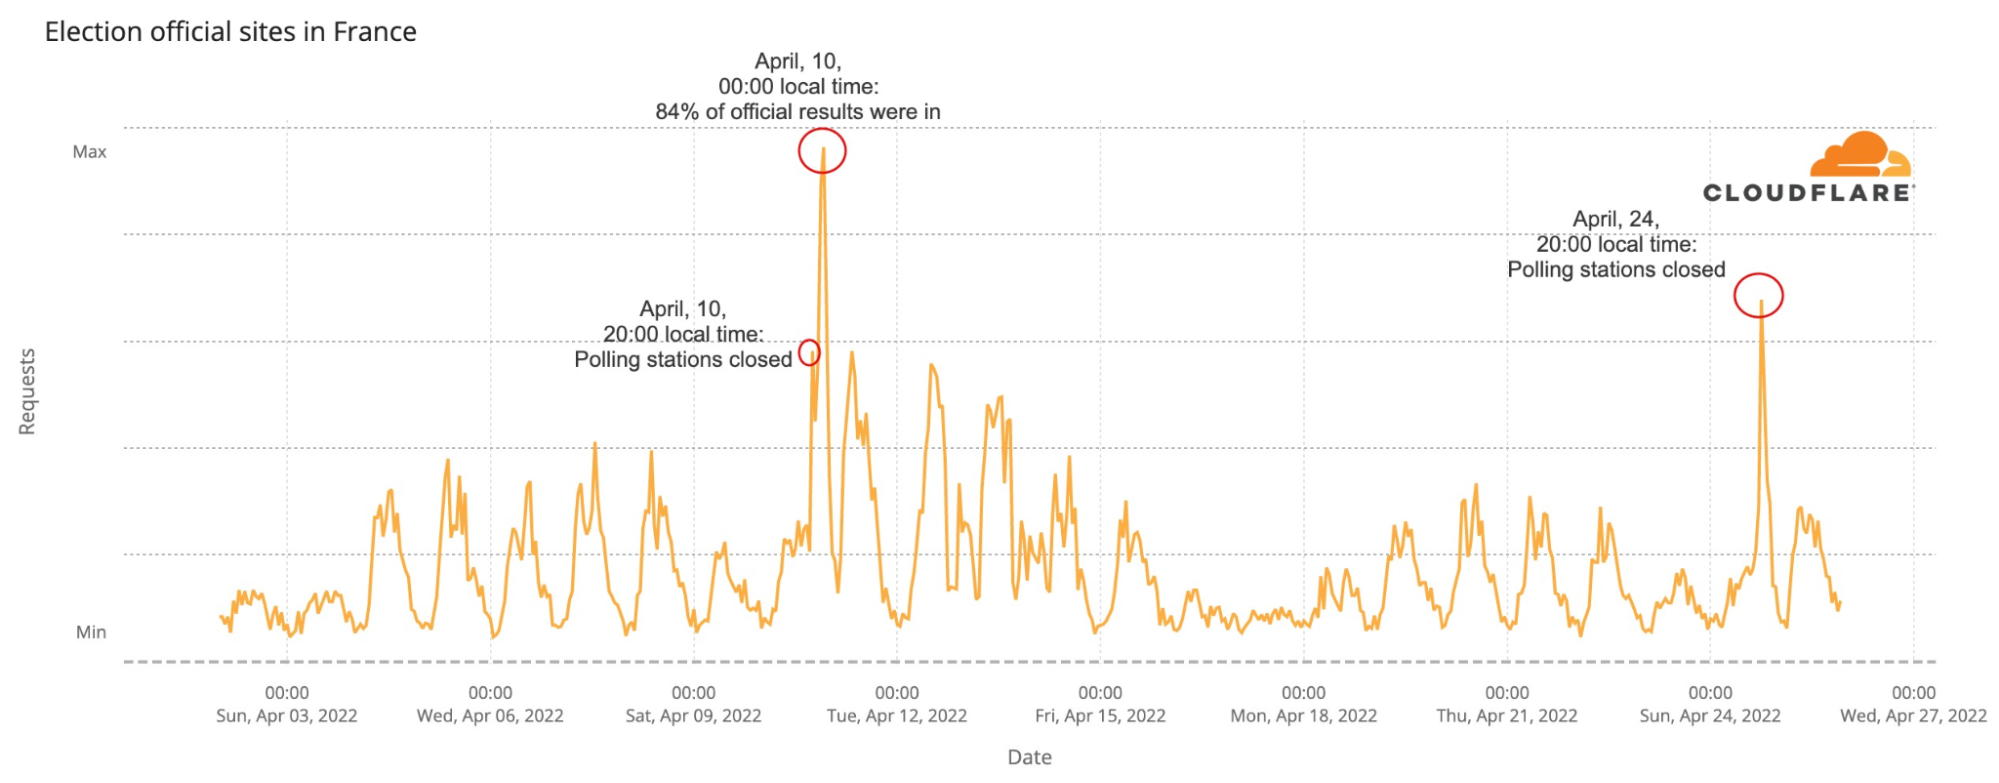
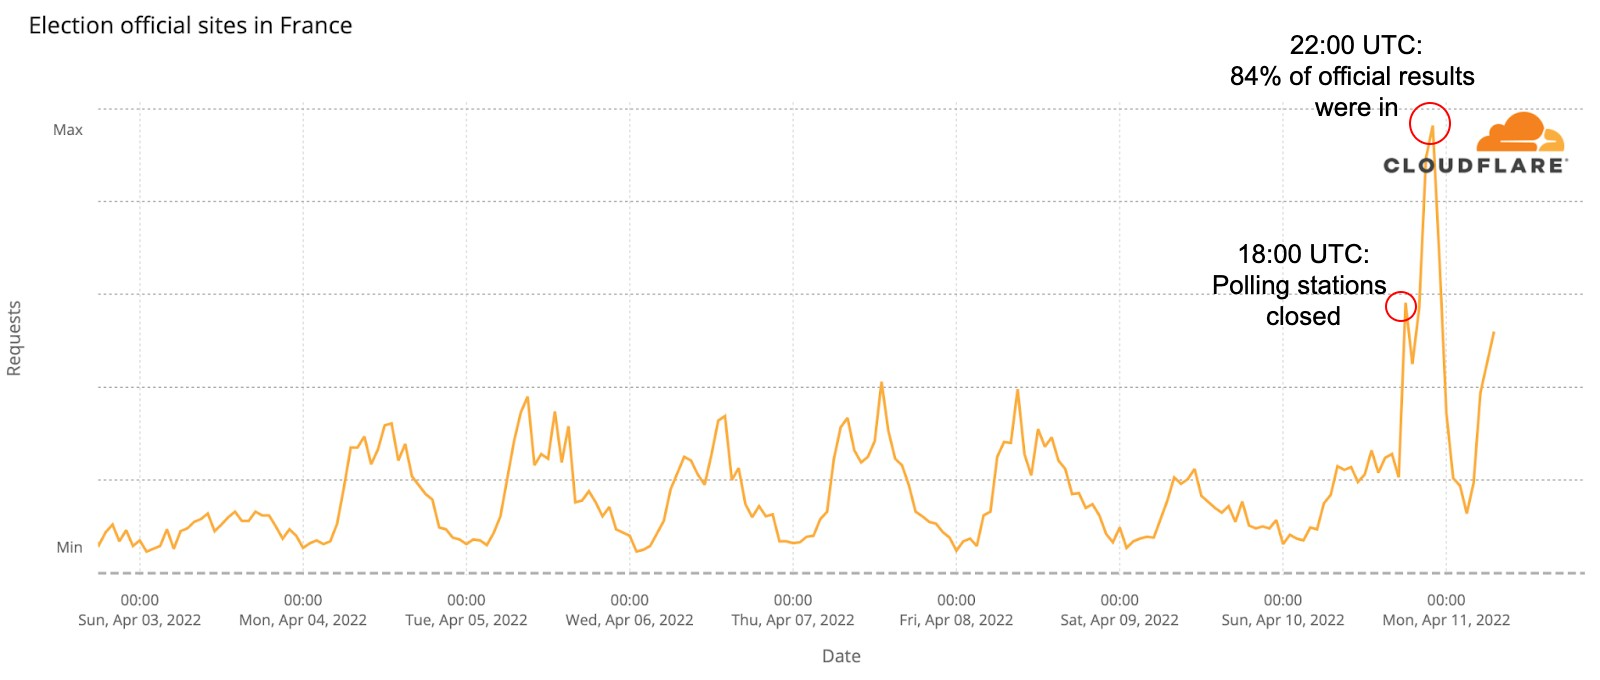
We saw two weeks ago that official election websites had a clear spike in requests on April 10, the first round of the elections. Here we’re looking at DNS request trends to get a sense of traffic to Internet properties.
Official French election-related websites had an increase in traffic throughout the week prior to the first round, after Monday, April 4, but it’s no surprise that the two major spikes were on both the elections’ day. How much? Here is the breakdown by bigger spikes in traffic:
#1. April 10 (first round of the election), 00:00 local time. 925% more requests than the previous Sunday (at the same time).
#2. April 24 (second round of the election), 20:00. 707% more requests.
#3. April 10 (first round of the election), 20:00. 370% more requests.
#3. April 11, 10:00. 115% more requests than the previous Monday.
(there’s a draw at these last two spikes)
News sites go up after polling stations close
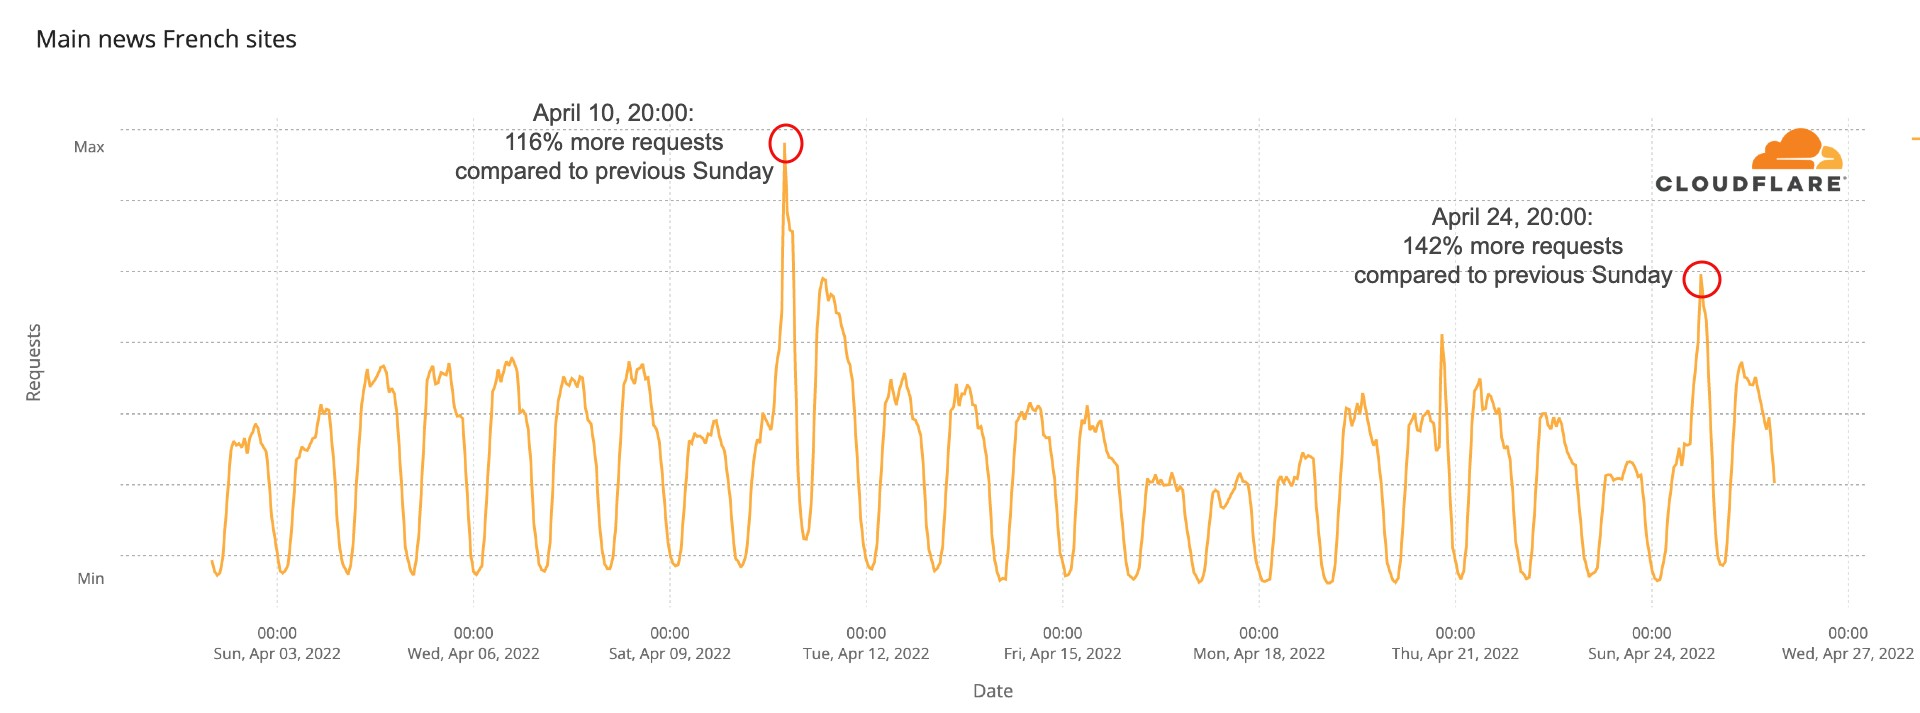
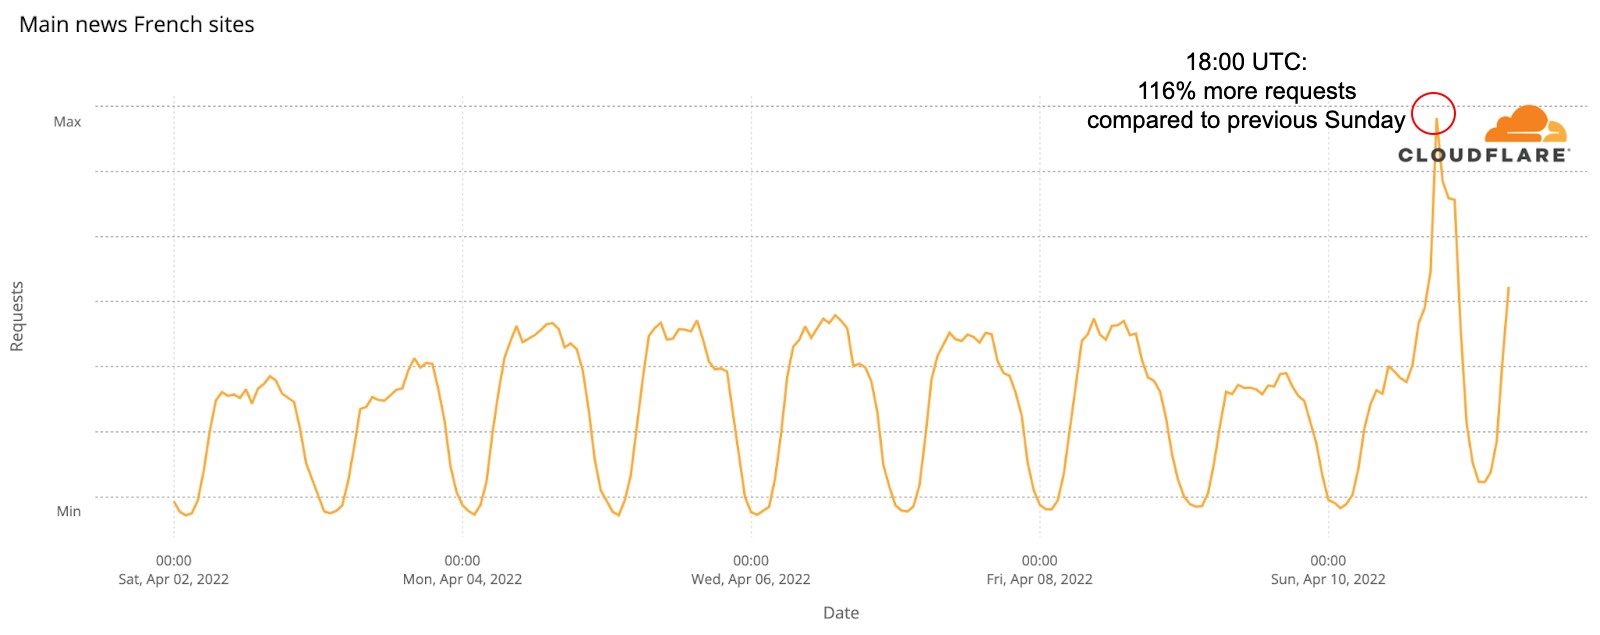
Regarding the main French news websites, as we saw two weeks ago, 20:00 local time, after the polling stations are all closed, and the first major polls are revealed continues to be the time of the biggest spikes of the whole month.
The biggest spike of the month in our aggregate DNS chart, that shows trends from 12 news websites, was definitely on April 10, the first round election day, around 20:00 local time, when those domains had 116% more traffic than at the same time on the previous Sunday. And the second-biggest spike was the runoff election day, on April 24, at the same time (20:00 local time), with an increase of 142% in traffic compared to the previous Sunday at the same time.
Very close to those two spikes is Monday morning, April 11, after the first round of the elections. At 10:00 local time requests were 45% higher than in the previous Monday. The Macron-Le Pen debate on Wednesday, April 20, also had a spike. At 21:00, when it was starting, requests were 56% higher than on the previous Wednesday.
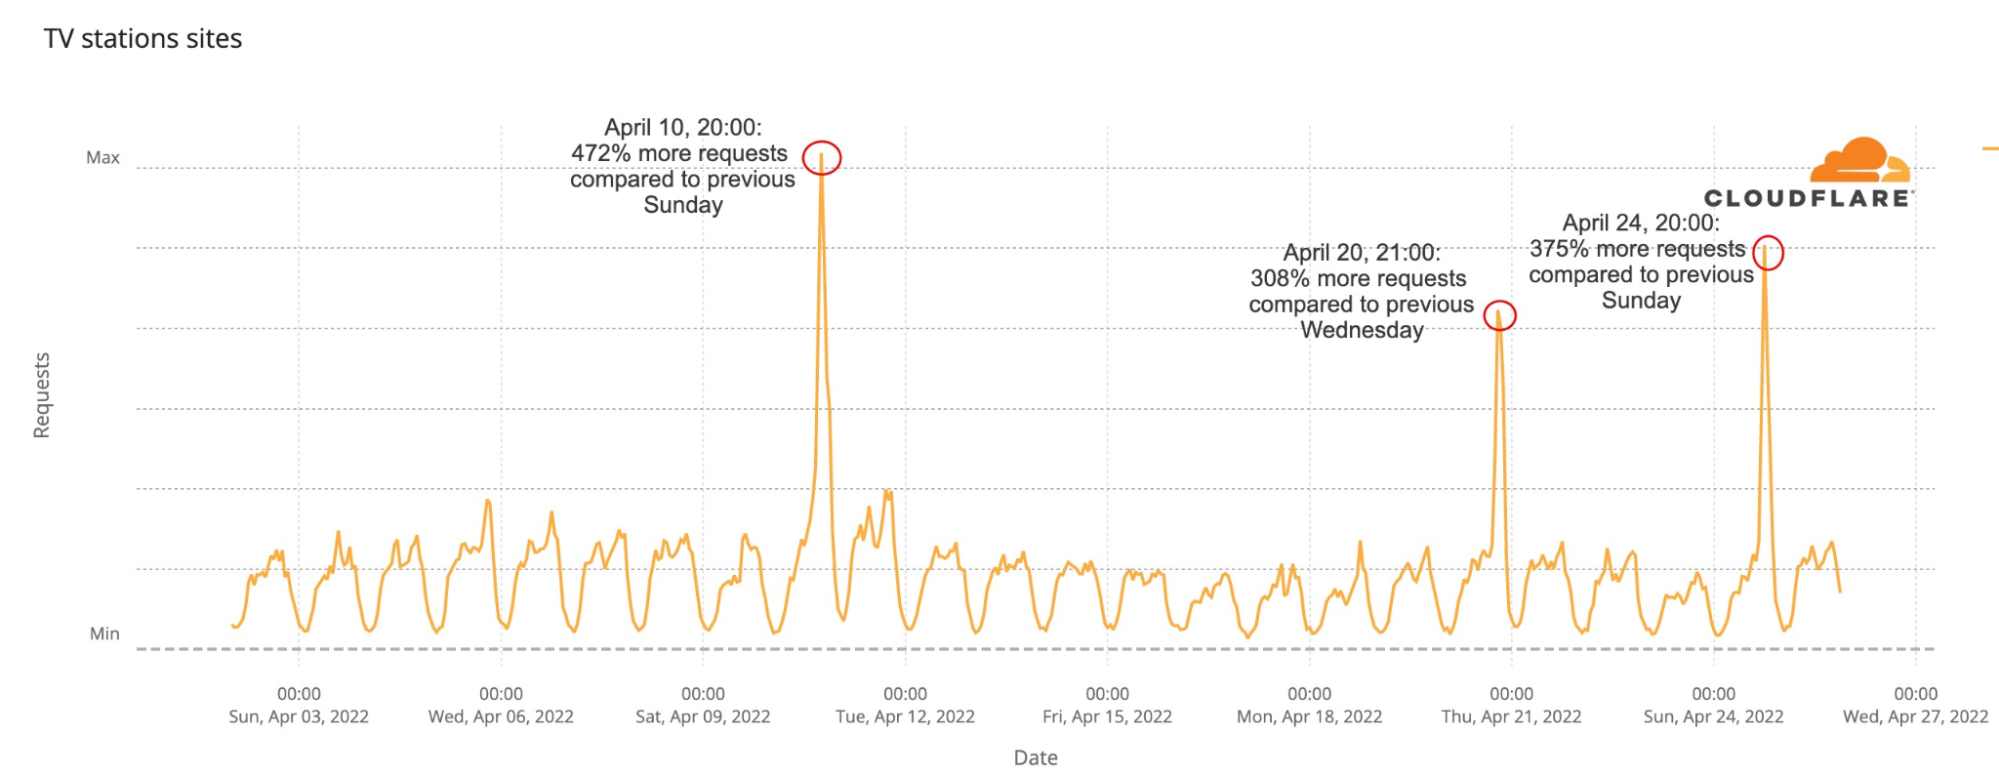
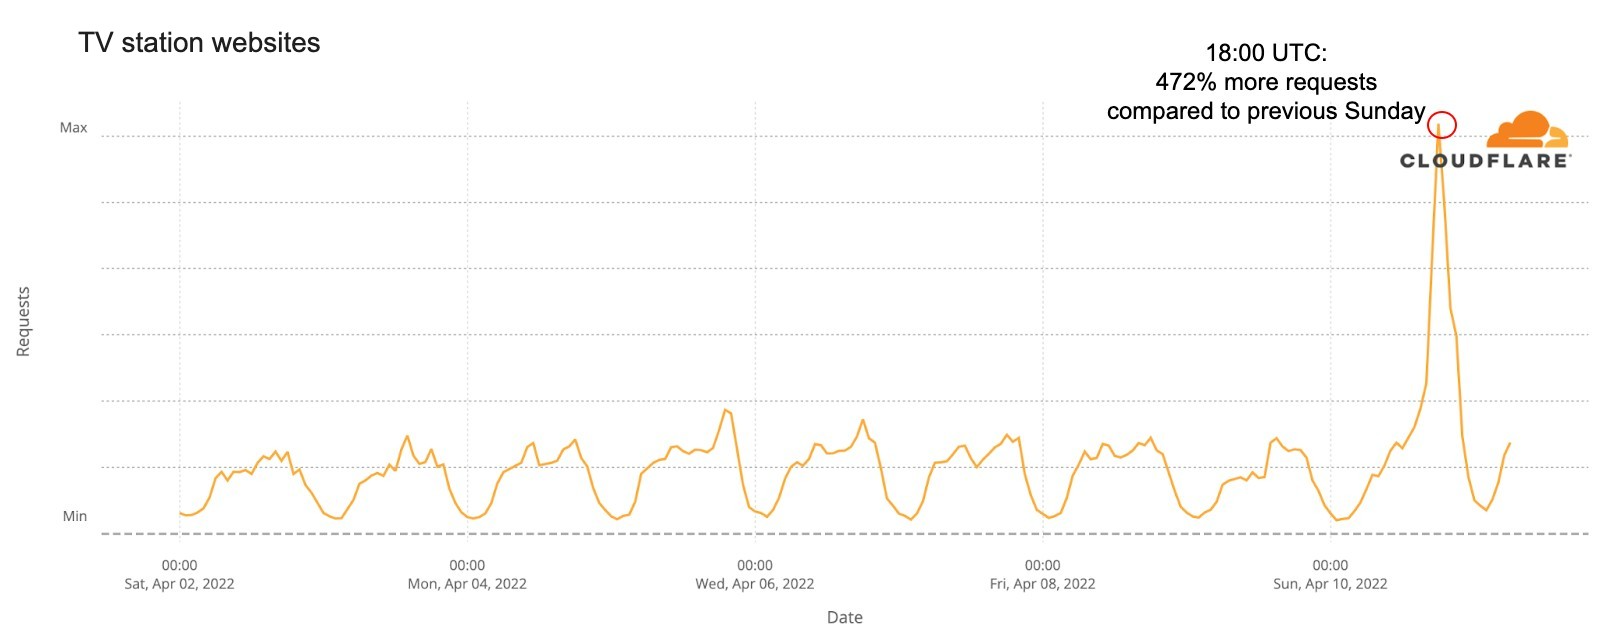
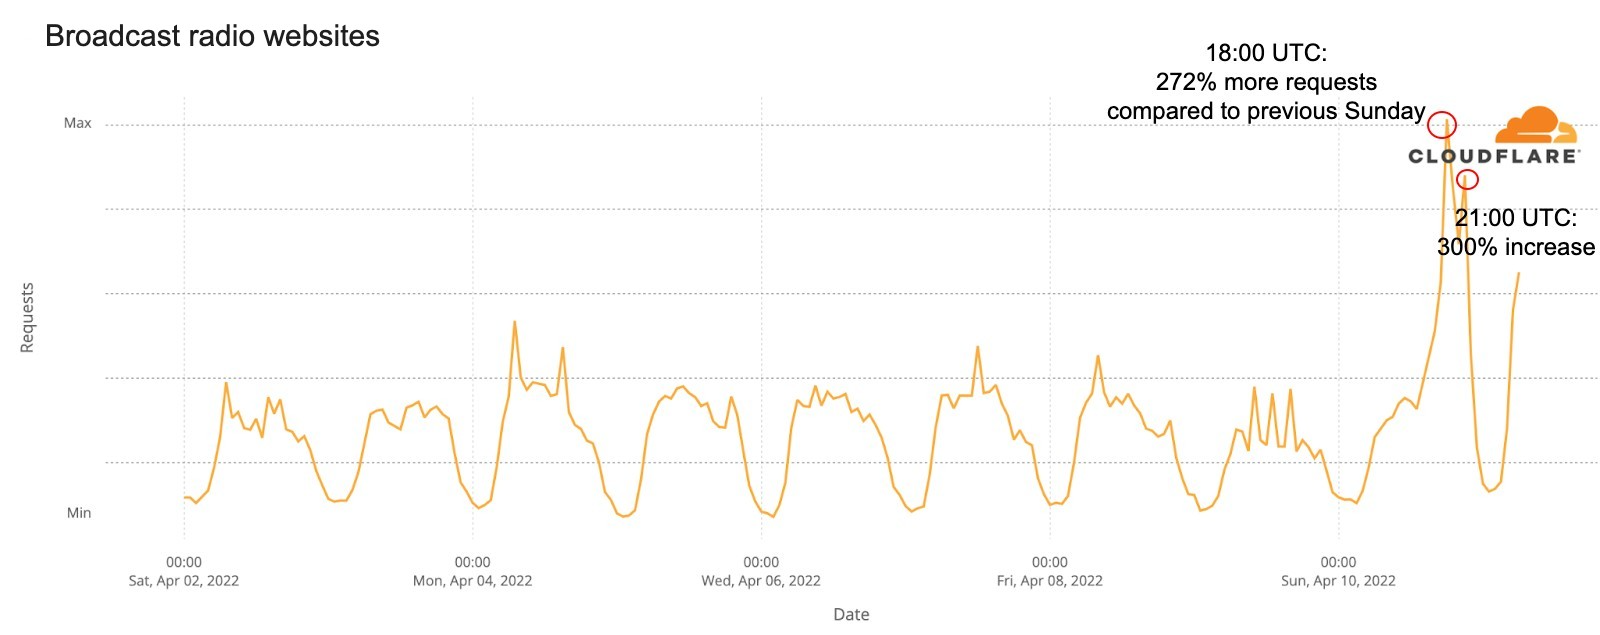
The same trend is seen on the major French TV station websites, with a clear isolated spike on April 10 (the first round election day) at 20:00 local time, with a 472% increase in traffic compared to the previous Sunday, when the main exit polls were announced. Something similar, at the same time (20:00), on April 24, with a 375% increase in requests compared to the previous Sunday.
That’s only matched, again, by the April 20 debate. At 21:00 traffic was 308% higher than the previous Wednesday, so people were clearly taking notice of the debate and checking news outlets and TV station websites — there were French sites like france.tv that transmitted via streaming.
Conclusion
When people are really eager to see something as important as election results, they go and search where the first polls are (in this case, before 20:00 local time, they are outside France).
Also, in two different election moments in France separated by two weeks, there are clear similarities in Internet trends that show the way people use the Internet during election periods. That’s more clear when results start to arrive, but also a debate as important for a presidential election as the Le Pen-Macron one, also impacts not only the Internet traffic but also the attention to news and TV websites.
“Our new Constitution is now established, and has an appearance that promises permanency; but in this world nothing can be said to be certain, except death and taxes.” — Benjamin Franklin, in a letter to Jean-Baptiste Le Roy, 1789
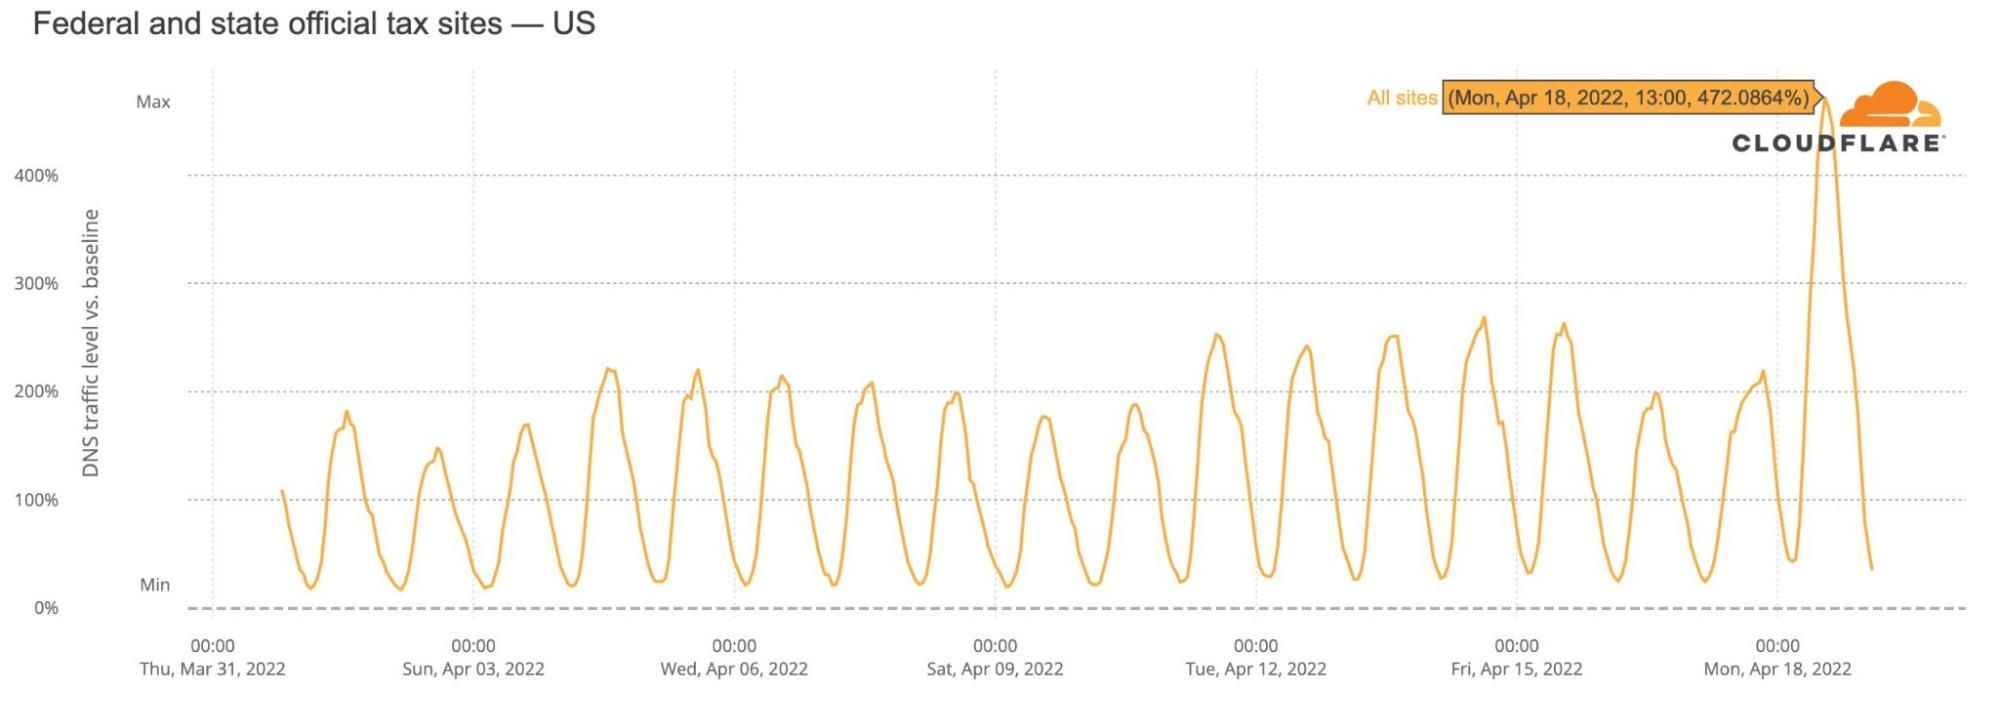
The famous expression highlighting that only “death and taxes” seem certain in life (something that goes back to the beginning of civilization and to Ancient Egypt) is on people’s minds during the month of April in the United States. This past Monday, April 18, 2022, was Tax Day. So, were US citizens procrastinators, leaving their federal (and state) tax returns to the last day? Traffic to tax-related official federal and state websites seems to show it: there was a spike of more than 470% on April 18.
Just for reference, we can see on Cloudflare Radar that Internet traffic in the US, from our perspective, wasn’t significantly impacted on Monday, April 18, although there was a clear peak, higher than in the previous 14 days, that night at 22:00 EST (that’s 02:00 UTC on April 19). So, traffic (that includes DNS and HTTP requests from our standpoint) was 18% higher compared to the same time on the previous Monday.
For the following charts, Cloudflare Radar uses a variety of sources to provide aggregate information about Internet traffic and attack trends. In this blog post, we will use DNS name resolution data as a proxy for traffic to Internet services, as we did for Super Bowl LVI or for the Oscars 2022.
In this case, the baseline value for the charts (that we use to get the percent growth) was calculated by taking the mean DNS traffic level for the associated Internet services on March 31 — a typical day before from the April 18 deadline. On these charts, we are using the EST timezone.
Let’s start with an aggregate of all the federal and state level official tax-related sites. This Monday, DNS requests jumped at 13:00 EST to 472% more than usual (the average on March 31 for all the 51 sites we’re checking is the baseline here). That’s 203% more than the previous highest growth day in April.
Here are the top five days in April ranked by traffic increase:
US federal and state official tax sites peaks in requests
Monday, April 18 (Tax Day 2022), 13:00 — 472% growth.
Thursday, April 14, 15:00 — 269%.
Friday, April 15, 15:00 — 264%.
Monday, April 11, 13:00 — 252%.
Wednesday, April 13, 14:00 — 251%.
Taxes on weekdays
Another trend in the previous chart is that people seem to use more weekdays in April than the weekends to submit their taxes (or to visit official tax-related sites). That’s a trend we see not only for federal sites, but also for the state ones (even more in the latter).
State official tax sites also have a bigger growth in requests in April, from our perspective, than federal, but the general growth is very clear right from the beginning of April, with a relevant peak going up to 221% of increase in traffic at 13:00 EST on April 4.
Another more specific trend regarding Tax Day 2022 was that traffic was higher than before any other day in April right around 09:00 (with 293% increase) and it continued that way until 20:00.
Tax services with a growth up to 680%
In the taxes filling realm there are also many services, some smaller and local, others national and well known, that help people to do the inevitable business of dealing with sales, income, property, license or other taxes.
The peak was reached on Monday, April 18, at 19:00 EST with a growth in requests of 680%. It was a busy afternoon and evening across the US for tax services.
And here’s the top five ranking of traffic growth for tax services sites in April:
US tax services sites peaks in requests
Monday, April 18 (Tax Day 2022), 19:00 — 680% growth
Sunday, April 17, 20:00 — 439%
Friday, April 15, 12:00 — 328%
Saturday, April 16, 14:00 — 326%
Sunday, April 10, 15:00 — 311%
For these types of sites, there are more spikes of traffic on the weekends than on weekdays and that started right at the beginning of April, with Sunday, April 3, reaching 295% in growth, not that far from the peaks on the days prior to Tax Day 2022.
We can also see in a more detailed view in the next chart that at 10:00 on Tax Day 2022 requests growth were already at an all month high with more than 478% of increase. The sustained growth was maintained throughout the day and only after 22:00 (474%) did it drop lower than in previous days.
Conclusion
No surprise, people are aware of the deadlines for their tax returns, and many do leave it to the last day and that is very clear looking at the trends related to tax sites.
If you’re curious about these types of trends, check Cloudflare Radar for up-to-date insights about all the countries on Earth.
The first round of the 2022 French presidential elections were held this past Sunday, April 10, 2022, and a run-off will be held on April 24 between the top two candidates, Emmanuel Macron and Marine Le Pen. Looking at Internet trends in France for Sunday, it appears that when people were voting Internet traffic went down, and, no surprise, it went back up when results are coming in — that includes major spikes to news and election-related websites.
Cloudflare Radar data shows that Sundays are usually high-traffic days in France. But this Sunday looked a little different.
The seven-day Radar chart shows that there was a decrease in traffic compared to the previous Sunday between 08:00 and 16:00 UTC, that’s 10:00 and 18:00 in local time — bear in mind that polling stations in France were open between 08:00 and 19:00 (or 20:00 in big cities) local time. So, the decrease in traffic was ‘inside’ the period when French citizens were allowed to vote.
That’s a similar trend we have seen in other elections, like the Portuguese one back in January 2022.
The time of the French election day with the largest difference compared to the previous Sunday was 14:00 UTC (16:00 in local time), when traffic decreased as much as 16% (as the previous 7-day chart shows). That’s clear in this chart:
That doesn’t show us precisely how people use the Internet differently on an election day — note that we already saw in the past how the weather, times of the year or even events affect human behaviour and subsequently Internet trends.
Let’s look deeper into those trends. We know that weekdays, weekends and even Sundays have, in many countries, specific patterns so, when we compare the previous four Sundays in France since March 20, we can see some trends highlighted in the next chart:
April 10, Election Day, was the Sunday with the most traffic of the previous month at 06:30 UTC (08:30 local time) and in several periods between 16:30 and 20:45 UTC (18:30 and 22:45 local time).
April 10, Election Day, was the Sunday with the least traffic of the previous month in several periods between 09:45 and 11:15 (11:45 and 13:15 local time) and it was the #3 out of #4 with less traffic between 12:15 and 16:15 (14:15 and 18:15 local time).
This seems to show patterns such as: before going to vote more people than usual were online on Sunday, Election Day (08:30 local time), but traffic went down considerably in the late morning period between (11:30-13:15) and again after lunch (14:15 and 18:15) shortly before the polling stations were closed.
The first exit polls started to be published around 18:40 local time (seen in the second and biggest green circle in the previous chart), but the main exit poll was at 20:00 local time, when all the polling stations were already closed, at that time Internet traffic in France was at its highest compared to Sundays during the past 30 days (seen in the third green circle in the previous chart, 18:00 UTC).
How about mobile devices’ usage trends? People in France were definitely using their mobile devices more on Election Day, and that is also evident when compared to the previous Sunday, April 3.
On Election Day, April 10, 2022, at around 09:00 local time mobile usage represented 60% of Internet traffic and had another spike at 21:00 local time with 58% (the seven-day average for mobile usage in France is 48%).
When results arrive, people go online
Official websites usually aren’t the most popular sites in a given country, their popularity is mostly connected to when citizens have to fill in their tax forms online or want to see something like election results — although news media outlets are also important there. Here we’re looking at DNS request trends to get a sense of traffic to Internet properties.
Official French election-related websites like elections.interieur.gouv.fr (where the results are published) had an increase in traffic throughout the week mainly after Monday, April 4, but on election day there were two major spikes.
The first spike in traffic was around 20:00 local time (370% more than the previous Sunday at the same time), when all the polling stations were already closed and the first major polls were revealed. But the main spike was later, at midnight (local time), when 84% of the votes were already counted and published — Macron was leading (27%) followed closely by Le Pen (25%). That spike represented 925% more requests than in the previous Sunday.
The news Internet traffic spike ‘knocks’ at 20:00
When there are elections in a country, people tend to see the analysis and results using media outlets from radio to TV, but also the Internet — media websites and social media. Let’s focus on French media outlets. The biggest spike of the week in our aggregate DNS chart, that shows trends from 12 news websites, was definitely on Election Day, around 20:00 local time, when those domains had 116% more traffic than at the same time on the previous Sunday.
Nonetheless, after 16:00 local time, traffic started to increase to those news outlets and by 18:00 local time it had its largest spike of the week with sustained growth until 20:00. At 23:00 local time there was another increase in traffic and after that it started to decrease. But, this Monday morning, traffic at 08:00 was already higher again than during the previous week (Election Day excluded). So, no surprise, Sunday night was when people were looking more into the news.
The same trend is seen on the major French TV station websites, with an even more isolated spike at 20:00 local time and a 472% increase in traffic compared to the previous Sunday, when the main exit polls were announced.
This was also similar to the broadcast radio website trends. Besides the 20:00 local time spike (272% increase compared to the previous Sunday), there was also a big one at 23:00 local time (300%) and a Monday morning spike with higher than before traffic (82% increase):
How about social media?
Regarding social media in France (looking at the aggregate DNS of the several sites), there’s no clear trend regarding the elections, but there were slightly fewer requests than on the previous Sunday. So social media doesn’t appear to have been as impacted by the elections as news websites.
Conclusion
Although there aren’t big changes in Internet traffic, like those seen in countries that shut down the Internet during election periods, Election Day seems to influence human and Internet patterns, in this case when results started to pour in on election night people went to news or official election websites.
The 94th Academy Awards happened this past Sunday, March 27, 2022. In the global event we got to see several Oscars attributed to winners like CODA, Jane Campion (the director of The Power of the Dog) and also Dune (which won six Oscars), but also moments that had a clear impact in the Internet traffic, like the altercation on stage between Will Smith and Chris Rock.
Cloudflare Radar uses a variety of sources to provide aggregate information about Internet traffic and attack trends. In this blog post, we will use DNS name resolution data as a proxy for traffic to Internet services, as we did for the Super Bowl LVI.
The baseline value for the charts (that are only focused on the US) was calculated by taking the mean DNS traffic level for the associated Internet services between 08:00 – 12:00 PST on Sunday (March 27, 2022) — usually we use UTC, but we chose to use Los Angeles time as that’s where the event took place.
The event started with Beyoncé singing at 17:00 PST and ended at around 20:30. In terms of growth in traffic, the start of the show didn’t show much for social media, although TikTok and Twitter started to decrease in DNS requests after that time.
Will Smith makes Twitter and TikTok rise in requests
Twitter and TikTok were the social networks that seemed most impacted by the moment Will Smith went on stage and started an altercation with Chris Rock after a joke.
For Twitter, the major change in DNS requests was exactly after that incident (at 19:25); before that, at 18:00, the moment Sebastián Yatra performed Encanto’s Dos Oruguitas song also had a small spike.
There were 32% more DNS requests for Twitter a few minutes after the altercation, and that growth peaked at 20:15 with 51% more requests than there were at 19:20 — that was after Will Smith (20:05) gave his acceptance and apology speech, when he was awarded the Best Actor Oscar. The ceremony ended at 20:30, and after that traffic went down.
TikTok also seemed to be used during the ceremony and the breaks, and after a spike during one of the commercial breaks, around 18:40, after Troy Kotsur won the Best Supporting Actor Oscar for his role in CODA.
The Will Smith incident seems to be associated with an increase of 20% in requests from 19:20 to 19:30. The trend continued with a 25% increase (19:40) and a peak of 40% more traffic at 20:15, right after Will Smith’s speech. After the ceremony ended (20:30), traffic went down.
Facebook (yellow line) and Instagram (green) weren’t particularly impacted, although there’s a decrease in traffic after the ceremony started and requests start to decrease after 19:00, especially Facebook.
Actresses made IMDb.com tick
One of the main sources of information about the movie industry is IMDb.com, the Internet Movie Database, and traffic to the site was impacted by the Oscars in a way not related to the Will Smith incident. Requests almost doubled (93% increase) in the minutes before the Oscars started (between 16:50 and 17:00).
And there was another clear spike right after Ariana DeBose won (at 17:23) the Best Supporting Actress Oscar for West Side Story, with almost 90% growth in traffic compared to the previous 10 minutes.
There is also an increase at 19:00, when Kenneth Branagh won the Best Original Screenplay Oscar for writing Belfast. The other major spike in traffic, with 55% increase compared to the previous minutes, was right around the time Jessica Chastain got the Oscar for Best Actress for her role in the movie The Eyes of Tammy Faye.
ABC and Oscars.com trends
ABC was the official broadcaster for the 2022 Oscars, and throughout the event had good numbers: two hours before the ceremony, ABC.com and also their dedicated page Oscars.com (that redirects to abc.com/shows/oscars) had between 200 to 600% more traffic than in our baseline (the morning period, 08:00 – 12:00 PST).
The biggest spike was around 19:45, a few minutes after the Will Smith incident. This was around the time Questlove received the Best Documentary Oscar for Summer of Soul (…Or, When the Revolution Could Not Be Televised), and there was a reunion for The Godfather, with Francis Ford Coppola and actors Al Pacino and Robert DeNiro, on stage.
Oscars official website
The official Oscars.org website also had some trends worth mentioning. Requests to the site increased 400% in the hour before the ceremony started, from 16:00 to 17:00, and remained high after that.
But at 19:45 there was a clearer spike in traffic of around 1,300% increase compared to the previous 10 minutes — that was 20 minutes after the Will Smith incident, right after Questlove’s Oscar and at the time of The Godfather reunion. There was another spike right after the Best Actress award and before the event ended. The full list of winners was published on Oscars.org right after 20:30.
Movie news sites trends
So, how about the trends for movie news sites like Variety, Hollywood Reporter, Vulture or E Online? For this we went on to look at the whole Oscars week (the baseline is a mean of the previous Sunday, March 20, 2022). The Oscars Sunday, March 27, was definitely the main day of the week, with DNS requests for those websites growing 833% more than the best days of the week.
That growth was even higher the next day, Monday, March 28, 2022, when traffic rose to 1,200% more than the best days of the previous week.
Conclusion
As we saw with the Super Bowl LVI, an out of the ordinary moment in a popular event, even when it’s broadcasted via television, causes changes in social media and Internet traffic. In the case of the Super Bowl LVI it was the Coinbase ad; here it was an unexpected incident on stage.
To provide the best experiences, we use technologies like cookies to store and/or access device information. Consenting to these technologies will allow us to process data such as browsing behavior or unique IDs on this site. Not consenting or withdrawing consent, may adversely affect certain features and functions.
Functional
Always active
The technical storage or access is strictly necessary for the legitimate purpose of enabling the use of a specific service explicitly requested by the subscriber or user, or for the sole purpose of carrying out the transmission of a communication over an electronic communications network.
Preferences
The technical storage or access is necessary for the legitimate purpose of storing preferences that are not requested by the subscriber or user.
Statistics
The technical storage or access that is used exclusively for statistical purposes.The technical storage or access that is used exclusively for anonymous statistical purposes. Without a subpoena, voluntary compliance on the part of your Internet Service Provider, or additional records from a third party, information stored or retrieved for this purpose alone cannot usually be used to identify you.
Marketing
The technical storage or access is required to create user profiles to send advertising, or to track the user on a website or across several websites for similar marketing purposes.