Post Syndicated from João Tomé original https://blog.cloudflare.com/radar-2025-year-in-review-internet-services/
In 2025, the Internet is more central to our lives than ever, and we rely on an array of online services to get things done, connect with others, and enjoy ourselves. Cloudflare’s Top Internet Services of 2025 report explores how the connected world interacted this year, based on Cloudflare’s observations and analysis of DNS trends.
This report is part of the 2025 Cloudflare Radar Year in Review, focused on shifts in popularity of Internet services. We hope you find the results are a compelling view of trends in nine major categories — who’s moving up, who’s sliding down, and who continues to hold our attention.
These rankings show relative popularity within each category, based on anonymized DNS query data from Cloudflare’s 1.1.1.1 DNS resolver and a machine-learning-assisted ranking method introduced in 2022. A lower rank does not imply lower traffic, only that other services may have grown faster.
-
Generative AI ➜
-
Social Media ➜
-
E-commerce ➜
-
Video Streaming ➜
-
News ➜
-
Messaging ➜
-
Metaverse & Gaming ➜
-
Financial Services ➜
-
Cryptocurrency Services ➜
From the dominance of social media and streaming to the rapid growth of AI chatbots, the data reflects an Internet that is constantly adapting to user needs and new technologies. Some of the shifts we observed coincide with news events such as the short Israel-Iran war and Donald Trump’s inauguration — as well as global phenomena like Eurovision and Black Friday.
-
Asian e-commerce climbs: Shopee and Temu joined Amazon in the global e-commerce top 3.
-
ChatGPT still leads, but rivals emerge: Claude, Gemini, Perplexity, and DeepSeek turned Generative AI into a crowded field, with Gemini holding the #2 spot by year’s end.
-
Instagram up, TikTok and X down: Instagram rose to #5 overall (from #7) and #2 in Social Media, while TikTok slipped to #8 and X fell outside the Top 20.
-
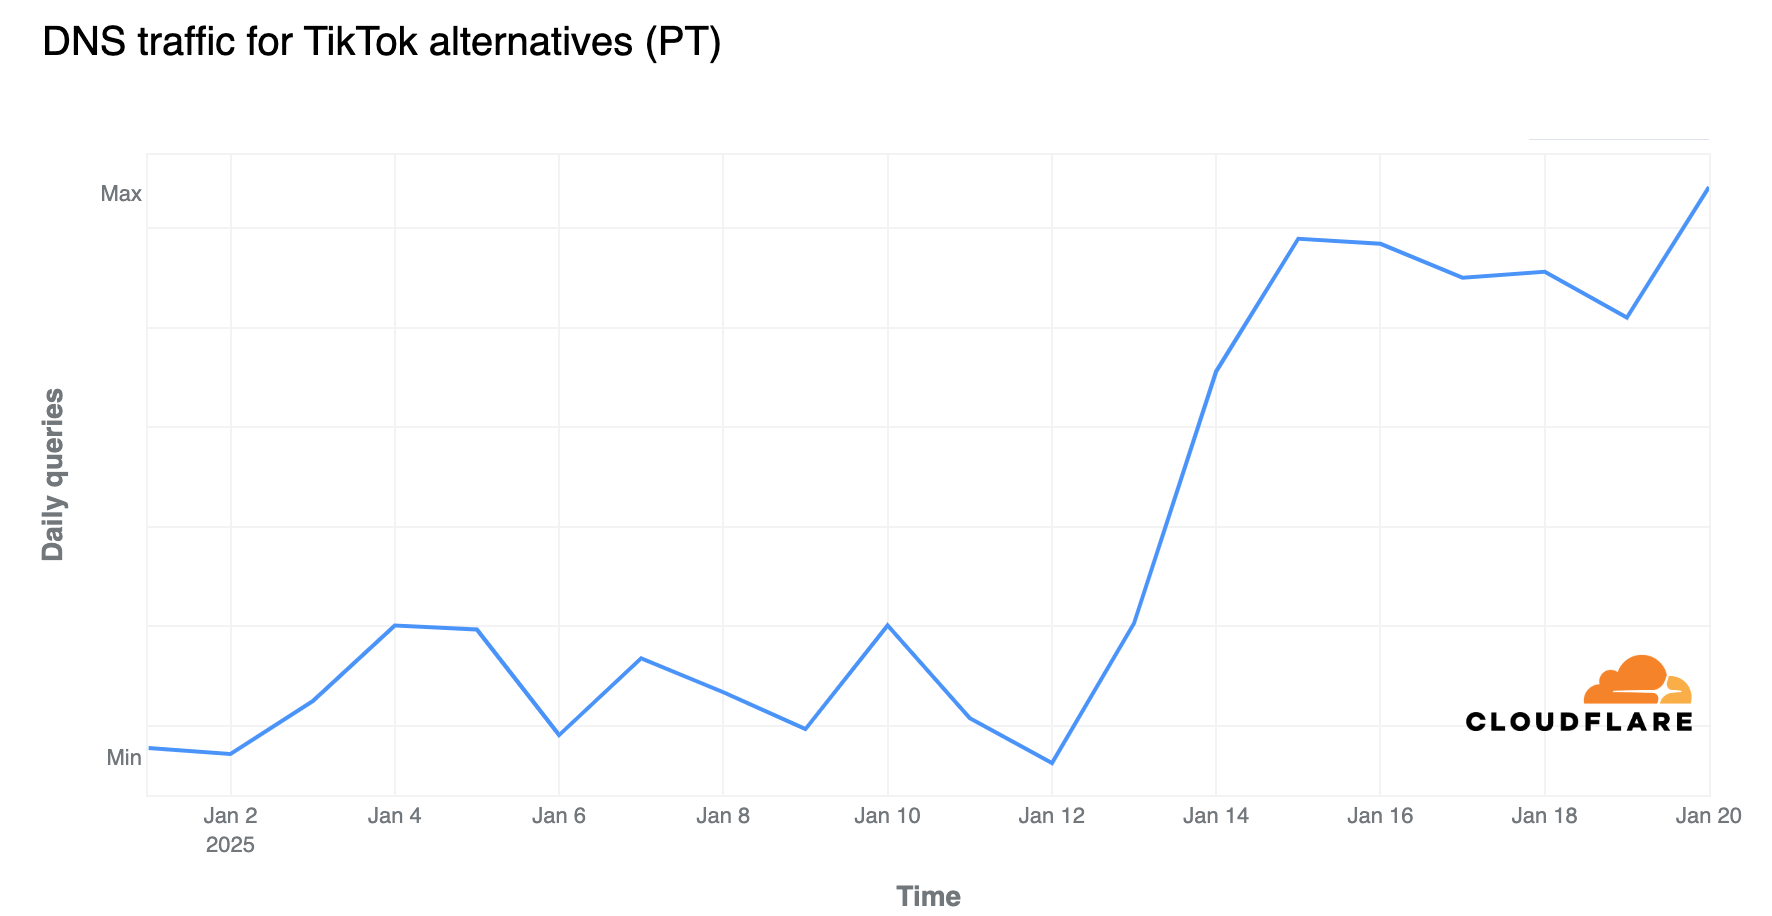
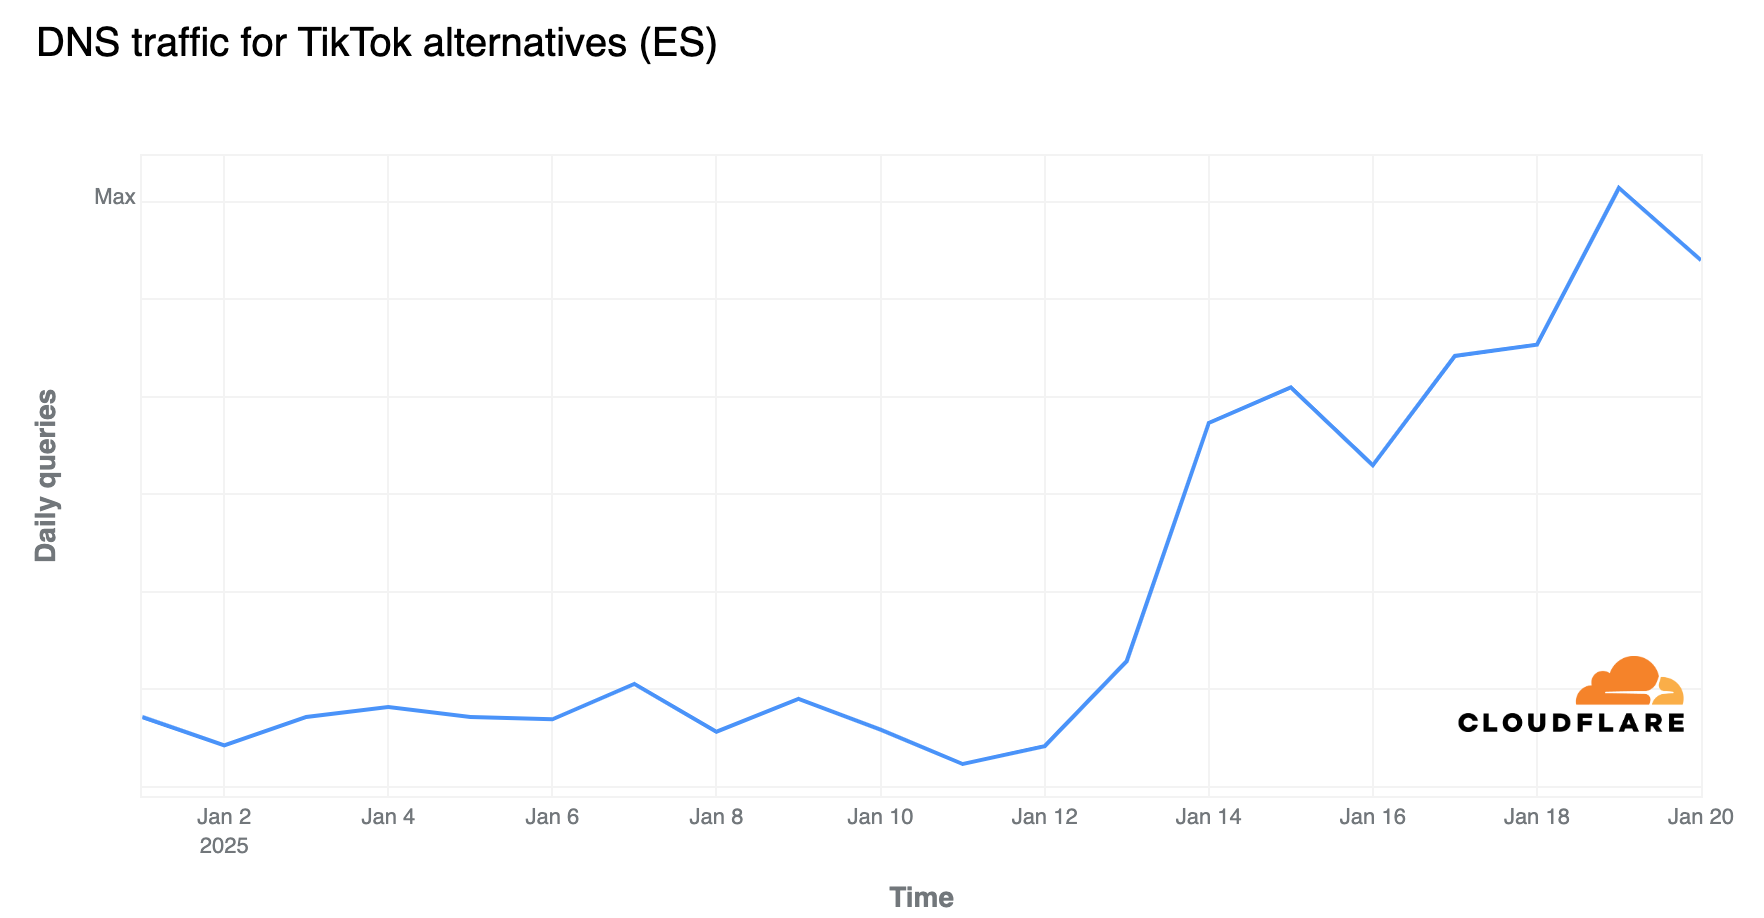
Kwai’s quiet rise in emerging markets: The Chinese short-video app climbed in our global social ranking and is now #3 in Brazil and high in several emerging markets.
-
Roblox still rules gaming, PlayStation overtakes Xbox: Roblox kept the #1 spot in Metaverse & Gaming, while PlayStation passed Xbox for #2.
-
Stripe and Nubank digital-first finance dominates: Stripe remained #1 in Financial Services, while Brazilian neobank Nubank highlights Latin America’s digital banking surge.
-
Crypto steadies, OKX surges: Binance kept the top spot, but OKX jumped to #2 as crypto traffic spiked around Trump’s inauguration and market rallies.
-
News under AI pressure: Globo and ESPN dominated the News category, and most traditional outlets slid in our Overall ranking as AI platforms are reshaping how people find information.
We’re also including a by-country and by-region perspective on the most popular Internet services in our Year in Review microsite for the second year. It features Top 10 lists not only for the Overall ranking but also for Generative AI, Social Media, and Messaging across more than 100 countries and regions. At the end of this post, we highlight key trends from this localized data.
Explore the full 2025 Cloudflare Radar Year in Review microsite for interactive visualizations, additional metrics, and deeper analysis of Internet traffic patterns, security trends, and network performance data. Check out the 2025 Year in Review blog post for more insights.
Our analysis uses anonymized DNS query data from the 1.1.1.1 public DNS resolver, used by millions globally. We aggregate domains associated with each service (e.g., twitter.com, t.co, and x.com are grouped as “X”) and focus on services accessed by end users, excluding infrastructure domains like root-servers.net.
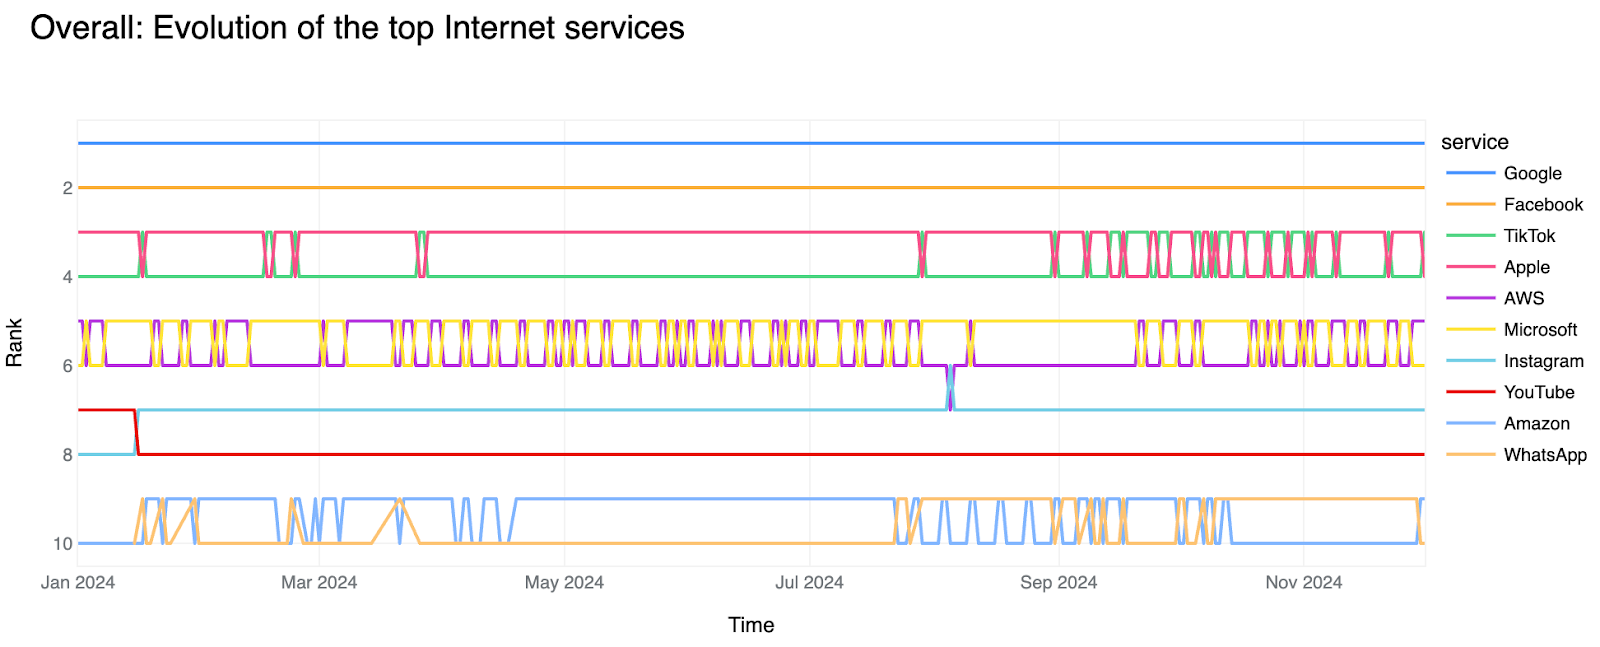
Since we introduced our current ranking method in 2022, Google (which includes services like Google Maps and Google Calendar) has remained the #1 most popular Internet service globally. Facebook continued to hold the #2 position for the third year in a row.
Apple and Microsoft follow a similar pattern to Google in that their main domains (apple.com and microsoft.com) power many different services. Other services with distinct domains, such as Outlook or iCloud, are counted separately.
(Note: In these rankings we use ▲▼ symbols to indicate changes from 2024.)
Top 10 most popular Internet services in 2025, overall
- Apple
- Microsoft ▲
- Instagram ▲
- AWS ▼
- YouTube ▲
- TikTok ▼
- Amazon
Apple held #3 through most of the year, but beginning in the summer Microsoft briefly challenged it, reaching that spot on several days in late 2025. Even so, Apple finished the year at #3. Microsoft’s tools performed better overall than in 2024 — Outlook and Microsoft 365/Office were just outside the Top 10.
Instagram was one of 2025’s strongest performers. It started the year at #7, matching its 2024 position, but climbed to #5 by year-end, reaching #4 on several days in May and June. YouTube also improved, rising one place to #7. Another Meta service, WhatsApp, remained #10 but appeared more frequently at #9 in late 2025 and even reached #7 during parts of May and June.
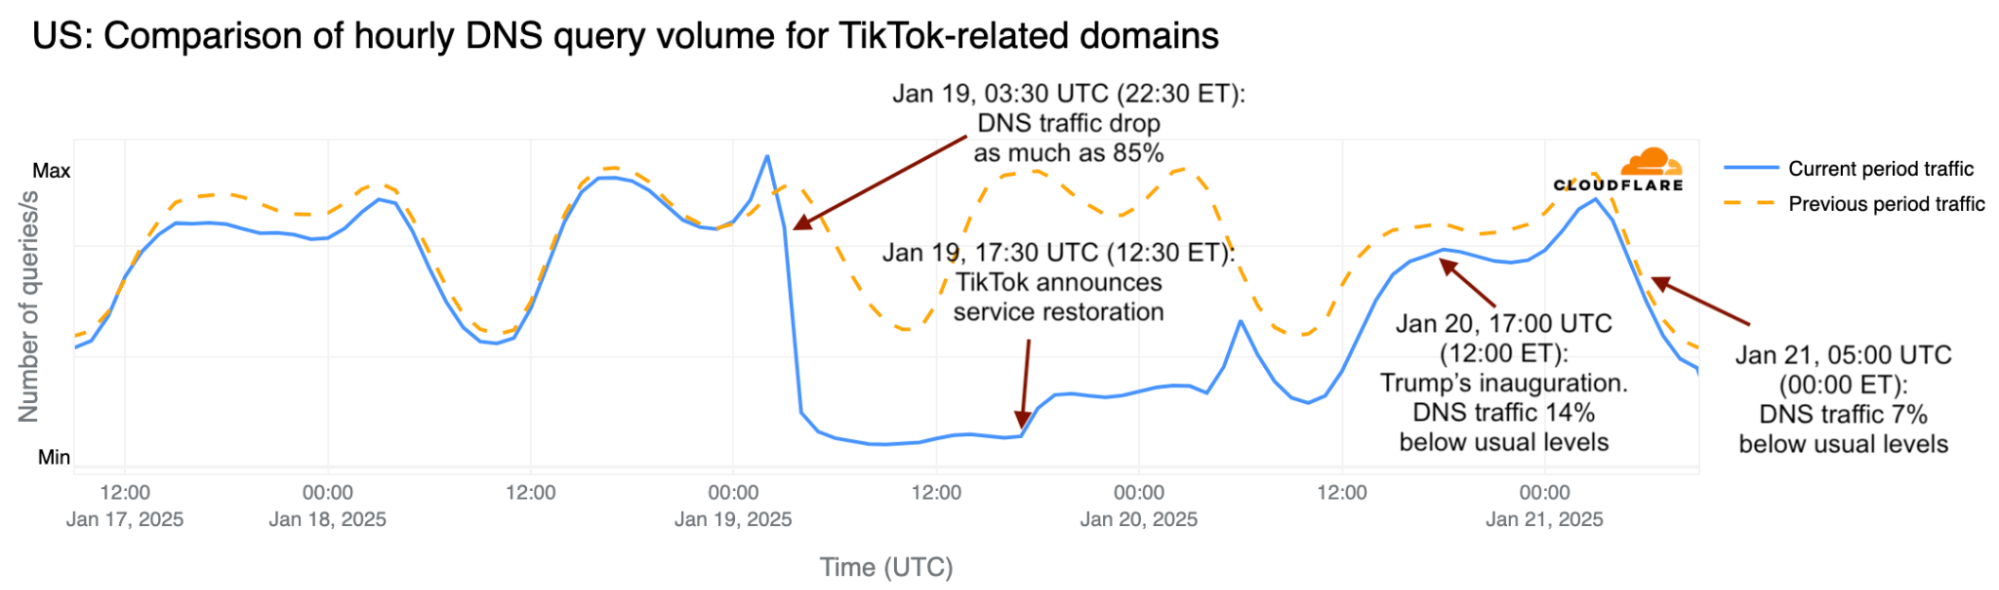
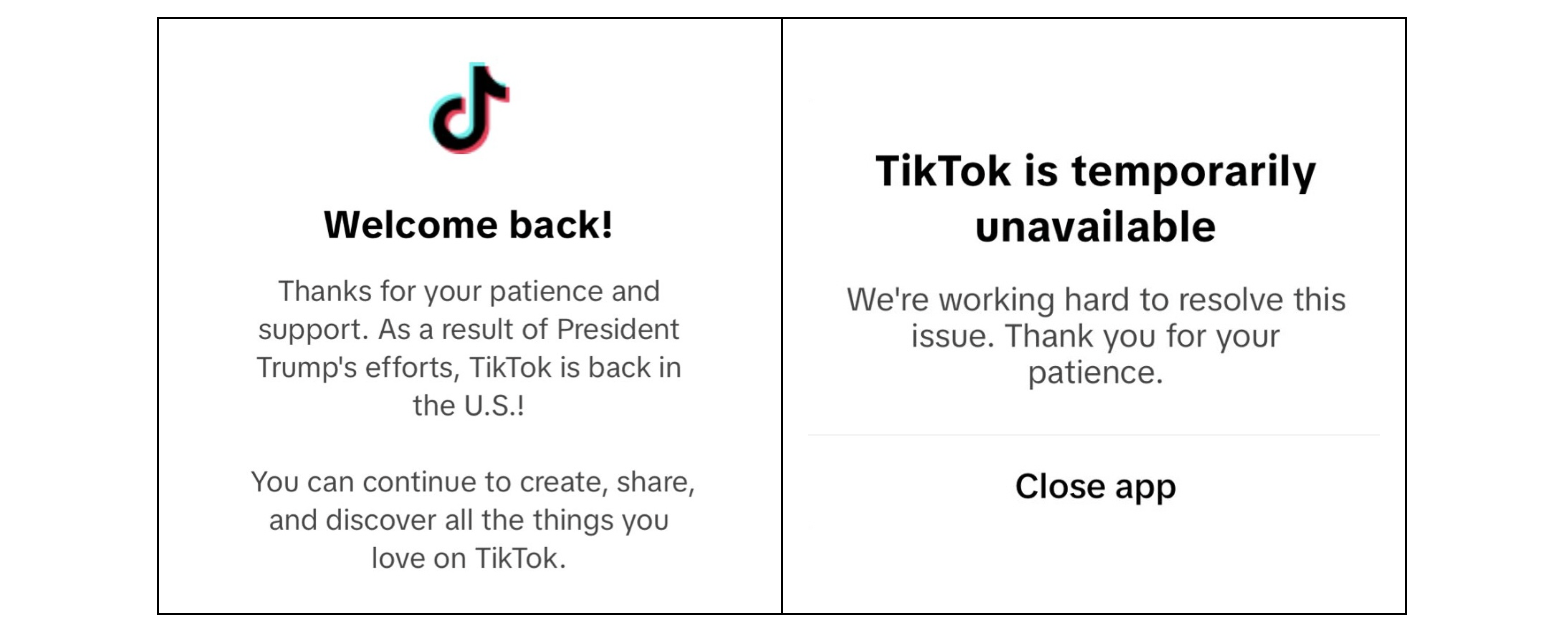
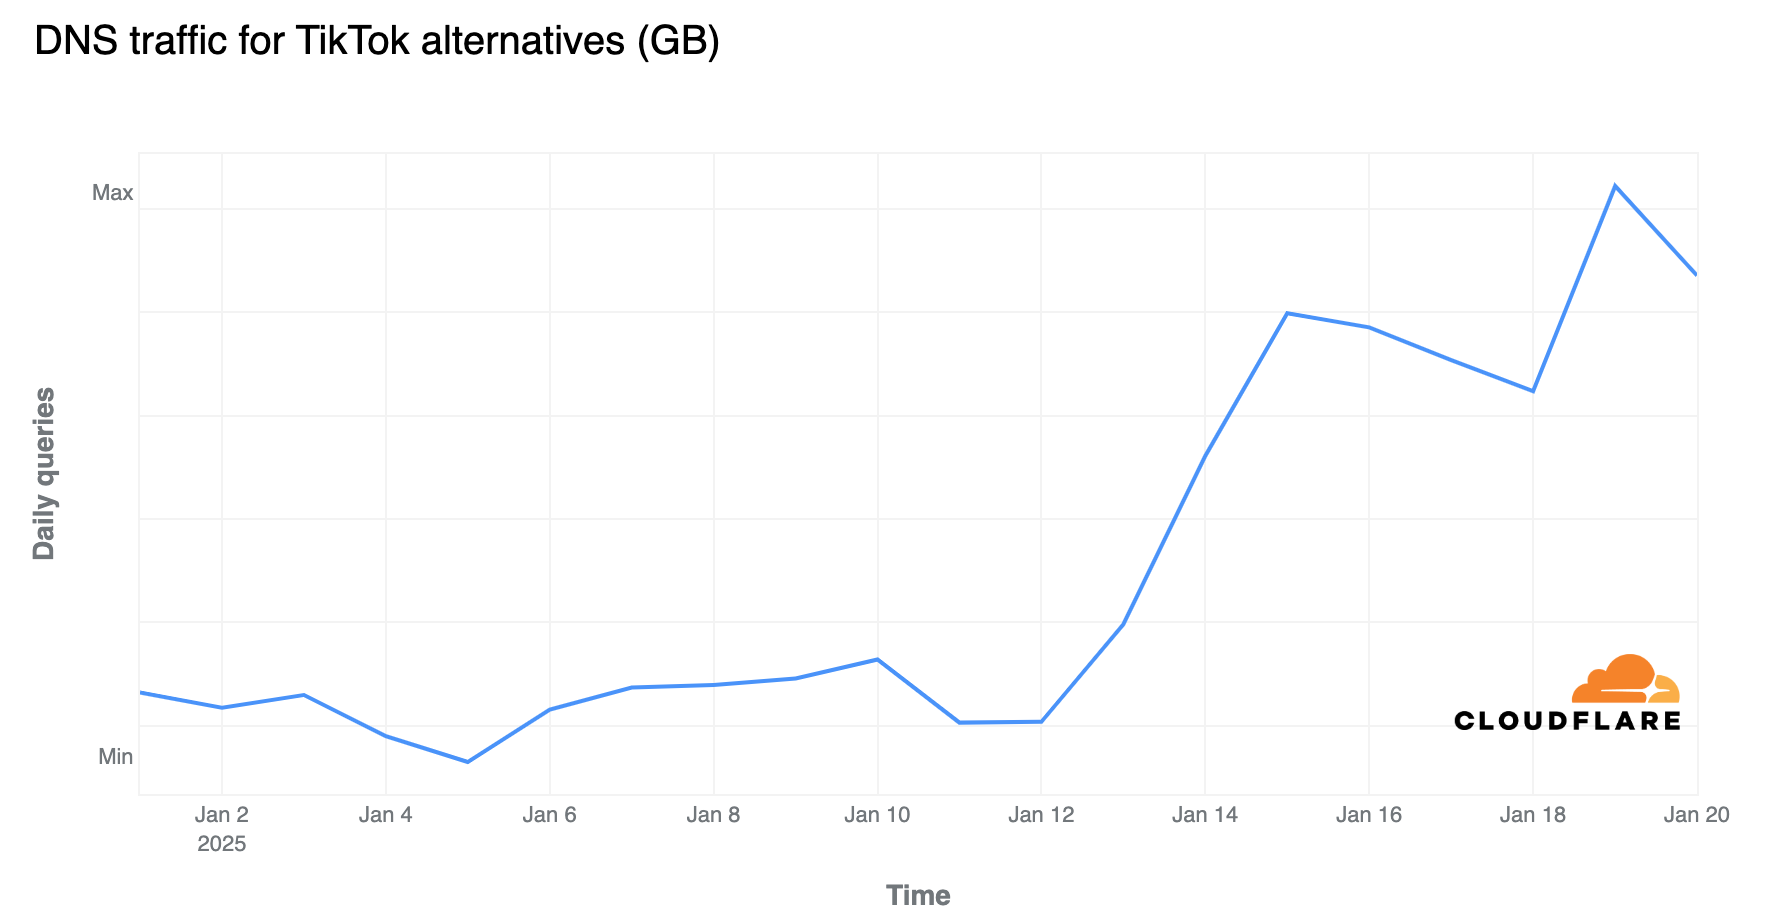
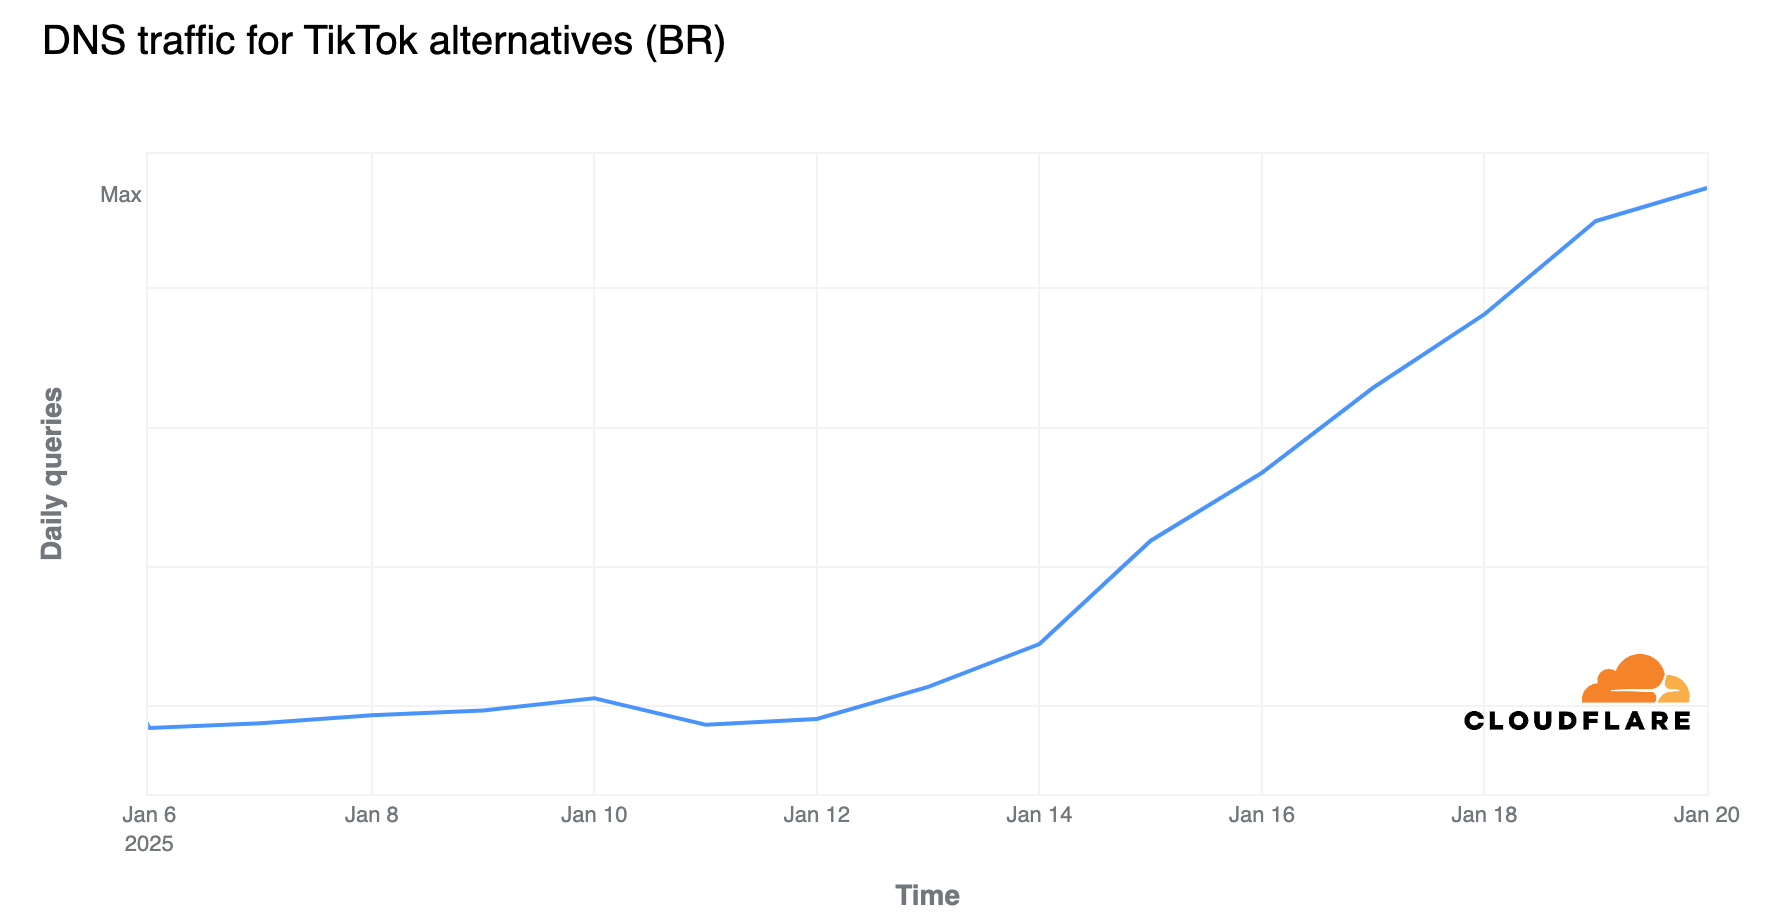
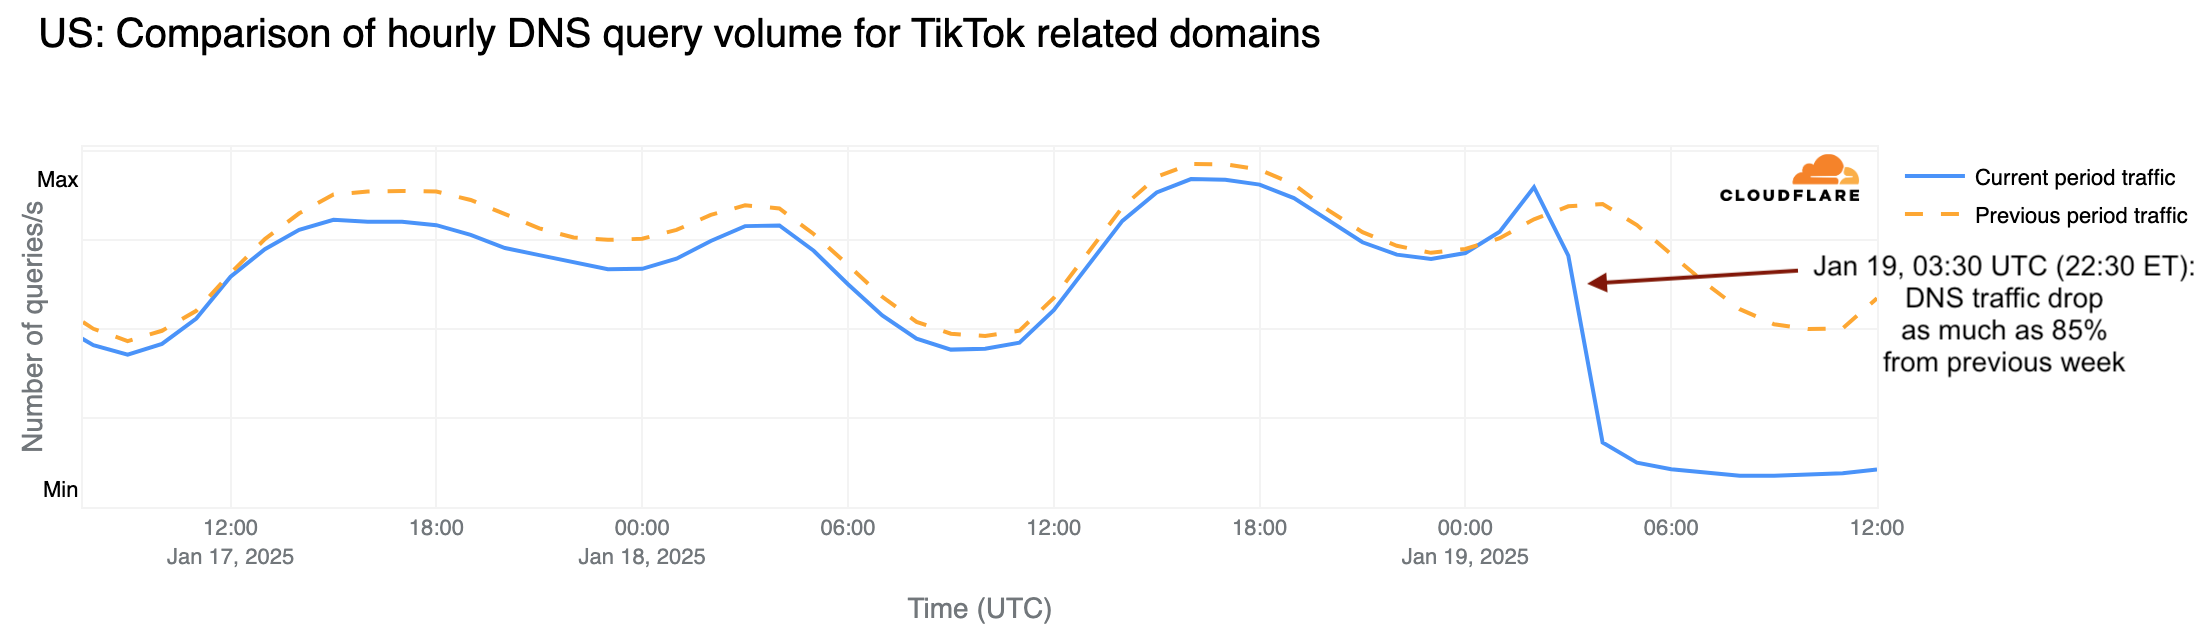
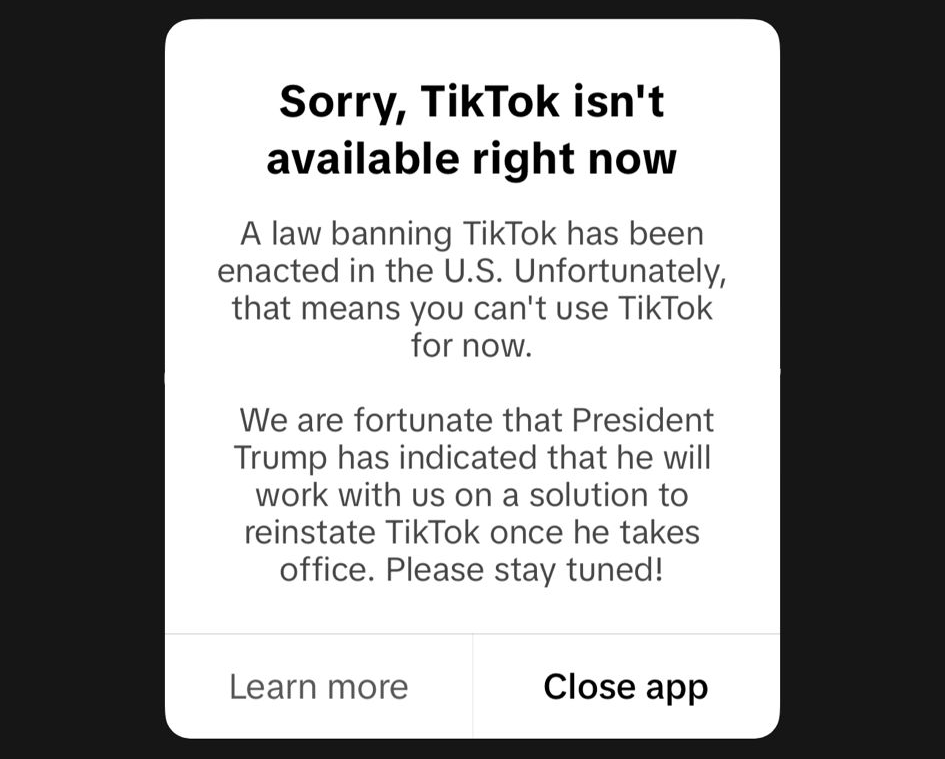
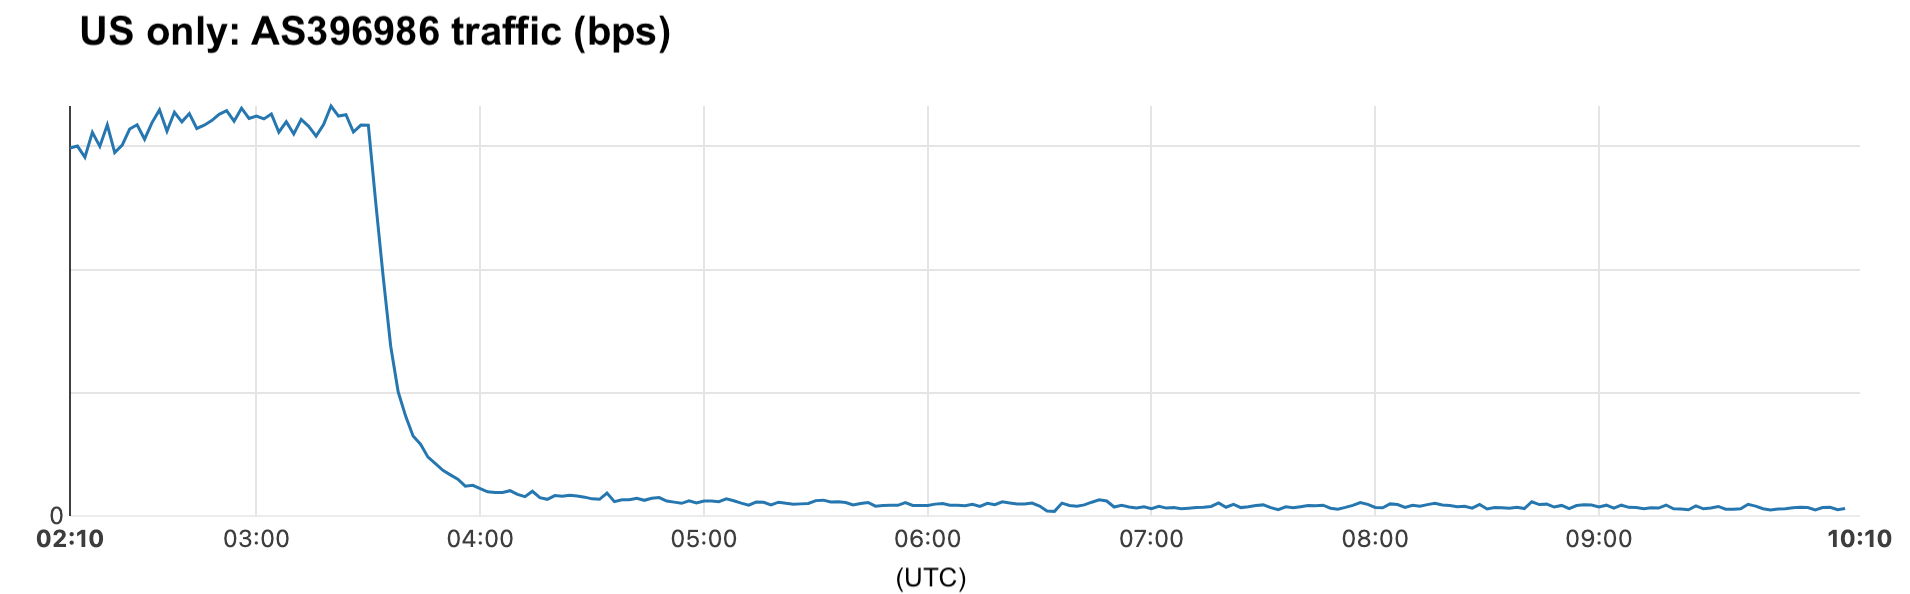
TikTok declined in the Overall ranking after a turbulent start to the year, including a temporary ban in the U.S. It fell from #4 in late 2024 to #8 by the end of 2025, performing worst during and after the summer. Amazon Web Services (AWS), which is tracked separately from Amazon through the amazonaws.com domain, also slipped slightly, moving down one position to #6. Amazon remained #9 but faced stronger competition than in 2024.
The chart below shows how these top Internet services evolved throughout the year.

X continued its downward trajectory. In 2022, it ranked as high as #10 and was close to Instagram. In 2023, it fell out of the Top 10 and, in 2024, dropped to around #14-15. In 2025, it began at #15 and slid further, ending the year outside the Top 20. More on X’s performance appears in the Social Media section below.
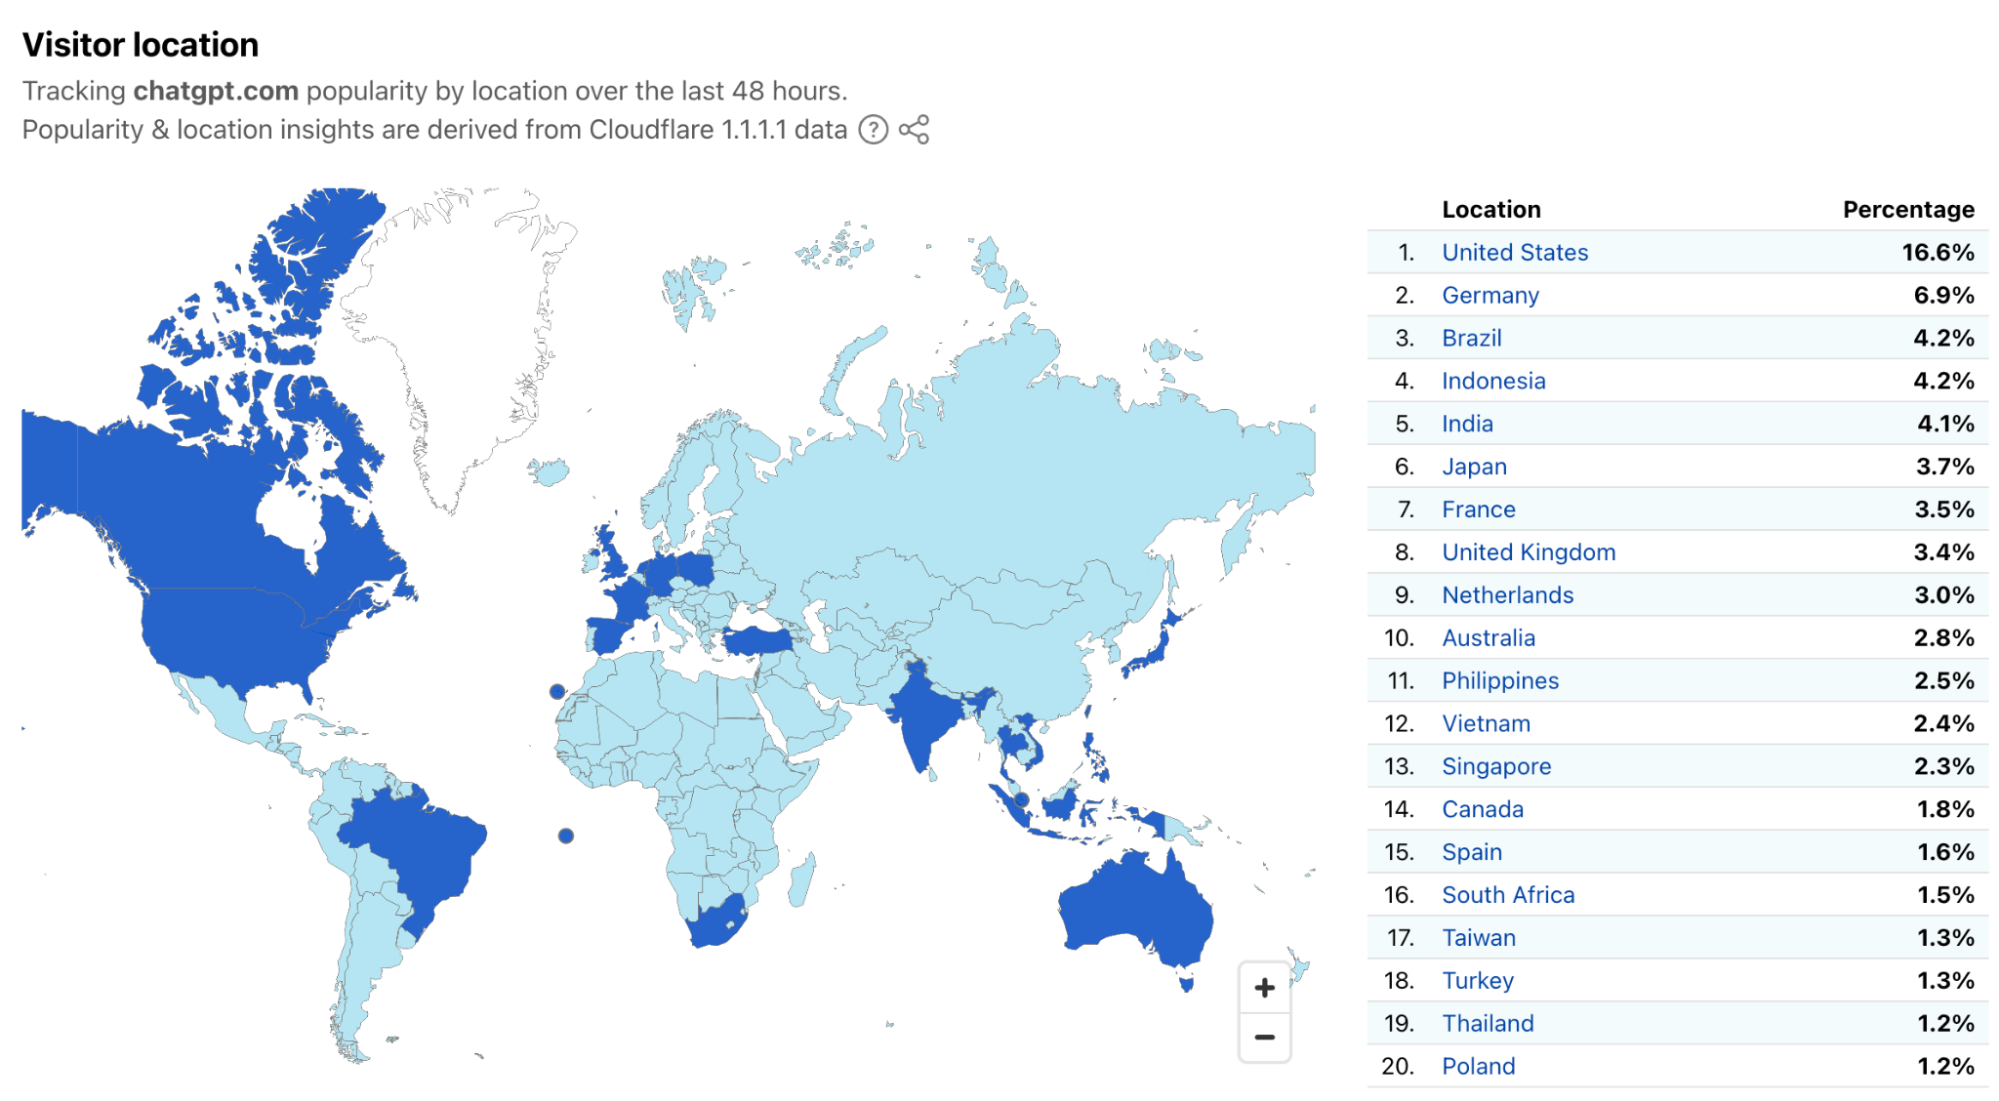
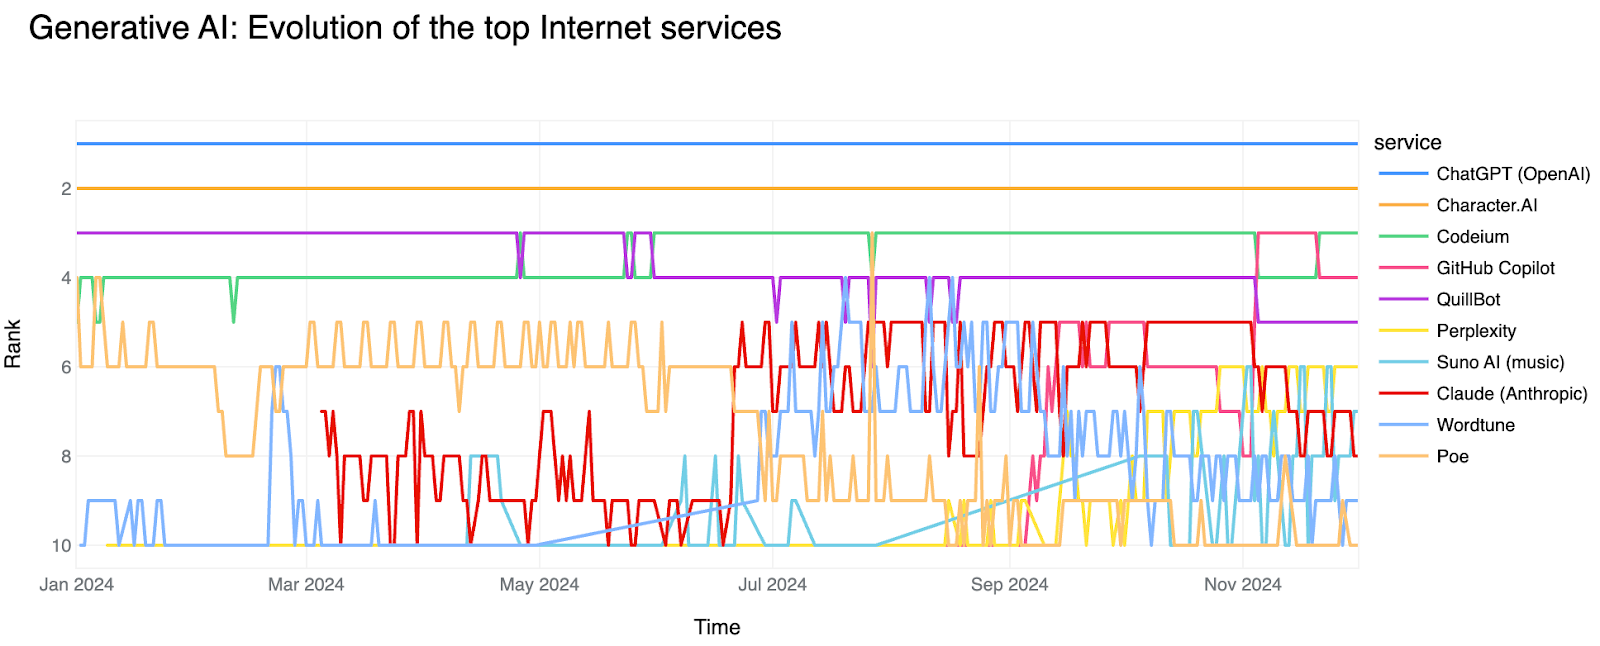
Generative AI became a globally recognized category in late 2022 with the launch of ChatGPT, which turned into a worldwide phenomenon throughout 2023. In 2025, as in 2024, OpenAI’s ChatGPT remained by far the most popular service in this category, which includes chatbots, coding assistants, and other AI tools. But it now faces serious all-purpose chatbot competitors, including Claude, Perplexity, and Google Gemini, which saw more growth as the year went on.
Top 10 Generative AI services in 2025
- ChatGPT / OpenAI
- Claude / Anthropic ▲
- Perplexity ▲
- Google Gemini ▲
- Character.AI ▼
- GitHub Copilot ▲
- Windsurf AI ▼
- QuillBot ▼
- Grok / xAI ▲
- DeepSeek ▲
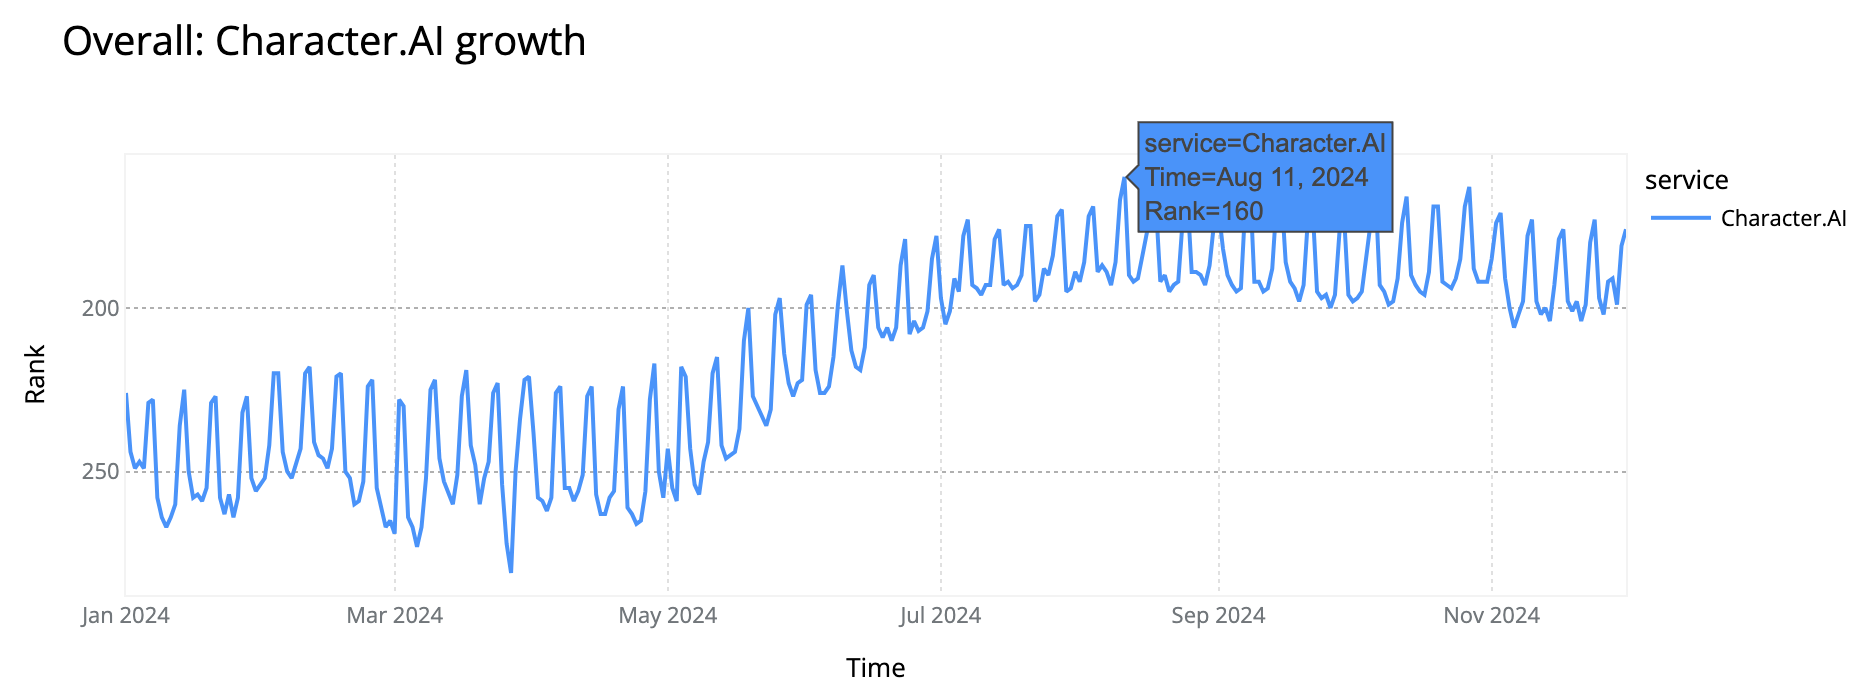
In 2024, the closest services behind ChatGPT were Character.AI (role-play chatbots), Codeium (the coding assistant that’s now Windsurf), and QuillBot (writing and paraphrasing). These tools dropped in the rankings in 2025, especially QuillBot, as users sought out broad, consumer-facing chatbots. The drop in Character.AI’s ranking also coincides with its October announcement that it would be banning teens from using its AI chatbots — by November it was oscillating between #5 and #7.
The biggest jump came from Google’s Gemini. It began 2025 outside the Top 10 but climbed steadily and, from mid-September onward, held the #2 position on most days. In our year-end weighted ranking, it finished at #4.

Claude, the AI assistant from Anthropic, delivered one of the year’s strongest performances, rising from #8-10 in early 2025 to #2 on most weekdays in July and August, before Gemini overtook it in mid-September. Consistent with its enterprise positioning, Claude showed markedly stronger weekday usage.
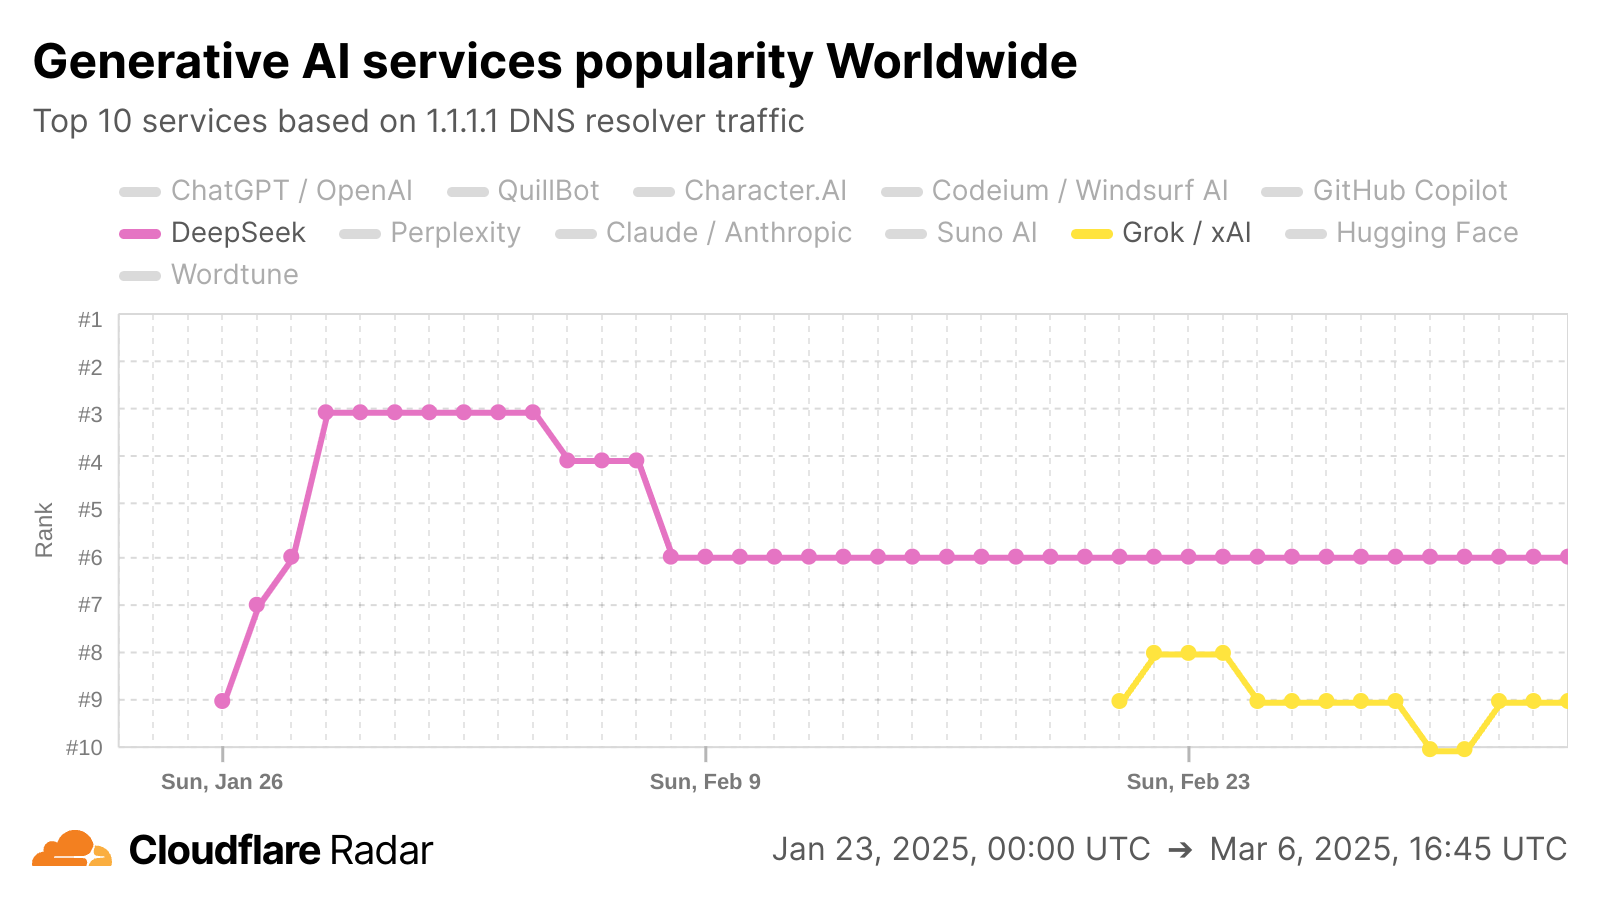
Perplexity climbed from #7 to secure #3 from September onward, while Grok (the chatbot from xAI) entered the Top 20 in mid-February and reached #9 by the end of the month, later peaking at #6 on several weekends in October and November.
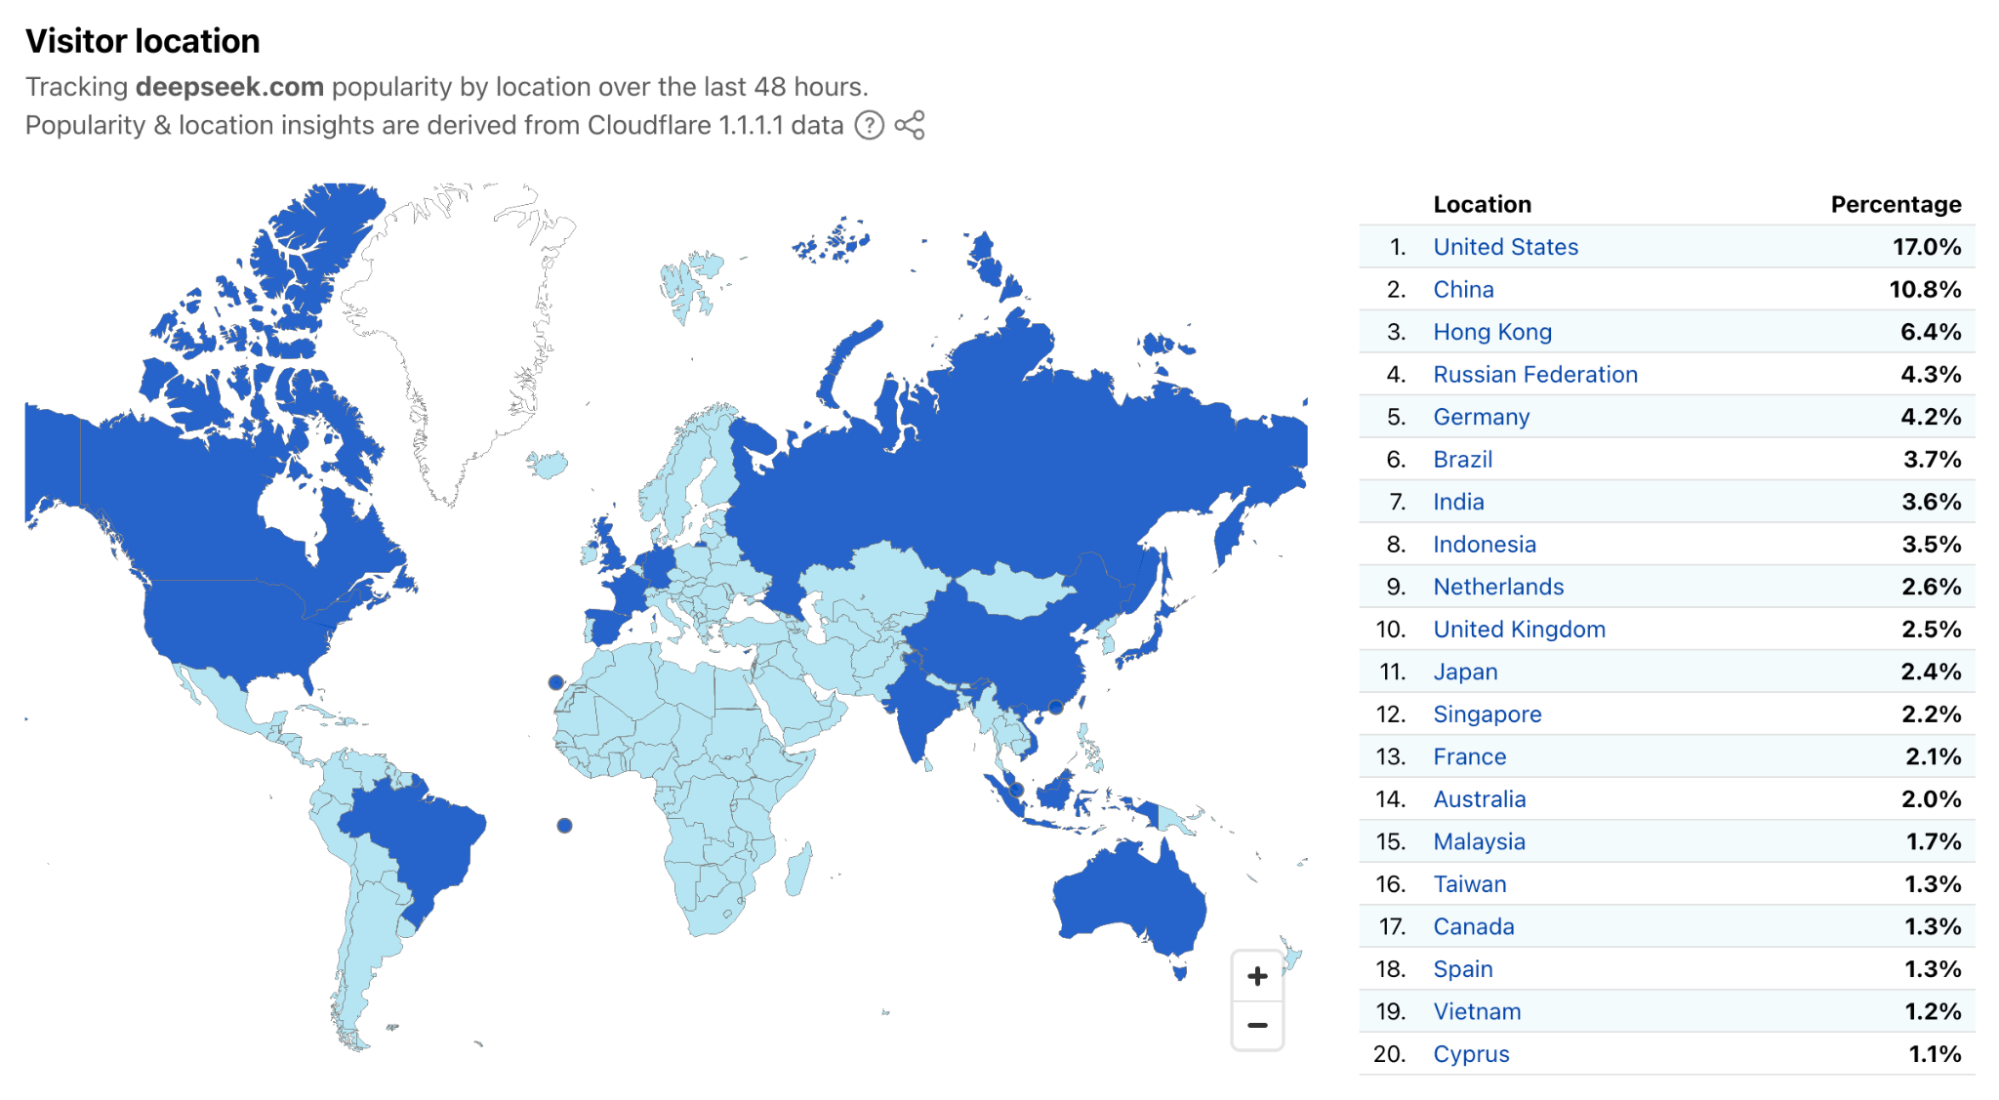
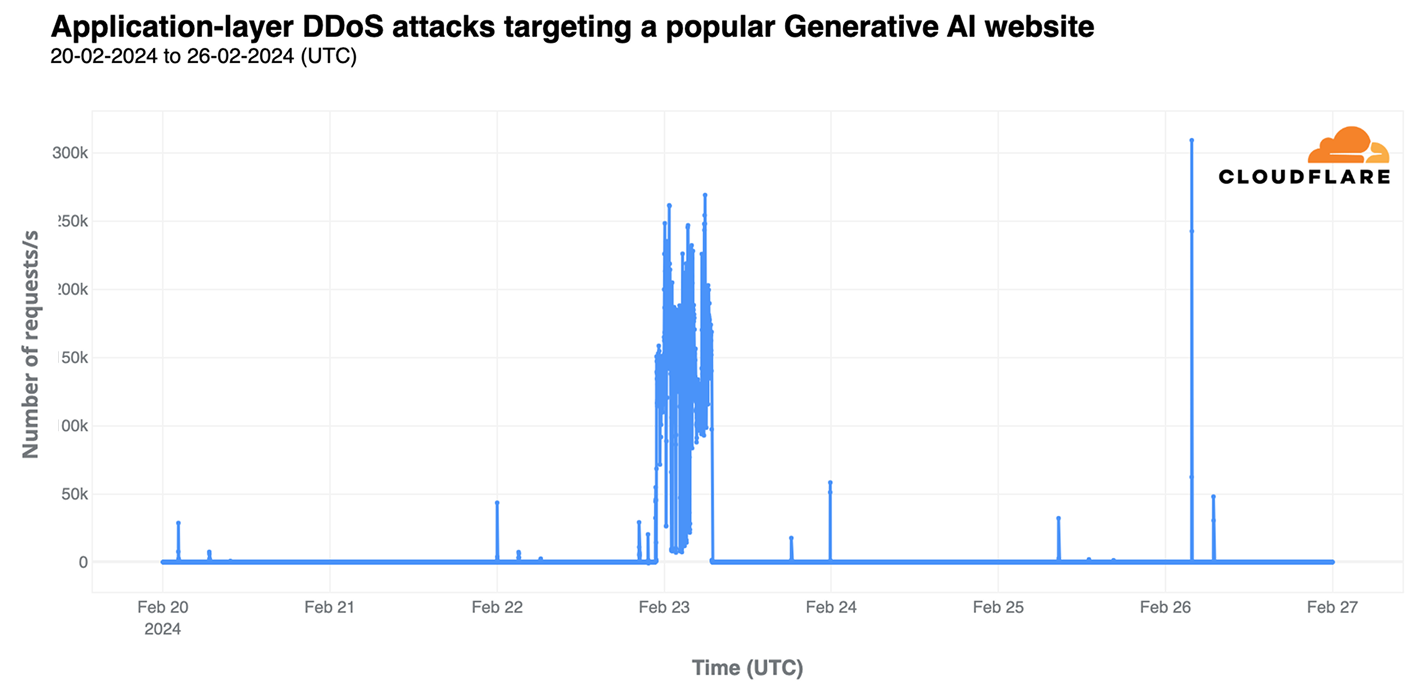
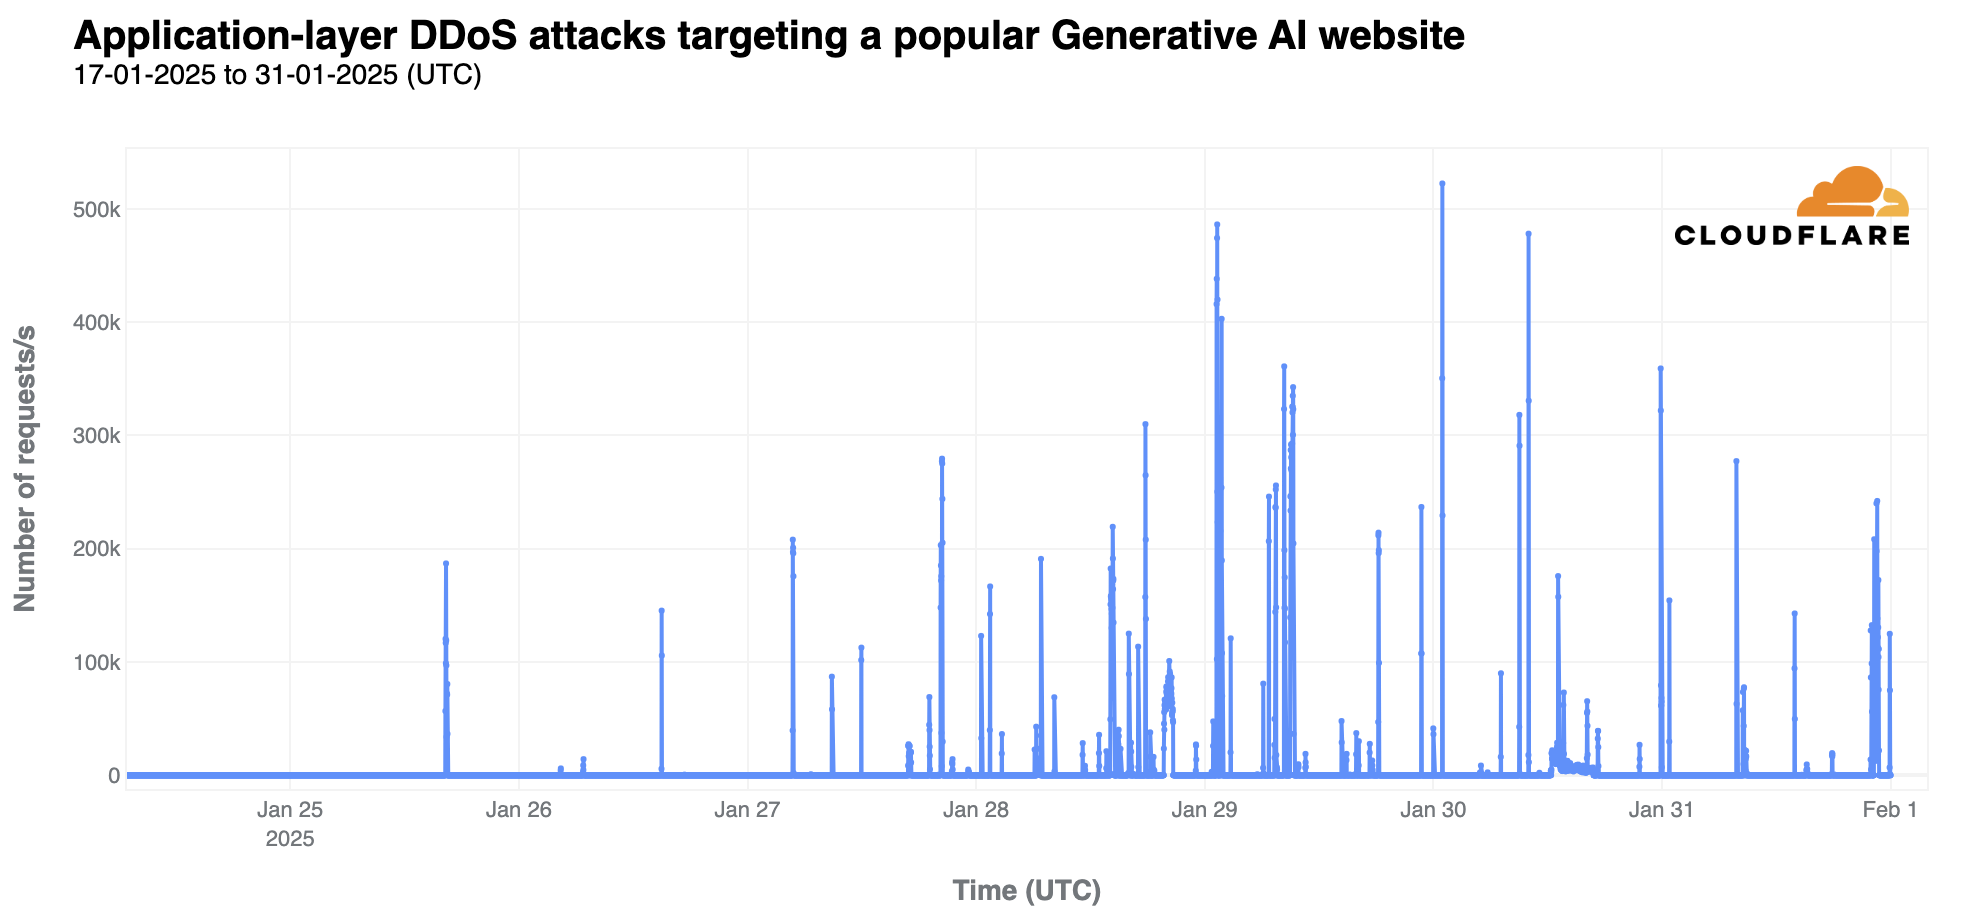
DeepSeek, the Chinese chatbot and open-source model developer, made the year’s most notable entrance. Between January 28 and February 3, it surged from outside the Top 20 to #3, demonstrating how quickly new entrants can disrupt the GenAI landscape. It stabilized between #6 and #10 for the remainder of the year.
Clear weekend-versus-weekday patterns emerged: ChatGPT and Claude dominated weekdays, reflecting workplace adoption, while Grok, Perplexity, and DeepSeek performed better on weekends, indicating stronger consumer and potentially hobbyist appeal.
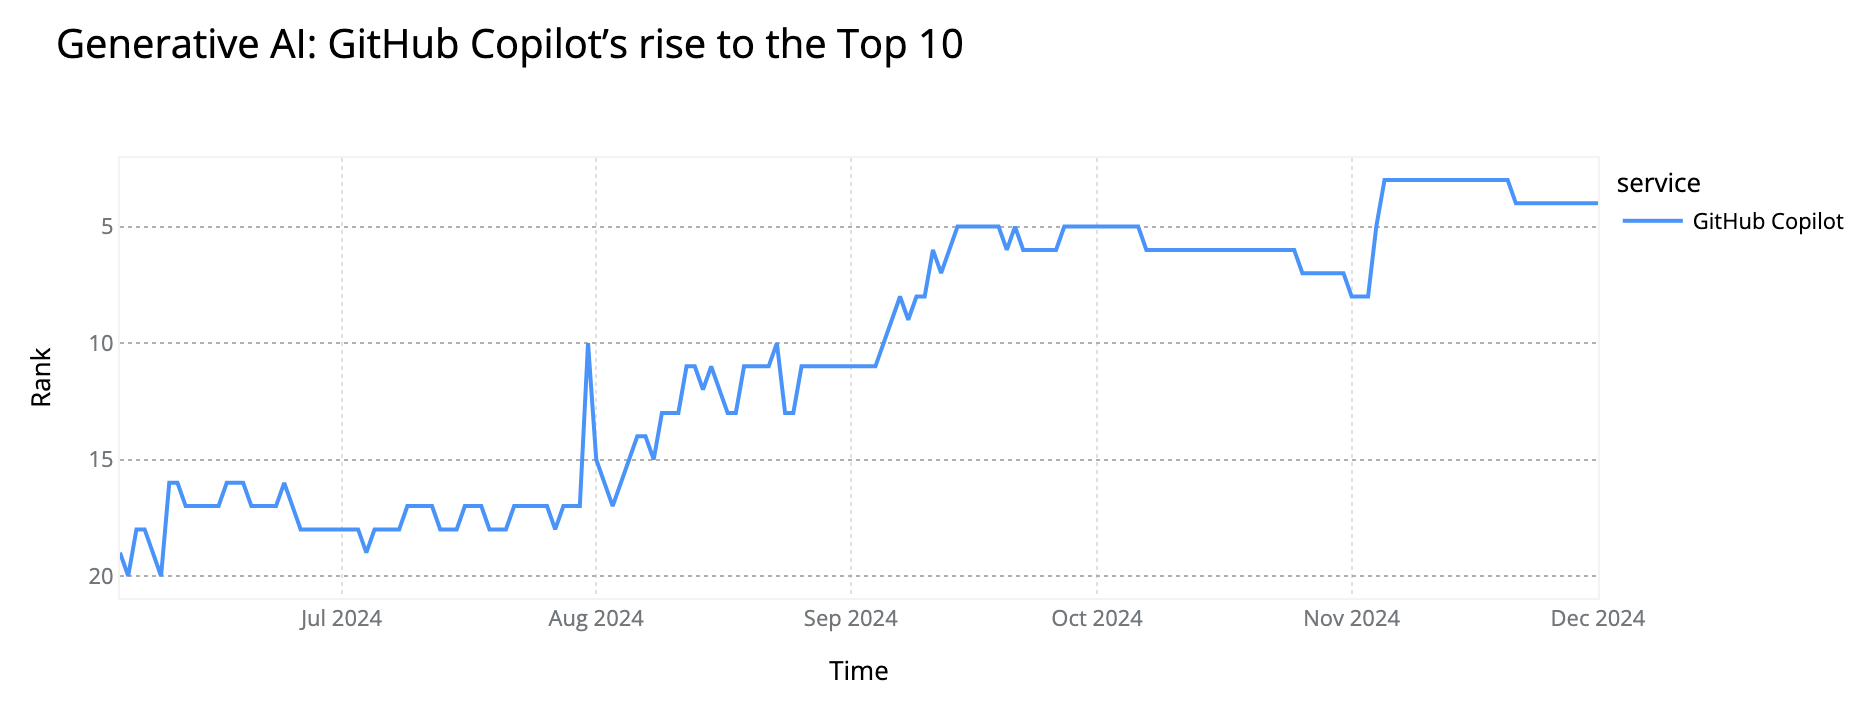
Among coding assistants, GitHub Copilot improved from #7 in 2024 to #6 in 2025, reaching #3 on several days during the first half of the year. Windsurf AI (formerly Codeium) started strong at #4 but declined to #7-8 by year-end as consumer-facing platforms rose.

ByteDance’s Doubao, launched in 2023, performed strongly despite one complication: it operates under a different name internationally — Dola (formerly Cici). While the international version uses its own domains, network patterns suggest they may still rely on some shared backend infrastructure with Doubao, including endpoints associated with doubao.com. This overlap helps explain why Doubao shows up in global rankings even in regions where Dola/Cici are the consumer-facing brands. Doubao ranks highly outside China — it is #7 in the GenAI category in Australia, #8 in New Zealand, and #9 in the UK, and climbs even higher in several African countries (#2 in Angola and Congo).
Among specialized AI services, Hugging Face, the open-source model repository, had some of the sharpest spikes of the year, reaching #3 on September 20-21, likely driven by model releases. Google’s dedicated AI properties showed more modest traction: DeepMind peaked at #12 in May, while AI Studio briefly entered the Top 20 in mid-September.
ElevenLabs (AI voice generation) reached #13-14 during peak periods, while Poe (Quora’s multi-bot aggregator) declined from #11 to #18. Meta AI remained outside the Top 10, appearing only sporadically in August and again in October–November.
When looking at trends for Generative AI services within our larger Overall ranking, some notable trends included:
-
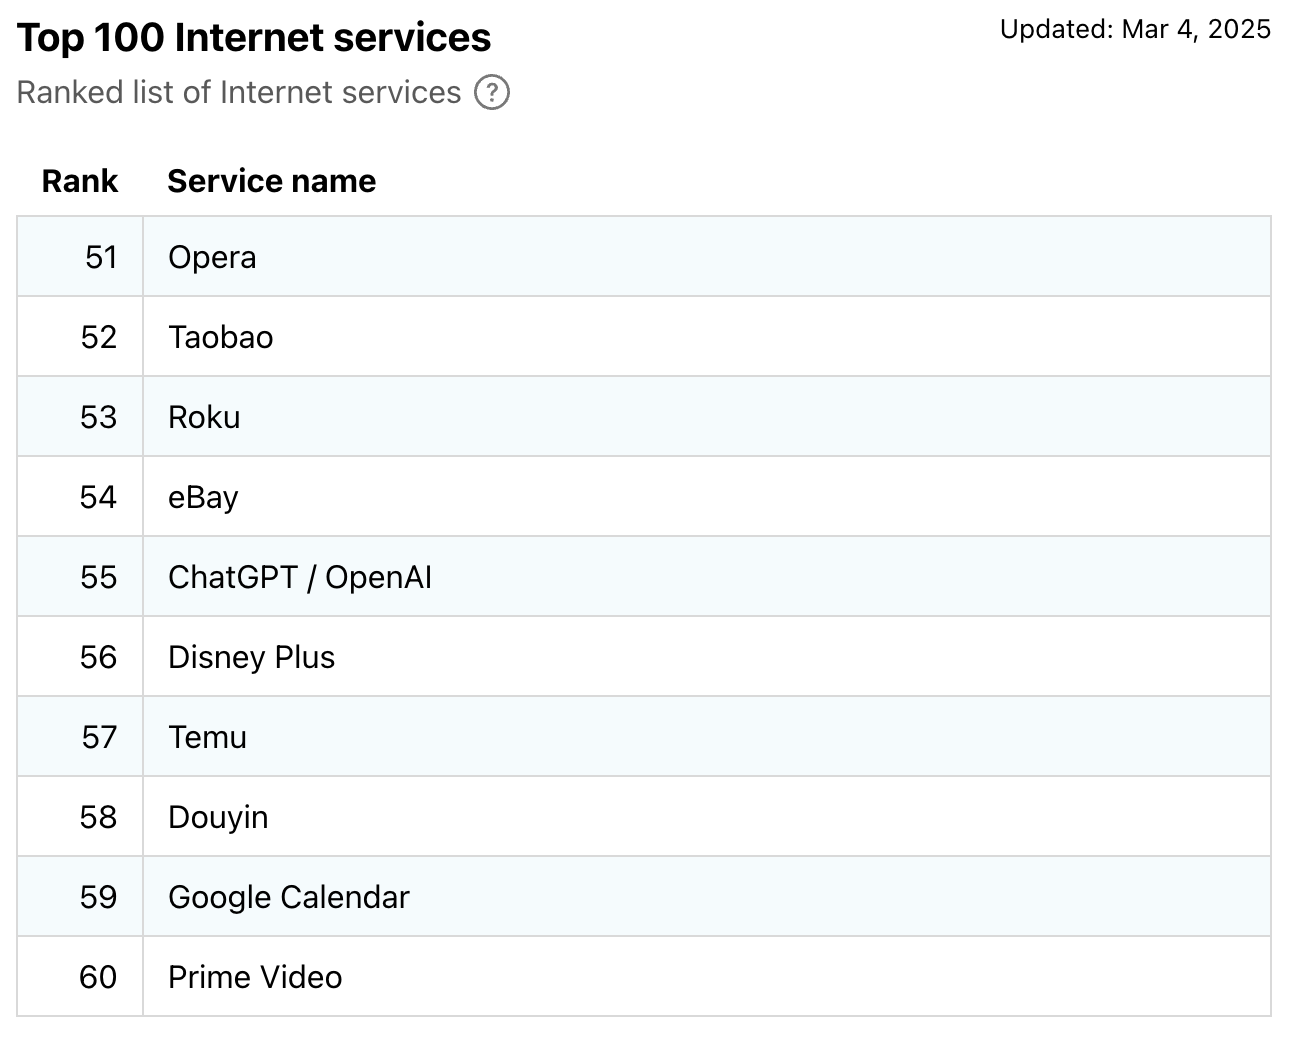
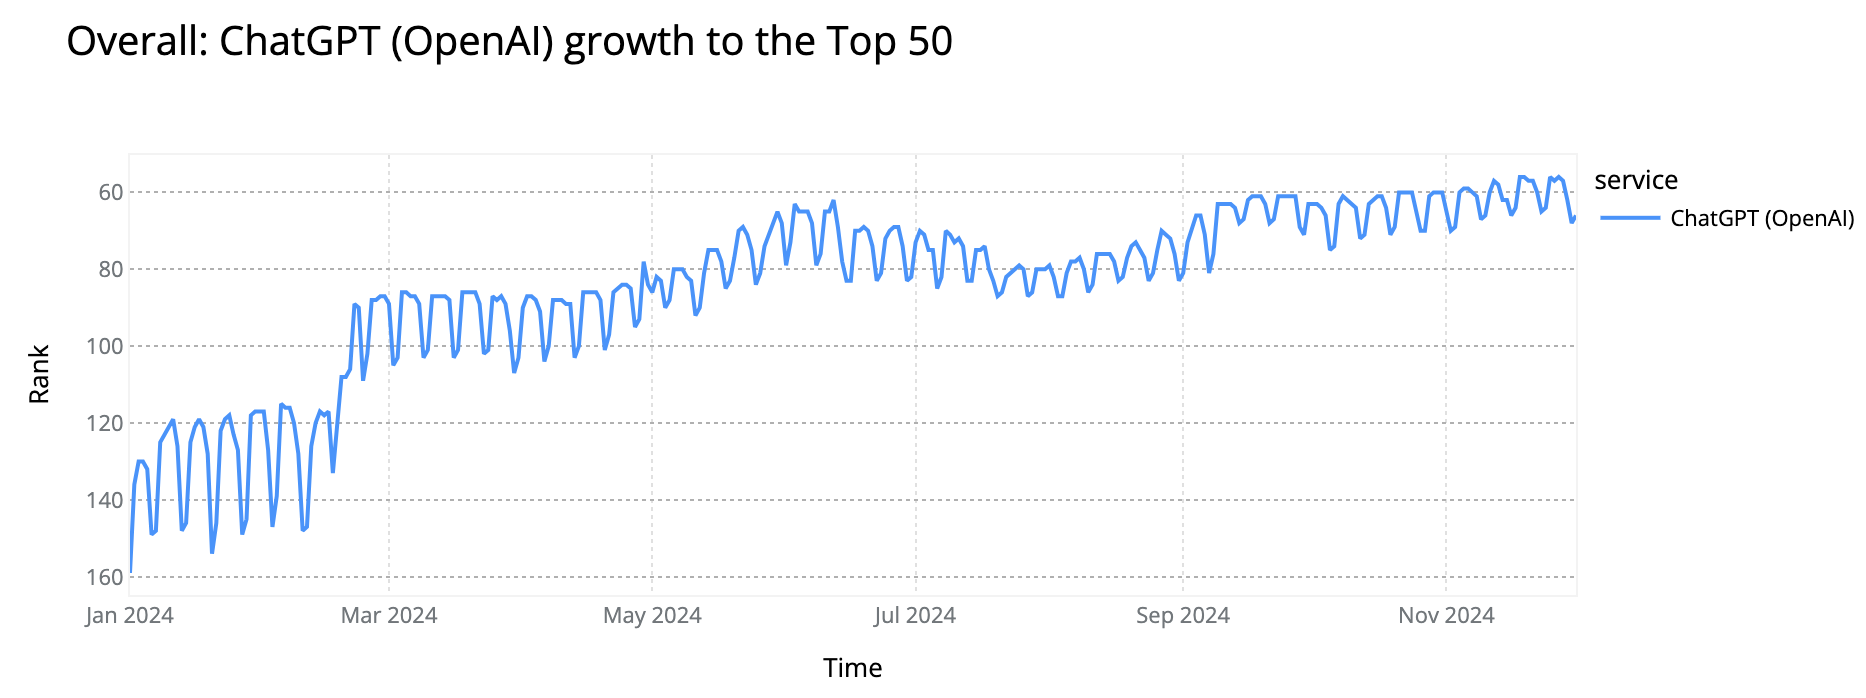
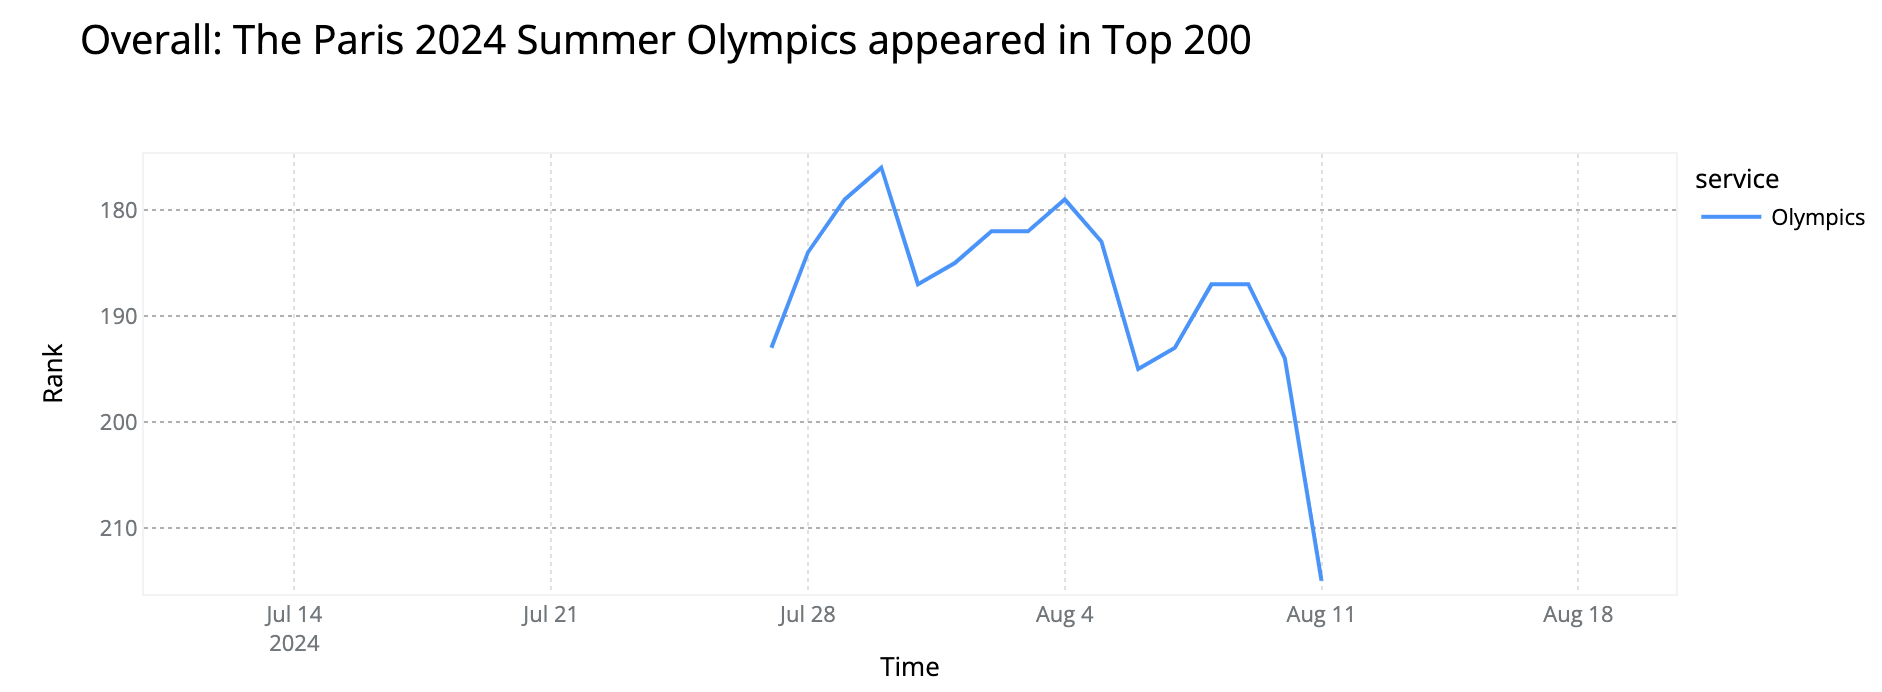
ChatGPT continued its steady ascent in the Overall domain ranking. After launching in late 2022, it hovered around #200 in early 2023, nearing the Top 100 by year-end. It then approached the Top 50 in late 2024, helped by back-to-school and return-to-work patterns. In 2025, it started between #51-60 and peaked at #33 on November 25, consistently ranking higher on weekdays.

-
By late November, ChatGPT sat just behind X (between #26-29) and ahead of Discord, Pinterest, and Reddit, a significant milestone for a service that didn’t exist three years earlier.
-
Other GenAI services also climbed the Overall rankings, though none matched ChatGPT’s momentum. Gemini rose quickly after entering the Top 500 in mid-March, peaking at #133 on November 24. Claude, barely inside the Top 500 in January, reached #155 on December 2 and held a Top 200 position from August onward. Perplexity surged from around #450 in early 2025 to peak at #155 on October 19, hovering near #160 in November. Grok reached #223 on November 18.


Reports estimate that over 5 billion people worldwide use social media, and that number has been growing. Facebook remains the dominant global platform, but the biggest shift in our rankings was Instagram displacing TikTok to secure the #2 spot. These platforms, along with Facebook, all appear in the Top 10 most popular Internet services overall.
Top 10 Social Media services in 2025
- Instagram ▲
- TikTok ▼
- Snapchat ▲
- Linkedin ▲
- X / Twitter ▼
- Kwai ▲
- Discord ▼
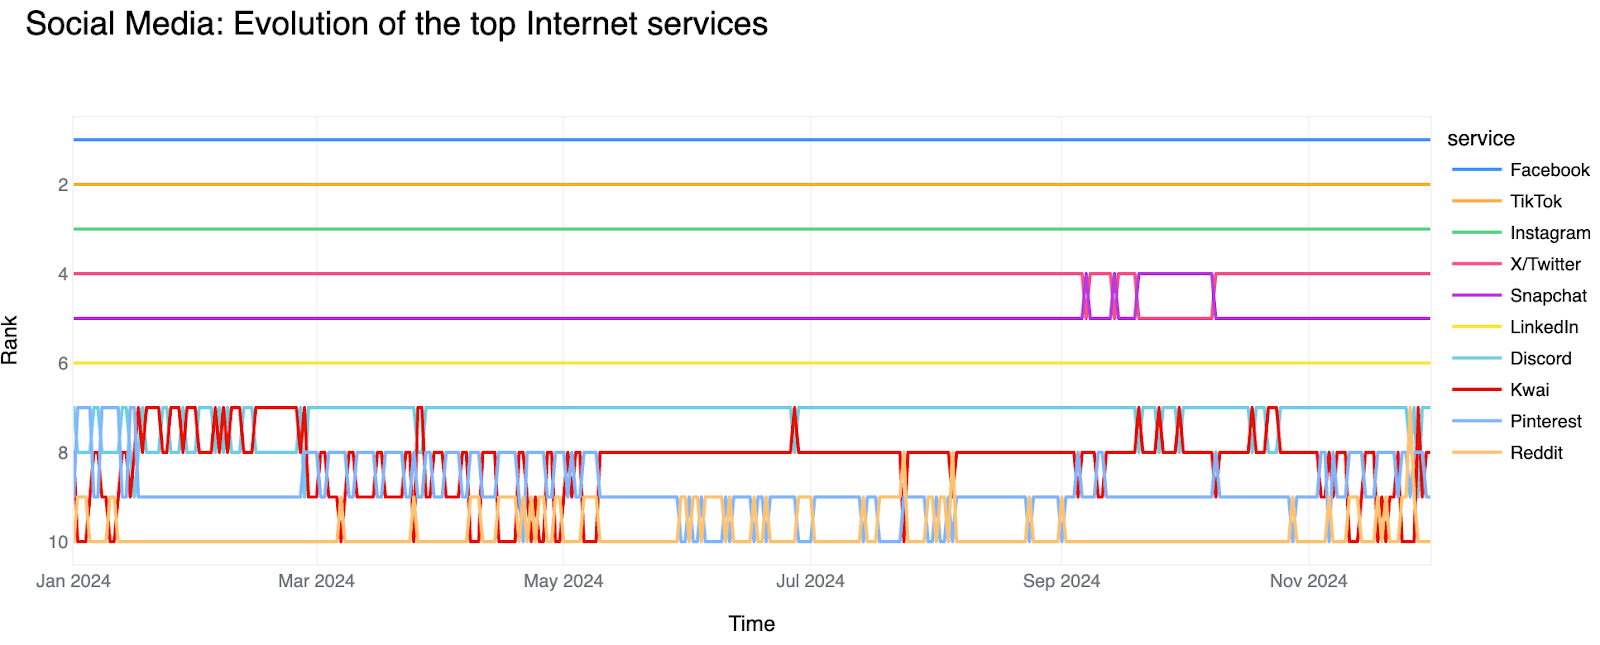
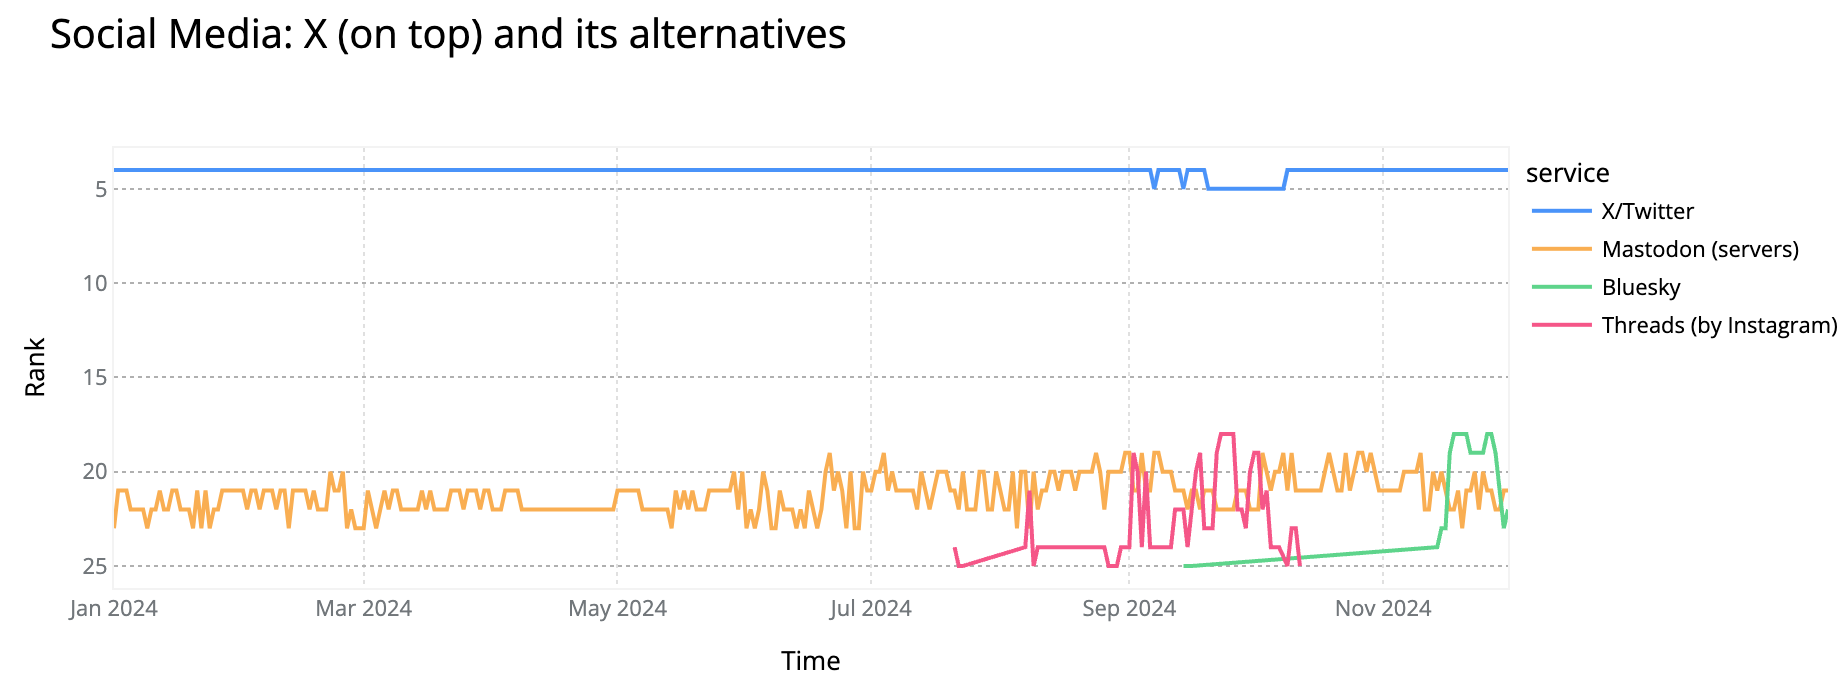
Instagram and TikTok swapped positions starting in May, with Instagram securing an uncontested #2 from late June onward. Snapchat moved into #4 in March, displacing X, which ended the year at #6, behind LinkedIn for the first time in our rankings. Discord and Reddit both briefly reached #7 before settling at #8 and around #9-10 respectively.
Kwai (known as Kuaishou in China) climbed from #8 in late 2024 to #7 in 2025, driven by growth in Latin America and other emerging markets. The Chinese short-video platform now ranks #2 in Brazil’s social media category (behind Facebook) and #3 in Brazil’s overall ranking.
Kwai reached top 10 status in two major emerging markets — Brazil (#3) and Indonesia (#9). It also ranked #15 in Syria, #18 in Colombia, and #20 in Egypt. Beyond these, it showed meaningful presence in markets like the Dominican Republic (#25), Guyana (#26), Oman (#28), and Argentina (#30).
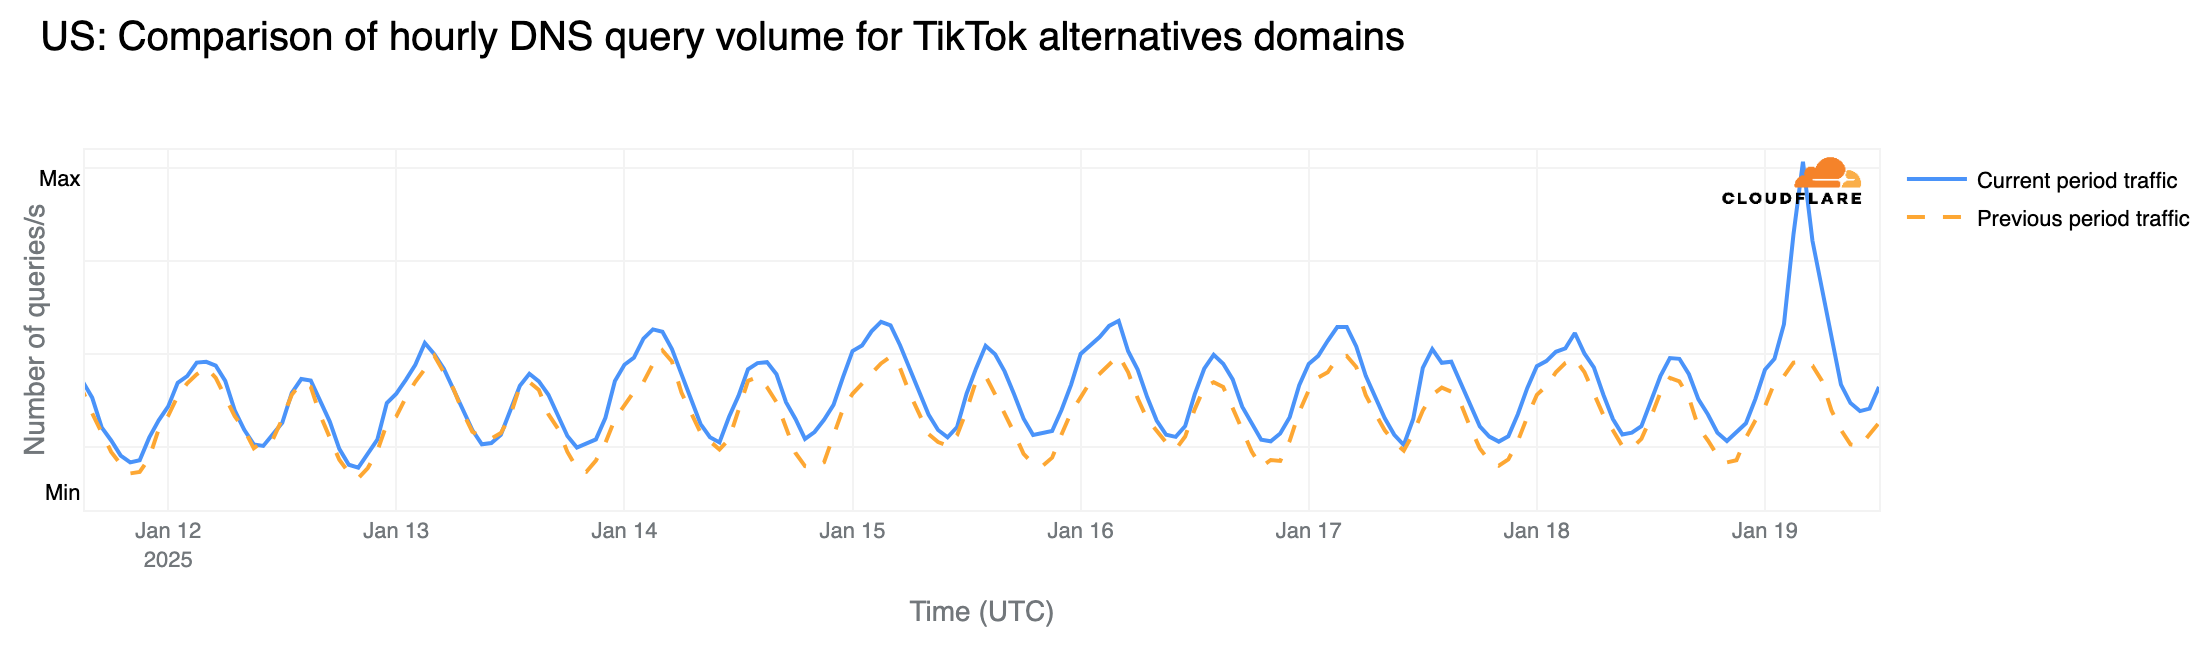
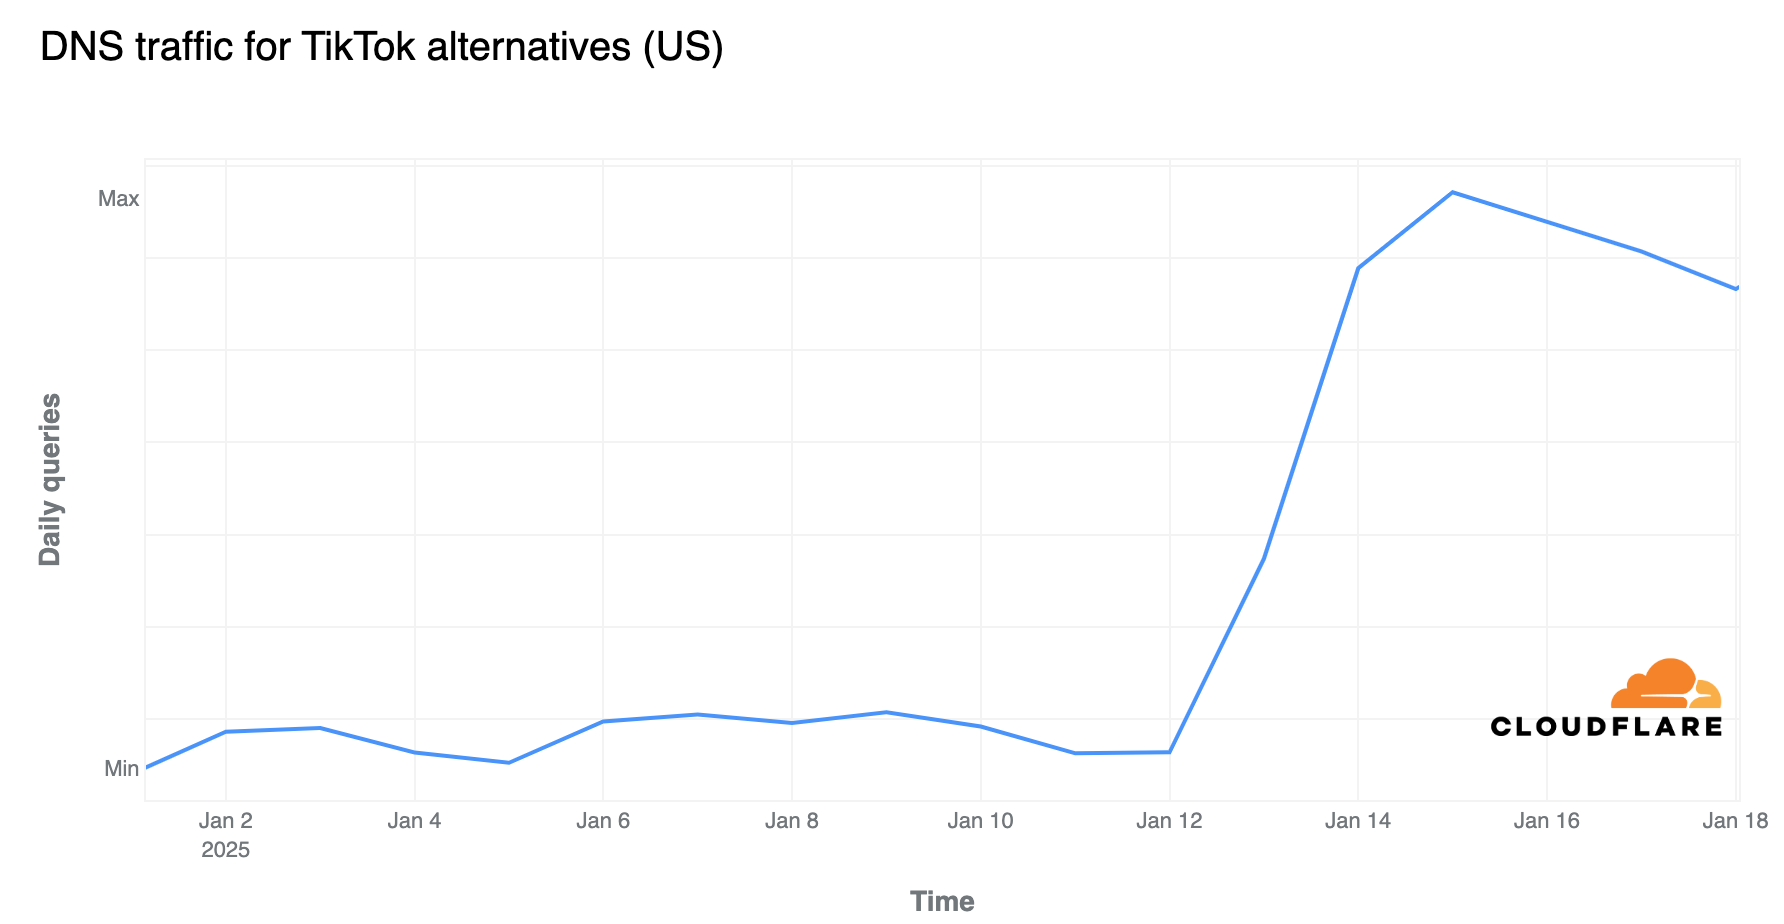
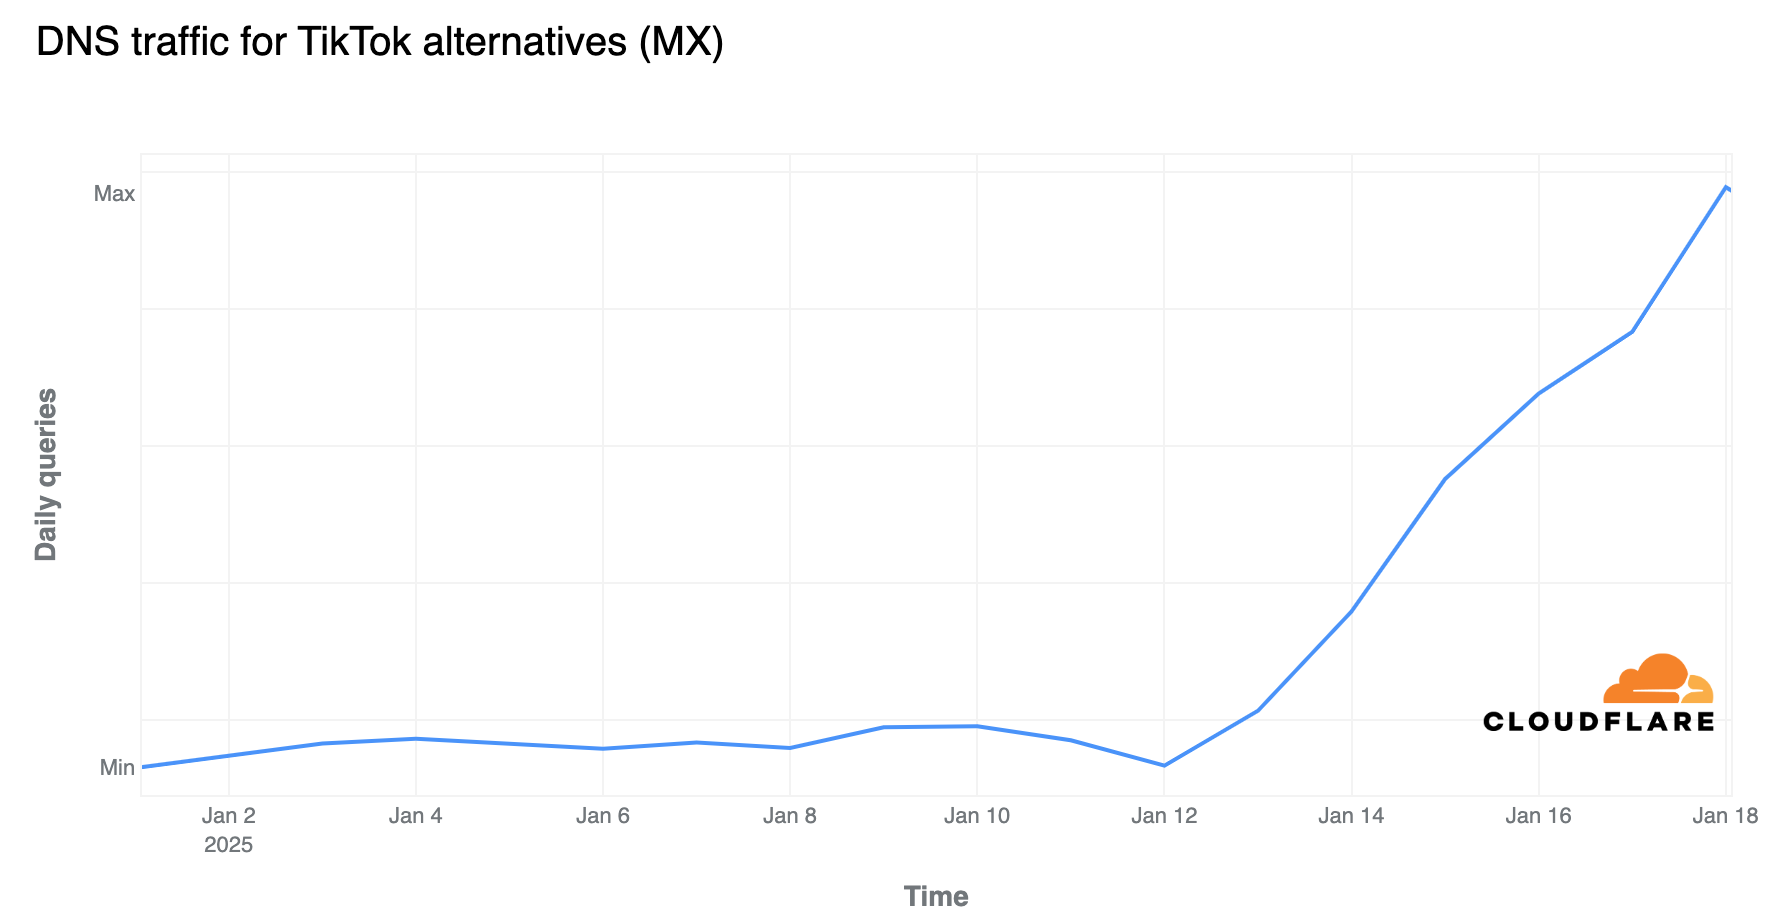
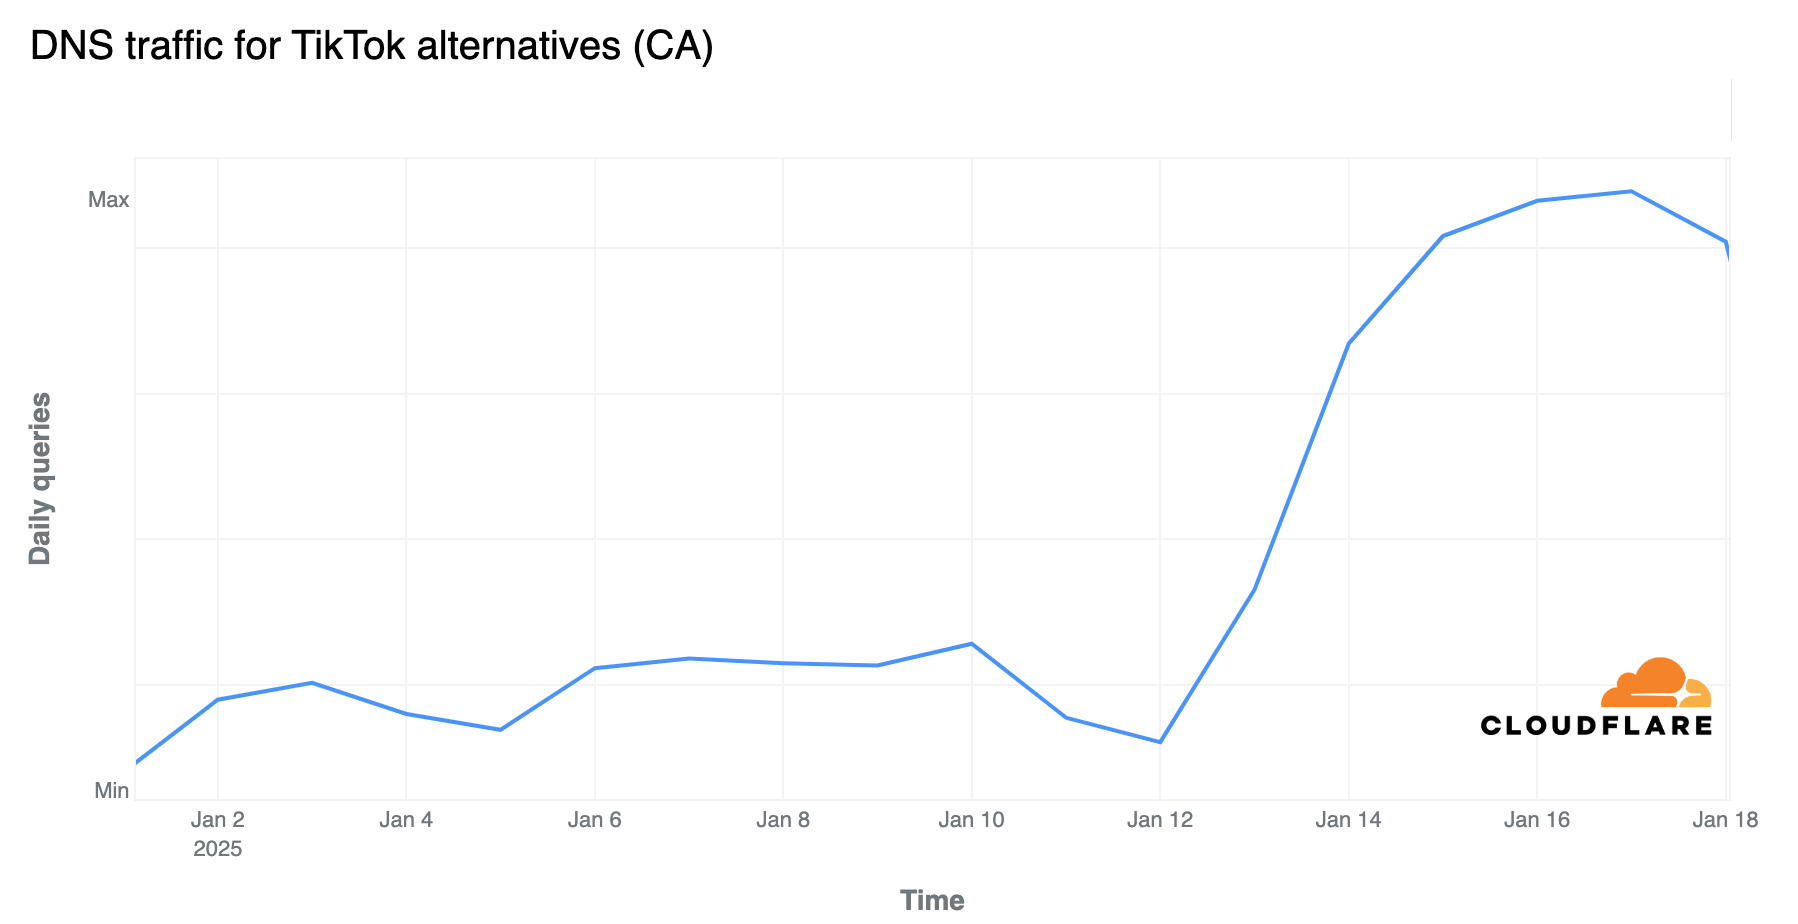
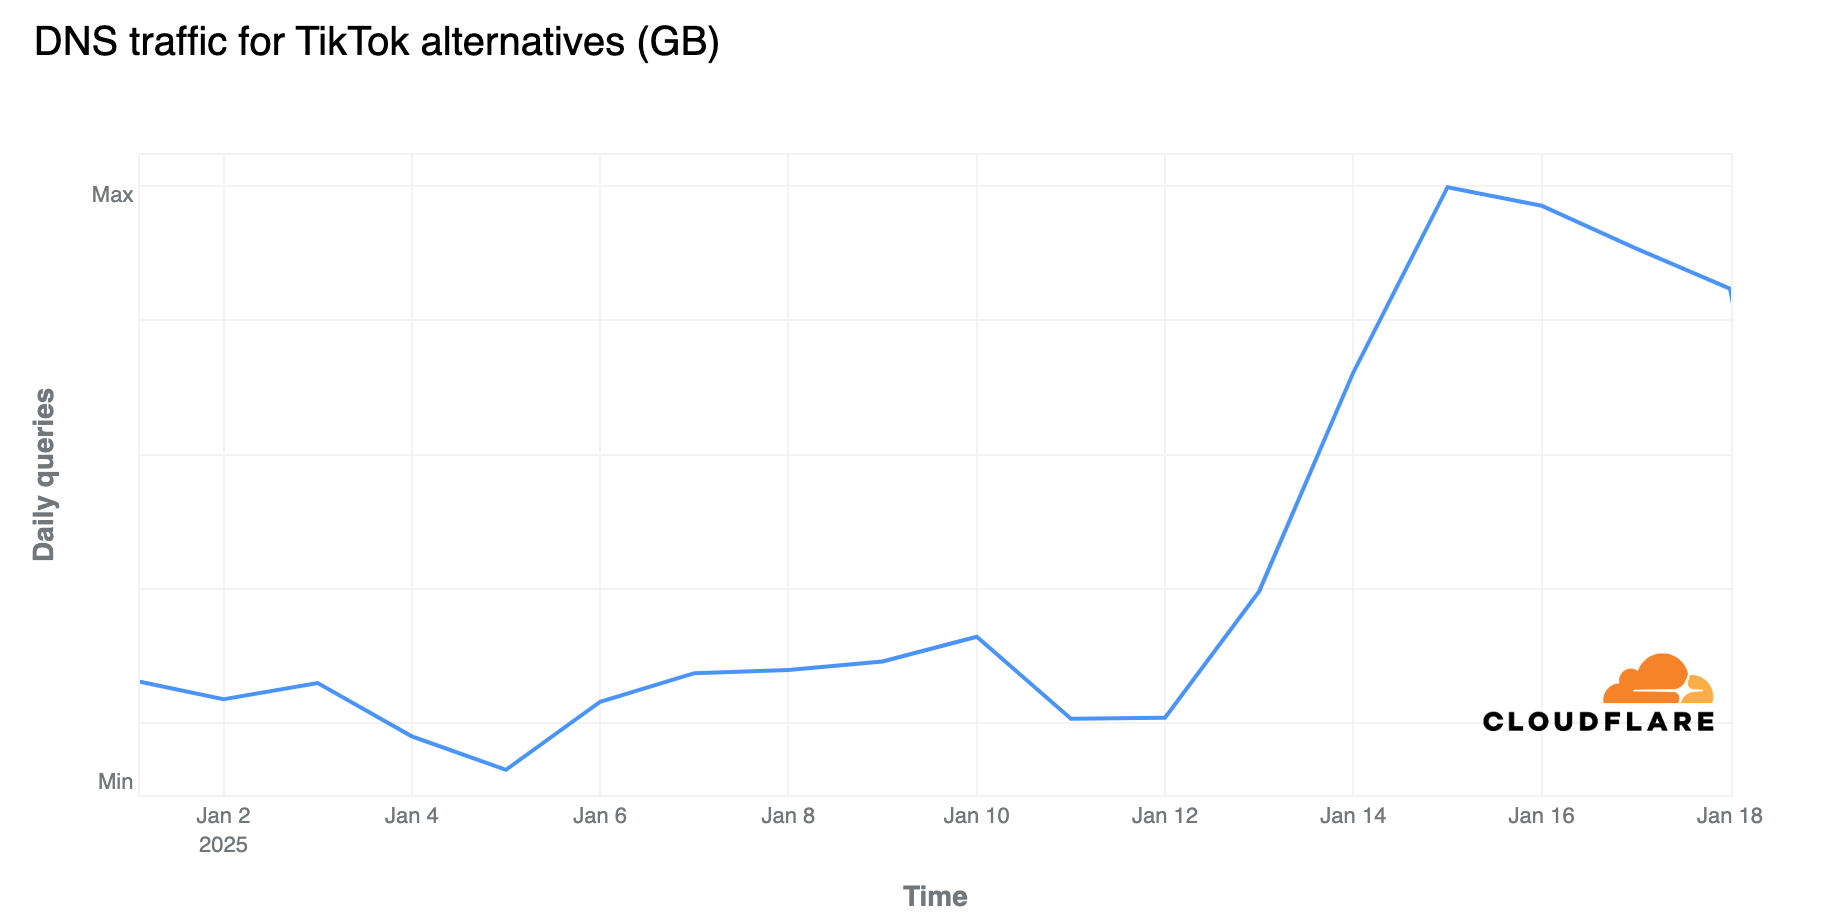
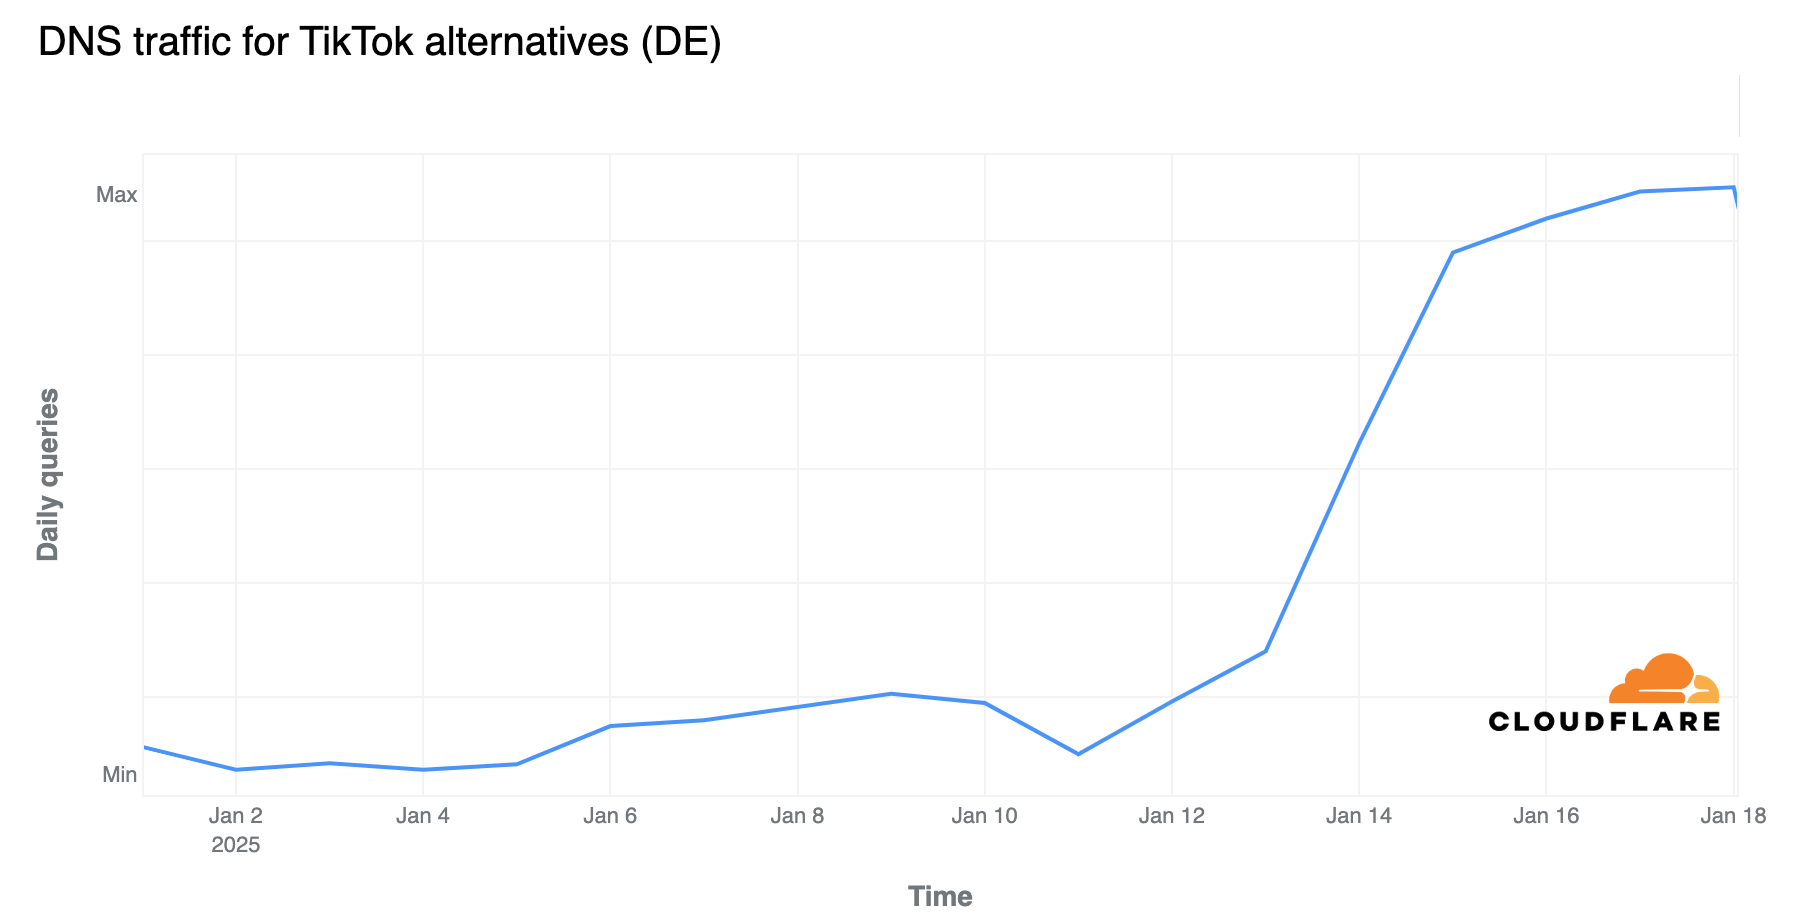
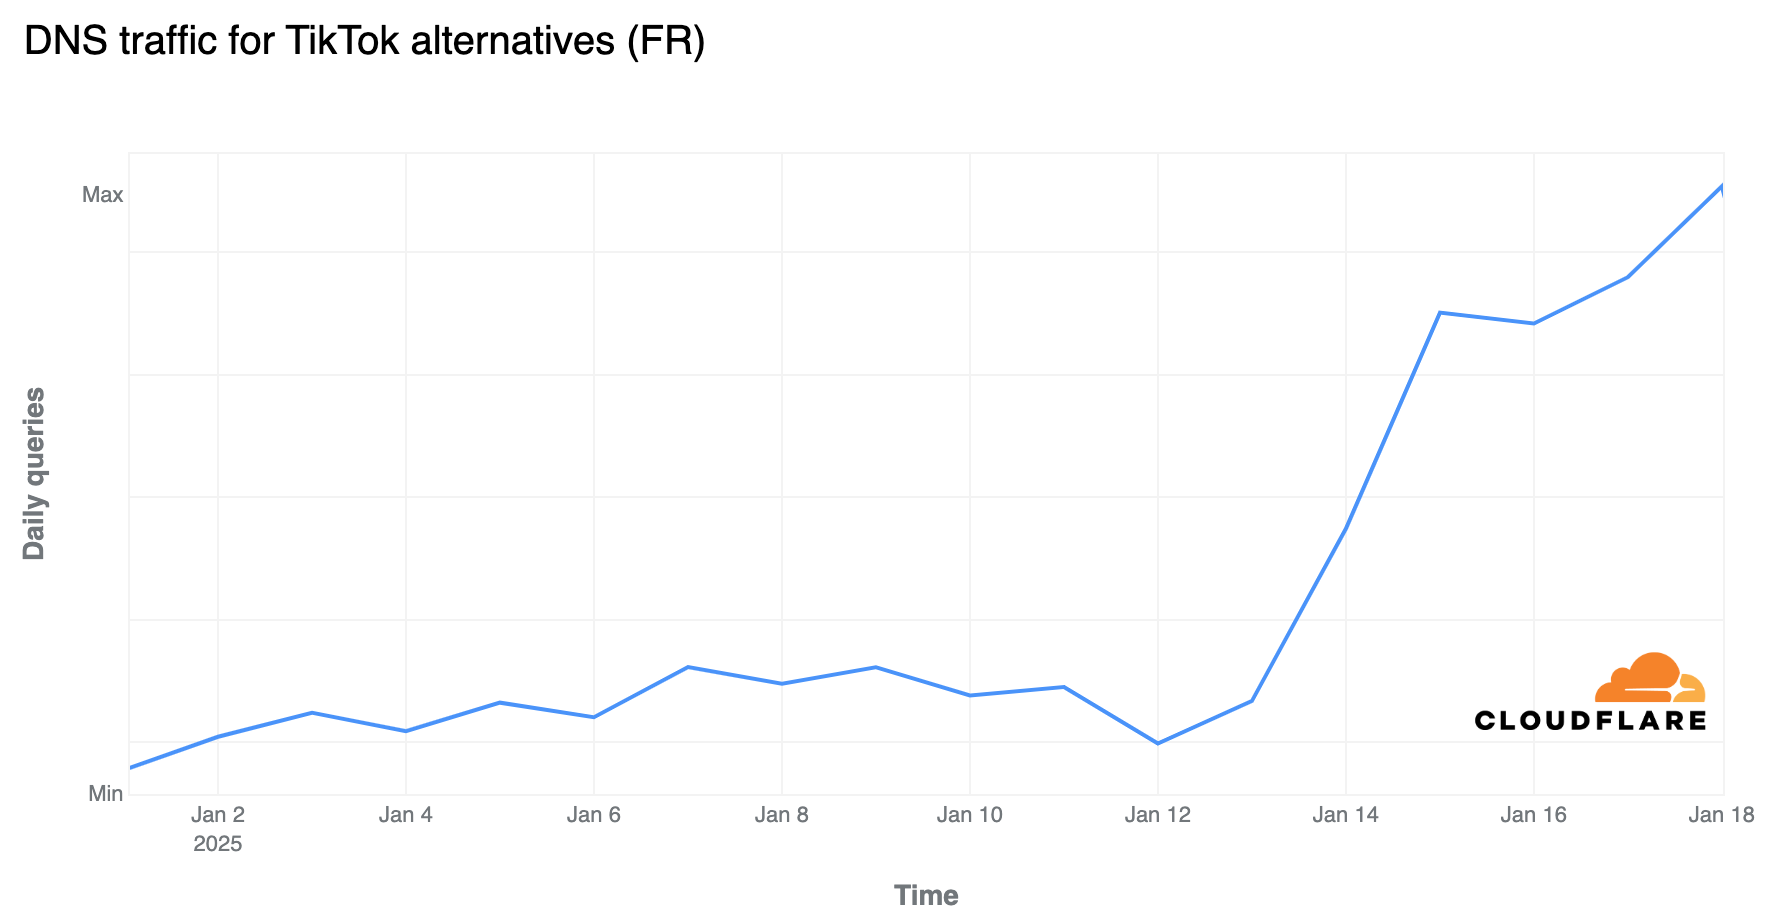
Our global ranking also highlights several non-Western platforms inside the Top 20. Douyin (the Chinese version of TikTok) held #11 for the second year in a row. VK (often described as Russia’s Facebook) remained at #12, and SnackVideo, a Southeast Asian TikTok rival also owned by Kuaishou, ranked #13. Xiaohongshu (RedNote), which gained attention during the brief U.S. TikTok ban in January, ranked #14.
Looking at microblogging competitors to X, none gained significant traction. Meta’s microblogging app Threads did not enter the Top 20 at any point, and Bluesky only briefly appeared on January 30, during the U.S. TikTok ban. Tumblr was in the Top 20 for much of the year, and Mastodon servers appeared there through most of October.
OnlyFans, the subscription-based content platform, appeared consistently in the Top 20 between May and early August (around #19) but declined in the second half of the year. Here’s the Social Media Top 10 chart for 2024:

Let’s go beyond the Social Media category to see how these platforms performed in our Overall ranking, where bigger shifts between services are evident.
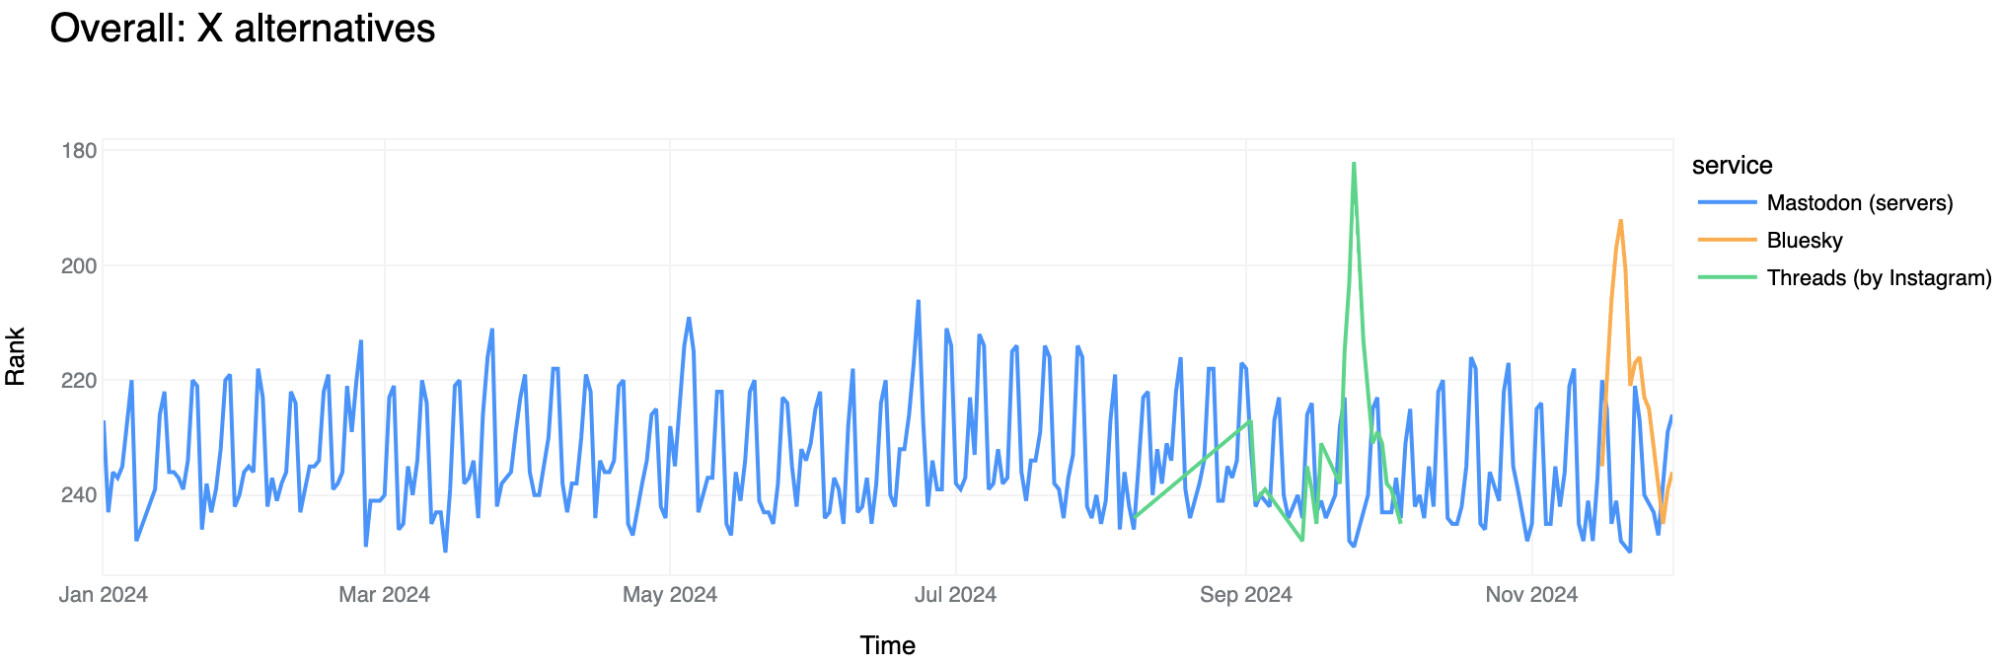
X alternatives showed limited DNS presence. Mastodon (aggregated servers) performed best, consistently ranking between #208 and #248, with stronger weekend traffic. Bluesky peaked around #240 in May but declined through most of the year, with a notable spike as the U.S. held off-year, state and local elections on November 4 (#229). This mirrors the pattern seen after the 2024 U.S. presidential election, when Bluesky performed better around election day and peaked on November 14 at #193.
Threads trailed both platforms, peaking at #279 in June but generally ranking around #360. (Note: Threads uses Meta’s shared infrastructure, so some images could load from Facebook/Instagram domains, which may reduce its standalone DNS footprint.)

Usage patterns in the Overall ranking:
-
Weekday vs. weekend trends: X, LinkedIn, Snapchat, and Discord performed better on weekdays, while Kwai, Pinterest, Tumblr, and OnlyFans peaked on weekends. LinkedIn ranked highest Monday–Wednesday, and Tinder continued its pattern of Sunday peaks.
-
Growth stories: Reddit stayed in the Top 50 throughout 2025 (an improvement over 2024), stabilizing in the #34-40 range after May and performing strongest Monday-Thursday. Kwai also had a strong second half of the year, peaking at #28 in September.
-
Declines: Quora continued the downward trajectory seen in 2024, falling from around #160 to outside the Top 200. Tinder and Tumblr followed similar patterns, both dropping below #200. OnlyFans remained inside the Top 200 from April to June but declined in the second half of the year.
-
Event-driven spikes: Instagram reached #4 for several days between mid-May and mid-June. X peaked at #15 on March 2 during the Oscars (compared with a #12 peak in 2024). Pinterest surged on November 30, the Sunday of Black Friday week.
Every Cyber Week and Black Friday season reminds us how central e-commerce has become to global Internet traffic. In this category, Amazon remained the undisputed leader in 2025, but the strongest momentum came from newer players that now round out the top three: Shopee (which launched in Singapore in 2015 and is popular in Southeast Asia) and China’s Temu (which expanded to the U.S. in 2022). Meanwhile, 2024’s top-three finishers Taobao and AliExpress both moved down the ranking to #5 and #10 respectively.
Top 10 E-commerce services in 2025
- Amazon
- Shopee ▲
- Temu ▲
- Shopify
- Taobao ▼
- eBay ▲
- Alibaba ▼
- Shein
- Mercado Libre
- AliExpress ▼
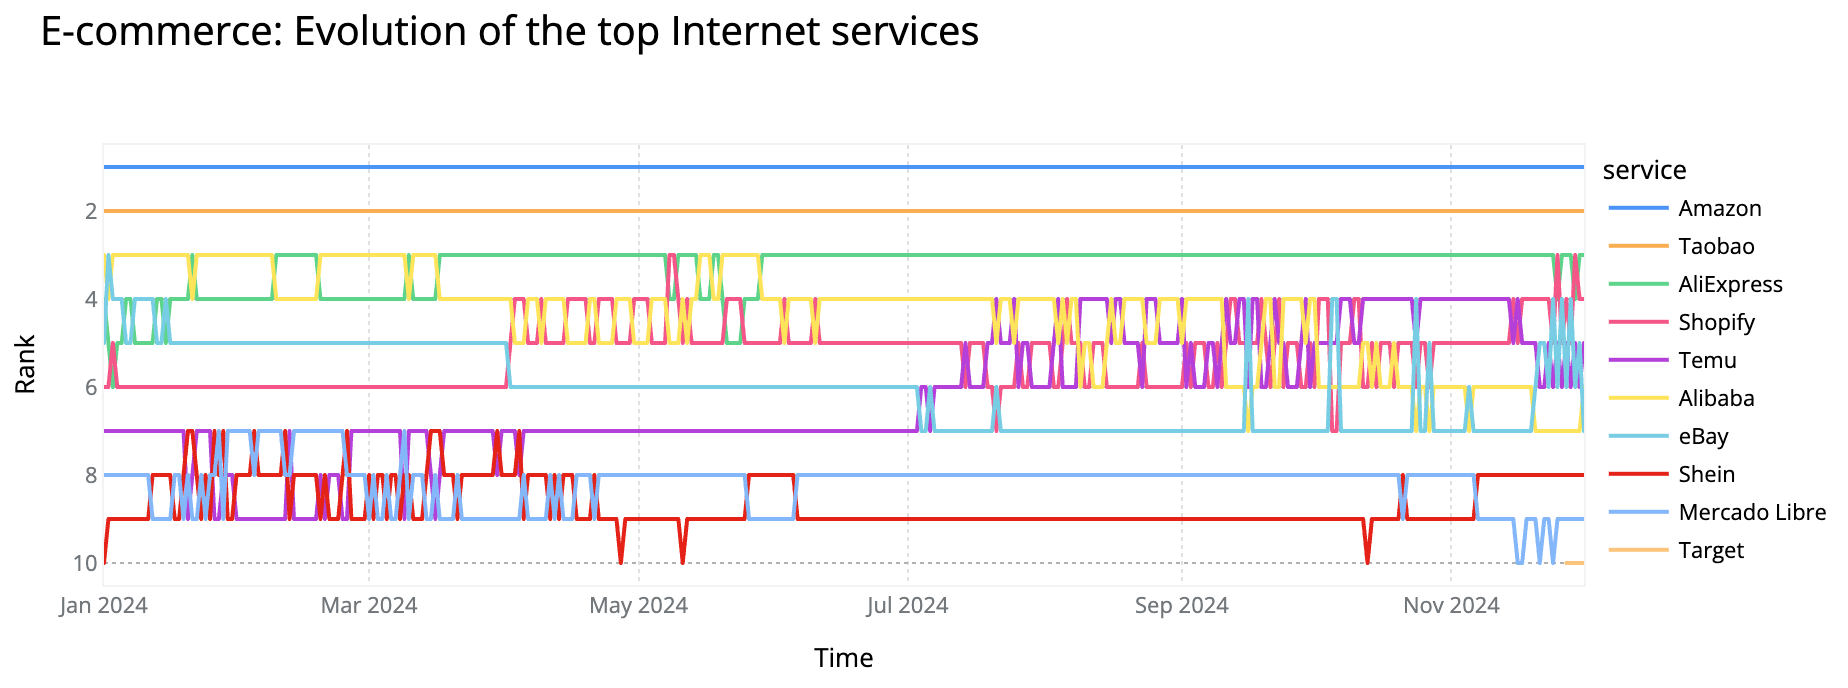
Shopee and Taobao began 2025 competing for the #2 position, but from mid-April to early July, Temu temporarily overtook both. From July onward, Shopee held #2 consistently, with Temu settling at #3. In 2024, Shopee was just outside the Top 10, while Temu finished at #5.
Shopify also strengthened its position. It opened the year at #6 and has remained steadily at #4 since July — the same finishing position as in 2024, but now ahead of Taobao and AliExpress and just behind Shopee and Temu.
eBay showed a clearer recovery: after ending 2024 at #7 (and 2023 at #3), it moved between #3 and #6 early in the year and ultimately held #6. Shein maintained #8, identical to 2024, and continued to outperform Mercado Libre (#9).
Just outside the Top 10 were Russia’s Wildberries, followed by Walmart and Japan’s Rakuten.

Looking at the broader Overall ranking, several patterns stood out:
-
Amazon followed a trajectory similar to 2024. It hovered between #9 and #10 after July, rose to #8 during Black Friday week, and peaked at #7 on November 29 (the day after Black Friday). It continued to perform better on Sundays.
-
Shopee remained around #50 for most of the year, outperforming its Black Friday number on Singles’ Day (November 11), when it reached #46 (vs. #48 on Black Friday). Shopify closed the gap in November: its best day was Black Friday, November 28, and it also hit #49 on November 6. Shopify continued to show stronger weekday performance.
-
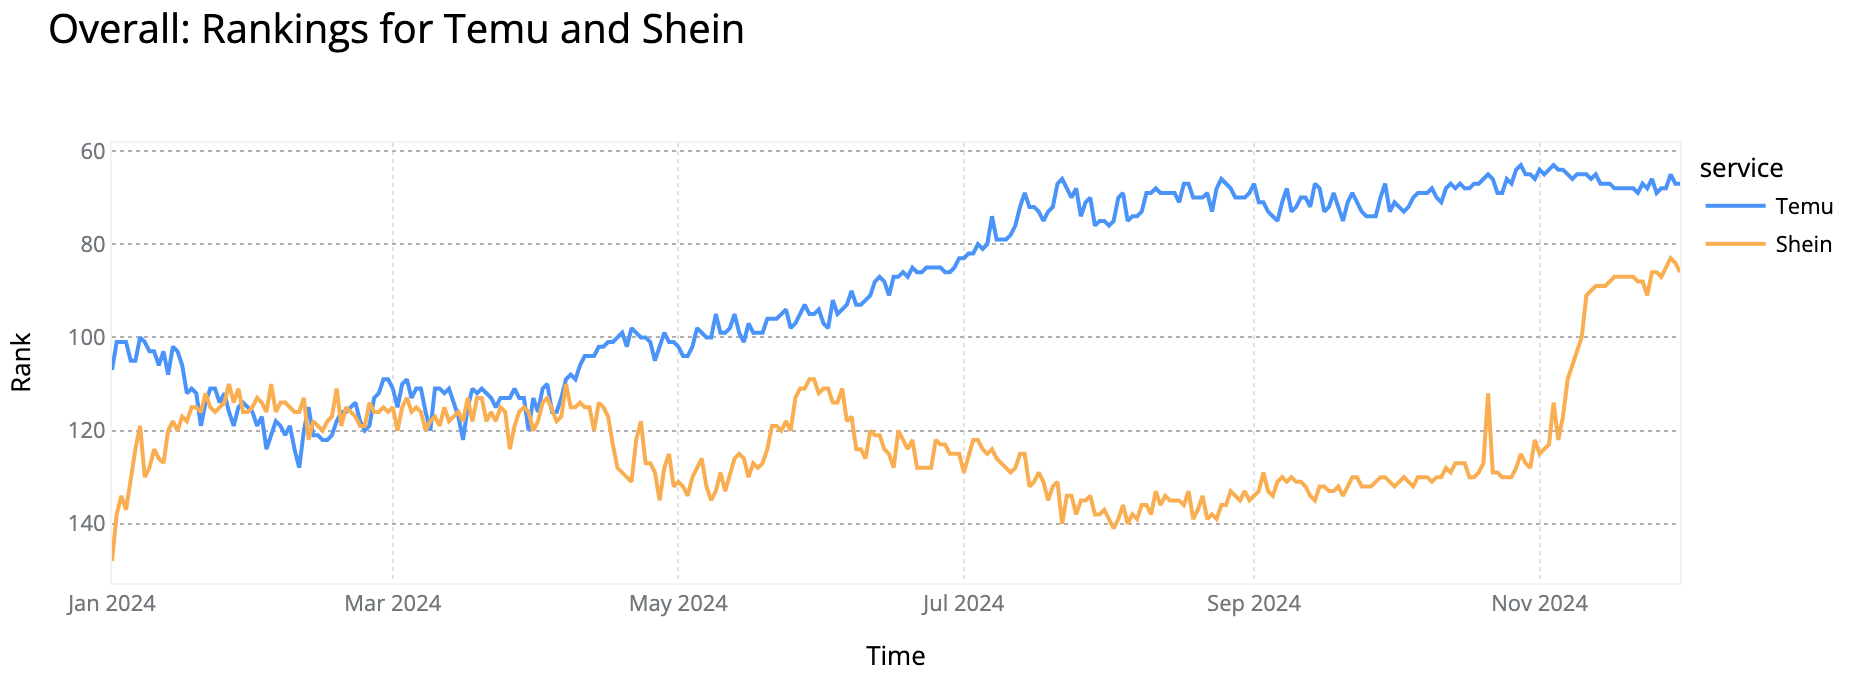
Temu, known for its low-cost marketplace model, peaked at #36 on May 18 (the day after the 2025 Eurovision final). It began the year near #60 (vs. outside the Top 100 in early 2024) and ended 2025 around #50. Black Friday did not visibly impact its ranking.
-
Shein remained more stable this year, holding between #80 and #90 after finishing just outside the Top 100 in 2024. It peaked at #78 on November 29. Temu, which had a similar performance to Shein in 2024, clearly outpaced it in 2025.
-
eBay improved its consistency, ranking between #46 and #62 throughout the year (vs. remaining outside the Top 70 in 2024). It peaked at #42 on April 15. As with previous years, Black Friday had little impact, reflecting lower seasonal demand for second-hand marketplaces.
-
Mercado Libre grew meaningfully in 2025, entering the Top 100 from September onward. Its best day, as in 2024, was Black Friday (November 28), when it reached #82 (vs. #100 in 2024).

Other retail services also had a Black Friday week impact in the Overall category:
-
Adidas entered the top 250, reaching #229 on Cyber Monday and #249 on Black Friday (similar to 2024).
-
Nike slipped slightly, peaking at #287 on Black Friday.
-
Target hit #117 on Cyber Monday, improving on its 2024 high of #127. It performed best on Saturdays.
-
Walmart performed slightly better than Target, peaking at #101 on the August 23-24 weekend and reaching #120 ahead of Thanksgiving.
-
Ikea showed a nearly identical pattern to 2024, peaking at #242 on June 2-3.
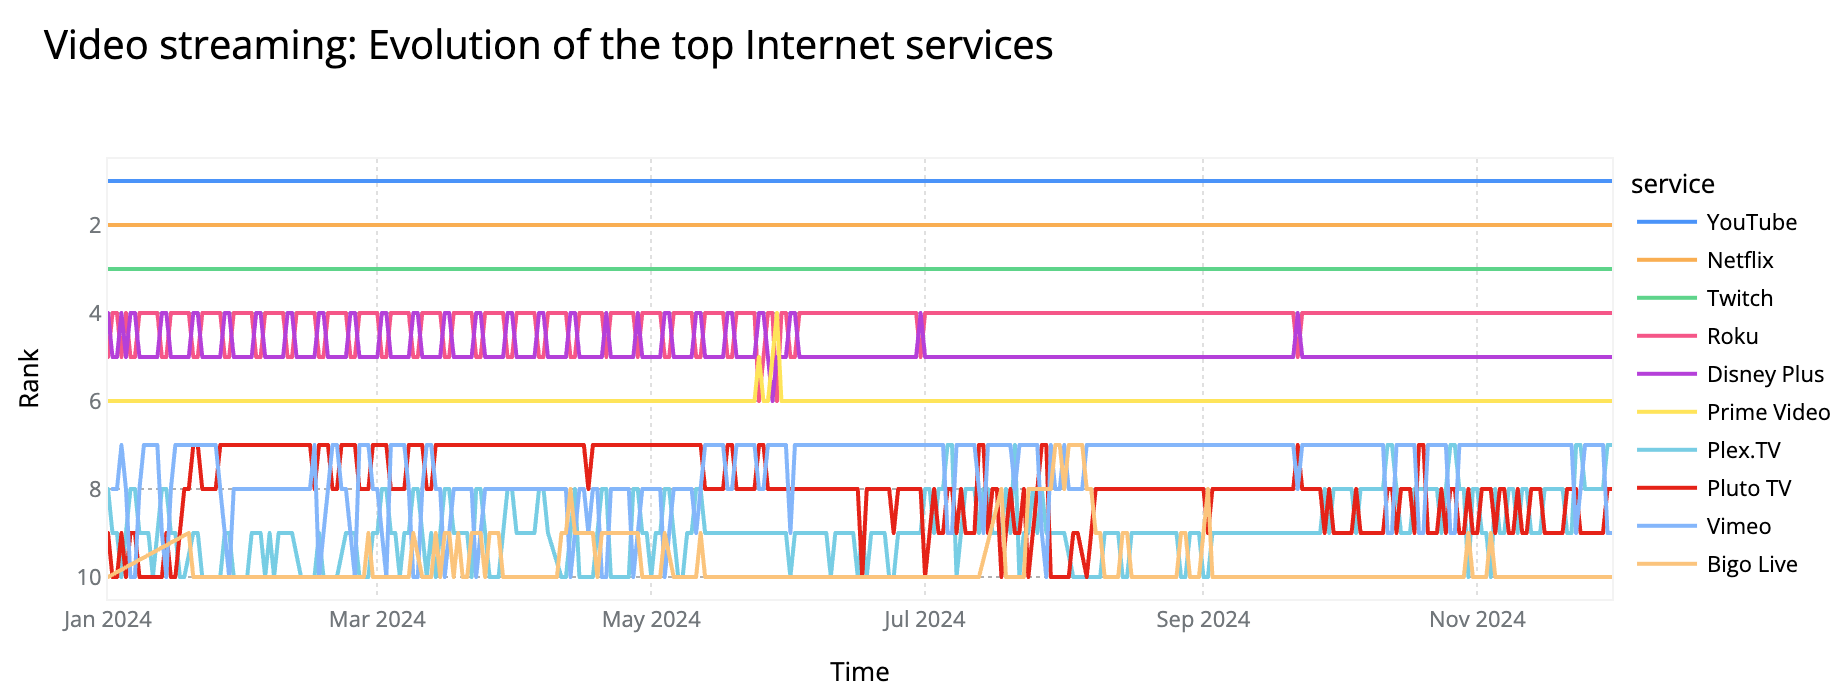
Video streaming remained one of the most stable categories of 2025, even as industry consolidation intensified. The Top 3 did not change for the third year in a row: YouTube held #1, followed by Netflix and Twitch.
Top 10 Video streaming services 2025
- YouTube
- Netflix
- Twitch
- Roku
- Disney Plus
- Prime Video
- Vimeo
- Pluto TV ▲
- Plex TV ▼
- HBO Max ▲
HBO Max was the year’s biggest climber, entering the Top 10 for the first time and reaching #8 on Cyber Monday (December 1), boosted by new episodes of IT: Welcome to Derry. The only other shift in the Top 10 was Pluto TV, a free ad-supported service, moving ahead of Plex TV.
Among paid services, Netflix remained the clear leader, followed by Disney Plus (#5) and Prime Video (#6). Hulu (#11), Peacock (#15), Apple TV+ (#17), and Paramount Plus (#20) stayed outside the Top 10. Roku consistently held #4 and briefly overtook Twitch during Black Friday week. Disney Plus held #5 throughout the year but climbed to #4 on several weekends between March and June, around the time of the premieres of Daredevil: Born Again and later Andor season 2.
The Top 10 over 2025:

Across the year, major premieres produced clear surges in the broader Overall ranking:
-
YouTube peaked at #5 on July 5, the day MrBeast released “World’s Fastest Car Vs Cheetah!”
-
Netflix stayed near #11 on weekends from late June and peaked at #10 on November 30, following the release of Stranger Things season 5.
-
Disney Plus ranged between #47 and #60, with its strongest spikes possibly tied to Daredevil: Born Again.
-
Prime Video reached #53 after the launch of The Family Man season 3 on November 22-23 and again on November 30.
-
HBO Max was consistently close to the Top 100 in our Overall ranking and peaked on November 23 during a release of IT: Welcome to Derry. Hulu showed similar Cyber Week behavior, reaching #132. Paramount Plus outperformed Peacock at the end of November on weekends, peaking at #197 on November 23 and 30.

As with previous years, most paid streaming platforms were strongest on weekends, especially Sundays, reflecting global viewing habits.
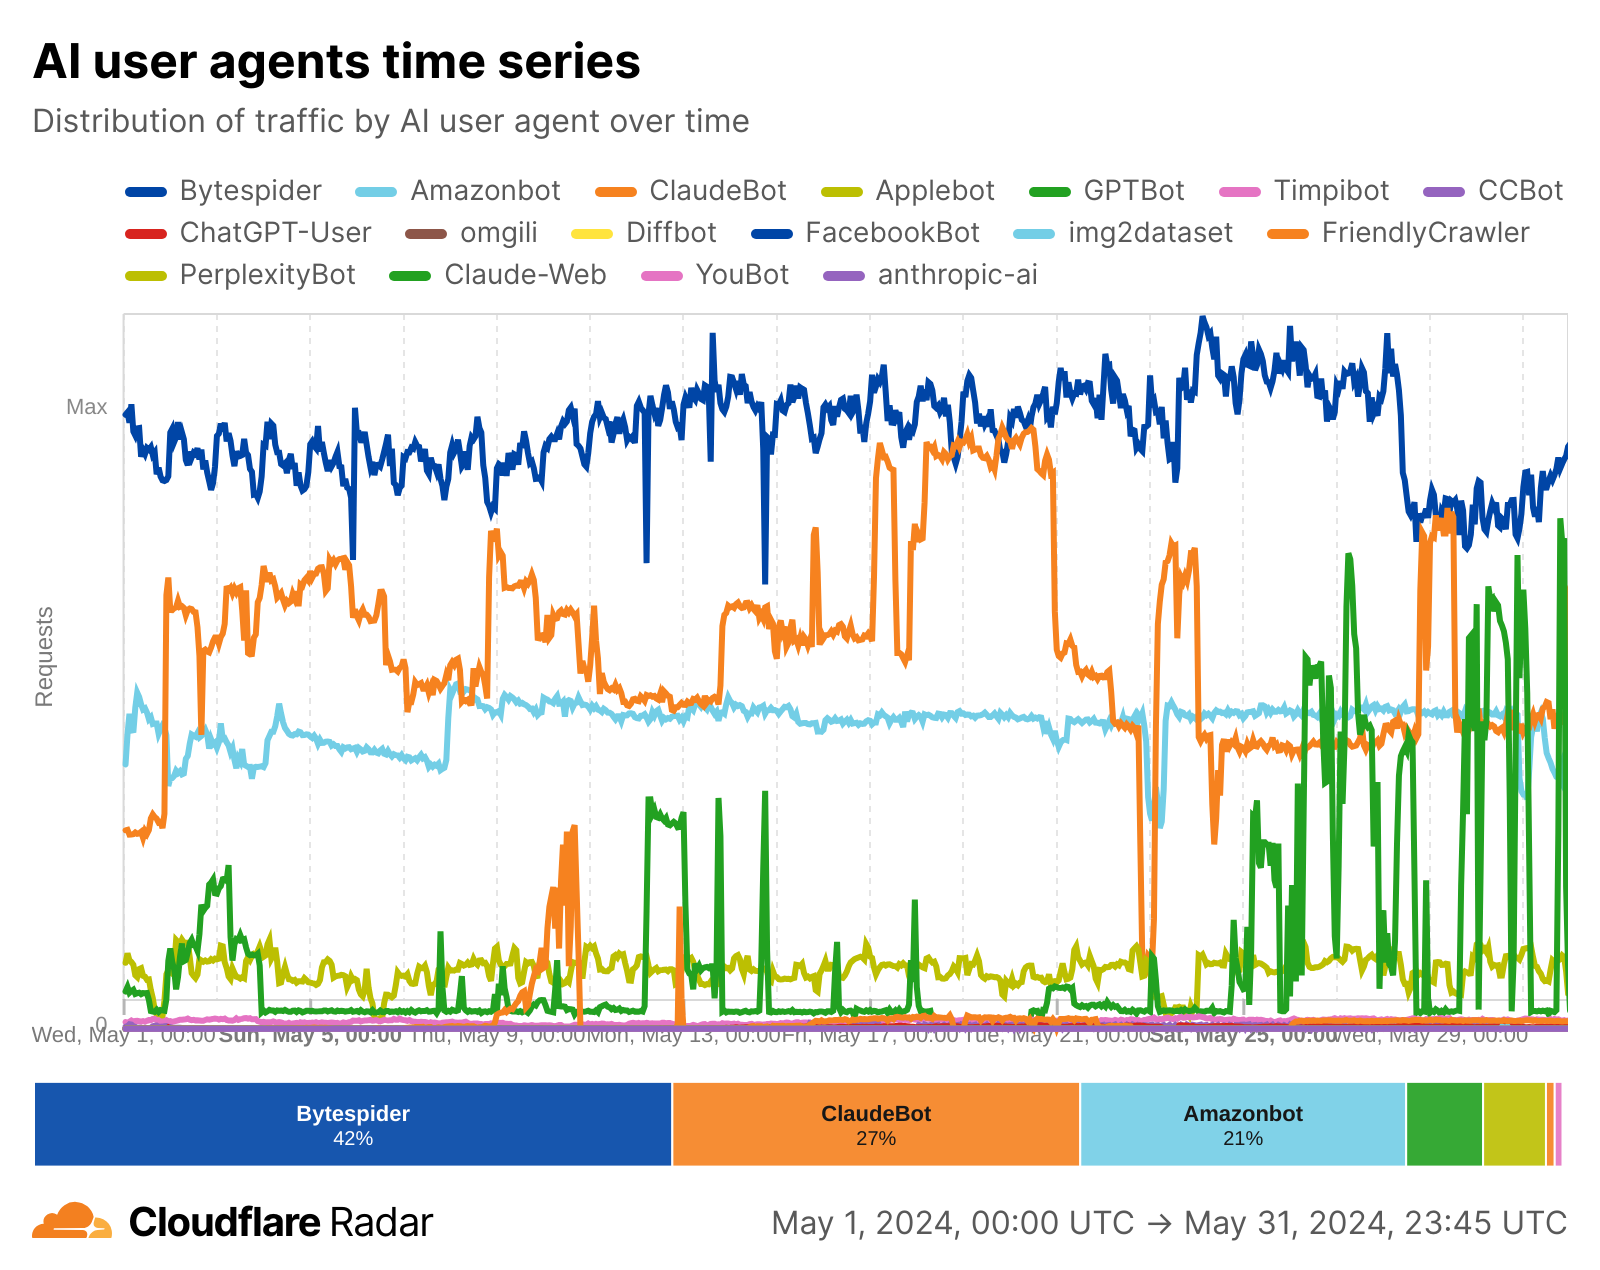
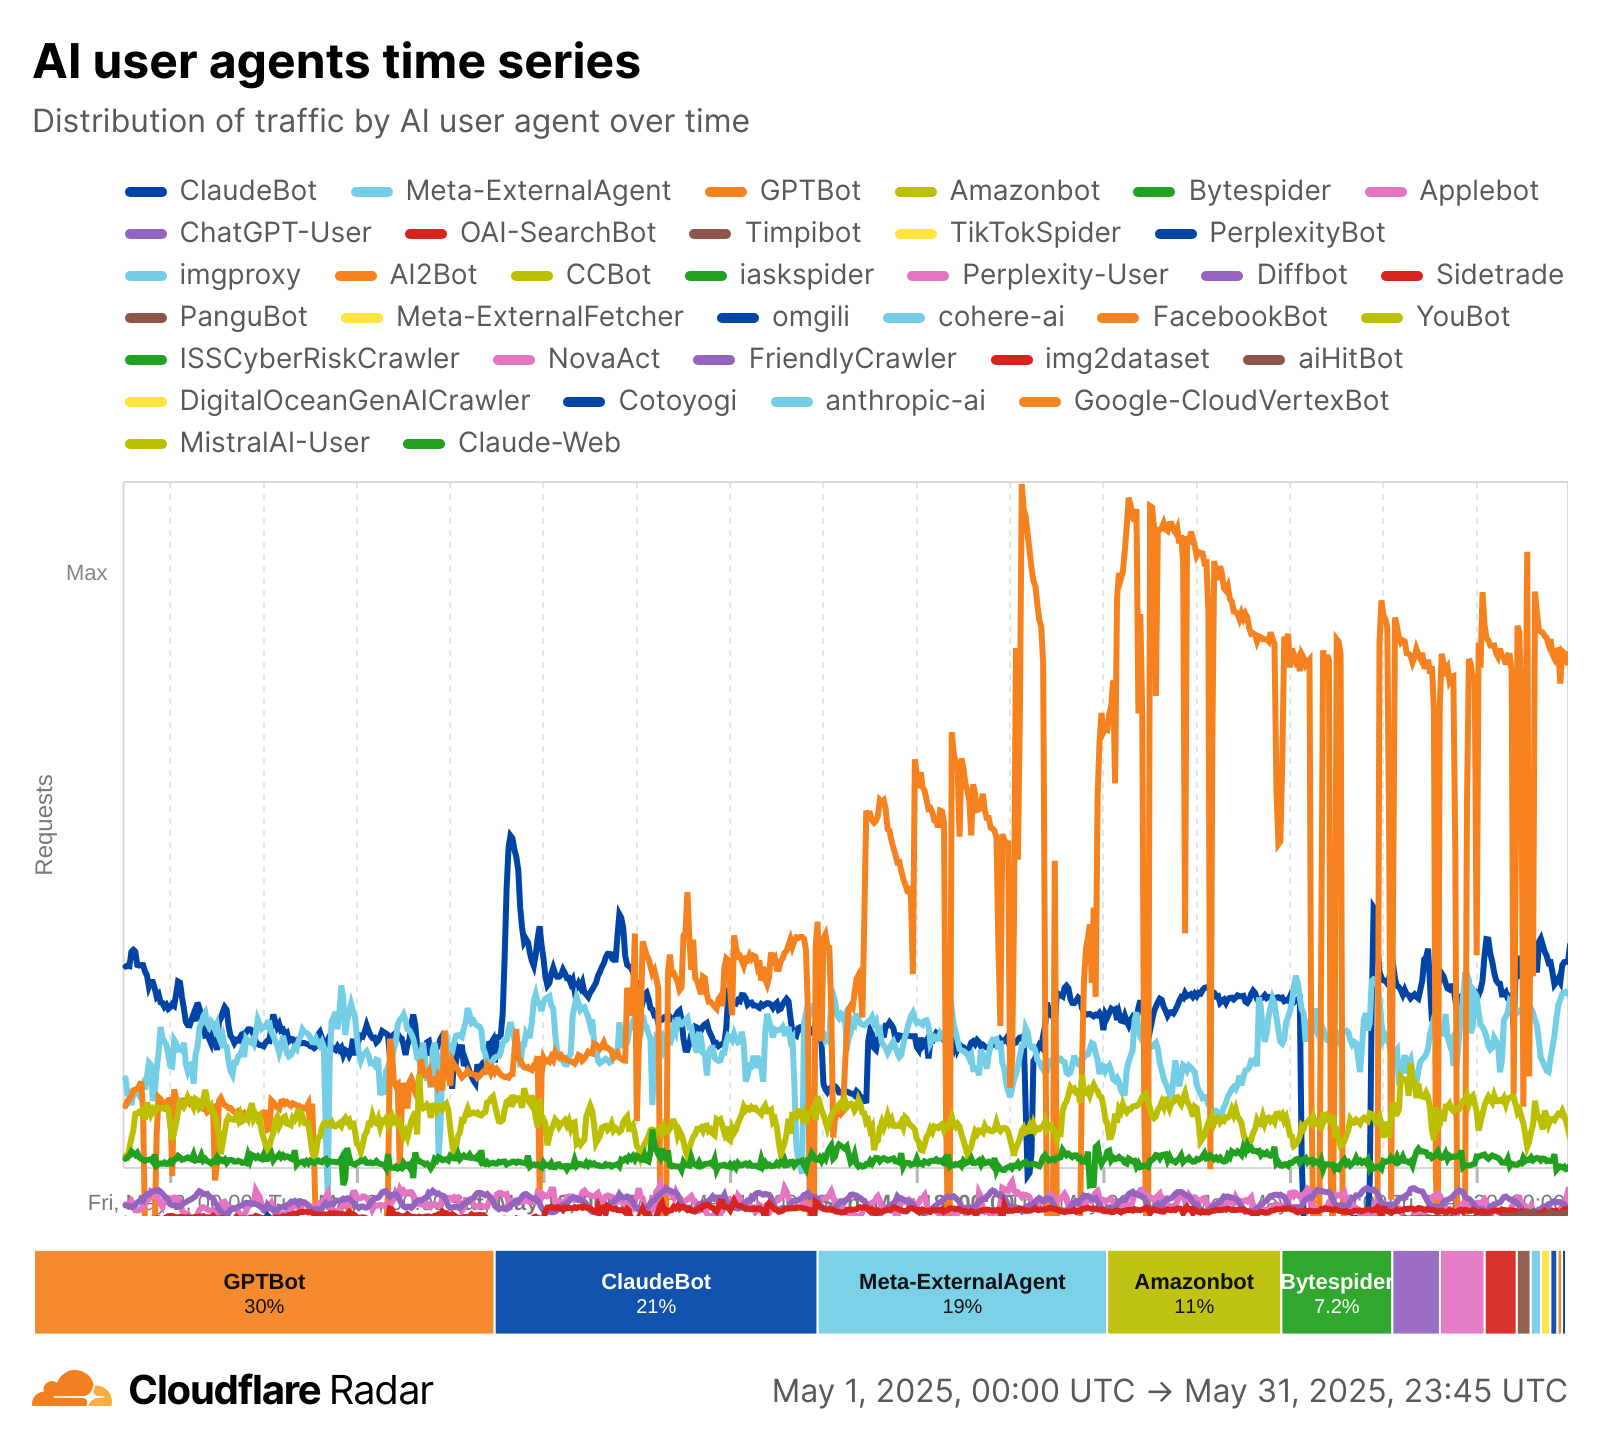
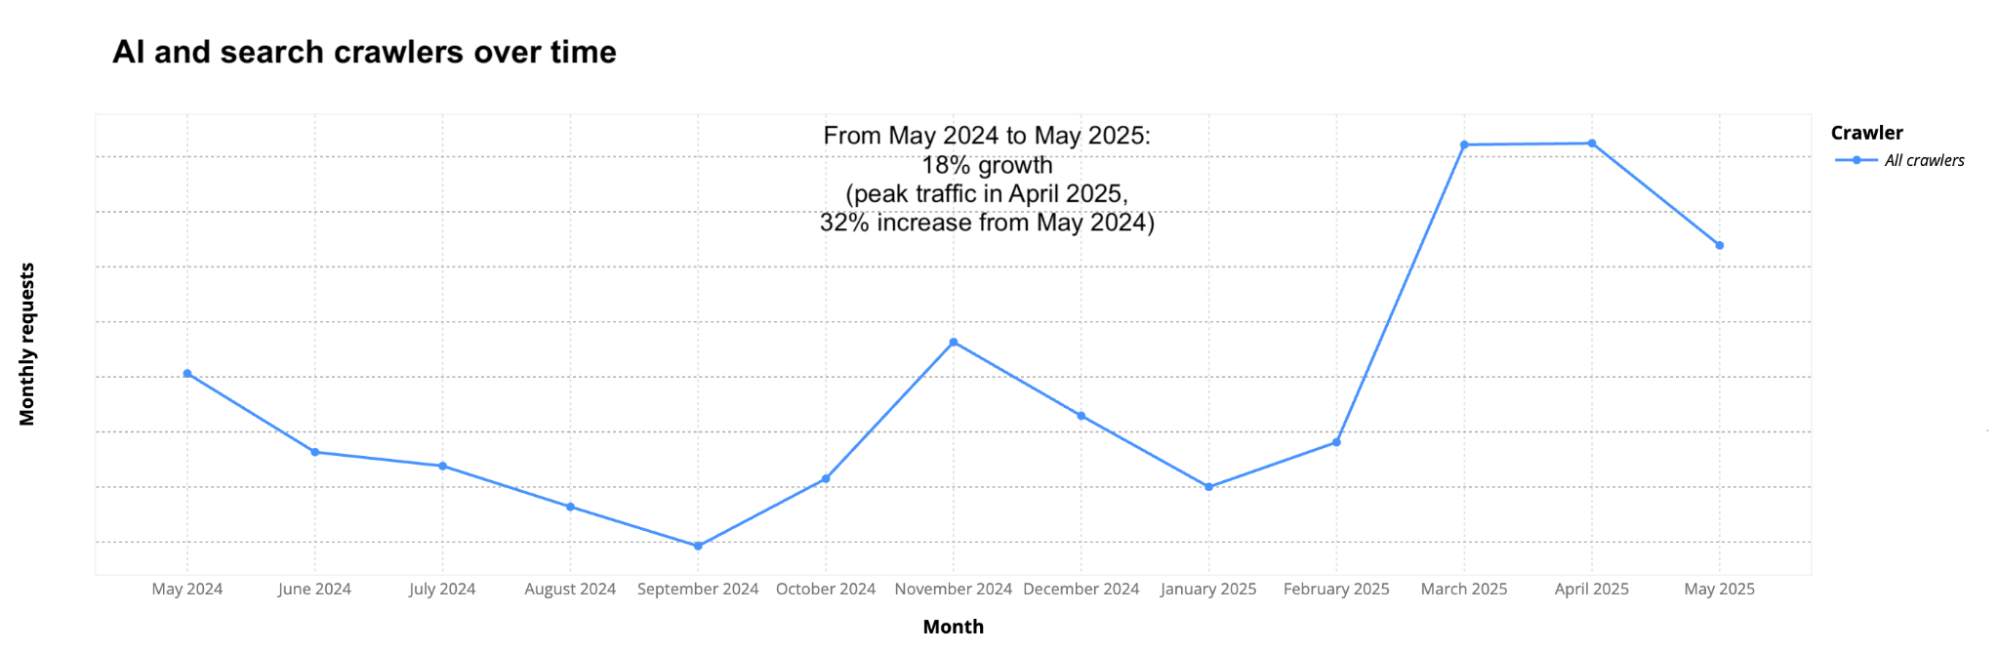
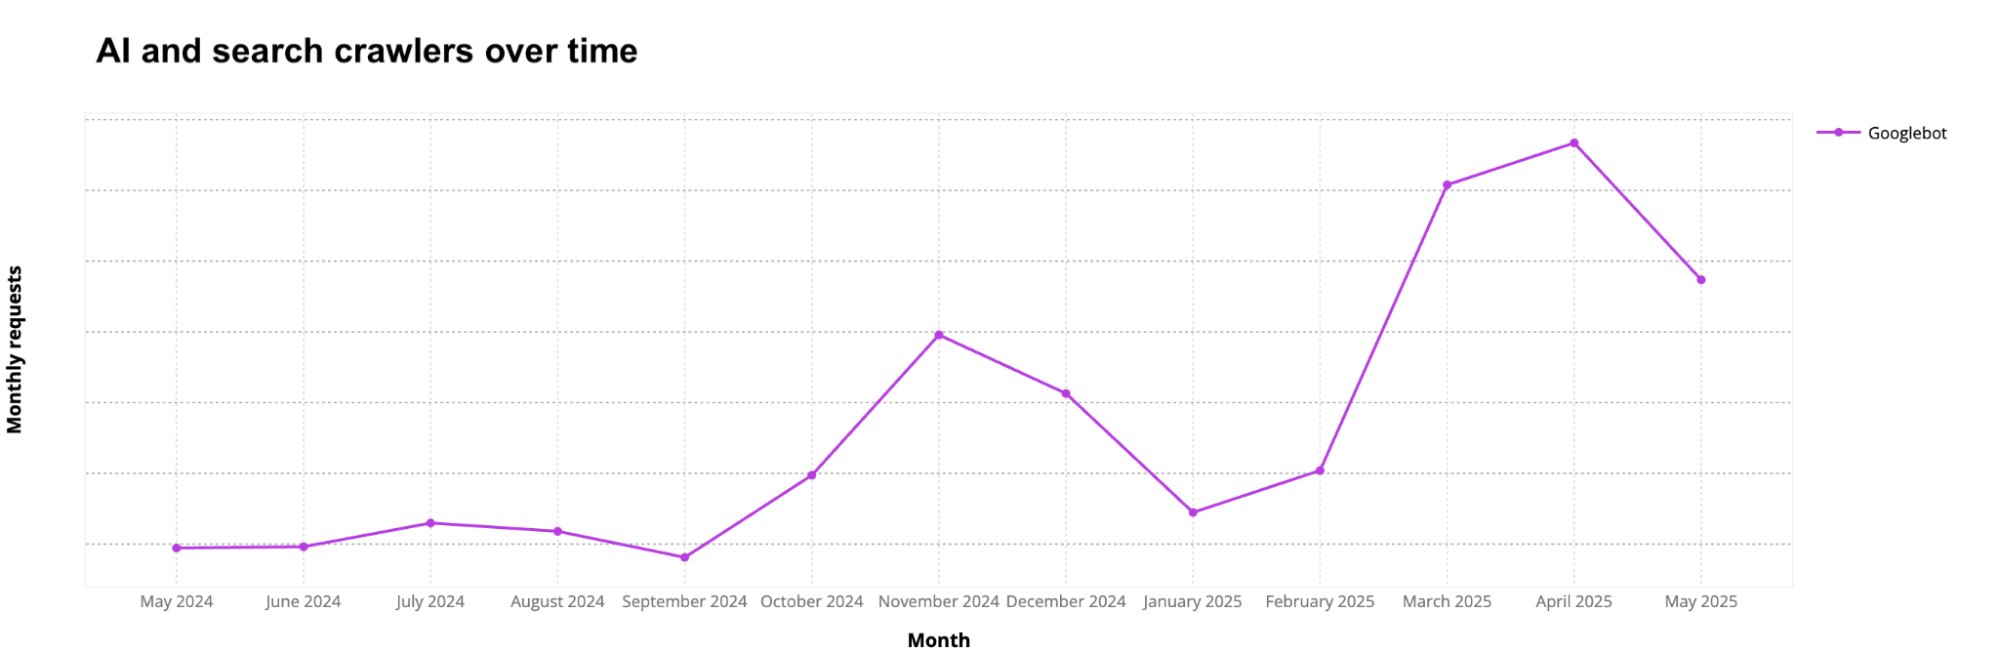
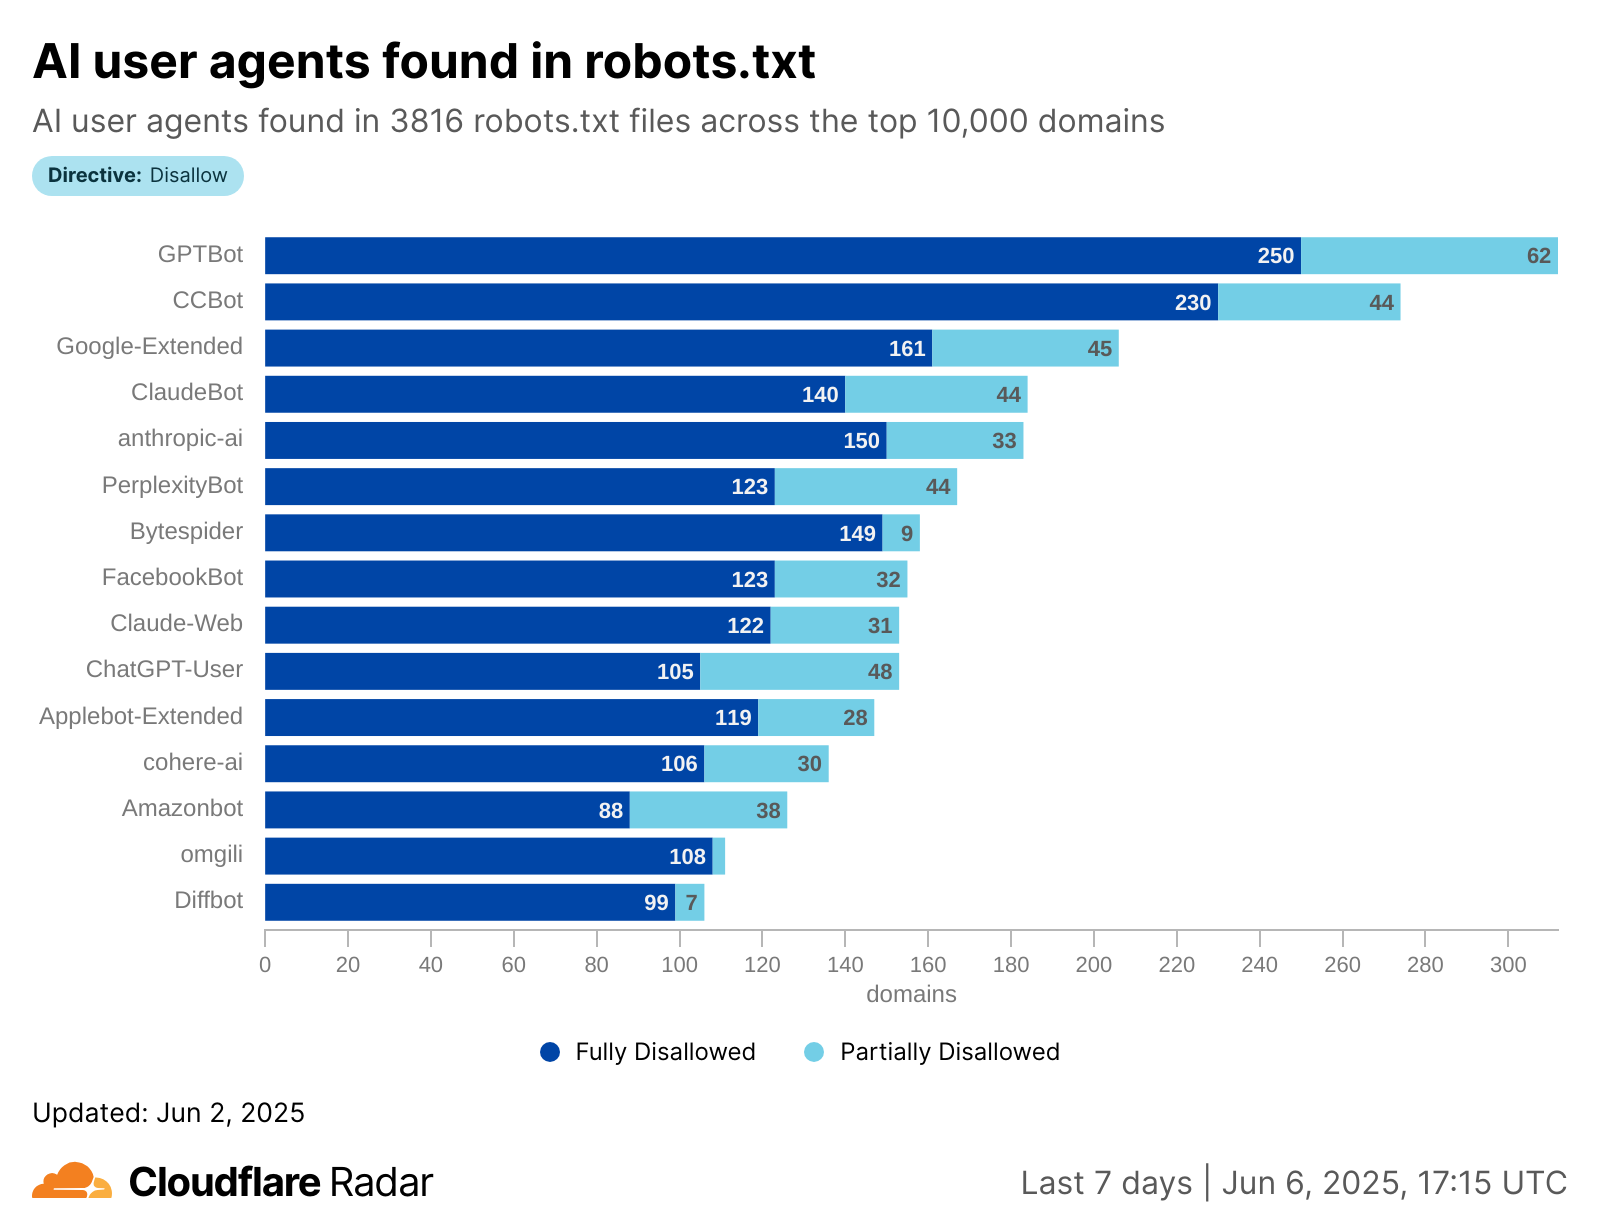
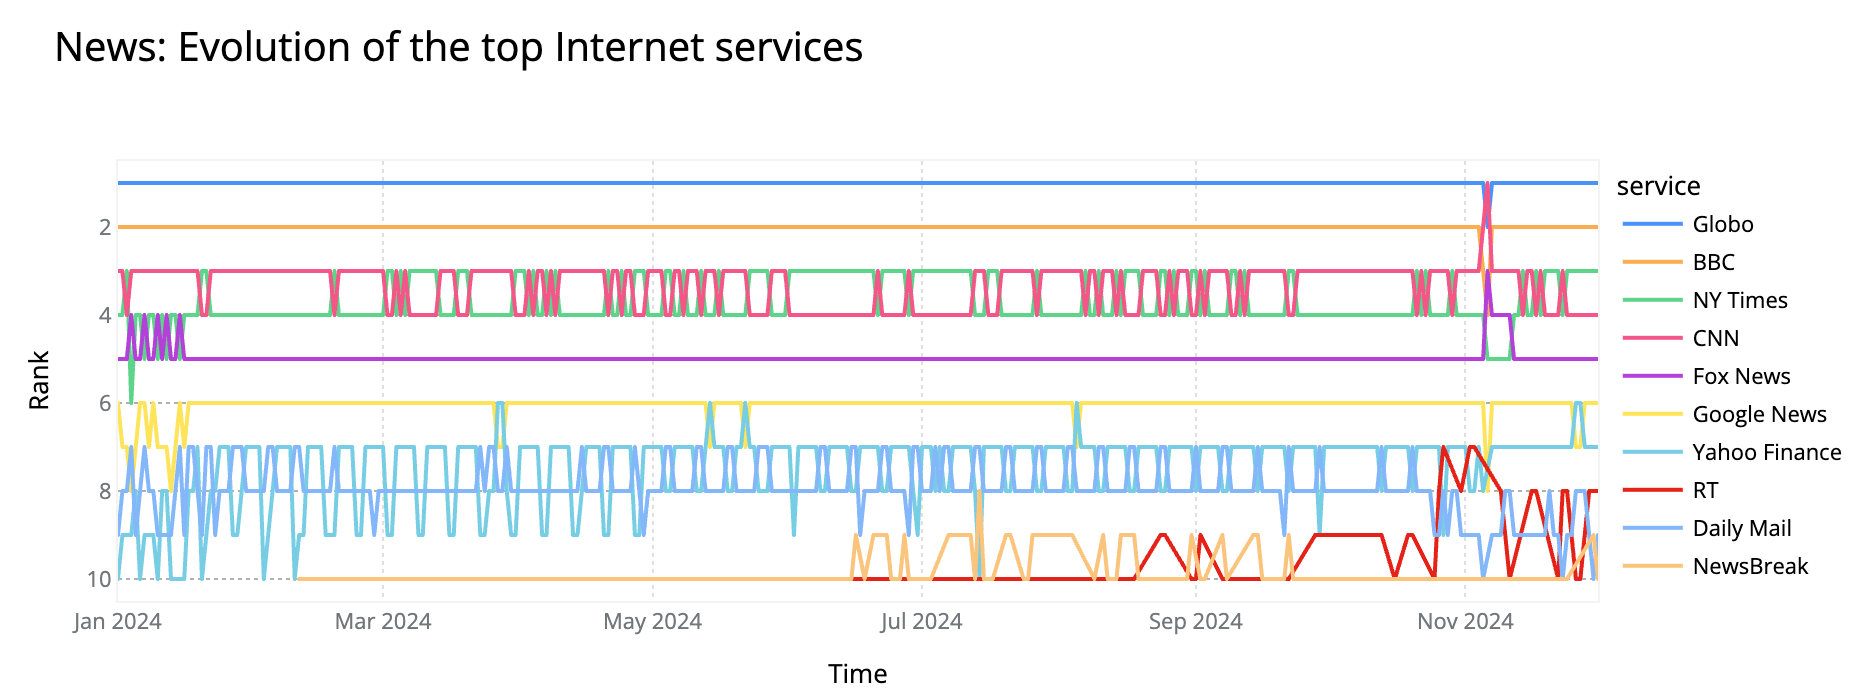
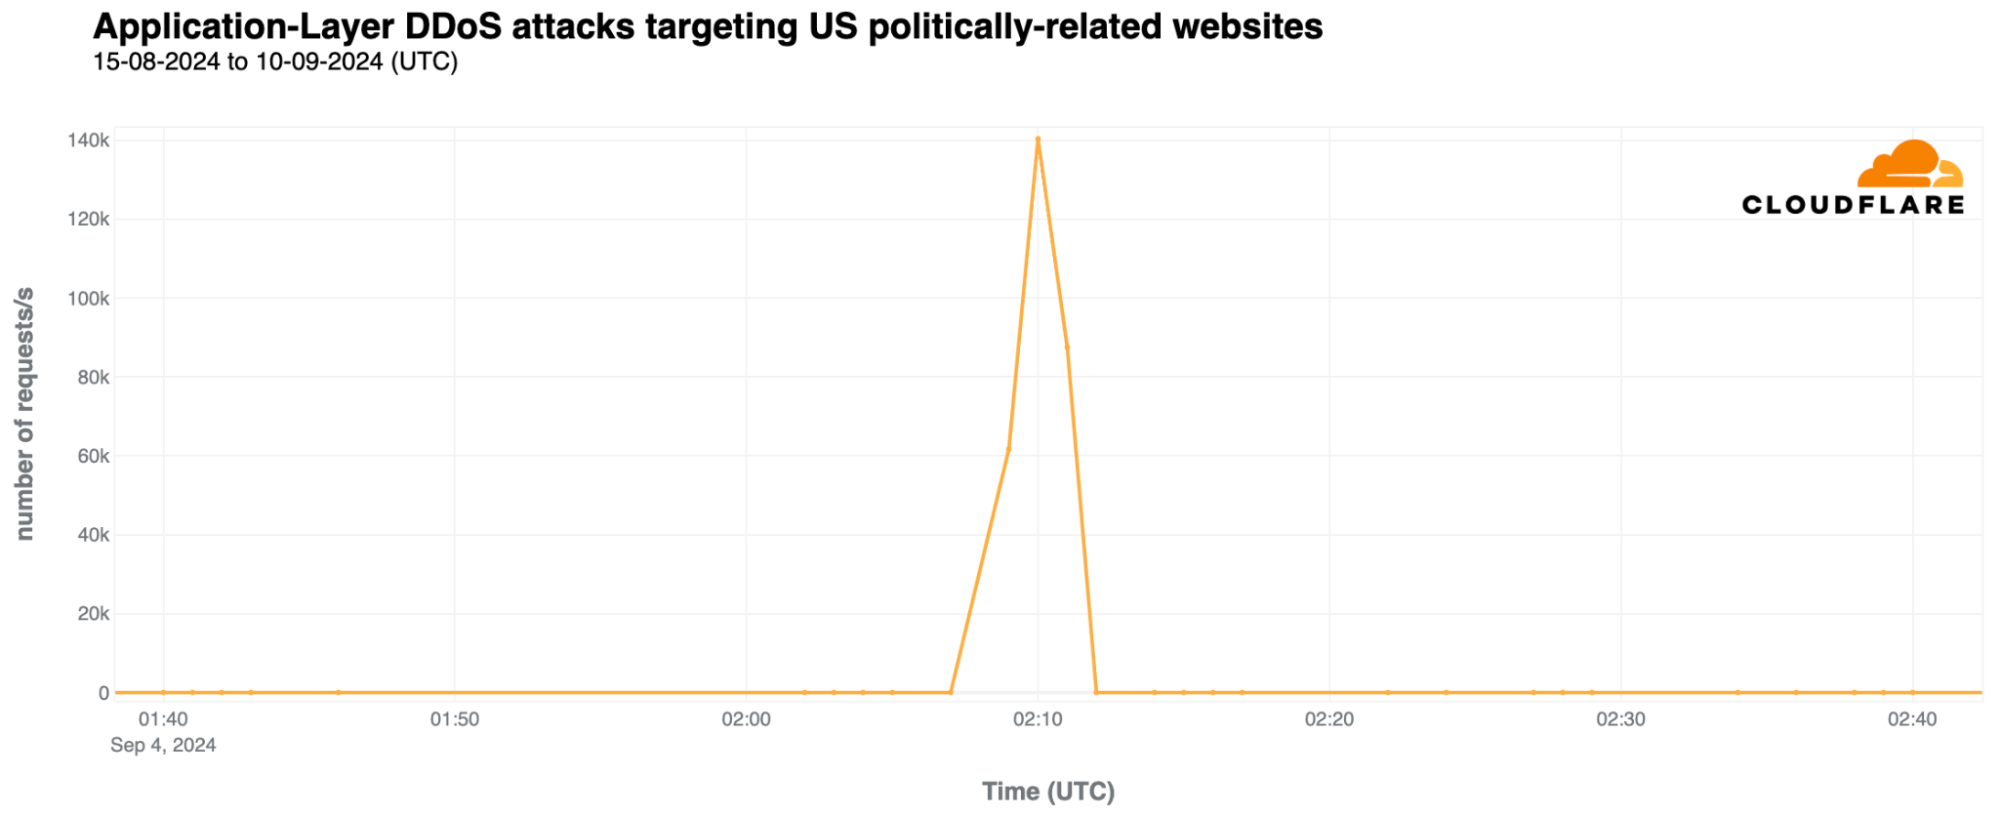
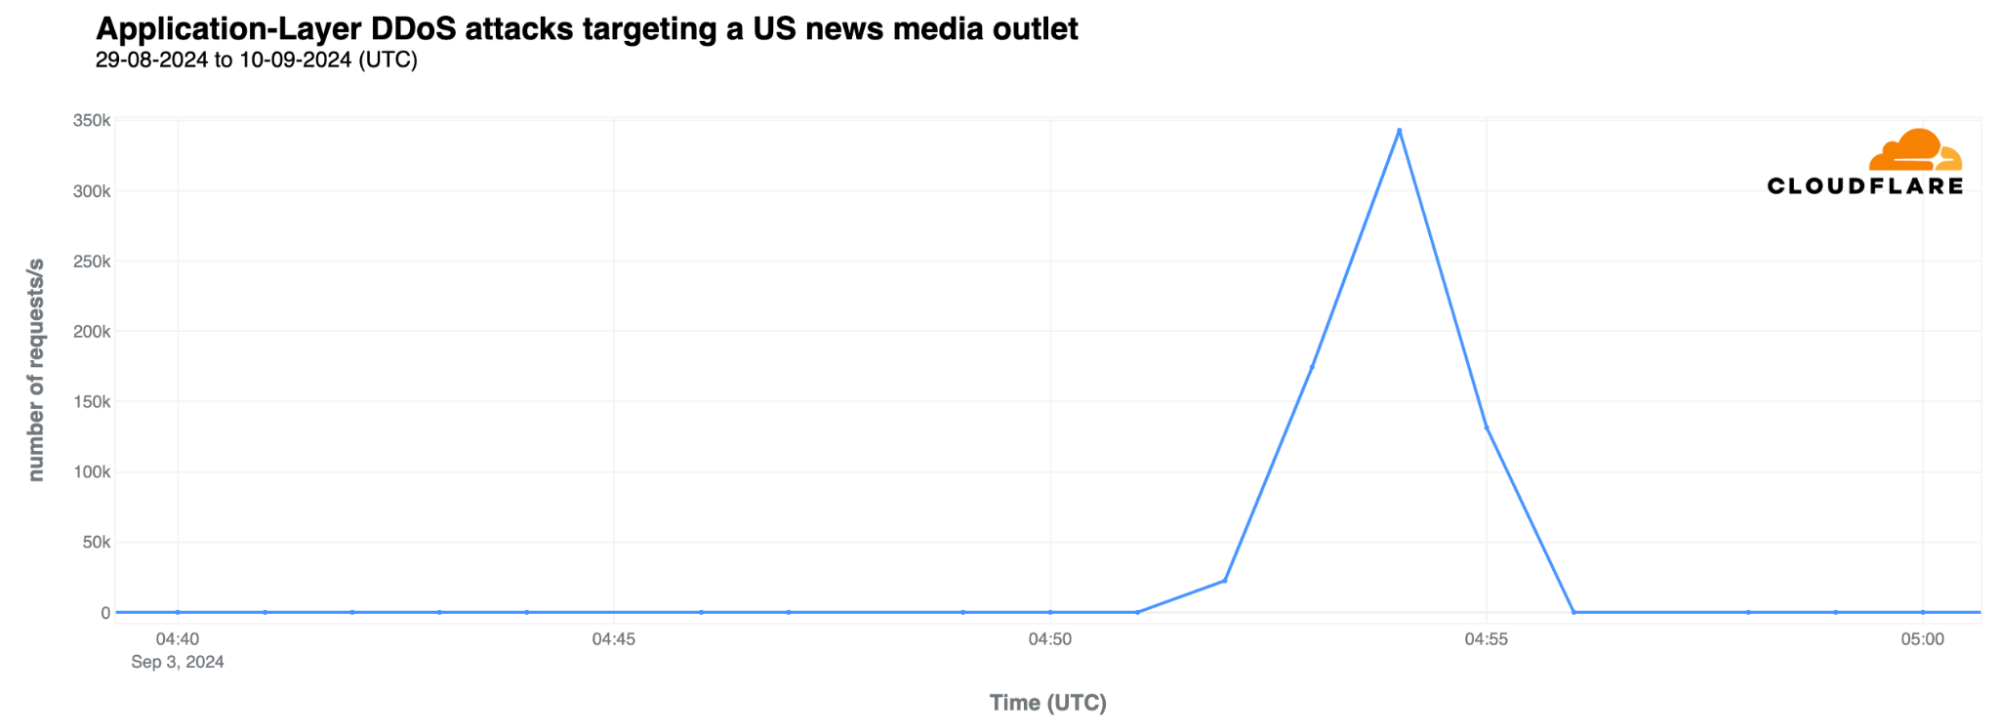
News organizations continue to inform the public, though their visibility and traffic appears increasingly diminished by AI-powered search and summarization tools (a trend we explored in our August 2025 blog post). This category, which includes traditional news outlets as well as aggregators, highlights several shifts in 2025.
Top 10 News services in 2025
- Globo
- ESPN ▲
- BBC ▼
- NY Times ▼
- CNN ▼
- Fox News ▼
- Yahoo Finance
- Google News ▲
- NewsBreak ▲
- Times of India ▲
Globo, the Brazilian media giant spanning TV, radio, and print, held the #1 position for the third consecutive year. ESPN moved into #2, overtaking the BBC (#3), which operates globally in 43 languages. The New York Times (#4), CNN (#5), and Fox News (#6) each fell one place due to ESPN’s rise.
Google News rose to #8 (with a clear weekend bias) while NewsBreak, a U.S. local-news aggregator, surged late in the year and reached #7 on several days in November.
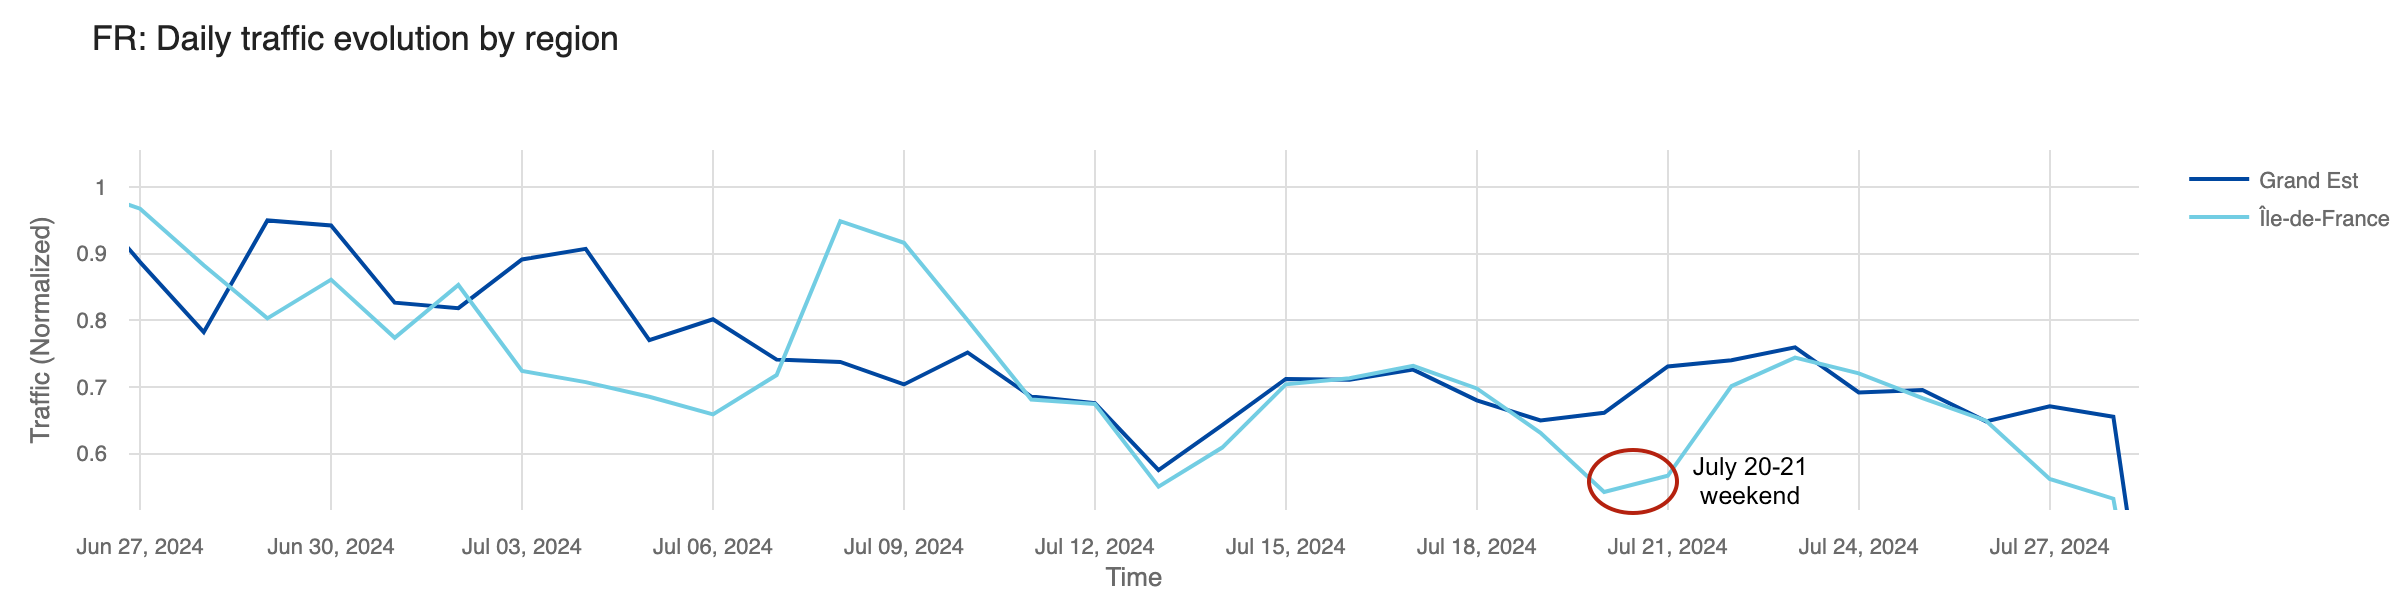
Outside the Top 10, The Guardian briefly reached #10 during Canada’s March leadership election, while RT (Russian state media) declined from the Top 10 early in the year to around #20 by year-end. The Financial Times spiked to #4 between July 24-27 during high-stakes U.S.-EU tariffs-related trade negotiations.

Across the broader Overall ranking, major geopolitical, political, and sporting events produced surges in news traffic. Last year, the surge was election-driven.
-
Trump inauguration (January 20–21): CNN, New York Times (NYT), and Fox News all spiked prominently.
-
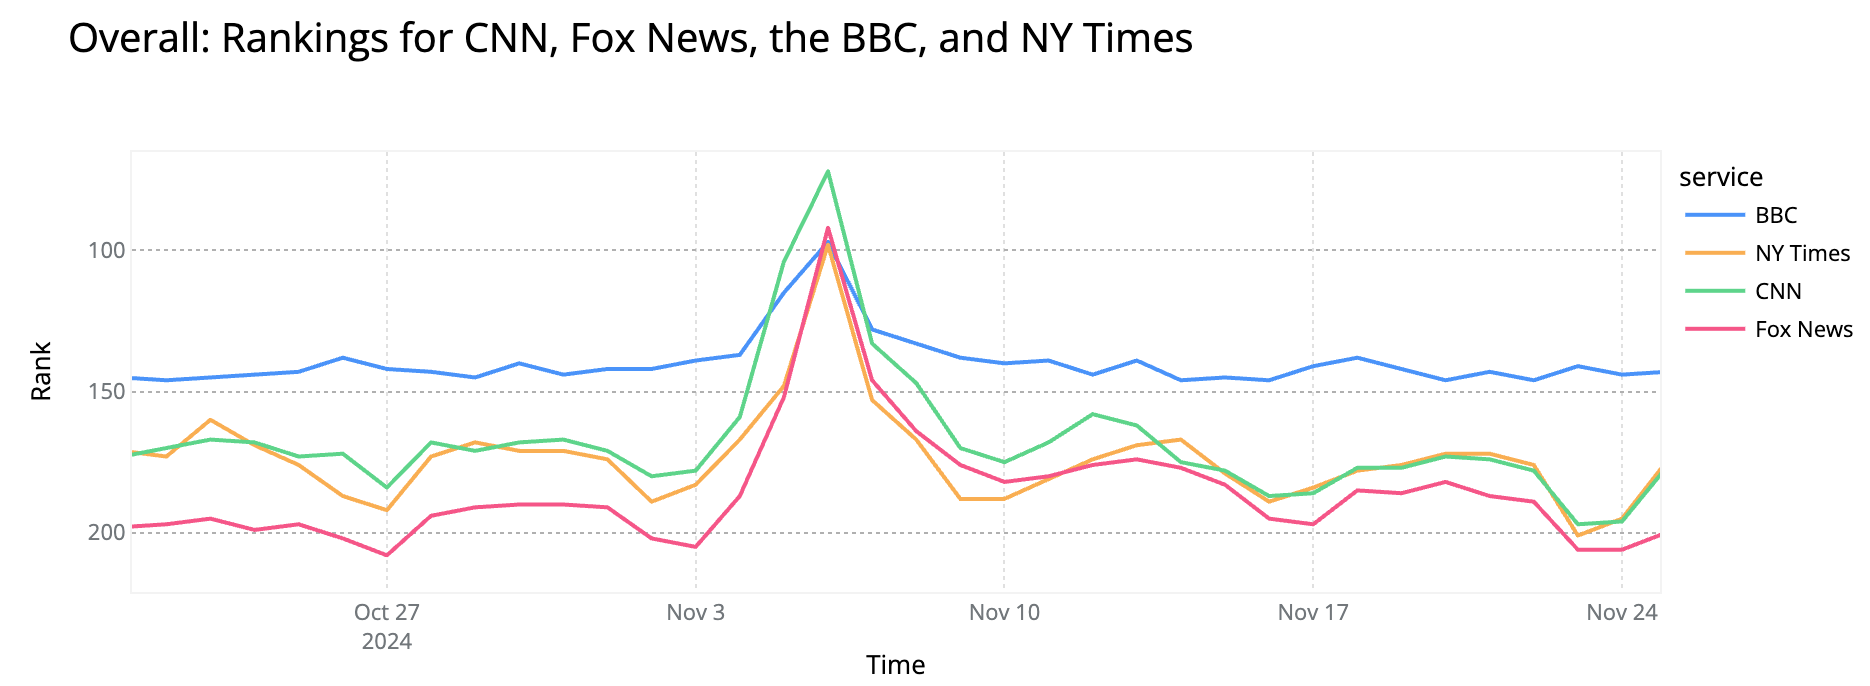
U.S.-UK trade deal announced & VE Day 80th anniversary (May 8): The year’s highest peaks: CNN (#126), NYT (#129), Fox News (#164), BBC (#106).
-
Israel-Iran conflict (the conflict started on June 13, when Israel launched a bombing campaign against Iran, and ended on June 24): BBC reached its yearly peak (#101), with CNN (#125), NYT (#136), and Fox News (#160) showing parallel spikes.
In the next chart we show rankings around the May and June peaks for BBC, CNN, NY Times, and Fox News.

-
U.S. off-year Election Day (November 5): CNN (#157), NYT (#169), and Fox News (#191) all saw moderate increases.
Regional dynamics also stood out. Globo peaked during Brazil’s Supercopa do Brasil final on February 2, moving within the #60-77 range. ESPN saw similar event-driven spikes, reaching #82 on April 26 during the NFL Draft and NBA playoffs; and then #79 on September 28, when NFL Week 4 overlapped with the dramatic final day of the MLB regular season; and also at #79 on October 26, as the F1 Mexico City Grand Prix coincided with NFL Week 8 and the first week of the new NBA season, pushing fans to track multiple leagues at once.
Across the second half of 2025, most major U.S. news outlets showed a gradual decline in the Overall ranking, moving from higher early-year positions toward the #200 range. This suggests shifting consumption patterns as AI tools and social platforms increasingly intermediate how users access news.
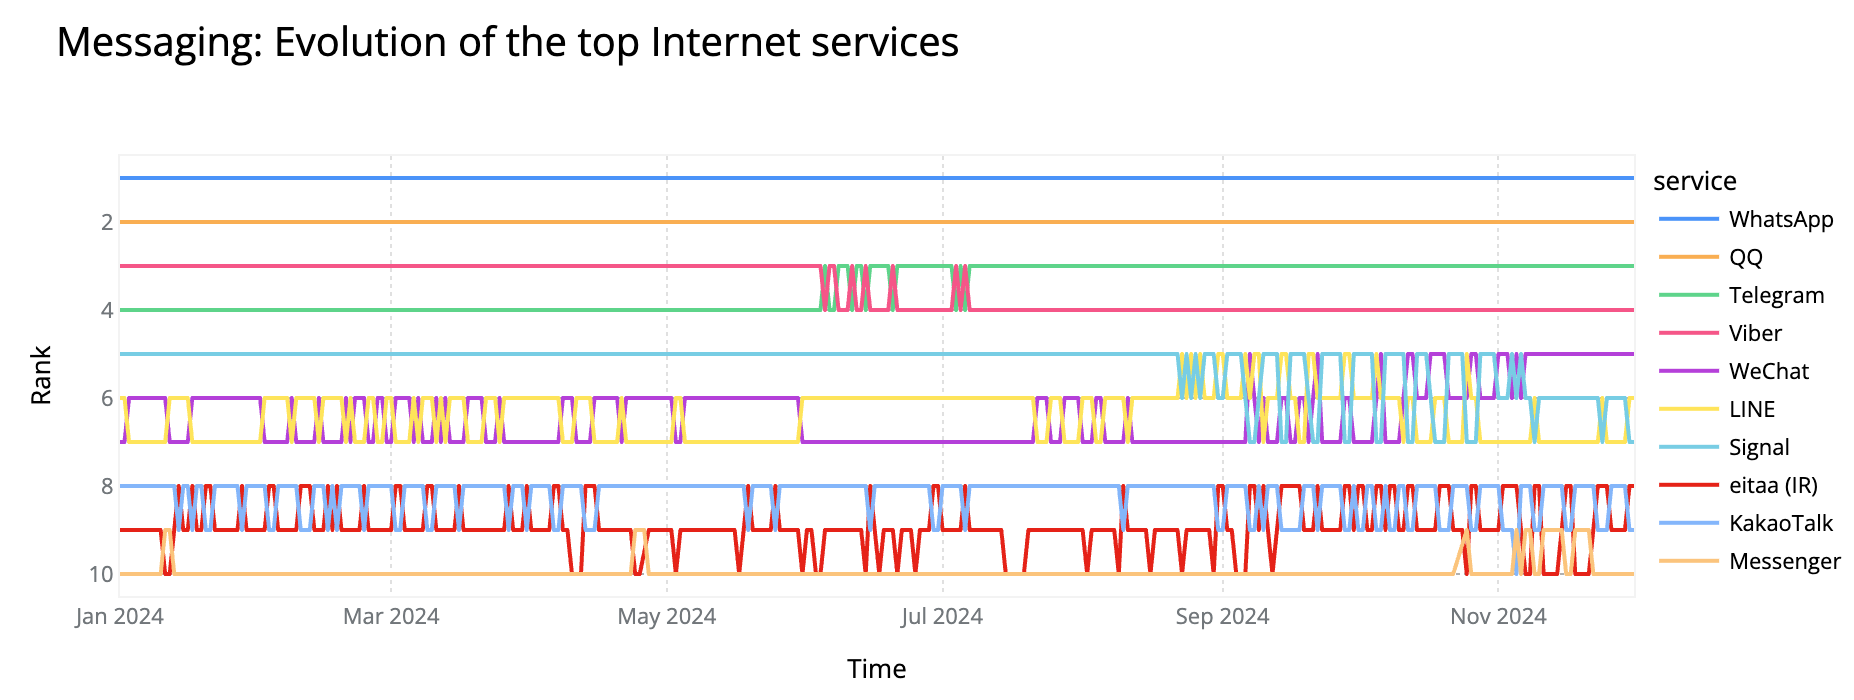
Messaging remains a core part of Internet communication, and this category shows continued maturity with stable leaders at the top. WhatsApp remained the clear #1 for the fourth consecutive year, while the standout shift in 2025 was Signal’s move into #5, reflecting growing demand for privacy-focused tools.
(Note: Apple’s iMessage is excluded because it lacks distinct domains. Messaging features inside social platforms — Instagram DMs, X messages, Snapchat — are not measurable as distinct from the other features of their respective social media platforms.)
Top Messaging services in 2025
- Telegram
- Rakuten Viber
- Signal ▲
- WeChat ▼
- LINE
- Messenger ▲
- Zalo.me ▲
- KakaoTalk ▲
Chinese service QQ (Tencent QQ) held #2 for the third year, supported by its integrated ecosystem of games, mobile payments, and communication tools. Telegram (#3) and Rakuten Viber (#4) held steady, remaining key platforms across Eastern Europe, Asia, and the Middle East.
Signal, the open-source encrypted messaging service, overtook Chinese app WeChat to secure #5 from October onward, reversing the order seen in 2024. Its rise highlights growing interest in open-source, end-to-end encrypted messaging, especially among security-conscious communities. Asian apps also performed strongly: LINE from Japan remained #7, while Vietnam’s Zalo.me reached #9, and South Korea’s KakaoTalk dropped to #10 (it was #8 in late 2024). Meta’s Messenger reached #8 after June.

Patterns in the Overall ranking:
-
WhatsApp maintained its #9 Overall position and reached #8 in January and on several days in November.
-
Telegram peaked at #56 on July 1, coinciding with major regional unrest in the Middle East.
-
WeChat slipped from near the Top 100 early in the year to around #130 by December.
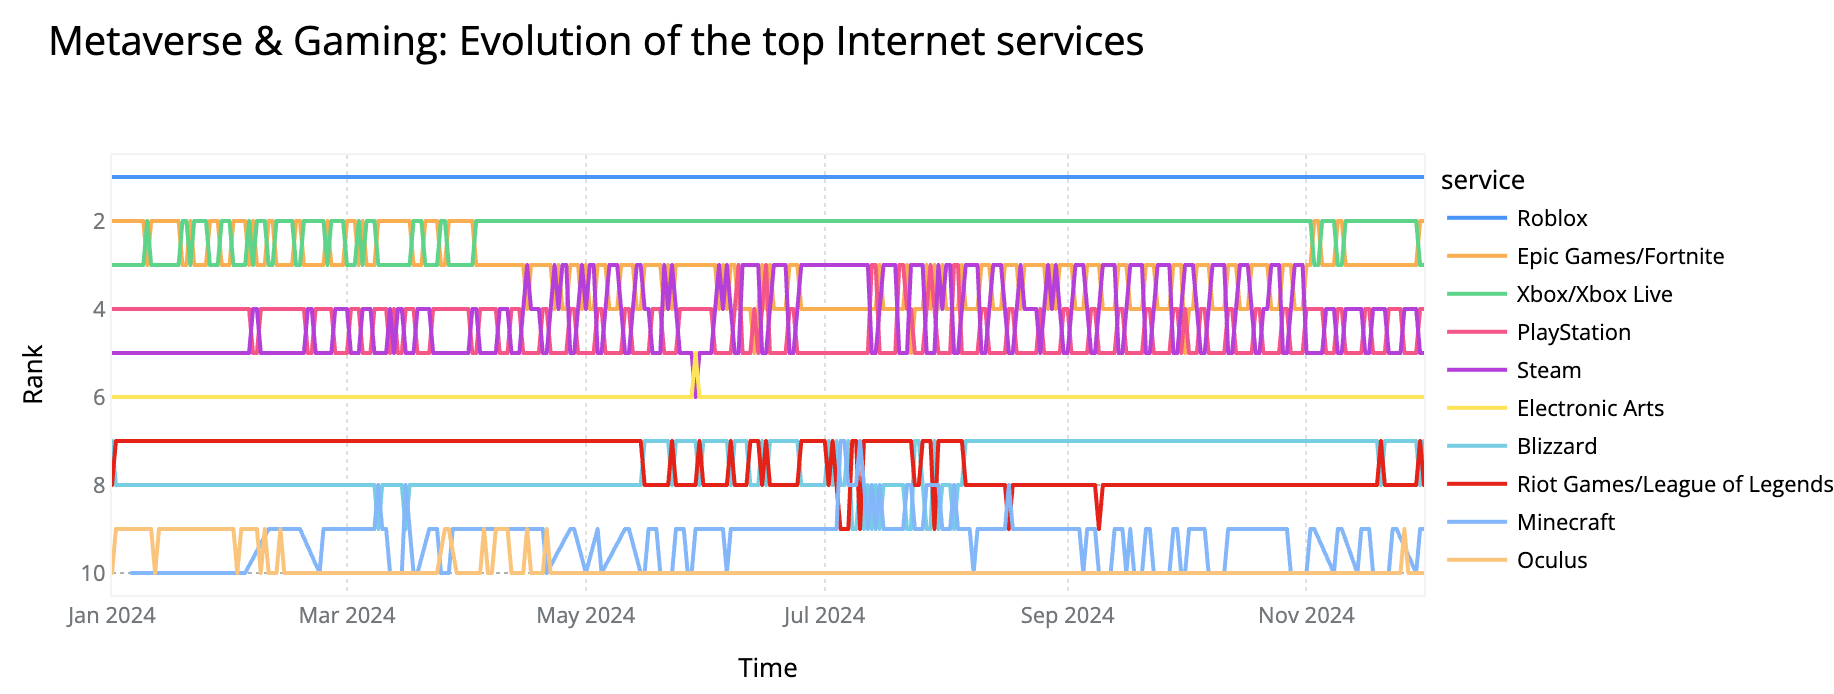
Gaming continues to drive substantial Internet traffic, even as “metaverse” news fades from public attention. Roblox dominated this category for the third year in a row, while the biggest shift in 2025 was PlayStation overtaking Xbox to claim the #2 position from May onward.
Top 10 Metaverse & Gaming services in 2025
- Roblox
- PlayStation ▲
- Xbox / Xbox Live ▼
- Epic Games / Fortnite ▼
- Steam ▼
- Electronic Arts
- Blizzard
- Minecraft ▲
- Riot Games / League of Legends ▼
- Nintendo ▲
Steam held #4, continuing its strong performance after its surprise rise in 2024. It performed best on weekdays and during key release periods, reaching #3 on several days in March, April, and July. Its best day was April 24, when it reached #2, coinciding with the release of Fatal Fury: City of the Wolves.
Electronic Arts (#6) and Blizzard (#7) remained steady, while Minecraft climbed to #8 (from #9), showing consistent weekend strength. Riot Games/League of Legends dropped to #9, and Nintendo returned to the Top 10. Meta’s Oculus stayed outside the Top 10 for the second year in a row, slipping from around the Top 100 to closer to #130 in the Overall ranking.
Here’s the top chart across 2025:

Usage patterns in the Overall ranking:
-
Roblox peaked at #15 on July 6 during its annual Hatch event (July 2-12), and consistently was higher on weekends.
-
PlayStation reached #30 during Black Friday week (November 22-23 and 29-30), its strongest performance of the year.
-
Minecraft remained between #87 and #120, with predictable weekend spikes.
-
Oculus declined across 2025, moving from around the Top 100 to roughly #130 by year-end, reflecting slower mainstream VR adoption.
Gaming platforms such as Roblox, Xbox, Epic Games/Fortnite, Steam, and PlayStation, all displayed strong weekend effects, with most services ranking 20-40 positions higher on Saturdays and Sundays than during the workweek. This pattern reflects gaming’s role as a leisure-driven category.
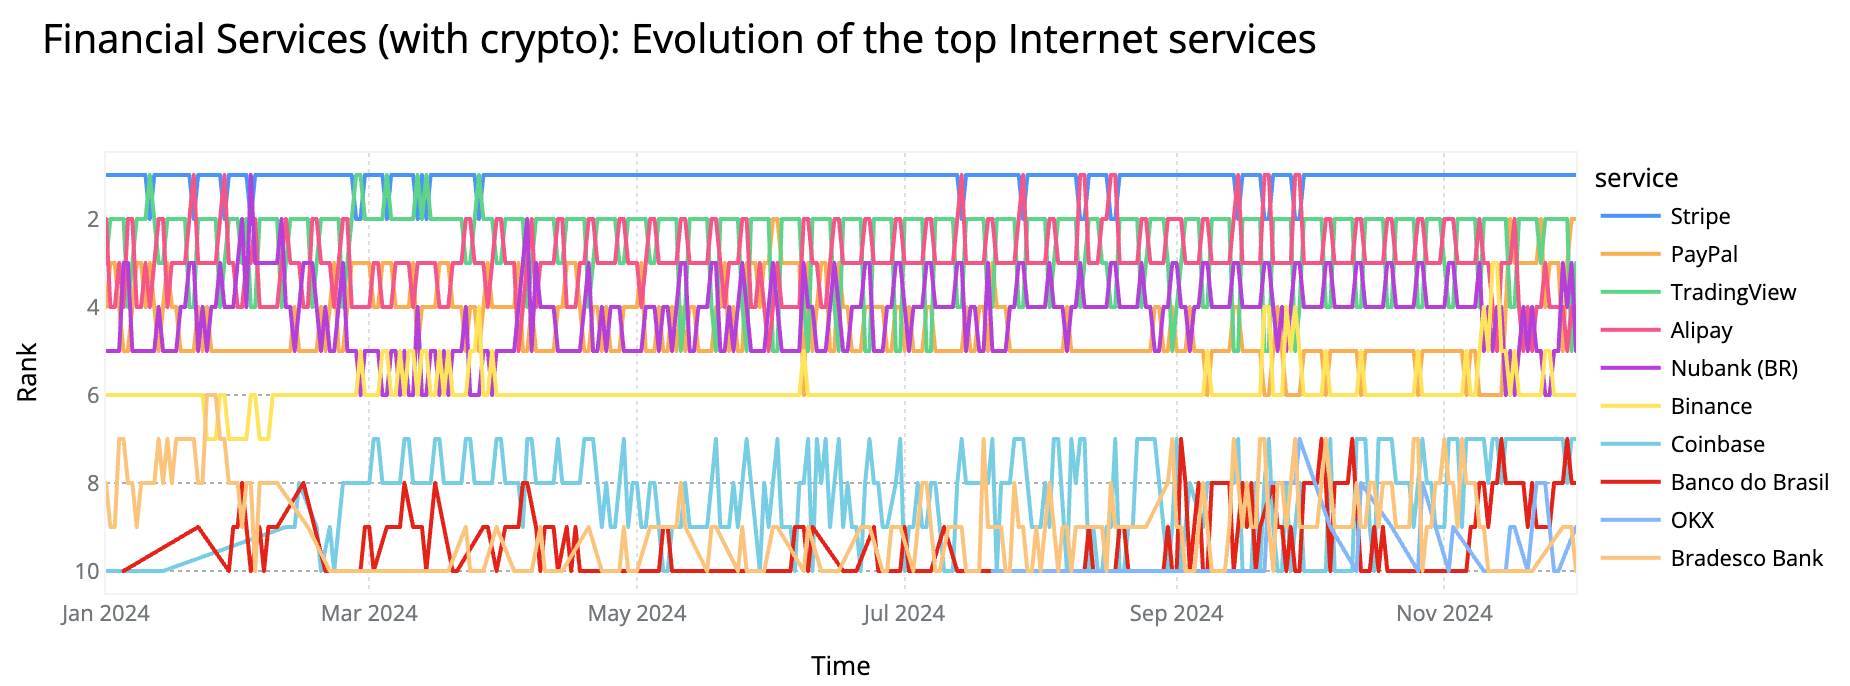
Digital-first financial services continued their dominance in 2025, even as traditional banks and tax tools remain present. Stripe, the Irish-American payment platform, kept its #1 spot for the third consecutive year after overtaking PayPal in 2023.
Top 10 Financial Services in 2025
- Stripe
- TradingView
- Alipay
- PayPal
- Nubank
- Binance
- Banco do Brasil ▲
- Intuit ▲
- Google Pay ▲
- OKX ▲
The first six positions in 2025 remained unchanged from late 2024. PayPal, usually #4, briefly reached #1 for a few days in late February and early March. TradingView, a platform for traders and investors, held a steady #2 (performing better on weekdays) and peaked at #1 on January 13, when U.S. markets tumbled after strong December jobs data renewed fears of persistent inflation. Alipay, the Chinese mobile and online payment platform, stayed at #3.
Brazil’s continued expansion in online banking was clear again this year. Nubank, the world’s largest digital bank and a major Latin American financial group, held #5 for the second year in a row. Banco do Brasil entered the Top 10 for the first time, while fellow Brazilian bank Bradesco fell out.
Binance kept its #6 position, while Coinbase fell out of the Top 10. Intuit entered the Top 10 this year, peaking during the U.S. Tax Day period (April 14-15) at #6. Google Pay and the cryptocurrency exchange OKX also reached the Top 10 for the first time, driven by strong end-of-year performance.

Other financial services trends in the Overall ranking:
-
Stripe had its best days late in the year, reaching #70 the day after Singles Day (November 12) and #71 on Cyber Monday (December 1). It continued to perform better on weekends and showed a steady upward trend in the Overall ranking, moving from around #80 to near #70.
-
PayPal ranked higher during Black Friday week, spiking at #82 on November 29. Its overall peak, however, came earlier in the year on March 2, when it reached #73.
-
Nubank performed best a few days before Carnival in Brazil (February 28-March 5), reaching #85 on February 22. It also spiked on Black Friday, November 28, hitting #96.
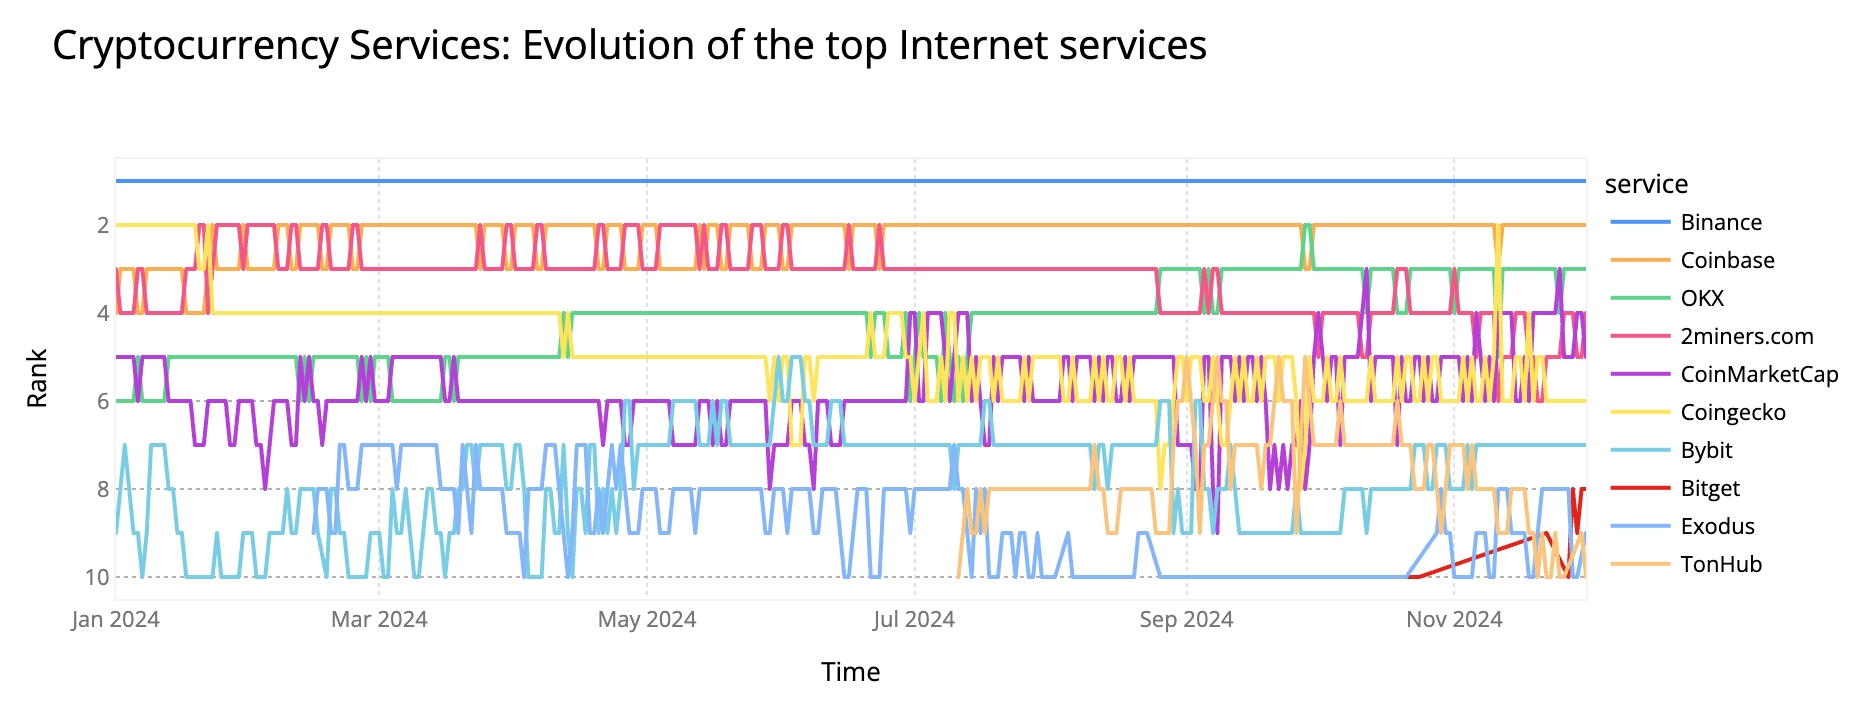
Alongside our Financial Services category, we track cryptocurrency-focused services separately. After several volatile years, the crypto ecosystem was relatively stable in 2025. Binance continued to lead the category, while the strongest momentum came from OKX, which climbed steadily from September onward to finish the year at #2 — overtaking Coinbase, which held that position in 2024.
Top 10 Cryptocurrency services in 2025
- Binance
- OKX ▲
- Coinbase ▼
- CoinGecko ▲
- 2miners.com ▼
- CoinMarketCap ▼
- Bybit
- MEXC ▲
- Exodus ▲
- Bitget ▲
CoinGecko, the cryptocurrency data platform, rose from #6 to #4, while 2miners.com slipped to #5. The final three entries were all newcomers to the Top 10:
-
MEXC (#8): a global cryptocurrency exchange known for spot and futures trading.
-
Exodus (#9): a multi-asset crypto wallet focused on ease of use and self-custody.
-
Bitget (#10): a cryptocurrency exchange specializing in derivatives and copy-trading (where users automatically replicate the trades of experienced traders) features.

The U.S. presidential inauguration of Donald Trump on January 20 produced noticeable traffic surges across crypto platforms, building on the elevated interest that followed the November 2024 election:
-
Binance peaked at #95 on January 20.
-
Coinbase reached #121 the same day.
-
OKX peaked earlier, at #157 on January 19.

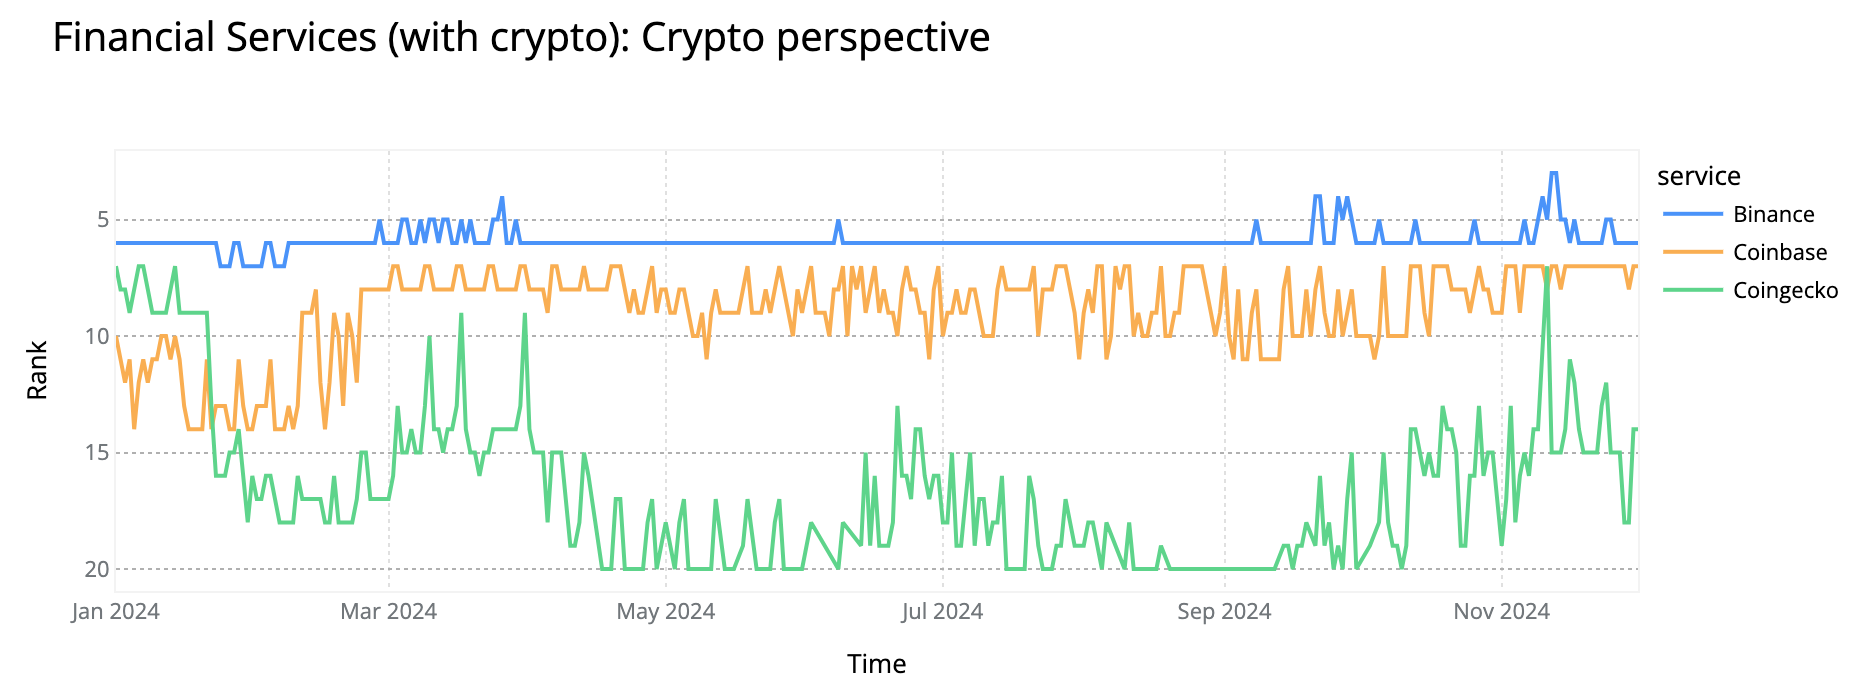
CoinGecko showed a clear downward trend in the Overall ranking, starting the year near the Top 200 and ending around #270. Binance and Coinbase remained relatively stable throughout 2025, while OKX showed clear growth beginning in September, rising toward the #150 range.
Outside our primary categories, several services showed significant traffic spikes
tied to major events, cultural moments, and seasonal behaviors:
Crisis and real-time tracking
-
FlightRadar24 spiked to #260 on June 13-15 during Israeli airstrikes on Iranian nuclear facilities, reflecting heightened global demand for real-time airspace disruption tracking.
-
NOAA Tides & Currents reached #300 on October 27 as Hurricane Melissa — an extremely powerful Category 5 storm — intensified and threatened the Caribbean.

Entertainment and media
-
Spotify held a stable #16–19 range throughout 2025, similar to 2024. It performed strongest in September and November, spending most of those months at #16. (Our dataset ends December 2, so the impact of the December 3 Spotify Wrapped release was not captured.)
-
IMDb peaked on September 14, coinciding with the Primetime Emmy Awards.
-
Wikipedia typically ranked between #22 and #24 but peaked at #19 on July 5, the same day of this viral moment: a failed “July 5, 2025, disaster prophecy” from a 1999 manga, which caused “Nothing happened in Japan” to trend #1 on China’s Sina Weibo.
Sports
-
The NBA reached #237 on April 19, the opening day of the NBA Playoffs, highlighted by a dramatic Nuggets-Clippers overtime game.
-
FIFA made a rare appearance in the Top 500, peaking at #373 on November 17 when FIFA and the U.S. State Department announced the FIFA Priority Appointment Scheduling System (FIFA PASS) for World Cup 2026 ticket holders.
-
GitHub remained between #27 and #36 for most of the year, mirroring its 2024 performance and underscoring its status as core development infrastructure.
In our country and region-specific Popular Internet Services lists on the Year in Review microsite, we saw Google rank #1 in almost every location (Libya, dominated by Facebook, was a rare exception). In addition to our Overall list, this year we are sharing specific categories: Social Media, Generative AI, and Messaging.
Here are several other highlights worth noting from the Overall rankings in particular countries:
AI’s strength in emerging markets
ChatGPT performed unexpectedly well outside traditional tech hubs, reaching the Top 30 in countries such as Kyrgyzstan, Somalia, the United Arab Emirates, and Ethiopia — evidence that AI adoption is spreading quickly in a wide range of markets.
Google Gemini also showed notable traction in emerging regions. It ranked highest in Ethiopia (#94), Sri Lanka (#105), Guatemala (#118), Rwanda (#122), and Thailand (#124), with similar patterns across Peru, Taiwan, Nepal, Vietnam, and Malawi (where Gemini ranked #128-137).
Facebook held #1-2 in many countries, but regional players built strong footholds. Kwai reached #3 in Brazil and showed significant presence across Latin America and the Middle East. Instagram ranked highest in parts of Central Asia and the Gulf region, while TikTok dominated broad stretches of Latin America, Africa, and Southeast Asia.
Snapchat performed best in markets such as Iraq, Libya, Palestine, and Pakistan. LinkedIn showed a dual profile, ranking high in advanced economies like Australia and France as well as fast-growing markets including Bangladesh, Peru, and Saudi Arabia.
Netflix remained strongest in Latin America (#8-10 in multiple countries) but ranked lower in Asia and much of Europe, where Spotify performed best, especially in the Nordics and Southern Europe.
Messaging showed clear geographic divides. WhatsApp led across the Caribbean, Africa, and parts of Asia; Telegram ranked highest in Eastern Europe and Central Asia; Signal gained share in privacy-minded markets such as Ukraine and Switzerland; and Viber continued to dominate the Balkans.

GenAI highlights by country/region include:
-
ChatGPT ranked #1 in the Generative AI category across nearly every country, with one exception: Venezuela, where Google Gemini took the top spot.
-
Google Gemini secured #2 across Latin America (including Brazil, Mexico, and Colombia) and Southeast Asia (Thailand, Indonesia), reflecting Google’s platform strength in mobile-first emerging markets.
-
Perplexity dominated as the #2 choice across Europe (Germany, France, Spain) and #3 in major English-speaking markets (U.S., UK, Australia), suggesting strong appeal among information-seeking users.
-
Claude showed selective strength at #3-5, performing best in Western Europe (Georgia, Switzerland) and developed markets like Germany, France or Japan, aligning with its enterprise and developer focus.
-
Lovable, the Swedish vibe coding platform, reached #10 in the GenAI category in one country: Angola. It reached #16 in Sweden and Slovenia, and #17 in Brazil.
ChatGPT remains the clear global leader, yet the contest for second place is highly regional: Google Gemini in emerging markets, Perplexity across Europe, and Claude in more technologically advanced economies. It’s a reminder that the Internet contains a multitude of local behaviors shaped by culture, infrastructure, and economic context.
The Internet’s evolution in 2025 showed both stability and disruption. Google, Facebook, and Instagram remained dominant in our Overall rankings, but the year’s defining story was generative AI’s rapid maturation. ChatGPT climbed into the global Top 40, while Claude, Gemini, Perplexity, and DeepSeek became credible challengers in a category that barely existed three years ago. By late November, Gemini had secured the #2 spot in our GenAI rankings, directly contesting ChatGPT’s lead.
Social media continued to fragment: Instagram rose to #5 overall while X fell outside the Top 20, and emerging platforms like Kwai gained meaningful traction across Latin America, the Middle East, and Southeast Asia. In e-commerce, Shopee and Temu joined Amazon in the global top three, displacing long-established Chinese marketplaces. Cryptocurrency stabilized after earlier volatility, with traffic surging around events such as the U.S. presidential inauguration.
Global developments triggered coordinated spikes across news and other real-time information services, underscoring how quickly real-world events shape online behavior.
These rankings reflect continued data validation and methodological refinement by our team. We welcome your feedback and suggestions for categories to explore in future editions.
Thanks to data scientist Sabina Zejnilovic, who played a crucial role in gathering the Internet services data.


