Can you imagine being able to schedule maintenance in Zabbix by simply telling a program: “I need to put the web server in maintenance tomorrow from 8 to 10 with ticket 100-178306”? That’s exactly what the Artificial Intelligence (AI) Scheduler Zabbix project I’ve developed does!
What problem does it solve?
Anyone who has worked with Zabbix knows that scheduling maintenance can sometimes be tedious, especially when you need to:
Configure complex routine maintenance
Handle Zabbix API bitmasks for specific days of the week or month
Search for specific hosts or groups
Document associated tickets
This project eliminates that friction by allowing the use of natural language to create both one-time and routine maintenance.
The magic behind the code
Conversational artificial intelligence
The system integrates both OpenAI GPT-4 and Google Gemini to interpret natural language requests. The AI doesn’t just understand what you want to do, but automatically:
Detects servers, groups, and dates
Identifies ticket numbers (XXX-XXXXXX format)
Automatically calculates complex Zabbix bitmasks
Generates contextual responses with examples
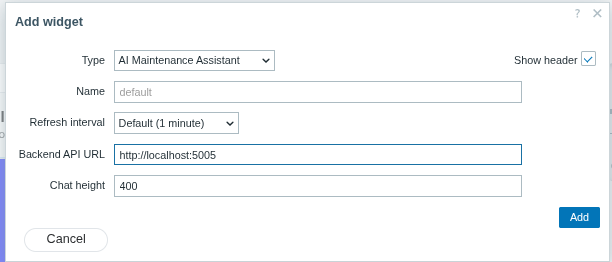
Fig. 1. Adding the AI Scheduler widget to your Zabbix dashboard
Advanced routine maintenance
What really stands out is its ability to handle complex patterns. Here are some practical examples that work:
“Daily backup for srv-backup from 2 to 4 AM with ticket 200-8341 until February 2027”
“Thursday and Friday maintenance from 5 to 7 AM until January 2027”
“Cleanup on the first Sunday of each month with ticket 100-178306 until December 2026”
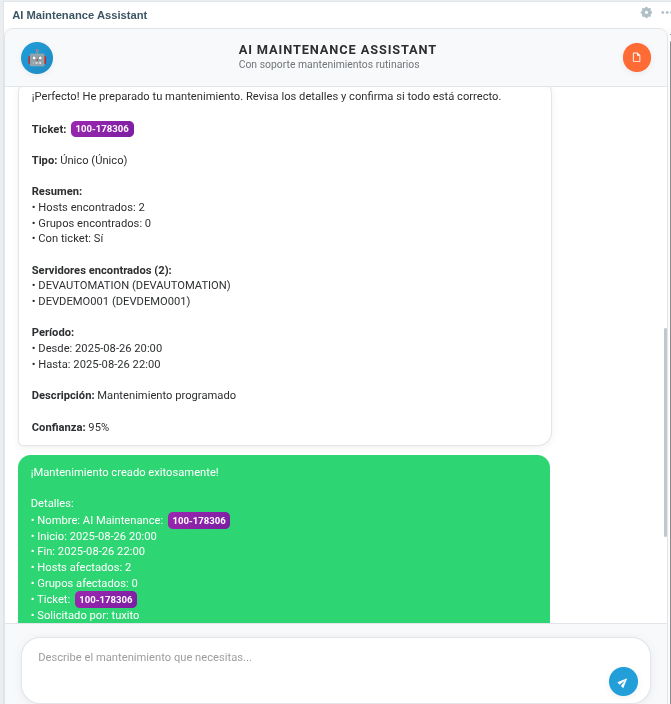
Fig. 2. AI-generated maintenance summary with all calculated parameters
Elegant architecture
The project uses a three-layer architecture:
Frontend: Custom widget for Zabbix
Backend: Flask API with AI integration
Zabbix: Native API to create maintenance
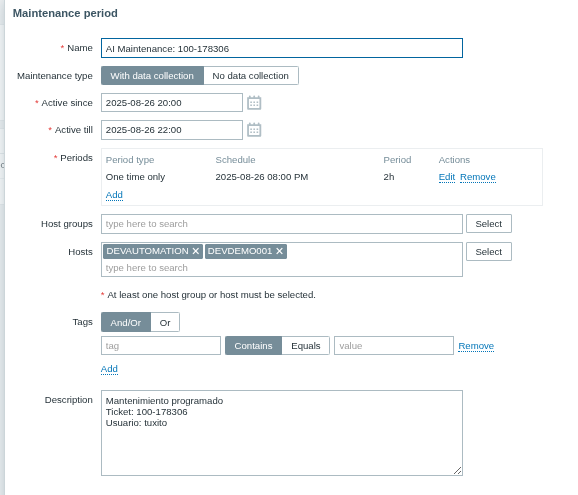
Fig. 3. Maintenance successfully created and visible in Zabbix interface
Super-simple installation
One of the best features is how easy it is to get it running:
cp .env.example .env
You only need to configure your Zabbix URL and AI API key:
docker compose up -d --build
And that’s it! You have an AI assistant working.
Multi-instance support
For organizations with multiple Zabbix servers, the project includes configuration for up to 5 simultaneous instances, each with its own configuration.
What impresses me most
Intelligent date detection
The system understands natural expressions like:
“Tomorrow from 8 to 10” → Next date with specific schedule
“Sunday from 2 to 4 AM” → Next Sunday at those hours
“24/08/25 10:00am” → Automatically converts the format
Automatic Bitmask management
Zabbix API bitmasks can be notoriously complicated. This system calculates them automatically:
Thursday and Friday = 8 + 16 = 24
Sundays only = 64
First week of the month with specific configuration
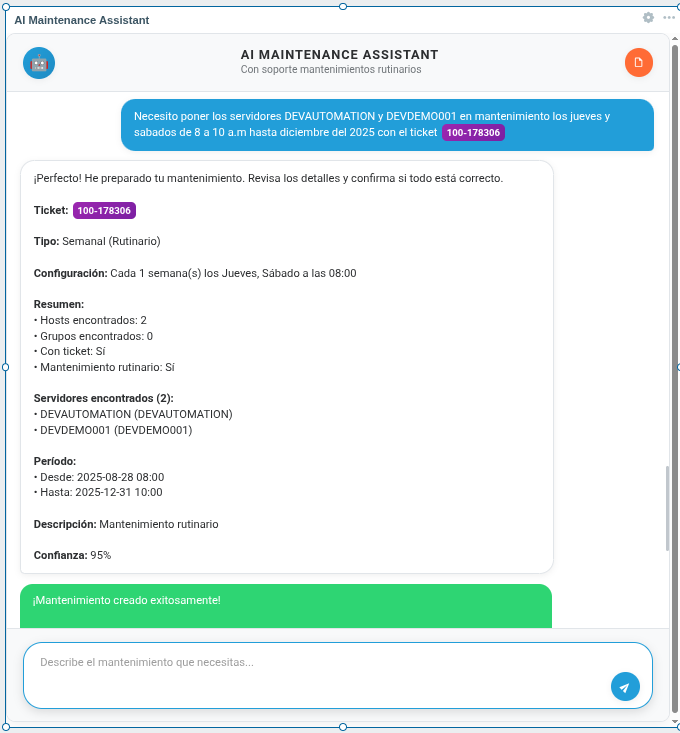
Fig. 4. Complex weekly maintenance scheduling with automatic bitmask calculation
Why is it important?
This project represents a natural evolution in systems administration. Instead of memorizing complex syntax or navigating multiple menus, you simply describe what you need in natural language. It’s especially valuable for:
Operations teams handling multiple maintenance tasks
Companies that need to document associated tickets
Organizations with complex maintenance patterns
The future is here
Projects like this demonstrate how artificial intelligence can make complex technical tools more accessible without sacrificing functionality. It’s not just automation – it’s intelligence applied to real infrastructure problems. If you work with Zabbix and are tired of manually configuring maintenance, this project is definitely worth checking out. It’s open source, well documented, and solves a real problem that many of us face every day. You can find the complete project on GitHub.
To facilitate the huge scale of Cloudflare’s customer base, we maintain data centers which span more than 300 cities in over 100 countries, including approximately 30 locations in Mainland China.
The Cloudflare global network is built to be continuously updated in a zero downtime manner, but some changes may need a server reboot to safely take effect. To enable this, we have mechanisms for the whole fleet to automatically reboot with changes gated on a unique identifier for the reboot cycle. Each data center has a maintenance window, which is a time period – usually a couple of hours – during which reboots are permitted.
We take our customer experience very seriously, and hence we have several mechanisms to ensure that disruption to customer traffic does not occur. One example is Unimog, our in-house load balancer that spreads load across the servers in a data center, ensuring that there is no disruption when a server is taken out for routine maintenance.
The SRE team decided to further reduce risk by only allowing reboots in a data center when the customer traffic is at the lowest. We also needed to automate the existing manual process for determining the window – eliminating toil.
In this post, we’ll discuss how the team improved this manual process and automated the determination of these windows using a trigonometric function – sinusoidal wave fitting.
When is the best time to reboot?
Thanks to how efficient our load-balancing framework is within a data center, technically we could proceed to schedule reboots throughout the day with zero impact to traffic flowing through the data center. However, operationally the management is simplified by requiring reboots take place between certain times for each data center. It both acts as a rate-limiter to avoid rebooting all servers in our larger data centers in a single day, and makes remediating any unforeseen issues that arise during the reboots more straightforward, as issues can be caught within the first batch of reboots.
One of the first steps is to determine the time window during which we are going to allow these reboots to take place; choosing the relative low-traffic period for a data center makes the most sense for obvious reasons. In the past, these low-traffic windows were found manually by humans reviewing historical traffic trends present in our metrics; it was SRE who were responsible for creating and maintaining the definition of these windows, which became particularly toilsome:
Traffic trends are always changing, requiring increasingly frequent reviews of maintenance hours.
We move quickly at Cloudflare, there is always a data center in a state of provisioning, making it difficult to keep maintenance windows up-to-date.
The system was inflexible, and provided no dynamic decision-making.
This responsibility became SRE toil as it was repetitive, process-based work that could and should be automated.
Time to be more efficient
We quickly realized that we needed to make this process more efficient using automation. An ideal solution would be one that was accurate, easy to maintain, re-usable, and could be consumed by other teams.
A theoretical solution to this was sine-fitting on the CPU pattern of the data center over a configurable period. e.g. two weeks. This method is a way to transform the pattern into a theoretical sinusoidal wave as shown in the image below.
With a sine wave, the most common troughs can be determined. The periods where these troughs occur are then used as options for the maintenance window.
Sinusoidal wave theory – the secret sauce
We think math is fun and were excited to see how this held up in practice. To implement the logic and tests, we needed to understand the theory. This section details the important bits for anyone that is interested in implementing this for their maintenance cycles as well.
The image below shows a theoretical representation of a sine wave. It is represented by the mathematical function y(t) = Asin(2πft + φ) where A = Amplitude, f = Frequency, t = Time and φ = Phase.
In practice, various programming language packages exist to fit an arbitrary dataset on a curve. For example, Python has the scipy curve_fit function.
We used Python and to make the result more accurate, it is recommended to include arbitrary values as initial guesses. These are described below;
Amplitude: This is the distance from the peak/valley to the time axis, and is approximated as the standard deviation multiplied by √2. The standard deviation represents the variability in the data points, and for a sine wave that varies between -1 and +1, the standard deviation is approximately 0.707 (or 1/√2). Therefore, by multiplying the standard deviation of the data by √2, we can represent an approximation of the amplitude.
Frequency: This is the number of cycles (time periods) in one second. We are concerned with the daily CPU pattern, meaning that the guess should be one full wave every 24 hours (i.e. 1/86400).
Phase: This is the position of the wave at T=0. No guess is needed for this.
Offset: To fit the sine wave on the CPU values, we need to shift upwards by the offset. This offset is the mean of the CPU values.
Here’s a basic example of how it can be implemented in Python:
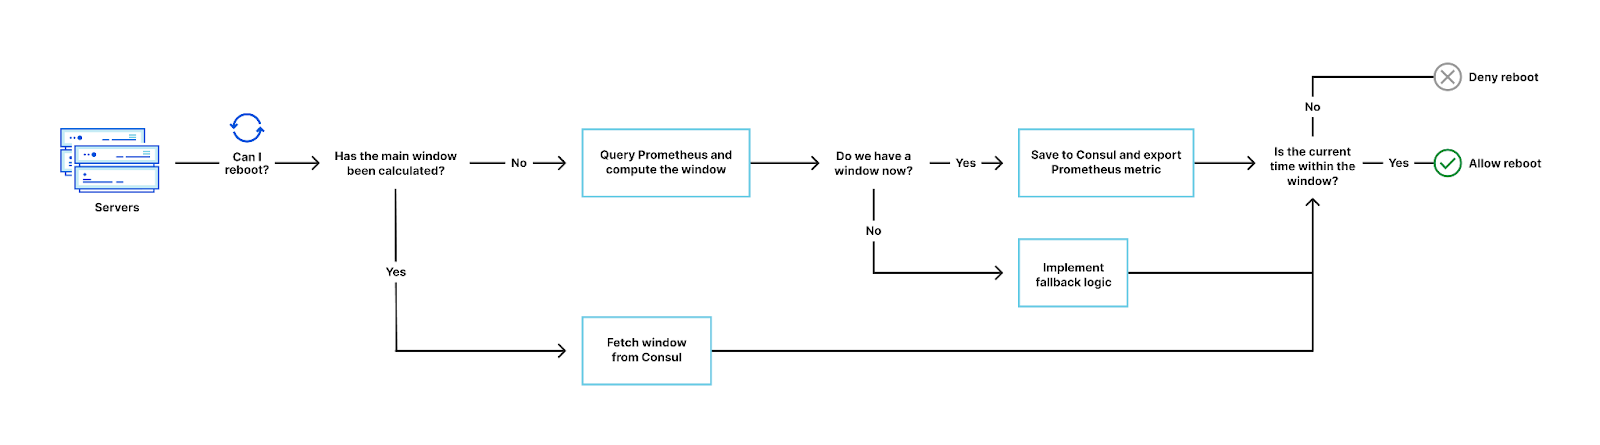
With the theory understood, we implemented this logic in our reboot system. To determine the window, the reboot system queries Prometheus for the data center CPU over a configurable period and attempts to fit a curve on the resultant pattern.
If there’s an accurate enough fit, the window is cached in Consul along with other metadata. Otherwise, fallback logic is implemented. For various reasons, some data centers might not have enough data for a fit at that moment. For example, a data center which was only recently provisioned and hasn’t served enough traffic yet.
When a server requests to reboot, the system checks if the current time is within the maintenance window first, before running other pre-flight checks. In most cases the window already exists because of the prefetch mechanism implemented, but when it doesn’t due to Consul session expiry or some other reason, it is computed using the CPU data in Prometheus.
The considerations in this phase were:
Caching: Calculation of the window should only be done over a pre-decided validity period. To achieve this we store the information in a Consul KV, along with a session lock that expires after the validity period. We have mentioned in the past that we use Consul as a service-discovery and key-value storage mechanism. This is an example of the latter.
Pre-fetch: In practice, it makes sense to control when this computation happens. There are several options but the most efficient was to implement a pre-fetch of this window on startup of the reboot system.
Observability: We exported a couple of metrics to Prometheus, which help us understand the decisions being made and any errors we need to address. We also export the maintenance window itself for consumption by other automated systems and teams.
How accurate is this fit?
Most load patterns fit into the sine wave, but there are some edge cases occasionally. e.g. a smaller data center that has a constant CPU. In those cases we have fallback mechanisms, but it also got us thinking about how to determine the accuracy of each fit.
With accuracy data we can make smarter decisions about accepting the automatic window, track regressions and unearth data centers with unexpected patterns. The theoretical solution here is referred to as the goodness of fit.
Curve fitting in Python with curve_fit describes curve fitting and calculating the chi-squared value. The formula for a goodness of fit chi-squared test in the image below:
The different values are the observed (Yi), expected (f(Xi)) and uncertainty. In this theory, the closer the chi-square value to the length of the sample, the better the fit is. Chi-squared values that are a lot smaller than the length represent an overestimated uncertainty and much larger represent a bad fit.
This is implemented with a simple formula:
def goodness_of_fit(observed, expected):

    chisq = numpy.sum(((observed - expected)/ numpy.std(observed)) ** 2)

    # Present the chisq value percentage relative to the sample length
    n = len(observed)
    return ((n - chisq) / n) * 100
The observed result of this is that the smaller the chi-squared, the more accurate the fit and vice versa. Hence we can provide a fit percentage of the difference between the length and the chi-squared.
There are three main types of fit, as shown in the images below.
Bad Fit
These data centers do not exhibit a sinusoidal pattern and the maintenance window can only be determined arbitrarily. This is common in test data centers which do not handle customer traffic. In these cases, it makes sense to turn off load-based reboots and use an arbitrary window. In these cases, it is common to require faster reboots on a different schedule to catch any potential issues early.
Skewed Fit
These data centers exhibit sinusoidal traffic patterns but are a bit skewed, with some smaller troughs within the wave cycle. The troughs (and hence the windows) are still correct, but the accuracy of fit is reduced.
Great Fit
These are data centers with very clear patterns and great fits. This is the ideal scenario and most fall into this category.
What’s next?
We will continue to iterate on this to make it more accurate, and provide more ways to consume the information. We have a variety of maintenance use-cases that cut across multiple organizations, and it’s exciting to see the information used more widely besides reboots. For example, teams can use maintenance windows to make automated decisions in downstream services such as running compute-intensive background tasks only in those periods.
I want to do this type of work
If you found this post very interesting and want to contribute, take a look at our careers page for open positions! We’d love to have a conversation with you.
Suppress unwanted problems during planned maintenance by defining Zabbix maintenance periods.
Planned downtimes due to maintenance are a part of every administrator’s life. Be it updating your software or upgrading the underlying hardware – sooner or later we will need to schedule a planned downtime. We also need to find a way to suppress the problems that these planned maintenance jobs can cause.
Define maintenance periods in Zabbix:
Prevent alert storms during maintenance periods
Define scheduled or one-time downtimes
Define maintenance periods for hosts or host groups
Use tags to suppress only the matching problems
Check out the video to learn how to use Zabbix Sender to send custom metrics to your Zabbix instance.
How to define a Zabbix maintenance period:
Navigate to Configuration → Maintenance
Click on the Create maintenance period button
Type in the maintenance period name
Select the maintenance type and the activity time window
Add a period during which your maintenance will take place
Select hosts and/or host groups
Optionally, specify tags to suppress only the matching problems
Add the maintenance period
Wait until the configuration changes are picked up by the Zabbix server
Navigate to Monitoring → Problems
Confirm if the problems on the host are suppressed
Tips and best practices:
Suppressed problems can be displayed in the problems section by checking the Show suppressed problems checkbox
Host status is switched to/from maintenance only at the start of the minute
If you create a maintenance period with data collection, the triggers are processed as usual, but any related problems are suppressed
If you create a maintenance period with no data collection, no related metrics will be collected during the maintenance period
To provide the best experiences, we use technologies like cookies to store and/or access device information. Consenting to these technologies will allow us to process data such as browsing behavior or unique IDs on this site. Not consenting or withdrawing consent, may adversely affect certain features and functions.
Functional
Always active
The technical storage or access is strictly necessary for the legitimate purpose of enabling the use of a specific service explicitly requested by the subscriber or user, or for the sole purpose of carrying out the transmission of a communication over an electronic communications network.
Preferences
The technical storage or access is necessary for the legitimate purpose of storing preferences that are not requested by the subscriber or user.
Statistics
The technical storage or access that is used exclusively for statistical purposes.The technical storage or access that is used exclusively for anonymous statistical purposes. Without a subpoena, voluntary compliance on the part of your Internet Service Provider, or additional records from a third party, information stored or retrieved for this purpose alone cannot usually be used to identify you.
Marketing
The technical storage or access is required to create user profiles to send advertising, or to track the user on a website or across several websites for similar marketing purposes.