In most organizations, printing is an essential but often invisible service. When it works, nobody notices. When it fails, productivity stalls. That’s why monitoring your print environment is just as important as monitoring servers, databases, or network devices.
At Opensource ICT Solutions, we specialize in turning complex systems into observable services. One recent example is our integration of PaperCut NG with Zabbix. This allows IT teams to track the health of their print infrastructure in real-time — everything from server resources to individual printers and devices.
Why monitoring PaperCut matters
PaperCut NG does much more than queue print jobs. It enforces quotas, integrates with authentication systems, and manages fleets of devices. If the database runs out of connections, the disk fills up, or the license expires, users feel the impact instantly.
By integrating PaperCut with Zabbix, we make these risks visible long before they become business problems. The result is:
Proactive detection of printer errors, low toner, or license issues.
Capacity planning through trend analysis of disk usage, memory, and DB connections.
Unified visibility — PaperCut health checks appear right alongside servers, networks, and applications in Zabbix dashboards.
How the integration works
The magic happens through the PaperCut System Health API and Zabbix’s flexible data collection methods.
HTTP agent items
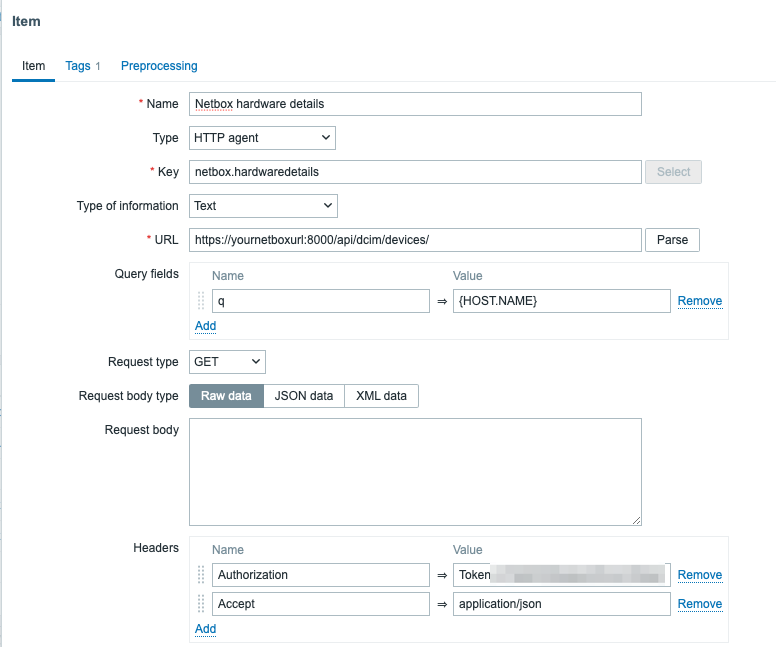
Zabbix fetches raw JSON data directly from PaperCut using an HTTP agent item, such as:
This single call provides a full snapshot of server health.
Dependent items + JSONPATH
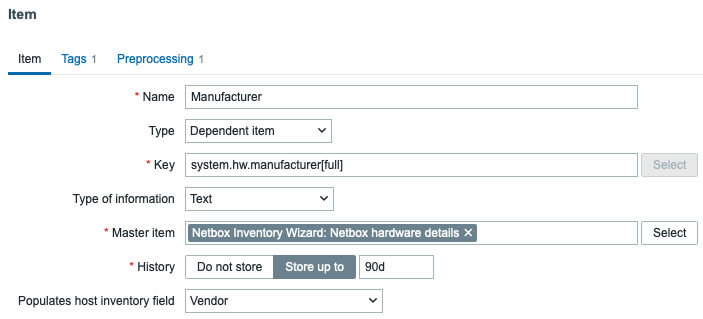
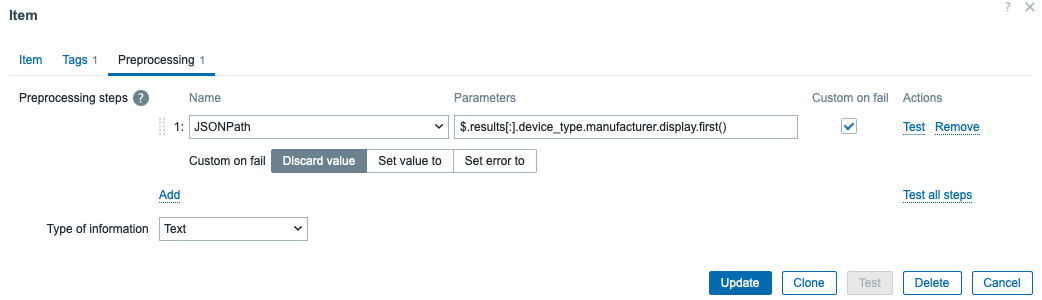
Instead of hammering the API with multiple requests, we extract the needed fields using dependent items with JSONPATH preprocessing.
For example:
This design means one request can populate dozens of metrics, keeping monitoring both efficient and lightweight.
Calculated items
Some values aren’t directly available from PaperCut. In those cases, we create calculated items inside Zabbix.
For example, the percentage of active DB connections is derived as:
This allows us to set intelligent triggers like “DB connections > 90%” without requiring PaperCut to calculate it for us.
Low-level discovery (LLD) for devices and printers
Perhaps the most powerful part of this integration is automatic discovery.
Printer LLD → Queries /api/health/printers and creates items and triggers per printer. If a printer goes into Paper Jam or No Toner, Zabbix knows immediately.
Device LLD → Queries /api/health/devices and builds items dynamically for each discovered device, tracking states like OK, WARNING, or ERROR.
This ensures that new printers and devices are monitored automatically — no manual configuration required!
Why this matters
Bringing all of this together, the integration turns PaperCut NG into a fully observable service inside Zabbix.
Efficiency → One API call, dozens of metrics.
Scalability → Automatic discovery of printers and devices.
Robustness → Alerts and dashboards for licenses, resources, and print queues.
For IT teams, this means fewer surprises, faster troubleshooting, and more confidence in a service that often goes unnoticed until it fails.
Our expertise
This PaperCut integration is just one example of how we at Opensource ICT Solutions help organizations unlock the full potential of Zabbix. We don’t just install monitoring – we design intelligent, scalable integrations that make hidden systems visible. Whether it’s print management, databases, custom applications, or network devices, we know how to extend Zabbix to fit your environment and give you the insights that matter most.
If you are running Zabbix, you know that it can be a tedious job to add hosts, link templates, and (even harder) make sure it is consistent with your CMDB. What if you already have a CMDB? In that case, it means you need to synchronize the CMDB with Zabbix…manually? Of course not!
Before we continue – this blog post and plugin both belong to Opensource ICT Solutions. We specialize in Zabbix (it’s our core business!) and as such try to make a living out of this open-source product. The plugin we will discuss is open source, and as such we do not have a commercial benefit from it – it’s brought to you by us, as a way to give back to the community (and maybe score some consultancy opportunities).
If you are familiar with NetBox already, it’s time to get excited. If you are not familiar with it, NetBox provides a powerful “single source of truth” for managing everything in your network: IP address management (IPAM), data center infrastructure management (DCIM), device inventory, rack layouts, cabling, virtual assets, and more. It’s built under the Apache 2.0 license, so the core software is fully open source, with an active community contributing plugins, integrations, and custom extensions. The platform is highly flexible – you can add custom fields, enforce custom validation and protection rules, integrate via REST and GraphQL APIs, and run multiple automations.
How cool would it be if you could use that in combination with Zabbix, so that if you create a new entity in your CMDB (your single source of truth) and sync that with Zabbix, you could just focus on one product and always can be assured your monitoring is complete?
What are we solving?
Many of our customers use NetBox as their CMDB and Zabbix as their monitoring solution. The challenge they run into is keeping NetBox and Zabbix in sync — a task engineers don’t usually enjoy.
For customers who don’t use a CMDB (or at least not NetBox), there’s always the uncertainty of whether a host in Zabbix has the right templates and macros applied. While Zabbix does allow bulk updates, you still need detailed knowledge of each device’s role to keep things consistent.
NetBox, on the other hand, already stores much richer context about configuration items. A device or virtual machine can have a role, device type, tenant, and even its site or location defined. All that’s missing is a way to leverage this information to make sure those devices are monitored correctly in Zabbix.
On top of that, this approach makes it simple – if a device is registered in the CMDB (and therefore something you’re responsible for), it’s also monitored in the right way. From a project delivery perspective, documentation only needs to be done once, and it ensures that it’s actually done. In short: if it’s not in the CMDB, it’s not monitored — and therefore not our responsibility.
It also means the project delivery engineer(s) don’t necessarily need to know in depth how Zabbix works: as long as they can populate the CMDB – the monitoring will be taken care of automatically.
What did we develop?
In short, a native plugin for NetBox that communicates with the Zabbix API. From there, it will gather information like templates and macros that exist in your Zabbix environment. This is completely API based, so in NetBox you just add an new Zabbix Server and let it synchronize:
Screenshot about a new Zabbix server in NetBox
At this point, nothing fancy happens. It is just establishing the connection and synchronizing templates, macros, etc. The rest of the configuration is done in your NetBox instance.
How does it look?
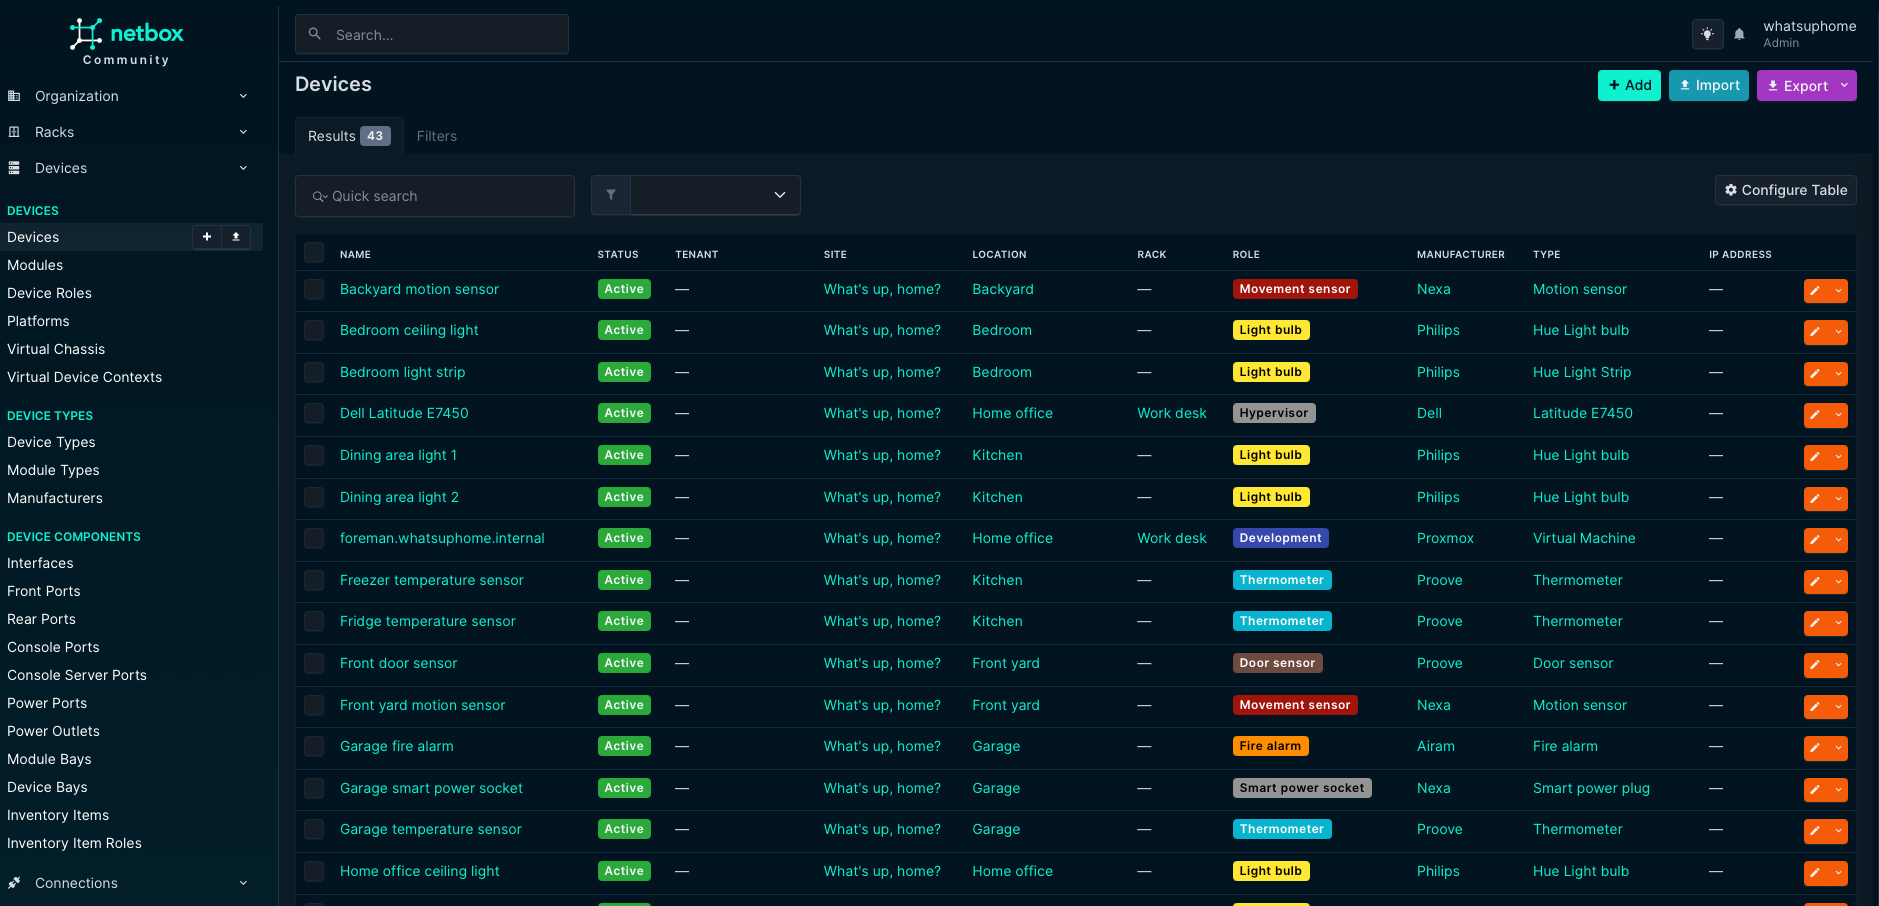
We’ve got the normal/native menu list items from NetBox, and for those familiar with it already the list below shows nothing new except for the “Zabbix” option:
Organization – Define sites, locations, and tenants to structure your infrastructure
Racks – Manage physical racks and their layout in data centers
Devices – Inventory of physical and virtual devices like servers, routers, and switches
Connections – Model physical cabling and logical connections between devices
Wireless – Manage wireless LANs, SSIDs, and related equipment
IPAM – IP Address Management: subnets, prefixes, IPs, and VRFs
VPN – Configure tunnels, peers, and VPN terminations
Virtualization – Track clusters, virtual machines, and virtual interfaces
Circuits – Manage provider circuits, WAN links, and related contracts
Power – Define power feeds, panels, and outlet connections.
Provisioning – Support for building and automating device/service onboarding
Customization – Extend NetBox with custom fields, rules, and UI tweaks
Operations – Tools for workflows, jobs, and operational tasks
Admin – Administrative settings for users, groups, and global configuration
The Zabbix menu is new here and actually gives us control over what is present in Zabbix. The objects here should look familiar if you know Zabbix:
Servers
Proxies
Proxy Groups
Templates
Macros
Tags
Hostgroups
Maintenance
NetBox menu including Zabbix plugin
In the various NetBox native objects, there will be information regarding the Zabbix setup.
Is it available already?
Of course it is, otherwise this blog post would’ve been completely useless! Installation can be done via https://pypi.org/project/nbxsync.
We released our NetBox plugin under the GNU Affero General Public License v3 (AGPL-3.0) because it best protects both our work and the community. Unlike permissive licenses, AGPL ensures that anyone who modifies or extends the plugin must share their changes under the same license, even if the software is only offered as a service. This prevents closed forks, guarantees improvements flow back into the community, and aligns with the collaborative spirit of NetBox and Zabbix.
While AGPL still allows use in commercial environments, it prevents organizations from profiting off private modifications without contributing back. In short, AGPL-3.0 keeps the plugin fair, transparent, and truly open source. This is also the license Zabbix uses, so the community is already familiar with it.
We think documentation is important, as we’ve often been in a situation where we had to discover ourselves how something works due to lack of documentation. We really try to keep you out of that situation and therefor created extensive documentation for this project. Obviously, we can help you when you are lost, but as that costs us time as well it won’t be a free service. The documentation is available here: https://nbxsync.com.
As we think it’s great to work on a project together, we welcome community contributions. However, in order to accept any pull requests, please create an issue on our Github repo first. Please do read our development guidelines and understand that we are more than happy to incorporate suggestions/pull requests if they benefit the wider community.
As it’s a native plugin, the installation is straightforward and well documented by NetBox: https://netboxlabs.com/docs/netbox/plugins/installation/. In our documentation, we provide the plugin-specific configuration. If this feels daunting, we’re more than happy to assist you with it as part of our consultancy offering.
So, with NetBox in place and the plugin installed, let’s actually walk through the NetBox configuration to give you a feeling of how it works. We will have to configure quite a bit in NetBox as a foundation, which hopefully is done already if you’ve got NetBox implemented in your organization.
In any case, we need to add one or multiple new Zabbix servers. We open the Zabbix menu and click on “Servers” where we add this server:
NetBox Zabbix Server configuration
Once added, NetBox will automatically synchronize with the Zabbix server and get the templates out of it, ready to be used! The macros will also get synchronized along with the templates,, so they are also available in NetBox.
NetBox dictates that devices should be in a site, so we start with that. In Organization → Sites we create a new site. A few fields are mandatory and populated in the screenshot below:
NetBox Sites Configuration
Name, Slug, and Status are mandatory. In a production setup, you probably want to populate some other fields as well, such as Tenant, Region, etc. But we are not writing a NetBox tutorial and as such we will completely ignore that. Once you are done, click on “Create” at the bottom of the configuration.
After the site has been created, it is time to add a Manufacturer under the menu “Devices.”
Once done, click on “Create” at the bottom of the configuration. Of course you can (or should) add multiple vendors – all that you actually use!
The next step is device type. In the end, we need to know the vendor, but it is equally important to know what type of device we are monitoring. As such, the next step is to add a device type, again under the main menu “Devices.” As we add in the example, we are going to add a CBS220 switch:
NetBox device type configuration
Once again, click on “create” when you are done.
Last but not least, we need to add a device role. The device role is an important attribute because it helps us clearly define the function of the device within the network. By categorizing devices based on their role (such as router, switch, firewall, server, or access point) we create a structured overview that makes it much easier to manage, monitor, and troubleshoot the environment. Assigning roles also ensures consistency, improves documentation quality, and allows us to quickly identify the purpose of each device in larger infrastructures.
We go to “Devices” → Device roles and from there:
NetBox Device Role
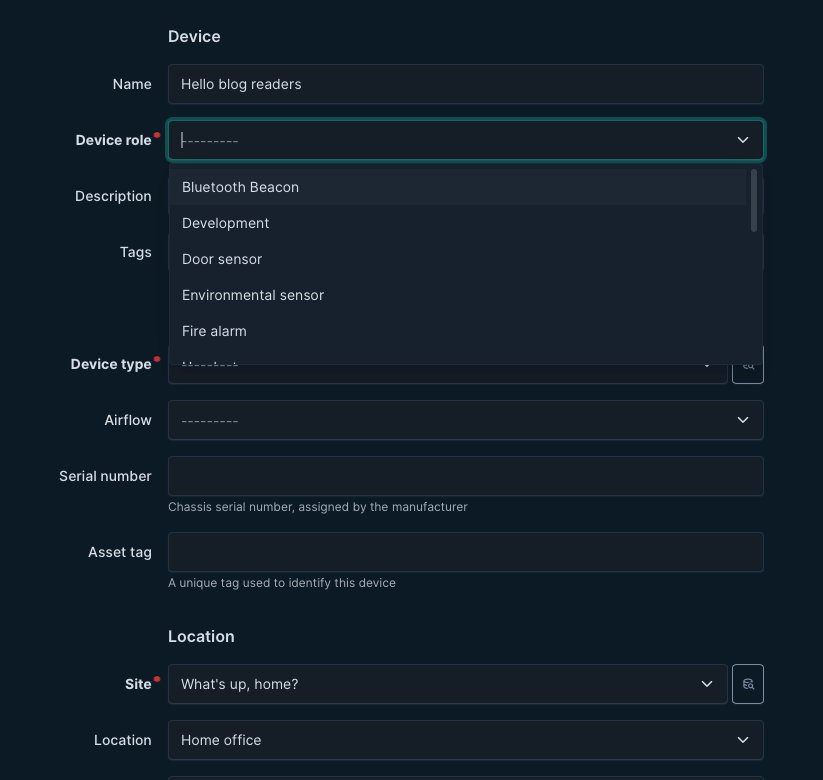
Now we can finally add the device itself! This is what it all is about – the work we’ve done before is really just laying the foundation for this moment. We add a device which will eventually become a Host in Zabbix, with all related properties pushed from NetBox its configuration.
So we navigate to Devices → Devices and from there add it:
NetBox Device configuration (truncated some fields)
After we save the device by clicking “Create,” NetBox immediately takes us to the newly created device’s detail page. Here we can see an overview of all the information we have just entered, such as the device name, role, site, rack position, and other attributes. This page acts as the central point for managing and extending the device configuration.
From here, we can add interfaces, assign IP addresses, connect cables, or link the device to virtual resources. In other words, once created the device record becomes the foundation for documenting its place and function in the network.
NetBox device overview with Zabbix options
In this screenshot, we can see already that there is a new tab “Zabbix” (just under the device name) and we’ve also got a new button “Sync Zabbix.”
In the tab “Zabbix” we should assign this device to a Zabbix server, as by default it will not get assigned to any. You might think this is a bit strange, especially if you’ve got one Zabbix server. However, the mindset during development is that NetBox typically is used by MSPs, which have multiple Zabbix servers and even might have the need to assign multiple Zabbix servers to this device for operational reasons.
We open the tab “Zabbix” and click on “Add” next to the Zabbix Servers. A new configuration page opens and we select the server we just added:
NetBox Zabbix server assignment
When you click on “create” the server is assigned. We can of course add an template to it, but as we know the vendor and type already, there should be some inheritance!
Let’s go back to Device → Manufacturers and click on the vendor(Cisco) we just added. Click on the name and you will see that this object also got a new “Zabbix” tab. In this tab you can configure that for this vendor, always these templates, hostgroups, tags and macros should be used. Here we will just add the template to this vendor, to show inheritance:
Netbox template inheritance
Once you’ve clicked on Create, navigate back to the device we made and observe how the template is inherited. As Zabbix also requires a host group and an interface, we are going to configure that now.
We will start with the host group, so click on Zabbix -> Hostgroups. There we create a new one as per the screenshot below. There is something strange with our configuration, as we use Jinja2 templates instead of static names.
The object name is “Device site” but the actual value will resolve to the site name we created (OICTS HQ) earlier. The power here lies in the variables – if we create a new device for another site and link this hostgroup, it will automatically resolve to the correct site name with no need for static configurations anymore!
Of course, the host group should be assigned to a Zabbix server again:
NetBox Zabbix hostgroups
The next step is to create a Zabbix host interface, which is essential for monitoring and communication between Zabbix and the device. To do this, we leverage the IPAM (IP Address Management) functionality within NetBox.
IPAM provides a structured way to manage and allocate addresses across the network, ensuring consistency and avoiding conflicts. In this case, we navigate to IPAM → IP Addresses and add a new IP address that will serve as the management interface for the device. This IP address will later be linked to the Zabbix host configuration, allowing monitoring data to flow seamlessly.
NetBox IPAM config – IP address
If we now go back to Devices -> the device we want to configure → tab “Zabbix” we should add an Host interface and Host group. Click on Add for the respective config and populate the minimum fields. For the Host interfaces that looks like this:
NetBox Zabbix host Interface
For the host group, there are fewer fields to fill in compared to other objects. All you need to do is select the appropriate group from the available options. This keeps the process straightforward and avoids unnecessary configuration.
Once saved, the host group will be correctly linked and ready for use in Zabbix:
NetBox Zabbix hostgroups
So the final result looks like this. At this point, all of the required elements have been configured in NetBox and properly linked to the Zabbix environment. The device now has its host group, host interface, and templates assigned, giving us a complete picture of how it will appear in monitoring.
What we see here is essentially the end-to-end outcome of the earlier configuration steps, where NetBox acts as the single source of truth and Zabbix automatically inherits the correct setup.
NetBox Zabbix device overview
Now it’s time to actually synchronize the device with Zabbix. At the top of the device detail page, right next to the device name, there is a button labeled “Sync Zabbix.” By clicking this button, NetBox will push all the information we’ve configured—such as interfaces, templates, and host groups—directly into Zabbix.
Within a few seconds, the host is created and fully ready for monitoring, without any manual setup inside Zabbix. With the heavy lifting automated, you can sit back and relax knowing that the device has been synchronized correctly.
Actually, let’s head over to Zabbix and confirm the synchronization:
Zabbix host overview from NetBox
Brilliant! The host is there, the template is linked, the host group automatically was set to “OICTS HQ” and the interface also looks correct. Monitoring will start and we did not touch Zabbix itself!
Want to see it in action?
Can do! We’ve created a YouTube video for you to actually see how it works. On top of that, we plan to host webinars regarding this plugin as well. You can register for all our webinars for free via the Zabbix website.
Is this it?
No! Actually there is a lot more we can do with this NetBox plugin, but it’s just that this blog post is not the correct place to show it all. Just to give you an idea, we can set maintenance from NetBox, which automatically will sync it to Zabbix. This way we again have a single source of truth and make sure we can see from a helicopter view where the impact is.
Furthermore, automatic synchronization can be set up so that any changes in Zabbix are overridden by the NetBox configuration. This way, we make sure there is no drift between NetBox and Zabbix. It also guarantees that if engineers forget to manually synchronize, no harm is done. However, the manual sync button will always be there, as nobody wants to wait to fix the monitoring when changes are made!
In addition, the plugin fully supports proxies and proxy groups – just as you know them from Zabbix. We’ve just haven’t shown it here to keep it somewhat short.
Roadmap
Although this project is just a side gig (we still dedicate our resources to Zabbix) we of course have a vision and roadmap that we would like to chase.
One major feature that’s on the roadmap is to show host problems in NetBox. By retrieving the current problems for a given host and showing them in NetBox, we should be able to limit the time spent in Zabbix even further. Our goal is to realize a “Single Pane of Glass” (just as NetBox is the “Single Source of Truth.”
Banco do Estado do Pará (Banpará) is the main public financial institution in the Brazilian state of Pará. It is a mixed-capital company, organized as a multiple bank with the mission of generating value for the state of Pará. It currently has approximately 198 physical customer service units and is present in all 144 municipalities in the state.
The challenge
Until 2016, Banpará used a monitoring environment installed on a single physical server. This environment was centralized, not very scalable, and vulnerable due to the lack of updates to recent versions of the software used. Centralization created a critical dependency – if there was a server failure, the entire monitoring system would be compromised.
There was no integration with the tool that orchestrates the company’s routine activities (which also generated an alert and a need for proper support of the bank’s infrastructure) and there was also the issue of including the routines of the internal demand generation tool in the monitoring panel, which was done manually.
With each new routine created, it was necessary to open calls with the technical teams for inclusion in the monitoring plan, which were then entered into a list of tasks. This process, in addition to being time-consuming, was subject to human error and delays, which compromised real-time visibility of critical operations.
The lack of proactive and integrated monitoring in Banpará’s structure resulted in operational gaps that created real risks to the continuous functioning of banking operations.
The solution
Given the challenges posed, the project developed with Zabbix had as its main objective to recreate the monitoring environment in a virtualized, scalable and resilient way, without dependence on a physical server. From rebuilding the infrastructure to integrating it with critical banking systems, the primary requirements included the following:
Integration with existing systems
Intelligent data processing and analysis
Reduction of manual processes and operational dependency
Development of customized solutions
Reorganization of the technological infrastructure
After implementing and structuring Zabbix at the bank (with the help of Master Support, an official Zabbix Certified Partner in Brazil), the structure became modular, scalable, and resilient, aligned with best practices, and able to expand monitoring without compromising system performance as the bank integrated new routines and services.
The results
The modernization of monitoring environment with Zabbix brought immediate benefits for Banpará’s IT monitoring scenario, especially with regard to operational efficiency, reliability and process automation:
More than 2,000 monitored devices
Around 100,000 metrics collected
More than 26,000 active alerts in Zabbix
Automated coverage of around 2,300 routines
An estimated gain of 2,300 operational hours
The adoption of Zabbix as a monitoring tool at Banpará was a practical response to the need to modernize the bank’s IT infrastructure. The project contributed to the elimination of manual processes, reduction of operational time, and increased visibility over critical routines. It also enabled the monitoring of a greater number of services, with greater agility in identifying failures and supporting decision-making.
In conclusion
With the current structure, Banpará now has a more integrated monitoring system, adjusted to operational demands and with the capacity to monitor the evolution of the bank’s activities in an organized and secure manner.
To learn more about what Zabbix can do for customers in banking and finance, visit our website.
Can you imagine being able to schedule maintenance in Zabbix by simply telling a program: “I need to put the web server in maintenance tomorrow from 8 to 10 with ticket 100-178306”? That’s exactly what the Artificial Intelligence (AI) Scheduler Zabbix project I’ve developed does!
What problem does it solve?
Anyone who has worked with Zabbix knows that scheduling maintenance can sometimes be tedious, especially when you need to:
Configure complex routine maintenance
Handle Zabbix API bitmasks for specific days of the week or month
Search for specific hosts or groups
Document associated tickets
This project eliminates that friction by allowing the use of natural language to create both one-time and routine maintenance.
The magic behind the code
Conversational artificial intelligence
The system integrates both OpenAI GPT-4 and Google Gemini to interpret natural language requests. The AI doesn’t just understand what you want to do, but automatically:
Detects servers, groups, and dates
Identifies ticket numbers (XXX-XXXXXX format)
Automatically calculates complex Zabbix bitmasks
Generates contextual responses with examples
Fig. 1. Adding the AI Scheduler widget to your Zabbix dashboard
Advanced routine maintenance
What really stands out is its ability to handle complex patterns. Here are some practical examples that work:
“Daily backup for srv-backup from 2 to 4 AM with ticket 200-8341 until February 2027”
“Thursday and Friday maintenance from 5 to 7 AM until January 2027”
“Cleanup on the first Sunday of each month with ticket 100-178306 until December 2026”
Fig. 2. AI-generated maintenance summary with all calculated parameters
Elegant architecture
The project uses a three-layer architecture:
Frontend: Custom widget for Zabbix
Backend: Flask API with AI integration
Zabbix: Native API to create maintenance
Fig. 3. Maintenance successfully created and visible in Zabbix interface
Super-simple installation
One of the best features is how easy it is to get it running:
cp .env.example .env
You only need to configure your Zabbix URL and AI API key:
docker compose up -d --build
And that’s it! You have an AI assistant working.
Multi-instance support
For organizations with multiple Zabbix servers, the project includes configuration for up to 5 simultaneous instances, each with its own configuration.
What impresses me most
Intelligent date detection
The system understands natural expressions like:
“Tomorrow from 8 to 10” → Next date with specific schedule
“Sunday from 2 to 4 AM” → Next Sunday at those hours
“24/08/25 10:00am” → Automatically converts the format
Automatic Bitmask management
Zabbix API bitmasks can be notoriously complicated. This system calculates them automatically:
Thursday and Friday = 8 + 16 = 24
Sundays only = 64
First week of the month with specific configuration
Fig. 4. Complex weekly maintenance scheduling with automatic bitmask calculation
Why is it important?
This project represents a natural evolution in systems administration. Instead of memorizing complex syntax or navigating multiple menus, you simply describe what you need in natural language. It’s especially valuable for:
Operations teams handling multiple maintenance tasks
Companies that need to document associated tickets
Organizations with complex maintenance patterns
The future is here
Projects like this demonstrate how artificial intelligence can make complex technical tools more accessible without sacrificing functionality. It’s not just automation – it’s intelligence applied to real infrastructure problems. If you work with Zabbix and are tired of manually configuring maintenance, this project is definitely worth checking out. It’s open source, well documented, and solves a real problem that many of us face every day. You can find the complete project on GitHub.
Zhongnan University of Economics and Law (ZUEL), located in Wuhan City, Hubei Province, China, is a key university with two campuses – Nanhu and Shouyi. The school boasts over 20,000 full-time undergraduate students, more than 8,800 graduate students, and over 2,500 faculty and staff members. ZUEL enjoys an outstanding reputation in the fields of law and economics, with four national key disciplines. Its law discipline, meanwhile, has been included in the list of national “Double First-Class” disciplines.
The challenge
As the information infrastructure at ZUEL continues to expand, the scale of the university’s IT infrastructure has rapidly grown to encompass power systems, dynamic environmental systems, servers, network devices, security appliances, storage systems, virtualization platforms, operating systems, databases, data lakes, and campus application systems.
At the same time, the daily academic and administrative activities of faculty and students increasingly demand higher levels of stability and reliability from information systems. To ensure the efficient operation of these systems, the Information Management department needed a monitoring and management system that could cover the entire university’s IT resources and address the growing complexities of operational maintenance.
The university found that traditional monitoring and management systems often fall short when faced with such large-scale and diverse monitoring demands, revealing problems like insufficient monitoring points, poor real-time capabilities, and limited scalability. To address these challenges, the university decided to adopt Zabbix 7.0 and develop a custom IP Radar platform to further meet its refined operational maintenance needs.
The solution
When combined with Zabbix 7.0, the IP Radar system can achieve comprehensive monitoring and management of the university’s entire IT infrastructure through the integrated application of multiple monitoring protocols and technologies. Specifically, the system collects data and performs monitoring with the help of the following core technologies:
Zabbix 7.0. As an enterprise-level open-source monitoring platform renowned for its robust data collection and analysis capabilities, Zabbix enhances the system’s high availability, supporting large-scale concurrent processing to make sure that the monitoring system remains stable and delivers uninterrupted service even under heavy loads.
Parallel monitoring with multiple protocols. The system collects data through a variety of protocols, including Agent, SNMP, IPMI, MODBUS, MQTT, and more, enabling the real-time monitoring of a wide variety of IT hardware.
High-availability design. To accommodate the monitoring demands of massive devices and thousands of users, the Zabbix 7.0 platform supports multi-node deployment and redundancy design, enabling load balancing and failover among proxy servers. Even in the event of a node failure, the system maintains uninterrupted monitoring services, and it’s also equipped with an automated fault alerting and repair mechanism.
The self-developed IP Radar platform. To meet a demanding set of operation and maintenance management needs, ZUEL has developed the IP Radar system based on the Zabbix 7.0 platform, further customizing its business monitoring capabilities. IP Radar not only conducts real-time monitoring of the IT infrastructure, but it also provides detailed performance analysis reports and trend predictions, while integrating behavior monitoring capabilities to enhance the school’s network security management.
The IP Radar platform itself contains a variety of unique and innovative features, including:
Comprehensive monitoring coverage. The IP Radar system monitors over a million items – everything from hardware devices to application systems, affecting everything from network performance to user experience. This extensive coverage gives the Information Management department to a comprehensive understanding of the operational status of the school’s IT resources while providing sufficient data support for troubleshooting and performance optimization.
Customized monitoring strategies. Compared to traditional monitoring systems, IP Radar offers highly customized monitoring strategies. ZUEL can tailor different business dashboards for networks, computing resources, user experience, data center environments, and more, based on its own needs and the permissions granted to operation and maintenance personnel. Depending on different monitoring thresholds and alerting strategies, the system can automatically generate alerts and notify relevant personnel through enterprise WeChat, SMS, and other channels.
Intelligent alerting and automated handling. The intelligent alerting system of the IP Radar platform leverages machine learning algorithms to analyze historical monitoring data, enabling it to predict potential fault risks and issue early warnings. At the same time, the system integrates automated operation and maintenance capabilities, which allow it to automatically execute predetermined repair operations when certain common faults occur, reducing the time and cost of manual intervention.
Network security monitoring. In terms of network security, the IP Radar system is capable of identifying abnormal traffic patterns and promptly detecting potential security threats through real-time analysis of the school’s entire network traffic. The system also supports the monitoring of online behavior to ensure that network access activities comply with the school’s security policies.
The results
After implementing the Zabbix-based system, ZUEL was able to measure a wide range of monitoring performance improvements, including:
Improved operational and maintenance efficiency. Through the IP Radar system, the school’s Information Management department has been able to monitor the operational status of over 28,000 hosts in real-time, significantly enhancing operational efficiency. The system’s automated fault handling capabilities reduce the complexity of manual operations, allowing operations and maintenance personnel to focus on addressing only the complex issues that the system is unable to resolve automatically. At the same time, the system’s intelligent alerting feature enables the early detection of potential problems, preventing sudden failures.
Enhancing system stability and reliability. The high availability design of Zabbix 7.0 ensures that the system remains stable even under heavy loads. Its redundant design and automatic failover mechanisms guarantee the reliability of the system, and the trend analysis functionality provided by IP Radar helps administrators to identify factors that may affect system stability in advance and making corresponding adjustments, enhancing the overall reliability of the IT system in the process.
Advancing detailed information management. The IP Radar platform lets schools manage multiple IT resources with greater precision. The system not only monitors the operational status of hardware devices, but it also analyzes the performance of business systems, helping administrators to optimize system configurations and enhancing user experiences. During project development, historical data from the monitoring platform serves as an essential basis for decision-making. In the acceptance phase, the monitoring platform provides evaluation reference data for operational efficiency and stability.
The IP Radar monitoring and management system developed by ZUEL and based on Zabbix 7.0 has become the largest, most widely used, and most effective (in terms of the volume of monitored data) in the Chinese education sector. The successful implementation of this system not only provides strong support for the school’s information management, but it also offers valuable references for information operation and maintenance at other universities.
In conclusion
Looking ahead, the IP Radar system is poised to expand its functionalities further by integrating more intelligent operation and maintenance management tools. Through the introduction of emerging technologies such as big data analysis and artificial intelligence, the system will achieve more breakthroughs in areas like automated operation and maintenance as well as intelligent fault prediction, providing even more comprehensive technical support for the university’s information management.
To learn more about what Zabbix can do for educational institutions, visit our website.
Zabbix has been the backbone of my infrastructure for over ten years, a journey I’ve been on from version 3.2 to 7.4. It’s a robust and reliable tool. However, in the age of intelligent assistants, I posed a question to myself: Why can’t I interact with my monitoring system as naturally as I talk with Maria, my generative AI assistant?
Table of Contents
What is MCP?
MCP (Model Context Protocol) is a universal protocol that helps generative AI systems interact with global data securely, reliably, and at scale.
Imagine this: It’s 3 AM, and you receive a critical alert on your phone. Instead of opening multiple dashboards and manually correlating data, you simply type: “What’s happening with the production server?”
You get a response like this:
“The web-prod-01 server is experiencing high memory usage (94%). This started 15 minutes ago, coinciding with a traffic spike. I recommend checking the database connection pool and considering a restart of the Apache service. Would you like me to show you the related logs?”
This is no longer science fiction!
Design principle
The main objective is to enhance Zabbix without altering its core. The solution is based on an architecture that adheres to the following principles:
Zabbix intact: The original installation remains unchanged.
API-first: All communication is done through Zabbix’s robust JSON-RPC API.
Intelligent bridge: An intermediary service is created to translate between human language and Zabbix metrics.
Scalability: The design is prepared to grow alongside the infrastructure.
AI server (MCP): Rocky Linux 9, Gemini AI, Express.js, Winston (Logging), Gemini CLI, Redis, Nginx, PM2
Webhooks
We process Zabbix alerts through a webhook that sends the data to our generative AI service.
#!/usr/bin/env python3
# -*- coding: utf-8 -*-
import json
import requests
import sys
from datetime import datetime

def send_to_mcp(args):
""" Sends alerts to MCP server"""
# SETTINGS - EDIT ACCORDING TO YOUR ENVIRONMENT
mcp_endpoint = "http://TU_IP_MCP_SERVER:3001/alerts" # Change to the MCP server IP
mcp_token = "TU_MCP_AUTH_TOKEN" # Exchange for your MCP authentication token
zabbix_server_ip = "TU_IP_ZABBIX_SERVER" # Change to the Zabbix server IP

headers = {
'Content-Type': 'application/json',
'Authorization': f'Bearer {mcp_token}'
}

# Extracting arguments from the Zabbix webhook
eventid = args[0] if len(args) > 0 else "unknown"
severity = args[1] if len(args) > 1 else "0"
message = args[2] if len(args) > 2 else "No message"
host = args[3] if len(args) > 3 else "unknown"
value = args[4] if len(args) > 4 else ""

payload = {
"timestamp": datetime.now().isoformat(),
"source": "zabbix",
"eventid": eventid,
"severity": severity,
"message": message,
"host": host,
"value": value,
"zabbix_server": zabbix_server_ip
}

try:
print(f"Sending alert to MCP: {mcp_endpoint}")
print(f"Payload: {json.dumps(payload, indent=2)}")

response = requests.post(mcp_endpoint, json=payload, headers=headers, timeout=15)
response.raise_for_status()

print(f"Alert sent successfully: HTTP {response.status_code}")
print(f"Response: {response.text}")
return True

except requests.exceptions.Timeout:
print("? Error: Timeout connecting to MCP server", file=sys.stderr)
return False
except requests.exceptions.ConnectionError:
print("? Error: Cannot connect to MCP server", file=sys.stderr)
return False
except requests.exceptions.HTTPError as e:
print(f"? HTTP Error: {e}", file=sys.stderr)
print(f"Response: {response.text}", file=sys.stderr)
return False
except Exception as e:
print(f"? Unexpected error: {e}", file=sys.stderr)
return False

if __name__ == "__main__":
# The arguments come from Zabbix
args = sys.argv[1:]
print(f"Script called with args: {args}")

success = send_to_mcp(args)
sys.exit(0 if success else 1)
Use cases
Scenario 1: Monday morning
Cesar: Good morning, how is the infrastructure looking?
Gemini CLI: Good morning! Everything is calm. 14 active hosts, 0 critical problems. There was a scheduled reboot on ‘proxmox-desarrollo’ over the weekend which completed successfully. The average CPU usage is at 23%. Do you need details on any specific system?
Scenario 2: Proactive planning
Cesar: What worrying trends are you seeing this week?
Gemini CLI: I’ve noticed three patterns that require attention:
1. storage-01: Growth of 2GB/day in /var/log.
Projection: 90% capacity in 12 days.
Recommendation: Configure a more aggressive log rotate.
2. mikrotik: Gradually increasing temperature (+3°C over the last 7 days).
Recommendation: Check ventilation.
3. base-datos-01: Slow queries increasing by 15%.
Recommendation: Review indexes and optimize frequent queries.
MCP implementation
Server (Rocky Linux 9)
bash
#create the project
mkdir /opt/mcp-zabbix
cd /opt/mcp-zabbix

#Install dependencies
sudo dnf install -y nodejs npm redis nginx
sudo npm install -g pm2

#Set up the project
npm init -y
npm install express axios @google/generative-ai winston helmet cors dotenv
Complete installation: Scripts for Rocky Linux and Debian
Zabbix configuration: Media types and actions
API reference: Endpoints and examples
Use cases
Basic monitoring: Hosts, items, triggers
Intelligent alerts: Automatic analysis
Ad-hoc queries: Quick investigation
Automated reports: Periodic summaries
Future integrations
The goal is to develop an application that allows natural interaction with an AI assistant called “Maria.” The idea is that based on what’s happening, Maria suggests actions and executes them proactively.
To achieve this, the assistant will integrate with Gemini’s command-line interface (CLI) and establish an additional secure communication channel. The recommended architecture will consist of several servers capable of understanding each other, including a Zabbix Server, the MCP (Model Context Protocol), and the personal assistant.You can follow the development of the base integration in this repository.
Conclusion
Zabbix will continue to be the reliable engine we all know. The difference is that it now becomes more intuitive and conversational. The goal is not to replace human experience, but to empower it. AI will allow us to create solutions that were previously unthinkable.
To fully leverage this potential, it is essential that we, as experts, continue to train and deepen our knowledge of the tool. This way, we will not only depend on what the AI suggests, but we will be able to validate and authorize its actions with our own judgment.
Authorization in Amazon Web Services (AWS) determines what actions a user, service, or system can perform on resources. It answers the question: “Does this identity have permission to do this action on that resource?”
In AWS, authorization is primarily handled through:
IAM (Identity and Access Management) policies
Resource-based policies (like S3 bucket policies)
Session-based permissions (like STS AssumeRole)
What authorization types are available in Zabbix AWS templates?
Access key authorization
Role-based authorization
Assume role authorization
Let’s look briefly at each of them.
Table of Contents
Before using the template, you need to create an IAM policy that grants the necessary permissions for the AWS services the template will interact with.
This policy defines what actions are allowed, on which resources, and optionally, under which conditions. Once created, the policy should be attached to the IAM role or user that will run the template.
IAM policy for Zabbix
Add the following required permissions to your Zabbix IAM policy in order to collect metrics. The policy can change when new metrics and services are added in Zabbix templates.
An error occurred (AccessDenied) when calling the DescribeInstances operation: User: arn:aws:iam::123456789010:user/zabbix_user is not authorized to perform: ec2:DescribeInstances on resource: arn:aws:ec2:eu-central-1:123456789010:instance/*
…you need to check the following permission to the role you are using (IAM Policy for Zabbix).
5. Set the following macros in Zabbix:
{$AWS.AUTH_TYPE} – set to access_key
{$AWS.ACCESS.KEY.ID} – set to your access key ID
{$AWS.SECRET.ACCESS.KEY} – set to your secret access key
Security tips
Never hardcode access keys in scripts or code.
Store them in ~/.aws/credentials, which is protected by file system permissions.
Apply least privilege with IAM policies.
Role-based authorization
1. Add the appropriate permission to the role you are using:
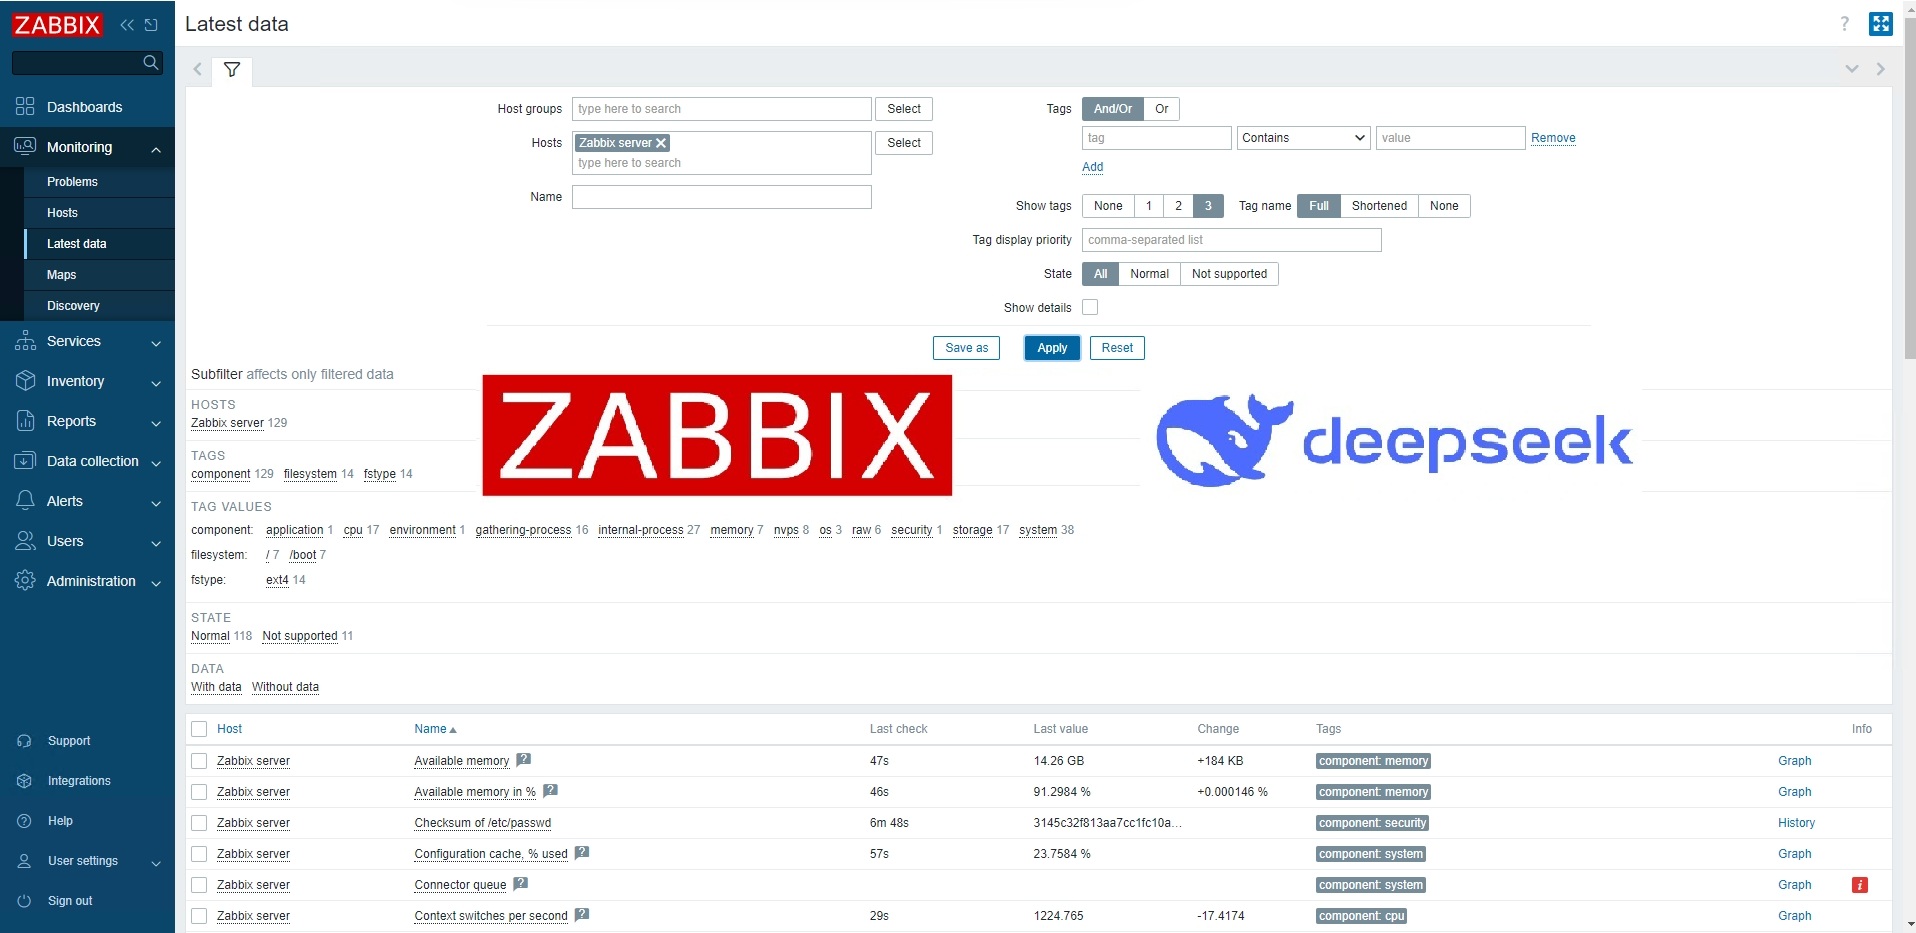
As IT infrastructures grow increasingly complex, efficiently analyzing monitoring data and accelerating incident response have become critical challenges for operations teams. This post explores a few innovative applications of DeepSeek when integrated with Zabbix.
Table of Contents
Requirements:
– Zabbix server 7.0 or higher
– DeepSeek API (Alternatively, other AI APIs can be used if needed)
By integrating DeepSeek Analytics into the Zabbix frontend, users can conduct intelligent alert analysis with just one click. This integration facilitates the swift generation of comprehensive fault analyses and solution suggestions, markedly decreasing the MTTR (Mean Time to Resolution). Consequently, it streamlines the troubleshooting process, alleviates the workload on IT personnel, ensures system stability, and conserves both time and resources.
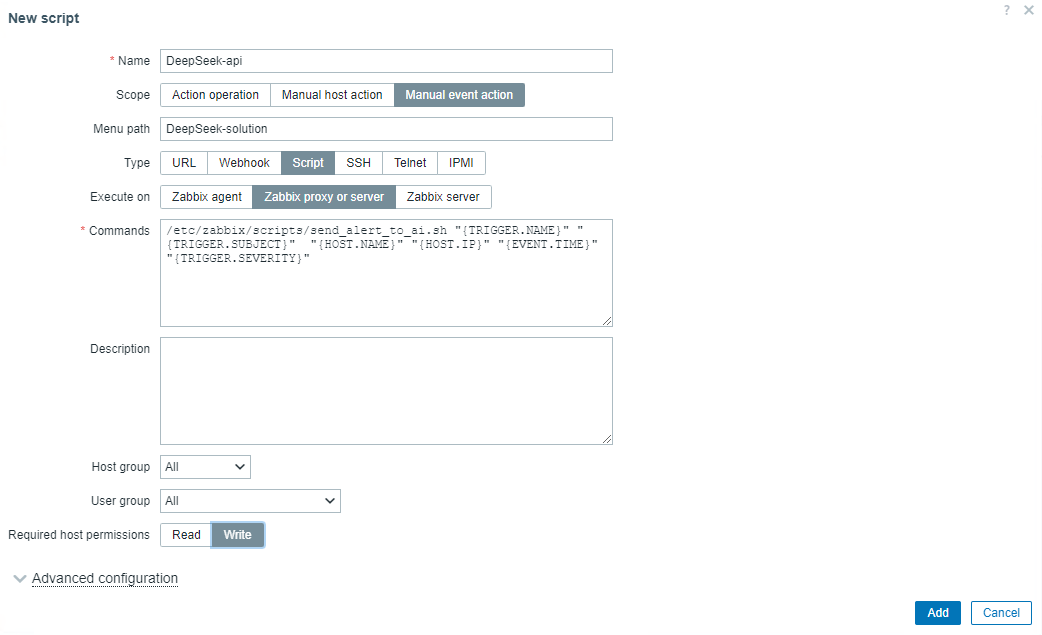
1.1 On the Zabbix home page, navigate to “Alerts” > “Scripts”, and click on the “Create script” button.
1.2 Configuration script:
Name: Can be customized
Scope: Select “Manual event action”
Menu path: Customize menu paths for quick access
Type: Select “Script”
Execute on: Select “Zabbix proxy or server”
1.3 Enter the following command in the command bar:
1.4.1 Modify the Zabbix Server Configuration File and Enable Global Scripts:
Open the Zabbix server configuration file for editing:
vi /etc/zabbix/zabbix_server.conf
Set the EnableGlobalScripts option to 1:
EnableGlobalScripts=1
Save the changes and exit the editor. Then, restart the Zabbix server service to apply the changes:
systemctl restart zabbix-server
1.4.2 Create an API Call Script.
Create a directory for custom scripts if it does not already exist:
mkdir -p /etc/zabbix/scripts && cd /etc/zabbix/scripts
Note: If the frontend prompts that the script file cannot be found, try moving the script to the directory used by the Nginx agent. Create a new script file named send_alert_to_ai.sh:
vi send_alert_to_ai.sh
Add the following content to the script, replacing DeepSeek KEY with your actual API key. Make sure you adjust the API call method if using a different AI service:
#!/bin/bash
# DeepSeek API configuration
API_URL="https://api.deepseek.com/chat/completions"
API_KEY="xxxxxxxxxxxxxxxxxxxx"
# Obtain the parameters to be passed as alarm information
TRIGGER_NAME="$1"
ALERT_SUBJECT="$2"
HOSTNAME="$3"
HOST_IP="$4"
EVENT_TIME="$5"
TRIGGER_SEVERITY="$6"
# Build a more concise JSON format for alarm information
alert_info=$(cat <<EOF
{
"model": "deepseek-chat",
"messages": [
{"role": "system", "content": "You are an assistant focused on responding quickly to system alarms。"},
{"role": "user", "content": "The following alarm information is received:\n\n: $TRIGGER_NAME\n: $ALERT_SUBJECT\n: $HOSTNAME\n: $HOST_IP\n: $EVENT_TIME\n: $TRIGGER_SEVERITY\n\nPlease tell me the cause of the alarm and the handling measures in a short and professional language with a word limit of 300 words。"}
],
"stream": false
}
EOF
)
# Send the POST request and capture the response and HTTP status code
response=$(curl -s -w "\n%{http_code}" -X POST "$API_URL" \
-H "Content-Type: application/json" \
-H "Authorization: Bearer $API_KEY" \
-d "$alert_info")
# Separate HTTP status codes from response bodies
http_code=$(echo "$response" | tail -n1)
response_body=$(echo "$response" | sed '$d')
# Parse and extract the content field
if [ "$http_code" -eq 200 ]; then
# Parse JSON using the jq tool
if ! command -v jq &> /dev/null; then
echo "jq could not be found, please install it first."
exit 1
fi
# Extract the content field and format the output
content=$(echo "$response_body" | jq -r '.choices[0].message.content')
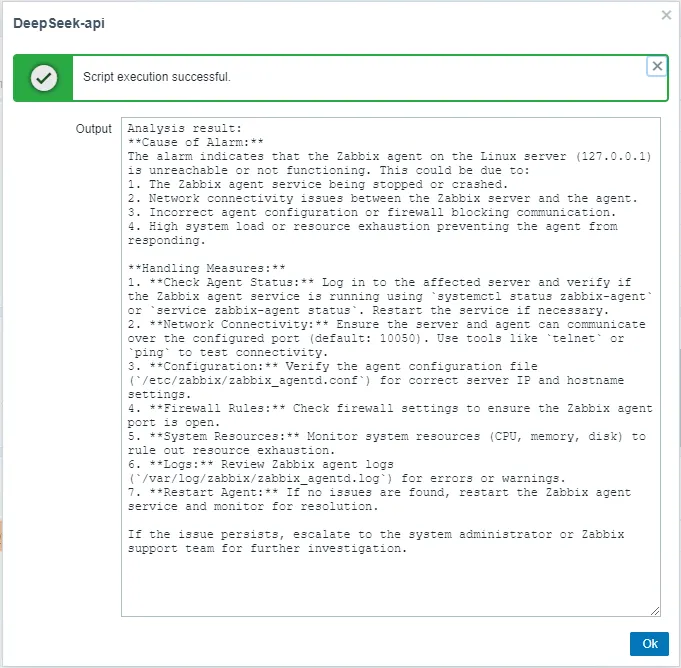
echo -e "Analysis result:\n$content"
else
echo "failure: HTTP status code $http_code, respond: $response_body"
fi
Make the script executable:
chmod +x send_alert_to_ai.sh
Note: The script provided invokes the official DeepSeek API. Replace DeepSeek KEY with your actual API_KEY. If you are using another AI service, please confirm the appropriate API invocation method.
Important Notes:
Note: The script relies on jq to process and parse JSON data for tasks such as filtering, mapping, aggregating, and formatting. If jq is not installed on your system, follow these instructions to install it.
For Debian/Ubuntu Systems:
apt-get update apt-get install jq
For CentOS/RHEL Systems:
yum install epel-release yum install jq
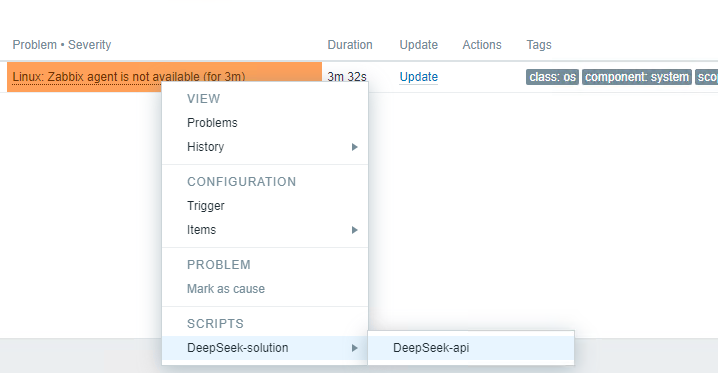
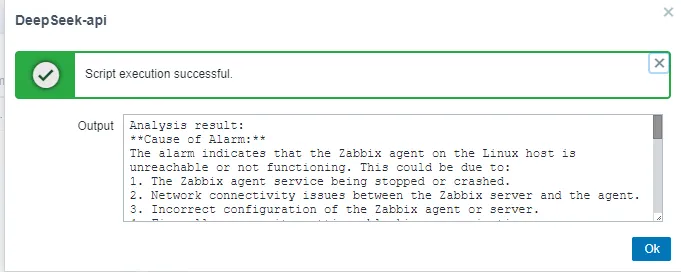
1.5 Actual Effect Display:
1.6 Optional Optimization Items.
1.6.1 Adjust Output Box Size for Better Browsing.
After executing the script, you may find that the output box is too small and inconvenient to browse. To optimize this, you can modify the front-end CSS file as follows.
Back up the existing CSS File:
cd /usr/share/nginx/html/assets/styles/
cp blue-theme.css blue-theme.css.bak
Edit the CSS File:
vi /usr/share/nginx/html/assets/styles/blue-theme.css
Add Custom Styles at the End of the File.
Add the following CSS rules to adjust the size and behavior of the output box:
#execution-output { height: 500px; /* Adjust to your desired height */ width: 540px; /* Optional: Adjust the width as required */ overflow-y: auto; /* Displays scrollbar when content exceeds the set height */ }
Save and exit the editor. At this point, clear the browser cache and reload the page to see the changes take effect.
1.6.2 How to Optimize Slow Output Response after Executing the One-Click Analysis Script.
During actual testing, it was estimated that returning a 300-word result takes approximately 20 to 30 seconds. While you can improve the response speed by adjusting the preset prompt words in the script, this approach may reduce the richness of the analysis content. Therefore, it is recommended to balance speed and content depth by adjusting the number of replies in the script’s prompt words according to your actual needs.
Actual effect display:
2. Scenario Two: Zabbix Documentation Knowledge Base Assistant
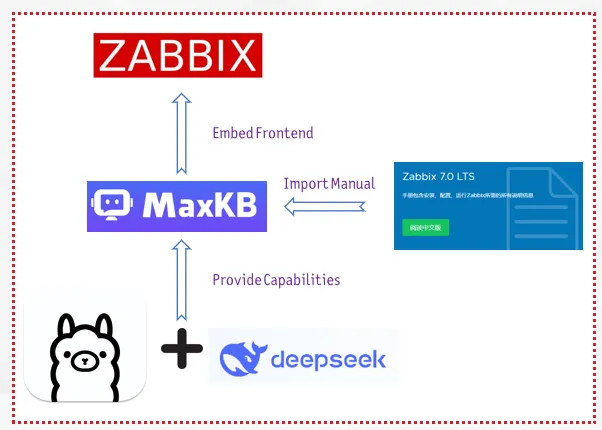
In today’s fast-paced IT environment, managing and retrieving information efficiently is crucial. To address this need, we’ve developed the Zabbix KB Assistant, an intelligent knowledge base solution built on MaxKB—an open-source Q&A system leveraging large language models.
This assistant streamlines access to Zabbix’s extensive documentation, making it easier than ever for users to find the information they require.
MaxKB stands out for its seamless integration capabilities, allowing for quick uploads of documents and automatic crawling of online content.
Its flexibility means it can be effortlessly embedded into third-party systems, including our very own Zabbix platform. The project is available at the GitHub repository.
The development process of Zabbix KB Assistant involved configuring MaxKB to recognize and parse the official Zabbix documentation. By utilizing this URL, we ensured that the latest updates and comprehensive guides are always accessible within our assistant. After setting up the core model configurations, we created a dedicated knowledge base tailored to Zabbix’s rich content.
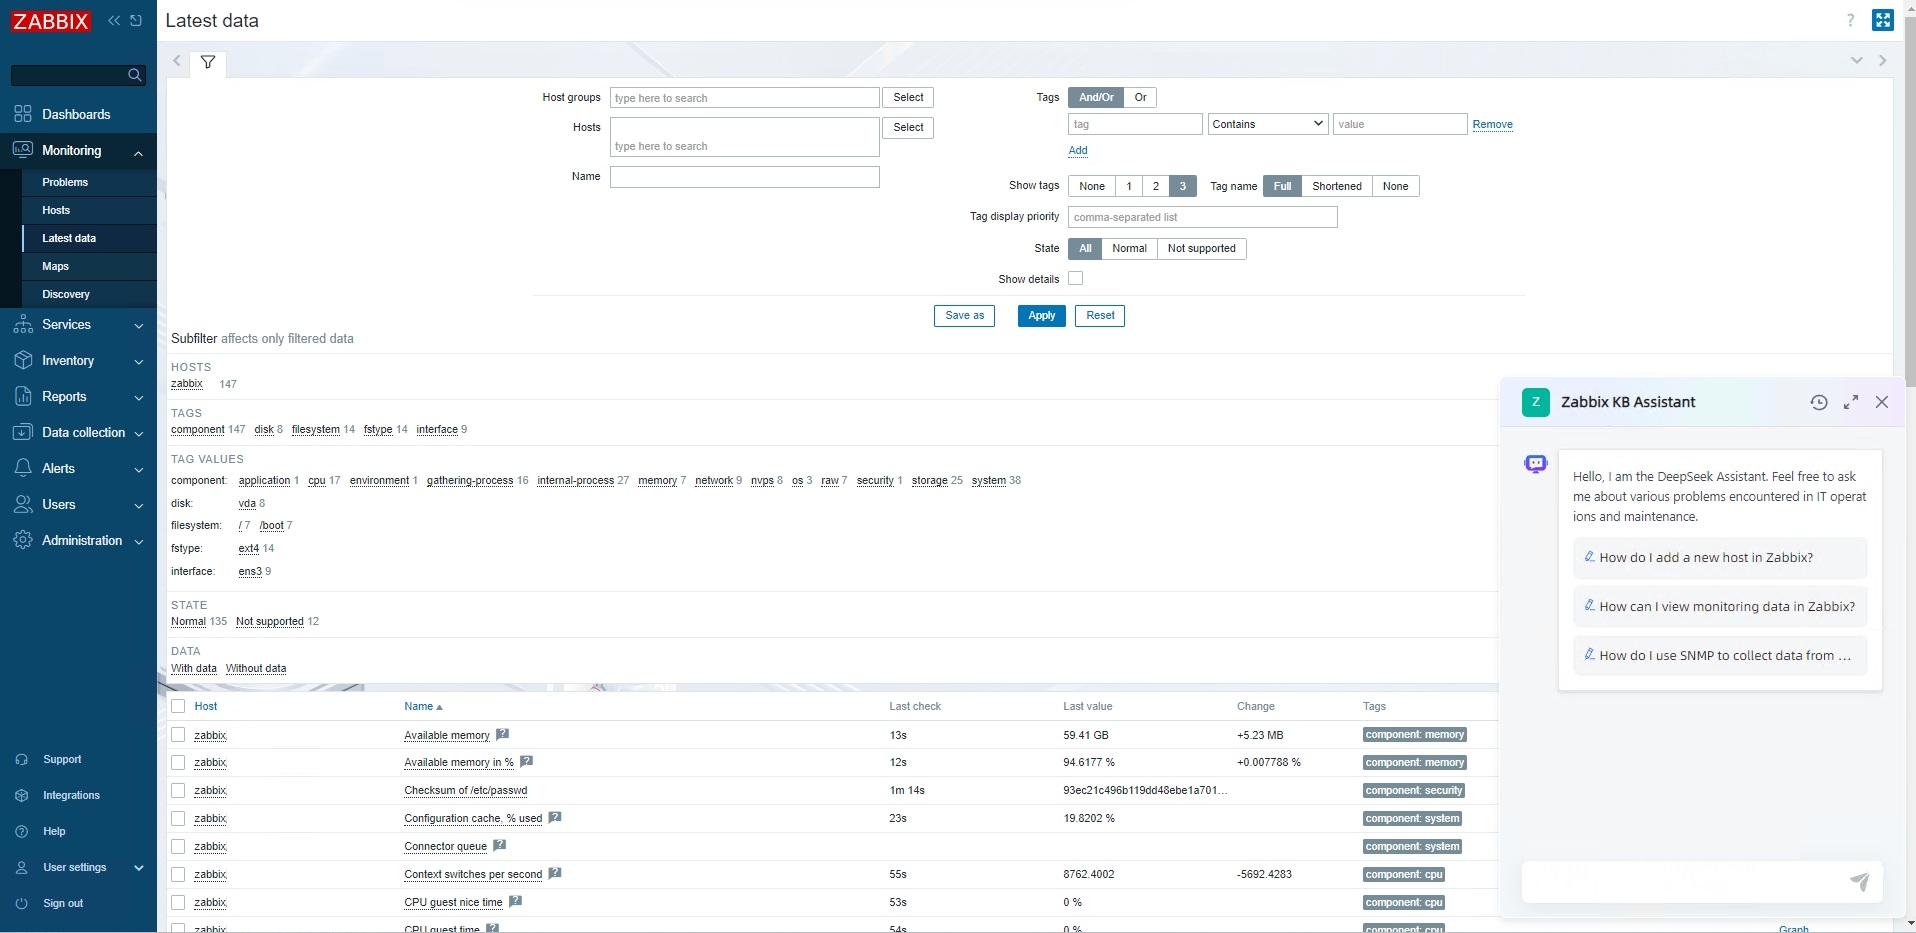
With the knowledge base in place, we proceeded to integrate Zabbix KB Assistant into the Zabbix frontend. This step was essential for providing instant access to users navigating the Zabbix interface. By embedding a floating window mode, users can interact with the assistant without leaving their current page—a feature that significantly enhances user experience.
Actual effect display:
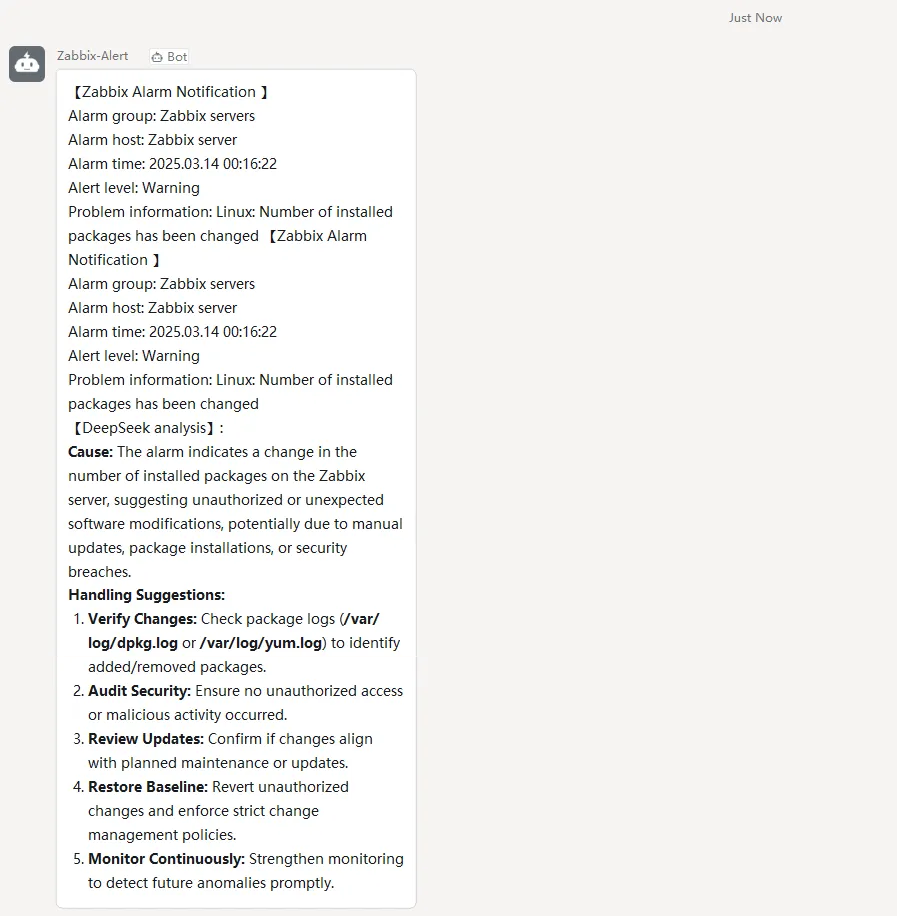
3. Scenario Three: DingTalk Alert Enhancement
By integrating DeepSeek’s deep analysis capabilities, DingTalk can automatically analyze alarm information upon receiving alerts. This integration provides precise fault diagnosis and solutions, aiding IT operations and maintenance personnel in quickly identifying and resolving issues. Consequently, this improves the efficiency of system maintenance and reduces downtime.
3.1 Create a Bot and Configure Security Settings.
First, create a new bot within the DingTalk group and ensure that the keyword “Alarm” is properly configured in the security settings. Next, retrieve the webhook URL for this bot and keep it safe for later use.
3.2 Install Python3 and Necessary Libraries.
Ensure that Python3 along with the required libraries are installed on your system. Depending on your operating system, follow these instructions.
3.3 Below is an example script (deepseekdingding.py) located at /usr/lib/zabbix/alertscripts/.
Replace the placeholder webhook URL and DeepSeek API key in the script with your actual values:
#!/usr/bin/env python3
#coding:utf-8
import requests
import sys
import json

class DingTalkBot(object):
    # Send an alarm
    def send_news_message(self, webhook_url, subject, content, ai_response):
        url = webhook_url
        data = {
            "msgtype": "markdown",
            "markdown": {
                "title": subject,
                "text": f"{subject}\n{content}\n\n【DeepSeek analysis】:\n\n{ai_response}"
            }
        }
        headers = {'Content-Type': 'application/json'}
        response = requests.post(url, headers=headers, data=json.dumps(data))
        return response

if __name__ == '__main__':
    WEBHOOK_URL = 'https://oapi.dingtalk.com/robot/send?access_token=224c1ff0c6df60a809b3c5b69b8448486b780d292e9d395ac8fbf84980214e30'  # Webhook
    API_URL = 'https://api.deepseek.com/chat/completions'
    API_KEY = "xxxxxxxxxxxxxxxxxxxx"  # DeepSeek API

    if len(sys.argv) < 3:
        print("Error: Not enough arguments provided.")
        sys.exit(1)

    subject = str(sys.argv[1])
    content = str(sys.argv[2])

    print(f"Received subject: {subject}")
    print(f"Received content: {content}")

    try:
        headers = {
            'Authorization': f'Bearer {API_KEY}',
            'Content-Type': 'application/json',
        }
        payload = {
            "model": "deepseek-chat",  # DeepSeek
            "messages": [
                {"role": "user", "content": f"If you are a professional IT operation and maintenance expert, please tell me the cause of these alarms and handling suggestions in a concise and professional language with a word limit of 100 words{content}"}
            ]
        }
        ai_response = requests.post(API_URL, headers=headers, json=payload)
        ai_response.raise_for_status()
        ai_response_content = ai_response.json().get('choices', [{}])[0].get('message', {}).get('content', '')
    except Exception as e:
        ai_response_content = "\nThe interface call timed out or an error occurred. Please check the configuration and try again"

    bot = DingTalkBot()
    response = bot.send_news_message(WEBHOOK_URL, subject, content, ai_response_content)

    if response.status_code == 200:
        print("successfully")
    else:
        print(f"failed: {response.text}")
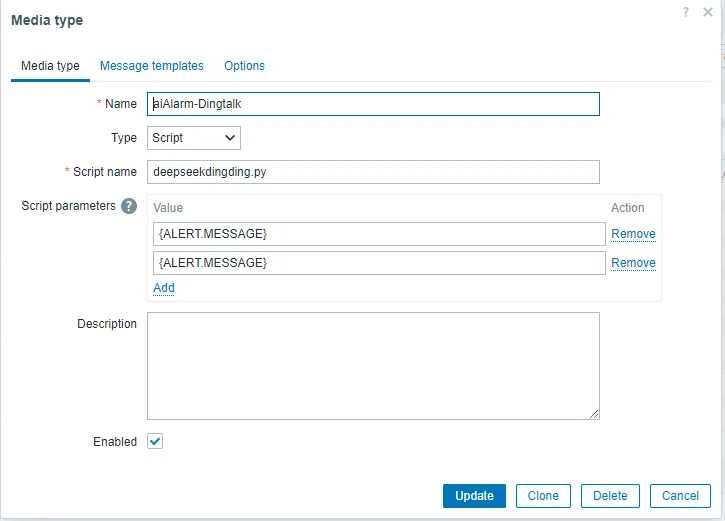
3.5 On the Zabbix home page, go to Alerts – Media types – Create Media type and then enter the following information:
Name: aiAlarm-Dingtalk
Type: script
Script name: deepseekdingding.py
Script parameter: {ALERT.MESSAGE} {ALERT.SUBJECT}
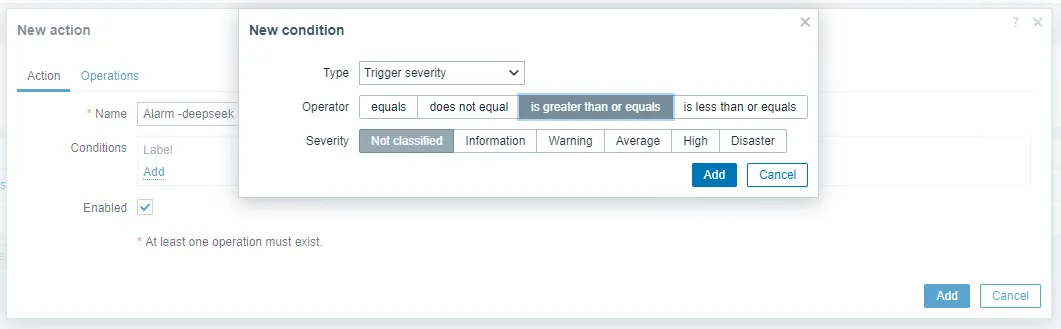
3.6 Create an alarm action.
Go to Alarm – Action – Trigger actions – Create action and set the name to Alarm -deepseek. Select this parameter as required:
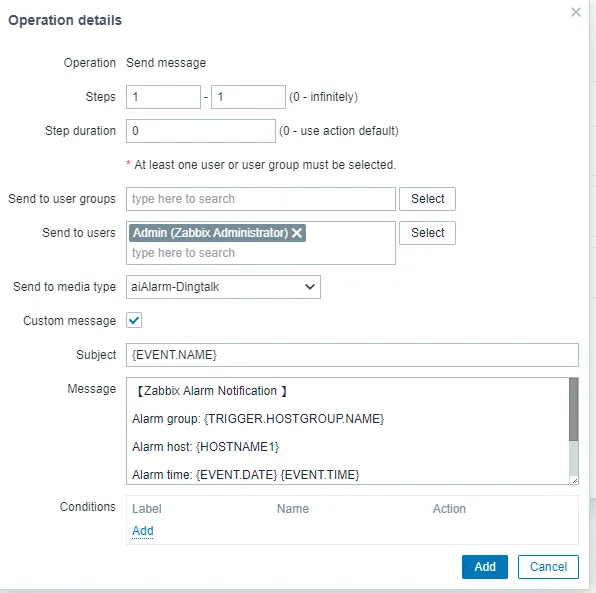
Edit the action options as follows:
Send to media type aiAlarm-Dingtalk
Topic fault alarm: {EVENT.NAME}
message
【Zabbix Alarm Notification 】

Alarm group: {TRIGGER.HOSTGROUP.NAME}

Alarm host: {HOSTNAME1}

Alarm time: {EVENT.DATE} {EVENT.TIME}

Alert level: {TRIGGER.SEVERITY}

Problem information: {TRIGGER.NAME}
Confirm the update.
3.7 Configure notification rights for users.
The following item is added to the “User-User-Alarm” media dialog box. Once added, click Update.
Actual effect display:
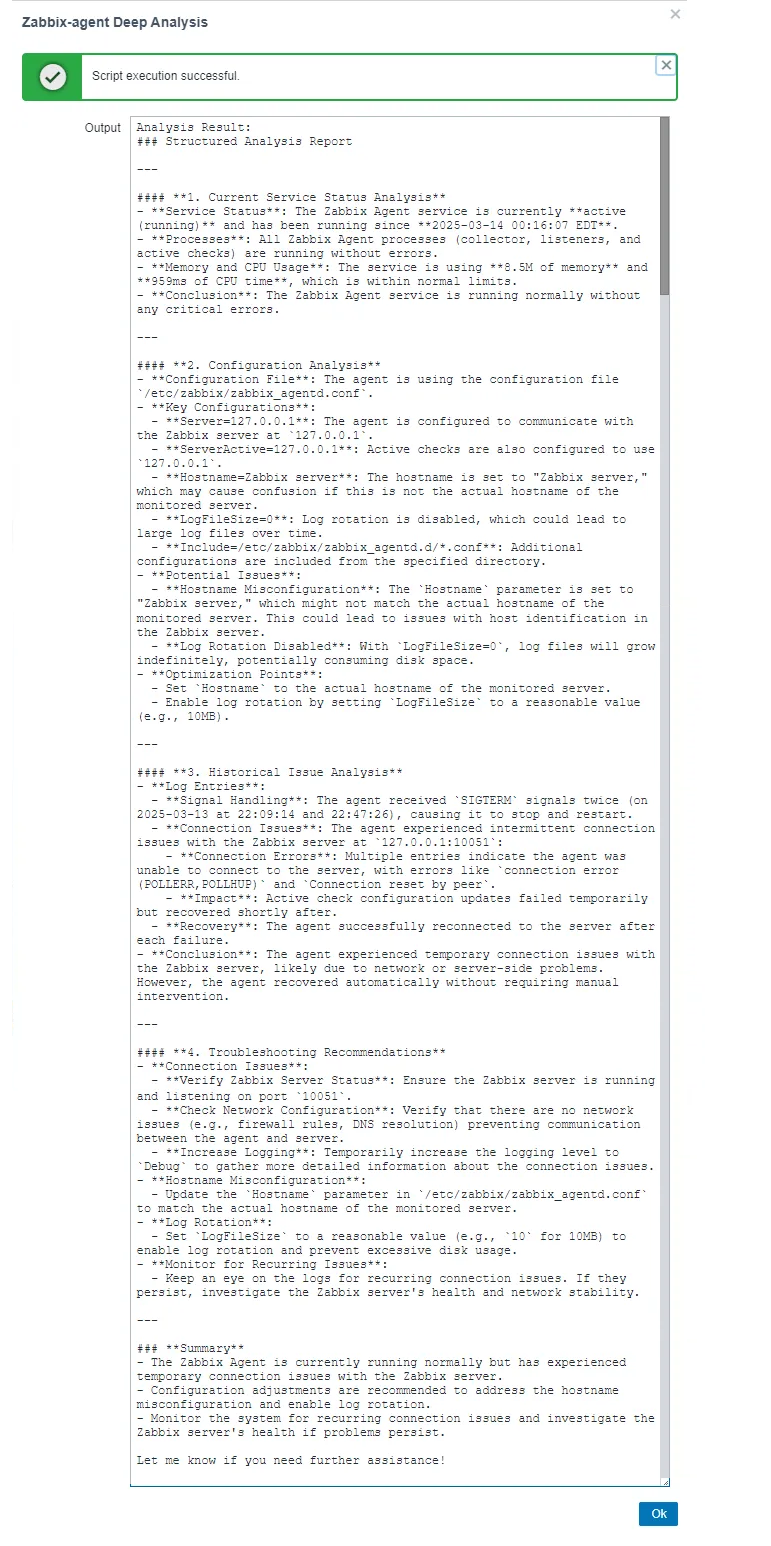
4. Scenario Four: One-Click System Service Deep Analysis
Our solution integrates DeepSeek analysis to offer a one-click intelligent inspection tool that automates the collection of service configurations, logs, and status from within your system. This information is then sent via API to DeepSeek for comprehensive analysis.
Our approach begins by extracting relevant configuration data, recent log entries, and current service statuses. These pieces of information are combined with predefined prompts and submitted to DeepSeek through its API. For instance, a prompt might look like this:
“Here are the current logs for XXX service:\n\n${recent_logs}\n\nService. Status is as follows:\n${service_status}\n. Please analyze the following four aspects based on this information and provide a concise report within 500 words: service status analysis, configuration review, historical issue examination, and troubleshooting recommendations.”
DeepSeek processes this input to perform a detailed breakdown across these four areas, delivering structured feedback and actionable insights.
This integration offers deep system analysis and precise optimization suggestions, enabling swift responses to system changes or anomalies. It aids administrators in promptly identifying and addressing issues.
In addition, it’s easily integrated into existing monitoring systems, allowing adjustments to the depth and scope of analysis as needed. The solution boasts high scalability and flexibility, catering to evolving business requirements.
When monitoring environments, we sometimes need to rely on third-party tools to better manage functionality and optimize responses to alerts. Let’s explore how to integrate Zabbix with PagerDuty, a real-time incident management solution designed to improve the reliability of digital services, including best practices and configuration details.
Table of Contents
What is PagerDuty?
PagerDuty is a real-time incident management platform designed to help IT teams react quickly to critical events. The tool helps organizations automate and manage incident response through a system of alerts, escalation, and coordination between teams. When a problem is detected in the system, PagerDuty notifies the responsible individuals and ensures that corrective action is taken quickly. This reduces downtime and improves operational efficiency. Integration with monitoring tools such as Zabbix makes it easy to identify issues before they impact users.
Some of PagerDuty’s key features include:
• Integration with monitoring tools (such as Zabbix)
• Notifications in multiple channels (email, SMS, calls)
• Automatic escalation of incidents to ensure agile responses
• Event analysis to improve the detection of recurring problems
How to integrate PagerDuty with Zabbix
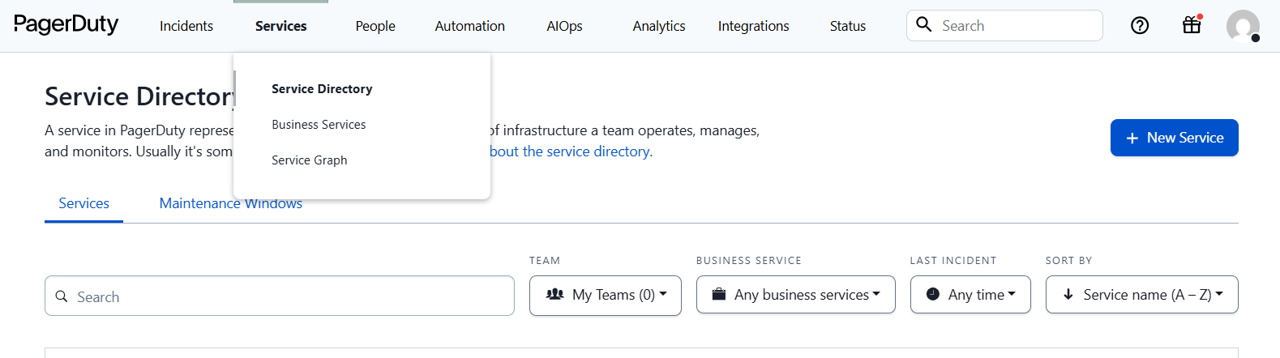
In PagerDuty, go to “Services” and click on “Service Directory.” Create a new service.
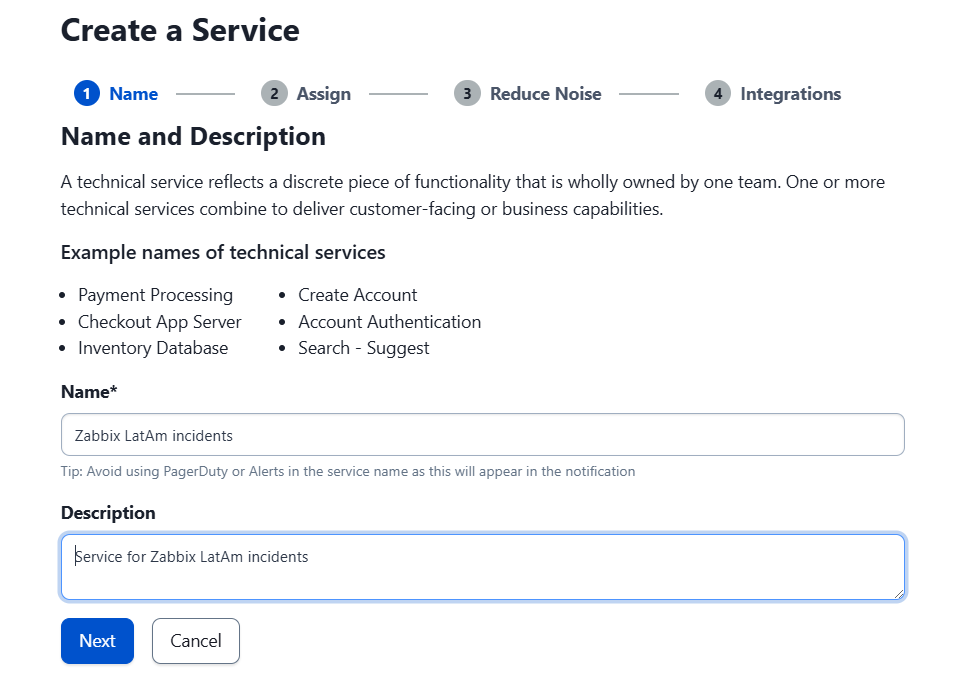
Give it a proper name and description.
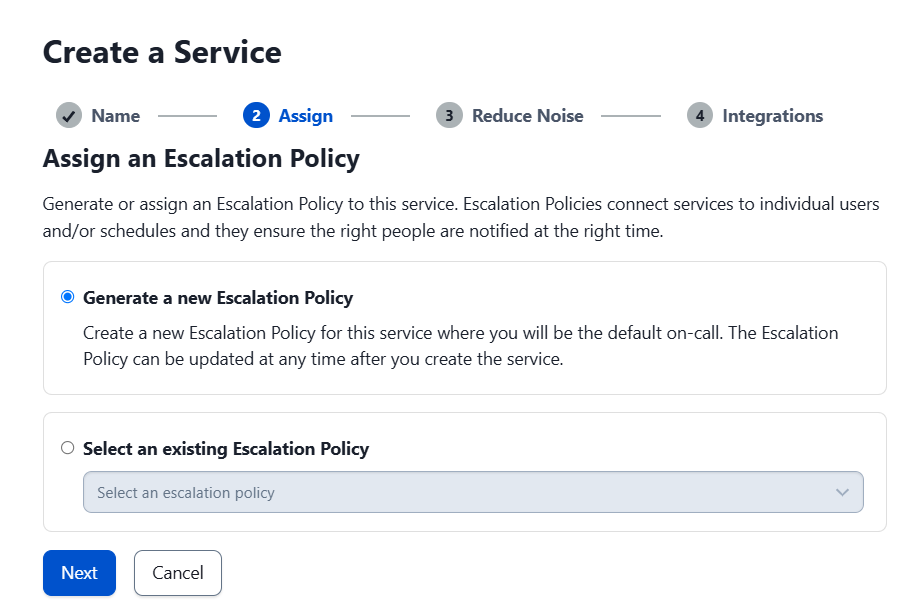
Accept the escalation terms and click “Next.”
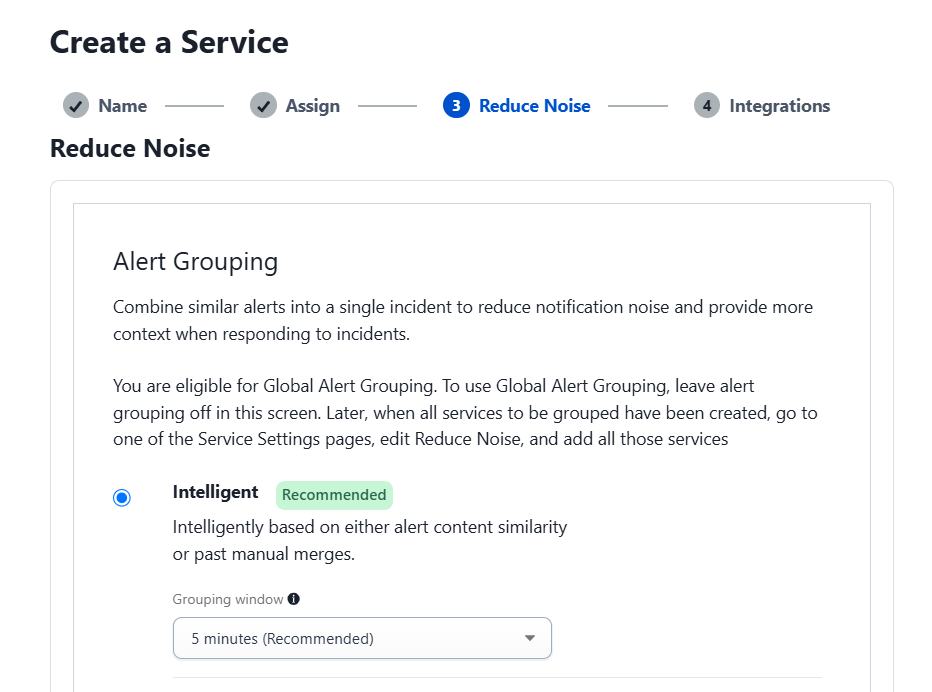
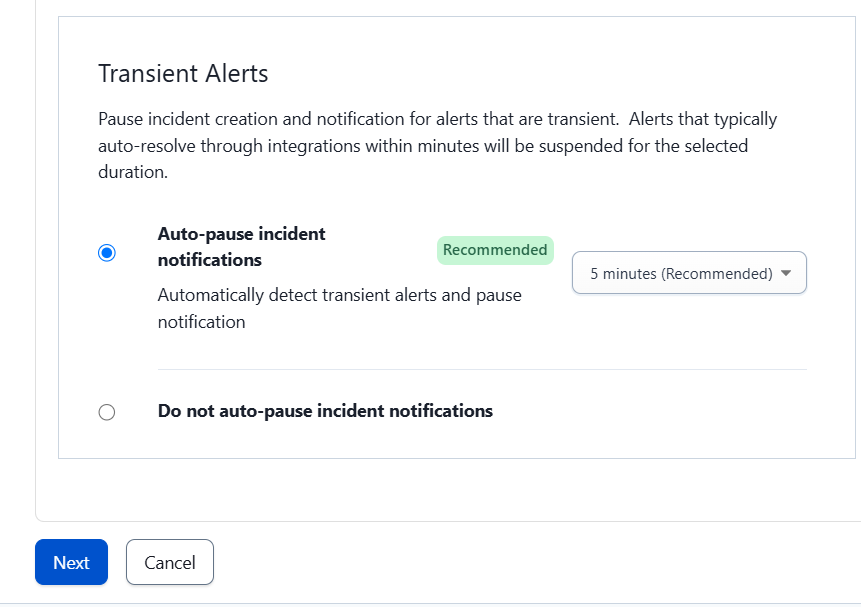
On the next screen, select “Intelligent” and the “Auto-pause incident notifications” option, then click “Next.”
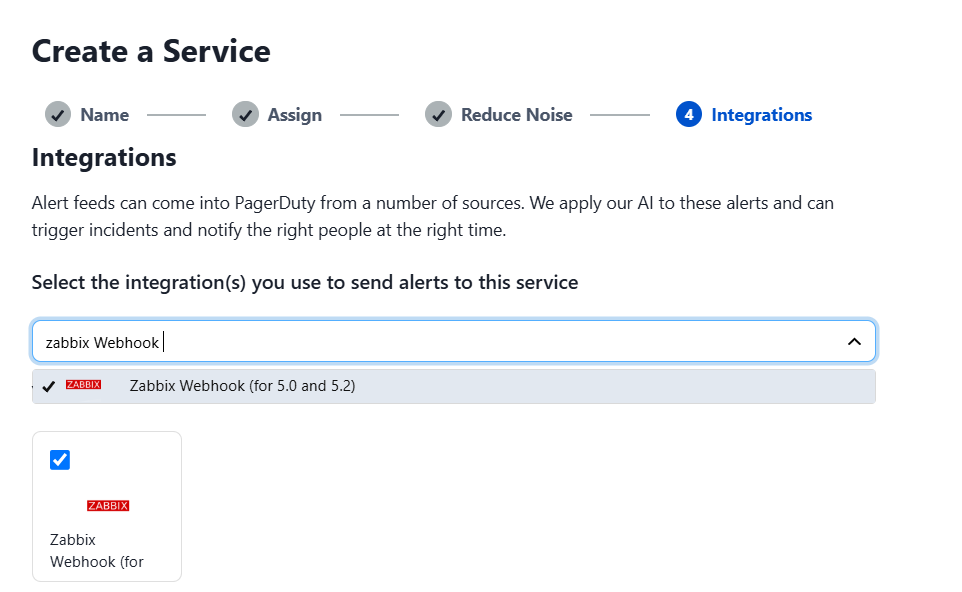
The next step is to add the Zabbix Webhook service, which will allow integration with Zabbix, and then click “Next.”
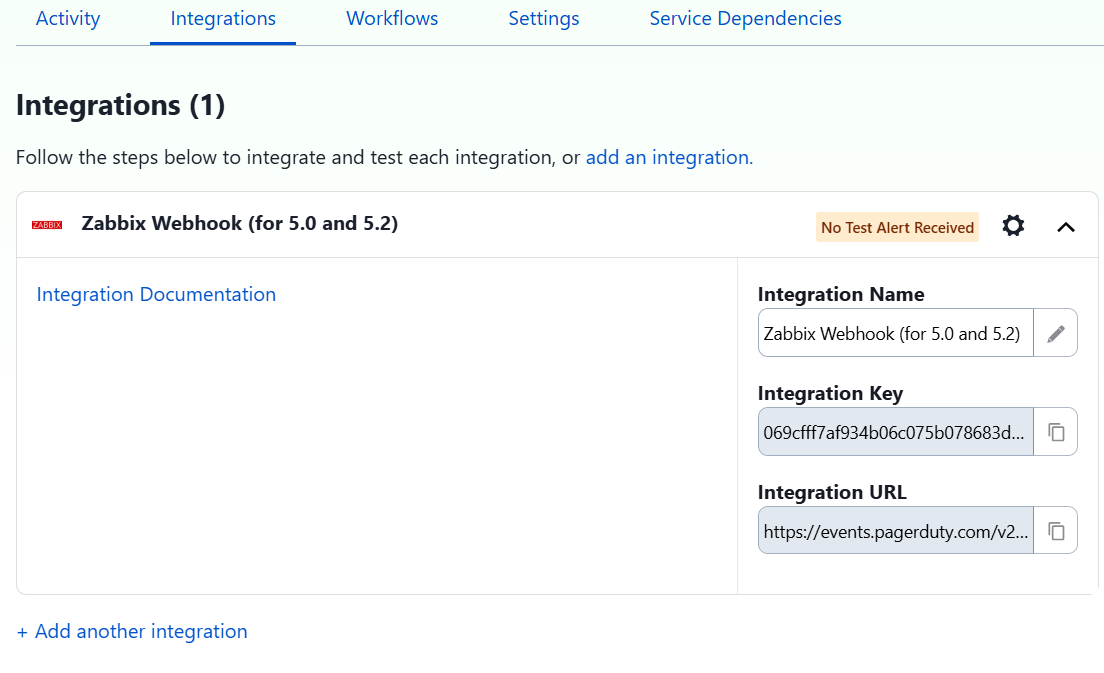
In Services > Service Directory, select the name of the service. In the “Integrations” tab, copy the integration token that is generated.
It is important to note that the PagerDuty webhook only shows the option of Zabbix versions 5.0 to 5.2, but it works correctly in later versions such as Zabbix 7.2, which was tested without any issues.
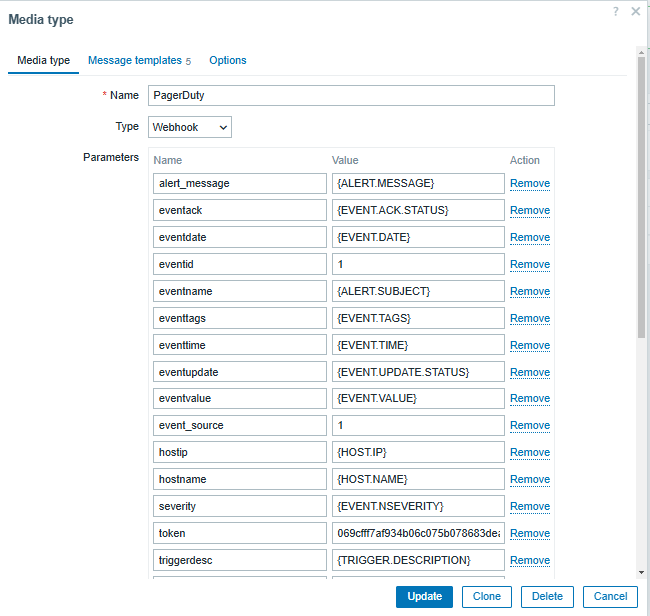
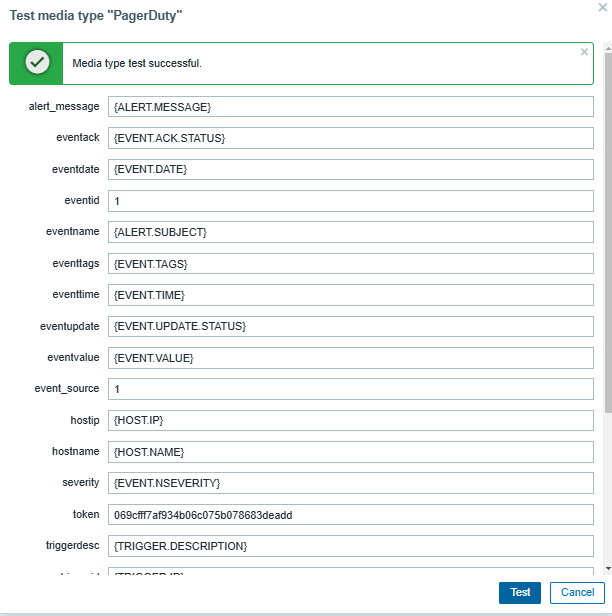
On Zabbix Server, go to Alerts > Media types > PagerDuty. Enter the integration token, the Zabbix URL, and select “Update.”
Send a test message to confirm that the integration is working correctly.
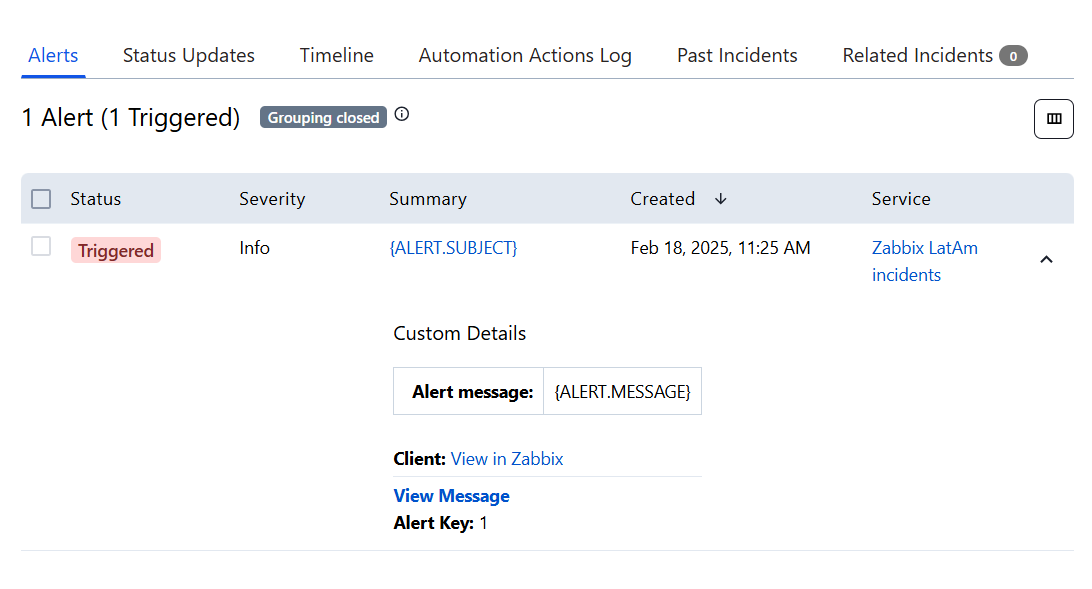
In the PagerDuty application, verify that the test alert was received.
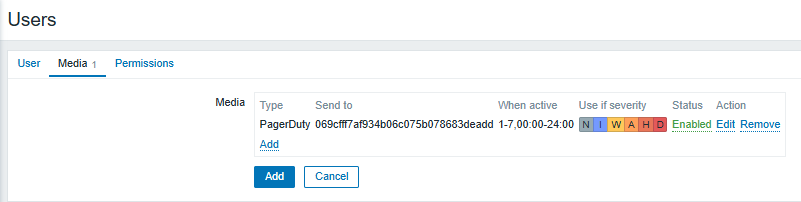
To send notifications, you need to grant permissions to a user in Zabbix. Go to Users > Create User. In the “Media” tab, select PagerDuty as the notification method. Set the severity of the alerts you want to receive.
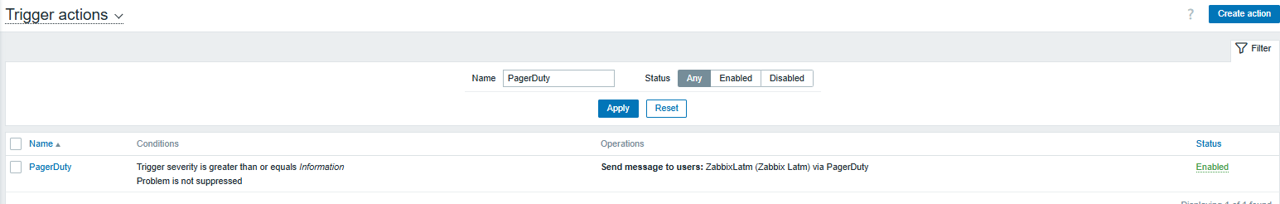
Subsequently, set up a Trigger Action in Alerts > Actions > Trigger Actions to define what types of alerts will be received (either by item or trigger) according to the needs of your team.
Best practices for integrating Zabbix and PagerDuty
• Customize notifications: Set rules to send only truly critical alerts, avoiding unnecessary notifications.
• Optimize escalations: Set up escalation rules so that alerts reach the right people at the right time.
• Monitor key metrics: Measure incident response times and adjust workflows as needed.
• Automate incident responses: Use PagerDuty’s capabilities to perform automated tasks in response to specific events.
• Notify about service failures: Use PagerDuty to start running recovery scripts, send notifications to the responsible teams, or even escalate the problem to a higher level if there is no solution in a stipulated length of time.
Conclusion
Zabbix’s integration with PagerDuty allows you to monitor the status of critical services in real time, even outside of working hours. This facilitates rapid incident response and improves your IT team’s ability to react.
This combination not only optimizes incident management but also helps minimize downtime, improve operational efficiency, and ensure the reliability of monitored systems.
With proper configuration and best practices, integrating Zabbix with PagerDuty can become essential for the proactive management of your technological infrastructure.
One of the great advantages of Zabbix is its extensible and modular architecture. This allows the platform to be enhanced with third-party modules, significantly expanding its functionalities without compromising the stability of the core system. The ECharts-Zabbix module is an excellent example of this flexibility in action.
Table of Contents
What is the ECharts-Zabbix module?
ECharts-Zabbix is a module that adds customizable widgets to Zabbix, using the ECharts library to create interactive and dynamic visualizations of your monitoring data. This module complements Zabbix’s standard visual capabilities, enabling richer and more informative graphical representation of complex monitoring environments.
What are the key features available with ECharts in Zabbix?
By integrating ECharts and Zabbix, you gain access to:
Multiple chart types (line, bar, pie, gauge, scatter, heatmap, and more)
Complete customization of colors, styles, legends, and tooltips
Fluid animations for a better user experience
Compatibility with Zabbix light and dark themes
Direct integration with data without the need for external tools
Responsive visualizations that adapt to different screen sizes
Helper functions for data formatting and dynamic color generation
Installation and configuration
Installing modules in Zabbix is easy thanks to the platform’s flexibility:
Extract the files to the modules folder of your Zabbix server
In the Zabbix frontend, go to Administration > General > Modules
Find the ECharts-Zabbix module in the list and click “Enable”
The widget will be available for use in Zabbix dashboards and screens
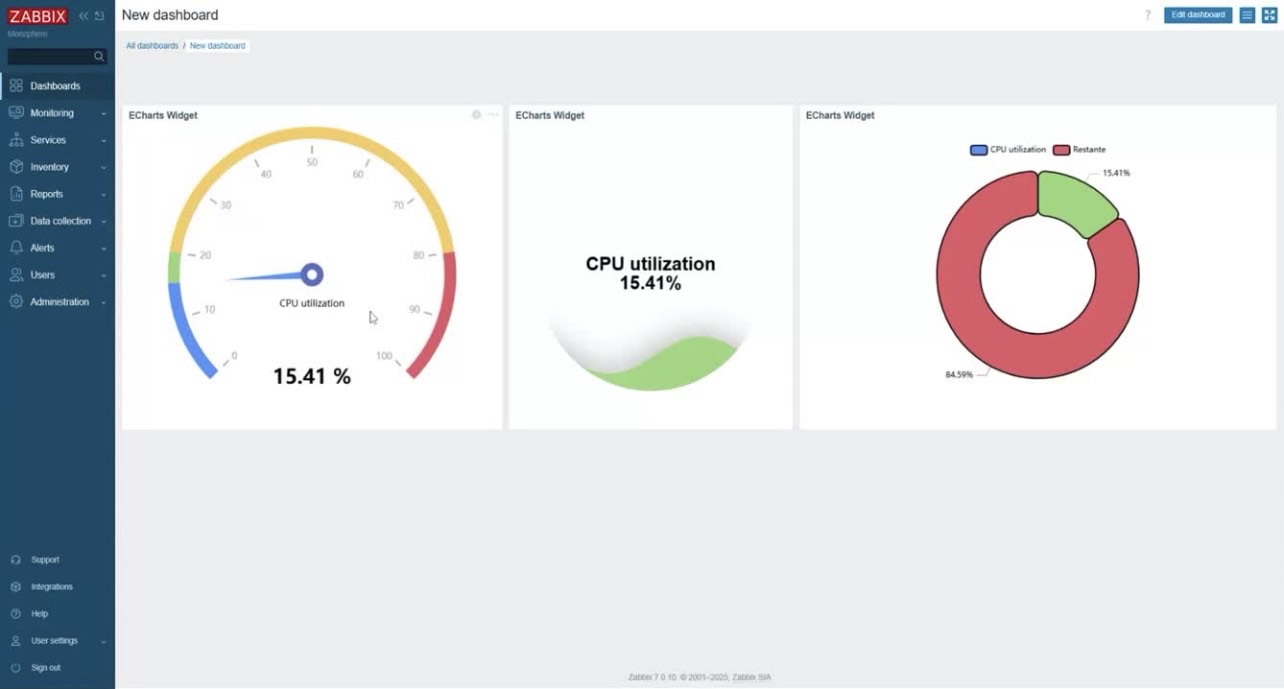
Practical use cases
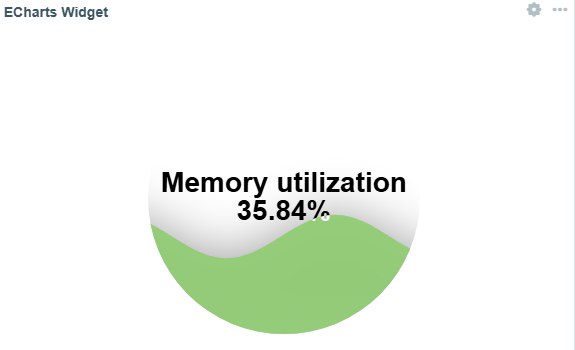
Server performance monitoring with Gauge charts
Gauge charts are ideal for visualizing metrics such as CPU, memory, and disk usage. The flexibility of Zabbix combined with ECharts allows you to create impressive visual panels that clearly show the current state of these metrics:
Zabbix has a growing ecosystem of modules and integrations, developed by both the community and specialized companies like Monzphere, which contributes the ECharts-Zabbix module. This development dynamic demonstrates how Zabbix has evolved to become a truly extensible platform.
To learn more about the ECharts-Zabbix module and other solutions for Zabbix, you can visit our official GitHub repository or Monzphere’s website.
Conclusion
Zabbix’s modular architecture is one of its greatest differentiators, allowing the platform to grow and adapt to the specific needs of each monitoring environment. The ECharts-Zabbix module is an excellent example of how this flexibility can be leveraged to transform the data visualization experience in Zabbix.
For modern monitoring environments where clear and effective data visualization is essential, the combination of Zabbix with specialized modules represents a complete and adaptable solution. Try expanding your Zabbix with the ECharts module and discover how it can transform your monitoring dashboards!
One of the most critical clients of our Premium Partners at the ATS Group is a large MSP that acts as a service and administration platform for their own clients, providing them with hardware, software, engineers, support staff, metrics, and reporting.
The challenge
The MSP needed a stable, high-performance platform monitoring solution that would cover all the services they provided. They didn’t have the capabilities or budget to run multiple monitoring solutions – a single, flexible solution that could track every service was paramount, as was the ability to react to anomalies before they became serious problems.
After an initial trial with a different monitoring solution that was notable for poor service, a lack of integrations, no community, and almost no documentation, they took a closer look at Zabbix, thanks in large part to our focus on preventative action and automation.
The solution
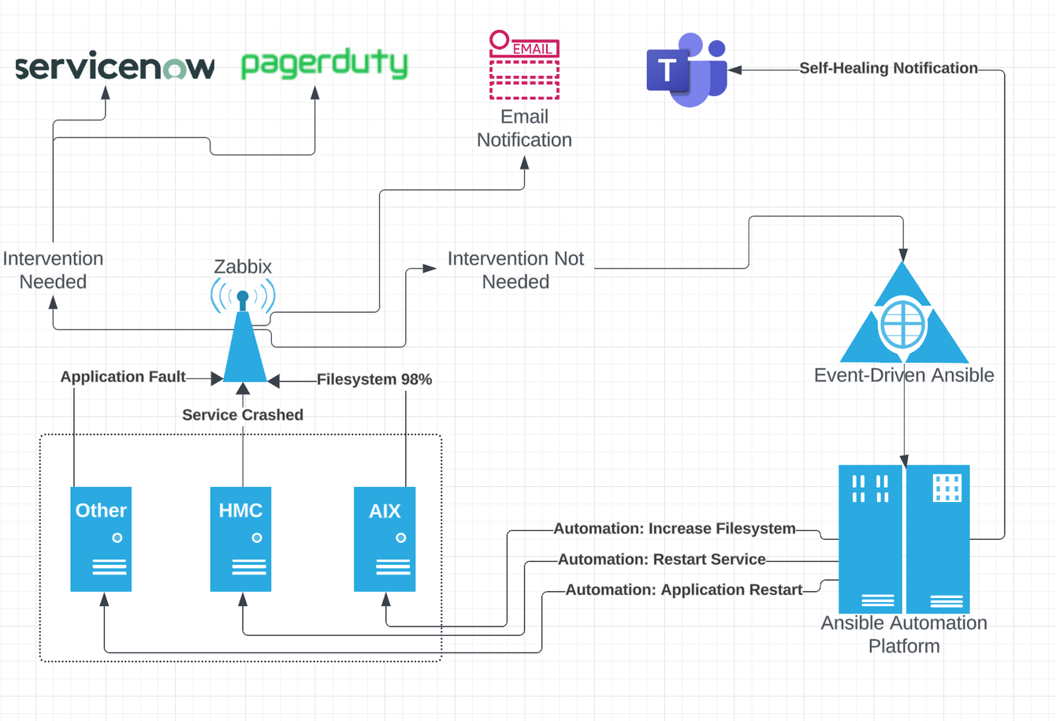
Because of their focus on performance-based monitoring, the client went with a “hot-cold” architecture and an integration with Ansible EDA, which stands for Event-Driven Ansible. It turned out to be a true “force multiplier”, as using Zabbix, Ansible, and EDA together allowed the MSP to monitor their systems, automate tasks based on real-time events, and provide immediate responses to issues without manual intervention.
The integration was designed to sort issues by whether or not they were able to be automated. If an issue arose that required human intervention, alerts could be sent to ServiceNow via multiple channels. If human intervention was unnecessary, the issue was rerouted to Event-Driven Ansible, which runs automation on all monitored hosts.
For example, with the joint Zabbix/Ansible solution, a slash admin backstage management system filling up at 2AM because of an overflowing log file for some script is no longer an urgent issue. If there are multiple gigabytes of room in the volume group, Zabbix can tell Ansible it’s a problem. Ansible can then increase the file system by 25% and send a message letting the engineers know in the morning that they took action on their behalf.
The results
With essentially no software costs and an automation integration that can find issues and fix them independently, the MSP was able to rapidly achieve a much higher service-to-spend ratio than they’d ever imagined possible.
There has been a noted increase in employee satisfaction as well – thanks to automation, engineers no longer have to be “on call” at all hours to solve simple issues, while C-level executives have seen productivity skyrocket thanks to the joint solution’s ability to find potential issues before they become real problems.
In conclusion
At Zabbix, we work hard to stay on the forefront of automation. That means constantly improving our own product while also staying on top of new technologies like Event-Driven Ansible in order to better integrate with them. To learn more about what Zabbix can do for MSPs, visit us here.
Zabbix is dedicated to monitoring IT infrastructures based on predetermined thresholds, such as servers, networks, and applications. Incorporating artificial intelligence (AI) into Zabbix as a complement allows a user to mitigate alerts based on these predetermined thresholds, offering possible causes and solutions to problems. This can help a user resolve incidents more efficiently.
In this article, we will explain how to integrate Zabbix and Google’s AI tool Gemini by using the API provided as well as a custom widget alternative.
First steps towards integration
You can find the repository in GitHub based on the Google Gemini model. You’ll need to create an account in Google AI Studio to obtain the required API.
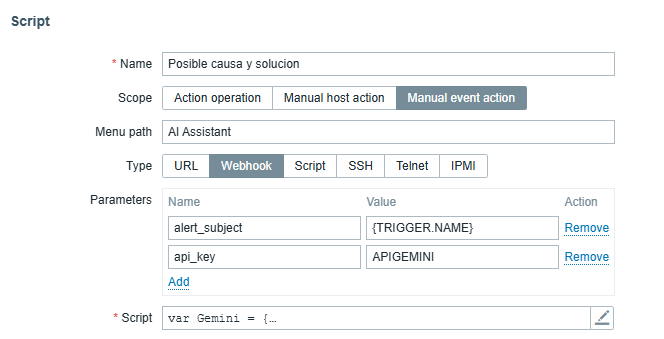
Script configuration in Zabbix
From Zabbix version 7.0, access:
“Alerts” > “Scripts” > “Create Script.”
For this functionality, we designated the name as “Possible cause and solution.” Next, we can configure the parameters with the trigger event and the API generated in AI Studio. We then copy and get the script from the repository mentioned in the «Script» field, as in the following image:
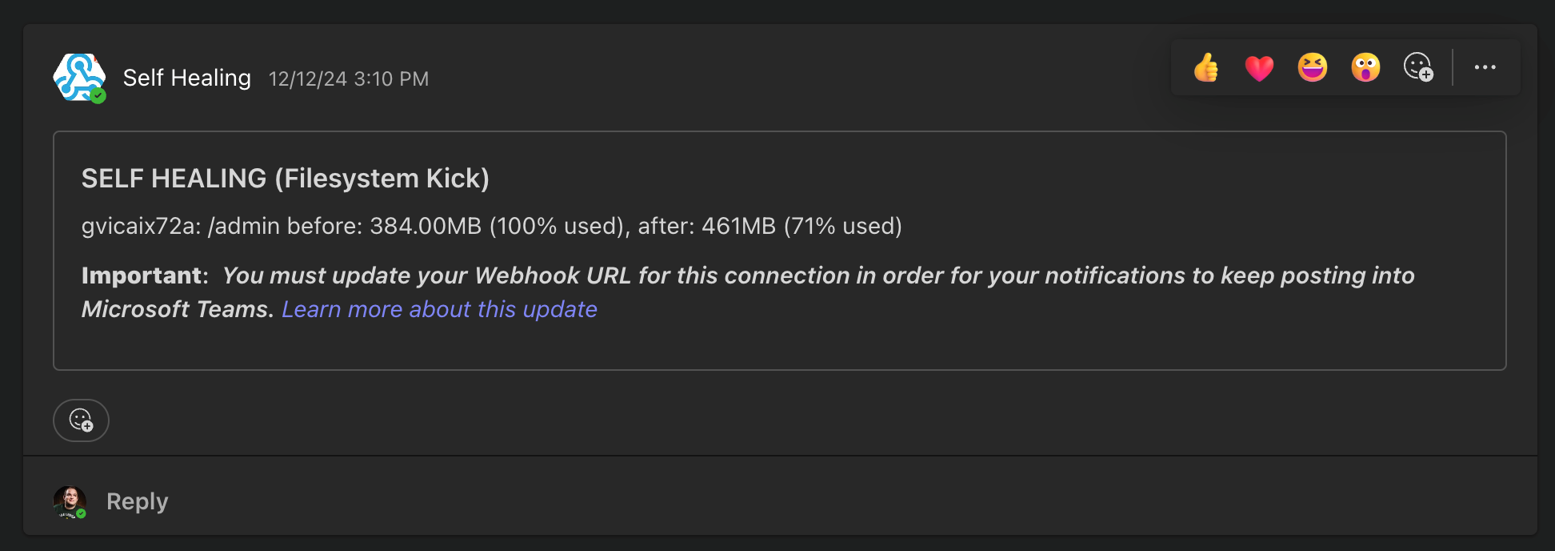
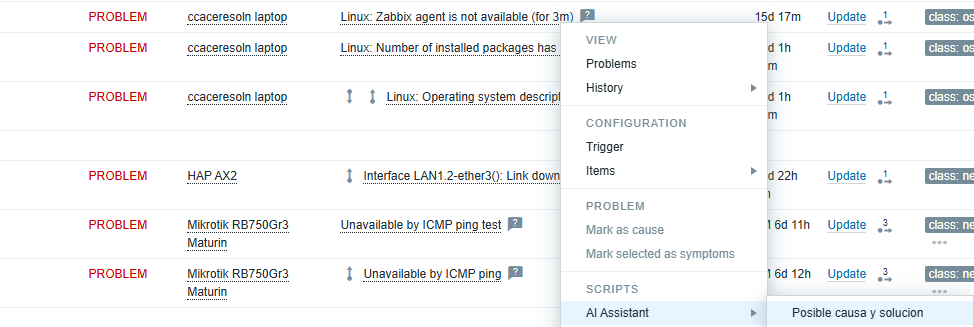
Application in the problem panel
After configuration, we access the alerts panel and select a specific alert. We click on “AI Assistant” and access the functionality that was previously named as “Possible cause and solution.”
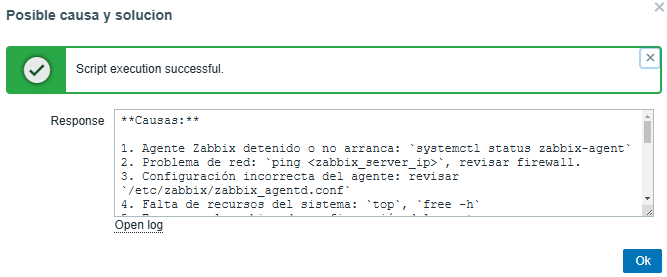
The following images present an example of an agent installed on a notebook.
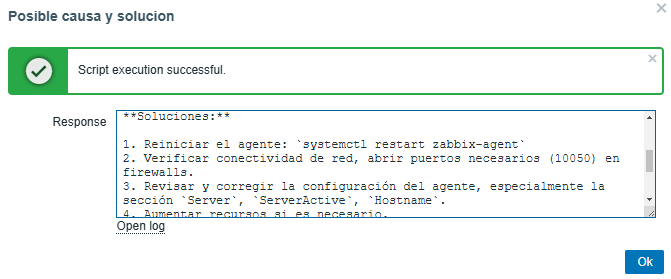
Possible cause:
Possible solution:
The AI will be able to provide a precise solution for each problem presented, allowing us to progressively optimize the predetermined thresholds.
Using the custom widget “What are you working on?”
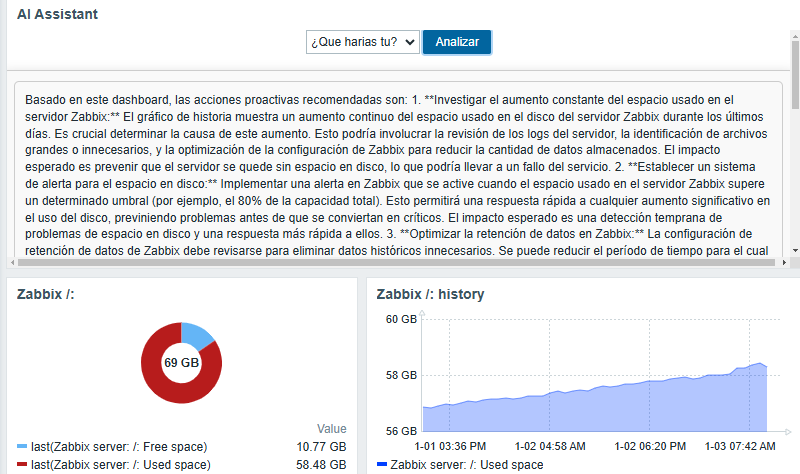
Creating accurate personalized dashboards for the user is essential.With this in mind, we propose the creation of an AI-based widget called “What are you working on?” (¿Qué harías tu? in Spanish), which analyzes the current state of the problem presented in Zabbix.
This concept integrates all the functionalities present in the widget (including Summary, Perspectives, Diagnosis, Comparison, and Forecast), since the used prompt can indicate whether it is necessary to make adjustments to the strategic plan or predict future trends based on the panel databuilt.
To exemplify how the “What are you working?” widget works, let’s consider the analysis of disk usage on our Zabbix Server.
The creation of personalized widgets from the official Zabbix page.
Once we have knowledge for the project, on the backend of our Zabbix Server we locate the route:
/usr/share/zabbix/widgets/
Then, we create a carpet called “insights” and copy the following repository. It is necessary to place the Gemini API in the file «assets/js/class.widget.php.js» in the field “YOUR_API_KEY.”
On the frontend, we go to “Administration” > “General” > “Modules.”
In the upper right corner, we click on “Scan Directory.”We have our widget to use:
After performing the scan, it is necessary to enable the widget, as it is disabled by default.
The importance of using AI in Zabbix
Let’s imagine a scenario with 100 monitored servers.Performance thresholds, Windows services, or other specific services can generate up to 50 weekly alerts. With the help of AI, it’s possible to reduce this number to a bare minimum, thanks to the weekly collection of possible causes and solutions.
This ground-level approach allows users to solve problems faster, but also improves overall health by minimizing necessary adjustments to the Zabbix server.
Implementing AI locally
Using a dedicated server with open source AI models like HuggingFace, it’s possible to implement the AI locally and create a database collecting the possible causes and solutions of the events.
The AI will learn from repetitive events, offering more accurate answers in the future.The analysis of possible trends can be based on the generated alerts. In this way, we can optimize our alerts and put artificial intelligence to work understanding and solving our problems.
Conclusion
The model we use is project-oriented.We are constantly evolving artificial intelligence, and we must use the model we know best. language is distinct due to the orientation of the prompts used for the answers and the learning we can provide, either by making requests to specific artificial intelligence platforms or by using it locally.
This week’s blog entry comes to us from Nyein Chan Zaw, who is based in Bangkok, Thailand and works as an Infrastructure Specialist for Green Will Solution. Read on to see how he uses his integrating a Modbus protocol with Zabbix to monitor data from temperature, humidity, and smoke sensors — and display their metrics on a Zabbix dashboard.
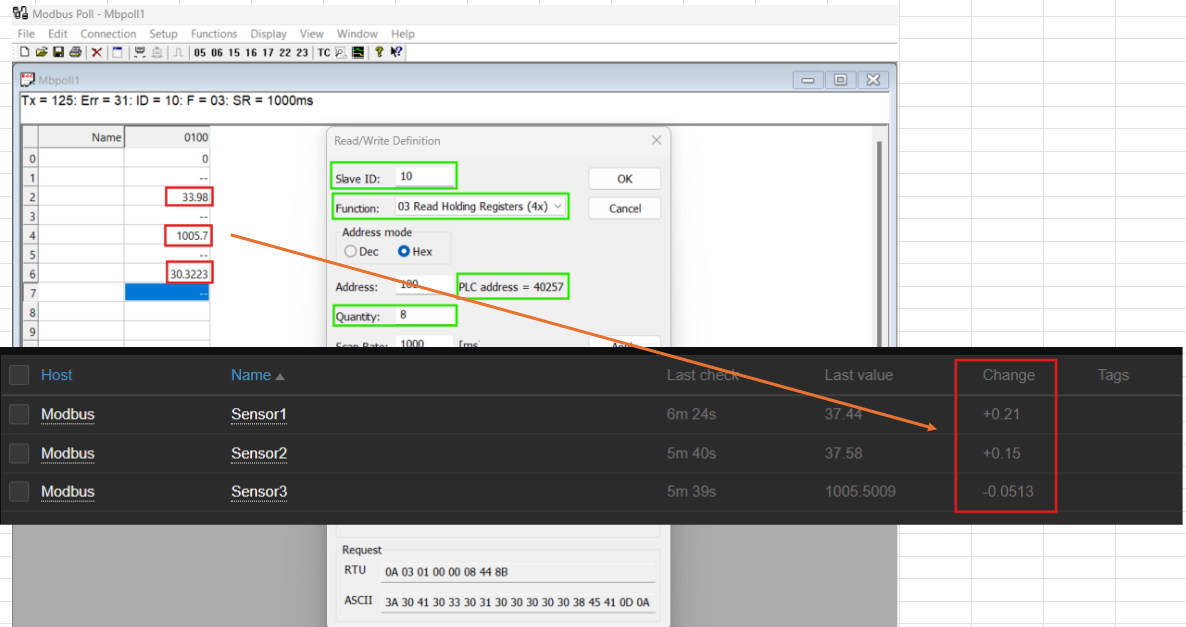
Step 1: Collecting Sensor Data via Modbus Protocol
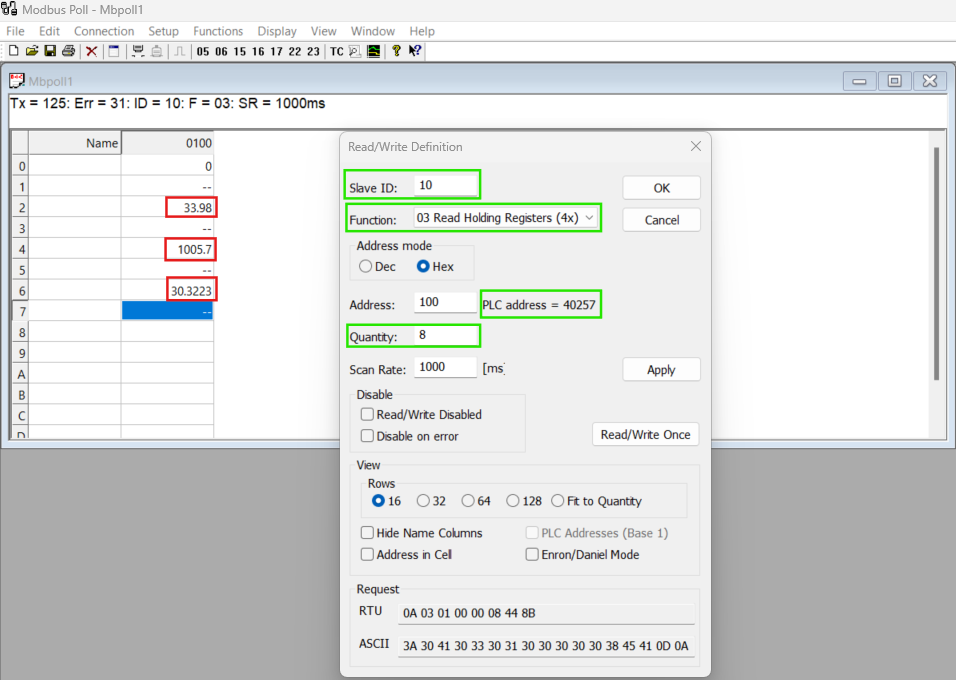
This snapshot shows how all three sensors are synchronized with the Modbus protocol, confirming that the communication is operational.
In the initial setup, the temperature, humidity, and smoke sensors transmit their data to the Modbus protocol. This data synchronization can be visualized using Modbus polling software, where the values from each sensor are displayed in real-time.
Step 2: Configuring Modbus Files on Zabbix Agent
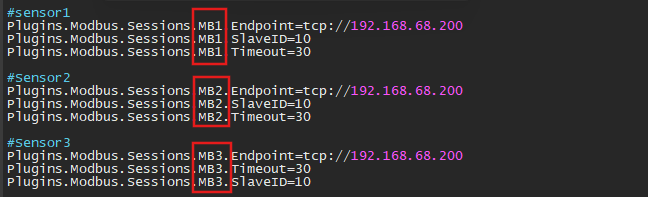
This snapshot demonstrates the configuration of three MB files corresponding to the three sensors.
To enable Zabbix to communicate with Modbus, the Modbus configuration (MB) files must be set up in the Zabbix Agent configuration file on the Zabbix server. Each sensor requires an individual MB configuration entry, specifying the Modbus parameters such as function code, register address, and data type.
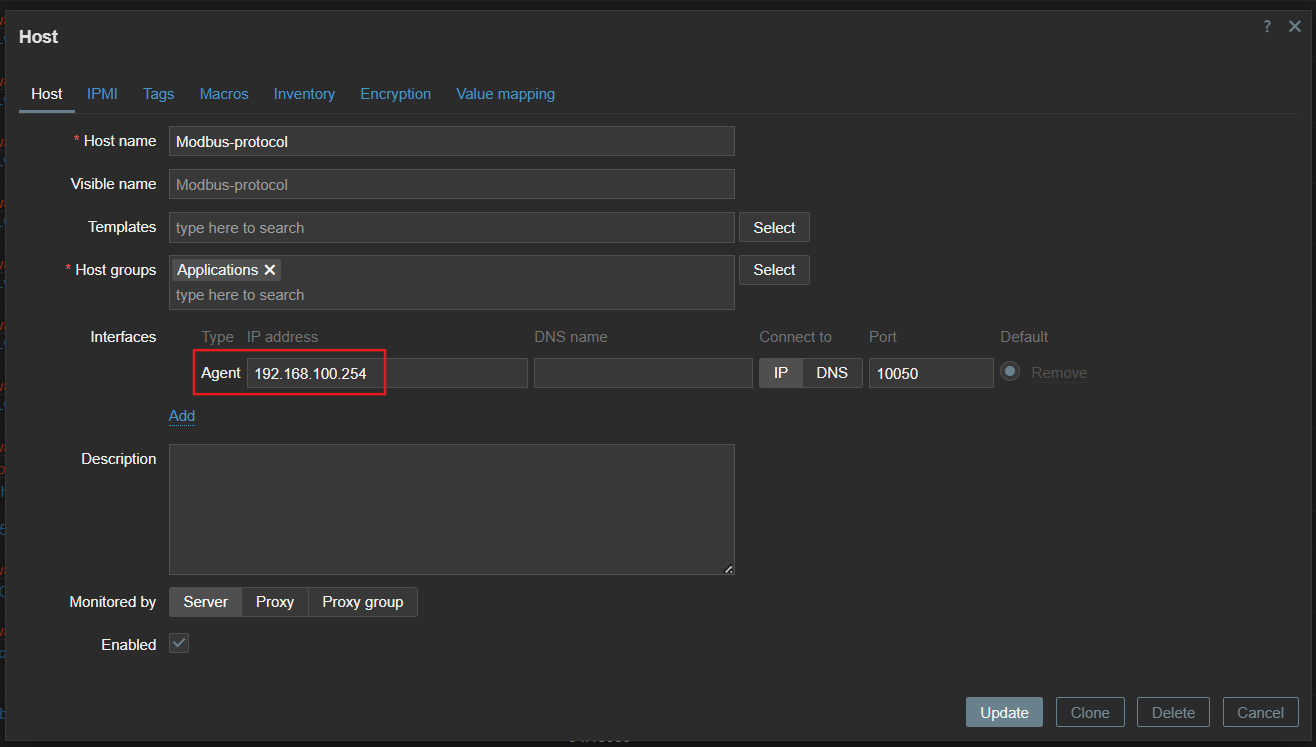
Step 3: Creating a Host for Modbus Protocol in Zabbix
Next, a Zabbix host must be created to represent the Modbus protocol device.
This snapshot highlights the host creation process with the associated IP address and configuration details.
During this process, assign the Modbus protocol’s IP address as the host’s interface. Configure the interface to communicate with the Zabbix server using the Zabbix agent.
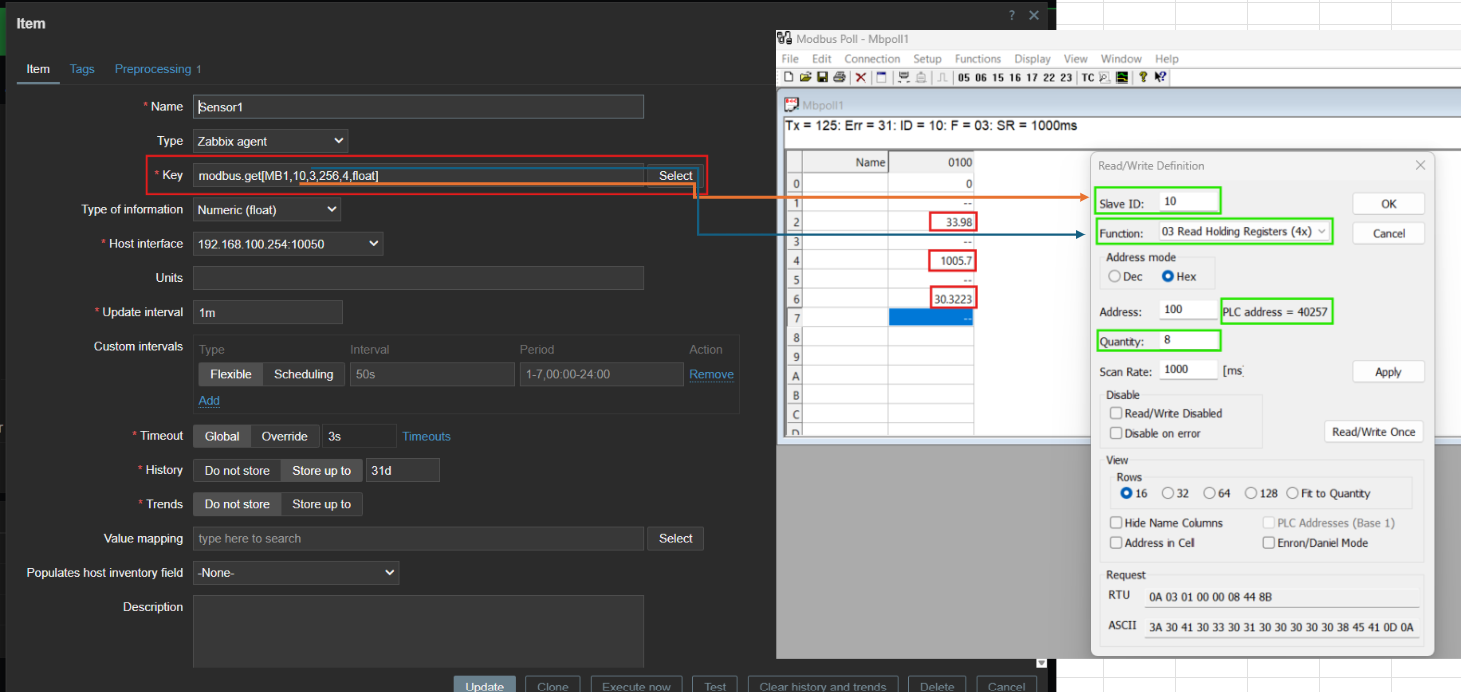
Step 4: Configuring Items for Each Sensor
Each sensor requires an item in Zabbix to capture its data.
This snapshot shows how items are configured for each sensor.
For every item, specify the Name for identification (e.g., Temperature Sensor). Define the Key, which includes the Modbus protocol function and register settings, to ensure accurate data retrieval.
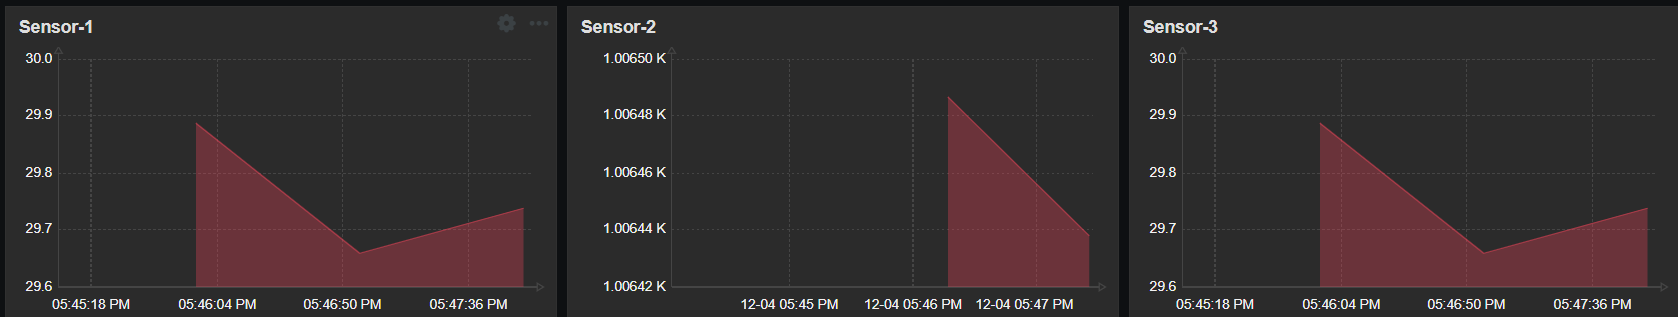
Step 5: Viewing and Utilizing Sensor Data in Zabbix
This snapshot displays the Zabbix dashboard, showcasing data from all three sensors.
Once the host and items are configured, Zabbix starts collecting data from the Modbus protocol. This data is displayed in the Zabbix interface, where metrics for temperature, humidity, and smoke are updated in real-time. Additionally, a custom dashboard can be created to visualize all three sensors’ data at a glance, providing actionable insights for monitoring and decision-making.
Conclusion
Integrating Modbus with Zabbix streamlines the monitoring of sensor data, making it easy to collect, visualize, and act upon critical metrics. This process demonstrates Zabbix’s flexibility and scalability in managing industrial protocols and data sources, ensuring robust monitoring for diverse applications.
If you’re looking to implement similar solutions or need help integrating Modbus with Zabbix, feel free to reach out in the comments below!
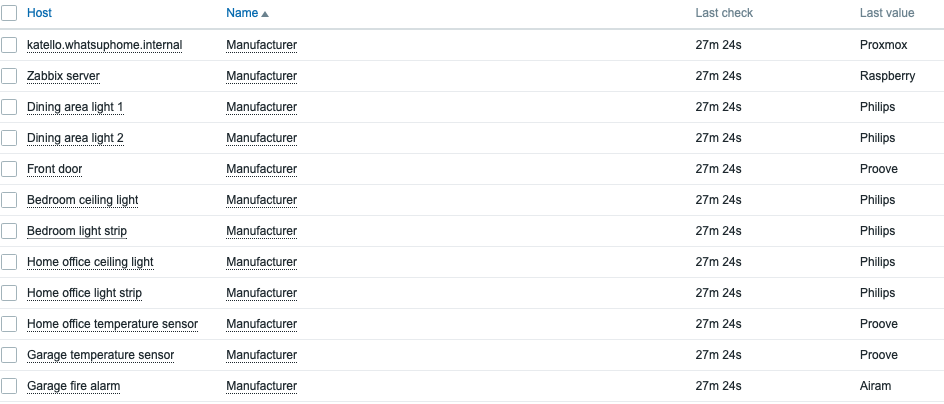
Welcome to another episode of What’s up, home? weirdness! Who wouldn’t have their own NetBox at home – and who wouldn’t think of it as a home CMDB? I’ve just started experimenting with it. For those who do not know, a Configuration Management Database (CMDB) is the source of truth for your inventory of stuff. In data centers, it keeps track of your servers, their cables, and everything else, telling you in which data center and which rack they are.
For me… well, take a look at for yourself. One picture says more than a thousand words of my storytelling.
What is it good for?
Well… in the real business world, it’s good for many things – from knowing about your assets, their serial numbers, purchase dates, hardware configuration, and so much else. I could go as deep as that, but there’s a limit how far even I want to go with these little experiments. Today’s case is merely to demonstrate the flexibility of Zabbix, yet again.
How did I do this?
I quickly threw the data in to NetBox by hand — it looks by a lot of work to do, but in fact, it wasn’t too bad – took me about 45 minutes to do the following:
Create a Site called “”What’s up, home?”
Create the rooms by adding new locations and making the previously created site as their parent
Add some manufacturers
Add some device roles
Add some device types
After that, adding the devices themselves is a breeze. If you have not used NetBox, this is what adding a new device looks like. Yes yes, in the real business world there would have been many more items for me to fill in, but for this case I only added the mandatory items and even those I could do just by choosing from the drop-down menus. Not a big deal.
…and the Zabbix integration?
Actually, this is something I created many years ago for other purposes, but still seems to work with today’s versions of NetBox. My little template queries NetBox over its API and asks if it has anything that matches with the host name that’s in Zabbix. If it has, then it gets the rack location and other stuff.
How this then works is pretty standard stuff. Retrieve a master item…
…and the dependent items then gather the data, parse some JSONPaths with Zabbix item preprocessing, and at least some of the items also populate bits and pieces in the Zabbix inventory. This is handy in real world, as your alerts can then contain the exact rack location and so forth about your failing devices. Add them as tags or add them as part of the alert text, your imagination is your limit.
Does it work?
Of course it does! Here’s the inventory grouped by manufacturer:
If I click on any of them, I get this:
Of course I can also browse the data through the latest data, for example…
…or I could just create some dashboards for visualizing all this. I have not done that yet, as this is what I did tonight so far and now I’m going to bed. To be continued – maybe! For now, the template only pulls data from NetBox, but I’d like to push data towards it as well, to also tell if a light bulb is powered on or not, for example. Stay tuned!
In this article, we will explore a practical example of using the zabbix_utils library to solve a non-trivial task – obtaining a list of alert recipients for triggers associated with a specific Zabbix host. You will learn how to easily automate the process of collecting this information, and see examples of real code that can be adapted to your needs.
Table of Contents
Over the last year, the zabbix_utils library has become one of the most popular tools for working with the Zabbix API. It is a convenient tool that simplifies interacting with the Zabbix server, proxy, or agent, especially for those who automate monitoring and management tasks.
Due to its ease of use and extensive functionality, zabbix_utils has found a following among system administrators, monitoring, and DevOps engineers. According to data from PyPI, the library has already been downloaded over 140,000 times since its release, confirming its demand within the community. It’s all thanks to you and your attention to zabbix_utils!
Task Description
Administrators often need to check which Zabbix users receive alerts for specific triggers in the Zabbix monitoring system. This can be useful for auditing, configuring new notifications, or simply for a quick diagnosis of issues. The task becomes especially relevant when you have plenty of hosts containing numerous triggers, and manually checking the recipients for each trigger through the Zabbix interface becomes very time-consuming.
In such cases, it is advisable to use a custom solution based on the Zabbix API. You can directly access all the required data using the API, and then use additional logic to determine the final alert recipients. The zabbix_utils library makes working with the Zabbix API more convenient and allows you to automate this process. In this project, we use the zabbix_utils library to write a Python script that collects a list of alert recipients for the triggers of the selected Zabbix host. This will allow you to obtain the necessary information faster and with minimal effort.
Environment Setup and Installation
To get started with zabbix_utils, you need to install the library and configure the connection to the Zabbix API. This article provides more details and examples on getting started with the library. However, it would be better if I describe the basic steps to prepare the environment here.
The library supports several installation methods described in the official README, making it convenient for use in different environments.
1. Installation via pip
The simplest and most common installation method is using the pip package manager. To do this, execute the command:
~$ pip install zabbix_utils
To install all necessary dependencies for asynchronous work, you can use the command:
~$ pip install zabbix_utils[async]
This method is suitable for most users, as pip automatically installs all required dependencies.
2. Installation from Zabbix Repository
Since writing the previous articles, we have added one more installation method – from the official Zabbix repository. First and foremost, you need to add the repository to your system if it has not been installed yet. Official Zabbix packages for Red Hat Enterprise Linux and Debian-based distributions are available on the Zabbix website.
For Red Hat Enterprise Linux and derivatives:
~# dnf install python3-zabbix-utils
For Debian / Ubuntu and derivatives:
~# apt install python3-zabbix-utils
3. Installation from Source Code
If you require the latest version of the library that has not yet been published on PyPI, or you want to customize the code, you can install the library directly from GitHub:
After installing zabbix_utils, it is a good idea to check the connection to your Zabbix server via the API. To do this, use the URL to the Zabbix server, the token, or the username and password of the user who has permission to access the Zabbix API.
Now that the environment is set up, let’s look at the main steps for solving the task of retrieving the list of alert recipients for triggers associated with a specific Zabbix host in Zabbix.
In zabbix_utils, asynchronous API interaction support is built in through the AsyncZabbixAPI class. This allows multiple requests to be sent simultaneously and their results to be handled as they become ready, significantly reducing latencies when making multiple API calls. Therefore, we will use the AsyncZabbixAPI class and the asynchronous approach in this project.
Below are the main steps for solving the task, and code examples for each step. Please note that the code in this project is for demonstration purposes, may not be optimal, or could contain errors. Use it as an example or a base for your project, but not as a complete tool.
Step 1. Obtain Host ID
The first step is to identify the host for which we will retrieve information about triggers and alerts. We need to find the hostid using its name/host to do this. The Zabbix API provides a method to obtain this information, and using zabbix_utils makes this process much simpler.
This method returns a unique identifier for the host, which can be used further. However, for our test project, we will use a manually specified host identifier.
Step 2. Retrieve Host Triggers
With the hostid in hand, the next step is to retrieve all triggers associated with this host. Triggers contain the conditions that trigger the alerts. We need to collect information about all triggers so that we can then use it to select actions that match all the conditions.
This request returns complete information about the triggers for the host. We get not only the triggers but also their tags, associated host and host groups, and discovery rule information. All this information will be necessary to check the conditions of the actions.
Step 3. Initialize Trigger Metadata
At this stage, objects for each trigger are created to store their metadata. This is done using the Trigger class, which includes information about the trigger such as its name, ID, associated host groups, hosts, tags, templates, and operations.
Here’s the code defining the Trigger class:
classTrigger:def__init__(self, trigger):self.name=trigger["description"]self.triggerid=trigger["triggerid"]self.hostgroups= [g["groupid"] forgintrigger["hostgroups"]]self.hosts= [h["hostid"] forhintrigger["hosts"]]self.tags= {t["tag"]: t["value"] fortintrigger["tags"]}self.tmpl_triggerid=self.triggeridself.lld_rule=trigger["discoveryRule"] or {}iftrigger["templateid"] !="0":self.tmpl_triggerid=trigger["templateid"]self.templates= []self.messages= []self._conditions= {"0": self.hostgroups,"1": self.hosts,"2": [self.triggerid],"3": trigger["event_name"] ortrigger["description"],"4": trigger["priority"],"13": self.templates,"25": self.tags.keys(),"26": self.tags, }defeval_condition(self, operator, value, trigger_data):# equals or does not equalifoperatorin ["0", "1"]:equals=operator=="0"ifisinstance(value, dict) andisinstance(trigger_data, dict):ifvalue["tag"] intrigger_data:ifvalue["value"] ==trigger_data[value["tag"]]:returnequalselifvalueintrigger_dataandisinstance(trigger_data, list):returnequalselifvalue==trigger_data:returnequalsreturnnotequals# contains or does not containifoperatorin ["2", "3"]:contains=operator=="2"ifisinstance(value, dict) andisinstance(trigger_data, dict):ifvalue["tag"] intrigger_data:ifvalue["value"] intrigger_data[value["tag"]]:returncontainselifvalueintrigger_data:returncontainsreturnnotcontains# is greater/less than or equalsifoperatorin ["5", "6"]:greater=operator!="5"try:ifint(value) <int(trigger_data):returnnotgreaterifint(value) ==int(trigger_data):returnTrueifint(value) >int(trigger_data):returngreaterexcept:raiseValueError("Values must be numbers to compare them" )defselect_templates(self, templates):fortemplateintemplates:ifself.tmpl_triggeridin [t["triggerid"] fortintemplate["triggers"]]:self.templates.append(template["templateid"])ifself.lld_rule.get("templateid") in [d["itemid"] fordintemplate["discoveries"] ]:self.templates.append(template["templateid"])defselect_actions(self, actions):selected_actions= []foractioninactions:conditions= []if"filter"inaction:conditions=action["filter"]["conditions"]eval_formula=action["filter"]["eval_formula"]# Add actions without conditions directlyifnotconditions:selected_actions.append(action)continuecondition_check= {}forconditioninconditions:if (condition["conditiontype"] !="6"andcondition["conditiontype"] !="16" ):if (condition["conditiontype"] =="26"andisinstance(condition["value"], str) ):condition["value"] = {"tag": condition["value2"],"value": condition["value"], }ifcondition["conditiontype"] inself._conditions:condition_check[condition["formulaid"] ] =self.eval_condition(condition["operator"],condition["value"],self._conditions[condition["conditiontype"] ], )else:condition_check[condition["formulaid"] ] =Trueforformulaid, bool_resultincondition_check.items():eval_formula=eval_formula.replace(formulaid, str(bool_result))
# Evaluate the final condition formulaifeval(eval_formula):selected_actions.append(action)returnselected_actionsdefselect_operations(self, actions, mediatypes):messages_metadata= []foractioninself.select_actions(actions):messages_metadata+=self.check_operations("operations", action, mediatypes )messages_metadata+=self.check_operations("update_operations", action, mediatypes )messages_metadata+=self.check_operations("recovery_operations", action, mediatypes )returnmessages_metadata
defcheck_operations(self, optype, action, mediatypes):messages_metadata= []optype_mapping= {"operations": "0", # Problem event"recovery_operations": "1", # Recovery event"update_operations": "2", # Update event }operations=copy.deepcopy(action[optype])# Processing "notify all involved" scenariosforidx, _inenumerate(operations):ifoperations[idx]["operationtype"] notin ["11", "12"]:continue# Copy operation as a template for reuseop_template=copy.deepcopy(operations[idx])deloperations[idx]# Checking for message sending operationsforkeyin [kforkin ["operations", "update_operations"] ifk!=optype ]:ifnotaction[key]:continue# Checking for message sending type operationsforopin [oforoinaction[key] ifo["operationtype"] =="0" ]:# Copy template for the current operationoperation=copy.deepcopy(op_template)operation.update( {"operationtype": "0","opmessage_usr": op["opmessage_usr"],"opmessage_grp": op["opmessage_grp"], } )operation["opmessage"]["mediatypeid"] =op["opmessage" ]["mediatypeid"]operations.append(operation)foroperationinoperations:ifoperation["operationtype"] !="0":continue# Processing "all mediatypes" scenarioifoperation["opmessage"]["mediatypeid"] =="0":formediatypeinmediatypes:operation["opmessage"]["mediatypeid"] =mediatype["mediatypeid" ]messages_metadata.append(self.create_messages(optype_mapping[optype], action, operation, [mediatype ] ) )else:messages_metadata.append(self.create_messages(optype_mapping[optype],action,operation,mediatypes ) )returnmessages_metadatadefcreate_messages(self, optype, action, operation, mediatypes):message=Message(optype, action, operation)message.select_mediatypes(mediatypes)self.messages.append(message)returnmessage
The code for creating Trigger class objects for each of the retrieved triggers:
This loop iterates through all triggers and saves them in a dictionary called triggers_metadata, where the key is the triggerid and the value is the trigger object.
Step 4. Retrieve Template Information
The next step is to obtain data about the templates associated with all the triggers:
This request returns information about all templates linked to the host’s triggers being examined. Executing a single query for all triggers is a more optimal solution than making individual requests for each trigger. This information will be needed for evaluating the “Template” condition in actions.
Step 5. Get Actions and Media Types
Next, we obtain the list of actions and media types configured in the system:
Here we retrieve actions that define how and to whom alerts are sent, and mediatypes through which users can receive notifications (for example, email or SMS).
Step 6. Match Triggers with Templates and Actions
At this stage, each trigger is associated with the corresponding templates and actions:
Here, for each trigger, we update information about its templates and configured actions for sending notifications. The list of associated actions is determined by checking the conditions specified in them against the accumulated data for each trigger.
For each operation of the corresponding trigger action, a Message class object is created:
classMessage:def__init__(self, optype, action, operation):self.optype=optypeself.mediatypename=""self.actionid=action["actionid"]self.actionname=action["name"]self.operationid=operation["operationid"]self.mediatypeid=operation["opmessage"]["mediatypeid"]self.subject=operation["opmessage"]["subject"]self.message=operation["opmessage"]["message"]self.default_msg=operation["opmessage"]["default_msg"]self.users= [u["userid"] foruinoperation["opmessage_usr"]]self.groups= [g["usrgrpid"] forginoperation["opmessage_grp"]]self.recipients= []# Escalation period set to action's period if not specifiedself.esc_period=operation.get("esc_period", "0")ifself.esc_period=="0":self.esc_period=action["esc_period"]# Use action's escalation period if unsetself.esc_step_from=self.multiply_time(self.esc_period, int(operation.get("esc_step_from", "1")) -1 )ifoperation.get("esc_step_to", "0") !="0":self.repeat_count=str(int(operation["esc_step_to"]) -int(operation["esc_step_from"]) +1 )# If not a problem event, set repeat count to 1elifself.optype!="0":self.repeat_count="1"# Infinite repeat count if esc_step_to is 0else:self.repeat_count=“∞”defmultiply_time(self, time_str, multiplier):# Multiply numbers within the time stringresult=re.sub(r"(\d+)",lambdam: str(int(m.group(1)) *multiplier),time_str )ifresult[0] =="0":return"0"returnresultdefselect_mediatypes(self, mediatypes):formediatypeinmediatypes:ifmediatype["mediatypeid"] ==self.mediatypeid:self.mediatypename=mediatype["name"]# Select message templates related to operation typemsg_template= [mforminmediatype["message_templates"]if (m["recovery"] ==self.optypeandm["eventsource"] =="0" ) ]# Use default message if applicableifmsg_templateandself.default_msg=="1":self.subject=msg_template[0]["subject"]self.message=msg_template[0]["message"]defselect_recipients(self, user_groups, recipients):forgroupidinself.groups:ifgroupidinuser_groups:self.users+=user_groups[groupid]foruseridinself.users:ifuseridinrecipients:recipient=copy.deepcopy(recipients[userid])ifself.mediatypeidinrecipient.sendto:recipient.mediatype =Trueself.recipients.append(recipient)
Each such object represents a separate message sent to users (recipients) and will contain all message information – its subject, text, recipients, and escalation parameters.
Step 7. Collect User and Group Identifiers
After matching the triggers with actions, the process of collecting unique identifiers for users and groups starts:
This code snippet collects the IDs of all users and groups involved in the operations for each trigger. This is necessary to perform only one request to the Zabbix API for all involved users and their groups, rather than making separate requests for each trigger.
Step 8. Obtain User and Group Information
The next step is to collect detailed information about users and user groups:
Here we gather data about users, including their role and media types through which they receive notifications, as well as data about user groups, including access rights to host groups and the list of users in each group. All this information will be needed to check access to the host with the triggers we are working with.
Step 9. Match Users and Groups with Triggers
After obtaining user information, we match users and groups with their respective rights to receive notifications. Here we also link users with groups, updating the information regarding rights and groups for each user.
foruseridin userids:ifuseridin users:user= users[userid] recipients[userid] =Recipient(user)forgroupinuser["usrgrps"]:ifgroup["usrgrpid"] in usergroups: recipients[userid].permissions.update([h["id"]forhin usergroups[group["usrgrpid"]]["hostgroup_rights"]ifint(h["permission"]) >1 ])forgroupidin groupids:ifgroupidin usergroups:group= usergroups[groupid] user_groups[group["usrgrpid"]] = []foruseringroup["users"]: user_groups[group["usrgrpid"]].append(user["userid"])ifuser["userid"] in recipients: recipients[user["userid"]].groups.update(group["usrgrpid"])elifuser["userid"] in users: recipients[user["userid"]] =Recipient(users[user["userid"]]) recipients[user["userid"]].permissions.update([h["id"]forhingroup["hostgroup_rights"]ifint(h["permission"]) >1 ])
This code fragment connects each user with their groups and vice versa, creating a complete list of users with their access rights to the host, and thus their eligibility to receive notifications about events for this host.
For each recipient, a Recipient class object is created containing data about the recipient, such as the notification address, access rights to hosts, configured mediatypes, etc.
Here’s the code that describes the Recipient class:
classRecipient:def__init__(self, user):self.userid=user["userid"]self.username=user["username"]self.fullname="{name}{surname}".format(**user).strip()self.type=user["role"]["type"]self.groups=set([g["usrgrpid"] forginuser["usrgrps"]])self.has_right=Falseself.permissions=set()self.sendto= {m["mediatypeid"]: m["sendto"] forminuser["medias"] ifm["active"] =="0" }# Check if the user is a super admin (type 3)ifself.type=="3":self.has_right=True
Step 10. Match Messages with Recipients
Finally, we match recipients with specific messages from Step 6:
This step completes the main process – each message is assigned to the relevant recipients.
Step 11. Check Recipient Access Rights and Output the Result
Before the actual output of the result with the list of recipients, we can perform a check of the recipients’ message rights and filter only those who have the corresponding rights to receive notifications for the events related to the trigger, or those who have all configured media types specified and active. After these actions, the information can be output in any convenient way – whether it be exporting to a file or displaying it on the screen:
All the examples and code snippets described above have been compiled to create a solution demonstrating the algorithm for obtaining notification recipients for triggers associated with the selected host. We have implemented this algorithm as a simple web interface to make the result more illustrative and convenient for familiarization.
This interface allows users to enter the host’s ID. The script then processes the data and provides a list of notification recipients associated with the triggers on that host. The web interface uses asynchronous requests to the Zabbix API and the zabbix_utils library to ensure fast data processing and ease of use with many triggers and users.
This lets you familiarize yourself with the theoretical steps and code examples and also try to put this solution into action.
Please note once again that the code in this project is for demonstration purposes, may not be optimal, or could contain errors. Use it as an example or a base for your project, but not as a complete tool.
The web interface’s complete source code and installation instructions can be found on GitHub.
Conclusion
In this article, we explored a practical example of using the zabbix_utils library to solve the task of obtaining alert recipients for triggers associated with a selected Zabbix host using the Zabbix API. We detailed the key steps, from setting up the environment and initializing trigger metadata to working with notification recipients and optimizing performance with asynchronous requests.
Using zabbix_utils allowed us to optimize and accelerate interaction with the Zabbix API, expanding the capabilities of the Zabbix web interface and increasing efficiency when working with large volumes of data. Thanks to support for asynchronous processing and selective API requests, it is possible to significantly reduce the load on the server and improve system performance when working with Zabbix, which is especially important in large infrastructures.
We hope this example will assist you in implementing your own solutions based on the Zabbix API and zabbix_utils, and demonstrate the possibilities for optimizing your interaction with the Zabbix API.
Zabbix plays a crucial role in monitoring all kinds of “things” – IoT devices,domains, cloud infrastructures and more. It can also be integrated with third-party solutions – for example, with Oxidized for configuration backup monitoring. Given the nature of Zabbix, it usually contains a lot of confidential information as well as (more importantly) some kind of elevated access to network elements while being used by operators, engineers, and customers. This requires that Zabbix as a product should be as secure as possible.
Zabbix has upped their security game and is actively working with HackerOne to take full advantage of the reach of their global community by providing a bug bounty program. And though it doesn’t happen too often, from time to time a security issue arises in Zabbix or one of its dependencies, warranting the release of a Security Advisory.
Table of Contents
The issue
Zabbix typically releases a Security Advisory and might even assign a CVE to the issue. Cool, that is what we expect from reputable software developers. They even inform their customers with support contracts before publishing the advisory, in order to allow them to patch installations beforehand.
Unfortunately, if you don’t have a support contract you’re expected to find out about these security advisories on your own, either by monitoring the Security Advisory page or by monitoring the published CVEs for Zabbix. NIST has a public API that can be used and that works well, but the issue with CVE’s is that they are often incomplete and thus useless. For example, CVE-2024-22119 contains far less information than the advisory.
Currently, Zabbix does not publish an API for their Security Advisories. There is the public tracker which contains all entries and can be queried via API, but because it is unstructured text, it is really hard to parse.
The solution
We want to automatically be notified of new security advisories, and the only data source that contains all data in a structured way is the Zabbix Security Advisory page. However, structured doesn’t mean easily parseable – in fact, it is just raw HTML. We could try to solve this issue in Zabbix, but the easier solution in this case is to scrape the page and generate a JSON file which then can be parsed by Zabbix to achieve our goal, which is automated notifications of new advisories.
Webscraping
We’ve chosen to scrape the Zabbix site using Rust, utilizing the Scraper crate to parse the HTML and flesh out the relevant parts we want. Without going into too much detail, the interesting information is stored in 2 tables, one with the table-simple class applied and one with the table-vertical class applied. Using CSS selectors (which is what the Scraper crate requires), we can retrieve the information we want.
This information is then stored in a struct, which gets added to a hashmap. The result is stored in a vector, which is added to a struct, which eventually is used to generate the JSON we require. Phew.
The ‘reports’ array contains one entry per advisory, and each entry has the following layout. Unsurprisingly, this closely matches the information that is available on the Zabbix Security Advisory page:
Now, we could provide you with the code of the scraping tool and wish you good luck with making sure the tool runs every X hours and somehow, somewhere stores the resulting JSON for Zabbix to parse. That would be the easy way out, right?
Instead, we’ve chosen to host the Rust program as an AWS Lambda function, triggered every 2 hours by the AWS EventBridge Scheduler and with some code added to the Rust program (function?) to upload the resulting JSON to an AWS S3 bucket. This chain of AWS products not only makes sure that our cloud bill increases, but also guarantees we don’t have to host (and maintain!) anything ourselves.
Now that the data is available in JSON, it’s fairly easy to parse it using Zabbix. Using the HTTP Agent data collection, we download the JSON from AWS. The URI is stored in the {$ZBX_ADVISORY_URI} macro, which allows for easy modification. By default, it points to the JSON file hosted on AWS S3. This retrieval is done by the Retrieve the Zabbix Security Advisories item, which acts as the source for every other operation. It retrieves the JSON every hour, and with the JSON being generated every 2 hours, the maximum delay between Zabbix publishing a new advisory and you getting it into Zabbix is 3 hours.
The retrieve the Zabbix Security Advisories item acts as a master item for the Last Updated item. This item uses a JSONPath preprocessing step to flesh out the information we want: $.last_updated.secs. The resulting data is stored as unixtime so that we mere mortals can easily read when the last update of the JSON file was performed.
A trigger is configured for this item to ensure that the JSON file isn’t too old. The trigger JSON Feed is out of date has the following expression: last(/Zabbix Security Advisories/zbx_sec.last_updated)>{$ZBX_ADVISORY_UPDATE_INTERVAL}*{$ZBX_ADVISORY_UPDATE_THRESHOLD}
By default, {$ZBX_ADVISORY_UPDATE_INTERVAL} is set to 2 hours (which is the interval the file gets updated by our tool) and {$ZBX_ADVISORY_UPDATE_THRESHOLD} is set to 3. So, when the JSON file hasn’t been updated within the last 6 hours, this trigger will trigger.
The item Number of advisories uses the same principle, where a JSONPath preprocessing step is used to flesh out the information we want: $.reports. However, as $.reports is an array, we can use functions on it. In this case .length(), which returns an integer. This number is used in the associated trigger A new Zabbix Security Advisory has been published, which simply triggers when the value changes.
This is all very cool, but the JSON has a lot more information, including details about each report. In order to get these details into Zabbix, we use a discovery rule to ‘loop’ through the JSON and create items based on what we’ve discovered: Discover Advisories. This rule uses (again) a JSONPath preprocessing step to get the details we want: $.reports[*][*]. Based on the resulting data (which is a single report in this case), 2 LLD Macros are assigned: {#ZBXREF} – based on the JSONpath $.zbxref and {{#CVEREF} – based on the JSONpath $.cveref.
For each discovered report, 8 items are created. They all work using the same principle, so I will only describe one: Advisory {#ZBXREF} / {#CVEREF} – Acknowledgement. This item uses the master item Zabbix Security Advisories, just like all other items described so far. JSONPath is once again used to get the information we want. The expression $.reports[*][“{#ZBXREF}”].acknowledgement.first() provides exactly what we need, where we combine a LLD macro ({#ZBXREF}) and a JSONpath function (.first()) to first ‘select’ the correct advisory in the JSON and then retrieve the value.
All other 7 items work like this, and there is only one exception: Advisory {#ZBXREF} / {#CVEREF} – Components. The ‘components’ value in the JSON file is actually an array with 1 or more items, describing which components might be affected. But we cannot store arrays in Zabbix, so we use another preprocessing step to convert the array into a string. A few lines of Javascript is all we need:
First, we parse the JSON input (‘value’) into an array, only to apply the javascript .toString() function on it. The toString method of arrays calls join() internally, which joins the array and returns one string containing each array element separated by commas, which is exactly what we want: a string, separated by commas.
To make working with these advisories easier, each item has the componenttag applied, with the value zabbix_security. If the item belongs to an advisory, the advisory tag is added with the value of {#ZBXREF} (which is the advisory number/name). That way, we can easily filter on all Zabbix Security items, filter on all items for a single advisory, and (to make things even better) the type tag is also applied, with the actual type being ‘workaround’ or ‘description.’ This allows for filtering on all Zabbix Security items, of the type ‘score’ (et cetera) to easily gain insight into the different advisories and their score, synopsis, description, components, et cetera.
Dashboard
The tags on the items allow for filtering, but with Zabbix 7.0 we can use all great new nifty features, such as the Item Navigator widget combined with the Item Value widget. Let’s take a look at what configuring such a dashboard might look like if you set up the Item Navigator widget as follows:
And then ‘link’ the Item Value widget to it:
You should get a somewhat decent dashboard. It isn’t perfect (given that the Item Value widget only seems to be able to display a single line of text) but it’s something.
Disclaimer
Though we use this functionality ourselves, this all comes without any guarantee. The technology used to retrieve data (screen scraping) is mediocre at best and could break at any moment if and when Zabbix changes the layout of their page.
The objective of this project was to establish a robust and integrated environment for the continuous monitoring of code quality and performance metrics. To achieve this, SonarQube, an open-source platform for the continuous inspection of code quality, was installed on AlmaLinux. Following its setup, SonarQube was seamlessly integrated with Zabbix, an enterprise-class open-source distributed monitoring solution, to enable the dynamic monitoring of various projects. This integration aimed to provide our team at Zen Networks with real-time visibility into key metrics such as bugs, vulnerabilities, and code smells for ongoing projects.
Table of Contents
Installing SonarQube on AlmaLinux
1. Pre-installation Requirements:
We conducted a detailed review to ensure that the server met the minimum hardware requirements for running SonarQube effectively.
Necessary dependencies, including Java Development Kit (JDK) and a supported database system, were installed and configured.
2. SonarQube Installation Steps:
The SonarQube server was downloaded from the official website.
Following best practices, a dedicated SonarQube user account was created for running the service.
The SonarQube service was configured to start on boot, ensuring high availability.
3. Configuration:
The sonar.properties file was meticulously edited to connect SonarQube to the chosen database, optimizing for performance and security.
Network settings were adjusted to allow SonarQube to run on the desired port (9000) and be accessible from the developer’s workstations.
Additional plugins were installed to extend the functionality of SonarQube and to support the languages used in our projects.
Project Setup in SonarQube
Upon successful installation and configuration of SonarQube on the AlmaLinux server, the next phase involved setting up projects for code analysis. Five test projects were created to demonstrate the capabilities of SonarQube and serve as a baseline for quality assessment.
Creation of Test Projects:
We created a series of five distinct projects, namely app-java, backup-code, erp-app, test-app, and web-app, each configured within SonarQube.
The projects were configured to assess various aspects of code quality, including reliability, security, and maintainability.
We enabled the automated scanning of code to identify bugs, vulnerabilities, and code smells within each project.
Analysis and Metrics:
Each project underwent a thorough analysis, with results indicating varying levels of bugs and vulnerabilities alongside code smells.
Metrics such as coverage and duplication were configured to be monitored, though the initial test runs reflected 0.0% coverage, indicating a scope for further CI/CD integration.
The test-app project notably showed a substantial number of bugs and a significant code smell count, highlighting areas for immediate improvement.
Quality Gate Status:
All projects were set against predefined quality gates to ensure they met the organization’s standards for code quality.
Despite some projects having bugs and code smells, all projects passed the quality gates, suggesting that non-critical issues were identified, which would be addressed in an ongoing manner.
Integration with Zabbix
The integration of SonarQube with Zabbix was aimed at leveraging Zabbix’s robust monitoring capabilities to keep a close eye on the projects’ health status in terms of code quality.
Zabbix Template Creation:
Our team built a Zabbix template dedicated to interfacing with the SonarQube API and designed to auto-discover SonarQube projects and their key metrics. For integrating Zabbix with the SonarQube API and enabling the auto-discovery of projects and key metrics, the following API calls and configurations were used:
A customized Zabbix template was created to interface with the SonarQube API. The template includes discovery rules, item prototypes, and preprocessing steps to extract relevant metrics.
Example of a discovery rule and item prototype in the Zabbix template:
In addition, our team set up items within Zabbix to track the number of bugs, vulnerabilities, and code smells, as presented in the SonarQube dashboard. We also configured triggers within Zabbix to alert the team when certain thresholds were reached, facilitating prompt action to maintain code quality.
Automation and Dynamic Monitoring:
We enabled the dynamic discovery of projects in SonarQube, allowing for new projects to be automatically detected and monitored without manual intervention. To enable the dynamic discovery of projects in SonarQube and ensure they are automatically detected and monitored by Zabbix, we implemented the following configurations:
SonarQube Configuration:
Webhooks: Configured SonarQube webhooks to notify Zabbix whenever a new project is created or updated.
Project Tags: Used consistent tagging for SonarQube projects to facilitate easy identification in Zabbix.
Zabbix Configuration:
Discovery Rules: Created discovery rules in Zabbix that periodically query the SonarQube API to check for new projects.
Low-Level Discovery (LLD): Implemented LLD in Zabbix to automate the creation of items, triggers, and graphs for each new SonarQube project.
We also established a data flow between SonarQube and Zabbix, ensuring that updates in the code quality metrics were reflected in real time on the Zabbix dashboard.
Validation and Testing:
We conducted a series of tests to ensure that the integration was functioning correctly.
Our team verified that metrics reported in SonarQube matched those displayed in Zabbix, confirming the accuracy and reliability of the monitoring setup.
With the projects and metrics being actively monitored, the focus shifted to presenting the data effectively. A custom dashboard was created in Zabbix to aggregate and display the information gleaned from SonarQube.
Design and Layout:
We created a user-friendly dashboard to provide a quick overview of the status of all projects.
The dashboard was organized to show metrics such as the number of bugs, vulnerabilities, code smells, and the Quality Gate status of each project at a glance.
Particular attention was paid to visual hierarchy and layout, ensuring that the most critical metrics were immediately visible.
Custom Widgets and Visualizations:
Widgets were customized for each key metric to enhance readability and instant understanding of the project statuses.
Visual indicators, such as color-coded status icons and progress bars, were incorporated to give a clear visual cue about the health of each project.
Real-time Data Representation:
W configured the dashboard to refresh at regular intervals, providing real-time updates to the development team.
Ensured that the most current data was always available, enabling a proactive approach to quality assurance and code health.
Results and Benefits
The integration of SonarQube with Zabbix and the creation of a dedicated dashboard yielded significant benefits for development workflow and project management.
Improved Code Quality Monitoring:
The real-time monitoring of code quality metrics allowed for quicker identification and resolution of issues.
Developers received immediate feedback on the quality of their code, fostering a culture of quality-first in the development process.
Enhanced Visibility:
The Zabbix dashboard provided a centralized view of the health status of all projects, enhancing visibility for both developers and management.
Critical issues could be identified at a glance, allowing for prioritization and resource allocation to address the most pressing problems.
Streamlined Workflow:
Automated project discovery and monitoring reduced manual overhead, allowing developers to focus on coding rather than reporting.
Alerts and notifications from Zabbix ensured that no critical issues went unnoticed.
Decision-making Support:
The collected data and trends visible on the dashboard supported informed decision-making regarding code quality improvements and technical debt management.
The ability to track historical data enabled the team to measure the impact of implemented changes over time.
Proactive Issue Management:
The early detection of bugs and vulnerabilities allowed the team to address issues before they escalated, reducing potential risks to project timelines and quality.
The Quality Gate statuses helped maintain a consistent standard of code quality across all projects.
Special thanks to the team at Zen Networks (Oumaima Naami, Karim Chadil, and Fayçal Noushi) for their work on this project.
As a Zabbix partner, we help customers worldwide with all their Zabbix needs, ranging from building a simple template all the way to (massive) turn-key implementations, trainings, and support contracts. Quite often during projects, we get the question, “How about making configuration backups of our network equipment? We need this, as another tool was also capable of doing this!”
The answer is always the same – yes, but no. Yes, technically it is possible to get your configuration backups in Zabbix. It’s not even that hard to set up initially. However, you really should not want configuration backups. Zabbix is not made for them, and you will run into limitations within minutes. As you can imagine, the customer is never happy with this limitation, and some actively start to question where we think the limitation is to see if it is a limitation for them as well. So we simply set up an SSH agent item and get that config out:
Voila! Once per hour Zabbix will log in to that device, execute the command ‘show full-configuration,’ and get back the result. Frankly, it just works. You check the Monitoring -> Latest data section of the host and see that there is data for this item. Problem solved, right?
No. As a matter of fact, this is where the problems start. Zabbix allows us to store up to 64KB of data in a item value. The above screenshot is of a (small) fortigate firewall and the config if stored in a text file is just over 1.1MB. So, Zabbix truncates the data, which renders the backup useless – restore will never work. At the same time, Zabbix is not sanitizing the output, so all secrets are left in it.
To make it even worse, it’s challenging to make a diff of different config versions/revisions – that feature is just not there. Most of the time, the customer is at this point convinced that Zabbix is not the right tool and the next question pops up – “Now what? How can we fix this?” This is where our added value is presented, as we do have a solution here which is rather affordable (free) as well.
The solution is Oxidized, which is basically Rancid on steroids. This project started years ago and is released under the Apache 2.0 license. We found it by accident, started playing around with it, and never left it. The project is available on Github (https://github.com/ytti/oxidized) and written in Ruby. Incidentally, if you (or your company) have Ruby devs and want to give something back to the community, the Oxidized project is looking for extra maintainers!
At this point, we show our customers the GUI of Oxidized, which in our case involves just making backups of a few firewalls:
So we have the name, the model, and (in this case) just one group. The status shows whether the backup was successful or not, the last update and when the last change was detected. At the same time, under actions, we can get the full config file, look at previous revisions(and diff them) combined with a ‘execute now’ option.
Looking at the versions, it’s simply showing this:
This is already giving us a nice idea of what is going on. We see the versions and dates at a glance, but the moment we check the diff option, we can easily see what was actually changed:
The perfect solution, except that it is not integrated with Zabbix. That means double administration and a lot of extra work, combined with the inevitable errors – devices not added, credential mismatches, connection errors, etc. Luckily, we can easily change the format of the above information from GUI to json by just adding ‘.json’ at the end of the url:
As you might know, Zabbix is perfectly capable of parsing json formats and creating items and triggers out of them. A master item, dependent lld (https://blog.zabbix.com/low-level-discovery-with-dependent-items/13634/), and within minutes you’ve got Oxidized making configuration backups while Zabbix is monitoring and alerting on the status:
At this point we’re getting close to a nice integration, but we haven’t overcome the double configuration management yet.
Oxidized can read its configuration from multiple sources, including a CSV file, SQL, SQLite, MySQL or HTTP. The easiest is a CSV file – just make sure you’ve got all information in the correct column and it works. An example:
Great, now we have to configure 2 places (Zabbix and Oxidized) and get a username/password cleartext in a CSV file. What about SQL as a source, and letting it connect to Zabbix? From there we should be able to get information regarding the hostname, but somehow we need the credentials as well. That’s not a default piece of information in Zabbix, but UserMacros can save us here.
So on our host we add 2 extra macros:
At the same time, we need to tell Oxidized what kind of device it is. There are multiple ways of doing this, obviously. A tag, a usermacro, hostgroups, you name it. In order to do this, we place a tag on the host:
Now we make sure that Oxidized is only taking hosts with the tag ‘oxidized’ and extract from them the host name, IP address, model, username, and password:
This way, we simply add our host in Zabbix, add the SSH credentials, and Oxidized will pick it up the next time a backup is scheduled. Zabbix will immediately start monitoring the status of those jobs and alert you if something fails.
This blog post is not meant as a complete integration write down, but rather as a way to give some insight into how we as a partner operate in the field, taking advantage of the flexibility of the products we work with. This post should give you enough information to build it yourself, but of course we’re always available to help you or just build it as part of our consultancy offering.
Native integration between two leading open-source tools – Zabbix for network monitoring and rConfig for configuration management, delivers substantial benefits to organizations. On one side, Zabbix offers a platform that maintains a Single Source of Truth for network device inventories. It provides real-time monitoring, problem detection, alerting, and other critical features that are essential for day-to-day operations, ensuring smooth and reliable network connectivity crucial for business continuity.
On the other side, there’s rConfig, renowned for its robust and reliable network automation, configuration backup, and compliance management. Integrating rConfig with Zabbix enhances its capabilities, allowing for seamless Device Inventory synchronization. This union not only simplifies the management of network configurations but also introduces more advanced Network Automation Platform features. Together, they form a powerhouse toolset that streamlines network management tasks, reduces operational overhead, and boosts overall network performance, making it easier for businesses to focus on growth and innovation without being hindered by network reliability concerns.
Table of Contents
Optimizing Network Management with Unified Inventory
At rConfig, we are deeply embedded with our customers, and our main mission is to work with them to solve their real-world problems. One significant challenge that consistently surfaces – both from client feedback and our own experiences – is managing and accurately locating a trusted and reliable central network inventory. This challenge brings to the forefront a classic dilemma in Enterprise Architecture circles: In our scenario of network inventory, which system ought to act as the System of Record, and which should function as the System of Engagement to optimize interactions with records for various purposes, such as Network Management Systems (NMS) and Network Configuration Management (NCM)?
Enterprise Architecture circles illustrating systems of record, insight and engagement. Credit: Sharon Moore – https://samoore.me/
At rConfig, from a product perspective we’ve chosen to focus on what we do best and love most: Network Configuration Management. Therefore, integrating with an upstream Network Management System (NMS) that can act as the System of Record for network device inventory was a logical step for us. Given that many of our customers also use Zabbix network operations, it was a natural choice to begin our integration journey with them. Our platforms are highly complementary, which streamlines the integration process and enhances our ability to serve our customers better. This strategic decision allows us to offer a seamless and efficient management solution that not only meets the current needs but also scales to address future challenges in network management.
Enhanced Integration Through ETL
You might be wondering how this integration works and whether it’s straightforward or challenging to set up. Setting up the integration between rConfig and Zabbix is relatively straightforward, but, as with any complex data driven systems, it requires careful planning and diligence to ensure that the data flow between the systems is fully optimized and automated. This is where ETL – or Extract, Transform, Load – plays a crucial role. ETL is a process that involves extracting data from the Zabbix API in its raw form, transforming it into a format that rConfig can readily process and validate, and then loading it into the rConfig production database. This process also efficiently handles any data conflicts and updates.
The advantages of using ETL are significant, enhancing data quality and making the data more accessible, thereby enabling rConfig to analyze information more effectively and make well-informed, data-driven decisions. At rConfig, our user interface is designed to aid in the development and troubleshooting of features, though we’re also fond of using the CLI for those who prefer it. Below is a screenshot from our lab showing the end-to-end ETL process with Zabbix in action. It illustrates the steps rConfig takes to connect to Zabbix, extract, validate, transform and map the data, load it to staging, and finally, move it to the production environment for a small set of devices.
While the screenshot below displays just a few devices as a sample integration in our lab, the most extensive integration we’ve achieved in a production environment with this new rConfig feature involved syncing a single Zabbix instance with over 5,000 host/device records. This highlights its efficiency and reliability in a real-world environment.
Screenshot of rConfig Zabbix Integration on the Command Line
Going Deeper: Understanding the Integration Process
To grasp the integration process more clearly, let’s dive into the details that will help you understand how to set everything up before we automate the task. Our documentation website, docs.rconfig.com, provides comprehensive details, and our YouTube channel features a great demonstration video of the entire process.
Initial Setup: The first step involves configuring rConfig to connect and authenticate with the Zabbix API. This setup is managed through the Configuration page in the rConfig user interface. During this phase, you can also apply filters to select specific Zabbix tags or host groups, refining exactly which host records you want to synchronize.
Screenshot of Zabbix Configuration page in rConfig V7 professional
Data Extraction and Validation: Once the connection is established, rConfig extracts host records in raw JSON format. This stage involves validating the data to ensure that the correct tags and data mappings are in place.
Screenshot of Zabbix Raw Host Extract page in rConfig V7 Professional
Staging for Review: After validation, the data is loaded into a staging table. This allows for a thorough review to confirm that the mapped rConfig data fields are correct, ensuring that the newly imported devices are associated with the appropriate connection templates, categories, and tags.
Screenshot of Zabbix host staging table in rConfig V7 Professional
Final Loading: The final step involves transferring the staged devices to the main production devices table. After this transfer, the staging table is cleared. The devices then appear in the main device table, marked with a special icon indicating that they are synced through integration.
Screenshot of Zabbix host fully loaded to production devices table in rConfig V7 Professional
Seamless Operational Integration: Once the devices are loaded into the production table, they are automatically incorporated into standard rConfig scheduled tasks, automations, or any other rConfig feature that utilizes the device data (like categories and tags). This integration facilitates a seamless operational workflow between the platforms. Users can even access these devices directly in Zabbix from within the rConfig UI, streamlining operations management.
After all the above steps are completed, and the initial setup is done future loads are completed on a scheduled and automation basis using the rConfig Task manager.
Screenshot of rConfig Device detail view for a Zabbix integrated host
This detailed setup and validation process ensures that the integration between rConfig and Zabbix is not only effective but also enhances the functionality and efficiency of managing network devices across platforms.
Case Study: Enhancing Network Management for a Las Vegas Entertainment Organization
Challenge: A prominent Las Vegas entertainment organization faced significant difficulties in managing the diverse and complex network that supports their extensive operations, including gaming, security, and hospitality services. The primary issues were outdated network inventories and inefficient management of network configurations across numerous devices, leading to operational disruptions and security vulnerabilities.
Solution: To address these challenges, the organization implemented the integration of rConfig with Zabbix, focusing on automating and centralizing the network management process. This solution aimed to synchronize network device inventories across the organization’s extensive operations, ensuring accurate and real-time data availability.
Implementation: The integration process began with setting up Zabbix to continuously monitor and gather data from network devices across different venues and services. This data was then extracted, standardized, and loaded into rConfig, where it could be used for automated configuration management and backup. The setup also included sophisticated mapping and validation to ensure all data transferred between Zabbix and rConfig was accurate and relevant.
Benefits:
Improved Network Reliability: The automated synchronization of network inventories reduced the frequency of network failures and minimized downtime, which is crucial in the high-stakes environment of Las Vegas entertainment.
Enhanced Security: With more accurate and timely network data, the organization could better identify and respond to security threats, protecting sensitive information and ensuring the safety of both guests and operations.
Operational Efficiency: The IT team was able to shift their focus from routine network maintenance to strategic initiatives that enhanced overall business operations, including integrating new technologies and improving guest experiences.
Scalability: The integration provided a scalable solution that could accommodate future expansion, whether adding new devices or incorporating new technologies or venues into the network.
Outcome: The implementation of the rConfig and Zabbix integration dramatically transformed the organization’s network management capabilities. The IT department noted a substantial reduction in the manpower and time required for routine maintenance, while operational uptime improved significantly. The organization now enjoys a robust, streamlined network management system that supports its dynamic environment, ensuring that both guests and staff benefit from reliable and secure network services.
This case study highlights the power of effective network management solutions in supporting complex operations and enhancing business efficiency and security within the entertainment industry.
Conclusion: Forging Ahead with Innovative Partnerships
In conclusion, the Zabbix platform stands out as a cornerstone in network monitoring, renowned for its extensive capabilities in real-time monitoring, problem detection, and alerting. Its robust architecture not only supports a broad range of network environments but also offers the flexibility and scalability necessary for today’s diverse technological landscapes. The platform’s ability to provide detailed and accurate network insights is crucial for organizations aiming to maintain optimal operational continuity and security.
The integration of Zabbix with rConfig, a globally reliable and robust network configuration management (NCM) solution, enhances these benefits significantly, creating a synergistic relationship that leverages the strengths of both platforms. For customers and partners, this integration means not only smoother and more efficient network management but also the assurance that they are supported by two of the leading solutions in the industry. Together, Zabbix and rConfig deliver a comprehensive network management experience that drives efficiency, reduces costs, and ensures a higher level of network reliability and security, positioning them as indispensable tools in the toolkit of any organization serious about its network infrastructure.
About rConfig
rConfig is an industry leader in network configuration management and automation. Founded in 2010 and based in Ireland, rConfig has been at the forefront of delivering innovative solutions that simplify the complexities of network management. Our software is designed to be both powerful and user-friendly, making it an ideal choice for IT professionals across a variety of sectors, including education, government, manufacturing, and large global enterprises.
With the capability to manage up to 10s of 1000s of devices, rConfig offers robust functionalities such as automated config backups, compliance management, and network automation. Our platform is vendor-agnostic, which allows seamless integration with a diverse range of network devices and systems, from traditional IT to IoT and OT environments. This flexibility ensures that our clients can manage all aspects of their network configurations, regardless of the underlying technology.
rConfig is committed to continuous innovation and customer-centric solutions, with industry first solutions such as API backups and our Script Integration Engine. Our native integration with platforms like Zabbix exemplifies our dedication to enhancing network management through strategic partnerships. This collaboration not only streamlines operations but also amplifies the benefits provided, ensuring that our customers have access to the most advanced tools in the industry.
Infrabel is a government-owned public limited company that builds, owns, maintains, and upgrades the Belgian railway network, makes its capacity available to railway operator companies, and handles train traffic control. Headquartered in Brussels, Infrabel employs over 9,000 people and manages 3,602 kilometers of rail lines.
Table of Contents
The challenge
Infrabel needed a monitoring solution that was flexible enough to manage not only infrastructure, but also OS level metrics, data centers, service and application states, and the availability of railway infrastructure components.
The solution
To begin with, Zabbix agents are deployed on railway station screens and broadcasting systems. This is possible because under the hood these pieces of hardware they run Debian OS, which means they can be monitored on the OS level by Zabbix agents right out of the box with our official templates.
This can be very easily automated together with low level discovery, autoregistration, or network discovery. Devices can be pinged from Zabbix proxies or Zabbix servers to check if they are available. If they are unavailable, Zabbix sends a notification, after which an engineer either restores the network connectivity or replaces the hardware.
In addition, Infrabel also uses Zabbix to retrieve and monitor data collected from ActiveMQ. This is where a combination of custom bash scripts and Zabbix sender is used, so the required data (also related to the railway infrastructure and data centre, hardware, and software) is retrieved from ActiveMQ via Bash script, then forwarded to Zabbix sender via a wrapper script, sent to the Zabbix server or proxy, stored and analyzed in Zabbix, and acted upon if required.
The results
Infrabel found that they could get the most out of Zabbix by integrating it with a third-party ticketing system they were already using. The integration itself is simple – when Zabbix generates a problem, the Zabbix API is then used to retrieve the problems related to a particular set of triggers that need to be forwarded to this third-party system.
These alerts are then forwarded via API to whatever system Infrabel requires – Zabbix has a variety of integrations available right out-of-the-box using web hooks, including Slack, JIRA, Microsoft Teams, and many others. Messengers can also be used with Zabbix, but Infrabel has opted to use Zabbix API for their custom ticketing solution.
In conclusion
Infrabel is the perfect example of how the flexibility of Zabbix allows it to adapt to any industry or need. The possibility to use Zabbix API, web hooks, or a combination of both was a game-changer for Infrabel – just as it could be for any customer in any industry.
You can learn more about what we can do for customers across a variety of industries by visiting our website or requesting a demo.
To provide the best experiences, we use technologies like cookies to store and/or access device information. Consenting to these technologies will allow us to process data such as browsing behavior or unique IDs on this site. Not consenting or withdrawing consent, may adversely affect certain features and functions.
Functional
Always active
The technical storage or access is strictly necessary for the legitimate purpose of enabling the use of a specific service explicitly requested by the subscriber or user, or for the sole purpose of carrying out the transmission of a communication over an electronic communications network.
Preferences
The technical storage or access is necessary for the legitimate purpose of storing preferences that are not requested by the subscriber or user.
Statistics
The technical storage or access that is used exclusively for statistical purposes.The technical storage or access that is used exclusively for anonymous statistical purposes. Without a subpoena, voluntary compliance on the part of your Internet Service Provider, or additional records from a third party, information stored or retrieved for this purpose alone cannot usually be used to identify you.
Marketing
The technical storage or access is required to create user profiles to send advertising, or to track the user on a website or across several websites for similar marketing purposes.

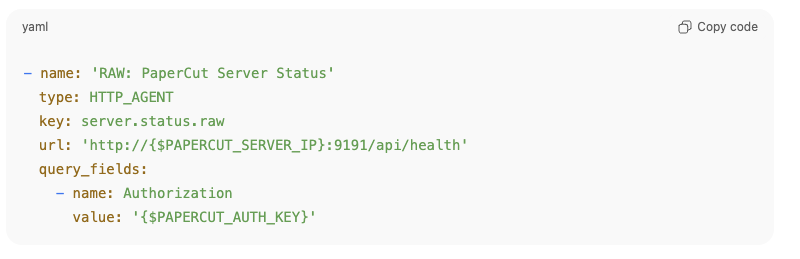
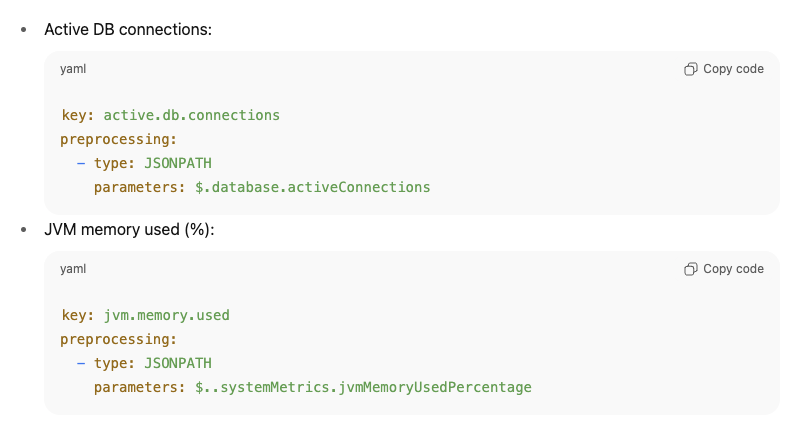
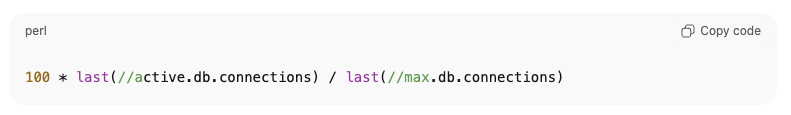

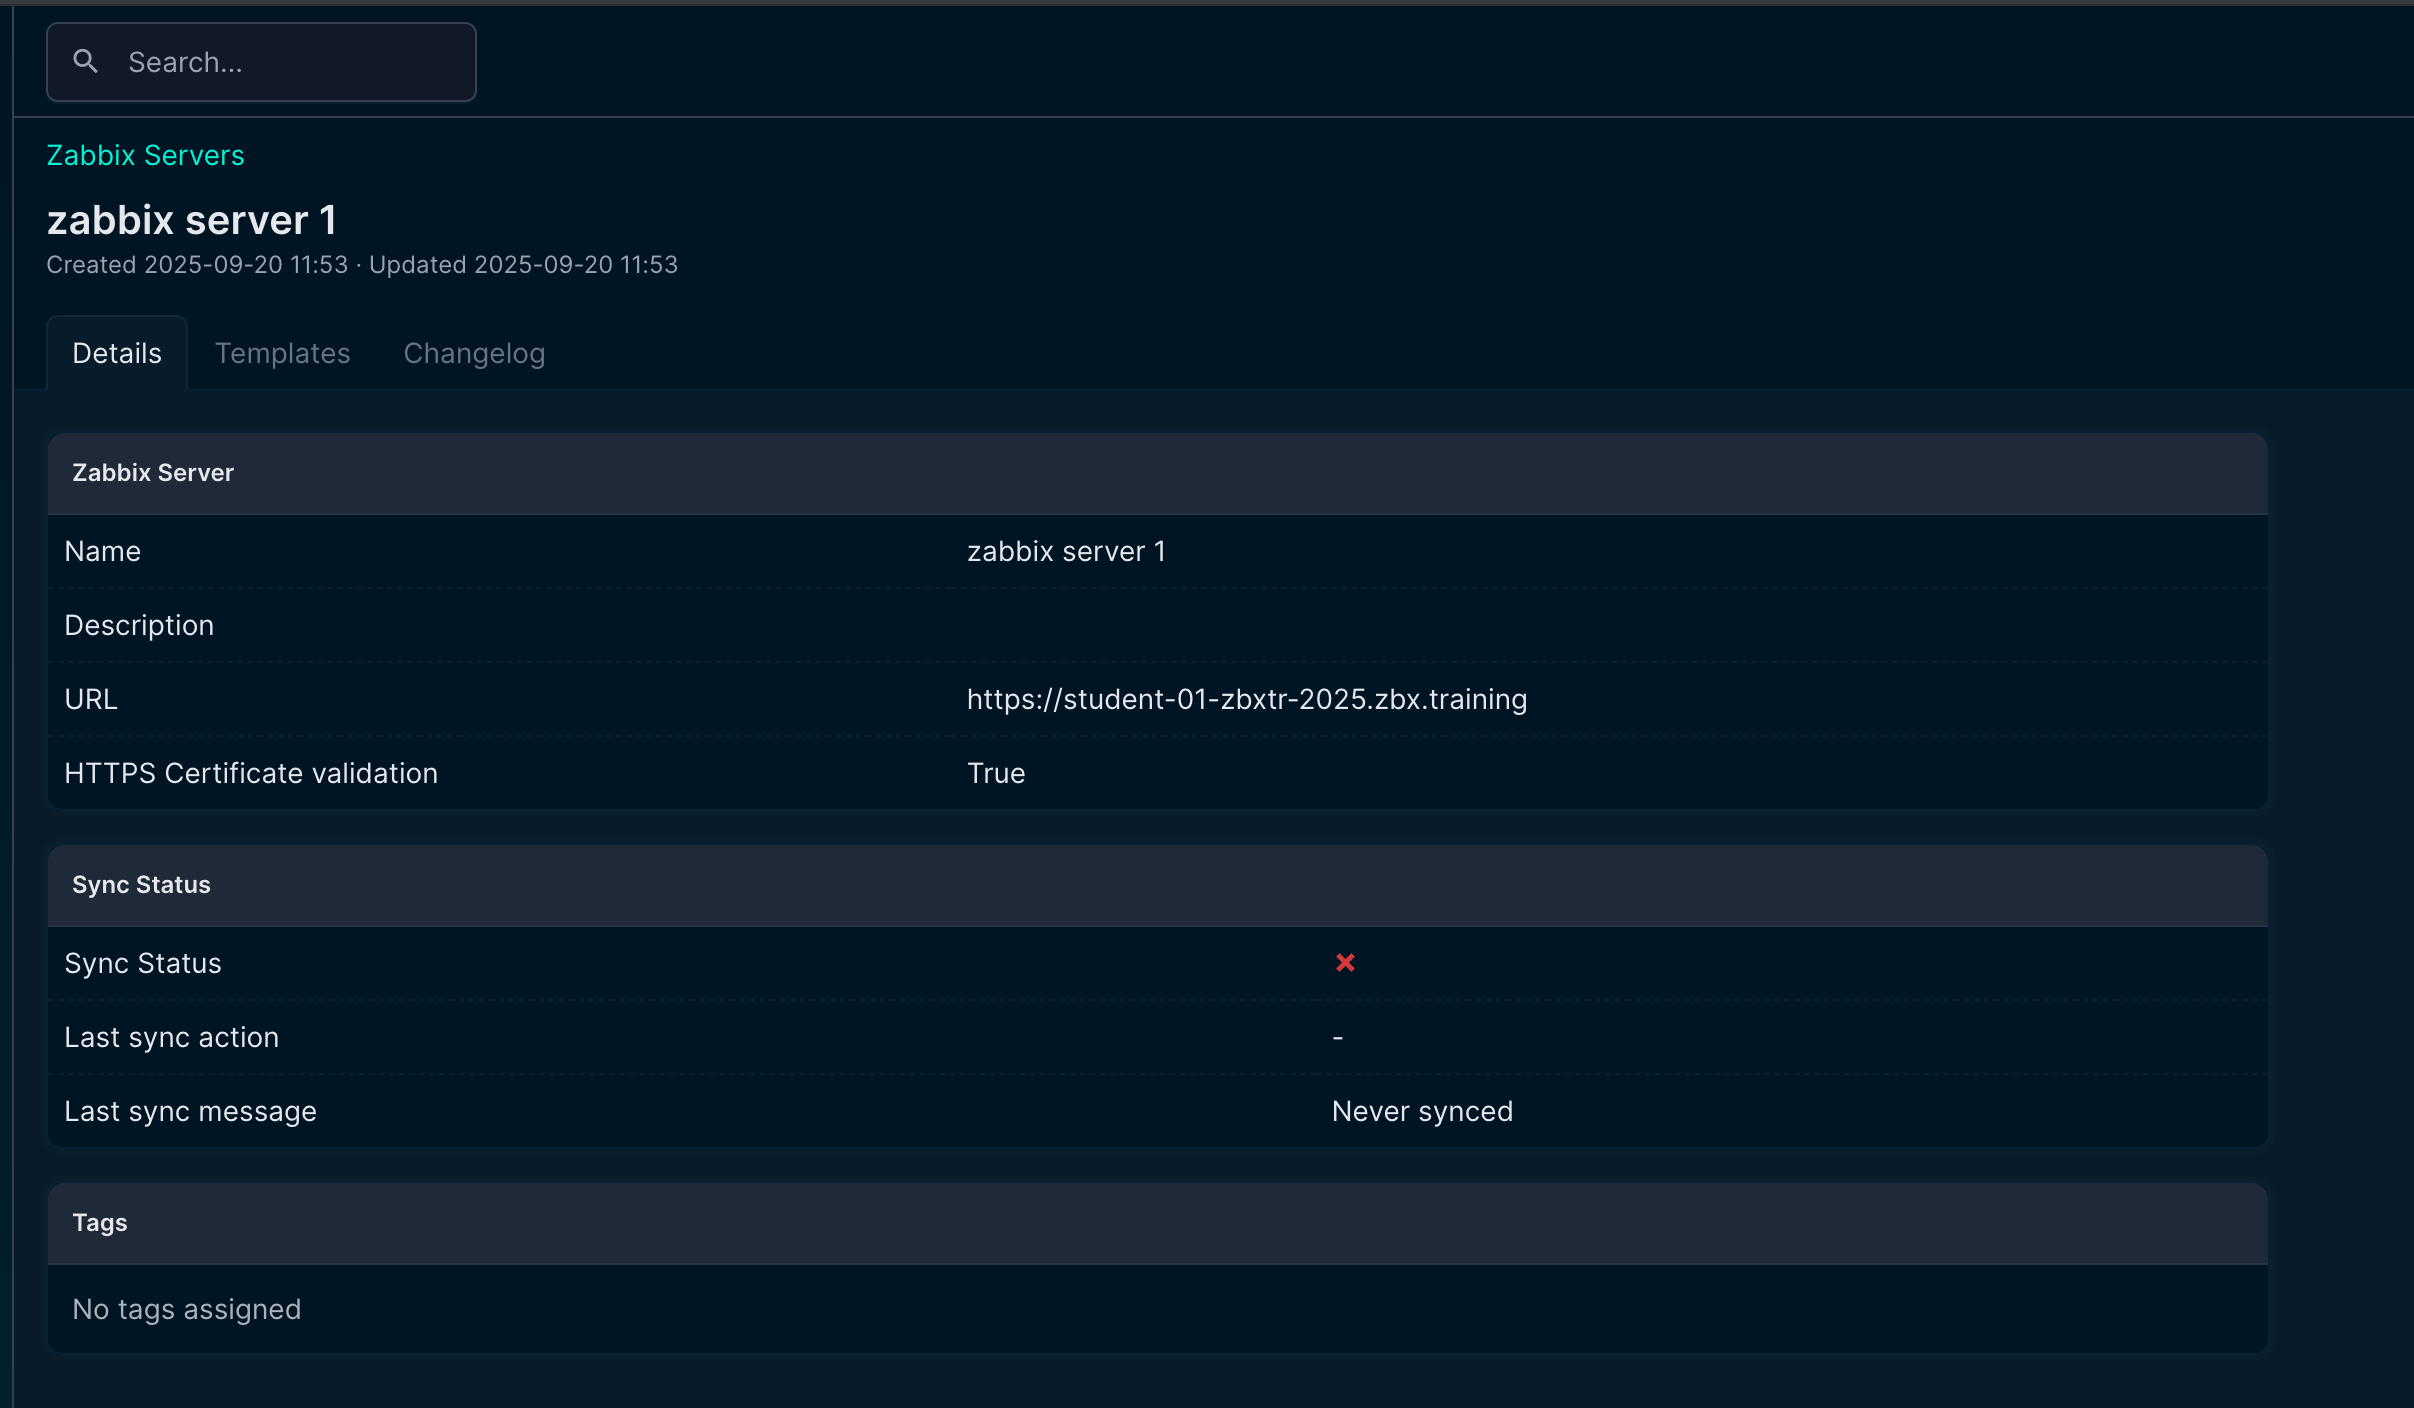
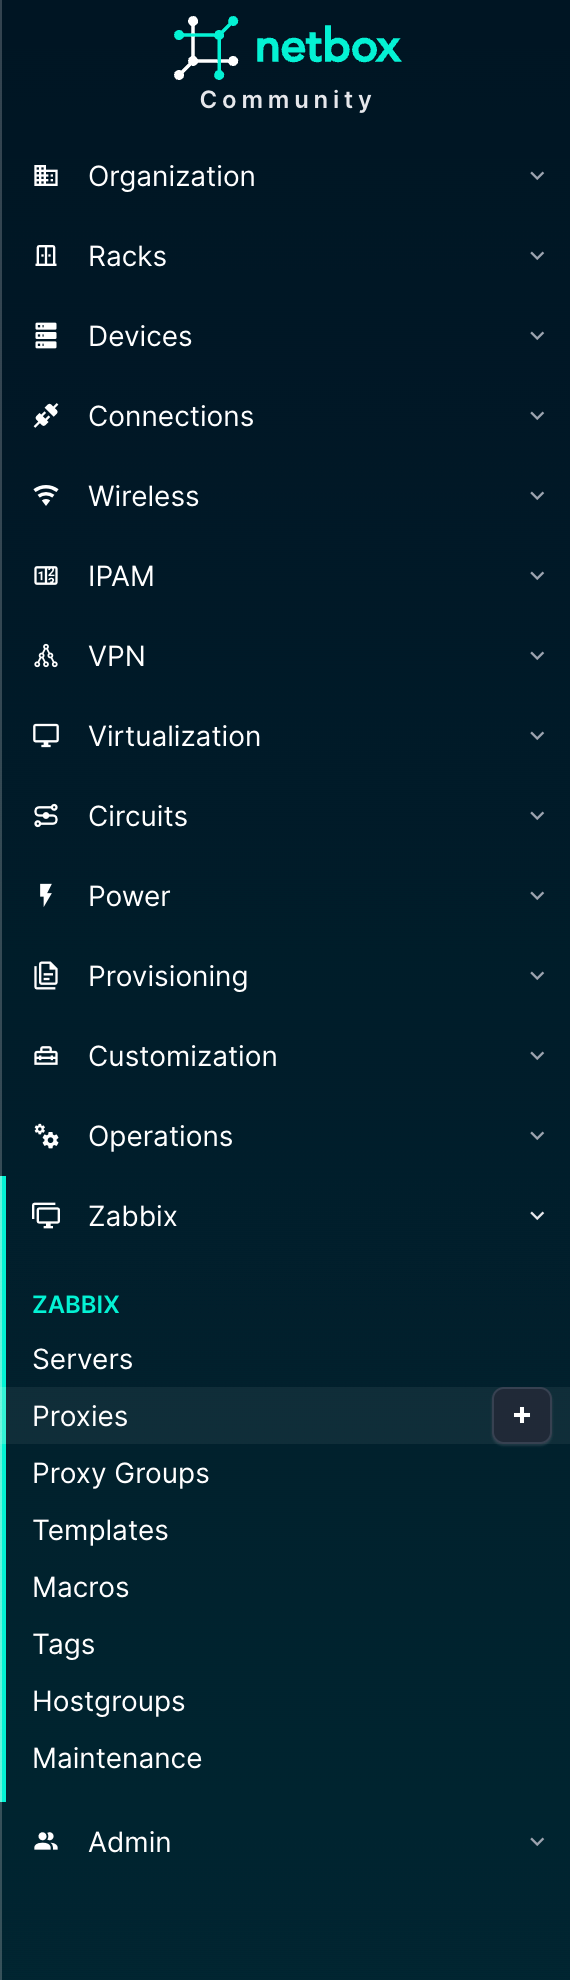
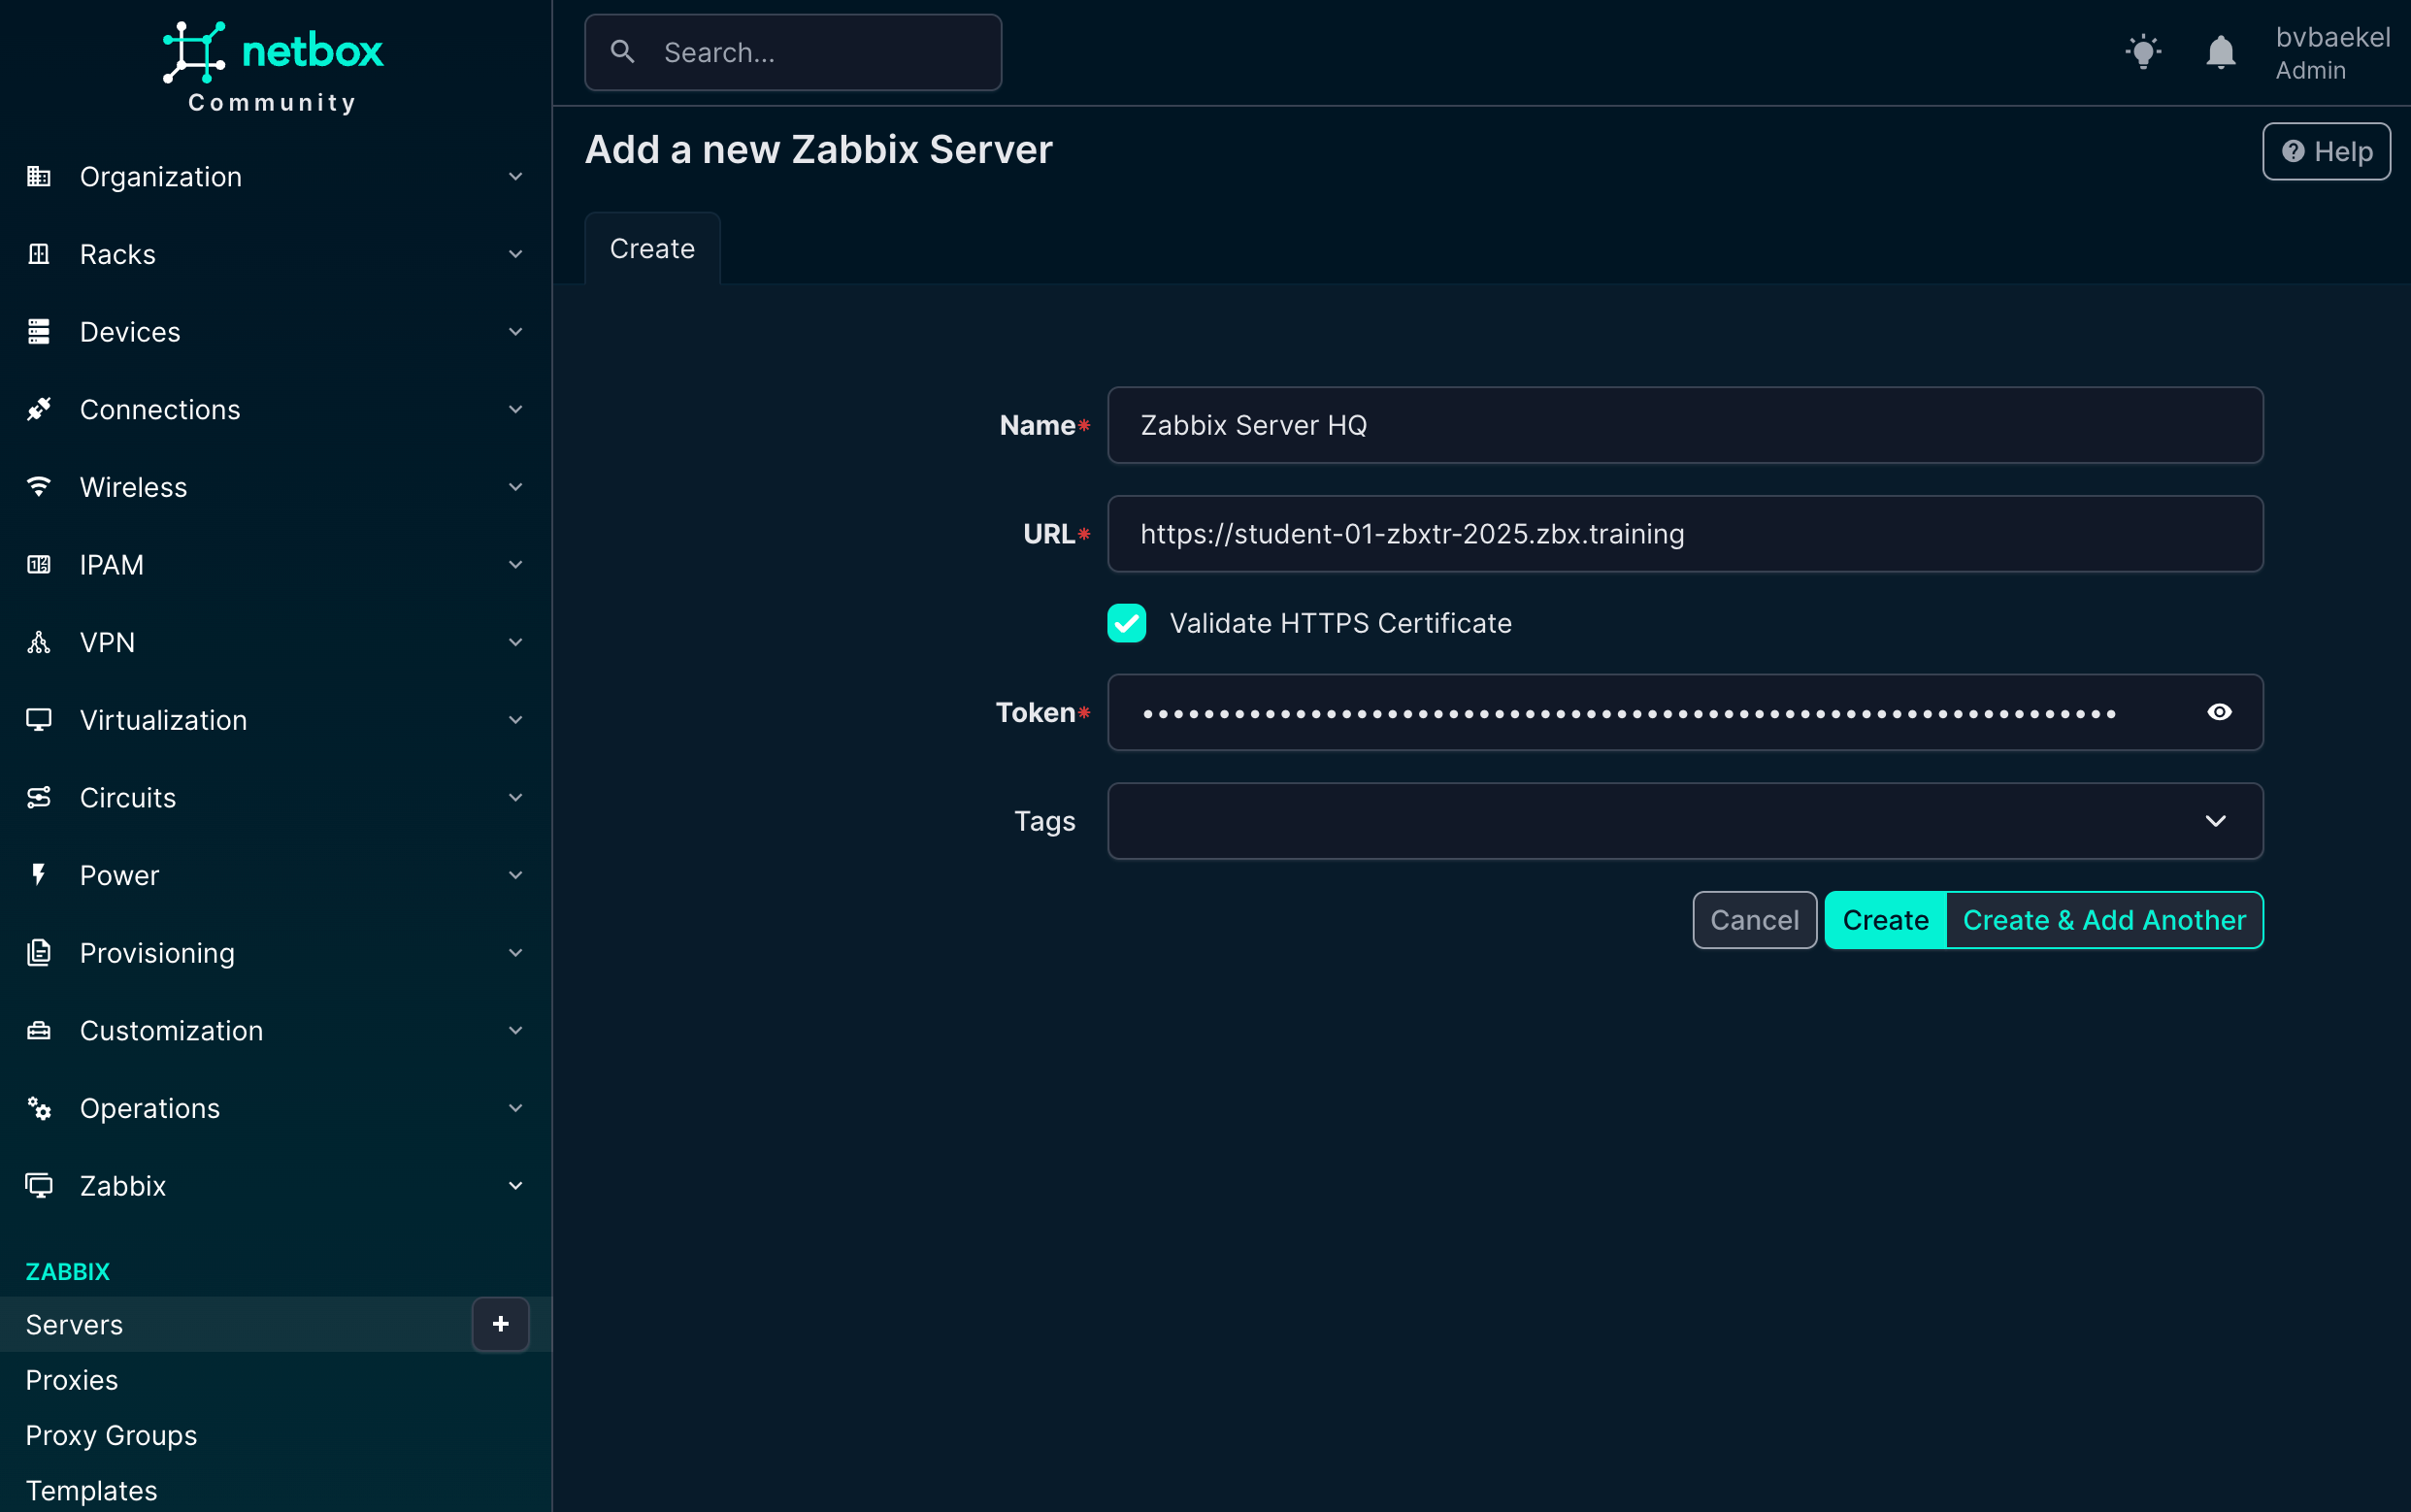
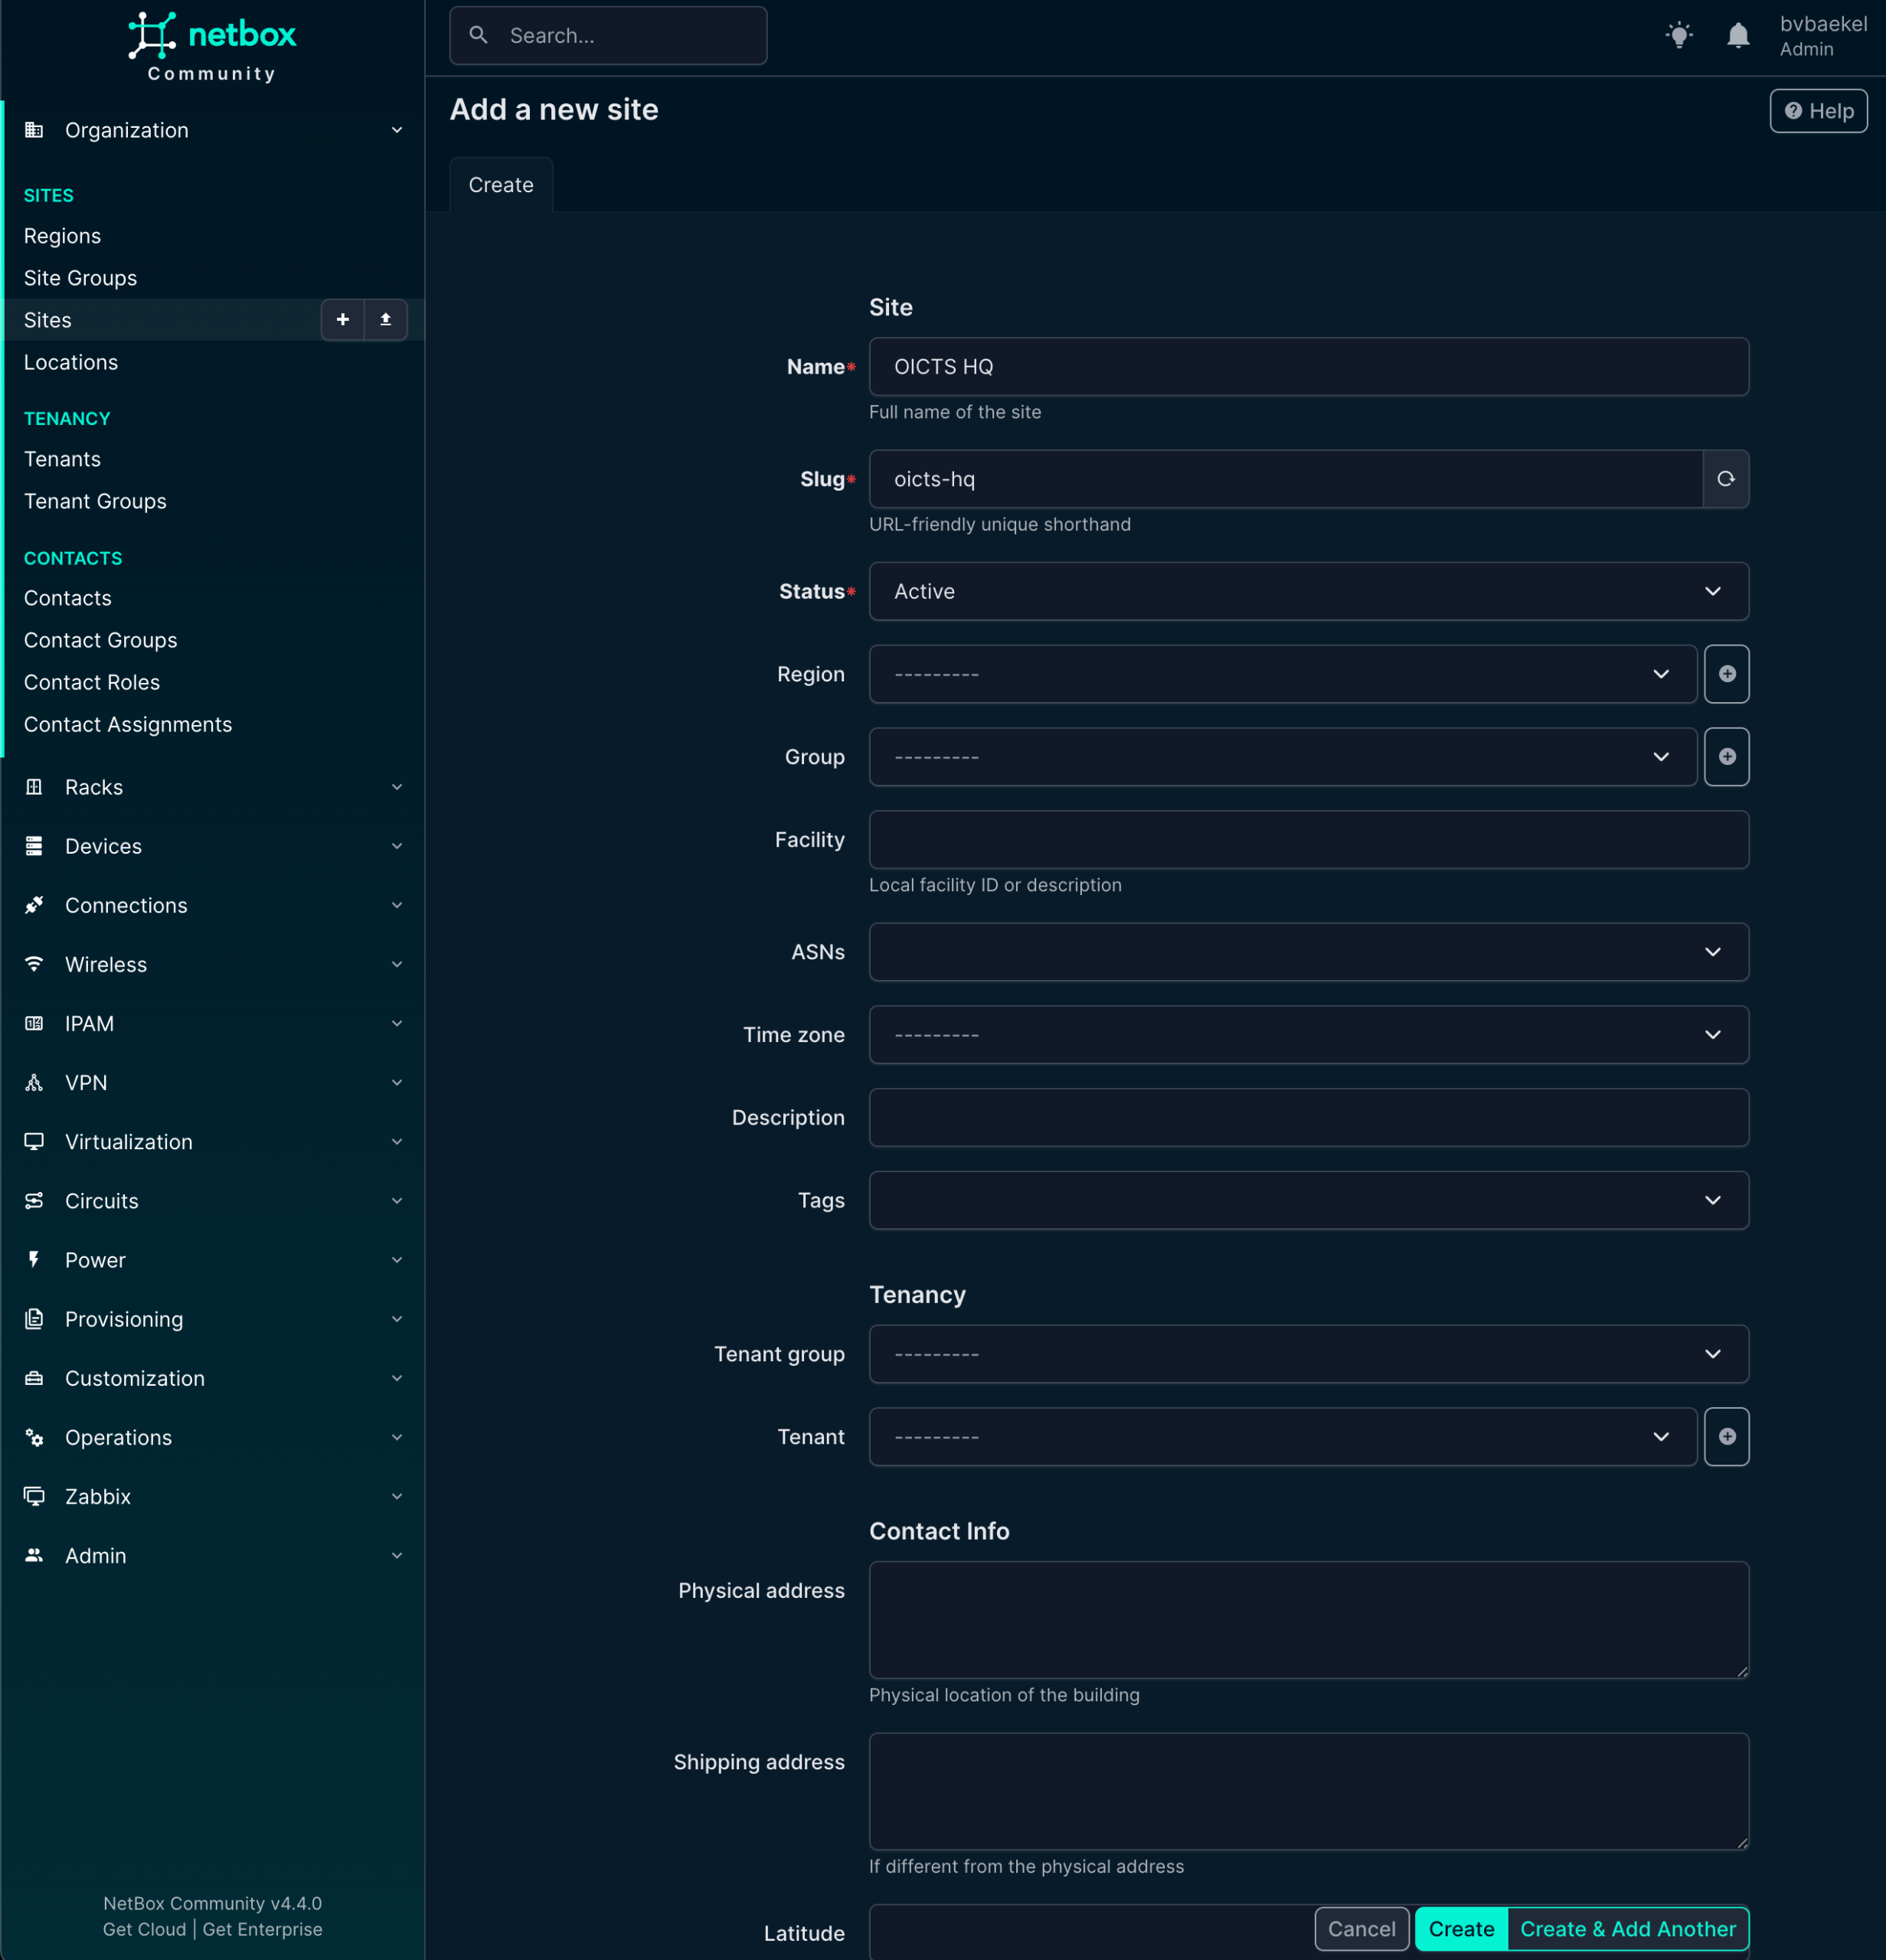
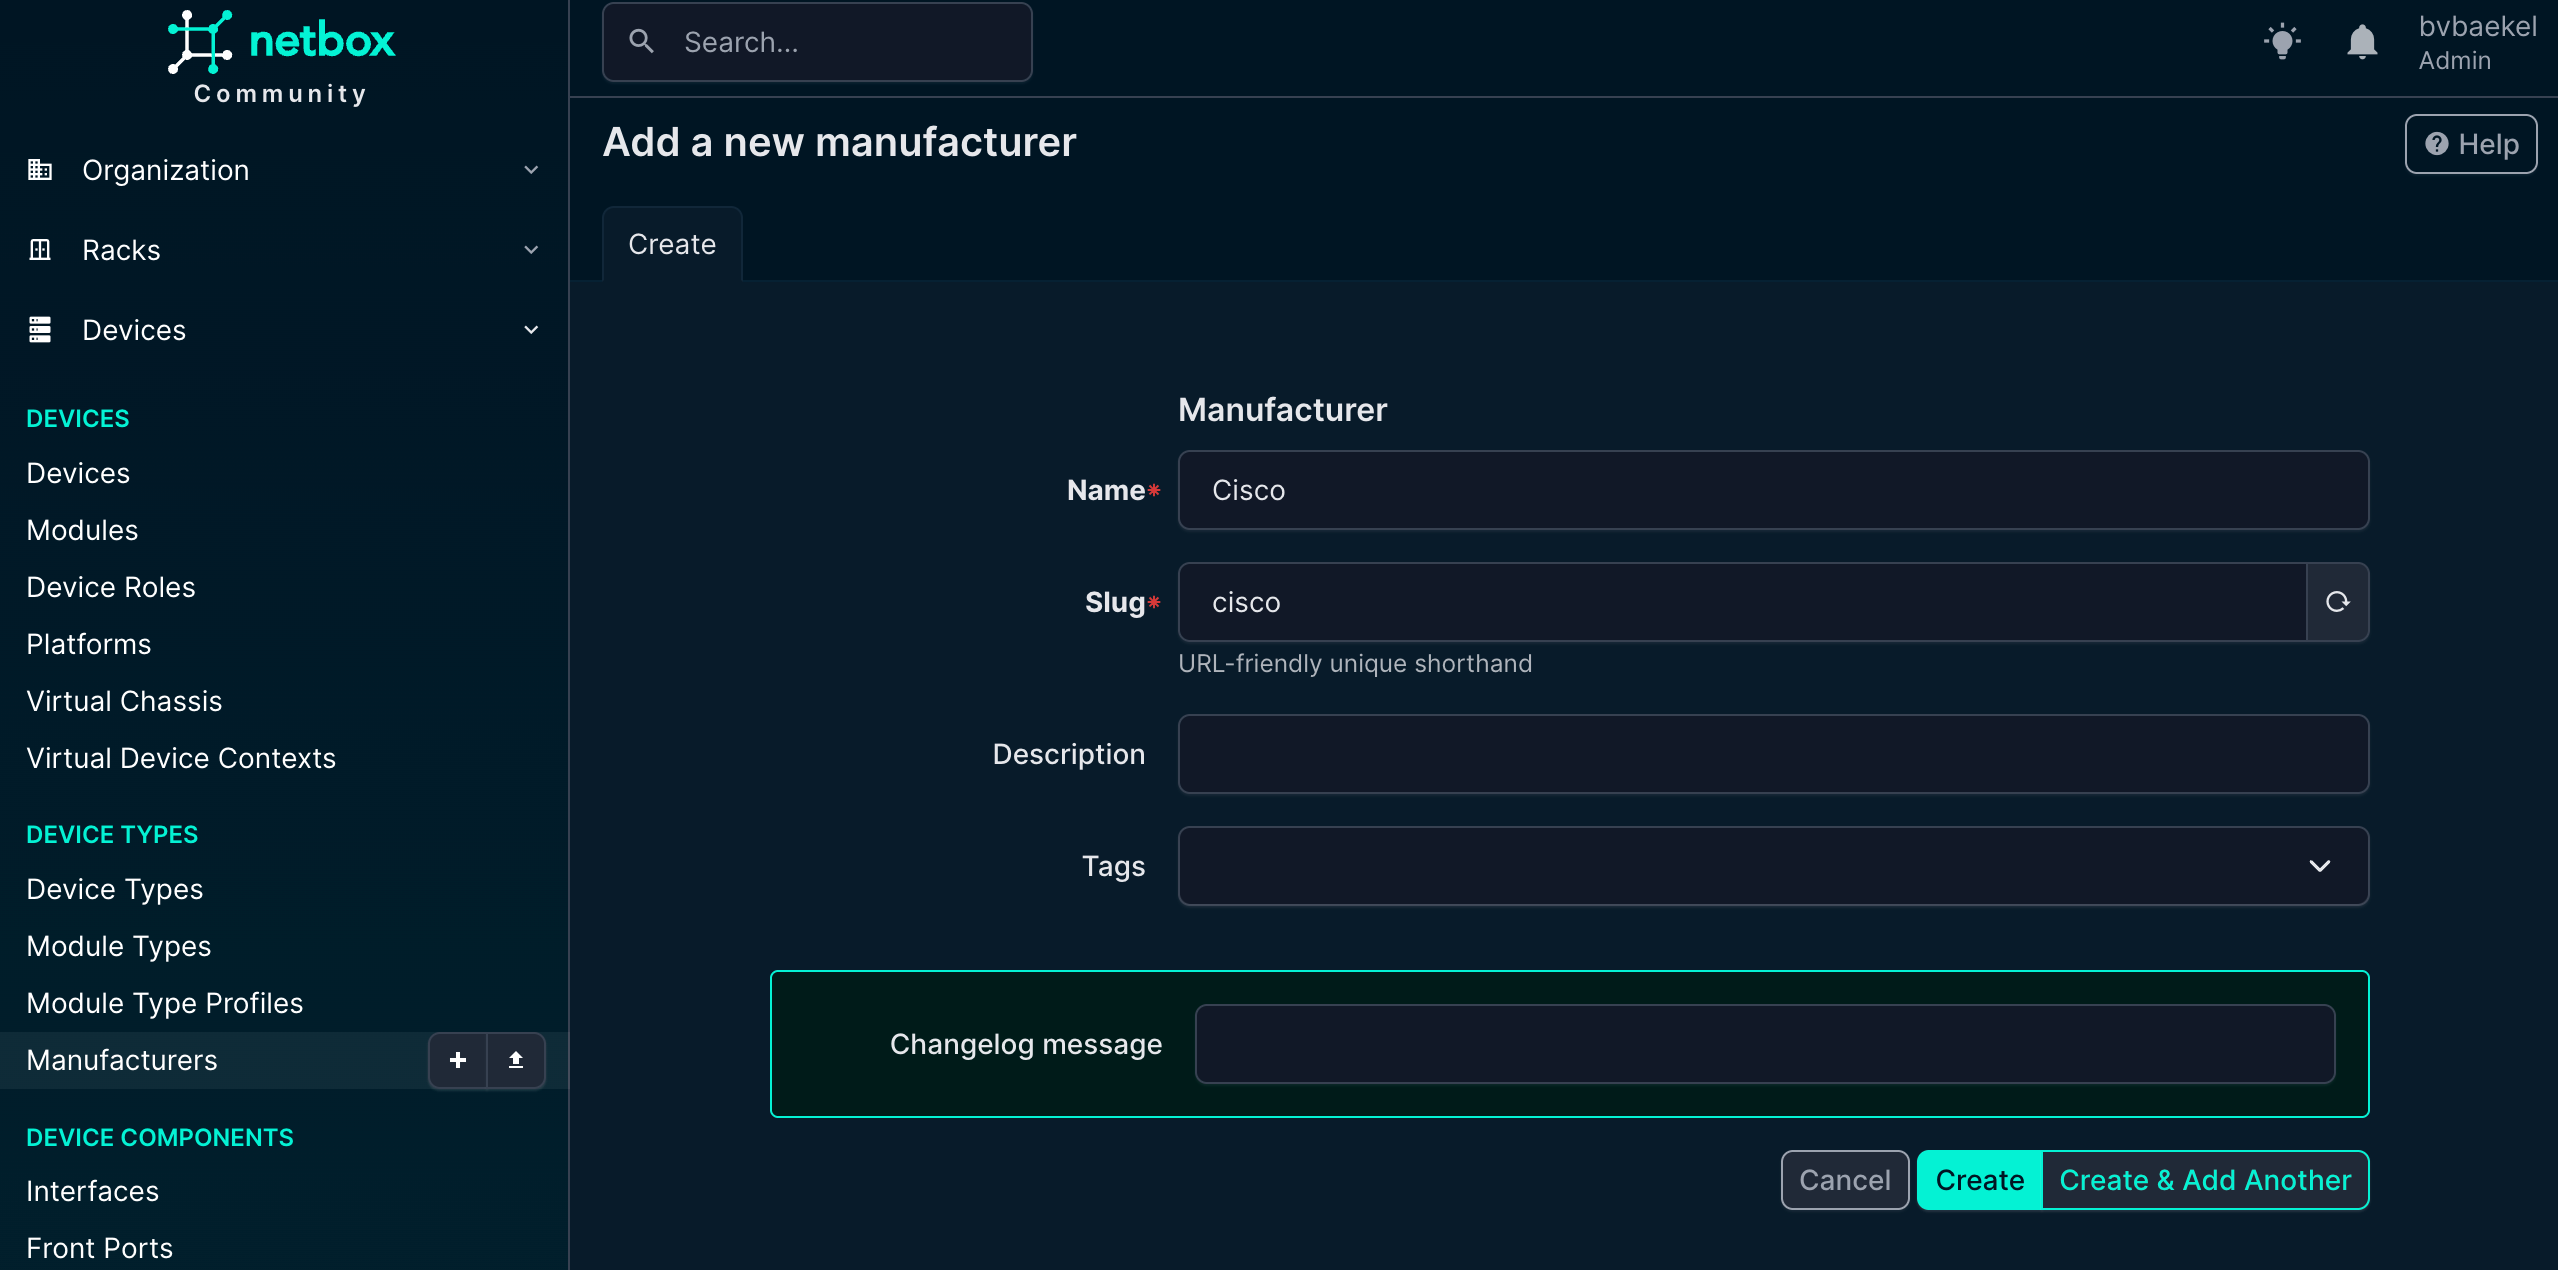
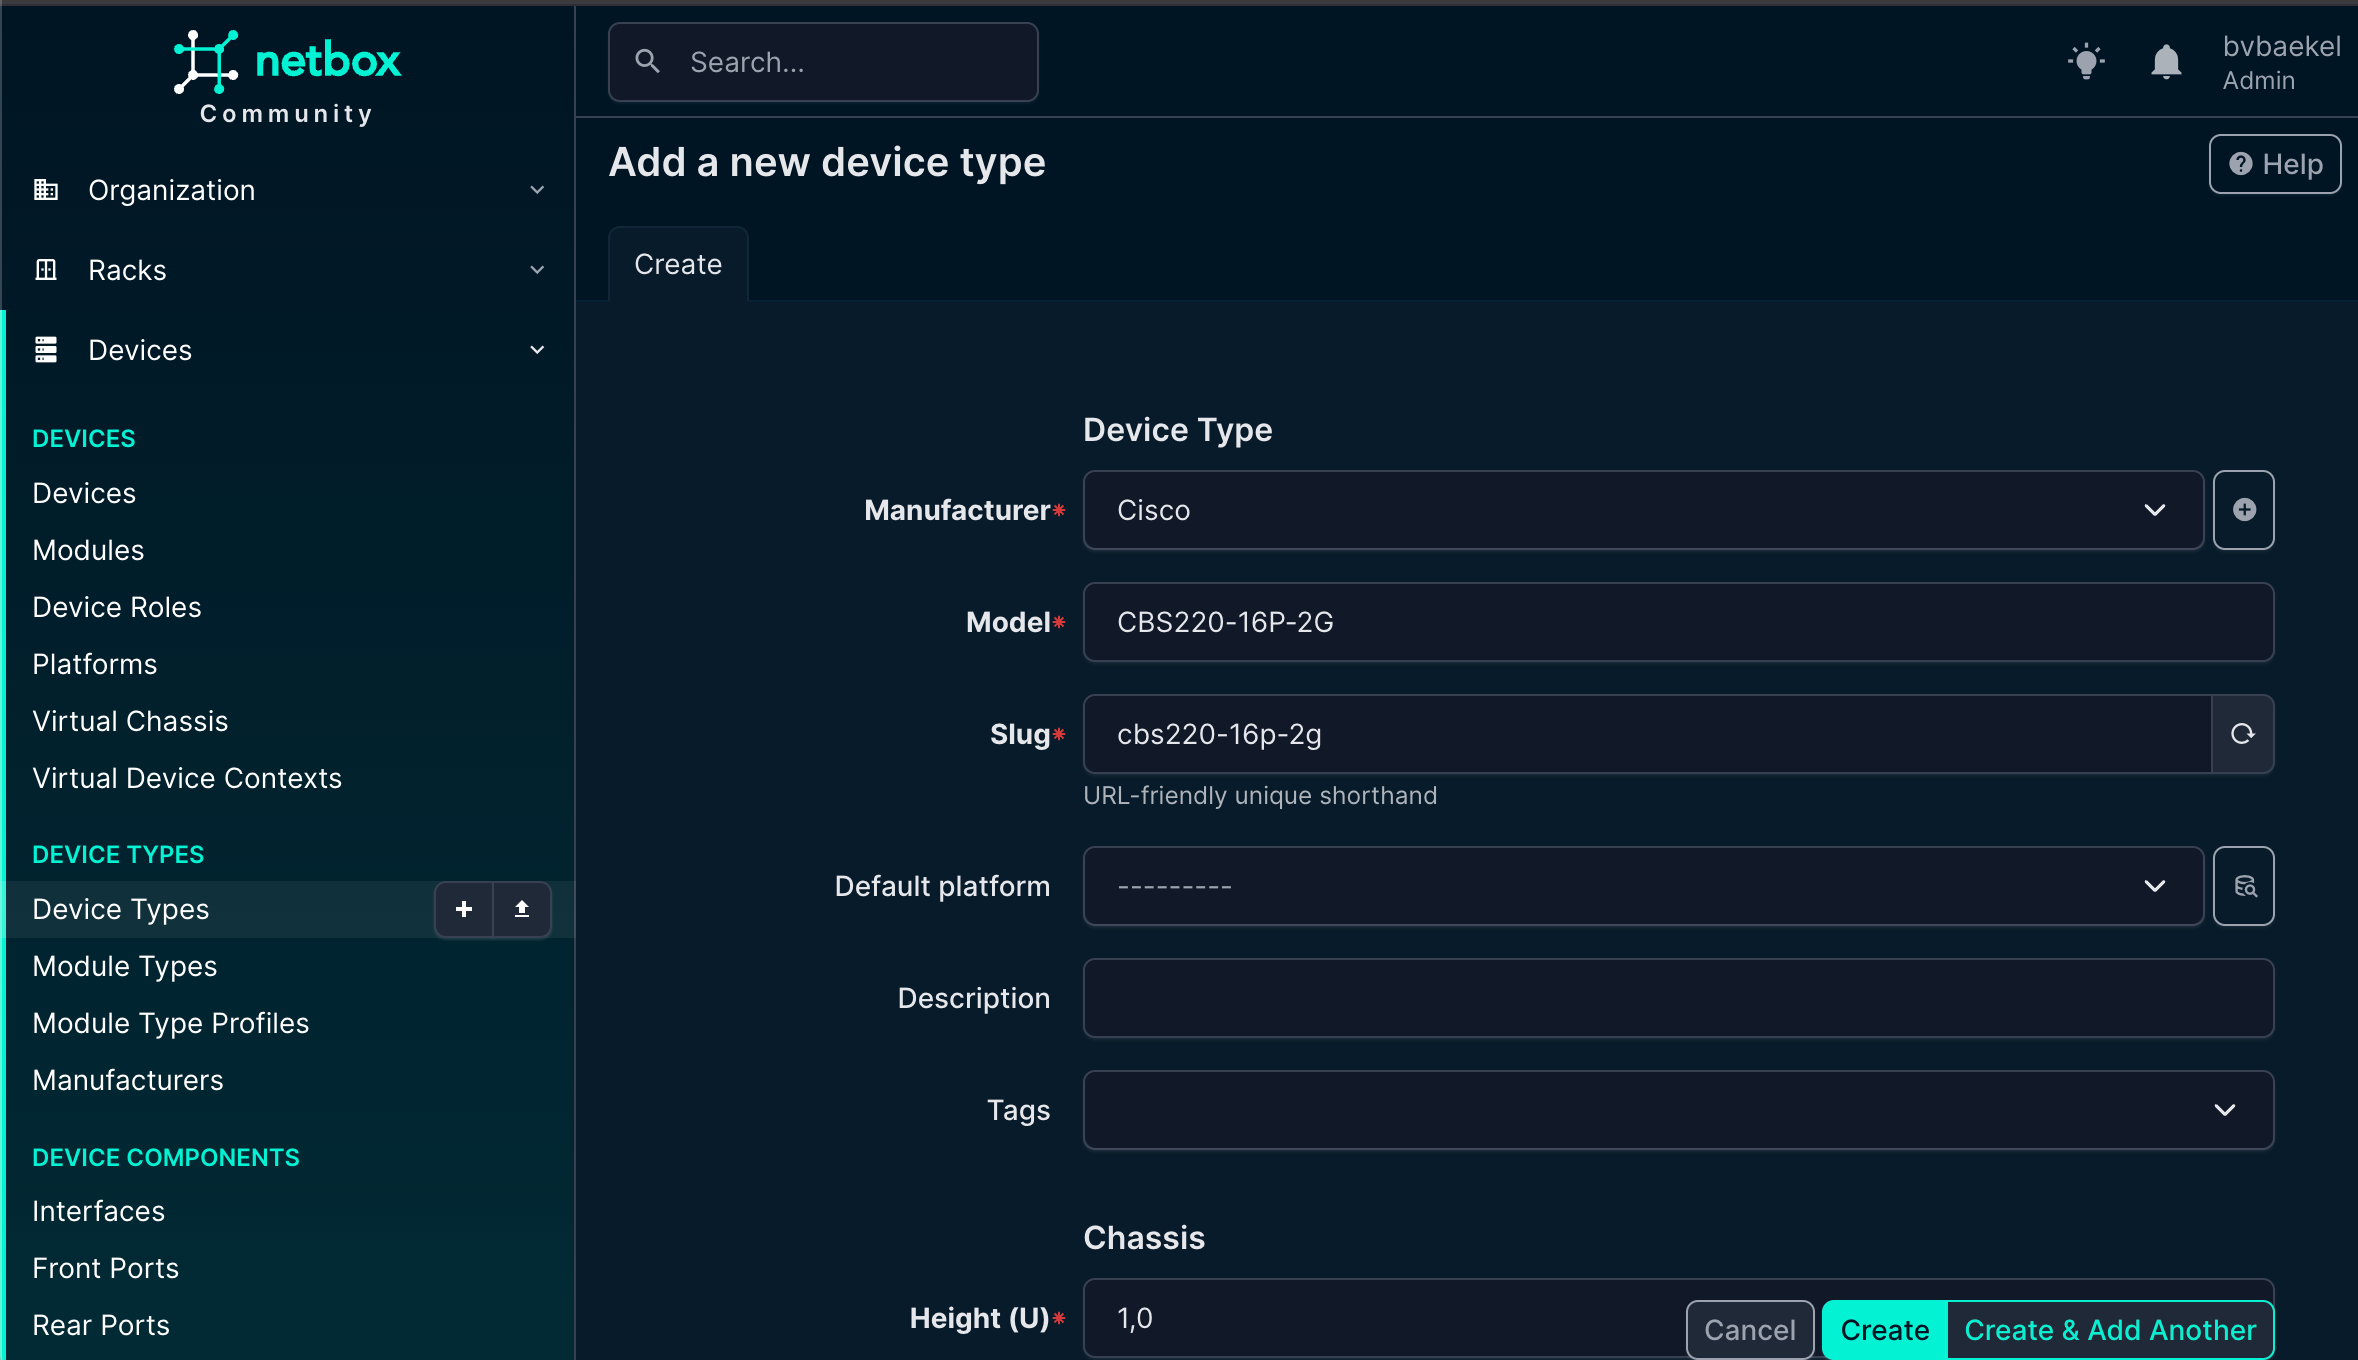
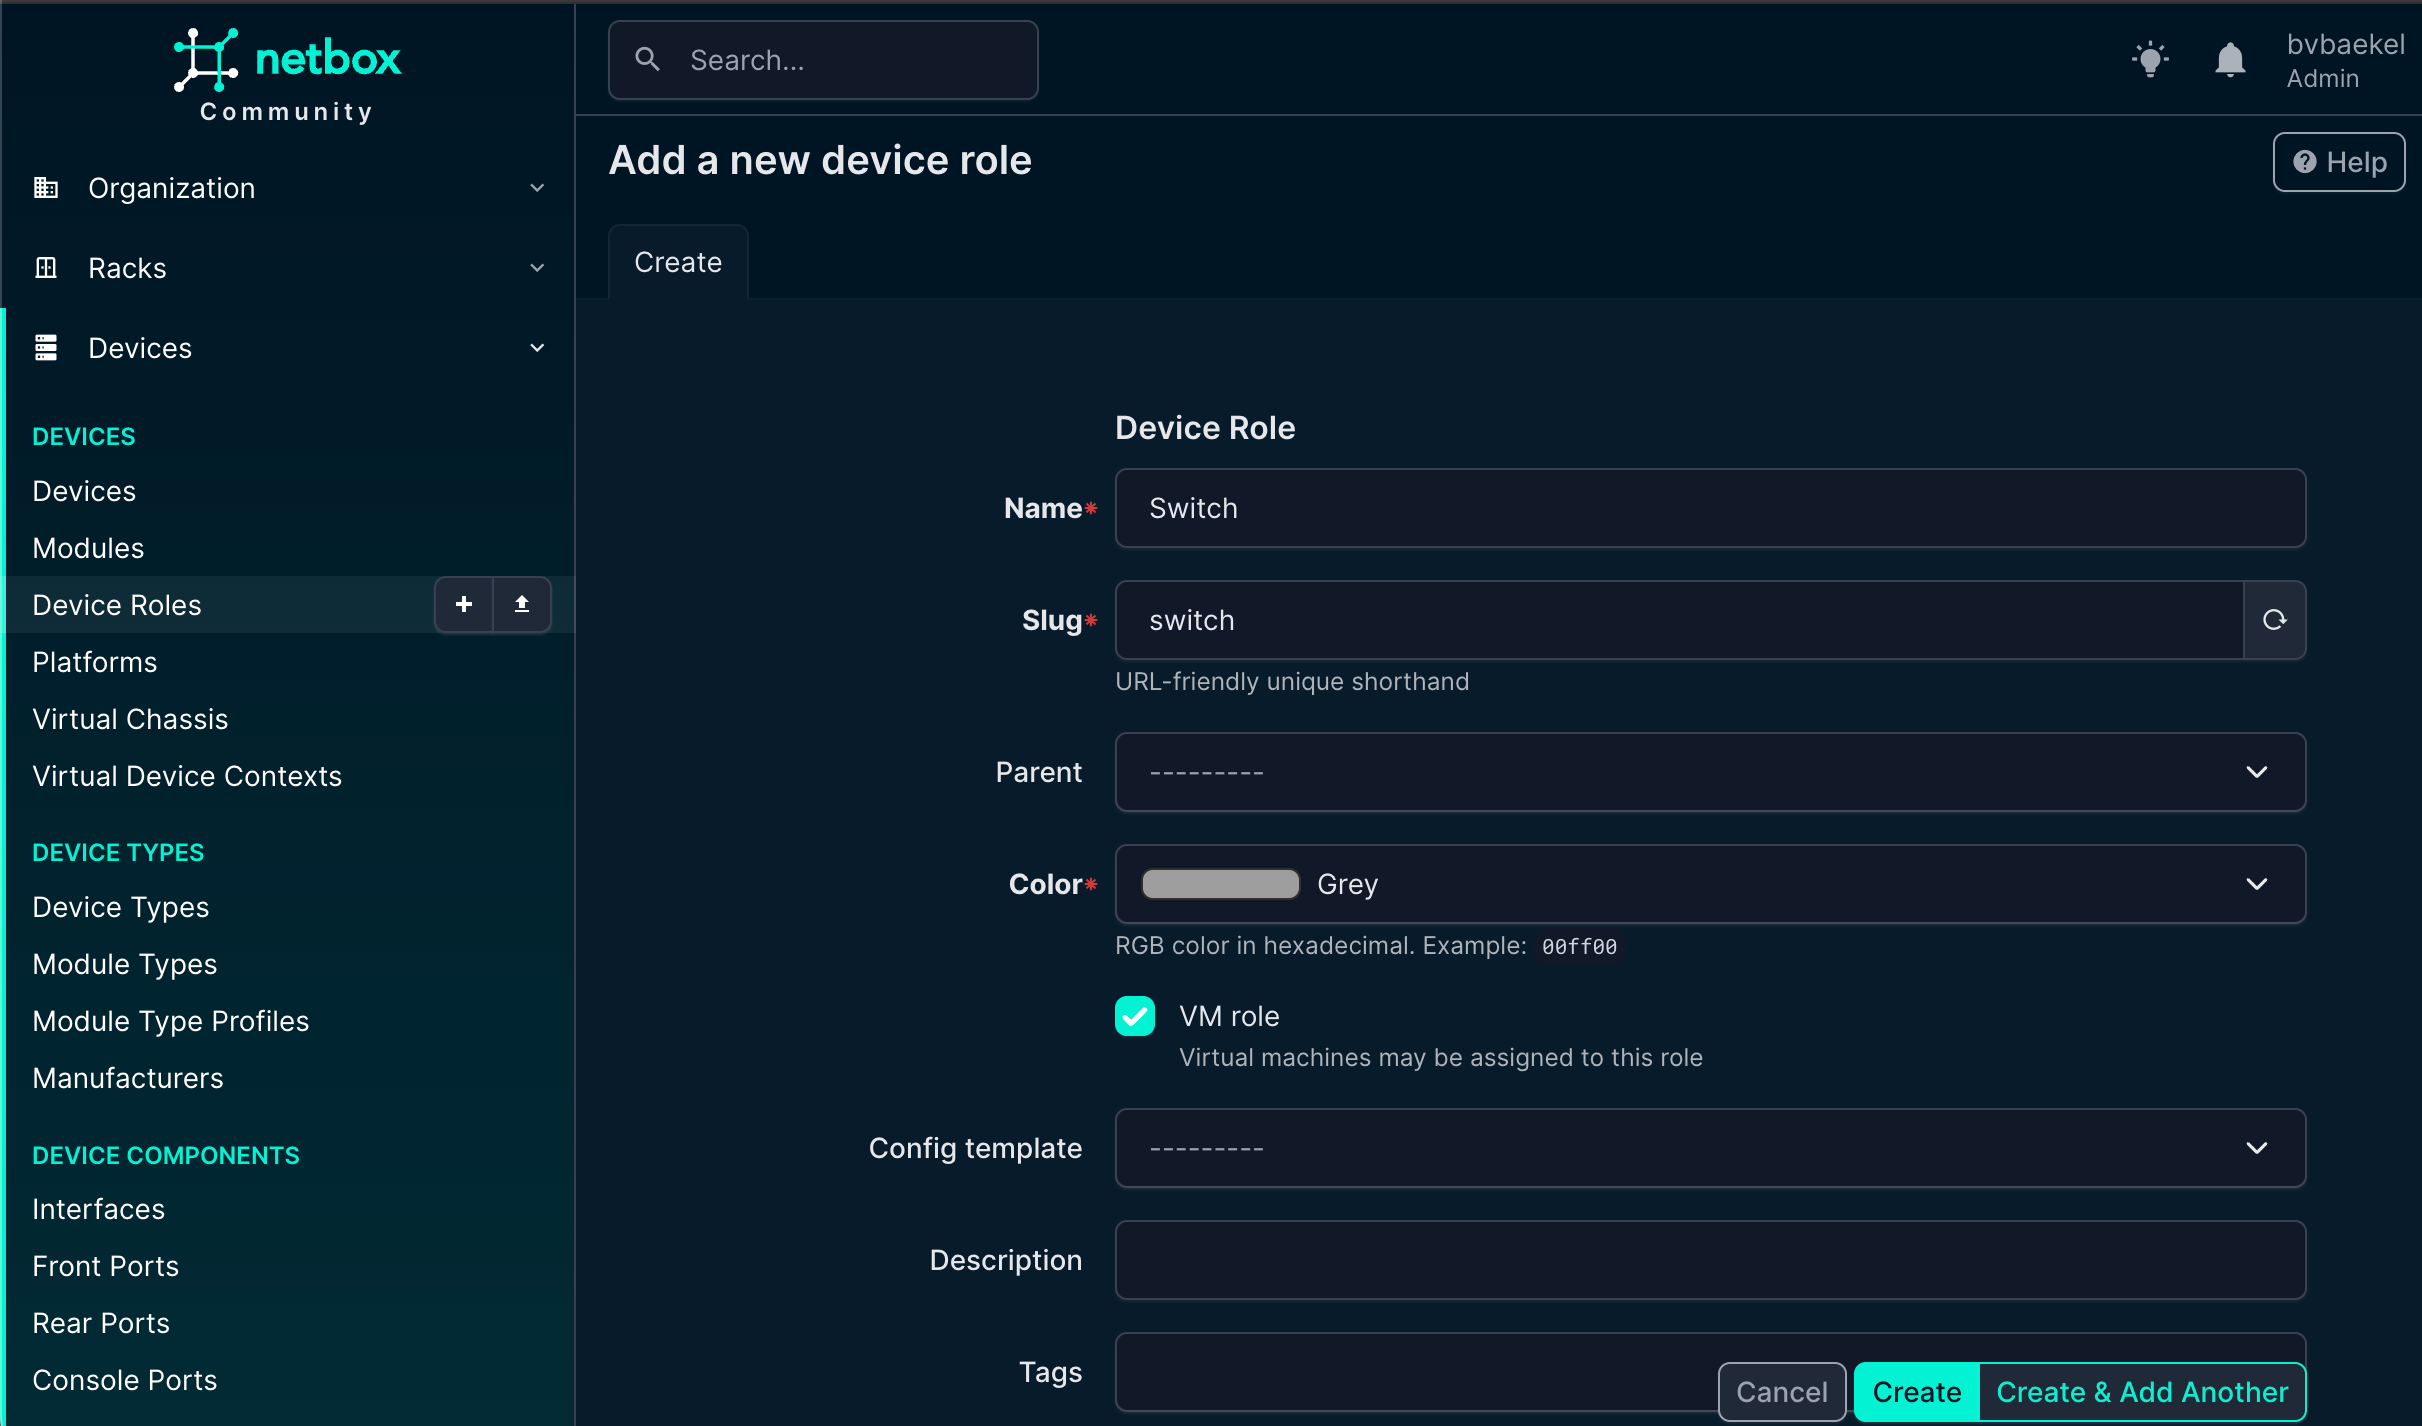
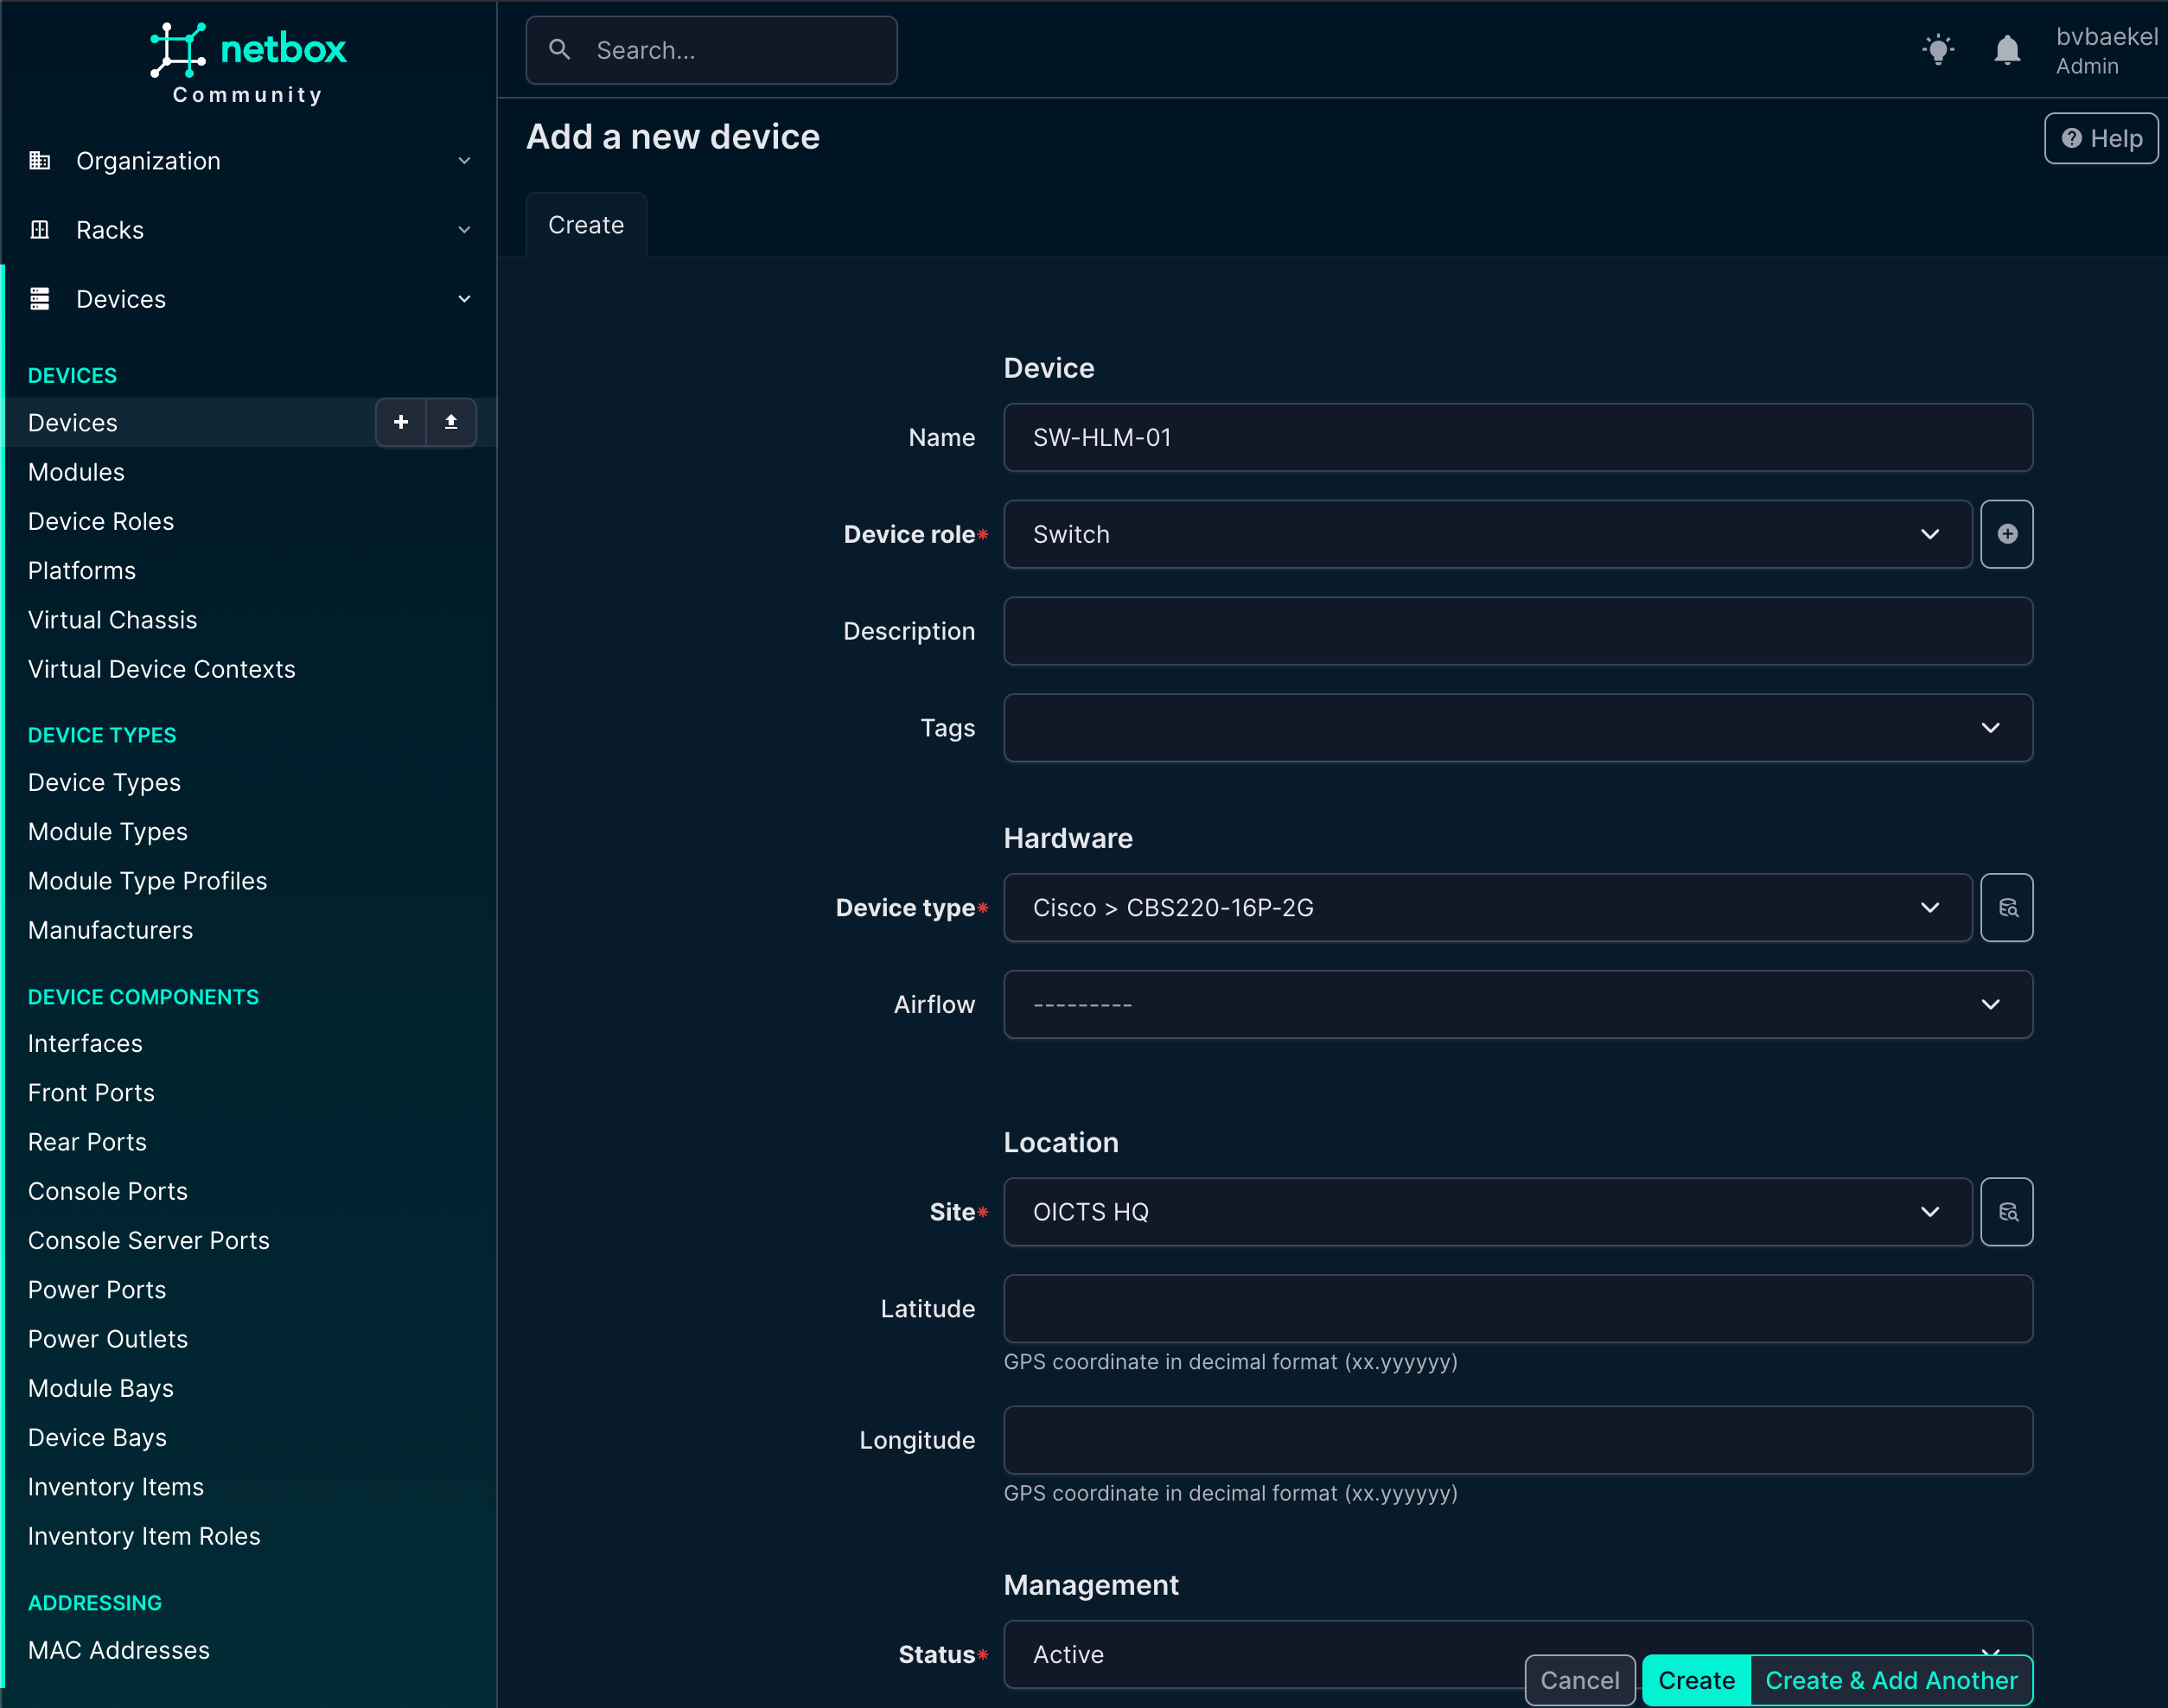
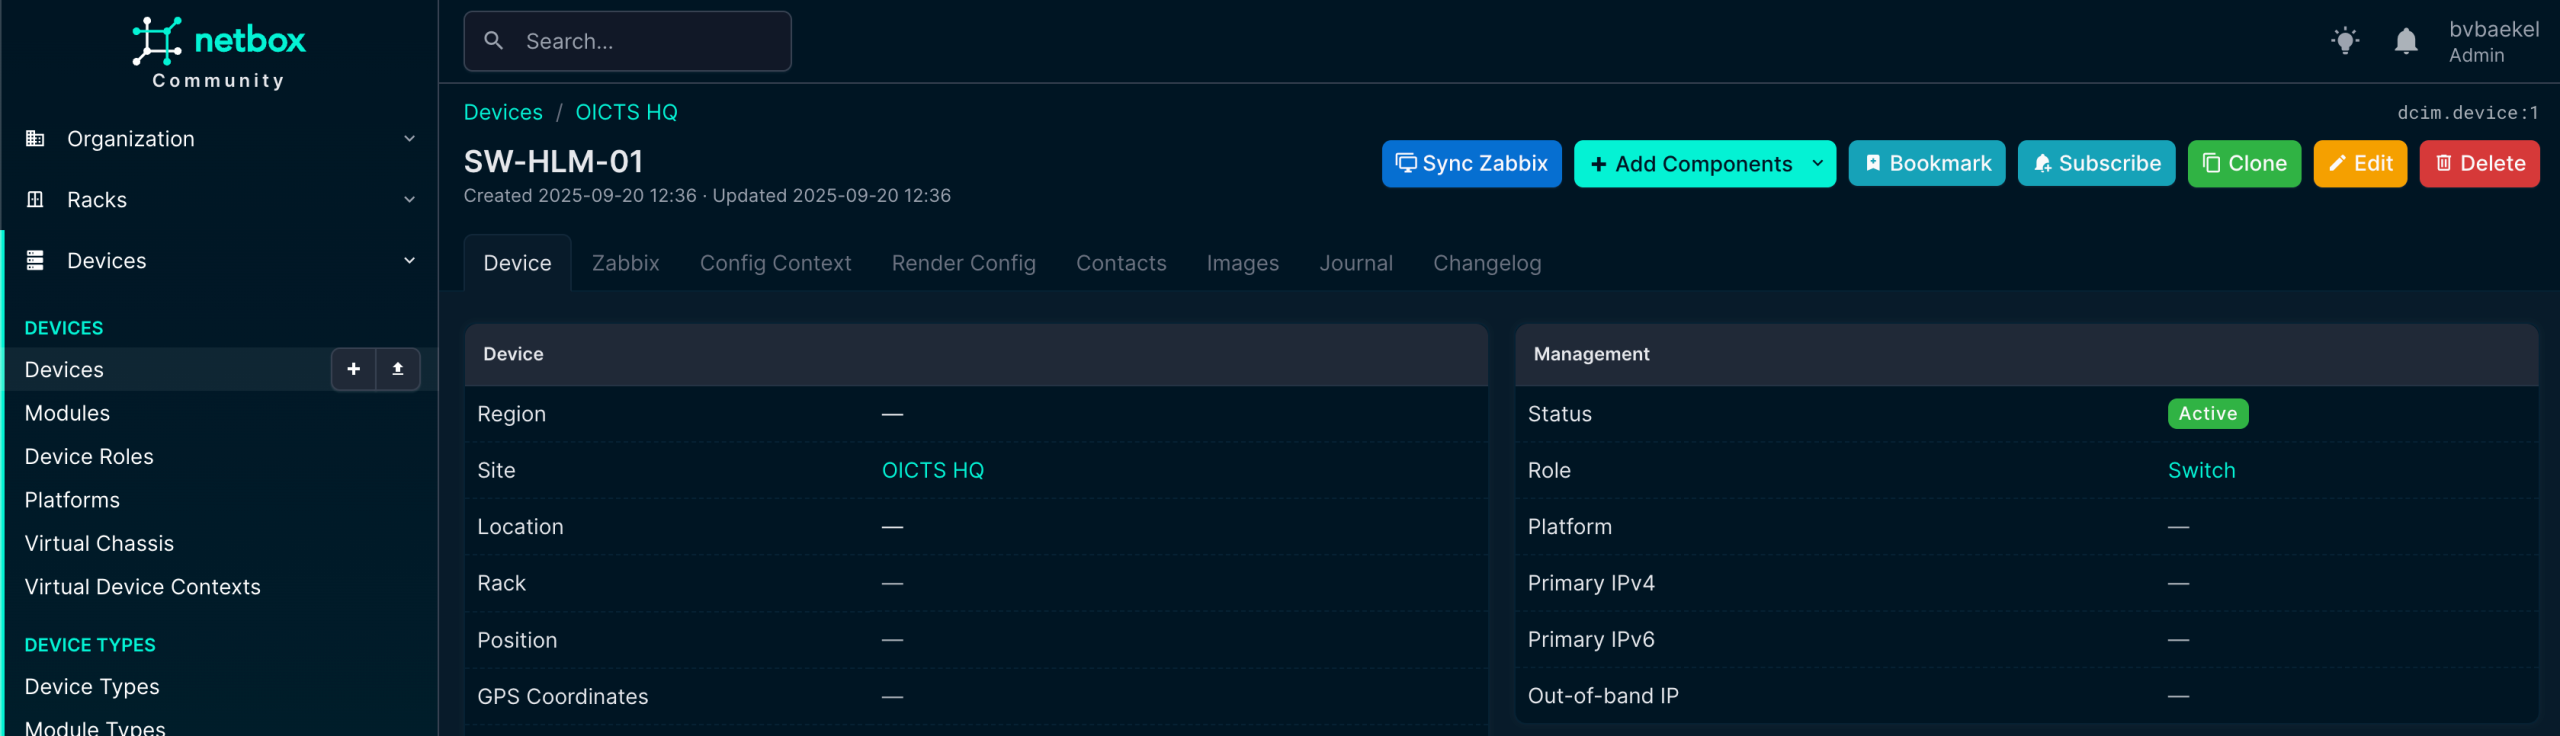
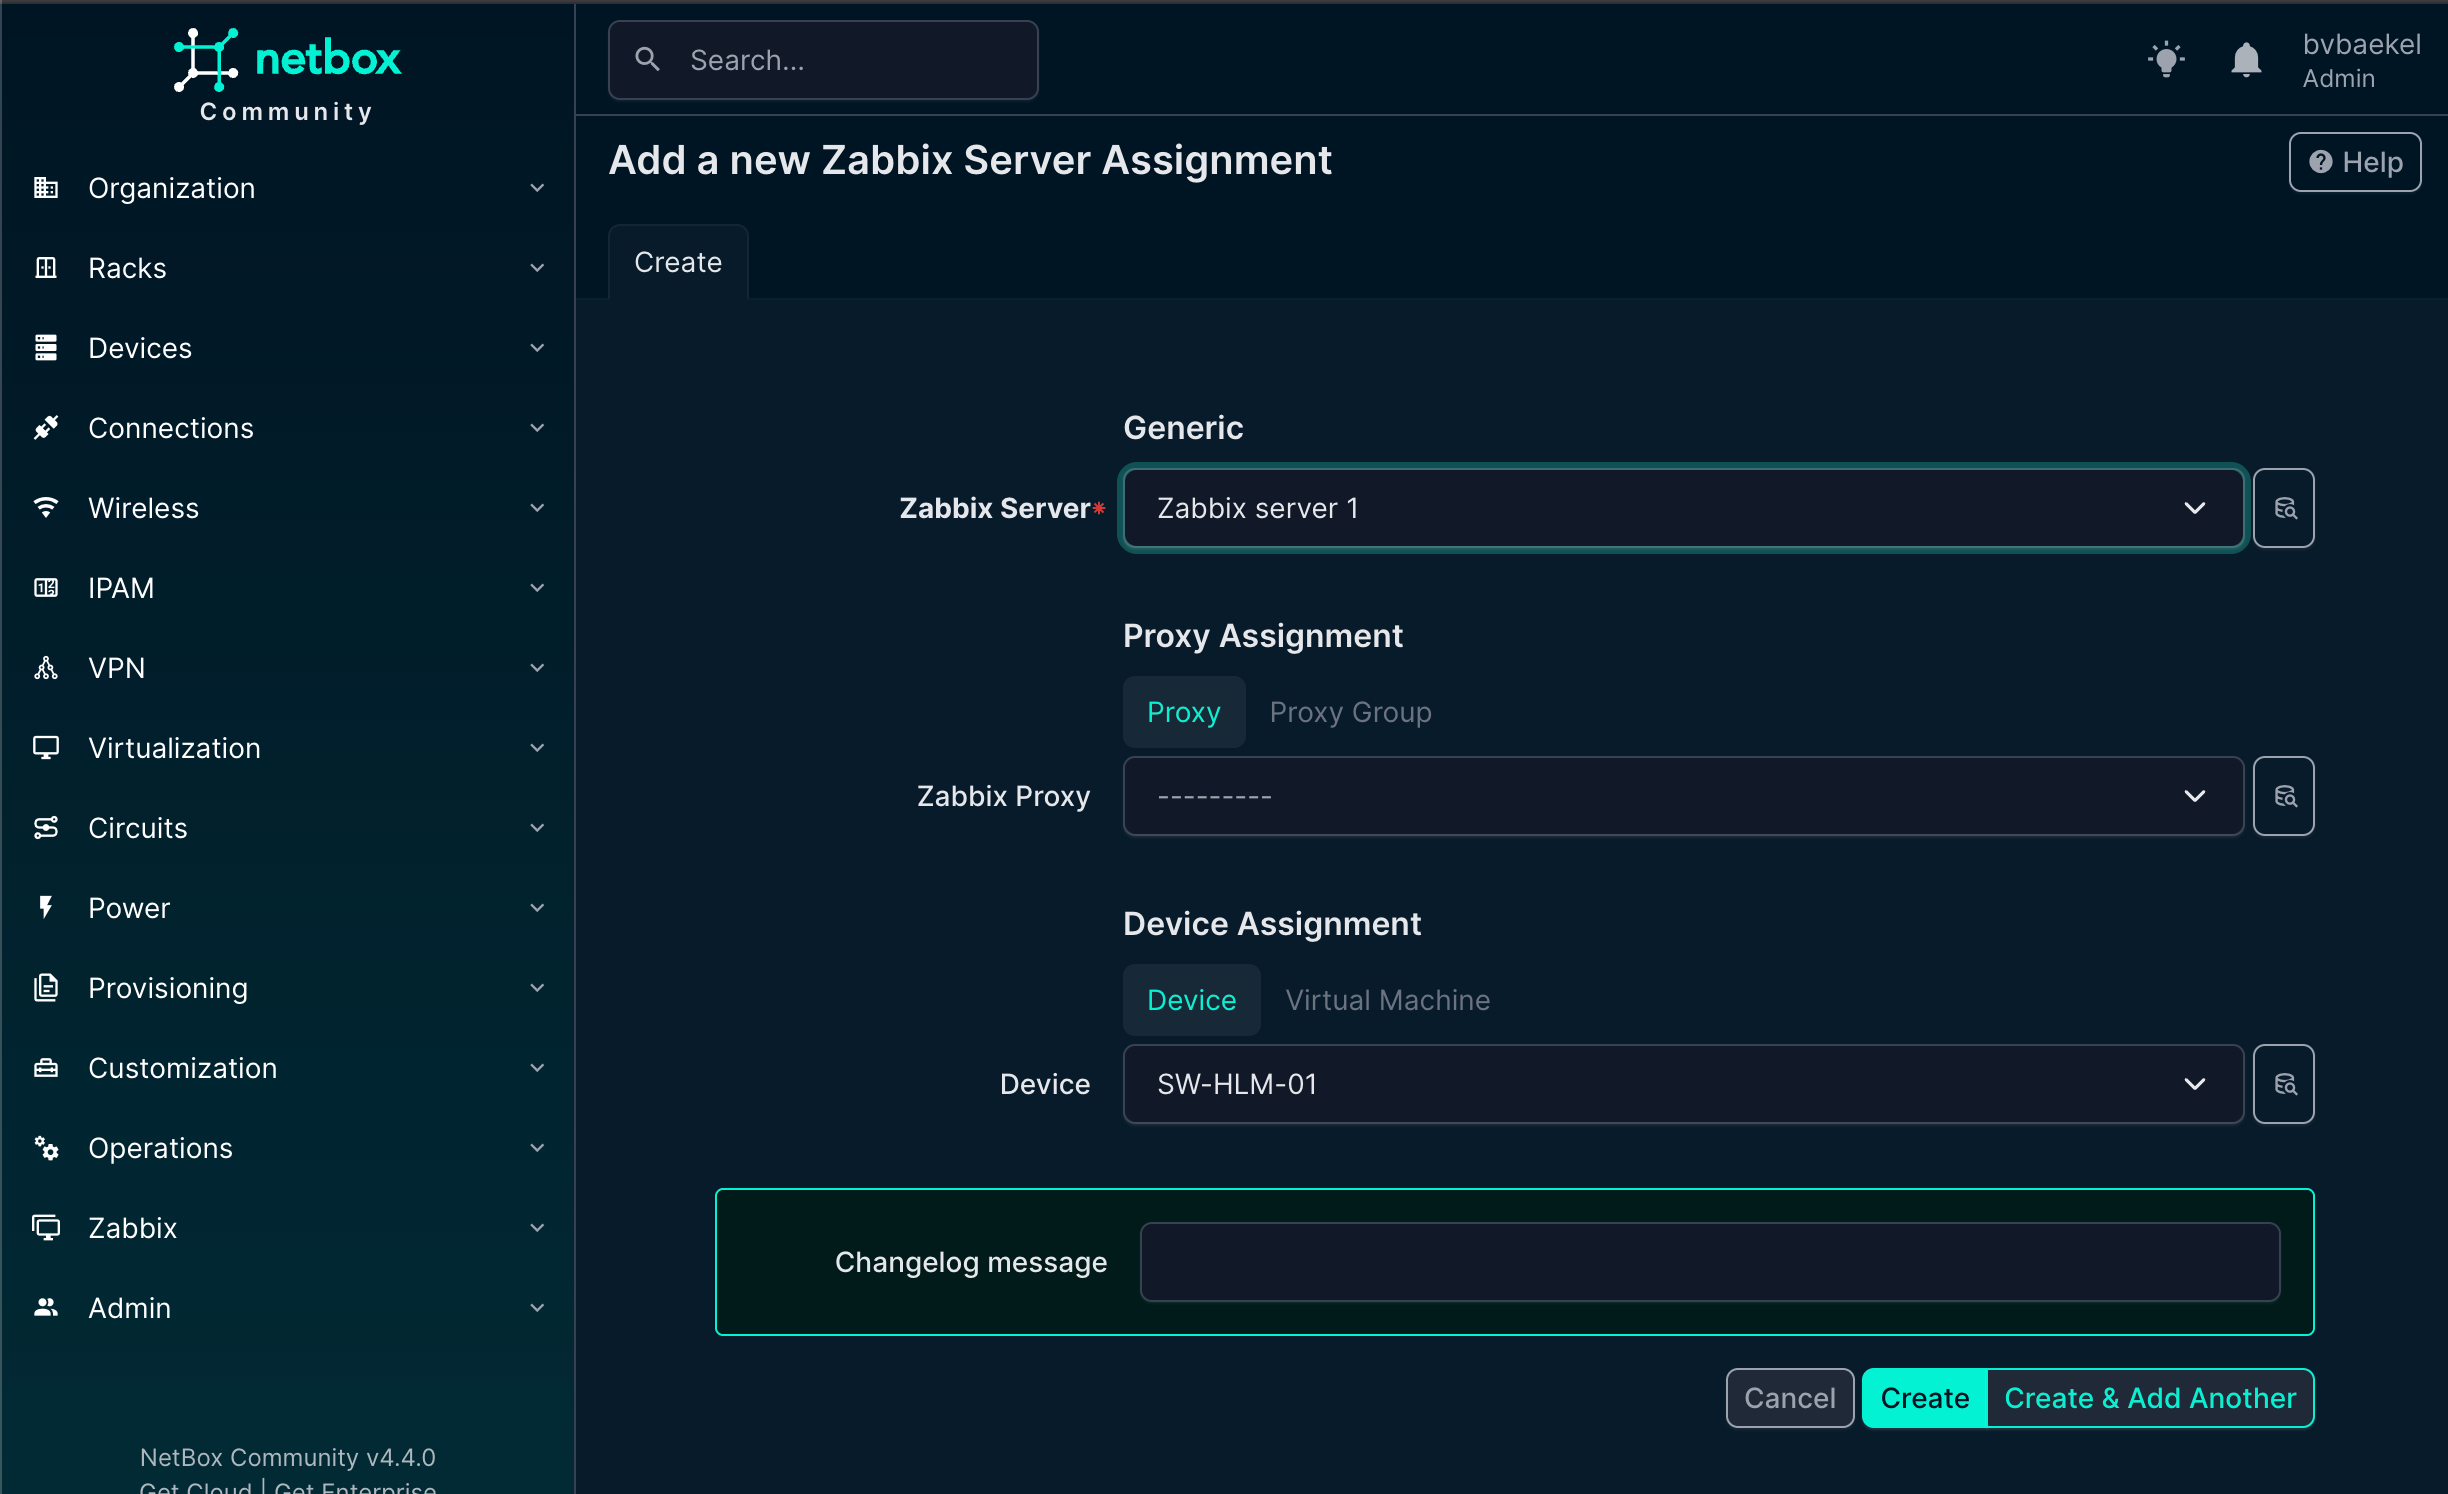
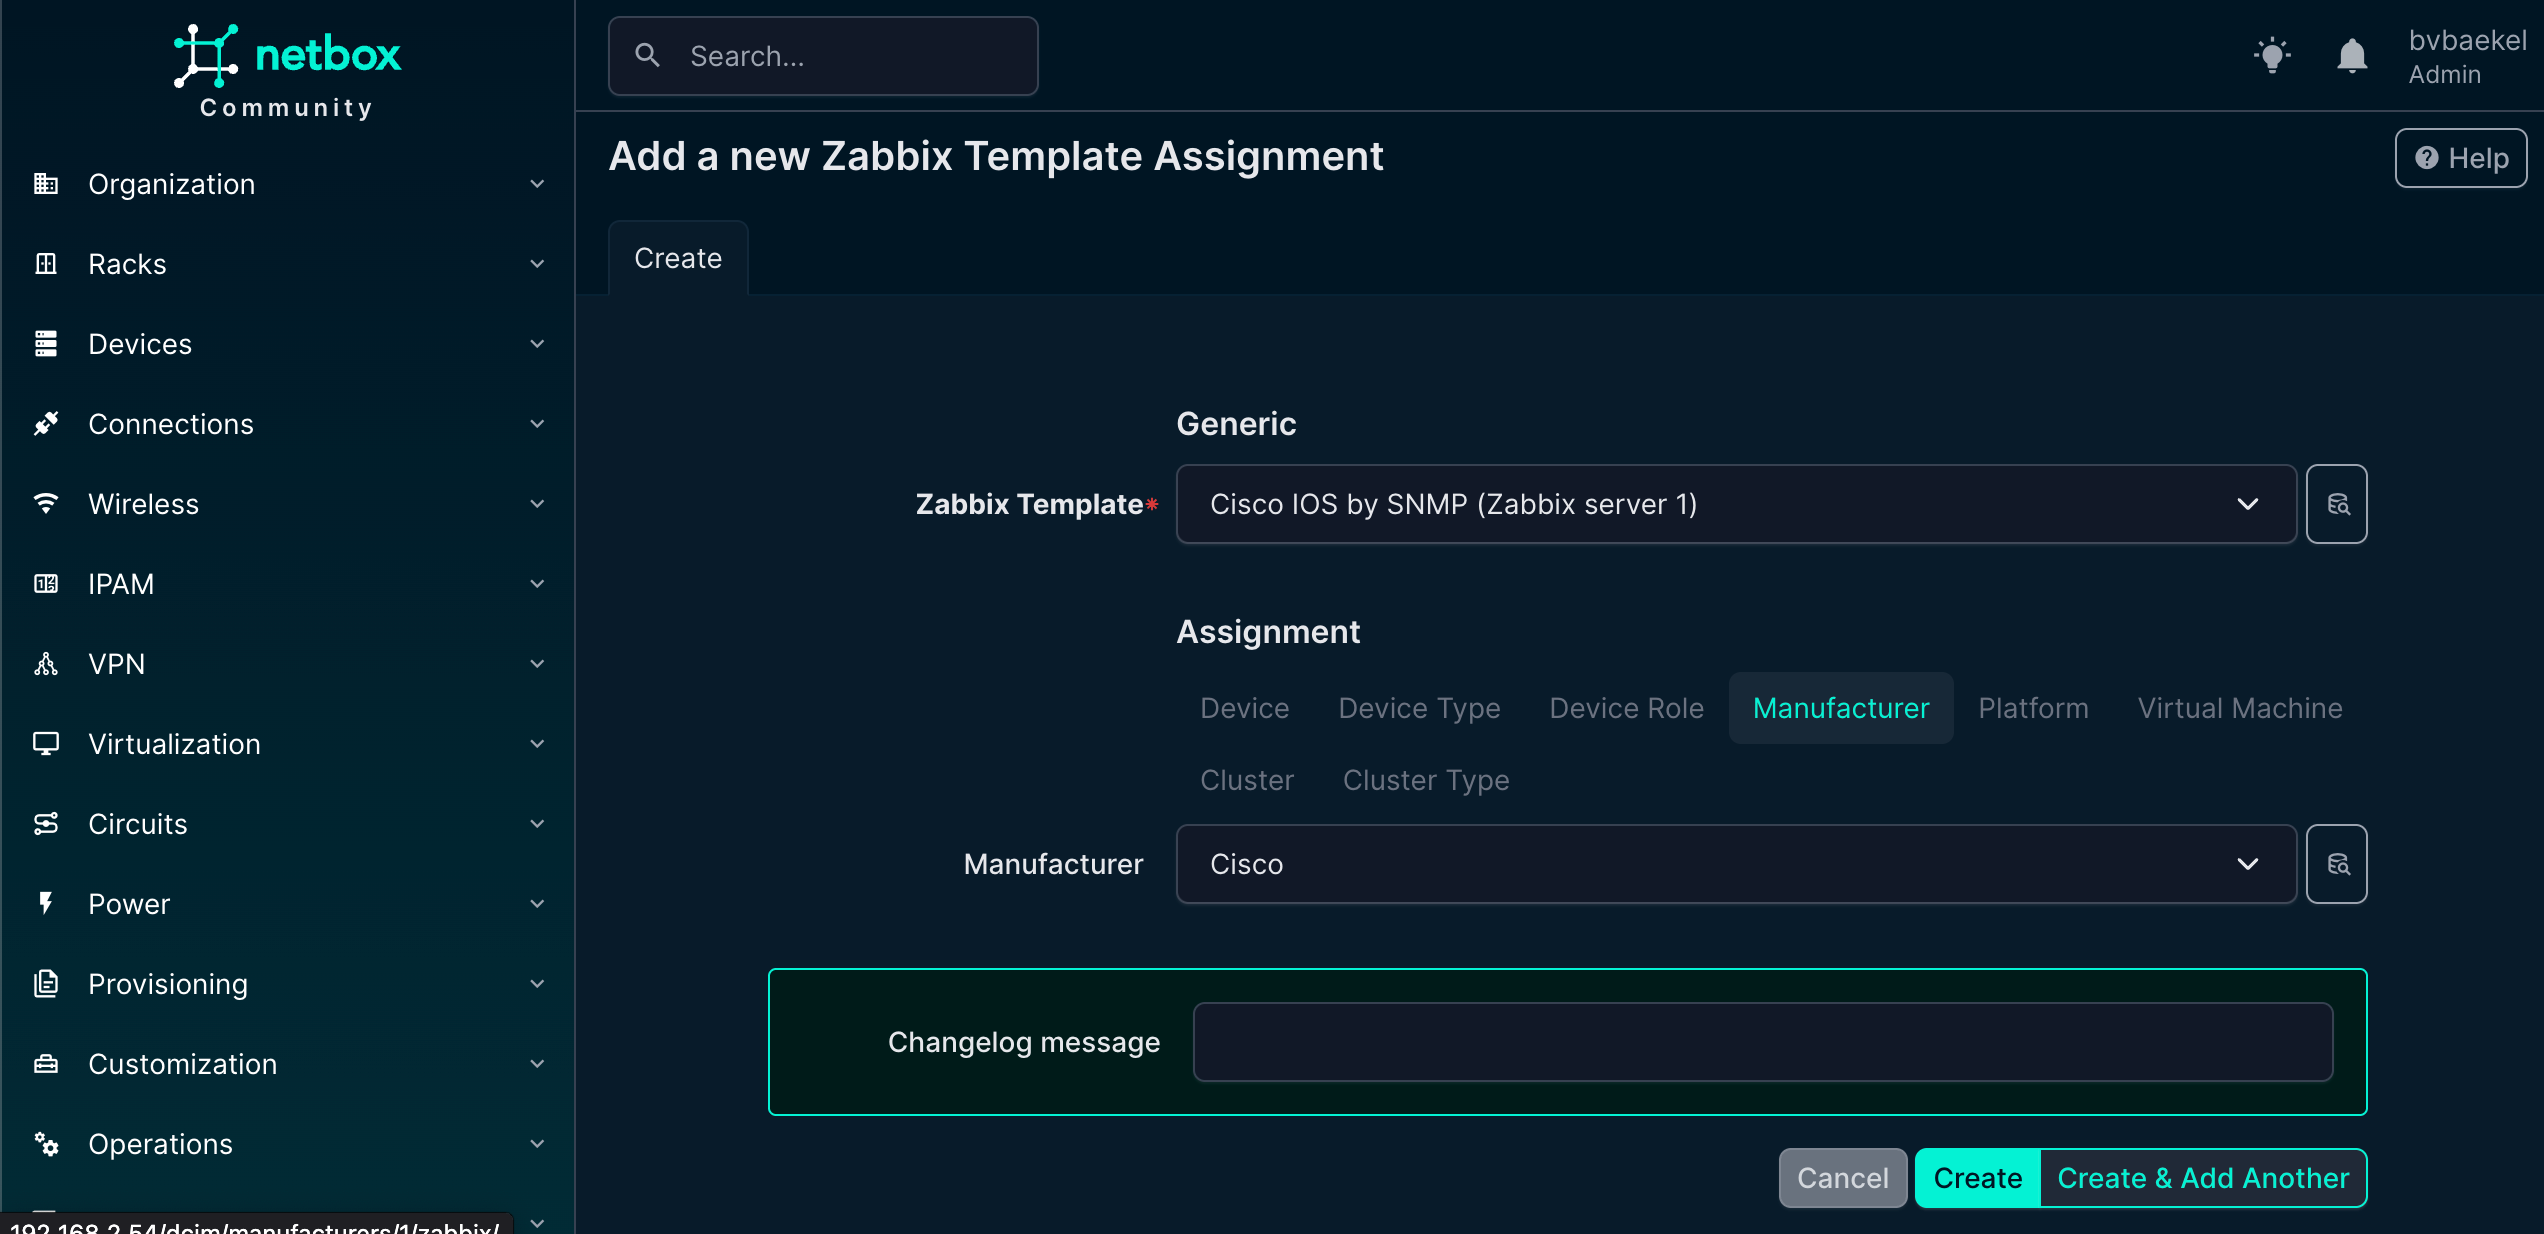
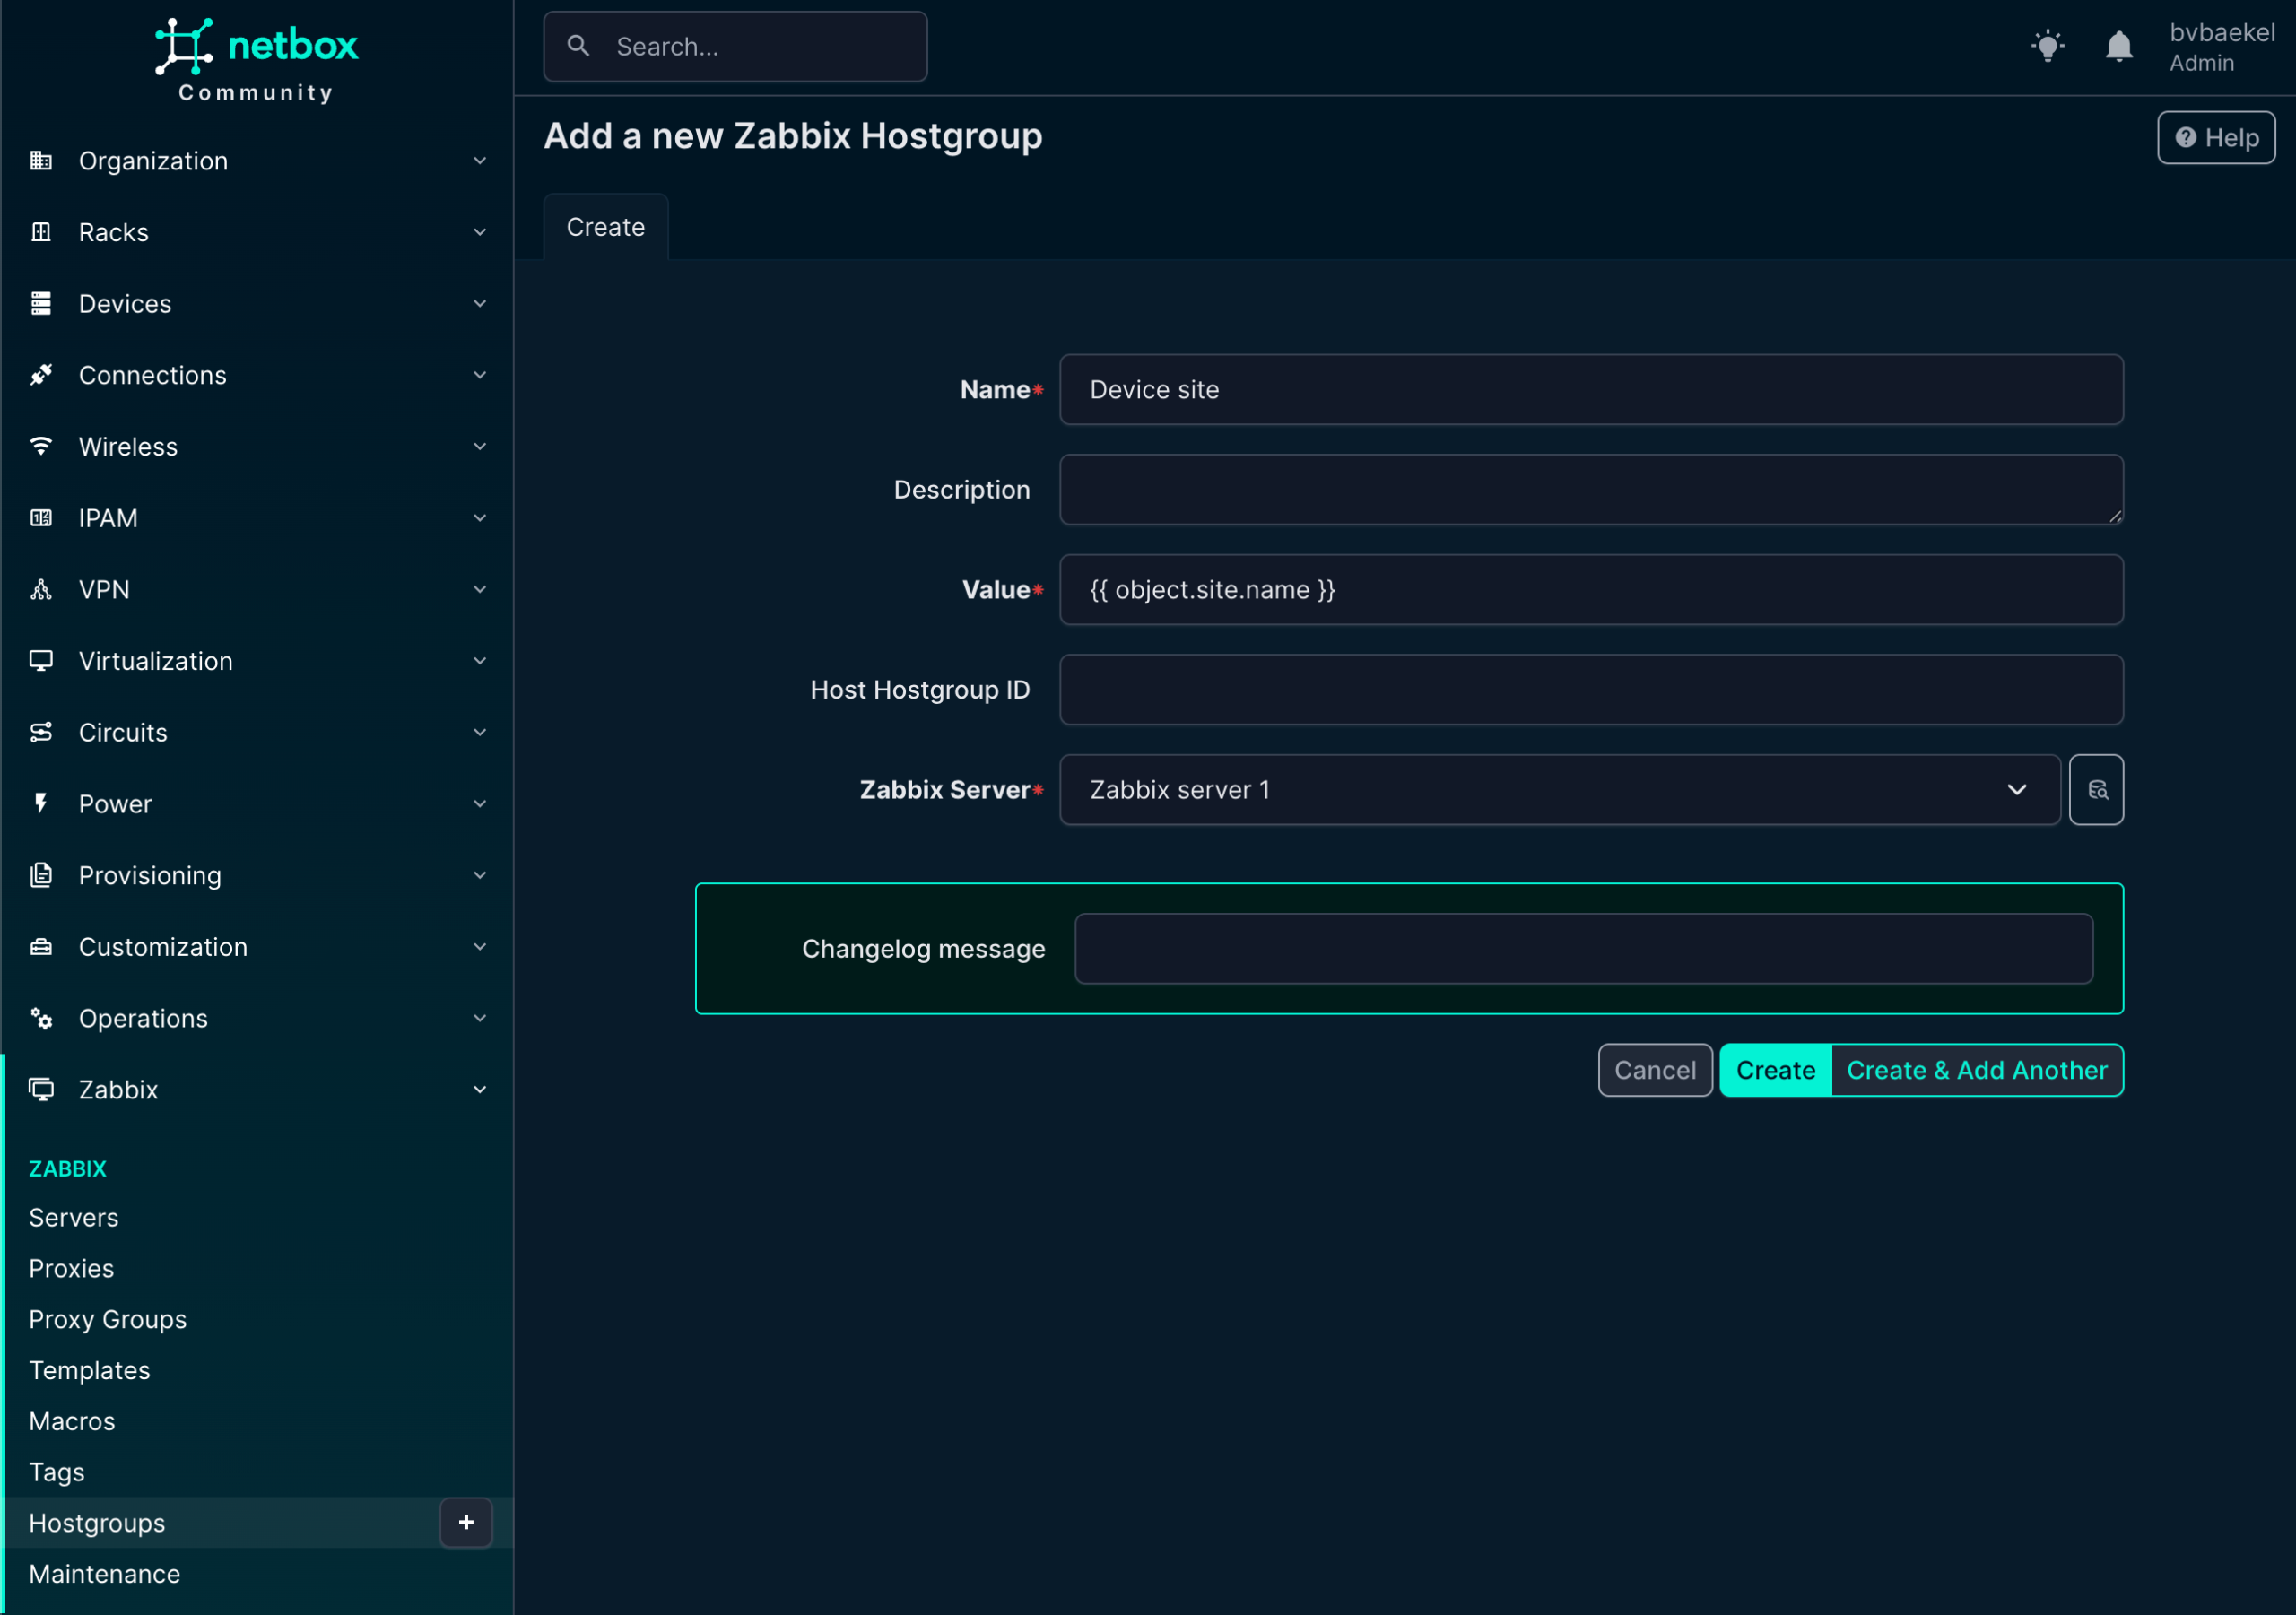
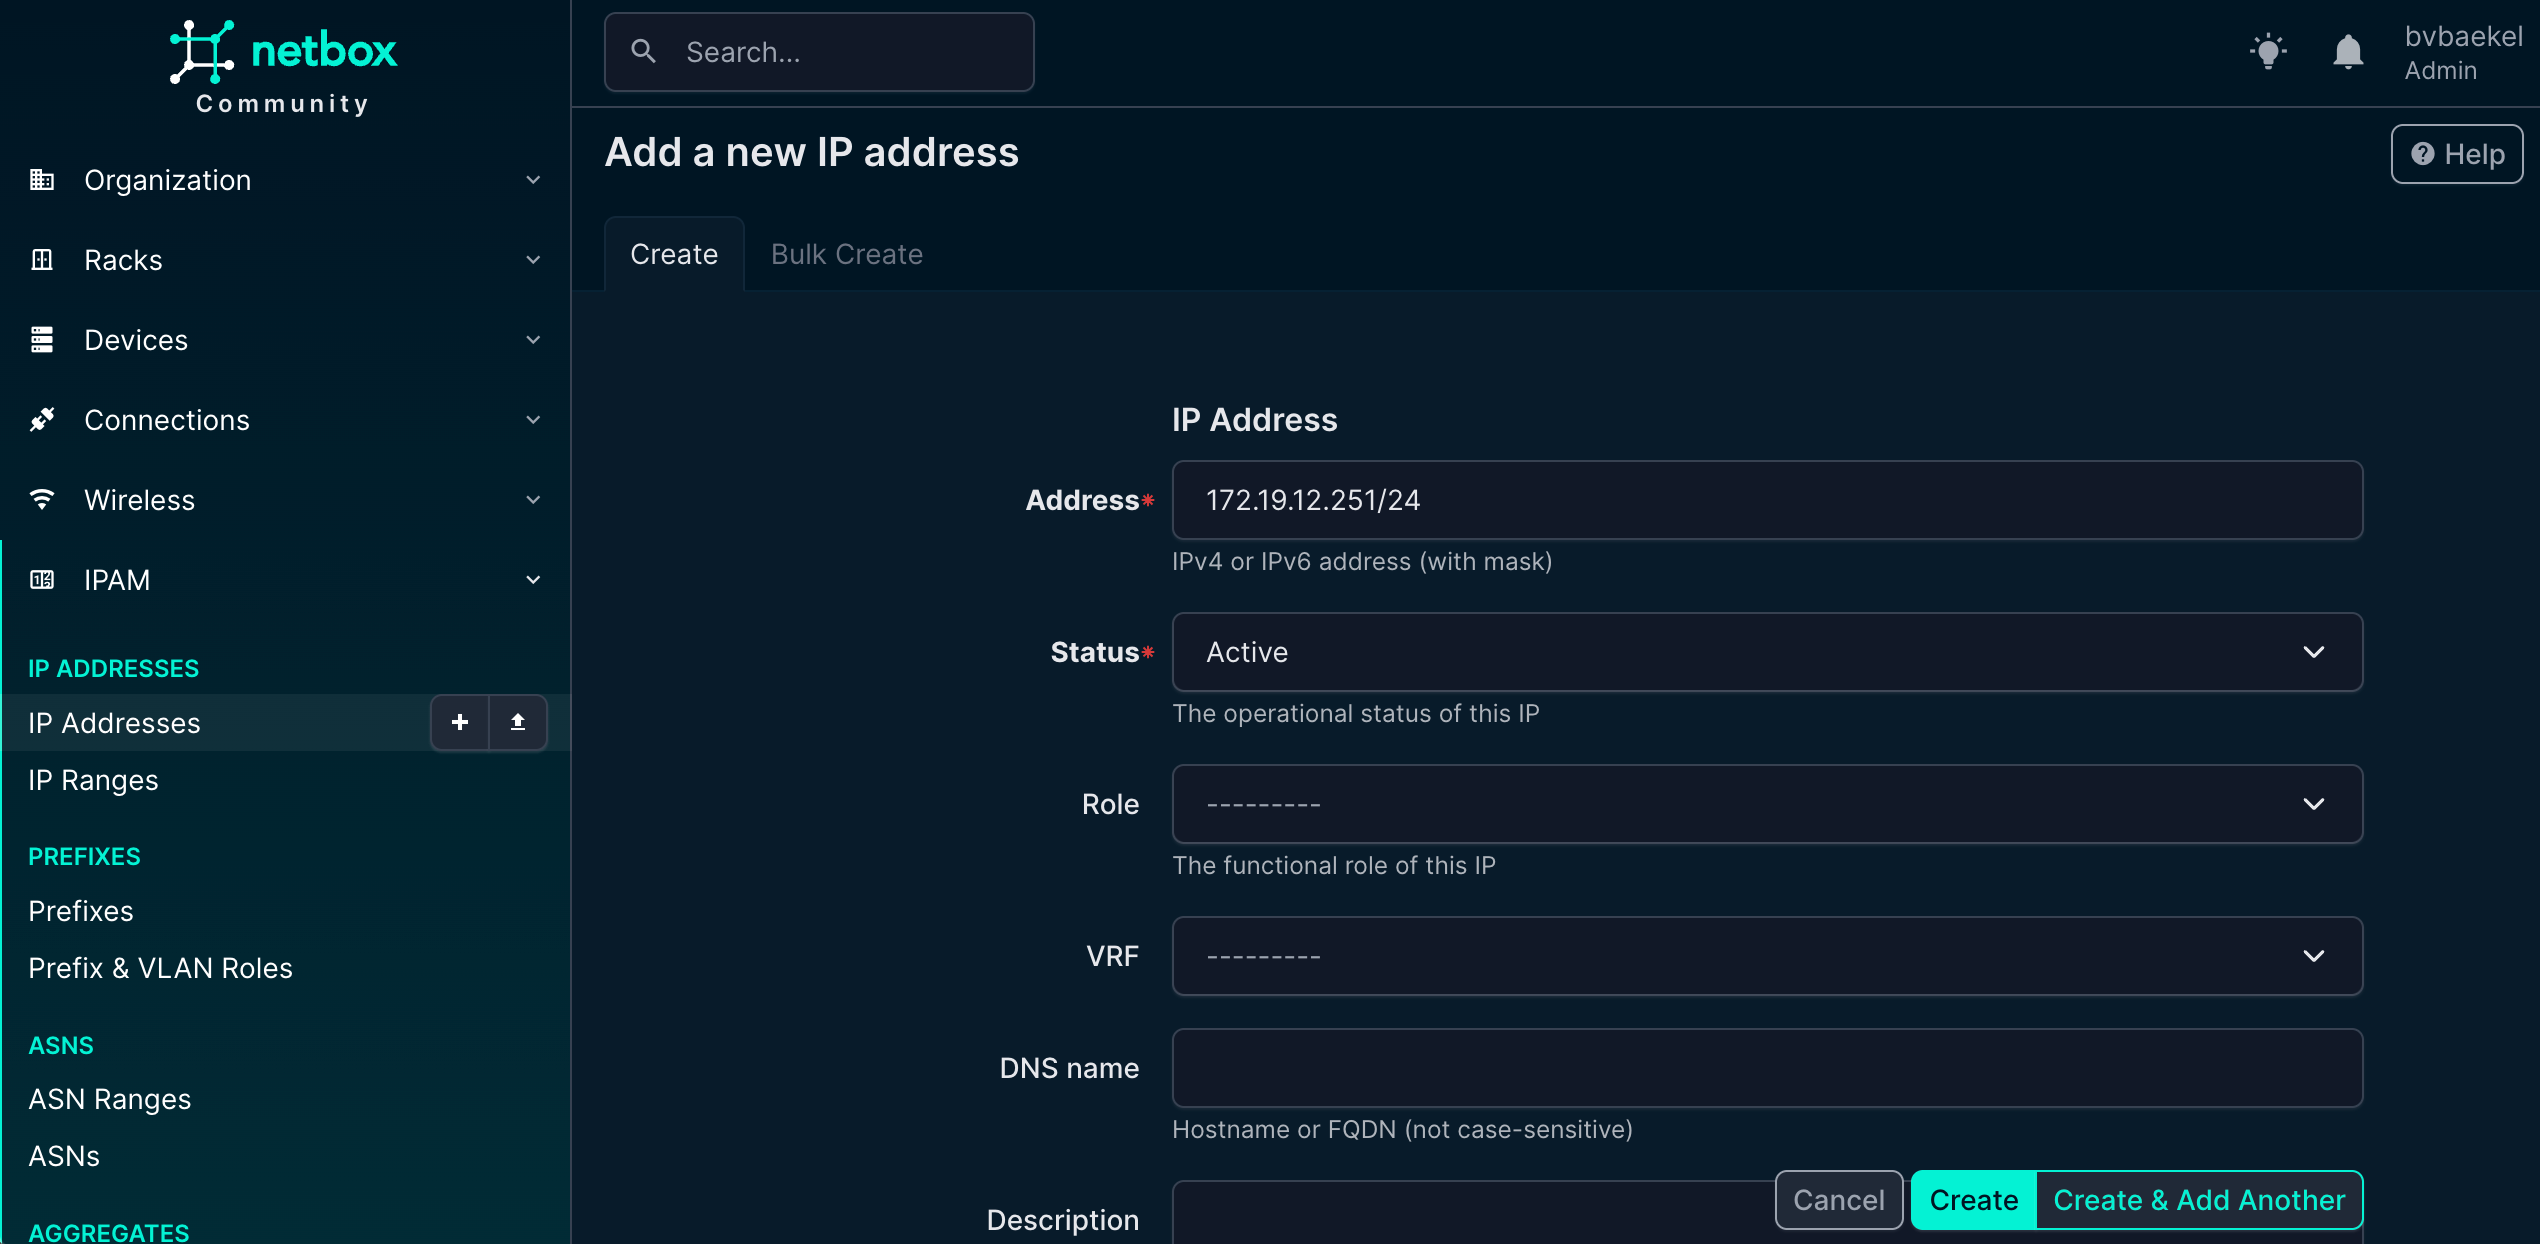
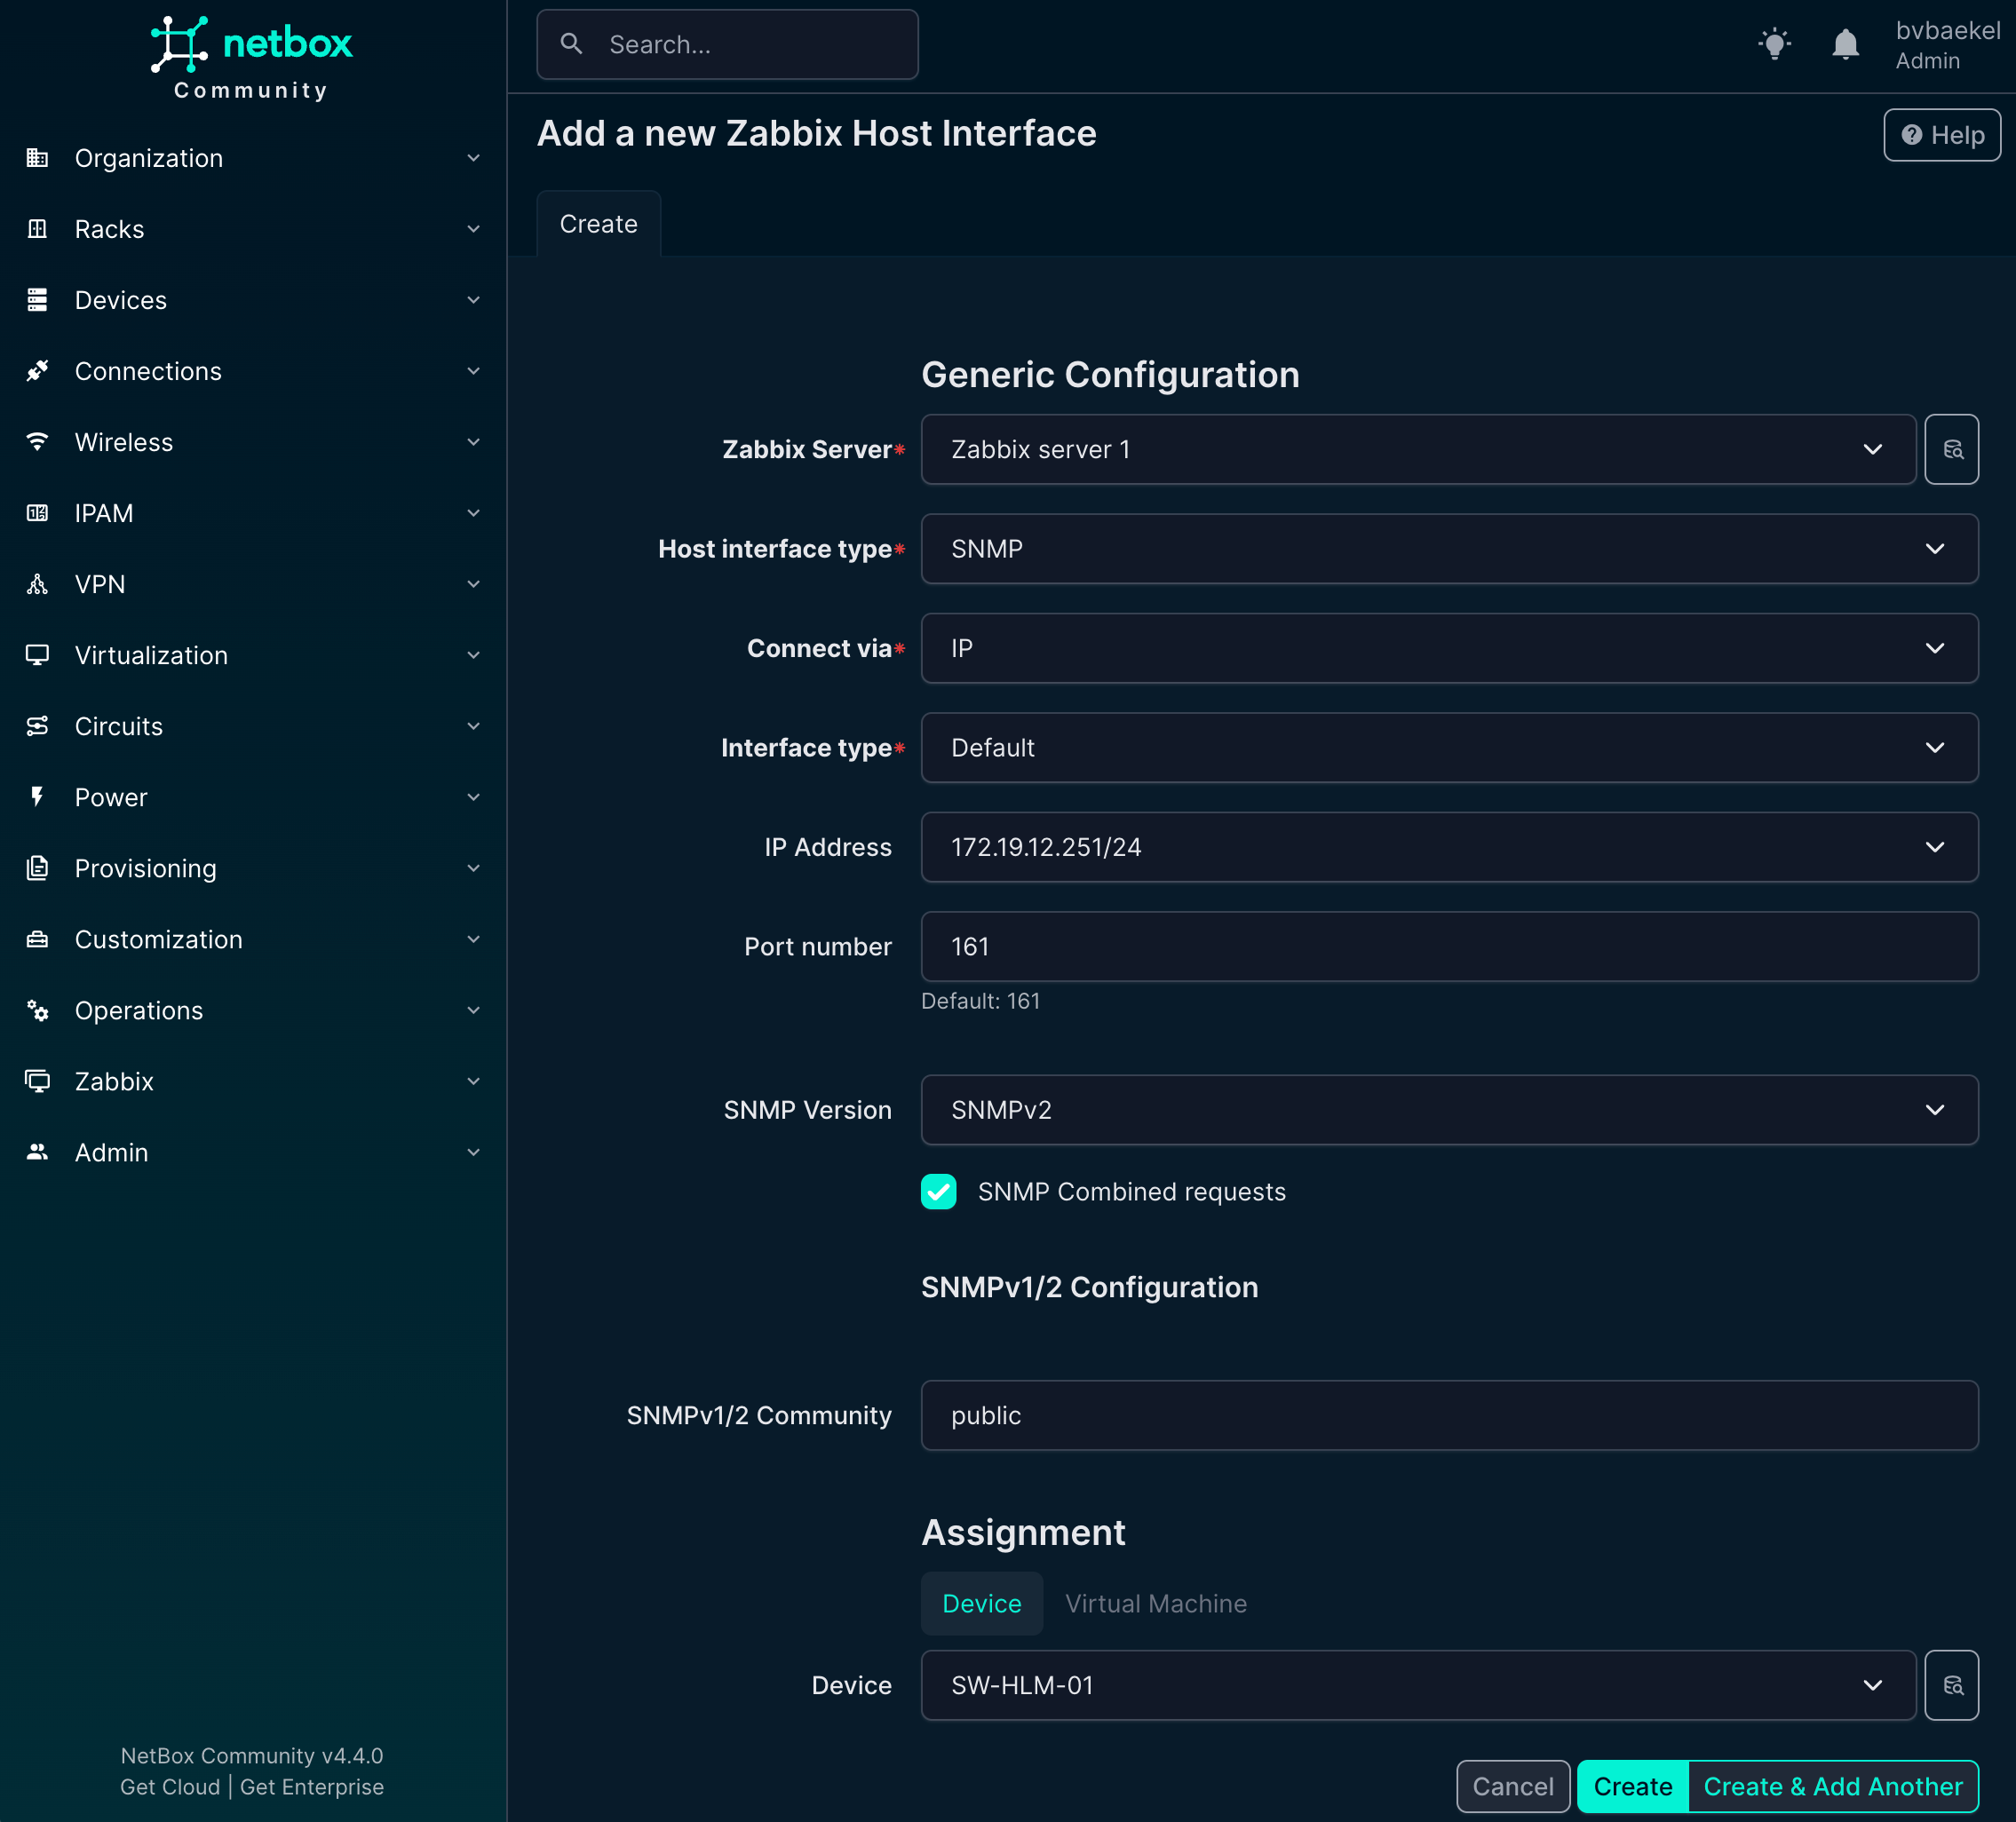
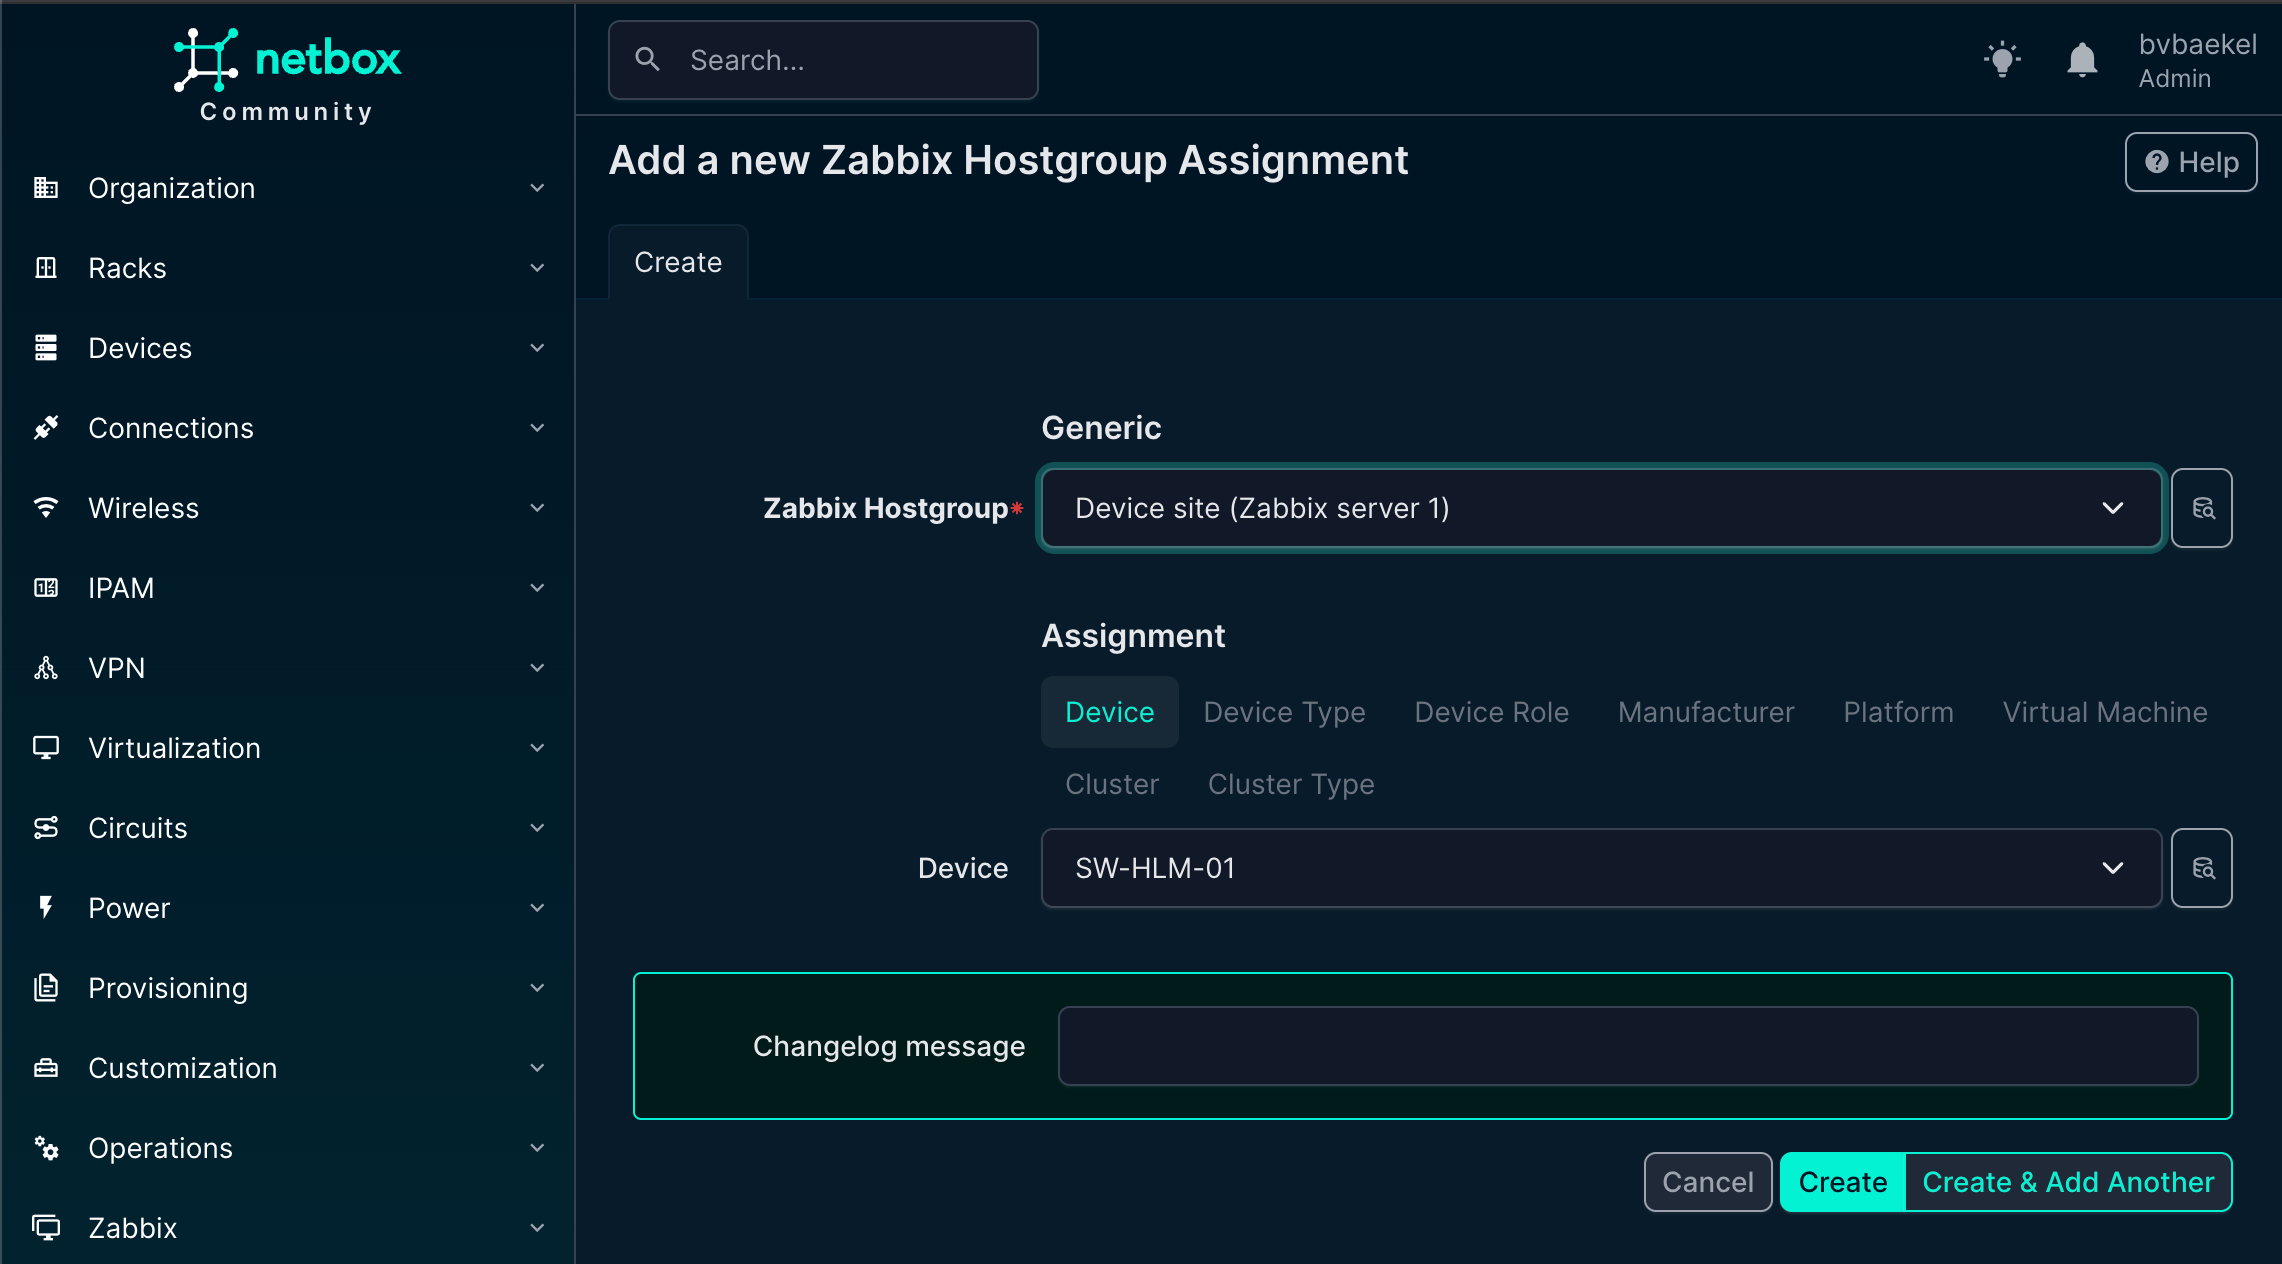
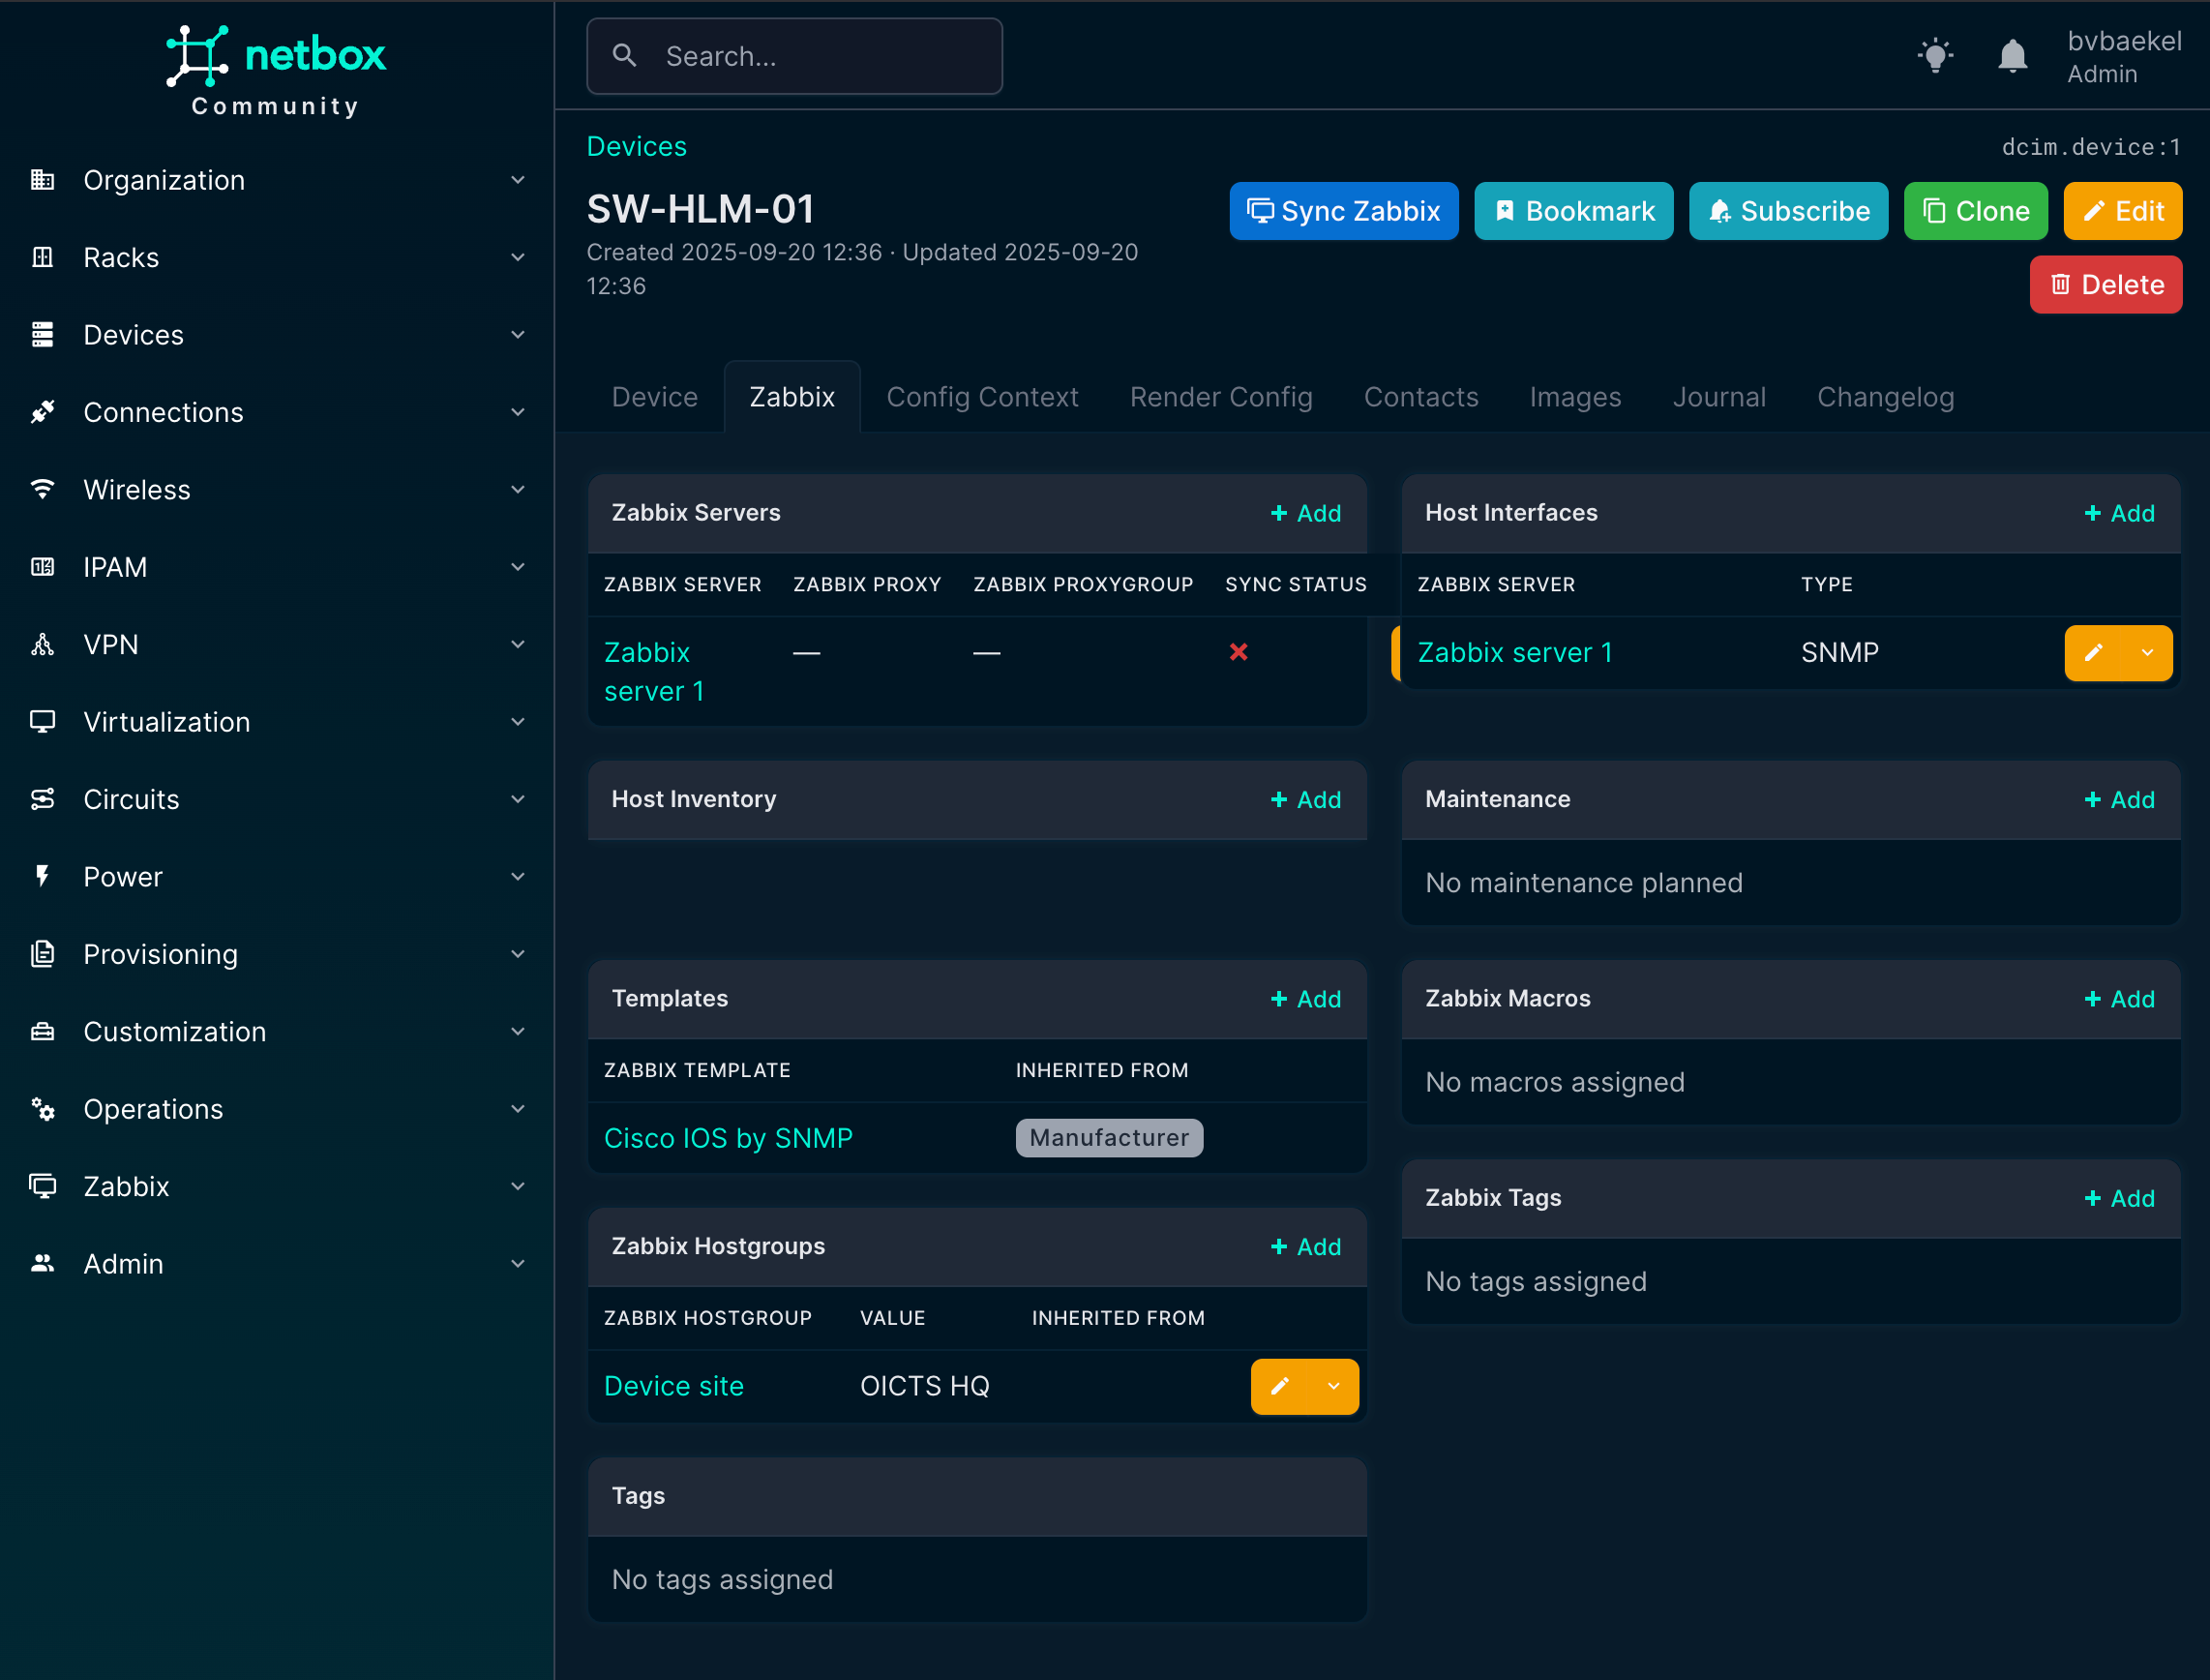
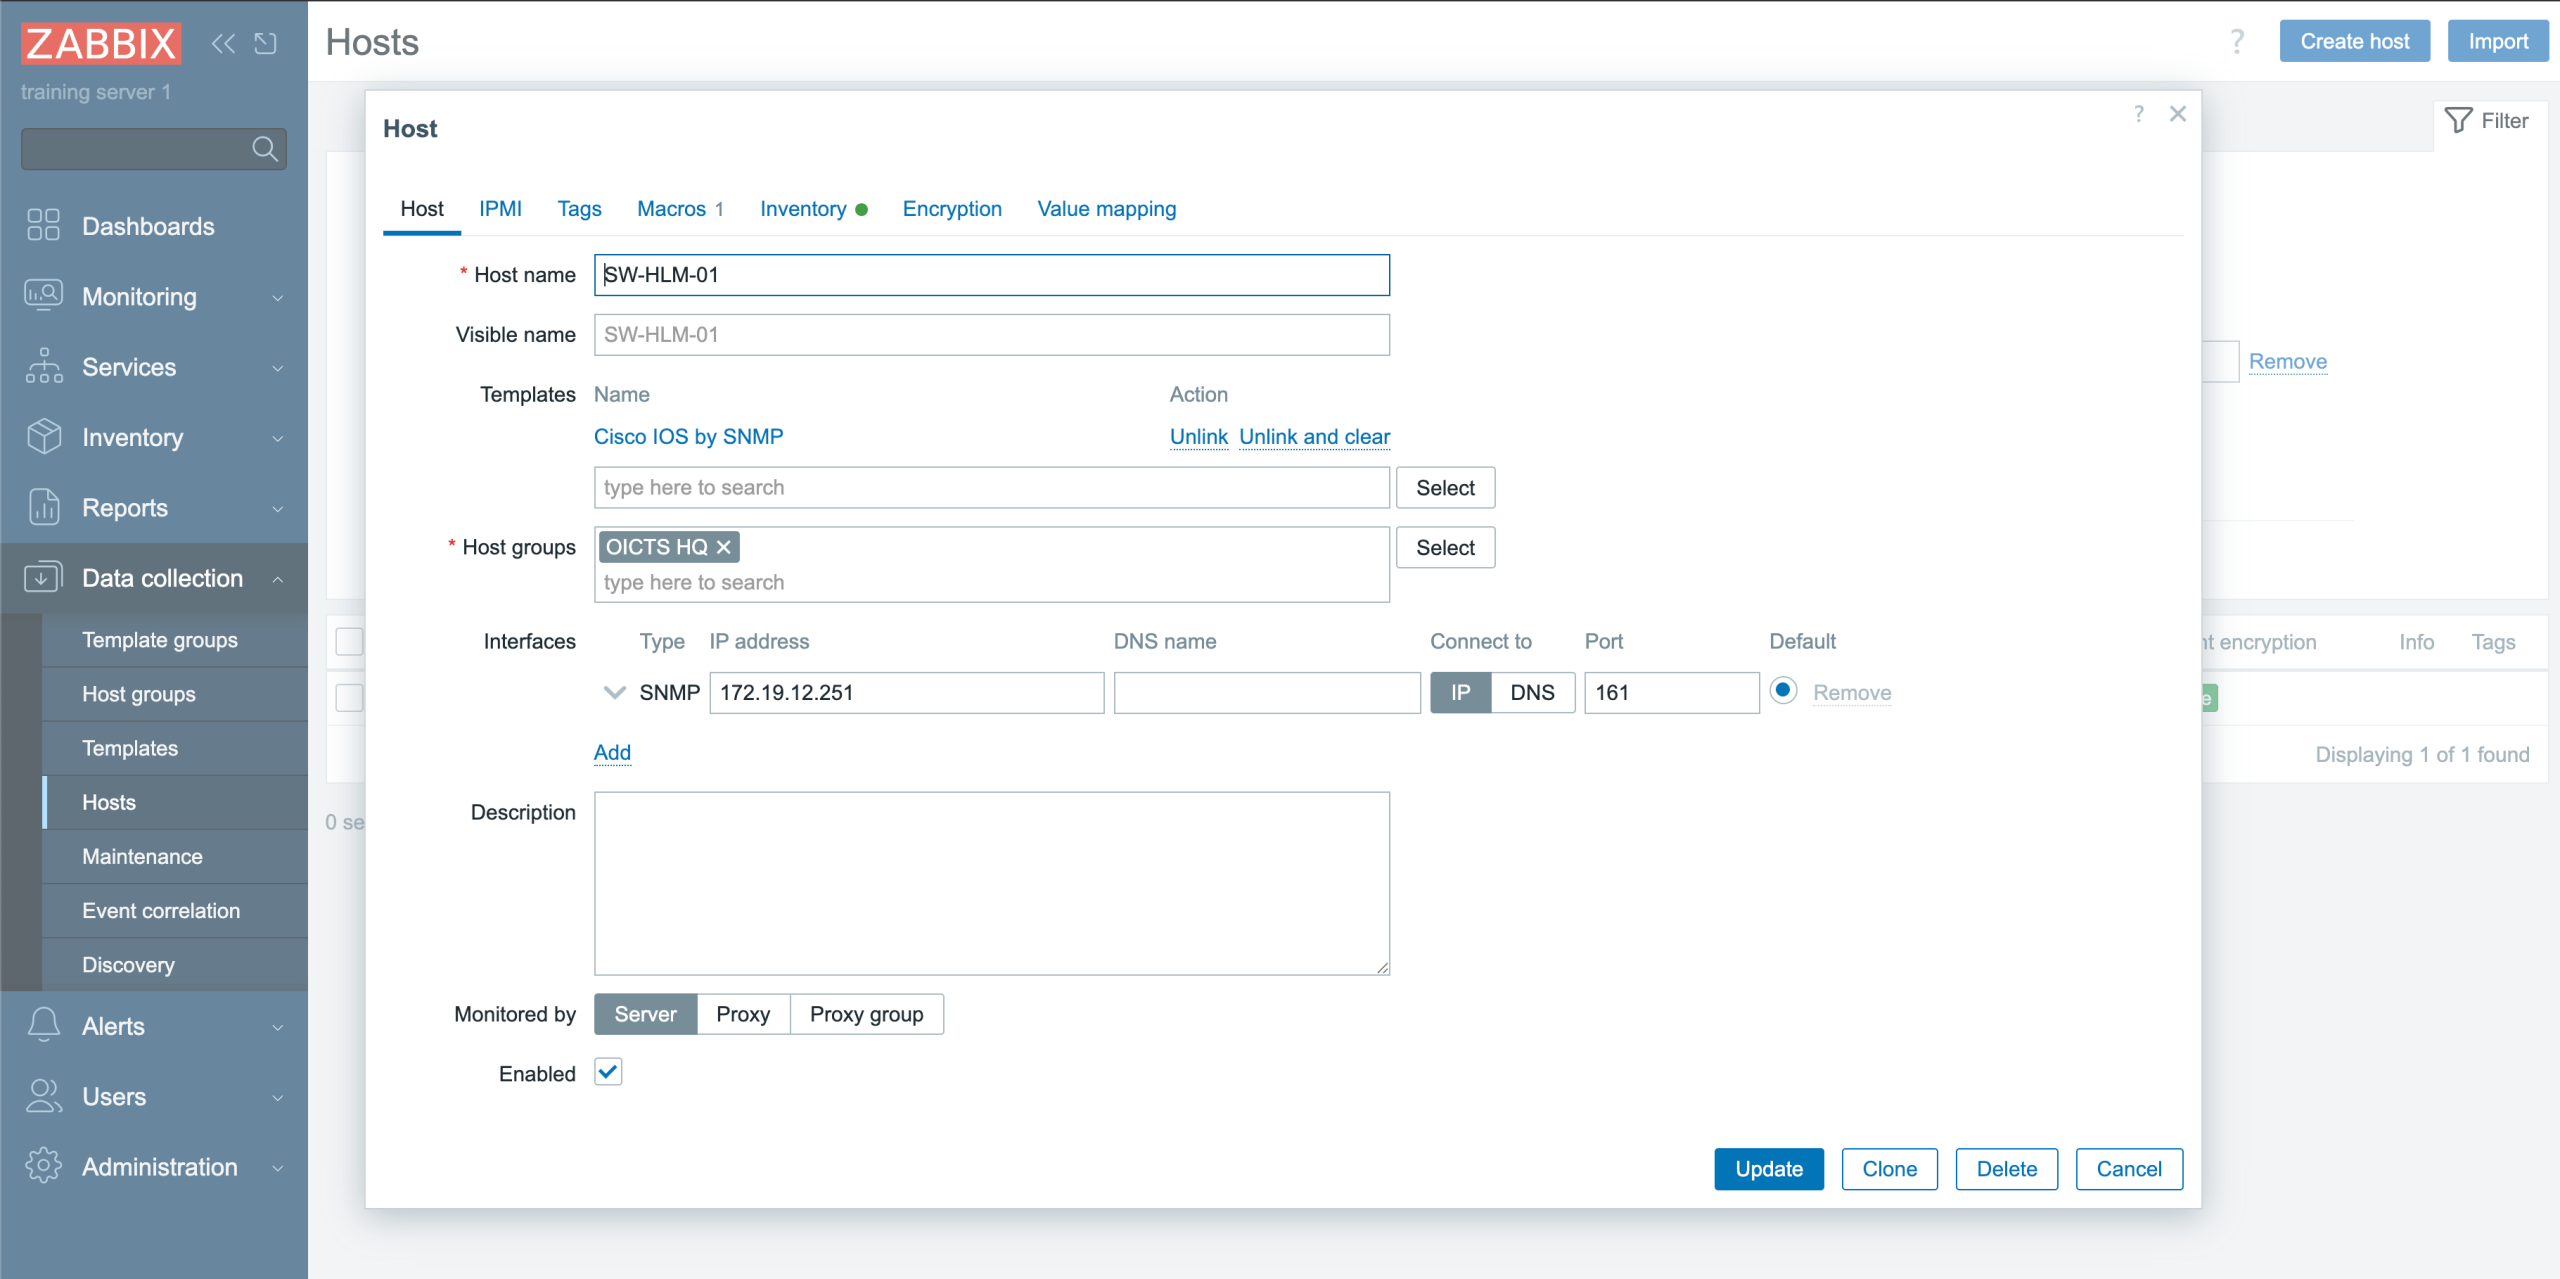


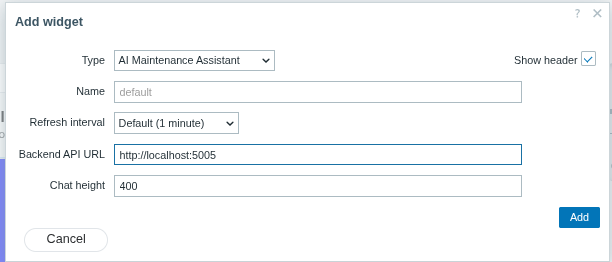
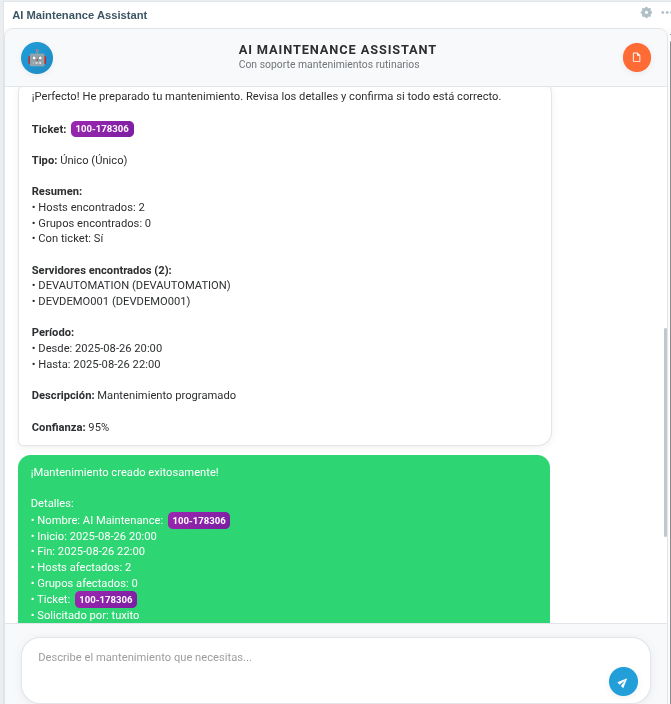
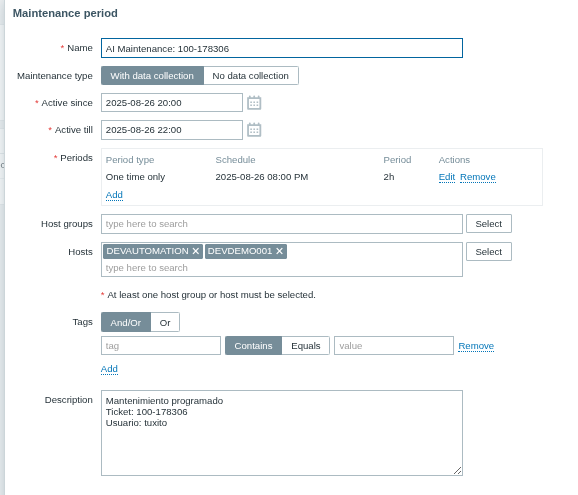
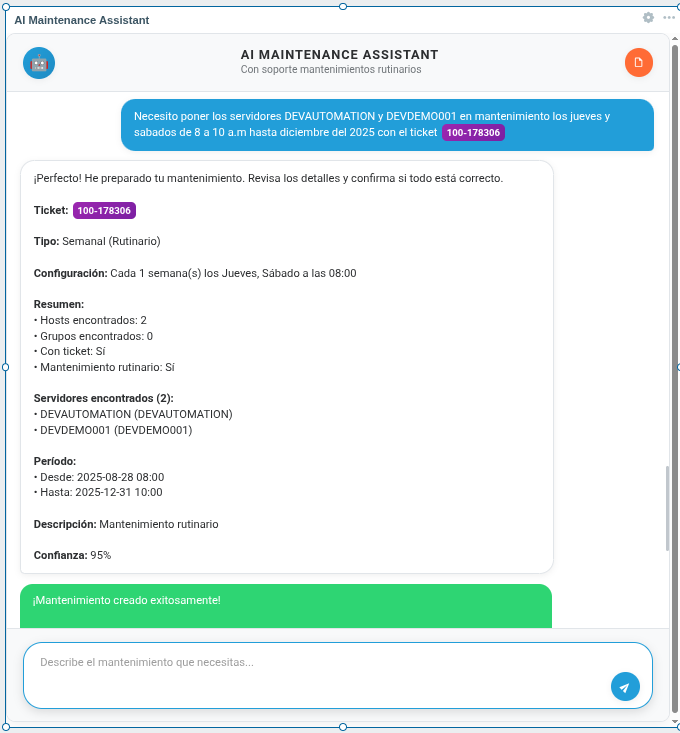
 Never expose your keys publicly!