Tag Archives: NetworkStats

Network Stats for Q1 2026: Neocloud Traffic Trends

Post Syndicated from Brent Nowak original https://www.backblaze.com/blog/network-stats-for-q1-2026-neocloud-traffic-trends/
A decorative image with the words Q1 2026 Network Stats.

Welcome to our second quarterly Network Stats report covering Q1 of 2026. Along with Drive Stats and Performance Stats, Network Stats pulls back the curtain on real-world infrastructure data, particularly how network-level analytics reflect emerging AI industry trends and usage patterns. 

Get more Network Stats (and the details of the dataset)

If you are curious about what metrics we’re recording and how we classify data in this series, check out the details outlined in our Q3 2025 Network Stats  and Q4 2025 Network Stats report.

One of the roles of the Network Engineering (NetEng) team at Backblaze is to monitor how traffic moves into, out of, and across our platform—not just day-to-day, but over time as customer behavior and industry dynamics evolve. Right now, few forces are reshaping networks faster than AI. 

With the launch of B2 Overdrive in April 2025, we built a direct, high-performance path between our storage layers and neoclouds where processing, inference, and modeling take place. It has given us a front-row seat to the impact of AI and how network behavior is changing with it. This quarter, in addition to our regular data analysis, we’ve added some geographic heatmaps to understand where and how data is moving. 

Join us live for the webinar

Join us live for the Q1 2026 Network Stats webinarMonday, May 4, 2026 at 11:30 a.m. PT / 2:30 p.m. PT. We’ll explore where AI traffic concentrates, how high-magnitude data flows behave, and what early indicators suggest about the future of AI-native infrastructure design.

Can’t make it live, or reading this article after-the-fact? Sign up anyway and catch the recording on demand.

Get Inside Real AI Network Flows

AI: The elephant in the room

AI workflows don’t just need a place to store data, they need to be able to move it quickly, easily, and nearly constantly for short bursts. Large, multi-petabyte datasets are ingested, transformed, exported for training, pulled back for evaluation, and periodically refreshed as models evolve.  

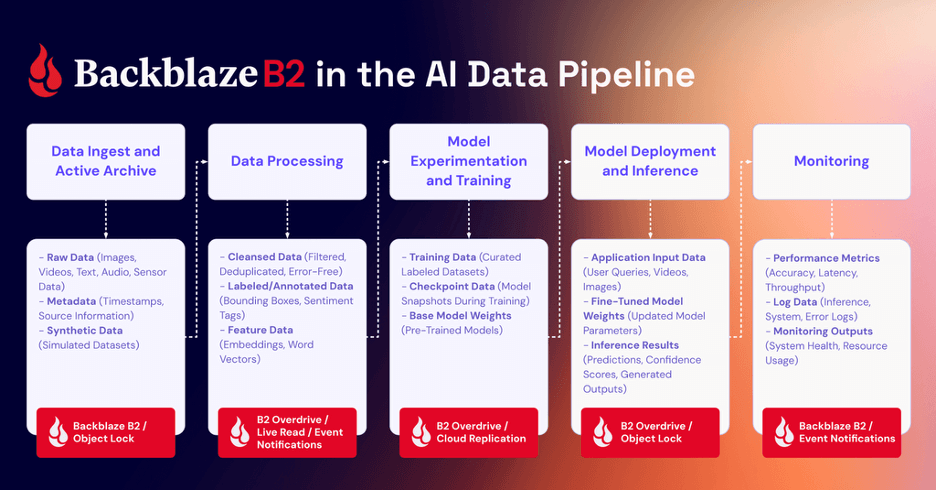
Backblaze plays a key role at both ends of that lifecycle. We serve as a durable storage layer for the initial data ingestion, and as the high-throughput source feeding model training, evaluation, and validation to whatever best neocloud is suitable at the moment. Once that model has been trained, it needs to be stored, served, and periodically retrained, where we serve as the storage medium.

From a network perspective, this represents a meaningful shift from diffuse, internet-style traffic patterns to large, high-bandwidth flows between a smaller set of endpoints typical of AI-centric infrastructure.

Trends and spring renewal

The defining theme of the quarter is “winter freeze” as we observed what looks to be a quiet period of Neocloud and hyperscaler traffic over the winter months with an uptick in March. 

The stacked area graph below shows total traffic by network type over time updated with the most current data. Hosting and internet service provider (ISP) traffic stayed largely within historical norms reflecting steady-state usage patterns. Three slices stand out this quarter:

  • CDN traffic: Increase in CDN traffic over the winter months.
  • Neocloud traffic: After the October 2025 peak, we saw a decline in neocloud traffic heading into January. The winter months were a low volume period with an upward trend observed February into March 2026.
  • Hyperscaler traffic: Hyperscaler traffic also followed the Neocloud pattern of a low period during winter with an upward trend in March 2026.
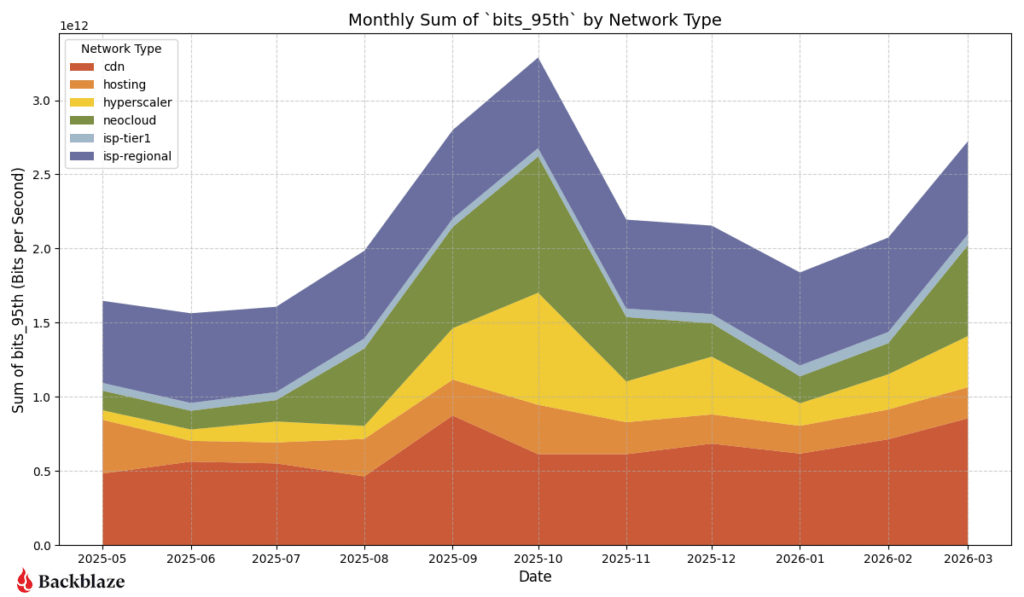
With more than three quarters of data at our disposal, we can now start to see some trends over time. What do we think is happening? 

This could be an indication of the human element where the business cycle has a lot of downtime in the winter months—all of our code, infrastructure, computing jobs, and new innovations involve people somewhere along the chain and we all (hopefully) tend to take more time off in the winter months.

Another hypothesis is that our numbers only show bits transferred over our network links over time. If a large dataset has been stored with us, there may not need to be an update to the large stored dataset for a number of months as code and models are refined, and then suddenly a large amount of new data makes its way over our network links. Perhaps a combination of both—human and training lifecycle?

We’ll be tracking these metrics and updating in future reports, so this high-level view of network traffic segmented by network type will be interesting to watch.

Chart overview

Now let’s take a deep dive into our data and answer these questions:

Quarter over quarter heatmaps: How and where data moves

To better understand our network activity, we isolated variables like region and types of provider. Let’s look at the following dimensions: 

  1. Total traffic volume: Where did we send and receive the most traffic? 
  2. Magnitude: Where were the data transfers with the most bits per unique IP address?
  3. Uniqueness: What does the number of distinct IP addresses look like? 

Quick terminology refresher

  • Regions
    • US-West: Our largest and longest-running region
    • US-East: Region with the most observed proximity to neocloud infrastructure
    • CA-East: Our newest region in Canada. 
  • Network Types
    • CDN: Networks that use Backblaze as an origin store for content delivery 
    • Hosting: Traditional hosting providers that runs workloads like physical or virtual servers for web, database, or application tasks
    • Hyperscaler: Large, traditional cloud providers
    • ISP Regional: Local or regional ISPs, think of these as the “last mile” paths as these networks are very close to customer equipment and efficient 
    • ISP Tier1: National or international ISPs that carry our traffic long distances
    • Neocloud: AI -focused compute networks

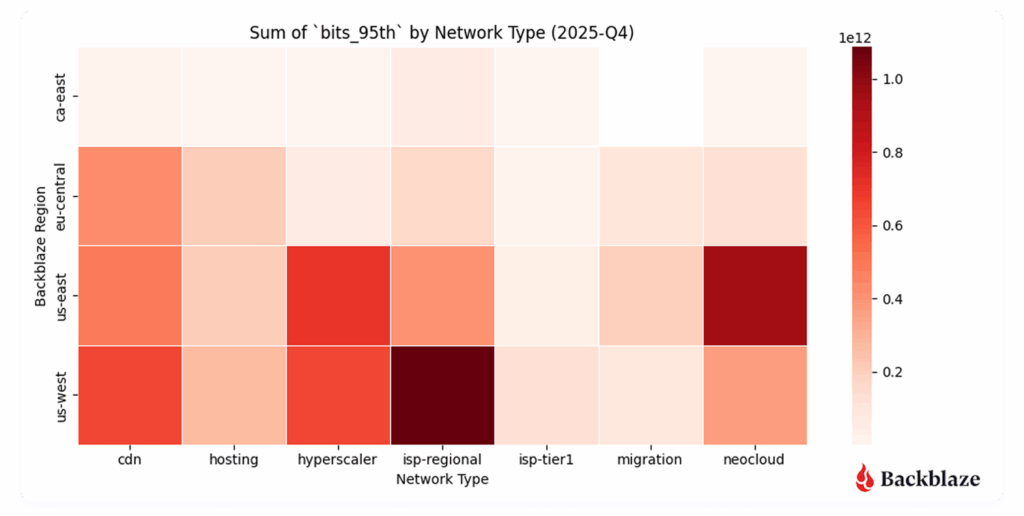
Heatmap #1: Where did we send and receive the most traffic?

US-West ↔ ISP-Regional traffic continues to be a hotspot on the heatmap, as expected. This region has the largest footprint behind it and connections to internet exchanges (IX). This quarter, with a lull in neocloud and hyperscaler traffic over the winter period, we saw an increase in traffic to our CDN partners. The amount of traffic to CDN networks in the US-West, US-East, and EU-Central regions all increased quarter over quarter.

Heatmap #2: Where were the data transfers with the most magnitude (bits per IP address)?

Another metric we record is bits per IP or what we term “magnitude.” This combination of the amount of traffic transferred with how many actors are involved per network is a good proxy to measure how heavy or impactful individual data flows are. In short:

  • High volume, many IPs: Easier to distribute and load-balance across infrastructure. And many source and destination pairs means that we can traffic engineer at the WAN layer, sending some traffic over one provider and some over another.
  • High volume, few IPs: More difficult, but more interesting, from a NetEng perspective. 

Despite the total amount of traffic decreasing over the winter months for neocloud traffic, the magnitude of neocloud transfers still remains high. This speaks to the nature of the traffic pattern—when a GPU/compute cluster is ingesting or producing data, it does so at a high bitrate with just a few number of unique endpoints talking to each other.

As expected, the concentration of our magnitude metric is high for our US-East cluster, with an uptick in concentration in US-West and EU-Central. Where specifically is this new concentration in these regions? Spoiler: We explore neocloud traffic later in the report with geographical data!
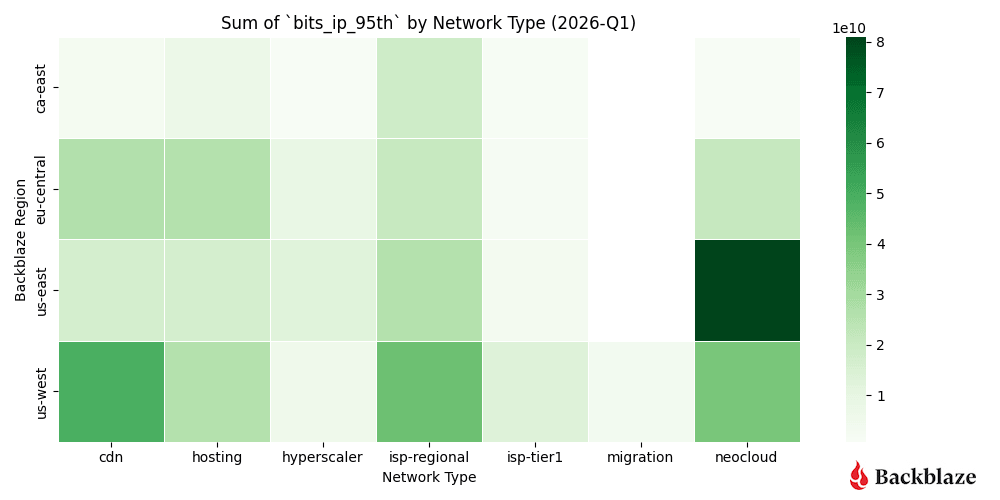
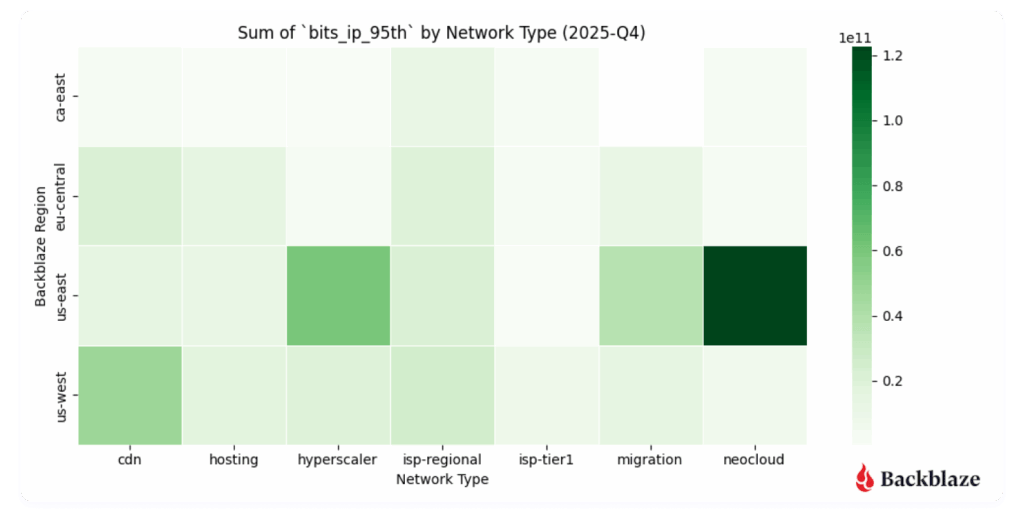
As with last quarter, we see a high concentration of neoclouds in US-East, but our new heatmap also shows a rising activity in US-West and EU-Central. We also see more distribution in other use cases. 

Heatmap #3: How many unique addresses do we interact with?

Uniqueness—measured by the number of distinct IP addresses per network type—adds another dimension to the story. Unsurprisingly, the quarter over quarter heatmap looks almost identical. This is expected with our US-West region being the most mature and serving a large amount of ISP Regional consumers and is a good sanity check on our dataset.

  • US-West shows the highest overall uniqueness, driven by its larger number of data centers and mix of workloads.
  • Neocloud traffic, by contrast, tends to involve fewer, more persistent endpoints, consistent with AI pipelines that rely on stable, long-standing connections between storage and compute. 

This is where we can clearly see those AI networking elephant flows showing up in the data.

Summary: Seasonal change in traffic flows

With a lull in bits transferred as noted in our top level graph, we can see what other networks by percentage took over. CDN traffic increased from around 20% to 32% of our total traffic, localized ISP regional traffic also increased 21.5% to 27.8%. Neocloud and hyperscaler traffic reduced from 36.4% in Q4 2025 to 25.5% in Q1 2026. 

Quarter over quarter data

We’re tracking our usual metrics here, and we gave you both this quarter and last quarter’s charts so you can easily spot potential trends.  

First let’s take a look at where all our traffic goes from a global perspective with an updated view of last quarter.
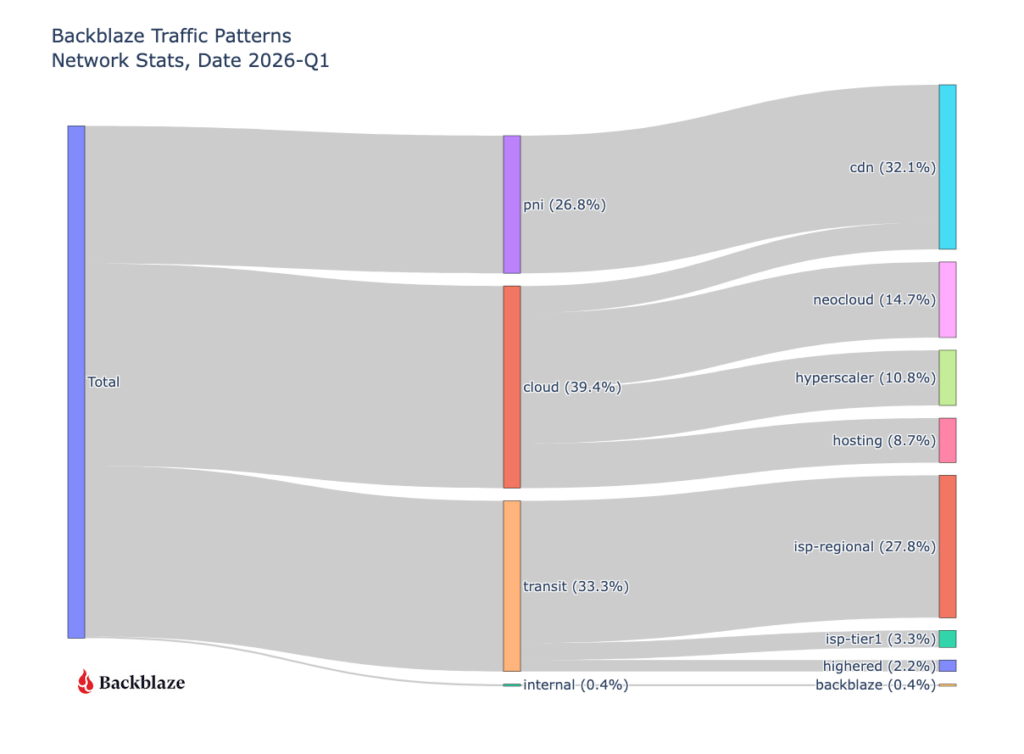
Next, let’s take a look at the geography of our network traffic. As we’ve already seen in previous heatmaps, data gravity is concentrating traffic into specific locations.

Where in the world is the neocloud?

New for March 2026, we’ve added geographic information to our dataset, allowing us to take a look at the concentration of traffic based on network types. We’re taking a look into the following locational slices:

  1. Countries
  2. Countries excluding the United States
  3. U.S. states

Heatmap #1: What countries show the highest concentration of traffic by network type?

Neocloud, hyperscaler, and CDN traffic in our dataset all show high concentrations in the United States. Is this due to our US-West and US-East regions being the largest of our deployments or is it related to how certain traffic types are present in the emerging AI market? A quick search shows that the U.S. contains around 40-45% of all data centers globally, so it’s likely the sheer deployment size and scope of US sites aligns with what we’re seeing at the network level.
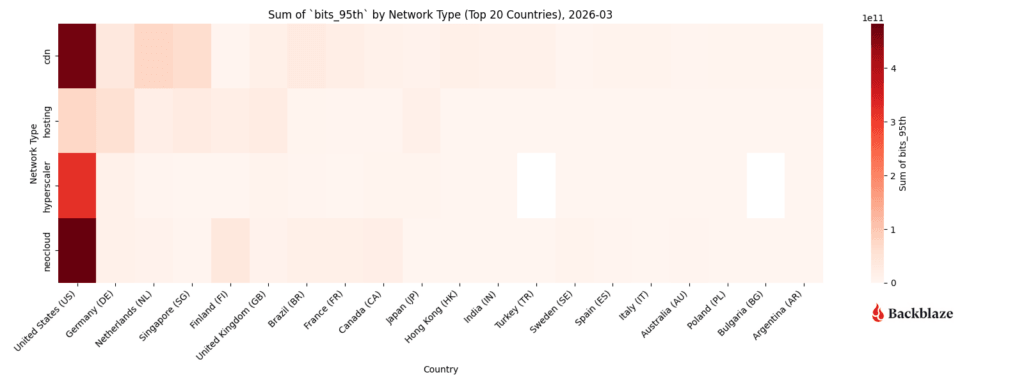
That said, excluding outliers can show us additional geographic trends, which leads to our next heatmap.

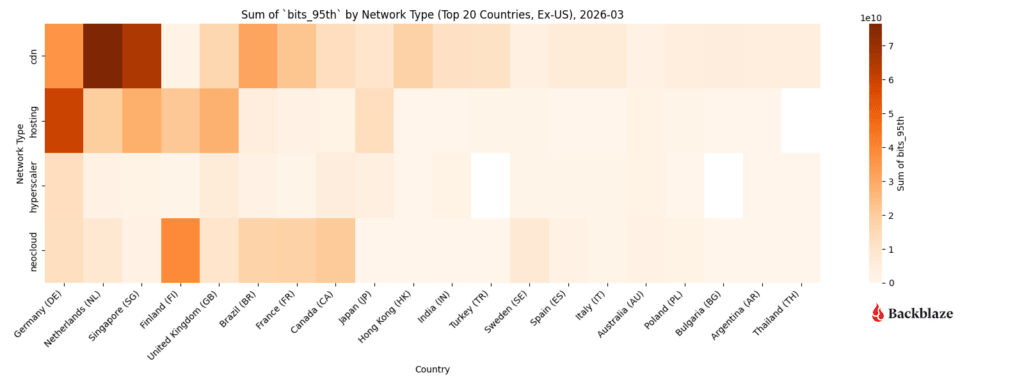
Heatmap #2: If we exclude the U.S., what countries show the highest concentration of traffic by network type?

Since the United States numbers highly skew the heatmap concentration, below is a heatmap without the US to give us better fidelity on ex-US datapoints. Interesting to note that we deliver a large amount of traffic to CDN entities in the Netherlands. This is due in part to our connectivity to AMS-IX (Amsterdam Internet Exchange). 

The network posture of Europe differs from the United States to where local IX networks are preferred over larger Tier1 ISP networks for transit (politically, cost, and preference wise). Second up is Singapore for CDN content and hosting activity in Germany. The next standout is a concentration of neocloud related activity in Finland, Brazil, France, and Canada.
Heatmap #3: What U.S. States show the highest concentration of traffic by network type?

If we dive into just the U.S. States, we can see the heavily weighted concentration of neocloud traffic to and from California. Hyperscaler activity matching up with our expectations as California and Virginia (specifically the Ashburn and Reston corridor) have a high concentration of partner networks. CDN traffic for us concentrates more for Backblaze specifically since the US-West region is our largest cluster footprint and longest running sites, so naturally the data being served out of these sites is more long-lived content lifecycle wise.
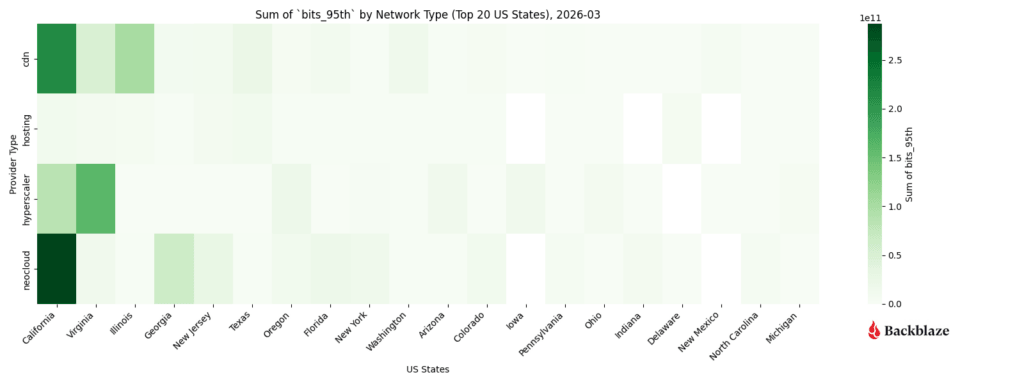
These insights into data geography help us understand, plan, and modify our growth trajectory. I say “help,” because we’re also discovering that neocloud and hyperscaler activity is very bursty and has a high magnitude of traffic flow below. From a planning perspective, understanding whether those bursts translate to a higher baseline for increased demand—and how to support bursts when they happen—is a different conversation than the predictable network trends of years past. 

Neocloud and hyperscaler traffic vs predictive patterns

This quarter we’re sharing a deeper dive into the metrics associated with neocloud and hyperscalers over time. These two traffic types are driving innovation at Backblaze and are interesting to share to the larger industry. While CDN, hosting, and ISP regional traffic patterns are easy for us to model and account for as we manage our network infrastructure, neocloud and hyperscalers growth profiling are a challenge! As we said above, they are bursty and have a high magnitude (bits per associated IP address).

And, in the spirit of that conversation, we have several new views to share:

  • Neocloud and hyperscaler magnitude (bits per IP address) over time
  • Heatmaps over time
    • Neocloud
    • Hyperscaler
    • CDN
    • Hosting
    • ISP regional

Chart #1: What’s the magnitude of neocloud and hyperscaler traffic over time?

Matching our earlier charts, we saw a burst of activity from August to December of last year with a resurgence of high magnitude neocloud traffic in March of 2026.

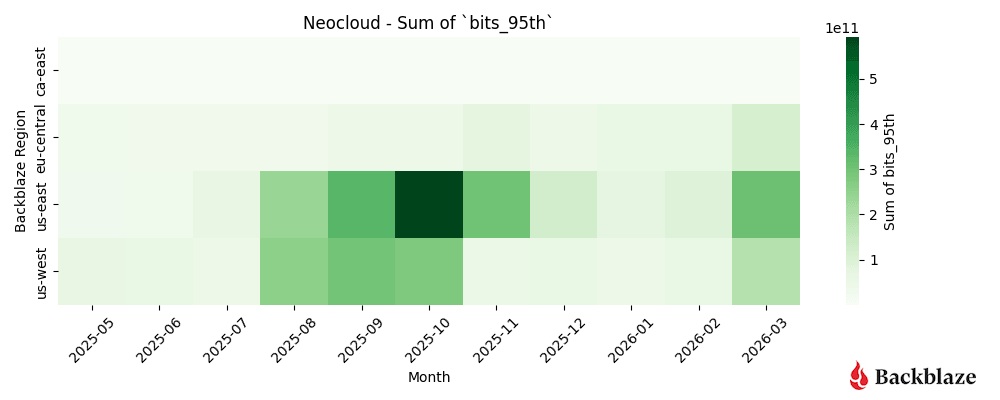
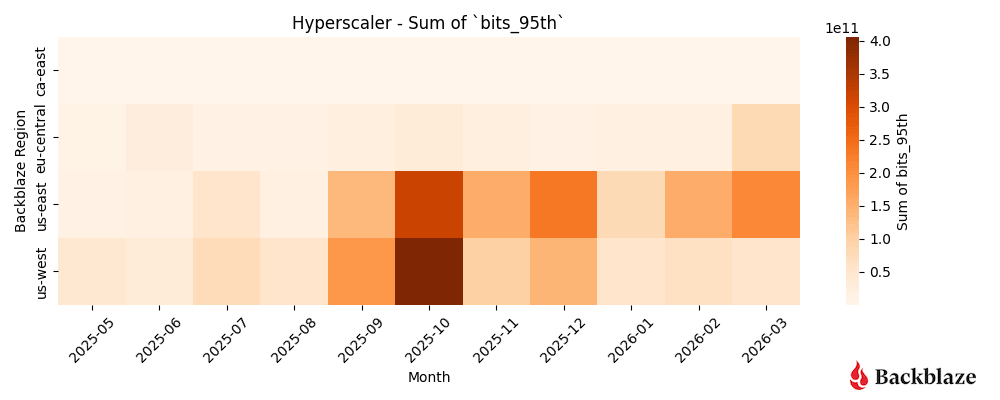
Heatmap #1 and #2: How dynamic are neocloud and hyperscaler traffic patterns?

Neocloud and hyperscaler traffic patterns are the most impactful to our operations due to the magnitude of their data flows. Below is a more detailed look at these concentrations over time, with a burst of activity from August to November for Neoclouds, a quiet period over the winter months, and a pickup again in March. 

As expected our US-East region remains a hotspot of Neocloud related activity. One standout from this analysis is that the Neocloud activity in March is more spread out over our US-West, US-East, and EU-Central regions. It will be interesting to see if this spread grows or contracts over time.
Over the winter months, there was a noticeable decrease in activity for hyperscale related traffic, most notable in January, but when compared to neocloud traffic, the month-over-month traffic patterns remained strongly visible in our US-East region.
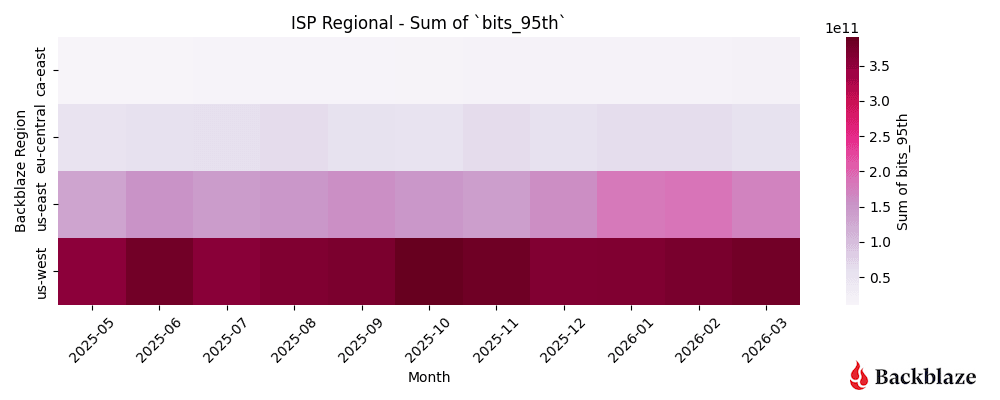
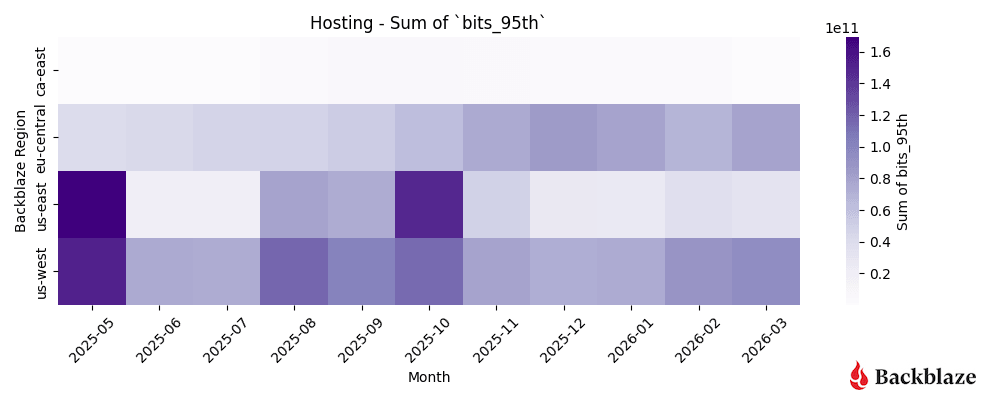
Heatmap #3, #4, and #5: How dynamic are CDN, hosting, and ISP regional traffic patterns?

We’re grouping CDN, hosting, and ISP regional types together because they represent a “steady-state” for us as network operators. These patterns are predictable, spread out over time, and generally do not change month-to-month. We do see visible bursts of traffic, like with a heavy blue tile for CDN in September and a few areas of hosting related traffic in May and October of 2025, but overall these are less impactful to our operations because the magnitude (bits per unique IP address) is lower—many sources are talking to many destinations, which as operators is easy to load balance.

The most striking example of this predictability is, unsurprisingly, ISP regional traffic. This represents your more consumer driven workflows and use cases.

Neocloud business cycle and geography

We can draw a conclusion from all these charts: neocloud and hyperscaler are both different traffic patterns and far more dynamic than CDN, hosting, and ISP regional traffic. For our Network Engineering group, this means we have two different stylistic approaches towards managing our network. 

First, when planning for the neocloud and hyperscaler traffic, our solutions entail adding large amounts of additional bandwidth in increments of 100G and often 400G ports to handle burst rates, ensuring that our inter-switch links inside our datacenter can also handle bursts of traffic, and reaching out to select partners to establish private network-to-network interface (PNI) connections where appropriate for zero-settlement transit. 

Our steady state growth patterns stem from CDN, hosting, and ISP regional traffic with easy to model growth curves. Looking over monthly numbers indicates a clear pattern for us, and that’s easy to plan for.

The last factor that we’re placing more emphasis on is the geographical location of our network interconnections. We’re seeing a high concentration of demand located in the United States, specifically in regions like California, Virginia, Illinois, and Georgia.

With more datapoints, we can clearly see the magnitude of the neocloud and hyperscaler transfers when compared to other network types. As above, it’s a bit early to claim concrete quarter over quarter patterns, but we’ll keep monitoring and updating the dataset. 

What’s next?

Anything specific you want to see? Let us know in the comments or reach out to the Network Stats team. Or, keep up-to-date with the latest technical content with our Developer Newsletter. 

The post Network Stats for Q1 2026: Neocloud Traffic Trends appeared first on Backblaze Blog | Cloud Storage & Cloud Backup

Point-to-Point at 100Gbps: What AI-Grade Infrastructure Actually Requires

Post Syndicated from Brent Nowak original https://www.backblaze.com/blog/point-to-point-at-100gbps-what-ai-grade-infrastructure-actually-requires/

A decorative image that shows several cubes on a background.

Bandwidth purchased for data center connectivity surged by nearly 330% between 2020 and 2024, driven primarily by AI workloads. And in 2024, just 10 buyers accounted for nearly 62% of all purchases, according to Zayo’s Bandwidth Report. That concentration is a structural feature of how AI moves data.

Every training run that pulls data from Backblaze storage to a neocloud passes through our network, and our telemetry captures what those flows look like in real time. Our Q4 2025 Network Stats report covers a full quarter of that data. It shows AI workloads producing a distinct network signature: sustained, high-volume transfers between a small number of endpoints, with infrastructure requirements specific enough to be worth examining in detail.

This piece walks through what that signature looks like and what it means for the infrastructure decisions teams are making right now.

The AI model lifecycle and how it moves data

AI model development is a cycle. Large datasets are ingested and consolidated, exported to compute for training, pulled back for evaluation, then pushed out again as models are refined, retrained, and updated with new data. Each stage requires moving substantial volumes of data between storage and compute, repeatedly, over the life of a model.

That structure produces a specific kind of network traffic. AI training moves petabyte-scale data between storage and compute nodes in sustained, long-lived flows—what network engineers call elephant flows—with training jobs running for hours or days under continuous network load. Add frequent checkpointing, model updates, and periodic data refreshes, and the result is traffic that is high in volume and persistent across the entire training run.

This shows up clearly in the Q4 2025 Network Stats data. Neocloud traffic spiked sharply from July through November, peaking in October, then settled into a higher baseline heading into the new year. One interpretation of that shape is the AI lifecycle playing out across a concentration of large training cycles: ingestion, training egress, then a new steady state as stored models get served and periodically retrained. As we accumulate more quarters of data across a broader customer mix, we’ll be better positioned to distinguish that pattern from seasonal budget cycles or customer-specific factors.

Also visible in the Q4 data is where this traffic is going. Cloud-to-cloud traffic grew from 36.2% to 49.6% quarter-over-quarter, with hyperscaler destinations rising from 3.5% to 18%. As the report notes, it’s too early to call these statistically significant trends; the dataset reflects Backblaze’s specific customer mix and covers a single quarter. The direction is consistent with how AI teams operate in practice: moving workloads across neoclouds and hyperscalers depending on price, availability, and job requirements. The storage layer is what persists across those compute environments, which has direct implications for how it needs to be designed.

What elephant flows require from a network

Traditional cloud infrastructure is designed around a specific traffic profile: many clients, many sessions, many discrete transactions. Routing, load balancing, and edge capacity are all optimized for that pattern, distributing load broadly and handling high volumes of short-lived connections efficiently.

Elephant flows don’t fit that profile. AI training establishes persistent, high-volume connections between client and storage that sustain continuous data movement for hours or days at a time. These connections are stickier than typical cloud traffic, particularly on peered networks, and the strain they produce is concentrated rather than distributed—showing up primarily at the edge, where routers handle sustained throughput at scale. Most traditional cloud infrastructure wasn’t provisioned for that kind of sustained pressure at the edge, because most workloads don’t produce it. Internal to the network, depending on a myriad of things—object size, concurrent threads, hardware, internal routing logic—your network path being sticky doesn’t reduce the number of I/O operations for servers, and often that becomes one of the biggest bottlenecks. 

The stakes make this consequential. Training the most advanced models now costs hundreds of millions of dollars, according to Epoch AI—though we also know this is a new technology, and therefore likely the compute will get more efficient over time. That said, the storage is still storage: Data has to live somewhere.  

Infrastructure that can’t sustain throughput under continuous load doesn’t just slow training down; it adds cost to every run. The practical answer is building throughput capacity at the connection points between storage infrastructure and the internet or peer network, sized for sustained flows rather than peak bursts.

That’s what AI-grade storage infrastructure is designed around: sustained throughput to a small number of destinations, at 100Gbps to 1Tbps per transfer for the largest AI workflows. Achieving that in practice means rethinking how a network is designed, routed, and scaled. We’ve written separately about what that looked like for Backblaze’s own infrastructure. Latency matters here for a specific reason: on long-distance transfers, higher latency directly limits achievable sustained throughput, which is one reason why geographic proximity to compute infrastructure affects real-world performance. 

The Q4 Network Stats heatmaps show this pattern from two angles. The magnitude heatmap, measuring bits transferred per unique IP address, shows high-magnitude neocloud flows clustering clearly in regions serving AI-heavy compute endpoints. The uniqueness heatmap shows neocloud traffic involving fewer, more persistent endpoints than CDN or ISP traffic, consistent with AI pipelines that rely on stable, long-standing connections between storage and compute.

The geography of AI infrastructure

The heatmaps show where AI traffic concentrates geographically today. Neocloud activity in the Q4 dataset clusters in Chicago, Dallas-Houston, Denver, New York, the Northern Virginia Reston/Ashburn corridor, and Atlanta, with a clear skew toward the East Coast. This reflects where AI compute infrastructure was built first and remains densest. Keeping latency low between storage and compute is a prerequisite for sustaining the high throughput rates AI workflows require, and that constraint has historically made East Coast proximity an advantage.

That concentration is consistent with broader infrastructure dynamics. AI training workloads are driving demand for regions with available power, fiber density, and compute infrastructure, and power constraints in preferred markets are already forcing operators to explore secondary locations and invest in custom power infrastructure. Demand in markets outside traditional data center hubs is growing rapidly as a result: Metro bandwidth in Memphis grew from 0.3 terabits to 13.2 terabits between 2023 and 2024. On the flip side, building out cabling to those traditionally under-utilized locations is expensive, often adding thousands of dollars per month to data center economics. High-capacity interconnects are central to making those secondary locations viable; without them, the compute investment is stranded. 

The scale of what’s being built reflects the trajectory of the workload. AI training infrastructure is projected to grow at a 22% compound annual growth rate (CAGR) through 2030, reaching more than 60GW of capacity, while inference infrastructure is expected to grow faster still at 35% CAGR, reaching more than 90GW, according to McKinsey. Training and inference have different geographic requirements: training tolerates latency and can sit in power-rich remote locations, while inference needs to be close to users, which means the buildout will be distributed across both dense metro markets and secondary locations connected by high-capacity fiber.

Backblaze’s own infrastructure decisions reflect this pattern directly. The East Coast concentration drove the decision to double Backblaze’s US-East footprint. At 100Gbps and above, proximity to where AI compute is actually running is a determining factor in storage performance.

What AI-ready storage infrastructure actually means

Storage has traditionally been sized for capacity and evaluated on cost per terabyte. AI workflows change the calculus. When a training run is pulling petabytes of data from object storage to flash storage at sustained 100Gbps rates, the storage layer is as much a performance determinant as the compute layer. A storage system that can’t sustain those throughput rates creates a bottleneck that no amount of GPU capacity can compensate for.

Throughput capability is one requirement. Portability is the other. The multi-cloud behavior visible in the Q4 data reflects how AI teams actually operate: moving workloads to whichever compute provider offers the best price-performance for a given job. Storage that is tightly coupled to one cloud provider is structurally incompatible with that workflow. Data that can’t move freely across cloud environments becomes a constraint on the model development process.

This is the infrastructure problem Backblaze B2 Overdrive is designed to address. By building a direct, high-performance path between Backblaze’s storage layer and the neoclouds where AI processing takes place, it provides the sustained throughput that training workflows require alongside the portability to move data as compute requirements change. The connections between Backblaze and neocloud endpoints visible in the Q4 heatmaps represent that architecture in practice.

The point extends beyond any single product. As AI workloads become a larger share of overall data center activity, the criteria for evaluating storage infrastructure are shifting. Capacity and cost per terabyte remain relevant, but sustained throughput capability, interoperability with compute providers, and network proximity to AI infrastructure are becoming equally important factors. Teams that treat storage as a passive component in AI pipeline design are likely to find it becomes the active constraint.

Early signal, long trend

The Q4 2025 Network Stats data is one quarter of observations from one storage provider’s network. The patterns it shows—high-magnitude flows to a small number of endpoints, East Coast geographic concentration, rising cloud-to-cloud traffic, a higher baseline heading into the new year—are consistent with what the broader industry understands about how AI moves data. What’s new is that they’re visible in real network telemetry rather than modeled projections.

We’ll be watching how neocloud traffic concentration evolves regionally, how the training-to-inference ratio shifts as inference infrastructure scales, and whether the cloud-to-cloud growth visible this quarter continues.

The full dataset, methodology, and visualizations are in the Q4 2025 Network Stats report. For background on how we classify and measure network traffic, the Q3 2025 report covers the dataset in detail, and you can follow the whole series here.

The post Point-to-Point at 100Gbps: What AI-Grade Infrastructure Actually Requires appeared first on Backblaze Blog | Cloud Storage & Cloud Backup
Network Stats for Q4 2025: Neocloud Traffic Trends

Post Syndicated from Brent Nowak original https://www.backblaze.com/blog/network-stats-for-q4-2025-neocloud-traffic-trends/

A decorative image with the text Q4 2025 Network Stats.

Welcome to our second quarterly Network Stats report covering Q4 of 2025. Along with Drive Stats and Performance Stats, Network Stats pulls back the curtain on real-world infrastructure data, particularly how network-level analytics reflect emerging AI industry trends and usage patterns.

Get more Network Stats (and the details of the dataset)

If you are curious about what metrics we’re recording and how we classify data in this series, check out the details outlined in our Q3 2025 Network Stats  report.

One of the roles of the Network Engineering (NetEng) team at Backblaze is to monitor how traffic moves into, out of, and across our platform—not just day-to-day, but over time as customer behavior and industry dynamics evolve. Right now, few forces are reshaping networks faster than AI. 

With the launch of B2 Overdrive in April 2025, we built a direct, high-performance path between our storage layers and neoclouds where processing, inference, and modeling take place. It has given us a front-row seat to the impact of AI and how network behavior is changing with it. This quarter, in addition to our regular data analysis, I’ll walk through where AI-driven traffic is concentrated, how ingress and egress patterns showed up, and what the findings say about where AI infrastructure might be headed next. 

Continue the conversation

Join us live for the Q4 2025 Network Stats webinar Wednesday, February 4, 2025 at 10:00 a.m. PT / 1:00 p.m. ET. We’ll explore where AI traffic concentrates, how high-magnitude data flows behave, and what early indicators suggest about the future of AI-native infrastructure design.

Can’t make it live, or reading this article after-the-fact? Sign up anyway and catch the recording on demand.

Get Inside Real AI Network Flows

Brave new market

AI workflows don’t just need a place to store data, they need to be able to move it quickly, easily, and nearly constantly for short bursts. Large, multi-petabyte datasets are ingested, transformed, exported for training, pulled back for evaluation, and periodically refreshed as models evolve.  

Backblaze plays a key role at both ends of that lifecycle. We serve as a durable storage layer for the initial data ingestion, and as the high-throughput source feeding model training, evaluation, and validation to whatever best neocloud is suitable at the moment. Once that model has been trained, it needs to be stored, served, and periodically retrained, where we serve as the storage medium.

This quarter, we saw a large amount of traffic between Backblaze, neoclouds, and traditional hyperscalers for processing concentrated across the months of June to November. This reflects large-scale ingestion events followed by intensive data manipulation and model-related egress. 

From a network perspective, this represents a meaningful shift from diffuse, internet-style traffic patterns to large, high-bandwidth flows between a smaller set of endpoints typical of AI-centric infrastructure.

The neocloud slice

The defining theme of the quarter is “new:” new AI-oriented workflows, new traffic patterns, and leading indicators of new infrastructure trends. 

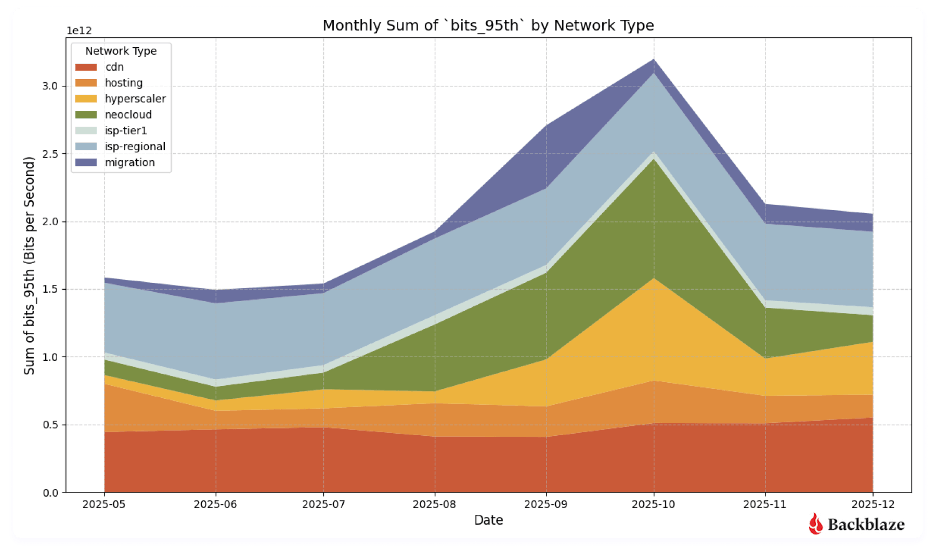
The stacked area graph below shows total traffic by network type over time. While content delivery network (CDN), hosting, and internet service provider (ISP) traffic stayed largely within historical norms reflecting steady-state usage patterns like content delivery, web hosting, and traditional backup workflows, two slices stand out:

  • Migration traffic: We saw a notable increase in migration traffic from August through October.  This classification reflects an influx of data into our network over fiber connections we have in the data centers to cost effectively migrate large amounts of data over private links, not using the public Internet.
  • Neocloud traffic: We saw a sharp increase in July through November, peaking in October.

What do we think is happening? Taken together, these patterns suggest a familiar AI lifecycle:  large datasets consisting of assets like images, videos, and metadata are ingested and consolidated then exported for training and experimentation. Now, those assets can be periodically updated as new assets are added and generated models and stored. We see that heading into the new year, the overall baseline has increased indicating a new normal.

Quick terminology refresher

  • Regions
    • US-West: Our largest and longest-running region
    • US-East: Region with the most observed proximity to neocloud infrastructure
    • CA-East: Our newest region in Canada. 
  • Network Types
    • CDN: Networks that use Backblaze as an origin store for content delivery 
    • Hosting: Traditional hosting providers that runs workloads like physical or virtual servers for web, database, or application tasks
    • Hyperscaler: Large, traditional cloud providers
    • ISP Regional: Local or regional ISPs, think of these as the “last mile” paths as these networks are very close to customer equipment and efficient 
    • ISP Tier1: National or international ISPs that carry our traffic long distances
    • Neocloud: AI -focused compute networks
    • Migration: Network links that we use for large-scale data onboarding

Heatmaps: Where AI traffic concentrates

To better understand where AI activity is happening, we thought it would be interesting to isolate the different Backblaze regions and to view concentrations of metrics visualized through heatmaps. We’re going to look at the following three dimensions: 

  1. Total traffic volume: Where did we send and receive the most traffic? 
  2. Magnitude: Where were the data transfers with the most bits per unique IP address?
  3. Uniqueness: What does the number of distinct IP addresses look like? 

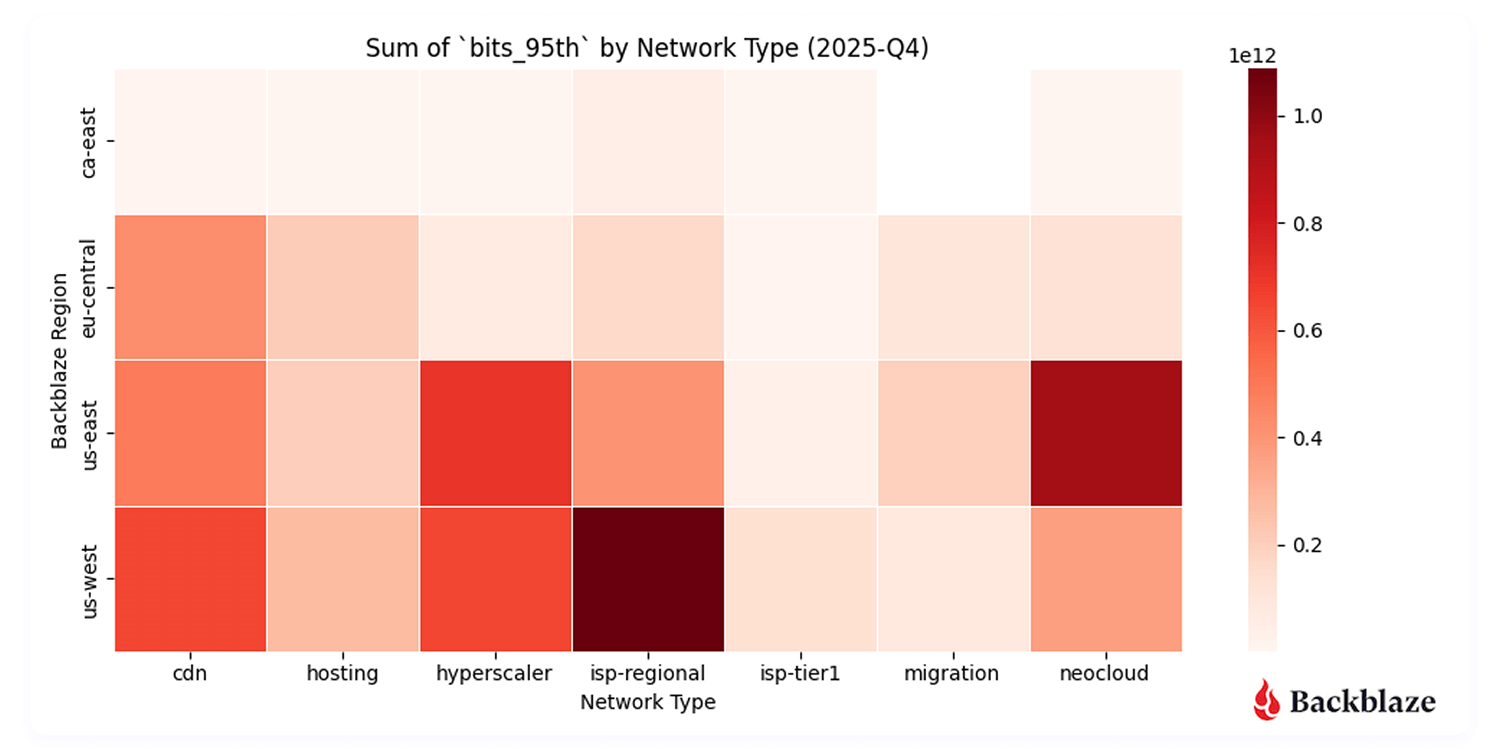
Heatmap #1: Where did we send and receive the most traffic?

Unsurprisingly, US-West ↔ ISP-Regional traffic dominates in total traffic volume. This region has the largest data center footprint behind it, with connectivity to internet exchanges (IX) such as Equinix-IX that were brought online in 2023. Internet exchanges bring us closer to consumer networks, where we can deliver traffic with lower latency.

More interesting, however, is the US-East ↔ neocloud concentration. Our flow data shows neocloud activity clustering in regions including Chicago, Dallas-Houston, Denver, New York, Northern Virginia (Reston/Ashburn corridor), and Atlanta—skewed more towards the East Coast where there’s dense AI compute availability. 

From a performance standpoint, this makes sense. It’s important to keep latency (the time between the source and destination) lower to achieve consistent high bandwidth rates for AI data transfers. For now, that gravity is pulling activity towards the East coast. 

Will neocloud traffic concentrations shift over time? Since this is our first quarter with a full dataset, it’s a bit early to draw long-term conclusions. But this is exactly the kind of trend we’ll be tracking. Stay tuned for future Network Stats reports.

Heatmap #2: Where were the data transfers with the most magnitude (bits per IP address)?

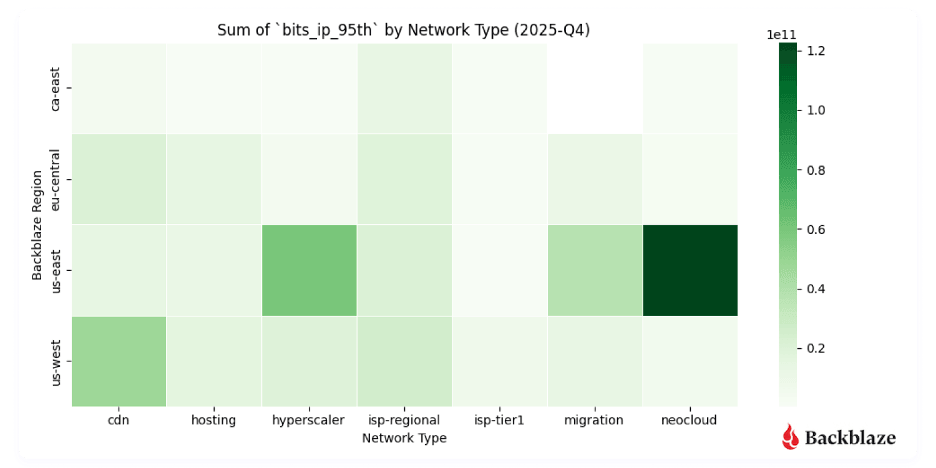
Another metric we record is bits per IP or what we termed in our last report “magnitude.” This combination of the amount of traffic transferred with how many actors are involved per network is a good proxy to measure how heavy or impactful individual data flows are. In short:

  • High volume, many IPs: Easier to distribute and load-balance across infrastructure. And many source and destination pairs means that we can traffic engineer at the WAN layer, sending some traffic over one provider and some over another.
  • High volume, few IPs: More difficult, but more interesting, from a NetEng perspective. 

With B2 Overdrive, we routinely support client transfers starting at 100Gbps up to 1Tbps of throughput.These high-magnitude flows show up clearly in the data, especially in regions serving AI-heavy neocloud endpoints. Seeing these patterns emerge in the data validates that customers are actively using the platform the way it was designed.

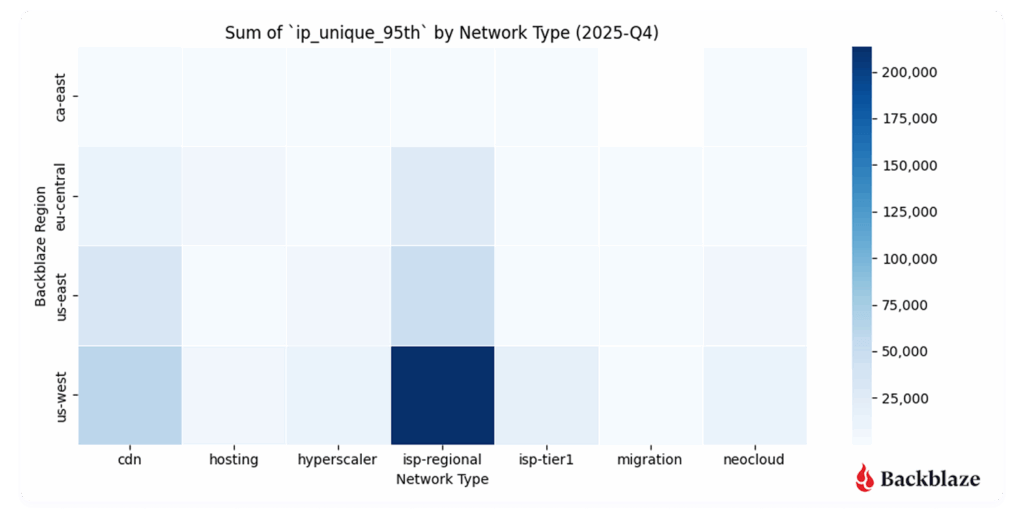
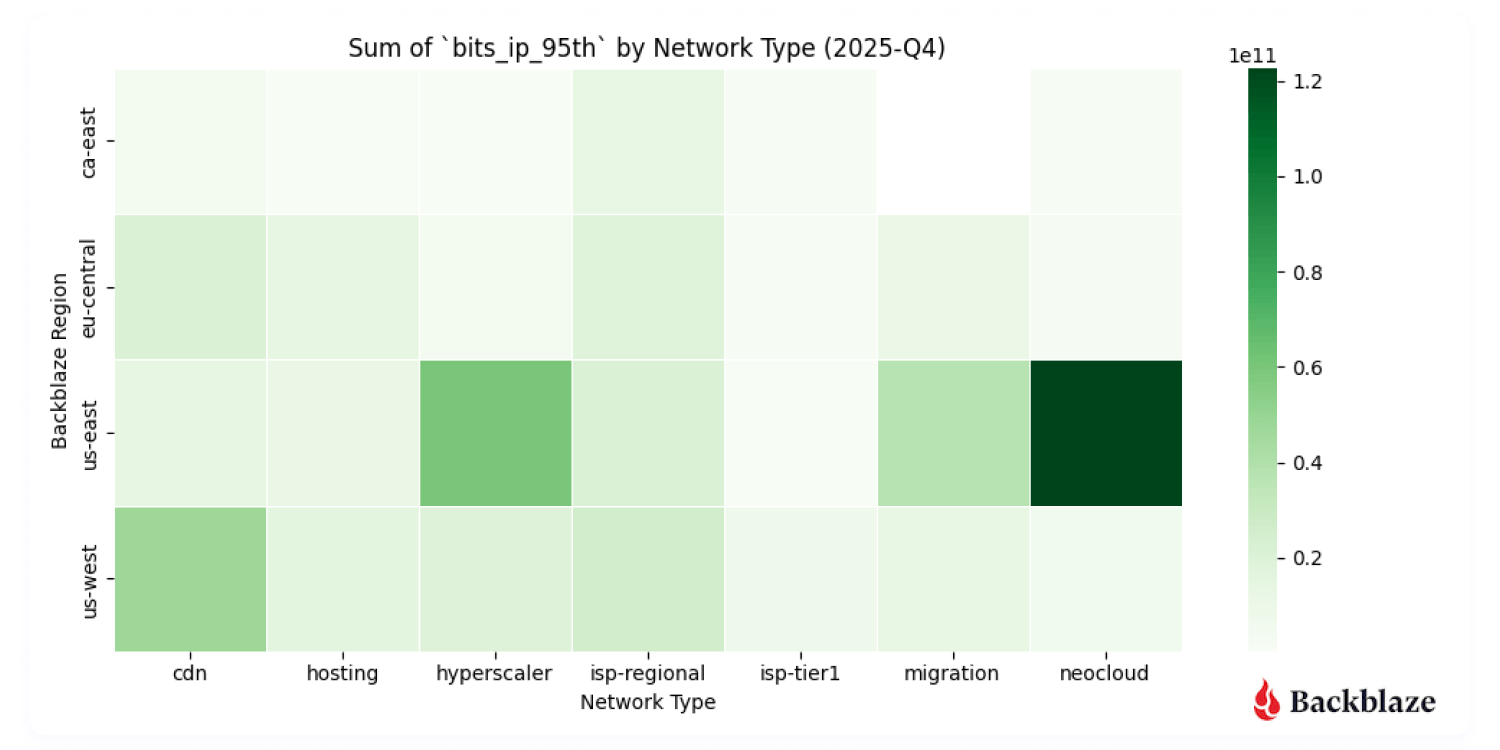
Heatmap #3: How many unique addresses do we interact with?

Uniqueness—measured by the number of distinct IP addresses per network type—adds another dimension to the story. 

  • US-West shows the highest overall uniqueness, driven by its larger number of data centers and mix of workloads.
  • Neocloud traffic, by contrast, tends to involve fewer, more persistent endpoints, consistent with AI pipelines that rely on stable, long-standing connections between storage and compute. 

This contrast reveals a broader trend: AI networking is less about many-to-many communication and more about sustained high-throughput relationships between specialized systems.

A chart showing the number of unique IP addresses that sent or received data to the Backblaze networks by region.
Communication uniqueness across our regions to each network type

Summary: Early indicators of an AI-native network era

This quarter represents an early but important snapshot of how AI is reshaping network behavior:

  • AI-driven traffic is concentrated and heavy (not groundbreaking news by any means, but interesting to see it played out on a network).
  • Neocloud connectivity is a defining feature of data movement today.
  • Data gravity is pulling storage, compute, and network design into tighter alignment.

This is our first look at these patterns specifically. As we gather more quarters of data, we’ll be watching closely to see how cyclical neocloud activity becomes, how regional concentrations shift, and how the growing ecosystem of AI-focused ISVs continues to change the shape of the network.

Quarter over quarter data

Last quarter we started capturing data and metrics that we were interested in tracking over time. This represents our first full quarter of data as we only started tracking in August of 2025, so it’s still early to start to see trends, but we’re including the visualizations for fidelity. 

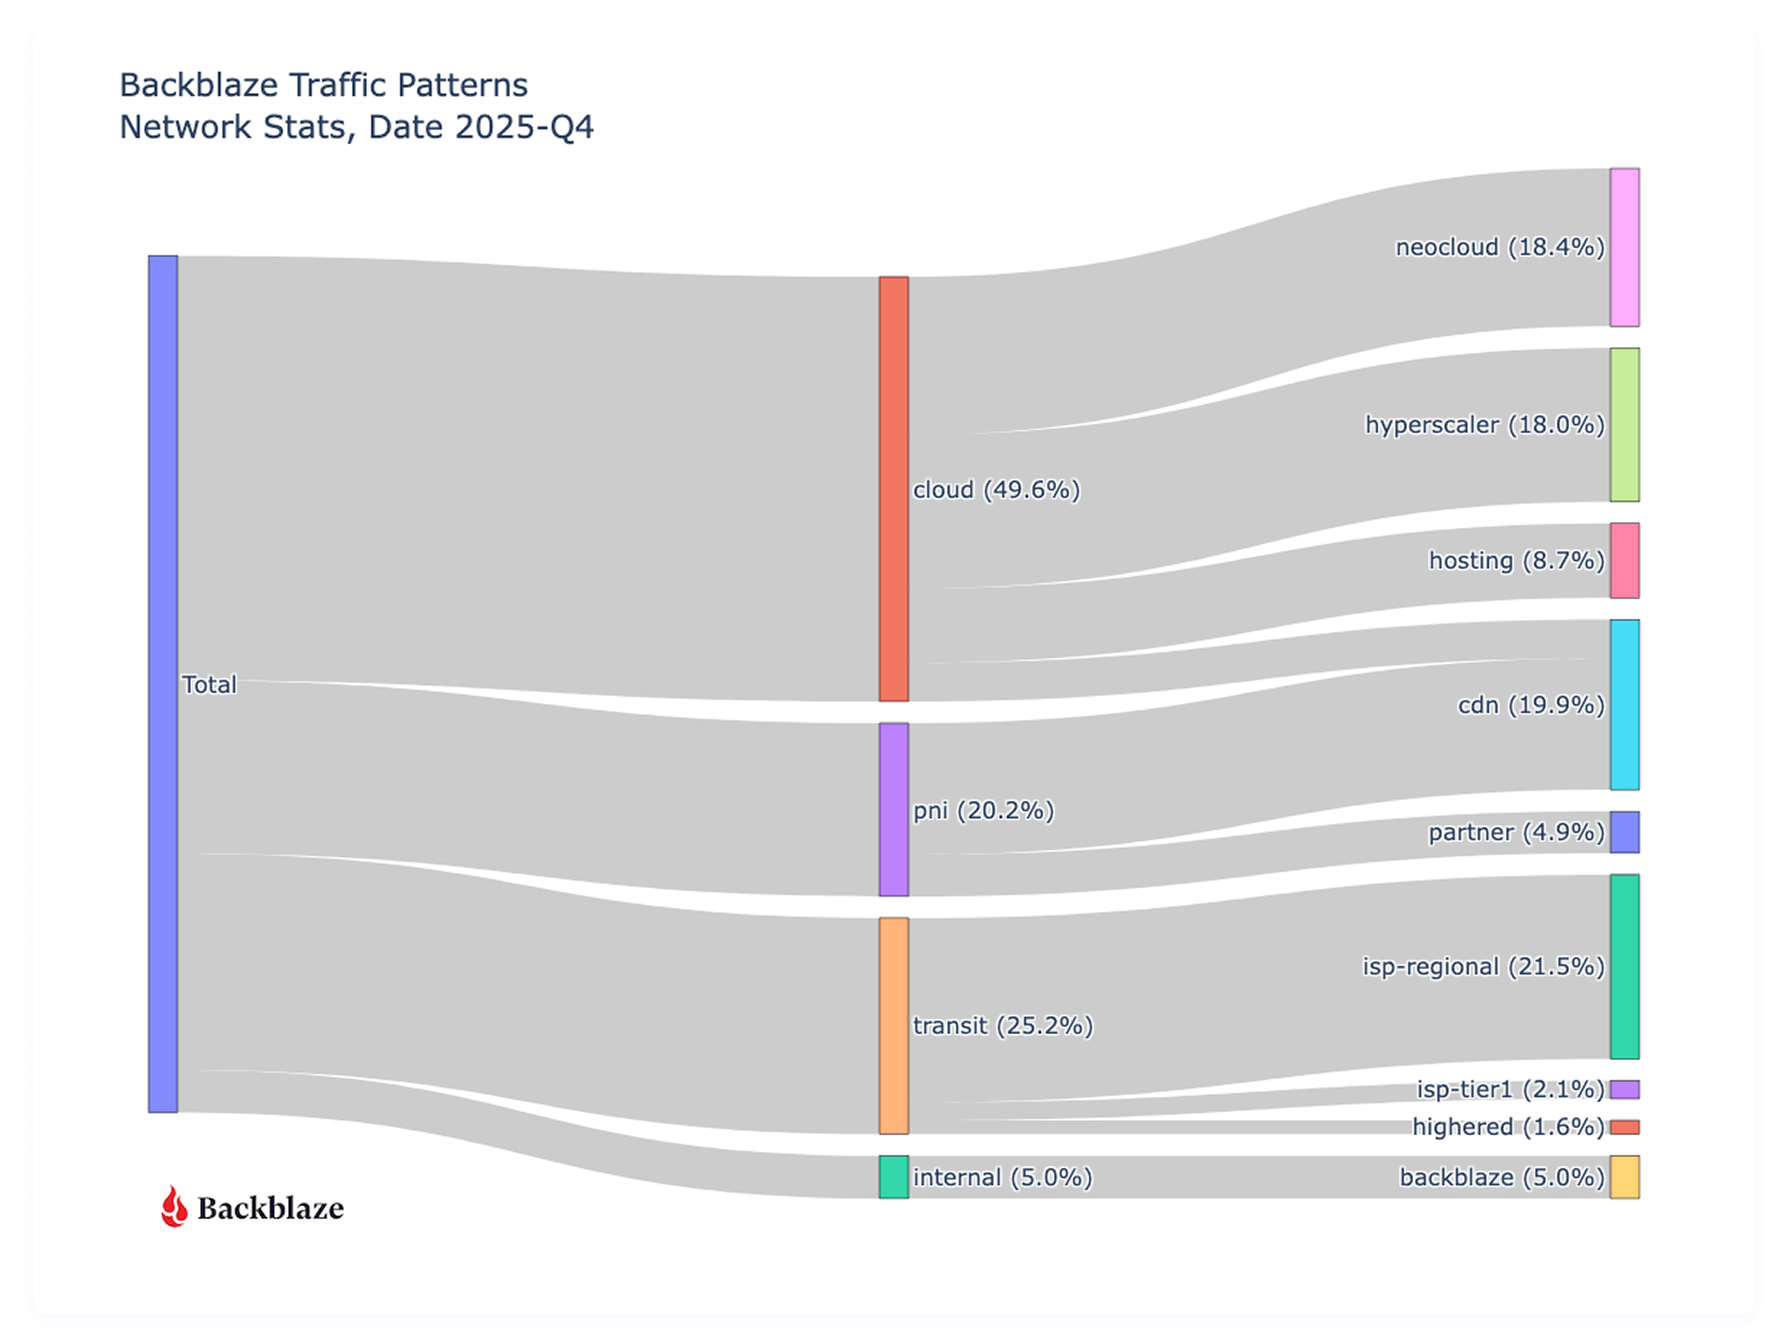
First let’s take a look at where all our traffic goes from a global perspective with an updated view of last quarter.

A Sankey diagram that tracks total data traffic flow between Backblaze and different types providers for Q4 2025.
Sankey diagram of all August ingress and egress traffic grouped by type of network

Traffic to other clouds has increased (36.2% to 49.6%) since we last reported in August of 2025, with a slight decrease (19.8% to 18.4%) in Neocloud destinations, but a large increase (3.5% to 18%) to hyperscalers. It’s too early to call these things statistically significant trends or patterns that impact the cloud storage industry broadly, because they’re reflective of what types of customers Backblaze specifically has and our sampling range is only a quarter. That said, we do see an overall increase in cloud to cloud traffic, but the higher percentage to the type of clouds rotated from last quarter.

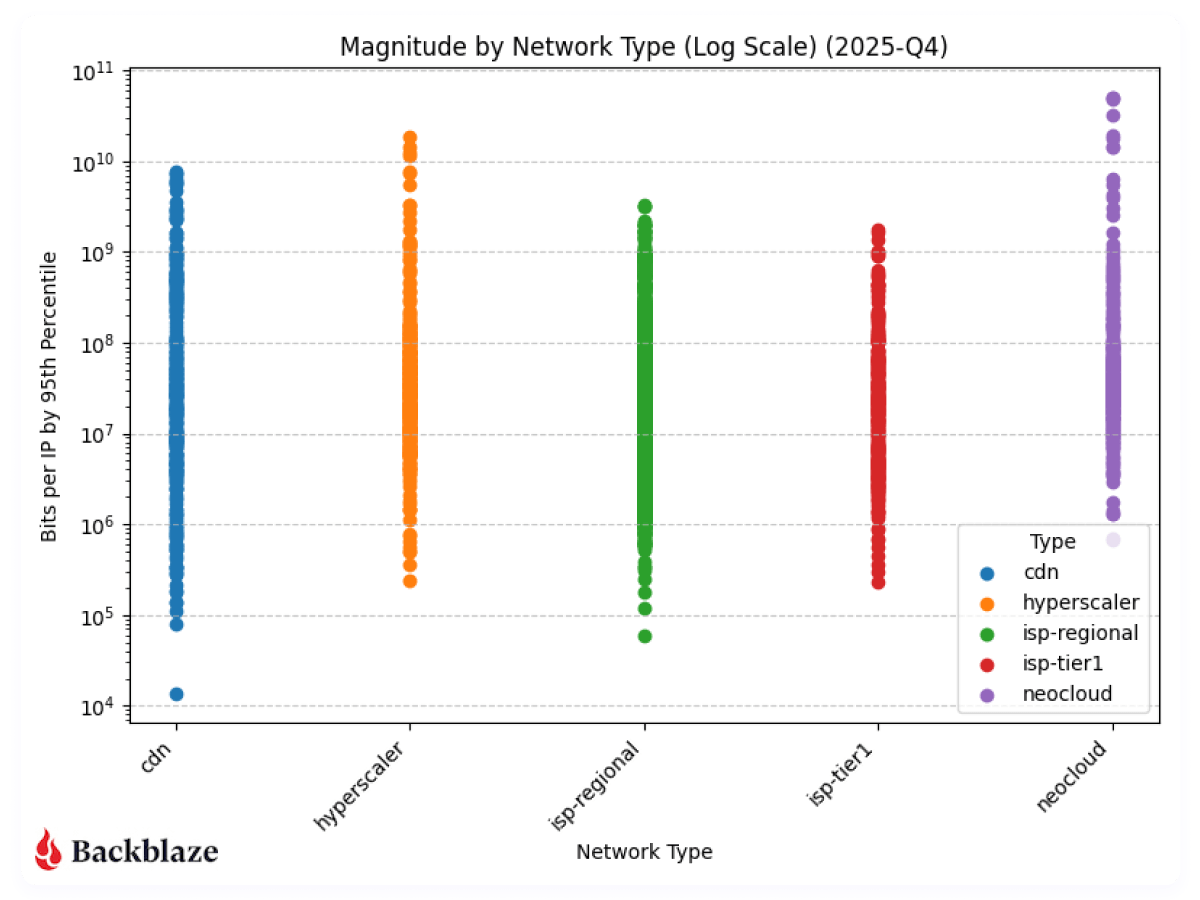
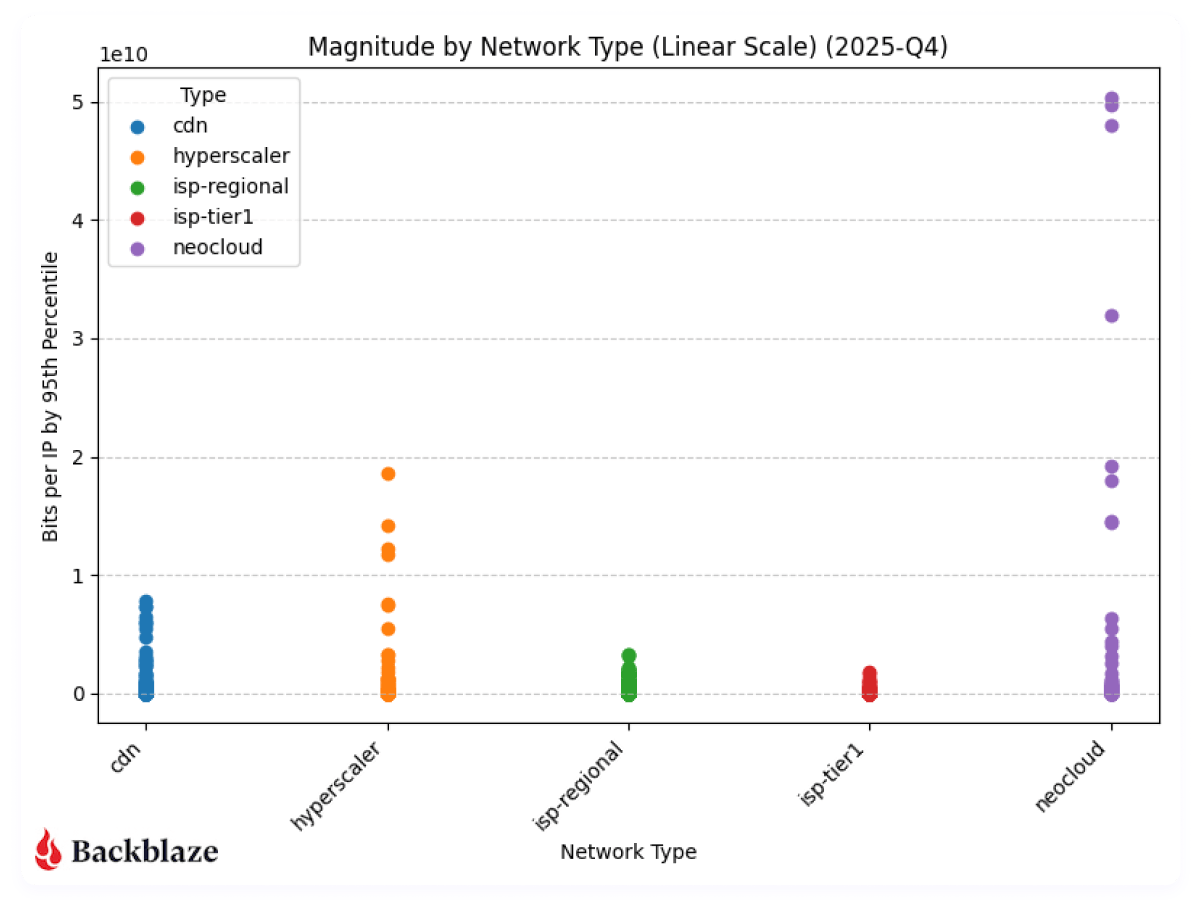
Next, let’s look at the magnitude of our network traffic based on the category of the traffic destination. As a reminder, magnitude represents the amount of traffic transferred with how many actors are involved per network. 

Next, to be consistent with our previous report, we’ll look at magnitude on a linear scale. 

With more datapoints, we can clearly see the magnitude of the neocloud and hyperscaler transfers when compared to other network types. As above, it’s a bit early to claim concrete quarter over quarter patterns, but we’ll keep monitoring and updating the dataset. 

What’s next?

Next quarter will be the first where we have true quarter over quarter data to analyze, and we’ll be back with more on how AI-driven flows change quarter over quarter. And as we get more data, we’re interested in looking at other trends like IPv4 vs. IPv6 traffic, cross-cloud connectivity trends, and revisiting the concentration analysis we did this quarter. 

Anything specific you want to see? Let us know in the comments or reach out to our Evangelism team. Or, keep up-to-date with the latest technical content with our Developer Newsletter. 

The post Network Stats for Q4 2025: Neocloud Traffic Trends appeared first on Backblaze Blog | Cloud Storage & Cloud Backup
Network Stats for Q3 2025: The Magnitude of AI Workflows

Post Syndicated from Brent Nowak original https://www.backblaze.com/blog/network-stats-for-q3-2025-the-magnitude-of-ai-workflows/

A textured background with the words Network Stats overlaid.

The way data moves is changing in the age of AI. As AI training, model tuning, and inferencing accelerate massive, unpredictable flows of data across clouds, our network telemetry here at Backblaze offers a real-world view into the AI data gravity shift: where data lives, how it moves, and what it takes to keep it accessible and affordable.

Over the past couple of years, we’ve shared Network Stats snapshots that shed light on how data moves across Backblaze’s storage cloud. This quarter, we’re taking that foundation further, and evolving this series into a full-fledged transparency report that stands alongside Drive Stats with regular quarterly reporting and stats you can analyze for yourself.

This report isn’t just about traffic patterns. It’s a look at how data movement is changing in the age of AI and what those shifts reveal about performance, cost, and resilience at scale. 

Tune in live for The Stats Lab webinar

Drive Stats was the beginning. Want to see the evolution? Check out the Backblaze Stats Lab webinar, bringing together content from all of our Stats articles. We’re going to chat about all things Backblaze and beyond—by the numbers.

Save My Seat

In this first report, we’re going to outline the fundamentals of our dataset, highlight standout examples for AI related traffic, and lay the foundation to start sharing our quarter-over-quarter metrics.

Dataset details 

Our internal tools allow us to capture network flow data, meaning transmission control protocol (TCP) conversations between parties on our network. Along with basic information such as who is talking and how many bits are being exchanged, we have the ability to record additional pieces of anonymized information like what country, what ISP, or if we’ve seen a particular IP address before. And for each of these metrics, we have numbers for the average, 95th percentile, and maximum values.

Let’s talk about the three elements that make up our dataset: time, values, and metadata.

1. Monthly time slices

For every month, for every region, and for each direction (egress and ingress), we are data warehousing the following metrics. We plan on either using month-by-month numbers, or rolling up into a quarterly value for Network Stats reports going forward.

Item Detail
Date range Every month
Location scope Every region (eg US-West, EU-Central)
Network traffic direction Ingress, egress

2. Metric values

For each monthly snapshot, we’re recording the following details in our data warehouse. Capturing the average, 95th weighted value, and the maximum allows us enough information to profile our traffic. 

The 95th value (discarding the highest 5% bursts) gives us a good profile for daily operations and the maximum helps profile bust traffic. 

The most interesting metrics that I’m excited to explore are the “bits per IP” values. This combination of “amount of traffic” transferred with “how many actors are involved” per network is a good proxy for what I’m calling the “magnitude” of the network flow. We’re exploring the first insight into this metric below in our chart section.

Defining the Network Stats Quarterly Data

Item Field(s) Detail
Name name
asn
Common name and BGP ASN of the network
Bits bits_avg
bits_95th
bits_max
Number of bits/second
Packets packets_avg
packets_95th
packets_max
Number of packets/second
Flows flow_avg
flow_95th
flow_max
Number of TCP flows
IPs ip_unique_avg
ip_unique_95th
ip_unique_max
Number of unique IP addresses
Bits per IP bits_ip_avg
bits_ip_95th
bits_ip_max
Number of bits per IP address
Protocol v4
v6
Amount of traffic using IPv4 vs IPv6

3. Additional metadata

One of the first custom additions to our dataset is a category field. This helps us define the BGP ASNs (Autonomous System Number), basically the organizations common name associated with a range of IP addresses, that we talk to and group them into categories such as neocloud, hyperscaler, CDN, or general ISP.

Additional Network Stats Metadata

Item Field Detail
category group The class of network carrying the traffic (Cloud, PNI, traditional Internet Transit, or Internal Backblaze-Backblaze)
category type The type of network receiving the traffic (Neocloud, Hosting/Compute provider, Hyperscaler, CDN, Regional ISP, more localised ISP, etc)

The global picture

We started capturing this dataset in August of 2025, so we don’t yet have a good amount of data to pull out quarter over quarter trends. But what we can do for now is take a look into some standout metrics for the month of August that we’re interested in tracking over time.

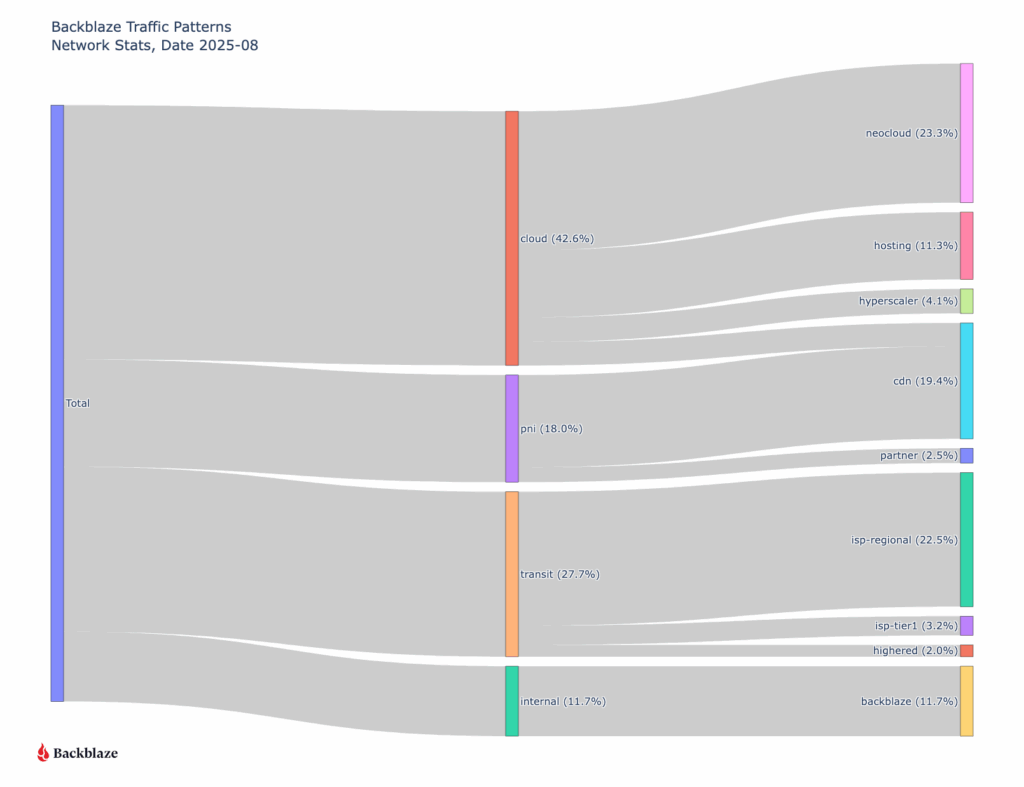
First let’s take a look at where all our traffic goes from a global perspective.

When we look at the data, one pattern stands out immediately: traffic associated with neocloud networks—cloud providers offering compute, GPU, or other AI-related services—already represents nearly a quarter of total ingress and egress across Backblaze’s network. That’s a meaningful signal. Historically CDN traffic has been the majority of our traffic as our B2 Object Storage has been growing. Now, we’re seeing clear evidence of a new class of workload emerging, and it’s AI-shaped.

Neocloud network behavior

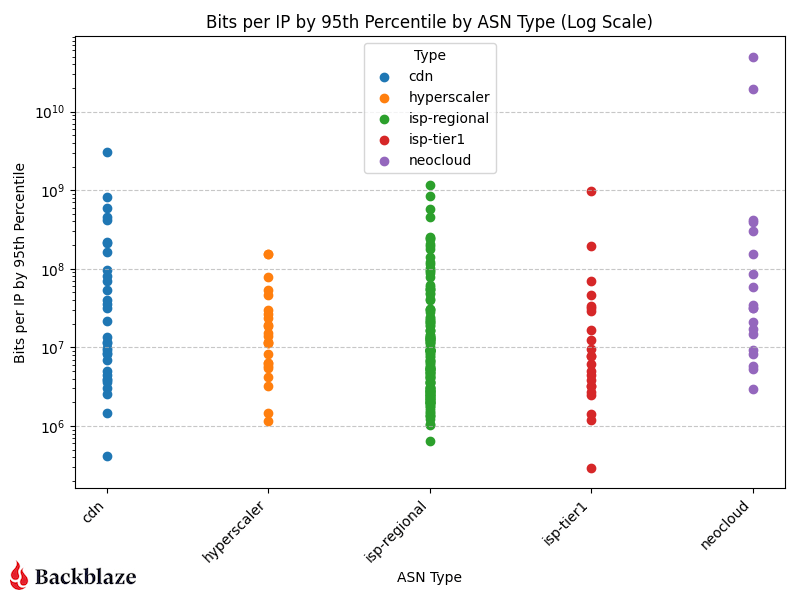
Let’s look at the magnitude of our network traffic based on the category of the traffic destination. To help quantify our data set, we interact with around 123,000 unique IP addresses every month. 

CDN, hyperscaler, isp-regional, and isp-tier one traffic cluster in the same general range of bits per IP, but neoclouds have a couple outliers—the two purple data points in the upper right corner of the log scale graph. 

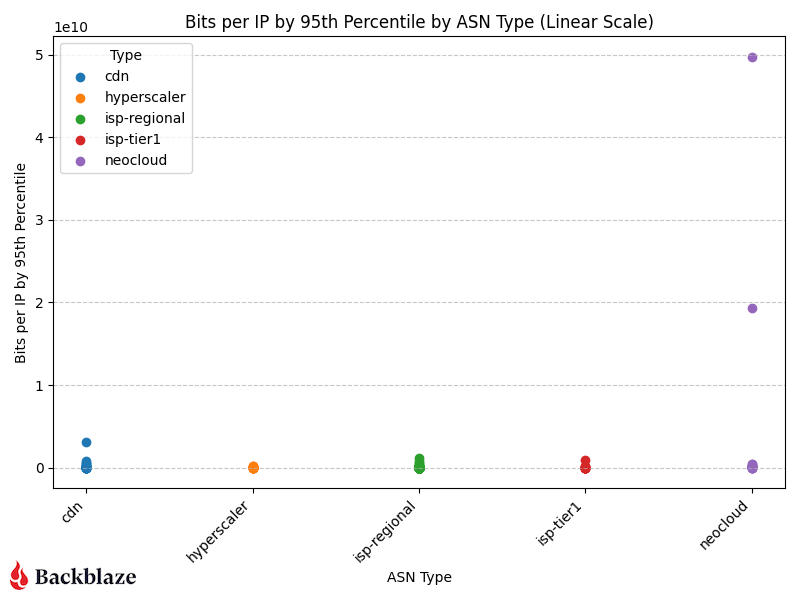
If we change the scale to linear (chart below), now we can see how much of an outlier the AI related traffic is in our sample range.

The “magnitude” (as we’re calling it) of the transfers we’re servicing for AI related flows to neoclouds is an order of magnitude greater than all our traffic patterns. This means that there are only a few unique IP addresses that we’re interacting with transferring large amounts of data in their flows.

The rise of AI-driven data movement

Over the past year, AI training and inference have transformed global data flows. Where traditional workloads move steadily, AI workloads move in bursts—rapid retrievals of massive datasets, short high-volume transfers for model training or tuning, and sustained outbound throughput for inferencing pipelines. The magnitude metric we’re introducing (bits per IP address) captures this shift. 

As shown in the charts above, AI-related traffic to neoclouds isn’t just heavier, it’s denser. Those purple data points represent a small number of IPs exchanging a disproportionate amount of data. That concentration of flow is a hallmark of AI compute pipelines, where a few high-bandwidth endpoints (often GPU clusters) interact with object storage to repeatedly feed and retrieve training data. 

In other words:

  • Fewer talkers, bigger flows. AI systems operate in fewer, more intense network sessions than traditional applications.
  • Shorter duration, higher peaks. Transfer patterns spike sharply, often corresponding to dataset replication or model checkpointing cycles.
  • Cross-cloud mobility. Much of this traffic routes between Backblaze and external compute platforms (classified as neoclouds) showing the rise of multi-cloud AI architectures.

The macro trend: The AI data gravity shift

This pattern reflects a broader macro trend in the cloud ecosystem: AI data gravity is pulling more storage and compute closer together. As AI models grow larger and datasets become more complex, organizations are rethinking where data “lives.” Instead of centralizing everything in one hyperscaler like AWS or Google Cloud Platform, they’re increasingly using cost-efficient, high-throughput storage clouds like Backblaze connected to specialized GPU clouds for compute (case in point: Why CoreWeave’s Object Storage Launch is Good for AI—and Everyone Building It).

This architectural shift explains the outlier traffic patterns we’re seeing on our network. Data isn’t just moving more—it’s moving smarter, following cost, performance, and regional availability cues. 

Why it matters

Tracking this kind of data movement and magnitude helps us, and more importantly our customers, understand a few key things:

  • Operational readiness for AI workloads: How our network scales under bursty, compute-linked demands. (For more on this check out Making the Backblaze Network AI Ready)
  • Cost predictability: Where and when ingress or egress volume spikes may occur.
  • Industry evolution: How AI is reshaping the underlying patterns of internet traffic.

What’s next?

This is just the first glimpse of that industry evolution. As our dataset matures, we’ll be able to watch these AI-linked flows change quarter over quarter, offering not just transparency, but a longitudinal view of how the data backbone of the AI economy takes shape. 

We’re planning to look at quarter over quarter number tracking for network types, IPv4 traffic vs IPv6 traffic, AI related workflows, cross-cloud connectivity trends, and more. We’re also planning to release the raw data quarterly going forward.

Anything specific you want to see? Let us know in the comments or reach out to our Evangelism team. 

We’re excited to share these insights from our network telemetry, the patterns we’re seeing, and what they mean for the broader data economy. This is the stuff we stay up at night studying, and sharing it publicly means we can all better understand the forces shaping digital infrastructure and build with greater confidence and foresight. 

The post Network Stats for Q3 2025: The Magnitude of AI Workflows appeared first on Backblaze Blog | Cloud Storage & Cloud Backup